3D Shape Analysis of Powder for Laser Beam Melting by Synchrotron X-ray CT

 , ,
, , 
Abstract
:1. Introduction
2. Materials and Methods
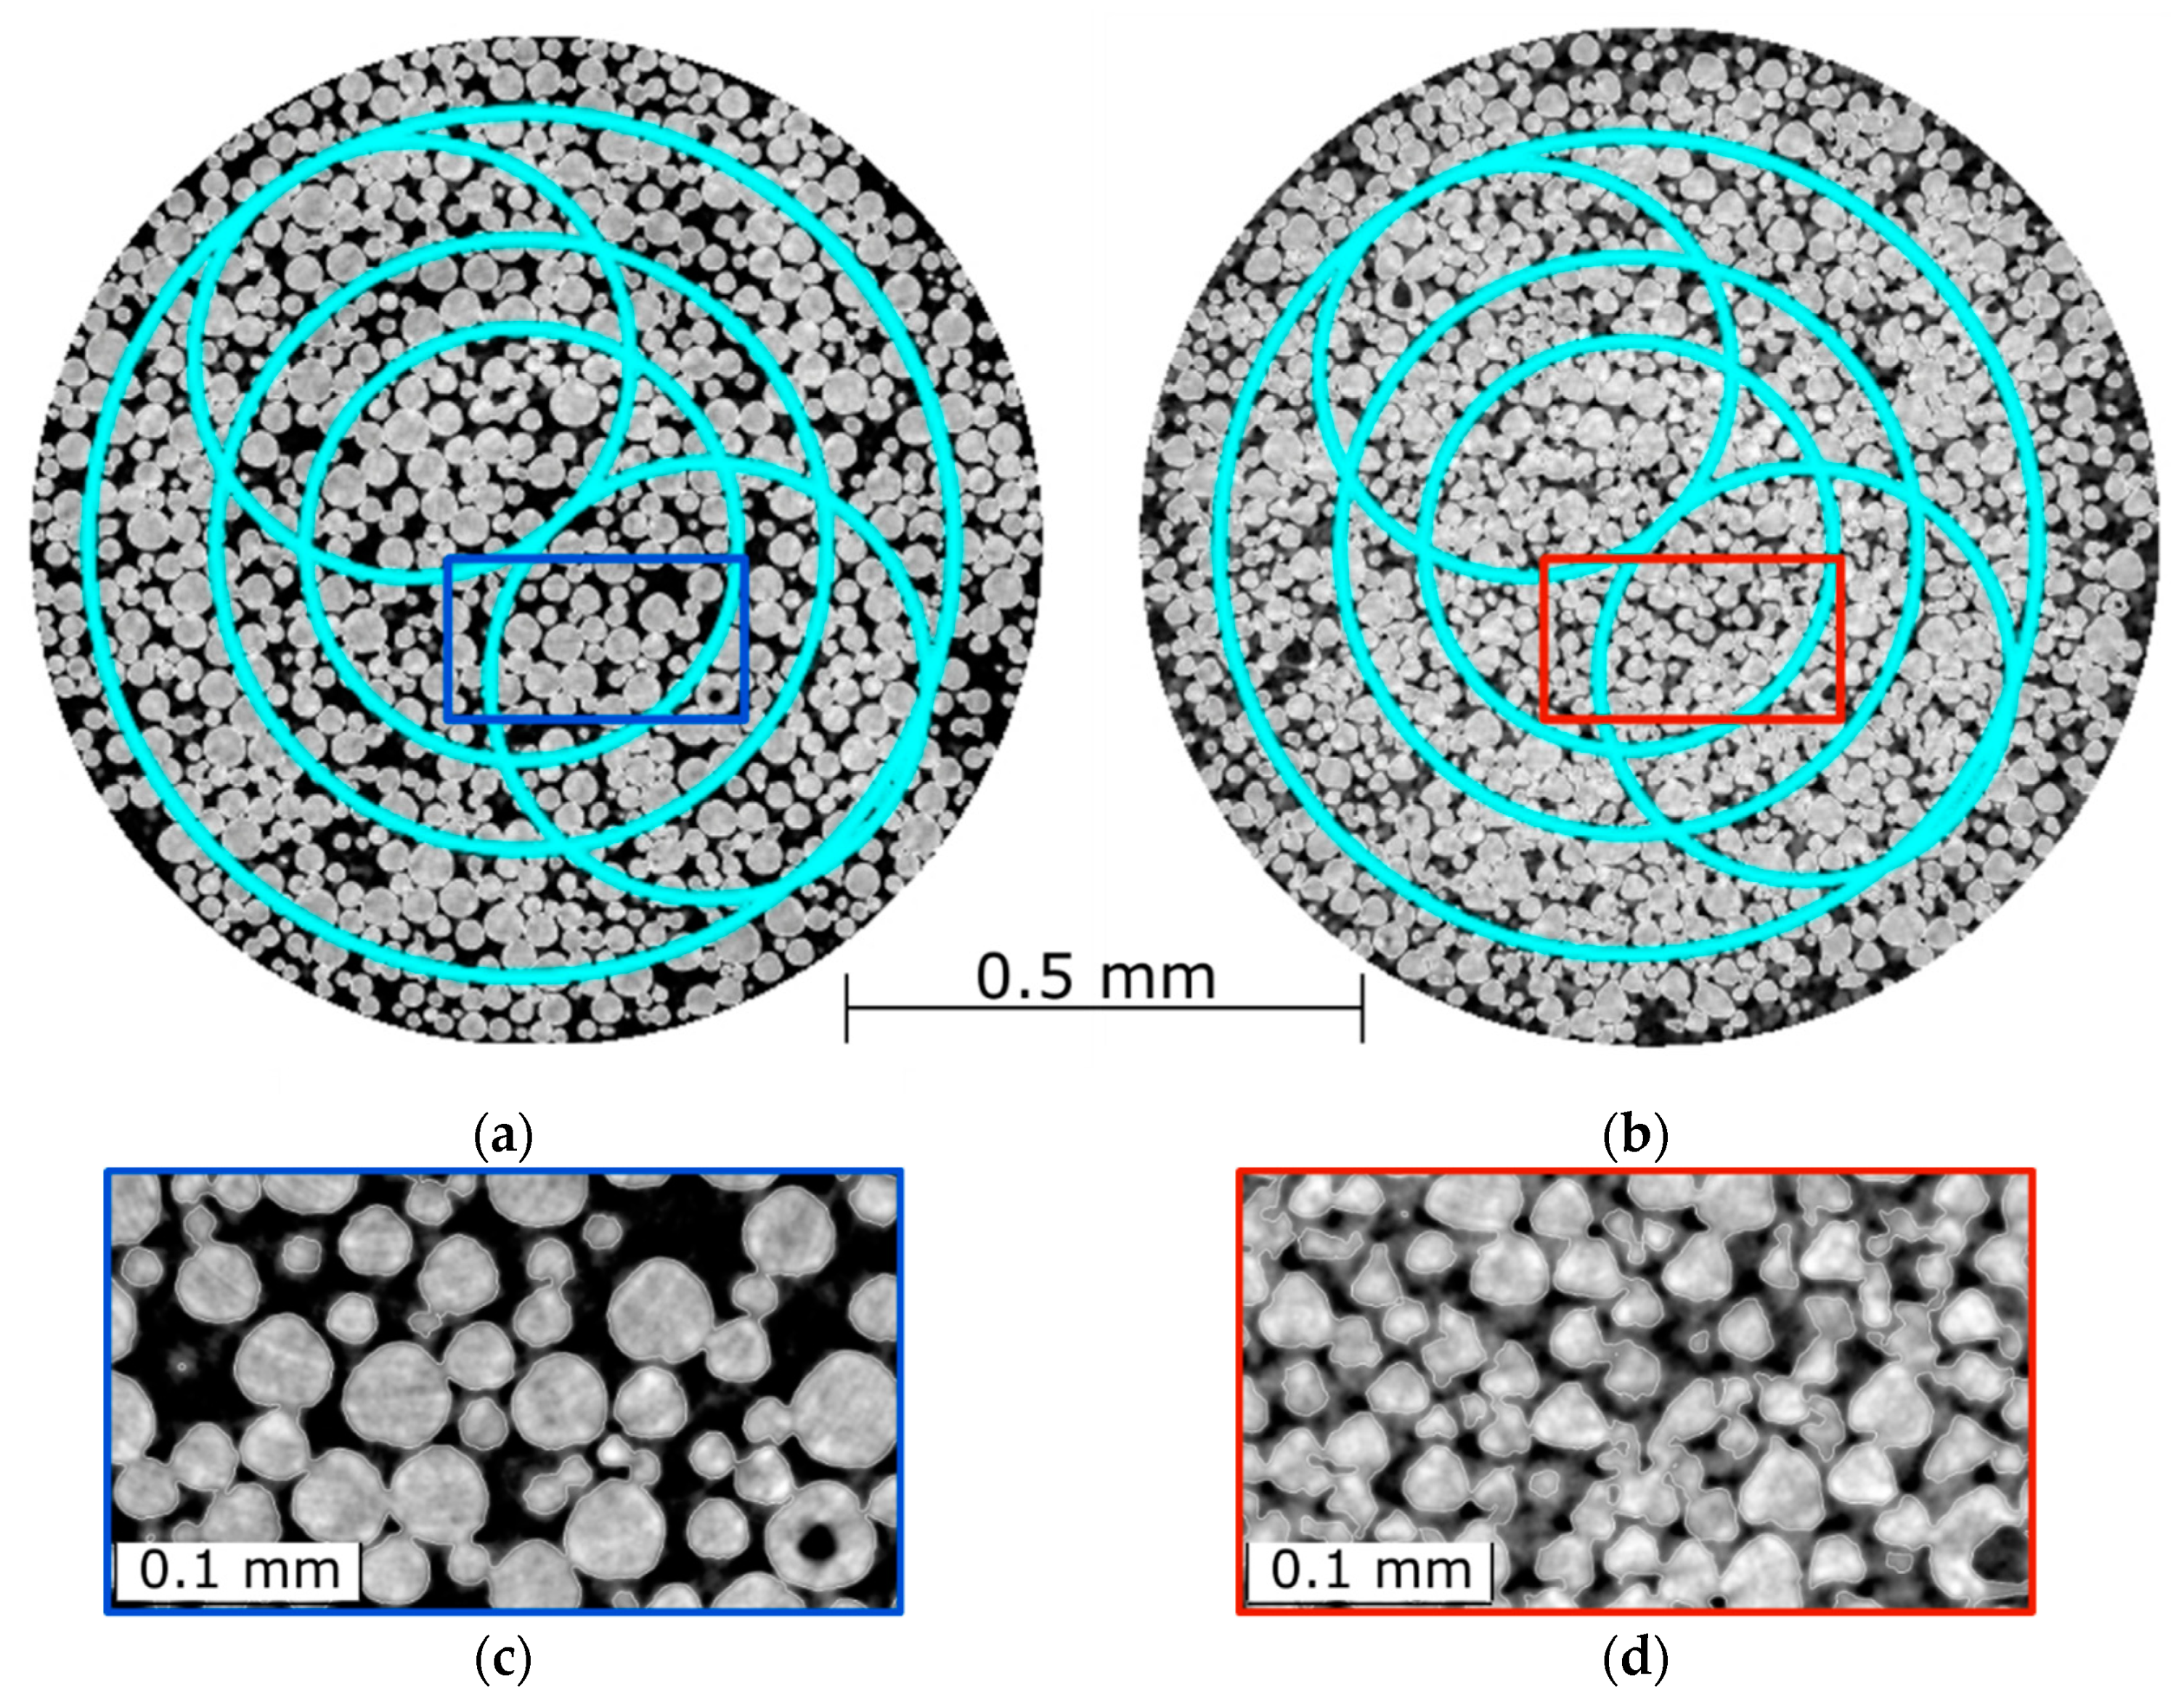
2.1. Sample Preparation
2.2. Experiment
2.3. Packing Density
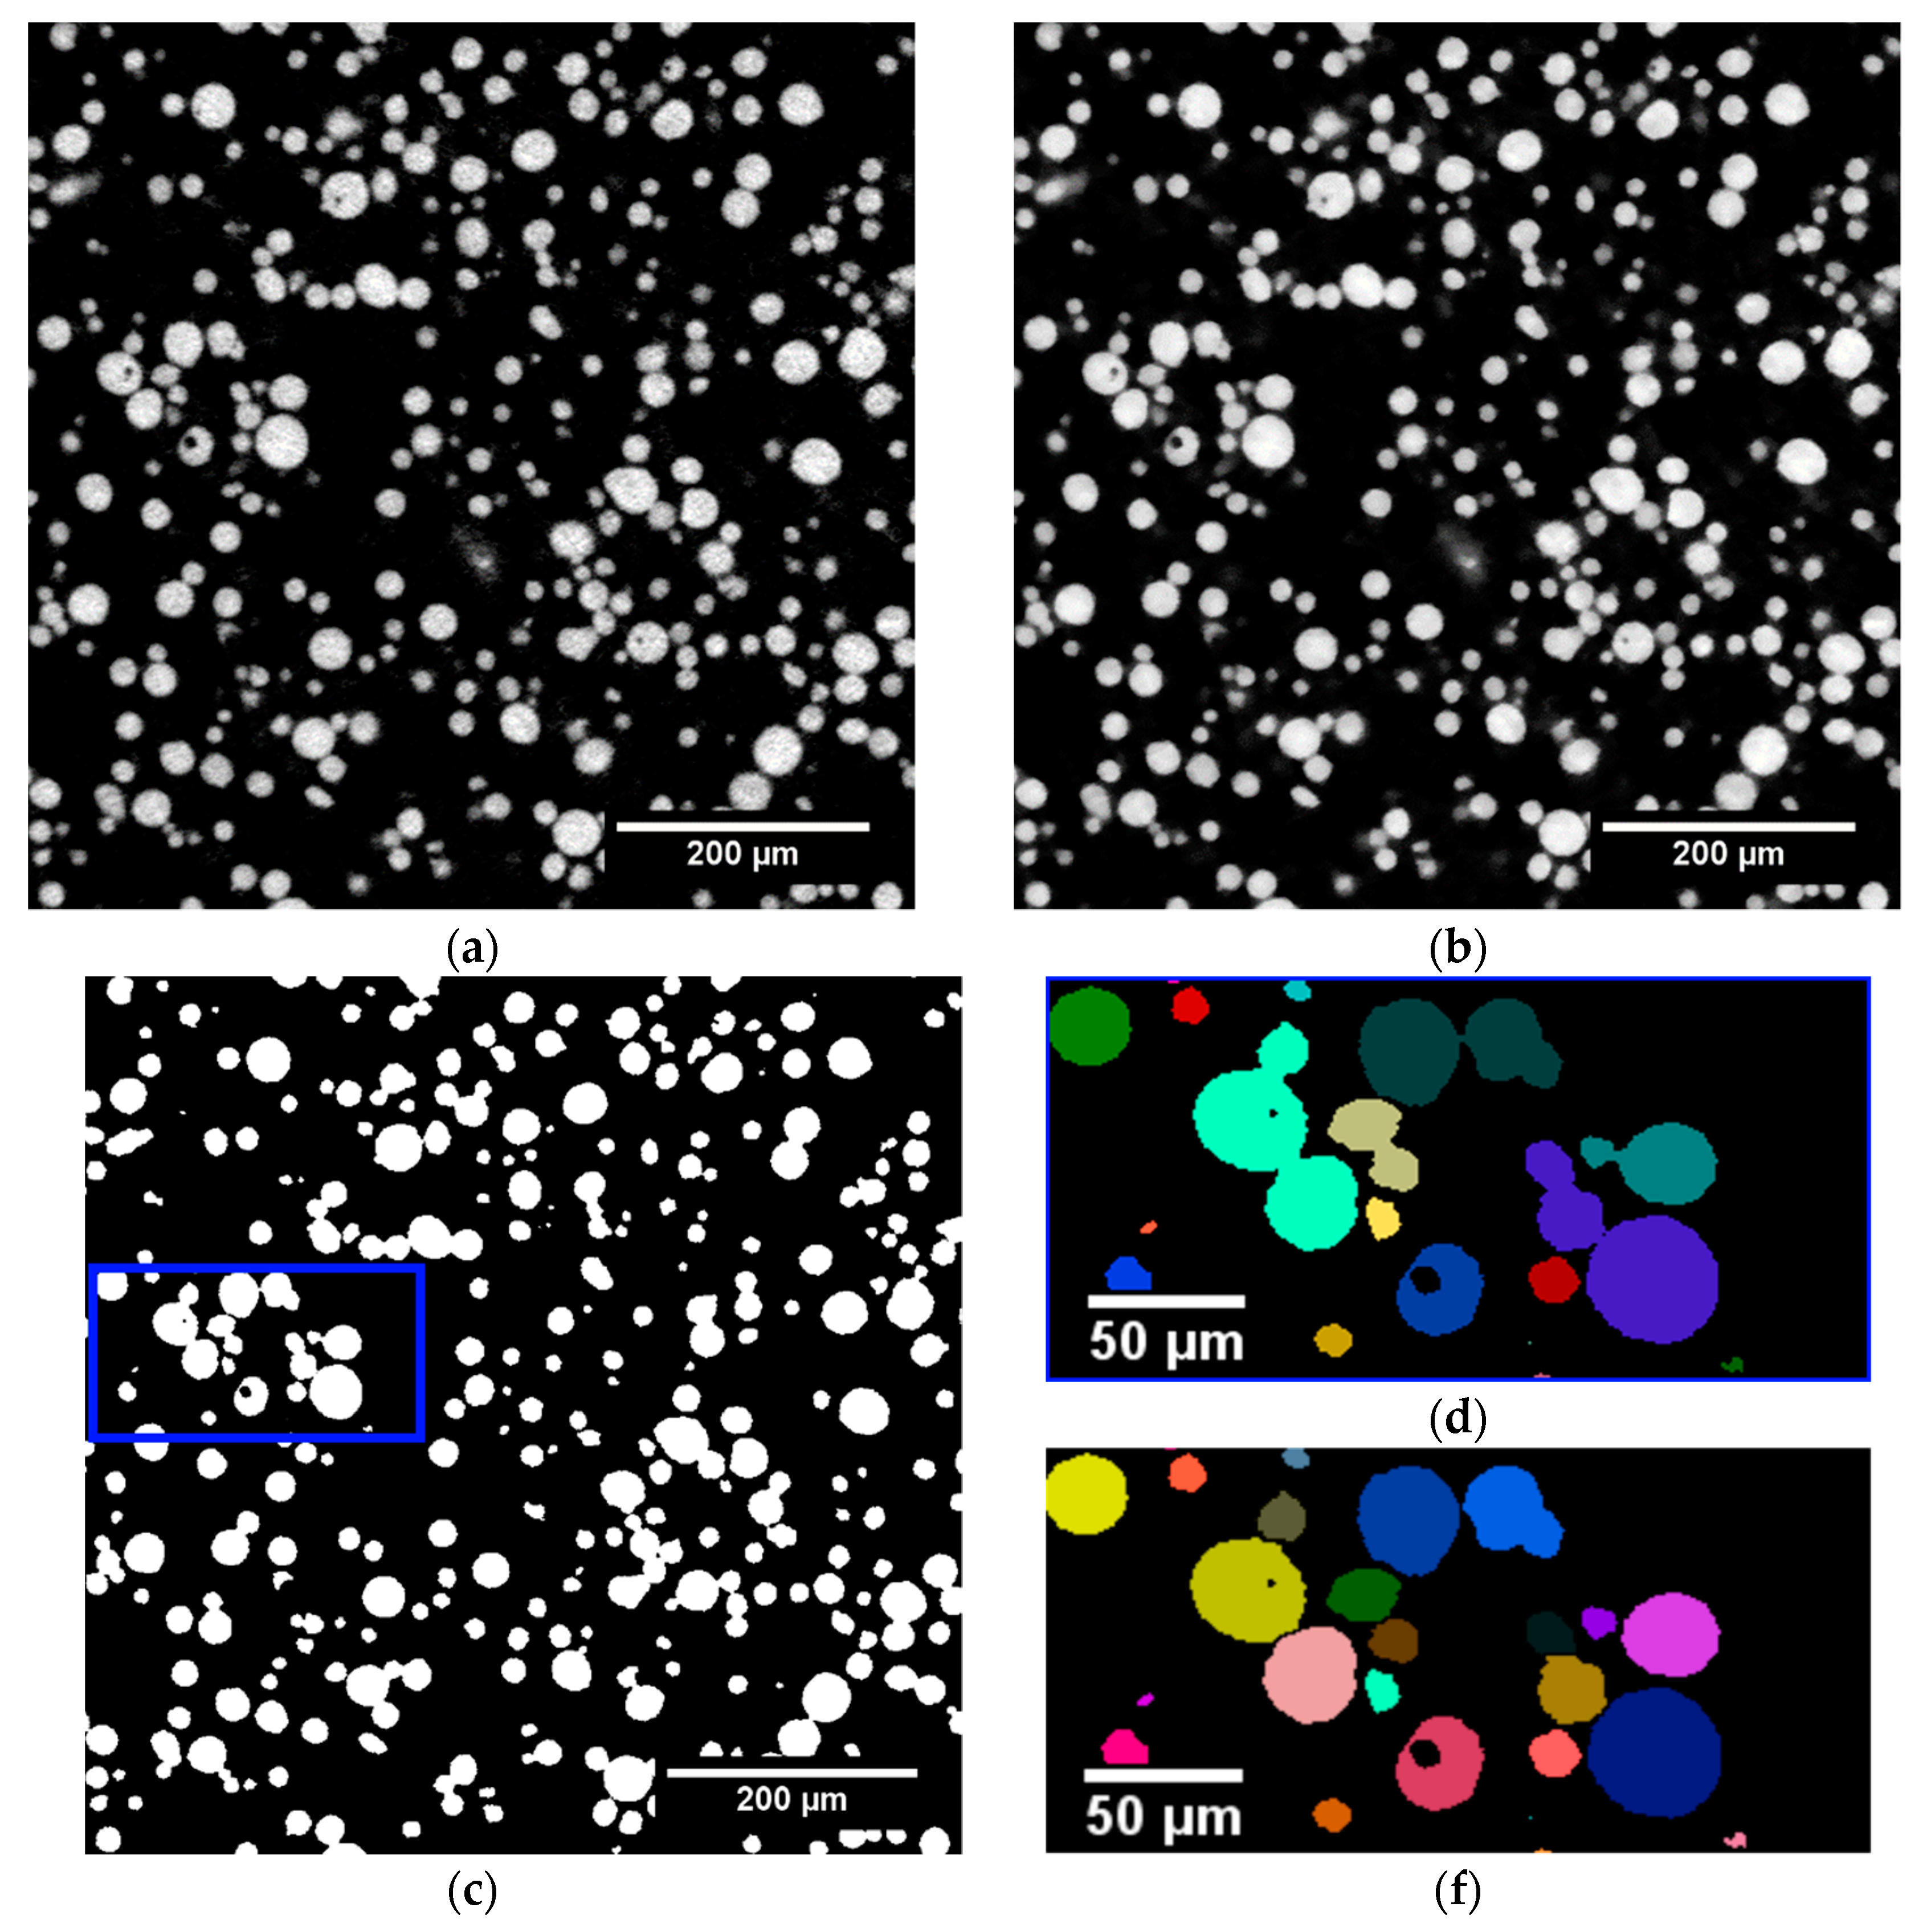
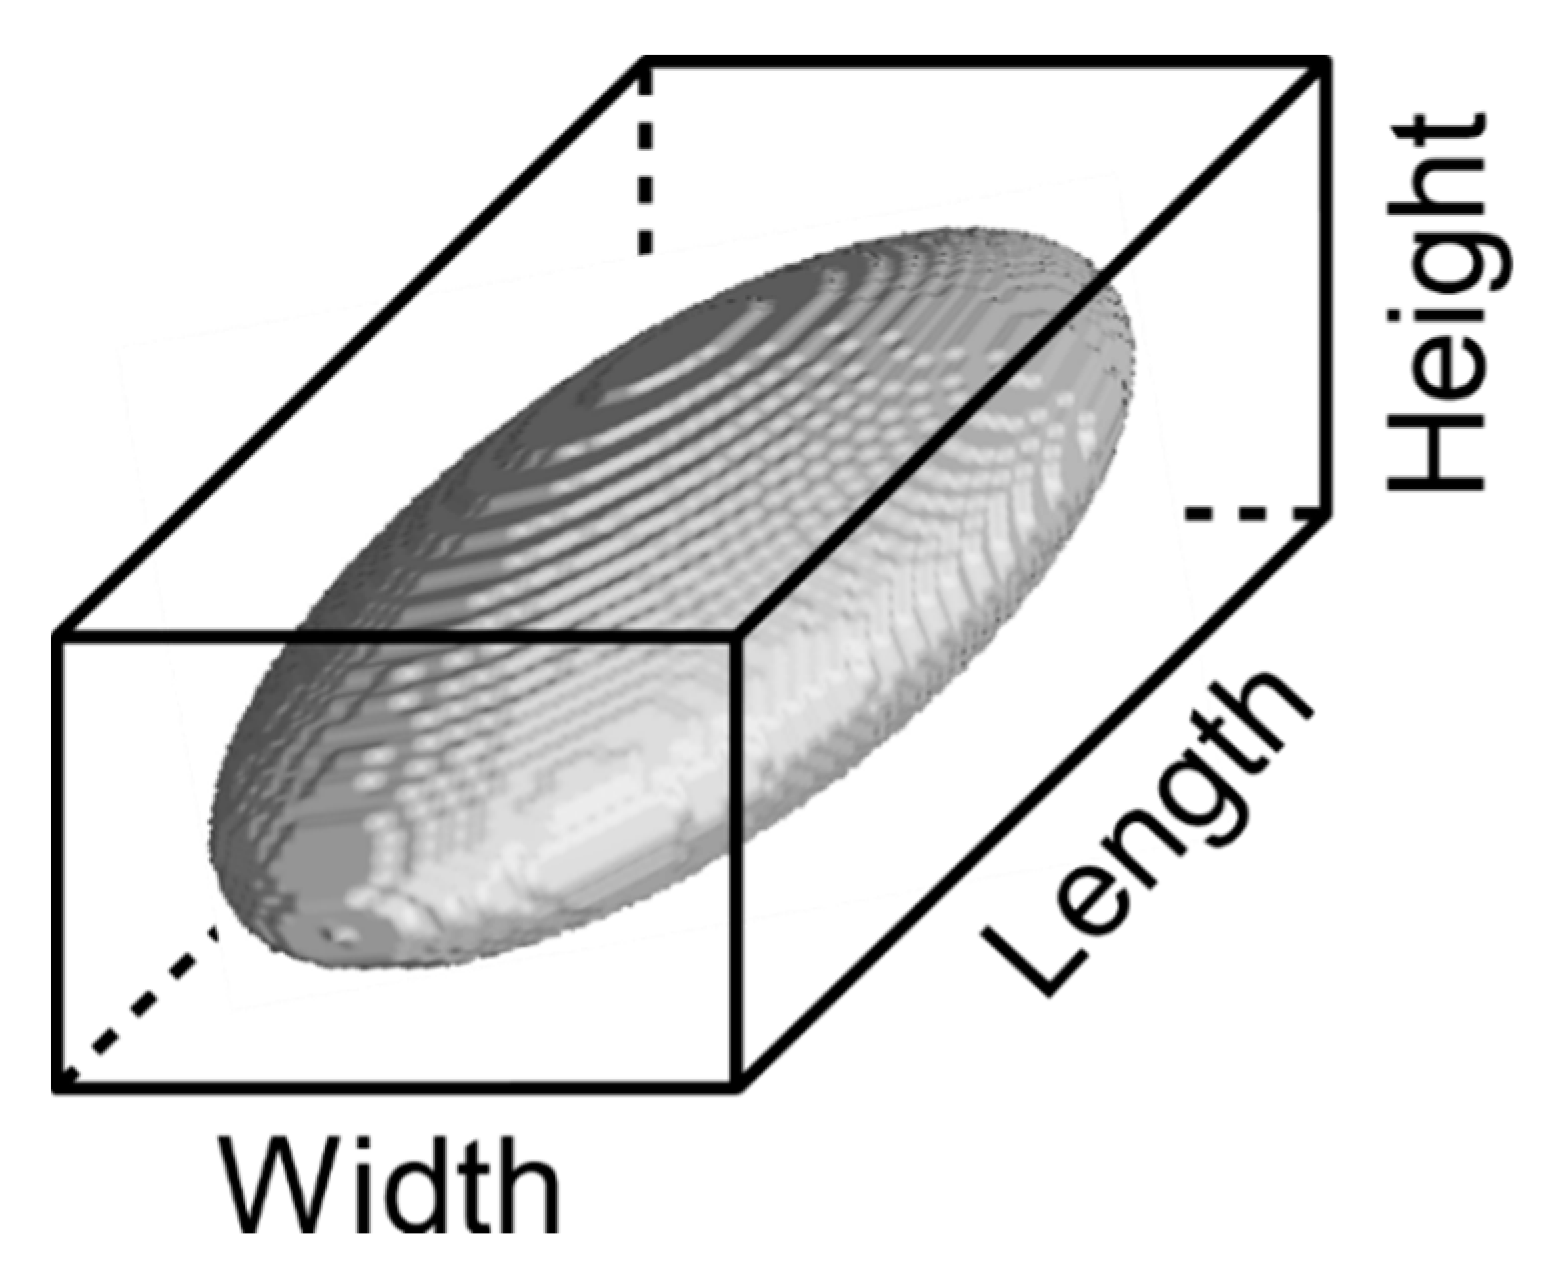
2.4. Particle Segmentation and Shape Analysis
- length = largest diameter (corresponds to λ1).
- width = medium diameter (corresponds to λ2).
- height = smallest diameter (corresponds to λ3).
3. Results and Discussion
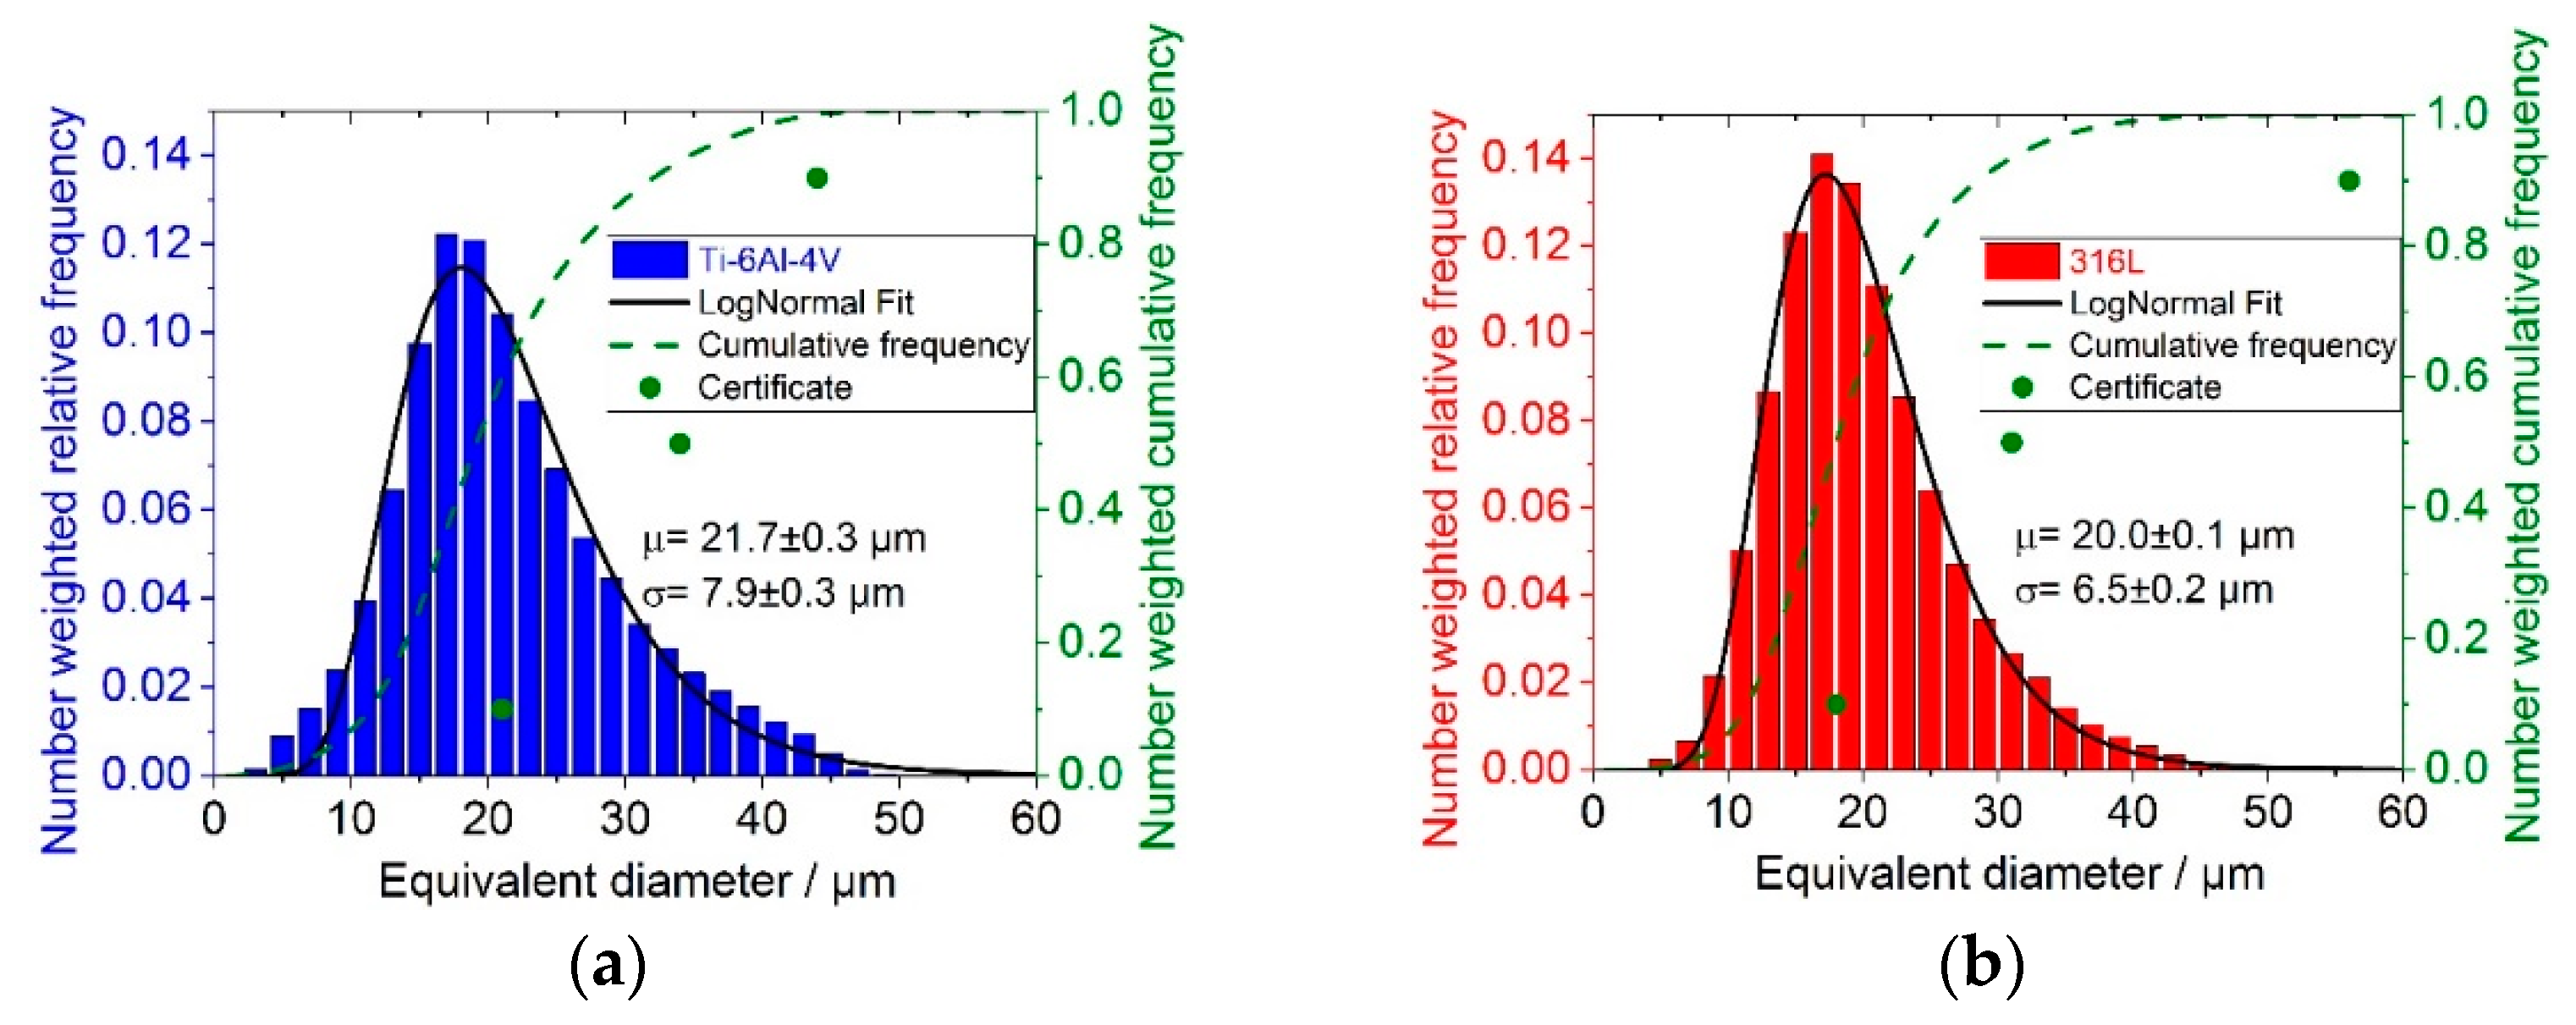
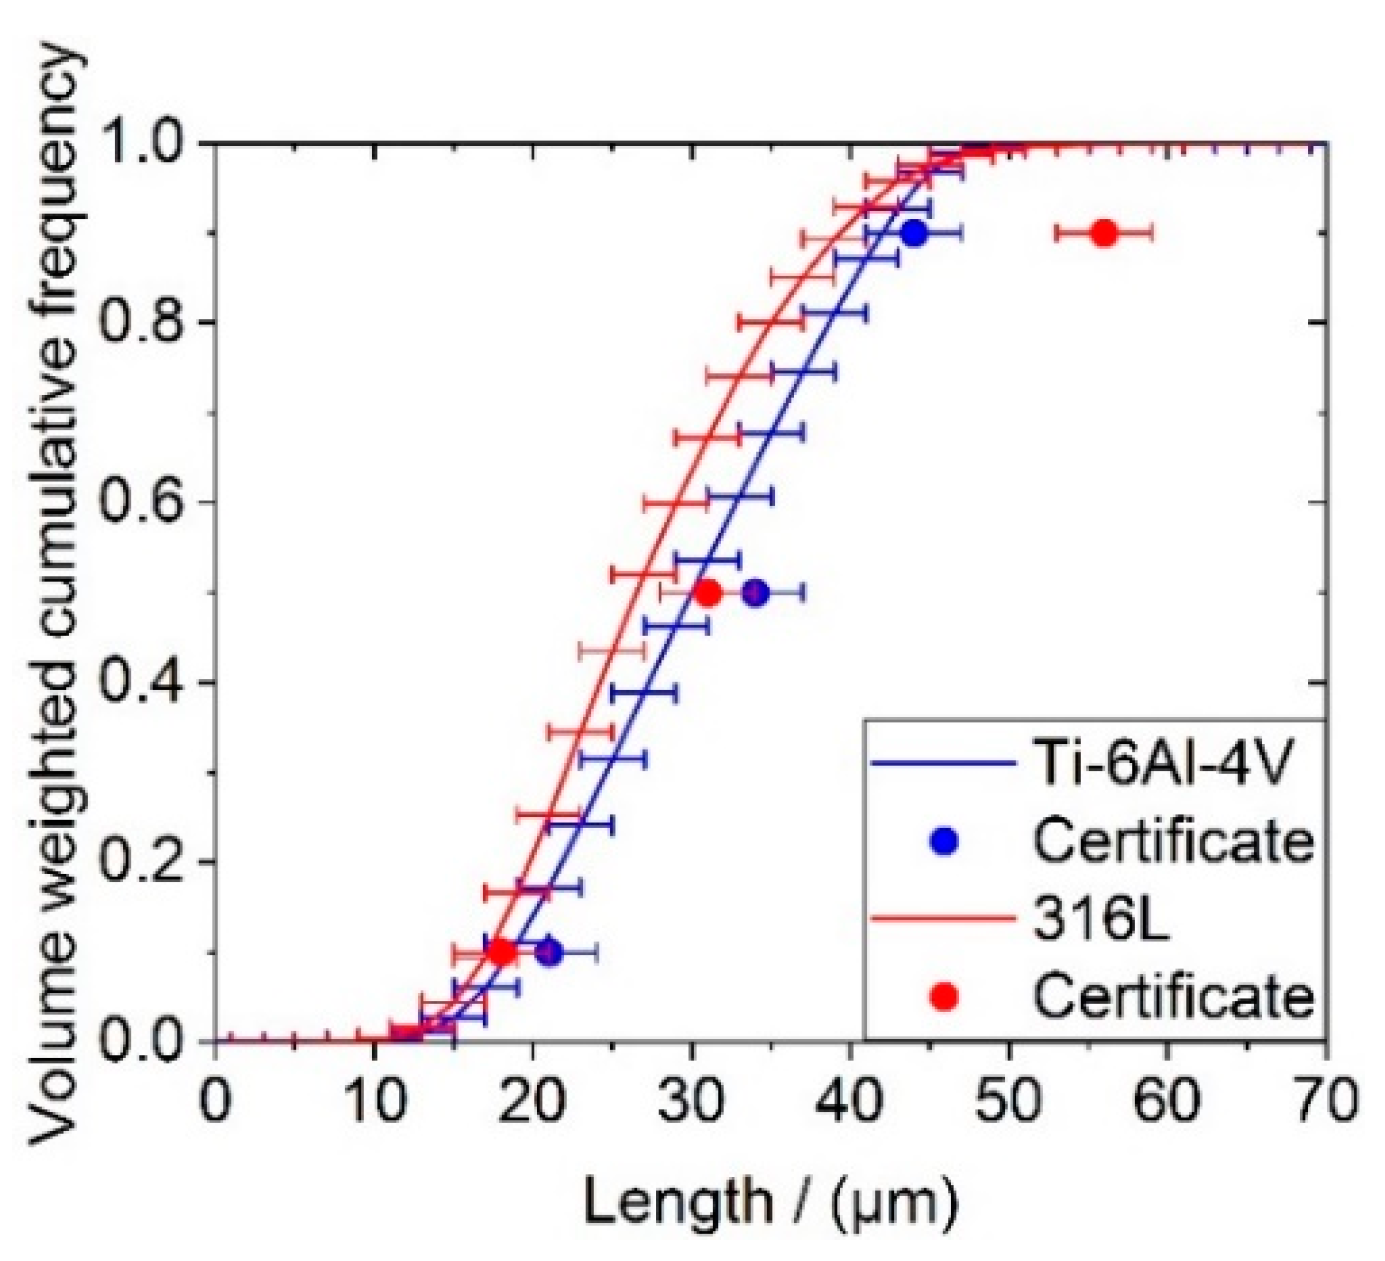
3.1. Particle Size
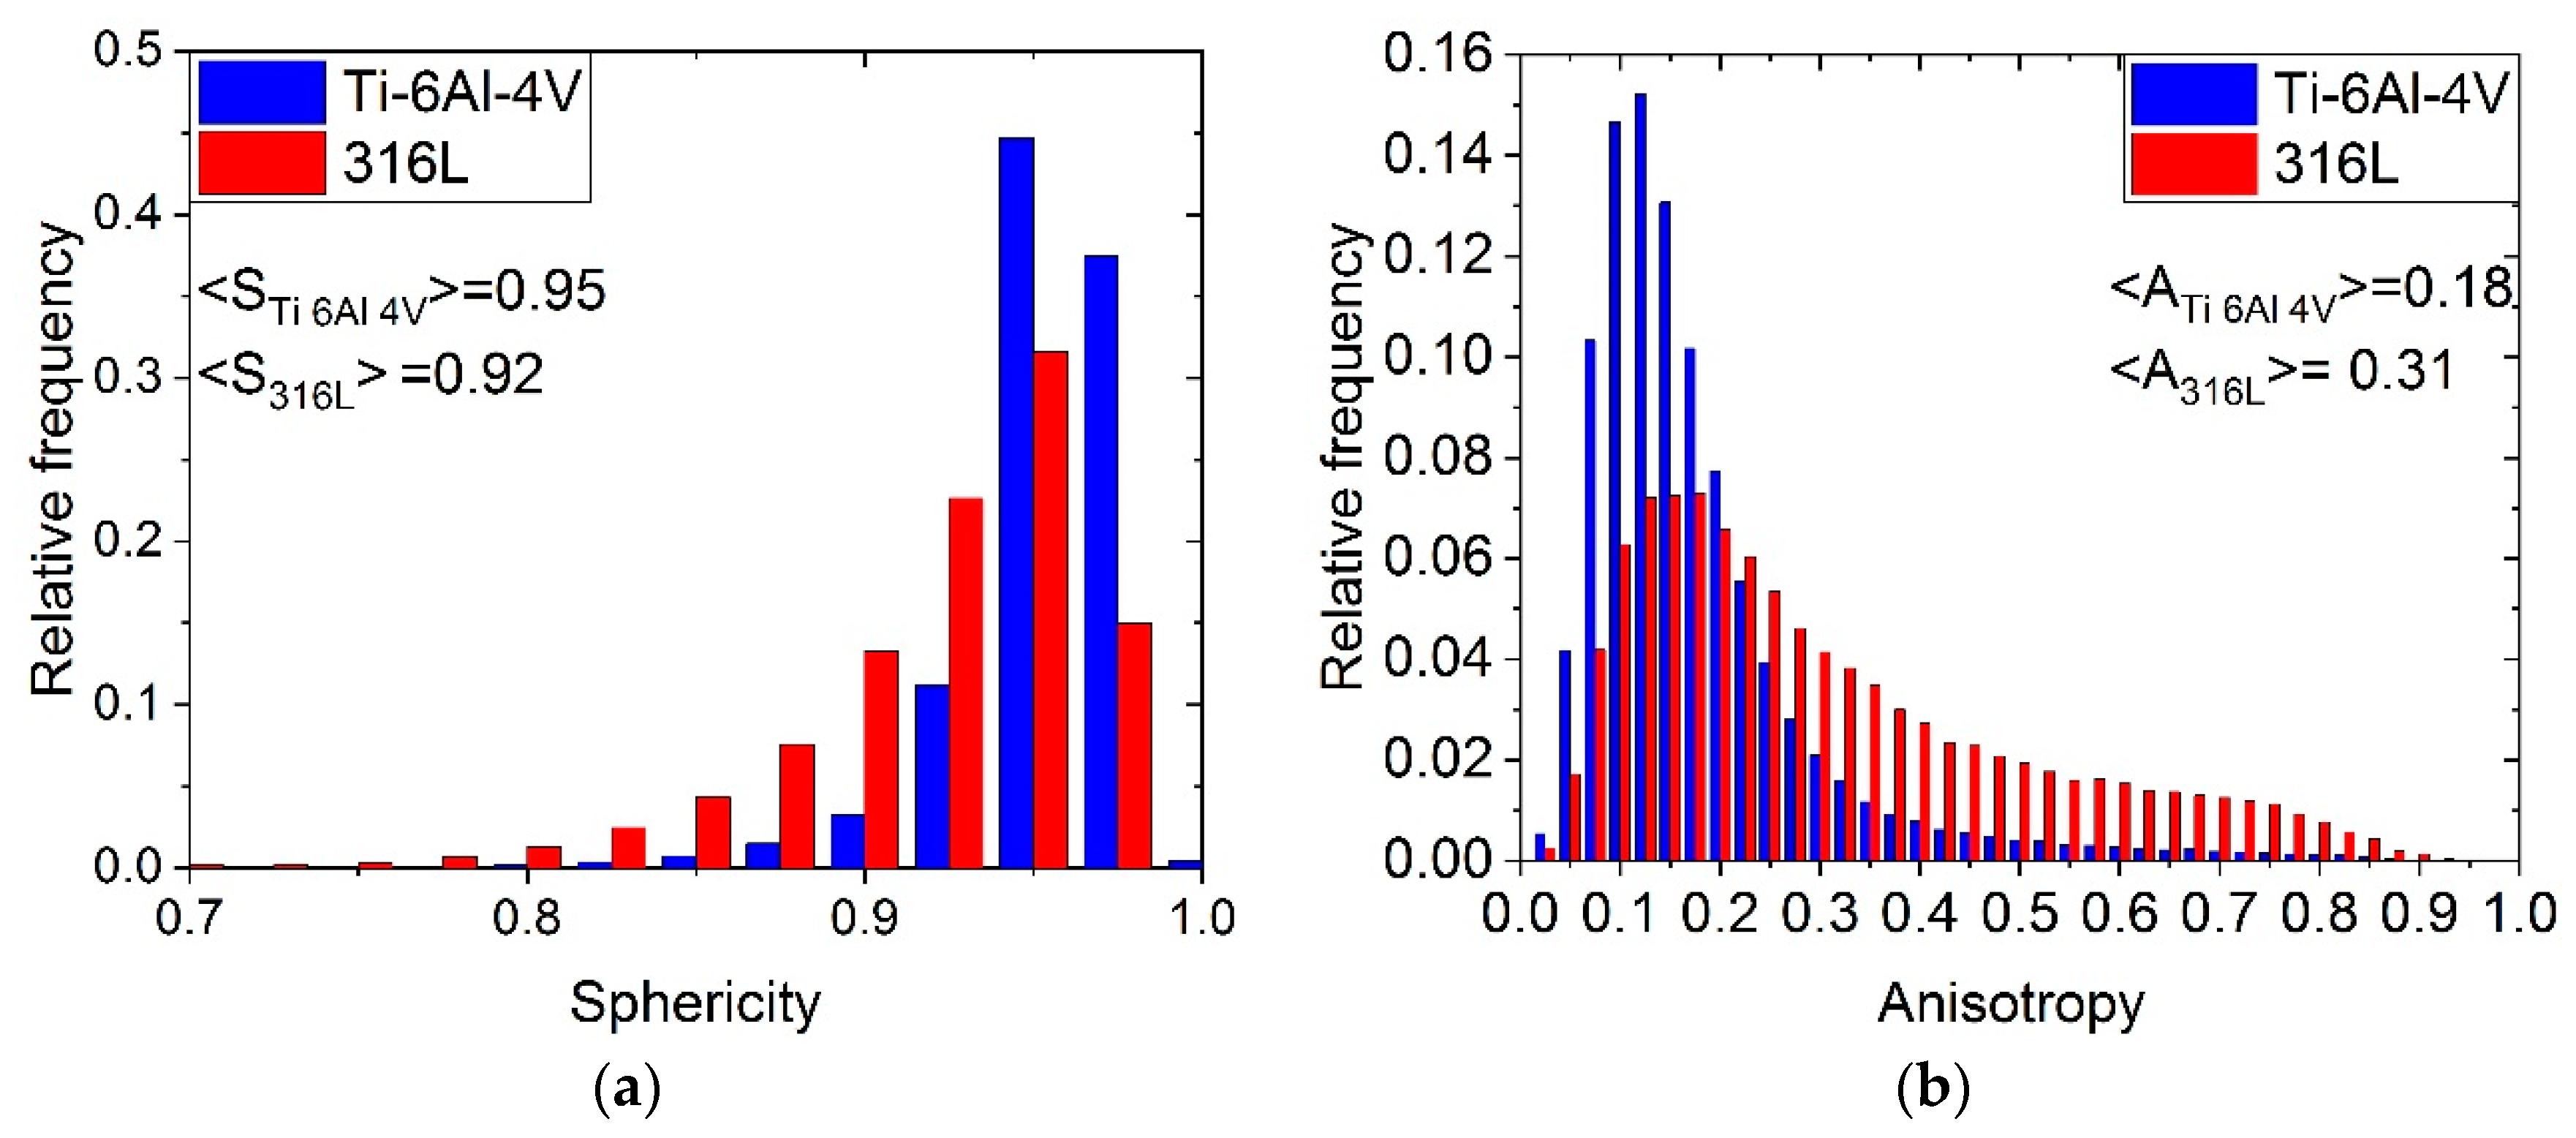
3.2. Particle Shape
3.3. Packing Density
- PDTi–6Al–4V = 0.561 ± 0.003.
- PD316L = 0.576 ± 0.004.
4. Conclusions
Author Contributions
Funding
Acknowledgments
Conflicts of Interest
References
- Spears, T.G.; Gold, S.A. In-process sensing in selective laser melting (SLM) additive manufacturing. Integr. Mater. Manuf. Innov. 2016, 5, 2. [Google Scholar] [CrossRef]
- Alkahari, M.R.; Furumoto, T.; Ueda, T.; Hosokawa, A.; Tanaka, R.; Abdul Aziz, M.S. Thermal Conductivity of Metal Powder and Consolidated Material Fabricated via Selective Laser Melting. Key Eng. Mater. 2012, 523–524, 244–249. [Google Scholar] [CrossRef]
- Spierings, A.B.; Voegtlin, M.; Bauer, T.; Wegener, K. Powder flowability characterisation methodology for powder-bed-based metal additive manufacturing. Prog. Addit. Manuf. 2015, 1, 9–20. [Google Scholar] [CrossRef]
- Baitimerov, R.; Lykov, P.; Zherebtsov, D.; Radionova, L.; Shultc, A.; Prashanth, K.G. Influence of Powder Characteristics on Processability of AlSi12 Alloy Fabricated by Selective Laser Melting. Materials 2018, 11, 742. [Google Scholar] [CrossRef] [PubMed]
- Tammas-Williams, S.; Zhao, H.; Léonard, F.; Derguti, F.; Todd, I.; Prangnell, P.B. XCT analysis of the influence of melt strategies on defect population in Ti–6Al–4V components manufactured by Selective Electron Beam Melting. Mater. Charact. 2015, 102, 47–61. [Google Scholar] [CrossRef]
- Jacob, G.; Brown, C.U.; Donmez, A. The Influence of Spreading Metal Powders with Different Particle Size Distributions on the Powder Bed Density in Laser-Based Powder Bed Fusion Processes. Adv. Manuf. Series (NIST AMS) 2018. 100-17. [Google Scholar] [CrossRef]
- Heiden, M.J.; Deibler, L.A.; Rodelas, J.M.; Koepke, J.R.; Tung, D.J.; Saiz, D.J.; Jared, B.H. Evolution of 316L stainless steel feedstock due to laser powder bed fusion process. Addit. Manuf. 2019, 25, 84–103. [Google Scholar] [CrossRef]
- Simonelli, M.; Tse, Y.Y.; Tuck, C. Effect of the build orientation on the mechanical properties and fracture modes of SLM Ti–6Al–4V. Mater. Sci. Eng. A 2014, 616, 1–11. [Google Scholar] [CrossRef]
- Erdoğan, S.T.; Garboczi, E.J.; Fowler, D.W. Shape and size of microfine aggregates: X-ray microcomputed tomography vs. laser diffraction. Powder Technol. 2007, 177, 53–63. [Google Scholar] [CrossRef]
- Garboczi, E.J.; Bullard, J.W. 3D analytical mathematical models of random star-shape particles via a combination of X-ray computed microtomography and spherical harmonic analysis. Adv. Powder Technol. 2017, 28, 325–339. [Google Scholar] [CrossRef]
- Jillavenkatesa, A.; Dapkunas, S.J.; Lum, L.S.H. NIST Recommended Practice Guide—Particle Size Characterization; National Institute of Standards and Technology: Washington, DC, USA, 2001.
- Strondl, A.; Lyckfeldt, O.; Brodin, H.; Ackelid, U. Characterization and Control of Powder Properties for Additive Manufacturing. Jom 2015, 67, 549–554. [Google Scholar] [CrossRef]
- Slotwinski, J.A.; Garboczi, E.J.; Stutzman, P.E.; Ferraris, C.F.; Watson, S.S.; Peltz, M.A. Characterization of Metal Powders Used for Additive Manufacturing. J. Res. Natl. Inst. Stand. Technol. 2014, 119, 460–493. [Google Scholar] [CrossRef]
- Nguyen, Q.B.; Nai, M.L.S.; Zhu, Z.; Sun, C.-N.; Wei, J.; Zhou, W. Characteristics of Inconel Powders for Powder-Bed Additive Manufacturing. Engineering 2017, 3, 695–700. [Google Scholar] [CrossRef]
- Zielinski, J.; Vervoort, S.; Mindt, H.-W.; Megahed, M. Influence of Powder Bed Characteristics on Material Quality in Additive Manufacturing. BHM Berg- und Hüttenmännische Monatshefte 2017, 162, 192–198. [Google Scholar] [CrossRef]
- Brown, D.J.; Vickers, G.T. The use of projected area distribution functions in particle shape measurement. Powder Technol. 1998, 98, 250–257. [Google Scholar] [CrossRef]
- Heim, K.; Bernier, F.; Pelletier, R.; Lefebvre, L.P. High resolution pore size analysis in metallic powders by X-ray tomography. Case Stud. Nondestruct. Test. Eval. 2016, 6, 45–52. [Google Scholar] [CrossRef]
- Cunningham, R.; Narra, S.P.; Montgomery, C.; Beuth, J.; Rollett, A.D. Synchrotron-Based X-ray Microtomography Characterization of the Effect of Processing Variables on Porosity Formation in Laser Power-Bed Additive Manufacturing of Ti-6Al-4V. Jom 2017, 69, 479–484. [Google Scholar] [CrossRef]
- Cooke, A.; Slotwinski, J. Properties of Metal Powders for Additive Manufacturing: A Review of the State of the Art of Metal Powder Property Testing; US Department of Commerce: Washington, DC, USA; National Institute of Standards and Technology: Gaithersburg, MA, USA, 2012; p. 7873. [CrossRef]
- Chen, G.; Zhao, S.Y.; Tan, P.; Wang, J.; Xiang, C.S.; Tang, H.P. A comparative study of Ti-6Al-4V powders for additive manufacturing by gas atomization, plasma rotating electrode process and plasma atomization. Powder Technol. 2018, 333, 38–46. [Google Scholar] [CrossRef]
- Liu, B.; Wildman, R.; Tuck, C.; Ashcroft, I.; Hague, R. Investigation the effect of particle size distribution on processing parameters optimisation in selective laser melting process. In Proceedings of the Solid Freeform Fabrication Symposium, Austin, TX, USA, 8–10 August 2011. [Google Scholar]
- Rack, A.; Zabler, S.; Müller, B.R.; Riesemeier, H.; Weidemann, G.; Lange, A.; Goebbels, J.; Hentschel, M.; Görner, W. High resolution synchrotron-based radiography and tomography using hard X-rays at the BAMline (BESSY II). Nucl. Instrum. Methods Phys. Res. Sect. A Accelerators Spectrom. Detectors Assoc. Equip. 2008, 586, 327–344. [Google Scholar] [CrossRef]
- Paganin, D.; Mayo, S.C.; Gureyev, T.E.; Miller, P.R.; Wilkins, S.W. Simultaneous phase and amplitude extraction from a single defocused image of a homogeneous object. J. Microsc.-Oxf. 2002, 206, 33–40. [Google Scholar] [CrossRef]
- Schindelin, J.; Rueden, C.T.; Hiner, M.C.; Eliceiri, K.W. The ImageJ ecosystem: An open platform for biomedical image analysis. Mol. Reprod. Dev. 2015, 82, 518–529. [Google Scholar] [CrossRef]
- Tomasi, C.; Manduchi, R. Bilateral filtering for gray and color images. In Proceedings of the Sixth International Conference on Computer Vision (IEEE Cat. No.98CH36271), Bombay, India, 7 January 1998; pp. 839–846. [Google Scholar]
- Ridler, T.W.; Calvard, S. Picture Thresholding Using an Iterative Selection Method. IEEE Trans. Syst. Man Cybern. 1978, 8, 630–632. [Google Scholar] [CrossRef]
- Münch, B.; Gasser, P.; Holzer, L.; Flatt, R. FIB-Nanotomography of Particulate Systems—Part II: Particle Recognition and Effect of Boundary Truncation. J. Am. Ceram. Soc. 2006, 89, 2586–2595. [Google Scholar] [CrossRef]
- Jolliffe, I. Principal Component Analysis; Springer: Berlin/Heidelberg, Germany, 2011. [Google Scholar]
- ASTM. Standard Test Method for Particle Size Distribution of Metal Powders and Related Compounds by Light Scattering; ASTM International: West Conshohocken, PA, USA, 2010. [Google Scholar]
- ISO. Particle Size Analysis—Laser Diffraction Methods; ISO: Geneva, Switzerland, 2009. [Google Scholar]
- Pedersen, J.S. Analysis of small-angle scattering data from colloids and polymer solutions: Modeling and least-squares fitting. Adv. Colloid Interface Sci. 1997, 70, 171–210. [Google Scholar] [CrossRef]
- Mühlenweg, H.; Hirleman, E.D. Laser Diffraction Spectroscopy: Influence of Particle Shape and a Shape Adaptation Technique. Part. Part. Syst. Charact. 1998, 15, 163–169. [Google Scholar] [CrossRef]
- Mutke, C.; Geenen, K.; Röttger, A.; Theisen, W. Interaction between laser radiation and metallic powder of 316L austenitic steel during selective laser melting. Mater. Charact. 2018, 145, 337–346. [Google Scholar] [CrossRef]
- Zhou, B.; Zhou, J.; Li, H.; Lin, F. A study of the microstructures and mechanical properties of Ti6Al4V fabricated by SLM under vacuum. Mater. Sci. Eng. A 2018, 724, 1–10. [Google Scholar] [CrossRef]
- McGeary, R.K. Mechanical Packing of Spherical Particles. J. Am. Ceram. Soc. 1961, 44, 513–522. [Google Scholar] [CrossRef]
- Hettiarachchi, H.A.C.K.; Mampearachchi, W.K. Effect of vibration frequency, size ratio and large particle volume fraction on packing density of binary spherical mixtures. Powder Technol. 2018, 336, 150–160. [Google Scholar] [CrossRef]
- Olakanmi, E.O. Effect of mixing time on the bed density, and microstructure of selective laser sintered (sls) aluminium powders. Mater. Res. 2012, 15, 167–176. [Google Scholar] [CrossRef]
- Ayer, J.E.; Soppet, F.E. Vibratory Compaction: I, Compaction of Spherical Shapes. J. Am. Ceram. Soc. 1965, 48, 180–183. [Google Scholar] [CrossRef]
- Pednekar, S.; Chun, J.; Morris, J.F. Bidisperse and polydisperse suspension rheology at large solid fraction. J. Rheol. 2018, 62, 513–526. [Google Scholar] [CrossRef]
- Tan, J.H.; Wong, W.L.E.; Dalgarno, K.W. An overview of powder granulometry on feedstock and part performance in the selective laser melting process. Addit. Manuf. 2017, 18, 228–255. [Google Scholar] [CrossRef]
- Lee, Y.S.; Zhang, W. Mesoscopic Simulation of Heat Transfer and Fluid Flow in Laser Powder Bed Additive Manufacturing. In Proceedings of the International Solid Freeform Fabrication Symposium, Austin, TX, USA, 10–12 August 2014; pp. 1154–1165. [Google Scholar]
- Gurtler, F.J.; Karg, M.; Dobler, M.; Kohl, S.; Tzivilsky, I.; Schmidt, M. Influence of Powder Distribution on Process Stability in Laser Beam Melting: Analysis of Melt Pool Dynamics by Numerical Simulations. In Proceedings of the 25th Annual International Solid Freeform Fabrication Symposium, Austin, TX, USA, 4–6 August 2014. [Google Scholar]

| Material | Measurement | D10/µm | D50/µm | D90/µm |
|---|---|---|---|---|
| 316L | Certificate | 18 | 31 | 56 |
| Length | 18.9 | 29.8 | 45.3 | |
| Equivalent diameter | 17.2 | 26.5 | 39.4 | |
| Width | 17.1 | 26.4 | 39.3 | |
| Height | 15.5 | 24.2 | 36.2 | |
| Ti–6Al–4V | Certificate | 21 | 34 | 44 |
| Length | 19.6 | 31.2 | 43.6 | |
| Equivalent diameter | 18.6 | 30.0 | 42.0 | |
| Width | 18.6 | 30.0 | 41.9 | |
| Height | 17.8 | 29.0 | 40.7 |
© 2019 by the authors. Licensee MDPI, Basel, Switzerland. This article is an open access article distributed under the terms and conditions of the Creative Commons Attribution (CC BY) license (http://creativecommons.org/licenses/by/4.0/).
Share and Cite
Thiede, T.; Mishurova, T.; Evsevleev, S.; Serrano-Munoz, I.; Gollwitzer, C.; Bruno, G. 3D Shape Analysis of Powder for Laser Beam Melting by Synchrotron X-ray CT. Quantum Beam Sci. 2019, 3, 3. https://doi.org/10.3390/qubs3010003
Thiede T, Mishurova T, Evsevleev S, Serrano-Munoz I, Gollwitzer C, Bruno G. 3D Shape Analysis of Powder for Laser Beam Melting by Synchrotron X-ray CT. Quantum Beam Science. 2019; 3(1):3. https://doi.org/10.3390/qubs3010003
Chicago/Turabian StyleThiede, Tobias, Tatiana Mishurova, Sergei Evsevleev, Itziar Serrano-Munoz, Christian Gollwitzer, and Giovanni Bruno. 2019. "3D Shape Analysis of Powder for Laser Beam Melting by Synchrotron X-ray CT" Quantum Beam Science 3, no. 1: 3. https://doi.org/10.3390/qubs3010003
APA StyleThiede, T., Mishurova, T., Evsevleev, S., Serrano-Munoz, I., Gollwitzer, C., & Bruno, G. (2019). 3D Shape Analysis of Powder for Laser Beam Melting by Synchrotron X-ray CT. Quantum Beam Science, 3(1), 3. https://doi.org/10.3390/qubs3010003