


Analysing the Value of Digital Twinning Opportunities in Infrastructure Asset Management

 ,
,  ,
,  ,
,  and
and 
Abstract
1. Introduction
- Several interested parties are involved in decision-making, sometimes with conflicting objectives;
- There are numerous options available, and information on how they contribute to the objectives is often limited;
- When many units/assets share resources, the optimal resource allocation to each unit/asset hardly ever represents the best collective resource allocation—“The whole is greater than the sum of the parts”;
- Decisions often produce second- and higher-order effects in complex systems like infrastructure asset systems. These effects are difficult to measure and may affect the types of impacts and their real magnitude.
2. Case Study Research
2.1. Research Approach Supported by Case Studies
2.2. Rail and Road Case Studies in Infraestruturas de Portugal, S.A.
2.3. UNI-TWIN Model
2.4. Application of the UNI-TWIN Model to the Case Studies
3. Value-Based Analysis of Digital Twinning Opportunities
3.1. Method of Analysis
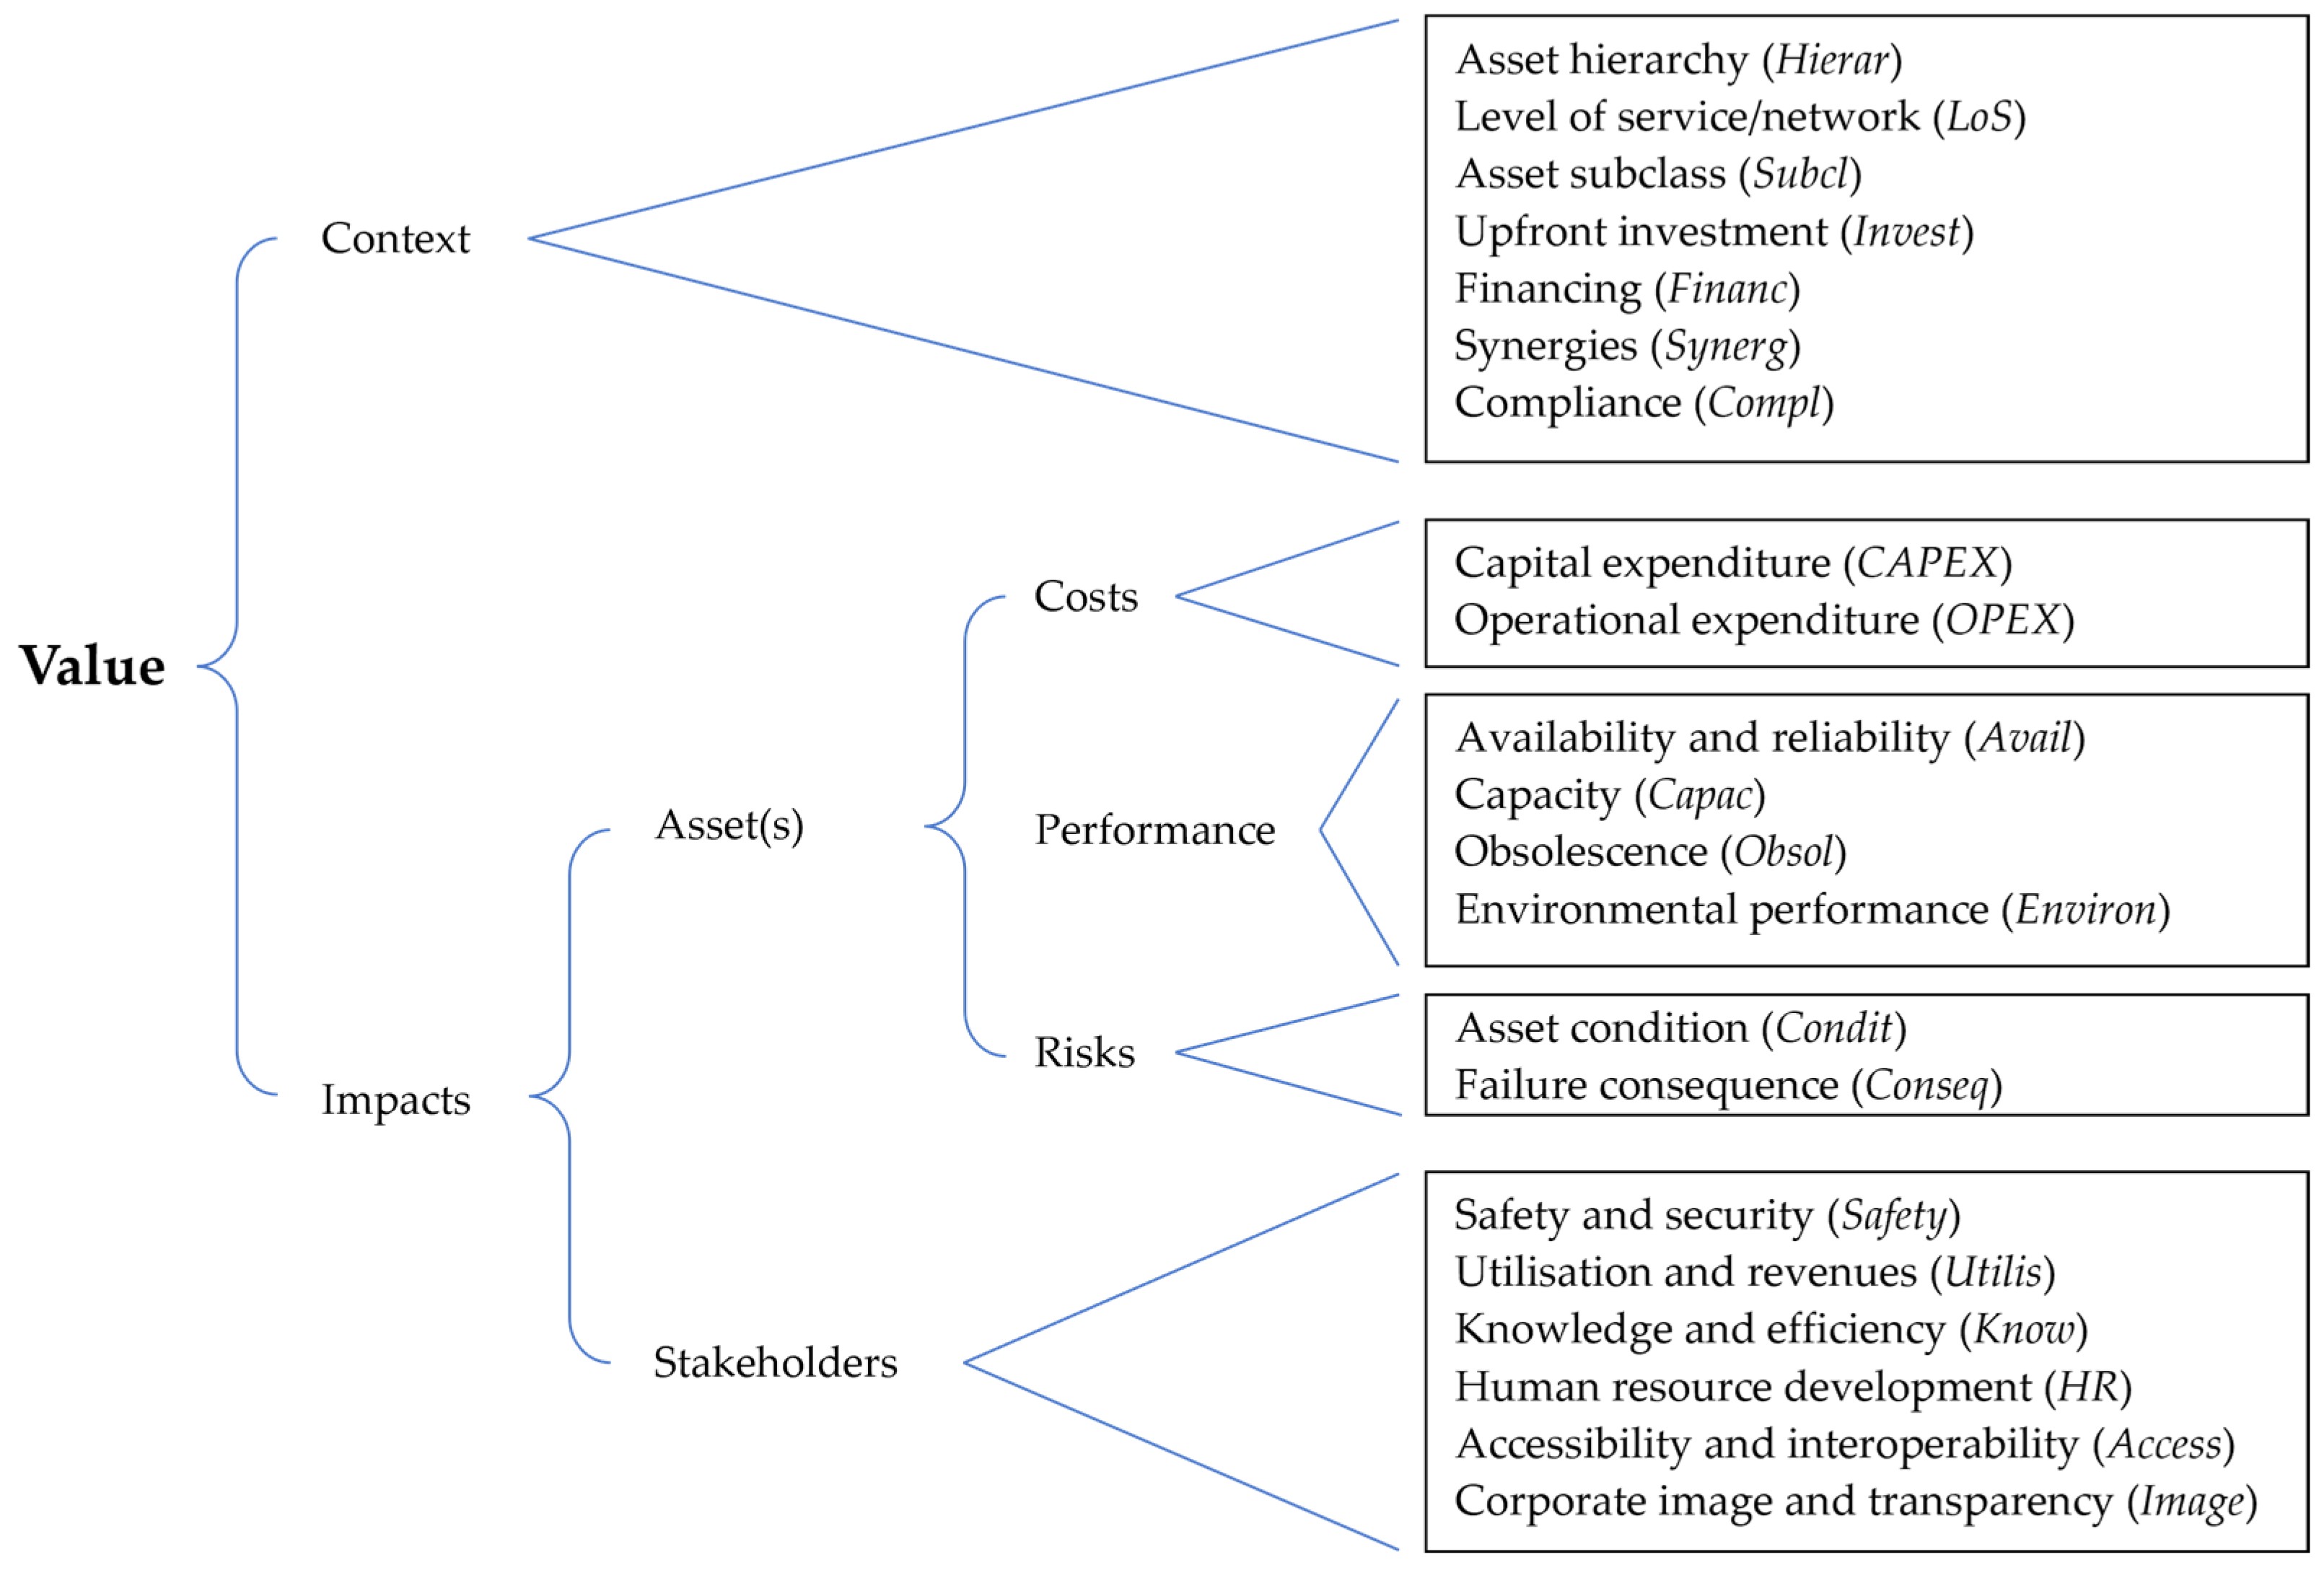
3.2. Value Framework

| Description | ||
|---|---|---|
| Context | Hierar | Level of asset hierarchy to which the opportunity is referring |
| LoS | Level of service associated with the asset(s), expressed in terms of network level | |
| Subcl | Asset subclass(es) to which the opportunity refers | |
| Invest | Upfront investment needed to implement the opportunity | |
| Financ | Type of financing opportunities related to the investment needed | |
| Synerg | Type of synergies associated with the opportunity in hands | |
| Compl | Type of commitments and requirements (political, legal, local/national/international) associated with the opportunity | |
| Asset(s) | CAPEX | Funds used to acquire or upgrade long-term physical assets |
| OPEX | Ongoing costs that the organisation incurs as a result of performing its normal business operations | |
| Avail | Time for which the asset is available to be operated relative to the total time. It includes relevant aspects such as reliability and service punctuality (affected by infrastructure). | |
| Capac | Ability of the asset(s) to support certain operational requirements (volume, speed, size, load, etc.) | |
| Obsol | Process of assets becoming antiquated in comparison with newer versions | |
| Environ | Environmental externalities derived from the asset life cycle activities | |
| Condit | Level of asset integrity, affecting the probability of failure | |
| Conseq | Consequences derived from asset failure | |
| Relevant stakeholders | Safety | Protection of passengers, workers, and other people from physical harm or security breaches |
| Utilis | Demand for services provided by the assets | |
| Know 1 | Ability to use information in decisions and actions, and the impacts on process efficiency and effectiveness | |
| HR | Development of workers’ capabilities, career, and job satisfaction | |
| Access | Capacity of users to access the service (accessibility) and the ability of infrastructure to connect with other assets/services/systems (interoperability) | |
| Image | Overall corporate image, communication, and transparency | |
3.3. Analysis Criteria
4. Results and Discussion
4.1. Analysis of Context
4.2. Impacts on Asset Cost, Risk, and Performance
4.3. Impacts on Stakeholders
4.4. Overall Value Analysis
- More important than the numerical results obtained, the use of three different case studies enabled the validation of the analysis methodology, which was the underlying aim of the study described in this chapter.
- Despite the adoption of BIM methodology for the new railway line (case study [F]) and the Displacement monitoring system using satellite data (case study [K]) showing a higher overall value than the Real-time Dissolved Gas Analysis system (case study [A]), it does not mean that they are necessarily “good” or viable digital twinning opportunities. This means that, according to this methodology and existing knowledge, case studies [K] and [F] are more likely to generate higher value for IP than [A].
- The analysis is performed at an intermediate level in terms of information detail to integrate and communicate the impacts of different opportunities related to different hierarchical levels. Some criteria could be further developed in terms of performance detail, such as OPEX (e.g., 10% reduction in asset OPEX), but these improvements should be aligned with the existing capacity to report such impacts.
- When applied to a larger set of opportunities, this analysis method is expected to assist asset managers in shortening the list of competing investments according to a given “cut-off line”.
- The proposed analysis method can be combined with other decision-support methods, tools, and metrics, such as Value/CAPEX, Life Cycle Costing, Net Present Value, Risk-based analysis, etc. [48]. Asset managers can select and assess the applicability and usefulness of such tools as those listed in [19,20,39].
- The analysis results are directly influenced by different sources of uncertainty, namely, judgements, impacts, scoring, scale factors, and weighting [49]. Future studies should consider these uncertainties further and their impact on the results. Using more case studies or comparisons with other tools (e.g., MACBETH) could help with this task.
5. Conclusions
Author Contributions
Funding
Data Availability Statement
Conflicts of Interest
References
- Bana e Costa, C. Como Utilizar a Metodologia MACBETH para Ajudar a Avaliar Opções e a Alocar Recursos: Conceitos e Casos. 2006. Available online: http://web.ist.utl.pt/carlosbana/bin/help/papers/CAGECE23_3_06CarlosBanaeCosta (accessed on 21 June 2024).
- Almeida, N.; Trindade, M.; Komljenovic, D.; Finger, M. A conceptual construct on value for infrastructure asset management. Util. Policy 2022, 75, 101354. [Google Scholar] [CrossRef]
- Wijnia, Y. Pragmatic Performance Management Aligning Objectives across Different Asset Portfolios. In 15th WCEAM Proceedings; Pinto, J.O.P., Kimpara, M.L.M., Reis, R.R., Seecharan, T., Upadhyaya, B.R., Amadi-Echendu, J., Eds.; WCEAM 2021, Lecture Notes in Mechanical Engineering; Springer: Cham, Switzerland, 2022; pp. 163–172. [Google Scholar] [CrossRef]
- IFRS Foundation. International Integrated Reporting Framework. 2022. Available online: https://integratedreporting.ifrs.org/wp-content/uploads/2021/01/InternationalIntegratedReportingFramework.pdf (accessed on 8 May 2024).
- ISO 55000; Asset Management—Overview, Principles and Terminology. International Organization for Standardization: Geneva, Switzerland, 2024.
- Vieira, J.; Poças Martins, J.; Marques de Almeida, N.; Patrício, H.; Gomes Morgado, J. Towards Resilient and Sustainable Rail and Road Networks: A Systematic Literature Review on Digital Twins. Sustainability 2022, 14, 7060. [Google Scholar] [CrossRef]
- Singh, M.; Fuenmayor, E.; Hinchy, E.P.; Qiao, Y.; Murray, N.; Devine, D. Digital Twin: Origin to Future. Appl. Syst. Innov. 2021, 4, 36. [Google Scholar] [CrossRef]
- Dirnfeld, R. Digital Twins in Railways: State of the Art, Opportunities, and Guidelines. Bachelor’s Thesis, Linnaeus University, Växjö, Sweden, 2022. [Google Scholar]
- Sanfilippo, F.; Thorstensen, R.T.; Jha, A.; Jiang, Z.; Robbersmyr, K.G. A Perspective Review on Digital Twins for Roads, Bridges, and Civil Infrastructures. In Proceedings of the International Conference on Electrical, Computer, Communications and Mechatronics Engineering, ICECCME 2022, Maldives, Maldives, 16–18 November 2022. [Google Scholar] [CrossRef]
- Yan, B.; Yang, F.; Qiu, S.; Wang, J.; Cai, B.; Wang, S.; Zaheer, Q.; Wang, W.; Chen, Y.; Hu, W. Digital twin in transportation infrastructure management: A systematic review. Intell. Transp. Infrastruct. 2023, 2, liad024. [Google Scholar] [CrossRef]
- PIARC. Road Related Data and How to Use It; PIARC—World Road Association: Paris, France, 2020; ISBN 978-2-84060-627-7. [Google Scholar]
- Paterson, W.; Scullion, T. Information Systems for Road Management: Draft Guidelines on System Design and Data Issues; Report INU 77, September 1990; The World Bank—Policy Planning and Research Staff—Infrastructure and Urban Development Department: Washington, DC, USA, 1990. [Google Scholar]
- Johnson, A.; Heaton, J.; Yule, S.; Luke, S.; Pocock, D.; Parlikad, A.K.; Scholing, J. Informing the information requirements of a digital twin: A rail industry case study. Proc. Inst. Civ. Eng.—Smart Infrastruct. Constr. 2022, 174, 33–45. [Google Scholar] [CrossRef]
- Sun, Y.; Fidge, C.; Ma, L. A generic split process model for asset management decision-making. In Proceedings of the 3rd World Congress on Engineering Asset Management and Intelligent Maintenance Systems Conference (WCEAM-IMS 2008), Beijing, China, 27–30 October 2008; Ni, J., Ma, L., Lee, J., Jinji, G., Mathew, J., Eds.; Springer: Berlin/Heidelberg, Germany, 2009; pp. 1444–1452. [Google Scholar]
- Clara, J. Tomada de Decisão e Transformação Digital em Gestão de Ativos na Infraestruturas de Portugal: Caso de Estudo—Ponte das Várzeas. Master’s Thesis, Instituto Superior Técnico, University of Lisbon, Lisboa, Portugal, 2022. [Google Scholar]
- IAM. Asset Management—An Anatomy, 4th ed.; Institute of Asset Management: Bristol, UK, 2024. [Google Scholar]
- Trindade, M.; Almeida, N.; Finger, M.; Silva, J.G.; Ghira, L.; Vieira, J. Application of a value-based decision-making process to an industrial water supply system. In Engineering Assets and Public Infrastructures in the Age of Digitalization; Liyanage, J., Amadi-Echendu, J.M.J., Eds.; Springer: Cham, Switzerland, 2020; pp. 321–329. [Google Scholar] [CrossRef]
- Vieira, J.; Cabral, M.; Almeida, N.; Silva, J.G.; Covas, D. Novel methodology for efficiency-based long-term investment planning in water infrastructures. Struct. Infrastruct. Eng. 2020, 16, 1654–1668. [Google Scholar] [CrossRef]
- IPWEA. International Infrastructure Management Manual, 5th ed.; IPWEA—Institute of Public Works Engineering Australasia: North Sydney, Australia, 2015. [Google Scholar]
- Parnell, G.S. Decision analysis in one chart. Decis. Anal. One Chart Decis. Line 2009, 1, 20–24. [Google Scholar]
- Prodanov, C.C.; de Freitas, E.C. Metodologia do Trabalho Científico: Métodos e Técnicas da Pesquisa e do Trabalho Acadêmico, 2nd ed.; Feevale: Rio Grande do Sul, Brazil, 2013. [Google Scholar]
- Gauch, H.G. Scientific Method in Practice; Cambridge University Press: Cambridge, UK, 2003. [Google Scholar]
- Gibbons, M.; Limoges, C.; Nowotny, H.; Schwartzman, S.; Scott, P.; Trow, M. The New Production of Knowledge: Dynamics of Science and Research in Contemporary Societies; SAGE Publications: Thousand Oaks, CA, USA, 1994. [Google Scholar]
- Robson, C.; McCartan, K. Real World Research, 4th ed.; John Wiley & Sons Ltd.: Chichester, UK, 2016. [Google Scholar]
- Neuman, W.L. Social Research Methods: Qualitative and Quantitative Approaches, 7th ed.; Pearson Education Limited: Harlow, Essex, UK, 2014. [Google Scholar]
- IP. Relatório e Contas. 2023. Available online: https://www.infraestruturasdeportugal.pt/sites/default/files/inline-files/Relatorio-Contas-IP-2023.pdf (accessed on 8 May 2024).
- IP. 50 Desafios de Inovação da IP. 2023. Available online: https://www.infraestruturasdeportugal.pt/sites/default/files/inline-files/DesafiosIDI-2023.pdf (accessed on 26 May 2024).
- Manning, C. Technology Readiness Levels. 2023. Available online: https://www.nasa.gov/directorates/somd/space-communications-navigation-program/technology-readiness-levels/ (accessed on 26 May 2024).
- IP. Sistema de Análise de Óleos Isolantes em Transformadores de Tração. In Ferrovia 4.0: PPS1—Sustainability of the Railway System. Ferrovia 4.0. In Press. Available online: http://ferrovia40.pt/estrutura-do-projeto/sustentabilidade-do-sistema-ferroviario/?lang=en (accessed on 26 May 2024).
- Starynina, J.; Bušmanis, R. BIM implementation for the Rail Baltica Global Project; Rail Baltica AS: Riga, Latvia, 2019. [Google Scholar]
- Amado, J.; Morgado, J.; Godinho, E.; Resende, P. A aplicabilidade da monitorização por satélite no contexto da gestão de ativos rodoferroviários. 10º Congr. Rodoferroviário Port. 2022, 1–8. Available online: https://10crp.crp.pt/wp-content/uploads/2022/07/paper_120.pdf (accessed on 16 May 2024).
- Vieira, J.; Poças Martins, J.; de Almeida, N.M.; Patrício, H.; Morgado, J. Reshaping the Digital Twin Construct with Levels of Digital Twinning (LoDT). Appl. Syst. Innov. 2023, 6, 114. [Google Scholar] [CrossRef]
- ISO 31000; Risk management—Guidelines. International Organization for Standardization: Geneva, Switzerland, 2018.
- Bana e Costa, C.; De Corte, J.-M.; Vansnick, J.-C. MACBETH. Int. J. Inf. Technol. Decis. Mak. 2012, 11, 359–387. [Google Scholar] [CrossRef]
- Naoum, S.G. Dissertation Research & Writing for Construction Students, 3rd ed.; Routledge: Abingdon, Oxfordshire, UK, 2013. [Google Scholar]
- Patrício, H.; Almeida, H. A framework for evaluating the performance of infrastructure assets. Application to the life-cycle of road and railway bridges. In Life-Cycle of Engineering Systems: Emphasis on Sustainable Civil Infrastructure, 1st ed.; Bakker, J., Frangopol, D.M., Breugel, K., Eds.; CRC Press: London, UK, 2016. [Google Scholar]
- IP. Estratégia de gestão de ativos. In SAMP—Strategic Asset Management Plan; Infraestruturas de Portugal, S.A. (DAM): Almada, Portugal, 2019. [Google Scholar]
- UIC. A Value Framework for Railways. 2024. Available online: https://shop.uic.org/en/other-reports/14618-a-value-framework-for-railways.html (accessed on 14 February 2024).
- IEC 31010; IEC 31010—Risk Management—Risk Assessment Techniques. International Electrotechnical Commission (IEC): Geneva, Switzerland, 2019.
- GFMAM. Criteria for Evaluating Asset Management Indicators. 2021. Available online: https://gfmam.org/sites/default/files/2021-11/Criteria_Evalution_Asset_Management_Indicators_First_Edition_English.pdf (accessed on 26 March 2024).
- IP. Inquérito 2017—Portefólio de Activos da Rede Ferroviária (Internal Document); Infraestruturas de Portugal, S.A.: Almada, Portugal, 2017. [Google Scholar]
- IP. Inquérito 2017—Portefólio de Activos da Rede Rodoviária (Internal Document); Infraestruturas de Portugal, S.A.: Almada, Portugal, 2017. [Google Scholar]
- Keeney, R.L.; Raiffa, H. Decisions with Multiple Objectives: Preferences and Value Tradeoffs; Cambridge University Press: Cambridge, UK, 1993. [Google Scholar]
- Oliveira, A. Priorização de Intervenções na rede Ferroviária—Definição de uma Estratégia de Priorização de Intervenções de Proximidade na rede Ferroviária Nacional para um Horizonte de 5 anos [Master’s Thesis, Universidade da Beira Interior]. 2016. Available online: https://ubibliorum.ubi.pt/bitstream/10400.6/7689/1/5154_10271.pdf (accessed on 26 May 2024).
- IP. Plano de Proximidade 2017–2021 (Internal Document); Infraestruturas de Portugal, S.A.: Almada, Portugal, 2016. [Google Scholar]
- Portal BASE. 2022. Available online: https://www.base.gov.pt/base4 (accessed on 8 May 2024).
- Das, B.P.; Patel, S. Ester-filled distribution transformers—The sustainable model to strengthen the low voltage grid. Transform. Mag. 2022, 9, 70–82. Available online: https://hrcak.srce.hr/file/392581 (accessed on 8 May 2024).
- Thomson, A.; Woodhouse, J. Which Project(s) Should I Defer if Budgets Have Been Cut? Optimizing Decision Making (Woodhouse Partnership). 2020. Available online: https://www.twpl.com/pt-br/resources/downloads-files/ (accessed on 8 May 2024).
- Bana e Costa, C. O Método Multicritério MACBETH Multicritério e Aplicações No Brasil. 2017. Available online: http://web.tecnico.ulisboa.pt/carlosbana (accessed on 26 May 2024).


| Case Study | Network | Brief Description |
|---|---|---|
| [A] | Rail | Real-time Dissolved Gas Analysis system in a power transformer at Salreu traction substation, located on the Linha do Norte railway line |
| [B] | Rail | Dynamic train weighting triggered by trains’ motion, applied to a track segment in the Linha do Norte railway line |
| [C] | Rail | BIM-supported fatigue life prediction system for the Várzeas railway bridge |
| [D] | Rail | Landslide and rockfall detection system, applied to a track segment on the Douro railway line |
| [E] | Rail | Automatic structural health monitoring of the walls of the Rossio railway tunnel |
| [F] | Rail | BIM methodology for the design, construction, maintenance, and renewal of the new high-speed rail line connecting Lisbon and Porto |
| [G] | Rail | Adoption of rail control software with signalling design automation and verification for the new Lisboa—Santa Apolónia railway station |
| [H] | Rail | Development of a Digital Shield for the rail track platform to improve safety during construction works around the rail corridor and reduce the impact on operations |
| [I] | Road | Real-time monitoring system of pavement performance in a road section of the IC5 |
| [J] | Road | Monitoring of pavement condition using a vehicle equipped with a Laser Profiler that allows obtaining three-dimensional cross-sectional profiles |
| [K] | Rail and Road | Displacement monitoring of rail and road infrastructures (earthwork structures and bridges) using satellite data (InSAR) |
| Case Study | Network | Description | |
|---|---|---|---|
| [A] |  [29] | Rail | Real-time Dissolved Gas Analysis (DGA) system in a power transformer at the Salreu traction substation, located on the Linha do Norte railway line. The Hydran M2-X unit continuously monitors and communicates gas and moisture levels dissolved in the power transformer insulating oil. |
| [F] |  ([30], for illustration purposes) | Rail | Adoption of BIM methodology for the design, construction, maintenance, and renewal of the new high-speed rail line connecting Lisbon and Porto. |
| [K] |  [31] | Rail/Road | Displacement monitoring of earthwork and engineering infrastructure using satellite data. Interferometric Synthetic Aperture Radar (InSAR)—a remote sensing technology based on radar waves—is used to detect ground or structural motion on a network-wide scale. |
| Dimension | Description |
|---|---|
| Hierarchy | The hierarchical level of the physical assets |
| Connection | The type of data connection between the physical and digital spaces |
| Synchronisation | The frequency at which data are integrated into the digital space |
| Geometric representation | The type of geometric representation of the physical space |
| Non-geometric representation | The level of representation of non-geometric characteristics of the physical space that are relevant to the defined purpose |
| Intelligence | The type of intelligence associated with data analysis |
| Interface | How users interact with the information generated in the digital space |
| Accessibility | The scope of users that access the information generated by the digital space |
| Autonomy | The autonomy level of digital space in decision-making |
| Level | Hierarchy | Connection | Synchron. | Geom. Rep. | NGeom. Rep. | Intelligence | Interface | Accessib. | Autonomy |
|---|---|---|---|---|---|---|---|---|---|
| 1 | Asset subcomponent | No connection | No synchronisation | No geometric represent. | No representation of non-geometric characteristics | Descriptive | No interface | Single user | No autonomy |
| 2 | Asset component | Manual data flow in both ways | Monthly/yearly | Conceptual | Necessary non-geometric requirements, with flaws | Diagnostic | Local access | Minimal | User- assistance |
| 3 | Asset | Semi-automatic in one way | Daily/weekly | Approximate | Necessary requirements without major data flaws | Predictive | De-centralised and shared access | Limited | Partial autonomy |
| 4 | Asset system/group/class | Automatic in one way | Hourly/minutes | Precise | Necessary and important requirements. Some data flaws can exist | Prescriptive | Immersive | Advanced | High autonomy |
| 5+ | System of Systems (portfolio) | Automatic in both ways | ≤seconds/event-driven | As-built | All non-geometric requirements | Cognitive | Smart hybrid | Full | Limited options for humans |
| Case Study | Hierarchy | Connection | Synchron. | Geom. Rep. | NGeom. Rep. | Intelligence | Interface | Accessib. | Autonomy |
|---|---|---|---|---|---|---|---|---|---|
| [A] | (1) | (4) | (5+) | (1) | (3) | (1) | (3) | (1) | (2) |
| Asset subcomponent (oil of a power transformer unit) | Automatic from physical to digital space (via Ethernet) | Readings sent to user every 15 s | No representation is needed for this phase | PT ID, location, temperature, moisture, and gas readings; it lacks gas characterisation | Descriptive (for now, data are analysed descriptively) | Decentralised access to data (IP server) | A single user has access to these data | Sends alerts in case of abnormal values | |
| [F] | (4) | (2) | (3) | (5+) | (3) | (1) | (3) | (5+) | (1) |
| New rail line | Inputs of internal and external data are mainly manual/off-line | Data inputs are most frequent during construction (days) | As-is BIM model, LOD 300 | Necessary requirements are represented with adequate quality, quantity, and granularity without major data flaws | Descriptive (clashes, quantities, etc.) | Decentralised and shared access | Multiple users across organisations | No autonomy | |
| [K] | (4) | (4) | (3) | (3) | (4) | (3) | (3) | (3) | (2) |
| Group of 18 earthwork and engineering assets | Automatic from physical to digital space (via satellite) | Sentinel-1 satellites allow radar image acquisition every 12 days | The elements are represented in GIS with their approximate quantity, size, and shape. | Necessary and important requirements (vertical and horizontal displacements, displacement risk) | Historical analysis and predictive tools for exceeded safety thresholds forecast | Online visualisation tools (shared access) | Multiple users across departments | Automated alerts once safety thresholds are crossed |
| Stakeholder Group | Network | Relevant Stakeholders | Needs and Expectations |
|---|---|---|---|
| Shareholder (external) | Rail, Road | Portuguese State | Sustainable construction Sustainable mobility Efficient management (quality vs. cost) Good reputation Public service Rationality and criteria in investment selection Reduction in accidents |
| Users (external) | Road | Private or collective users of the national road network | Good condition and functionality Safety Accessibility Network availability according to service levels Reduced costs |
| Concession holder | Collaboration in contractual relationship Control of contractual obligations | ||
| Rail | Rail operators, rail service users | Fair service pricing Information Availability, punctuality, reliability Safety Reduced costs | |
| Regulatory body (external) | Road | AMT *, IMT *, ANSR * | Compliance with the Concession Contract |
| Rail | AMT *, IMT * | Compliance with the Contract Programme Compliance with safety requirements | |
| Local bodies (external) | Rail, Road | Municipalities, CCDR *, neighbouring municipalities | Equity and transparency Accessibility Information |
| Suppliers (external) | Rail, Road | Other concession holders, toll operators, design and construction companies, service providers, suppliers | Compliance with contractual obligations Equity and transparency |
| Labour organisations (external) | Rail, Road | ACT * | Compliance with legislation |
| Media (external) | Rail, Road | Media | Quick, accurate, and up-to-date information |
| Workers (internal) | Rail, Road | Workers’ committees, labour unions | Safety Training Fair pay Prospect of career progression |
| Criterion (Context) | Description of Performance Levels | Relative Value | |||||
|---|---|---|---|---|---|---|---|
| LoS | Rail | Road | Rail | Road | |||
| S1 (high performance/commuter) | S1.1 (high performance) | 100 | 100 | ||||
| S2 (high performance) | S1.2 (high performance) | 80 | 80 | ||||
| S3 (medium performance) | S2.1 (medium performance) | 50 | 50 | ||||
| Various | S2.2 (medium performance) | 50 | 50 | ||||
| S4 (low performance) | Various | 0 | 50 | ||||
| S3 (low performance) | 0 | ||||||
| Subcl 1 | Relevance | Rail | Road | ||||
| High | Rail track Turnout Bridges, tunnels, viaducts Operational control centre Track platform Interlocking and external equipment | Pavement Drainage Safety barriers Traffic lights Lighting Other equipment (kerbs, etc.) | 100 | ||||
| Medium | Level crossings Catenary ATP system Platform protection Substations and sectioning posts Other track equipment Elevated crossings Complementary safety systems Culverts and drainage Operation support systems Transmission Cable trays and transmission support | Viaducts, underpasses Roadside and pavement Bridges, tunnels Vertical signalling Culverts Platform protection Overpasses Fences Variable-message signs Emergency Communications System (SOS) Video surveillance | 50 | ||||
| Low | Passenger platform Buildings Current return paths and earthing system Energy remote control and supervisory systems Passenger information system Acoustic protection, fences | Acoustic protection Other built elements (car parks, rest areas, etc.) Traffic counting Gantries and tolls Buildings | 0 | ||||
| Invest | System of Systems | Asset system | Asset | Asset component | Asset subcomponent | ||
| ]0;1 mEUR[ | ]0;500 kEUR[ | ]0;50 kEUR[ | ]0;10 kEUR[ | ]0;1 kEUR[ | 100 | ||
| [1 mEUR;5 mEUR[ | [500 kEUR;1 mEUR[ | [50 kEUR;100 kEUR[ | [10 kEUR;50 kEUR[ | [1 kEUR;5 kEUR[ | 50 | ||
| [5 mEUR;10 mEUR[ | [1 mEUR;5 mEUR[ | [100 kEUR;500 kEUR[ | [50 kEUR;100 kEUR[ | [5 kEUR;10 kEUR[ | 0 | ||
| [10 mEUR;50 mEUR[ | [5 mEUR;10 mEUR[ | [500 kEUR;1 mEUR[ | [100 kEUR;500 kEUR[ | [10 kEUR;50 kEUR[ | −50 | ||
| [50 mEUR;+∞[ | [10 mEUR;+∞[ | [1 mEUR;+∞[ | [500 kEUR;+∞[ | [50 kEUR;+∞[ | −100 | ||
| Financ | European Union funding | 100 | |||||
| European Investment Bank financing | 50 | ||||||
| Self-financing | 0 | ||||||
| Synerg | Leverages investments already implemented | 100 | |||||
| There are planned investments related to the opportunity | 50 | ||||||
| There are no relevant synergies | 0 | ||||||
| Compl | Court summons/instruction from grantor/legal obligation | 100 | |||||
| Recommendation from legal advice/national or international commitments | 66.7 | ||||||
| Municipal or local commitments | 33.3 | ||||||
| No requirements or commitments | 0 | ||||||
| Criterion (Impacts) | Description of Performance Levels | Score | Relative Value | |
|---|---|---|---|---|
| Asset(s) | CAPEX, OPEX, Avail, Capac, Obsol, Environ, Condit, Conseq | |||
| Significant or highly likely positive impact | ++ | 100 | ||
| Marginal or likely positive impact | + | 50 | ||
| Negligible or unknown impact | +/− | 0 | ||
| Stakeholders | Safety, Utilis, Know, HR, Access, Image | Marginal or likely negative impact | − | −50 |
| Significant or highly likely negative impact | − − | −100 | ||
 |—“neutral” level of performance; |
 |—“good” level of performance.
| Criterion (Context) | Asset Hierarchical Level | Scale Factor |
|---|---|---|
| Hierar 1 | System of Systems | 1.00 |
| Asset system | 0.50 | |
| Asset | 0.25 | |
| Asset component | 0.15 | |
| Asset subcomponent | 0.10 |
| Value Criteria/Weights | Total | ||||||||
|---|---|---|---|---|---|---|---|---|---|
| Context | Hierar | LoS | Subcl | Invest | Financ | Synerg | Compl | Hierar | |
| - 1 | 3% | 2% | 2% | 7% | 2% | 2% | - 1 | 18% | |
| Asset(s) | CAPEX | OPEX | Avail | Capac | Obsol | Environ | Condit | Conseq | |
| 12.5% | 13% | 12.5% | 2% | 2% | 3% | 5% | 5% | 55% | |
| Relevant stakeholders | Safety | Utilis | Know | HR | Access | Image | |||
| 13% | 5% | 2% | 1% | 4% | 2% | 27% | |||
| Total | 100% | ||||||||
| Case Study | Asset(s) Context | Opportunity Context | Context | ||||||||
|---|---|---|---|---|---|---|---|---|---|---|---|
| Network | Hierar | LoS | Subcl | Invest | Financ | Synerg | Compl | ||||
| [A] | Score | Rail | Asset subcomp. | S1 | Substations and sectioning posts (medium relevance) | 9.5 kEUR | [5 kEUR; 10 kEUR[ | European Union funding | There are no relevant synergies | No requirements or commitments | |
| Relative value | 0.10 * | 100 | 50 | 0 | 100 | 0 | 0 | ||||
| Weighted value | 3.0 | 1.0 | 0.0 | 7.0 | 0.0 | 0.0 | 11.0 | ||||
| [F] | Score | Rail | Asset system | S1 | Various subclasses (high relevance) | 2.5 mEUR | [1 mEUR; 5 mEUR[ | European Union funding | There are planned investments related to the opportunity | No requirements or commitments | |
| Relative value | 0.50 * | 100 | 100 | 0 | 100 | 50 | 0 | ||||
| Weighted value | 3.0 | 2.0 | 0.0 | 7.0 | 1.0 | 0.0 | 13.0 | ||||
| [K] | Score | Rail and Road | Asset system 1 | Various levels 2 | Various subclasses (high relevance) | 50 k€ | ]0;500 k€[ | Self- financing | There are no relevant synergies | No requirements or commitments | |
| Relative value | 0.50 * | 50 | 100 | 100 | 0 | 0 | 0 | ||||
| Weighted value | 1.5 | 2.0 | 2.0 | 0.0 | 0.0 | 0.0 | 5.5 | ||||
| Weights | 3% | 2% | 2% | 7% | 2% | 2% | 18% (total) | ||||
| Case Study | Impact (Description) | Metrics (Examples) | Impact Criterion | Score |
|---|---|---|---|---|
| [A] | Reduction in laboratory testing periodically performed to the properties of the insulating oil | Reduction of 1 test every 2 years (2750 EUR/2 years): 2500 EUR/test (power transformer of type A/B with oil in acceptable condition) + 250 EUR/test for expert supervision | OPEX | ++ |
| Reduction in oil replacements caused by the decrease in oil extractions during laboratory testing | Reduction of circa 3 L of insulating oil per sample, equivalent to EUR 90 per sample/test | OPEX | + | |
| Reduction in the environmental impact caused by the decrease in oil replacements | Reduction of circa 3 L of insulating oil per sample, equivalent to 6 kg CO2/sample/test [47] | Environ | ++ | |
| Reduction in fault risk by early detection of degradation patterns in the insulating oil | Note: The reduction in the need for expert supervision and contractor services (number of trips) and the impacts of the monitoring equipment could also be considered | Cond Conseq | + + | |
| Increased data quality and confidence in decision-making | It promptly alerts the user to abnormal readings, minimising the probability of unplanned asset failures (increased costs of reactive interventions). | OPEX Environ | + + | |
| Increase in recurring costs due to the operation and maintenance of the monitoring equipment | Reduction in the number of confirmatory tests needed to validate previous tests (often producing unreliable results caused by various error sources, e.g., sample extraction proceeding) | OPEX | − | |
| [F] | Increased data quality and confidence in decision-making | A more precise estimate of additional work and a decrease in rework caused by planning and design phases with fewer errors contribute to reducing capital expenditure. | CAPEX | + |
| Reduction in the environmental impact of renewals and maintenance actions | A collaborative and coordinated work methodology as BIM decreases the risk of errors and rework (e.g., fewer clashes, delays), contributing to the reduction of the environmental impact (e.g., material consumption, equipment use, waste) | Environ | + | |
| Reduction in downtime due to faults and maintenance work | Better informed interventions consume less time (limited and costly in rail operations—MTTR, for example) and produce fewer errors (less rework) | Conseq | + | |
| Increase in recurrent costs due to the adoption of BIM methodology | Need for periodic training of human resources, payment of IT licenses (e.g., Autodesk Revit), and operation (e.g., electricity consumption, data storage, data quality review) and maintenance of IT infrastructure | OPEX | − | |
| [K] | Reduction in fault risk by early detection of increasing displacement patterns | Automatically alerts users once safety thresholds are crossed, minimising the probability of unplanned asset failures (increased costs of reactive interventions). | Cond Conseq | + ++ |
| Optimisation of inspection activities | The use of a complementary monitoring system helps asset managers prioritising inspections in a more informed way, minimising time and resource consumption | OPEX | + | |
| Increase in recurring costs due to the operation of the monitoring system (service provider) | Costs associated with the operation of the monitoring system provided by an external entity. | OPEX | − |
| Case Study | Costs | Performance | Risk | Asset(s) | ||||||
|---|---|---|---|---|---|---|---|---|---|---|
| CAPEX | OPEX | Avail | Capac | Obsol | Environ | Condit | Conseq | |||
| [A] | Score | +/− | ++ | +/− | +/− | +/− | ++ | + | + | |
| Relative value | 0 | 100 | 0 | 0 | 0 | 100 | 50 | 50 | ||
| Weighted value | 0.0 | 13.0 | 0.0 | 0.0 | 0.0 | 3.0 | 2.5 | 2.5 | 21.0 | |
| [F] | Score | + | − | +/− | +/− | +/− | + | +/− | + | |
| Relative value | 50 | -50 | 0 | 0 | 0 | 50 | 0 | 50 | ||
| Weighted value | 6.3 | -6.5 | 0.0 | 0.0 | 0.0 | 1.5 | 0.0 | 2.5 | 3.8 | |
| [K] | Score | +/− | +/− | +/− | +/− | +/− | +/− | + | ++ | |
| Relative value | 0 | 0 | 0 | 0 | 0 | 0 | 50 | 100 | ||
| Weighted value | 0.0 | 0.0 | 0.0 | 0.0 | 0.0 | 0.0 | 2.5 | 5.0 | 7.5 | |
| Weights | 12.5% | 13% | 12.5% | 2% | 2% | 3% | 5% | 5% | 55% (total) | |
| Case Study | Impact (Description) | Metrics (Examples) | Impact Criterion | Score |
|---|---|---|---|---|
| [A] | Increased data quality and confidence in decision-making | Reduction in the number of confirmatory tests needed to validate previous tests (often producing unreliable results caused by various error sources, e.g., sample extraction proceeding) | Know | ++ |
| Increased safety caused by the reduction in in-person tests | Reducing the number of incidents and accidents caused by the presence of workers (service providers) performing the laboratory tests on the insulating oil | Safety | + | |
| Increased risk of data breaches | Increased exposure to data breaches and unauthorised access to asset data | Safety | − | |
| Increased risk of dependence on certain technology solutions and vendors | Adopting a work methodology for such a broad scope might create dependence on certain technologies or providers. Poor after-sales service, discontinued versions, increases in license price, and incompatibility between versions are issues that might arise. | Know | − | |
| [F] | Increased data quality and confidence in decision-making | A more precise estimation of additional work and a decrease in rework caused by planning and design phases with fewer errors contribute to better knowledge. | Know | ++ |
| Reduction in risk of losing data and information | Using digital infrastructure (e.g., cloud) and decentralised access to store and access data decreases the risk of permanent loss of documented information (e.g., design documents, as-is) by physical destruction (e.g., biological agents, fire, floods) | Know | + | |
| Safer work procedures due to better visualisation | During design, construction, maintenance, and disposal phases, work planning can benefit from immersive and comprehensive visualisation of the asset and its environment, producing safer procedures and a safer work environment (e.g., fewer accidents or less severe accidents) | Safety | + | |
| Increased risk of data security | Decentralised and shared access to data increases exposure to data breaches and unauthorised access to data related to critical assets | Safety | − | |
| Increased risk of dependence on certain technology solutions and vendors | Adopting a work methodology for such a broad scope might create dependence on certain technologies or providers. Poor after-sales service, discontinued versions, increases in license price, and incompatibility between versions are issues that might arise. | Know | − | |
| Increased risk of interoperability issues | When exchanging and updating file versions, interoperability issues might occur, leading to data losses and inconsistencies | Know | − | |
| Lack of some standards regarding the use of BIM in the rail and road context | The sector’s overall maturity regarding the use of BIM is currently low. A lack of standards regarding information requirements and data exchange protocols persists within the community. Due to the learning curve, the initial stages of development are expected to be less productive and more extended in time due to the learning curve. | Know | − | |
| Improved corporate image by adopting innovative work methodologies involving the use of technologies | The corporate image of IP may benefit from the adoption of BIM in a project of such importance as the new high-speed rail line (e.g., innovation awards, news in the media) | Image | + | |
| [K] | Improvement of organisational knowledge | The satellite-based monitoring system complements other inspection activities by adding more data (e.g., longer time series). | Know | + |
| Increased safety caused by the reduction in in-person surveys | Reducing the number of incidents and accidents caused by the presence of workers performing topographical surveys | Safety | + | |
| Improved corporate image by adopting innovative monitoring techniques | The corporate image of IP may benefit from the adoption of innovative monitoring techniques (e.g., news in the media) | Image | + |
| Case Study | Safety | Utilis | Know | HR | Access | Image | Stakeholders | |
|---|---|---|---|---|---|---|---|---|
| [A] | Score | +/− | +/− | ++ | +/− | +/− | +/− | |
| Relative value | 0 | 0 | 100 | 0 | 0 | 0 | ||
| Weighted value | 0.0 | 0.0 | 2.0 | 0.0 | 0.0 | 0.0 | 2.0 | |
| [F] | Score | +/− | +/− | + | +/− | +/− | + | |
| Relative value | 0 | 0 | 50 | 0 | 0 | 50 | ||
| Weighted value | 0.0 | 0.0 | 1.0 | 0.0 | 0.0 | 1.0 | 2.0 | |
| [K] | Score | + | +/− | + | +/− | +/− | + | |
| Relative value | 50 | 0 | 50 | 0 | 0 | 50 | ||
| Weighted value | 6.5 | 0.0 | 1.0 | 0.0 | 0.0 | 1.0 | 8.5 | |
| Weights | 13% | 5% | 2% | 1% | 4% | 2% | 27% (total) | |
| Case Study | Relative Weighted Value (without Scale Factor) | Scale Factor (Hierar) | Overall Weighted Value (with Scale Factor) | ||||||
|---|---|---|---|---|---|---|---|---|---|
| Context | Asset(s) | Stakeholders | Result | Context | Asset(s) | Stakeholders | Result | ||
| 0.10 | |||||||||
| [A] | 11.0 | 21.0 | 2.0 | 34.0 | 1.1 | 2.1 | 0.2 | 3.4 | |
| 0.50 | |||||||||
| [F] | 13.0 | 3.8 | 2.0 | 18.8 | 6.5 | 1.9 | 1.0 | 9.4 | |
| 0.50 | |||||||||
| [K] | 5.5 | 7.5 | 8.5 | 21.5 | 2.8 | 3.8 | 4.3 | 10.8 | |
| Interval | [−2; 18] | [−55; 55] | [−27; 27] | [−84; 100] | [−2; 18] | [−55; 55] | [−27; 27] | [−84; 100] | |
Disclaimer/Publisher’s Note: The statements, opinions and data contained in all publications are solely those of the individual author(s) and contributor(s) and not of MDPI and/or the editor(s). MDPI and/or the editor(s) disclaim responsibility for any injury to people or property resulting from any ideas, methods, instructions or products referred to in the content. |
© 2024 by the authors. Licensee MDPI, Basel, Switzerland. This article is an open access article distributed under the terms and conditions of the Creative Commons Attribution (CC BY) license (https://creativecommons.org/licenses/by/4.0/).
Share and Cite
Vieira, J.; Almeida, N.M.d.; Poças Martins, J.; Patrício, H.; Morgado, J.G. Analysing the Value of Digital Twinning Opportunities in Infrastructure Asset Management. Infrastructures 2024, 9, 158. https://doi.org/10.3390/infrastructures9090158
Vieira J, Almeida NMd, Poças Martins J, Patrício H, Morgado JG. Analysing the Value of Digital Twinning Opportunities in Infrastructure Asset Management. Infrastructures. 2024; 9(9):158. https://doi.org/10.3390/infrastructures9090158
Chicago/Turabian StyleVieira, João, Nuno Marques de Almeida, João Poças Martins, Hugo Patrício, and João Gomes Morgado. 2024. "Analysing the Value of Digital Twinning Opportunities in Infrastructure Asset Management" Infrastructures 9, no. 9: 158. https://doi.org/10.3390/infrastructures9090158
APA StyleVieira, J., Almeida, N. M. d., Poças Martins, J., Patrício, H., & Morgado, J. G. (2024). Analysing the Value of Digital Twinning Opportunities in Infrastructure Asset Management. Infrastructures, 9(9), 158. https://doi.org/10.3390/infrastructures9090158