Article

Speed Analyses of Intersections Reconstructed into Roundabouts: A Case Study from Rijeka, Croatia

by
Sanja Šurdonja
1,*,
Robert Maršanić
2,3 and
Aleksandra Deluka-Tibljaš
1
1
Faculty of Civil Engineering, University of Rijeka, Radmile Matejčić 3, 51000 Rijeka, Croatia
2
Department for Logistics and Sustainable Mobility, University of North, Trg dr. Žarka Dolinara 1, 48000 Koprivnica, Croatia
3
County Road Administration of Primorsko-Goranska County, Nikole Tesla 9, 51000 Rijeka, Croatia
*
Author to whom correspondence should be addressed.
Infrastructures 2024, 9(9), 159; https://doi.org/10.3390/infrastructures9090159
Submission received: 24 July 2024 / Revised: 6 September 2024 / Accepted: 9 September 2024 / Published: 12 September 2024

Abstract

:
The reconstruction of a standard at-grade intersection into a roundabout is very often motivated by the need to improve traffic safety, and the effects are usually monitored through before–after analyses based on traffic accidents. As in some countries, like Croatia, data on traffic accidents are not available, in this study, a methodology for the estimation of roundabout implementation effects based on measured operating speeds was developed and applied. This methodology enabled the analysis of the development of roundabouts designed according to the Croatian guidelines through the analysis of four roundabout case studies. Statistical analyses of before–after operating speed were performed, and speed time distribution variations, traffic volumes, and design elements were analyzed, compared, and correlated. Statistically significant differences were found between operating speeds before and after the reconstruction, although the expected effect of speed reduction of roundabouts was not observed. The weak correlations observed between the individual design elements of the roundabouts and operating speed highlight the need to analyze the combination of design elements with operational speed. The application of the developed methodology enabled systematic safety analyses of the selected roundabouts. The results of the analyses suggest a need to revise the guidelines.

1. Introduction

Road intersections are the most hazardous points of road networks due to a series of decisions that drivers need to make in a short period of time. Thus, intersections should be designed such that all their elements are understandable and simple enough to ensure straightforward navigation but also force drivers to decrease their speed to give them more time to observe a situation and decide how to respond to it [1,2].
At-grade signalized or non-signalized intersections are often reconstructed into roundabouts because of the need to increase the traffic safety of existing intersections, as roundabouts are perceived as safer solutions due to the way in which traffic moves in them and the fewer potential conflict points they present. A roundabout’s curved path of passage through an intersection also increases safety as it is expected to reduce a vehicle’s speed therein and in the wider zone of the intersection (approach and departure) [3,4].
Although roundabouts generally have the same basic geometric elements, the technical regulations for designing roundabouts differ between countries. These technical standards depend on the tradition of use and, consequently, targeted research related to this type of intersection. In Croatia, the first technical instructions for the design of roundabouts were created in 2003, and the latest version of the guidelines for designing roundabouts in Croatia was issued in 2015 [5], referring primarily to state roads. Still, since there are no other technical regulations, these guidelines are widely applied to all categories of roads inside and outside urban areas. It must be pointed out that the Croatian guidelines for roundabouts share many similarities with those of surrounding countries (e.g., Slovenia, Serbia, and Bosnia and Herzegovina). These guidelines give designers a lot of freedom to choose and optimize design elements. To ensure the functionality of the design, the following three checks are suggested: visibility, swept path, and operating speed checks [5]. The available traffic safety statistics at the national level for Croatia [6] show that since the implementation of new guidelines for the design of roundabouts in 2015, the number of traffic accidents at roundabouts increased from 2016 to 2022 by 35%. The number of fatally injured individuals in the same period was almost constant, and it varied from zero to a maximum of three deaths per year. This increasing number of accidents can be connected with the increasing number of roundabouts (there are no reliable figures on the number of reconstructed intersections in the Republic of Croatia) and their implementation in the areas where they represent a novelty, so users must undergo a certain period of adaptation to the specific way of moving through this type of intersection. Although there have been years in which there was not a single fatality at roundabouts, data show [6] that in some of the analyzed years, the proportions of fatalities at roundabouts were the same as those at standard at-grade intersections.
After roundabouts have been implemented, it is common practice to monitor their performance to improve design standards and achieve the best possible effects regarding safety and capacity. An analysis of existing research showed that collecting and analyzing data related to traffic safety at roundabouts constitutes an extremely important step in defining traffic and infrastructural elements that affect safety [7]. An analysis of the functionality of a roundabout and a comparison with the previous solution used at a given location, when it comes to reconstructions, are the basis for improving the theory and practice of designing this type of intersection. In several European countries (Scandinavian countries and the UK), design standards were analyzed and improved in the early 2000s [8,9]. An overview of the results of selected relevant studies is presented in Section 2 of this paper.
Considering that there is no systematic scheme for monitoring roundabout performance in Croatia, the objective of this research was to develop a specific methodology for evaluating the effect of the implementation of roundabouts in Croatia based on operating speeds measured before and after their implementation. The methodology used includes a comparison of operating speeds before and after roundabout implementation and analyses and determinations of the correlations between the selected parameters—traffic and design. This study is based on the findings of previous research that confirmed (as detailed in Section 2) that real speed data from standard intersections before reconstruction and roundabouts after reconstruction can serve as a valuable measure for estimating the impact of roundabout implementation on traffic safety.
The proposed methodology was applied to a case study of four roundabouts situated in Rijeka City and the surrounding region to establish if the expected effect on speed control could be detected through detailed analyses of operating speed and its correlation with traffic and design parameters.
The chosen roundabouts were reconstructed from at-grade intersections and designed according to Croatian guidelines [5]—specified further on in the text—using elements suggested in the document. The elements pointed out in the guidelines are not strictly defined; there are wide suggestions regarding the values of the elements to be applied. Therefore, the final roundabout design is greatly influenced by traffic needs, location characteristics, and environment, but it also depends on the designers’ choices.
At all four locations, traffic volumes, structure, and speed were measured on site 24 h before the reconstruction at standard intersections and after reconstruction into roundabouts. The excessive speeds measured at the standard intersections represented one of the reasons for the conversion of these intersections from the classic type into a roundabout. Detailed analyses of the measured speeds were performed to define the possible parameters influencing these speeds—traffic and design parameters. Traffic accident data were not included as the number of reported accidents was very small and, therefore, not valid for safety analyses.

2. Roundabout Efficiency Analyses—A Literature Review

Different approaches are used to analyze the effects of roundabout implementation efficiency at locations where standard intersections were reconstructed into roundabouts.
The following two main types of procedures can be distinguished:
  • Procedures for analyzing and comparing solutions in advance during the planning or design phase to determine whether a roundabout is an optimal solution compared to other types of at-grade intersections concerning the reason for the reconstruction of the intersection;
  • Research that is carried out after the construction of roundabouts in which, based on the performance data, the impact of the roundabout’s implementation on safety, capacity, environment, etc., is analyzed and estimated.

2.1. Analyses of the Possible Effects of Roundabout Implementation in the Planning Stage

Analyses of roundabout applicability conducted to select the optimal solution for a particular intersection usually involve the use of multi-criteria analyses (MCAs) and/or creating and testing traffic microsimulation models for different types of solutions.
To evaluate the appropriateness of the use of roundabouts in relation to some other types of intersections, in many countries, procedures are defined through relevant criteria, based on which a comparison is made. These criteria include various aspects of the analyzed solutions—traffic functioning, impact on traffic safety and the environment, economic justification, etc. [10]. In this way, it is possible to choose the optimal solution by analyzing its potential effects through multi-criteria analysis (MCA) [11,12].
Traffic microsimulation models are used to analyze the future traffic function of an intersection within an MCA [13] or alone. Models created in traffic microsimulation programs (VISSIM, AIMSUN, etc.) enable the analysis of several variants of the infrastructure solutions for different variants and scenarios of traffic demand. Alternatives compared and evaluated through microsimulation outputs (e.g., travel time, vehicle delay, queue length, and others) can give very valuable answers regarding which type of intersection will have the best traffic performance [14,15] or how the number of roundabouts in a corridor affects traffic flow [16]. Results yielded by microsimulation models can also give an idea of the environmental impacts of different types of intersections [17,18], and traffic microsimulations are also efficient tools for the analysis/prediction of traffic safety in advance [19].

2.2. Analyses of Traffic Safety after the Implementation of a Roundabout

To improve the design and performance of roundabouts, the results of studies that analyze the effects of the implementation of roundabouts through so-called before–after analysis are usually employed. Such research includes the analysis of certain selected indicators of the functionality of roundabouts expressed through safety/capacity/impact on the environment by comparing the values of the indicators before and after the roundabout was implemented. The analysis of the improvement of traffic safety is mainly based on the analysis of the number of traffic accidents that occurred at a location before and after the roundabout was built [8] or the impact of a roundabout on reducing speed [4].
The second research group relates to developing a model for predicting traffic accidents at roundabouts by analyzing a larger number of roundabouts [20,21].
Below are presented the results of some of the before–after analyses conducted for roundabouts in several European countries, including Flanders, Sweden, Lithuania, the Czech Republic, and the USA.
The goal of the extensive before–after study conducted in the USA [21] was to compare the number of traffic accidents that would have occurred at the analyzed intersections if they had not been reconstructed into roundabouts with the number of traffic accidents that actually occurred at the roundabouts. The analyzed comparison data for 24 intersections of different types and control methods show that the construction of roundabouts reduced the number of traffic accidents, depending on the type of roundabout, by 58–61% and the number of accidents with injured persons by 77–82%. The other systematic before–after study in the USA was conducted to determine the safety effects resulting from the transformation of signalized intersections into roundabouts [22]. The study included 28 reconstructed roundabouts, and the conclusion was that roundabouts influenced reductions in both total and injury-accompanied crashes, with a larger benefit for injury-accompanied crashes. An important conclusion was that the positive effect of the roundabouts decreased with the increase in traffic volume at the spot.
A very detailed comparative study [7] was carried out in Flanders on 95 roundabouts and 119 standard-level intersections to analyze the impact of roundabouts on traffic safety. Traffic accidents were analyzed three years before and one year after the construction of roundabouts on roads where the allowed speeds in the main and secondary directions ranged from 50 to 90 km/h. It was found that the number of traffic accidents with injuries was reduced by 34%, and greater improvements were observed on roads with higher permitted speeds. In general, it was determined that the number of traffic accidents for each injury level decreased at all types of roundabouts.
Published results [7] related to the before–after analysis of small roundabouts in Sweden showed that the analyzed type of roundabout significantly reduced speeds in the intersection zone and corridors between roundabouts without having any side effects. A correlation was established between the reduction in approaching speed and injury accident risk. An important conclusion of this study was that the details of the design are of decisive importance for road safety at roundabouts.
A study conducted in Lithuania [4] covered 11 roundabouts with diameters ranging from 11 to 85 m to determine the speed of vehicles passing through the intersections. Based on previous international studies, the basic premise of this study was that reducing vehicle speed at roundabouts is correlated with accident numbers. It has been shown that passenger vehicles develop significantly higher speeds at large roundabouts, and the size of the radius is an important element of speed and accident reduction.
In [20], the authors describe the process of developing a traffic accident prediction model at a roundabout based on data collected in the following four Central European countries: the Czech Republic, Hungary, Poland, and Slovakia. Parameters related to geometry and roundabout traffic conditions were analyzed as independent variables. According to the finally adopted model, based on the combined sample from all countries, injury accident frequency positively correlates with traffic volume and apron width and negatively correlates with deflection (at the entrance and inside the roundabout).
The authors of a study conducted in the Czech Republic aimed to analyze how entry design parameters influence safety at roundabouts and used these findings to update current Czech guidelines [23]. An analysis of data on geometry, traffic load, and speed in the area around the roundabouts resulted in the conclusion that both crash frequency and severity are influenced by entry geometry, as the geometry also influences driving speed.
The final conclusion was that safety performance is dictated by both geometry and speed.
Maycock and Hall, in their study [24], found that at four-arm roundabouts in the UK, the risk of single-vehicle crashes increases with wider roundabout entrances and with greater curvature of the vehicle entry path. The same was confirmed by Arndt in his research [25]. The findings confirmed the impact of large entry path curvature and high approaching speed on higher accident risk and also that accident risk at exits increases with a decrease in deflection islands and exit radius.
Very detailed research that included 33 parameters considering the design of roundabouts, markings, signs, the road environment, and pavement conditions was conducted in Italy [26] to establish a safety index for evaluating urban roundabouts. The developed procedure was designed to provide a proactive approach to the road safety assessment of urban roundabouts based on their design characteristics and risk factors. It was tested on a sample of 50 urban roundabouts in Rome, Italy. The findings were that road users’ improper behavior was mainly affected by a combination of roundabout design, markings, and signs.
The analysis of the existing research points to the conclusion that there are the following two main groups of parameters that affect traffic safety at roundabouts:
  • Traffic parameters—the speed, volume, and structure of traffic flow in the narrower and wider zones of the intersection;
  • Design parameters—the size of the outer radius, the radius of the central island, the width of circulatory road, the width and radius of the entry and exit, the entry angle, and deflection.
In this research, the idea was to use on-site measured operating speeds before and after roundabout implementation together with analyses of and comparisons with selected main groups of parameters identified in the literature review.

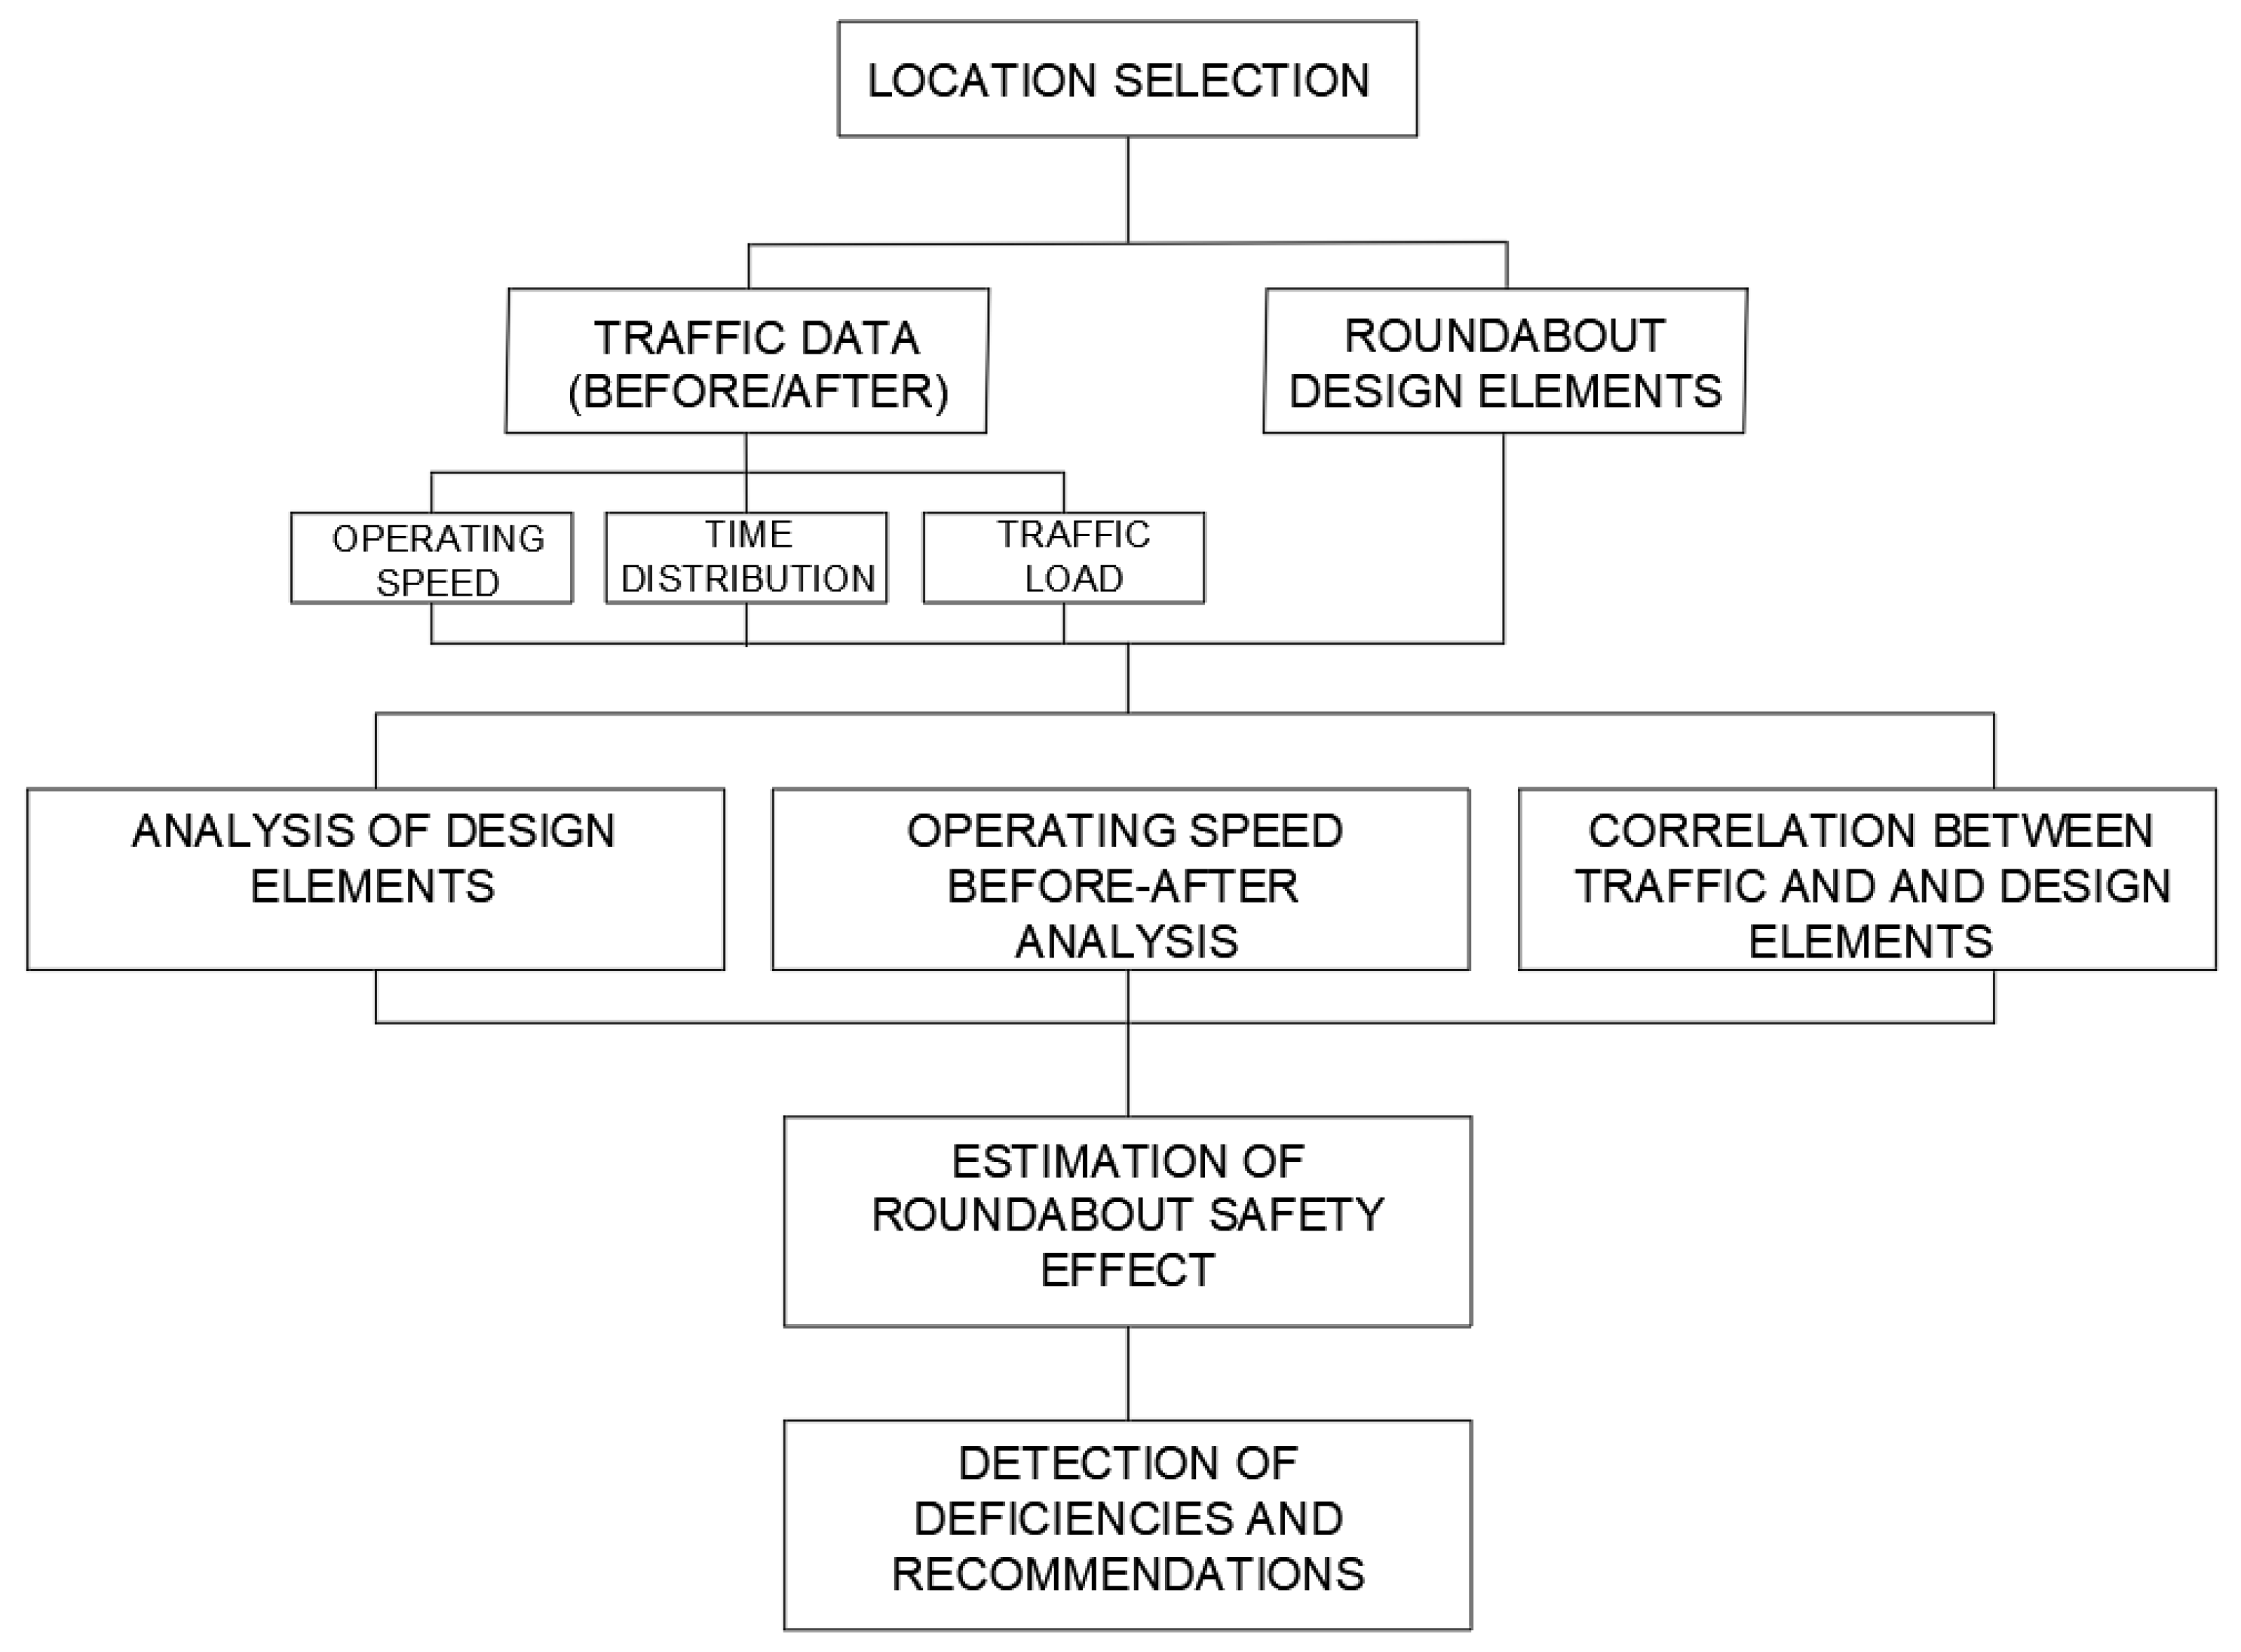
3. Materials and Methods

As many studies have confirmed that one of the main effects of the application of roundabouts is a reduction in speed in the wider zone of the intersection [3,4], in this paper, a methodology that allows determining the effect of a roundabout on speed control through detailed analyses of operating speed and its correlation with traffic and roundabout design parameters was developed.
The steps of the developed methodology are shown in Figure 1.
To apply this methodology, it is important to select sites for which operating speed data are available for both at-grade intersections (before reconstruction) and roundabouts (after reconstruction). The need to collect data on operating speeds before reconstruction is possibly the largest drawback of this methodology since researchers usually do not know at what moment a certain at-grade intersection will be transformed, so it is difficult to have a large sample.
Operating speeds and traffic load should be measured in the field for a minimum of 24 h during a working day in stable weather and traffic conditions in order to determine the time distribution of speeds and traffic load in ordinary traffic conditions.
At intersections before reconstruction (at-grade intersections) and at the resulting roundabout, operating speed should be measured at the same positions of the intersection/roundabout leg. In this case, the position was 40–70 m from the entrance/exit to the intersection and also at the direct entrance/exit of the roundabout. Traffic and speed were measured at the same time for both directions of traffic.
For this study, four roundabouts on the county road network of the City of Rijeka, Croatia, and its surroundings were selected. In the last eight years, selected intersections have been converted from classic intersections (non-signalized at-grade intersections) into roundabouts to improve both capacity and safety through the expected changed traffic conditions. The previously described methodology was applied to those 4 selected intersections.

3.1. Selected Parameters

The selected roundabouts were analyzed according to the defined methodology using two groups of parameters that, in previous research (Section 2), proved to be essential for roundabout functioning from the perspective of traffic safety—traffic and design parameters.

3.1.1. Traffic Parameters

Traffic parameters include data related to the characteristics of traffic flow at the intersection, as follows:
  • Operating speed;
  • Time distribution of traffic load and speed.
To ensure the integrity and quality of the database, field measurements were conducted utilizing Datacollect SRD radar traffic counters, ensuring minimal disruption to the flow of traffic. The traffic counters were strategically placed on either a streetlight pole or a traffic sign pole at a height of 2.20 m. In addition to recording the type and number of vehicles, traffic counters record the vehicles’ speed.
The measurements made with traffic counters were carried out in the following two phases: in the first phase, measurements were made at non-signalized intersections (before reconstruction); in the second phase, measurements were made after their reconstruction into roundabouts.
In the first phase, data were collected with counters placed 40–70 m from the entrance to the intersection. Using this method, the traffic load of each leg and the approach and departure speed on the corresponding intersection leg were determined.
In the second phase, occurring after reconstruction into a roundabout, measurements were repeated at approximately the same positions as in the first phase, and additional counters were placed at the positions of the immediate entrance to/exit from the roundabout (0–40 m from the entrance to/exit from the roundabout) (Figure 2 and Figure 3).
The positions and labels of the traffic counters (on one intersection leg) are shown in Figure 3.
Speed data were systematically recorded by the traffic counters over a 24 h period, capturing both daytime (6 a.m. to 10 p.m.) and nighttime (10 p.m. to 6 a.m.) speeds, as well as speeds in the morning peak hour (7–8 a.m.). All measurements were made under stable weather conditions and exclusively on working days (Monday–Friday). This approach was intended to guarantee the accuracy and reliability of the collected data, as they were collected in standard traffic conditions.

3.1.2. Design Parameters

Detailed design drawings of each roundabout were used to collect data on the applied design elements. The following design elements (Figure 3), for which there are specific recommendations and limit values in the Croatian guidelines [5], were determined:
  • The outer radius of the roundabout—Ro [m];
  • Width of the circulatory road—u [m];
  • Entry width—eent [m];
  • Entry radius—Rent [m];
  • Exit width—eex [m];
  • Exit radius—Rex [m];
  • Entrance angle—ɸ [°];
  • Radius of the central island (including traversable apron)—Rc [m];
  • Width of traversable apron—t [m];
  • Deflection—d [m].
In addition to the applied design elements, deflection and entry angle were incorporated into the analysis (the parameters “ɸ” and “d” in Figure 3). The method of defining deflection and entry angle is shown in Figure 3.

4. Data Analysis and Results

For all four analyzed locations, all the selected parameters were determined, comprising detailed geometrical and traffic data from before and after reconstruction.
The selected roundabouts were analyzed by considering the following:
  • Design elements;
  • Operating speeds before and after intersection reconstruction;
  • Correlations between traffic and speed data (operating speed and traffic load) and the selected roundabout design elements.
Data on the traffic accidents were available for only two of the four roundabouts. As there were a very small number of traffic accidents at only two of the locations, the corresponding data were not included in the analyses. From these very limited data, it can be gleaned that traffic accidents in relation to the amount of traffic more frequently occur at night and in slightly greater numbers at the entrance than at other parts of the roundabout.

4.1. Analysis of Design Elements

Table 1 presents the values of the main roundabout design elements recommended in the Croatian guidelines [5] and the values adopted in the design of the selected roundabouts.
In these four cases, all the applied elements of the roundabouts are within the recommended values of the Croatian guidelines. Deviations from the guidelines’ recommendations can be observed by considering the width of the entrance/exit and the size of the entrance and exit radius on some roundabout legs. Namely, the guidelines recommend the application of higher values at the exit from the roundabout compared to the entrance. This deviation is visible in the width of the entrance of legs A3, B1, C2, D2, and D4 and the size of the entrance radius of legs A2, C2, and D3.

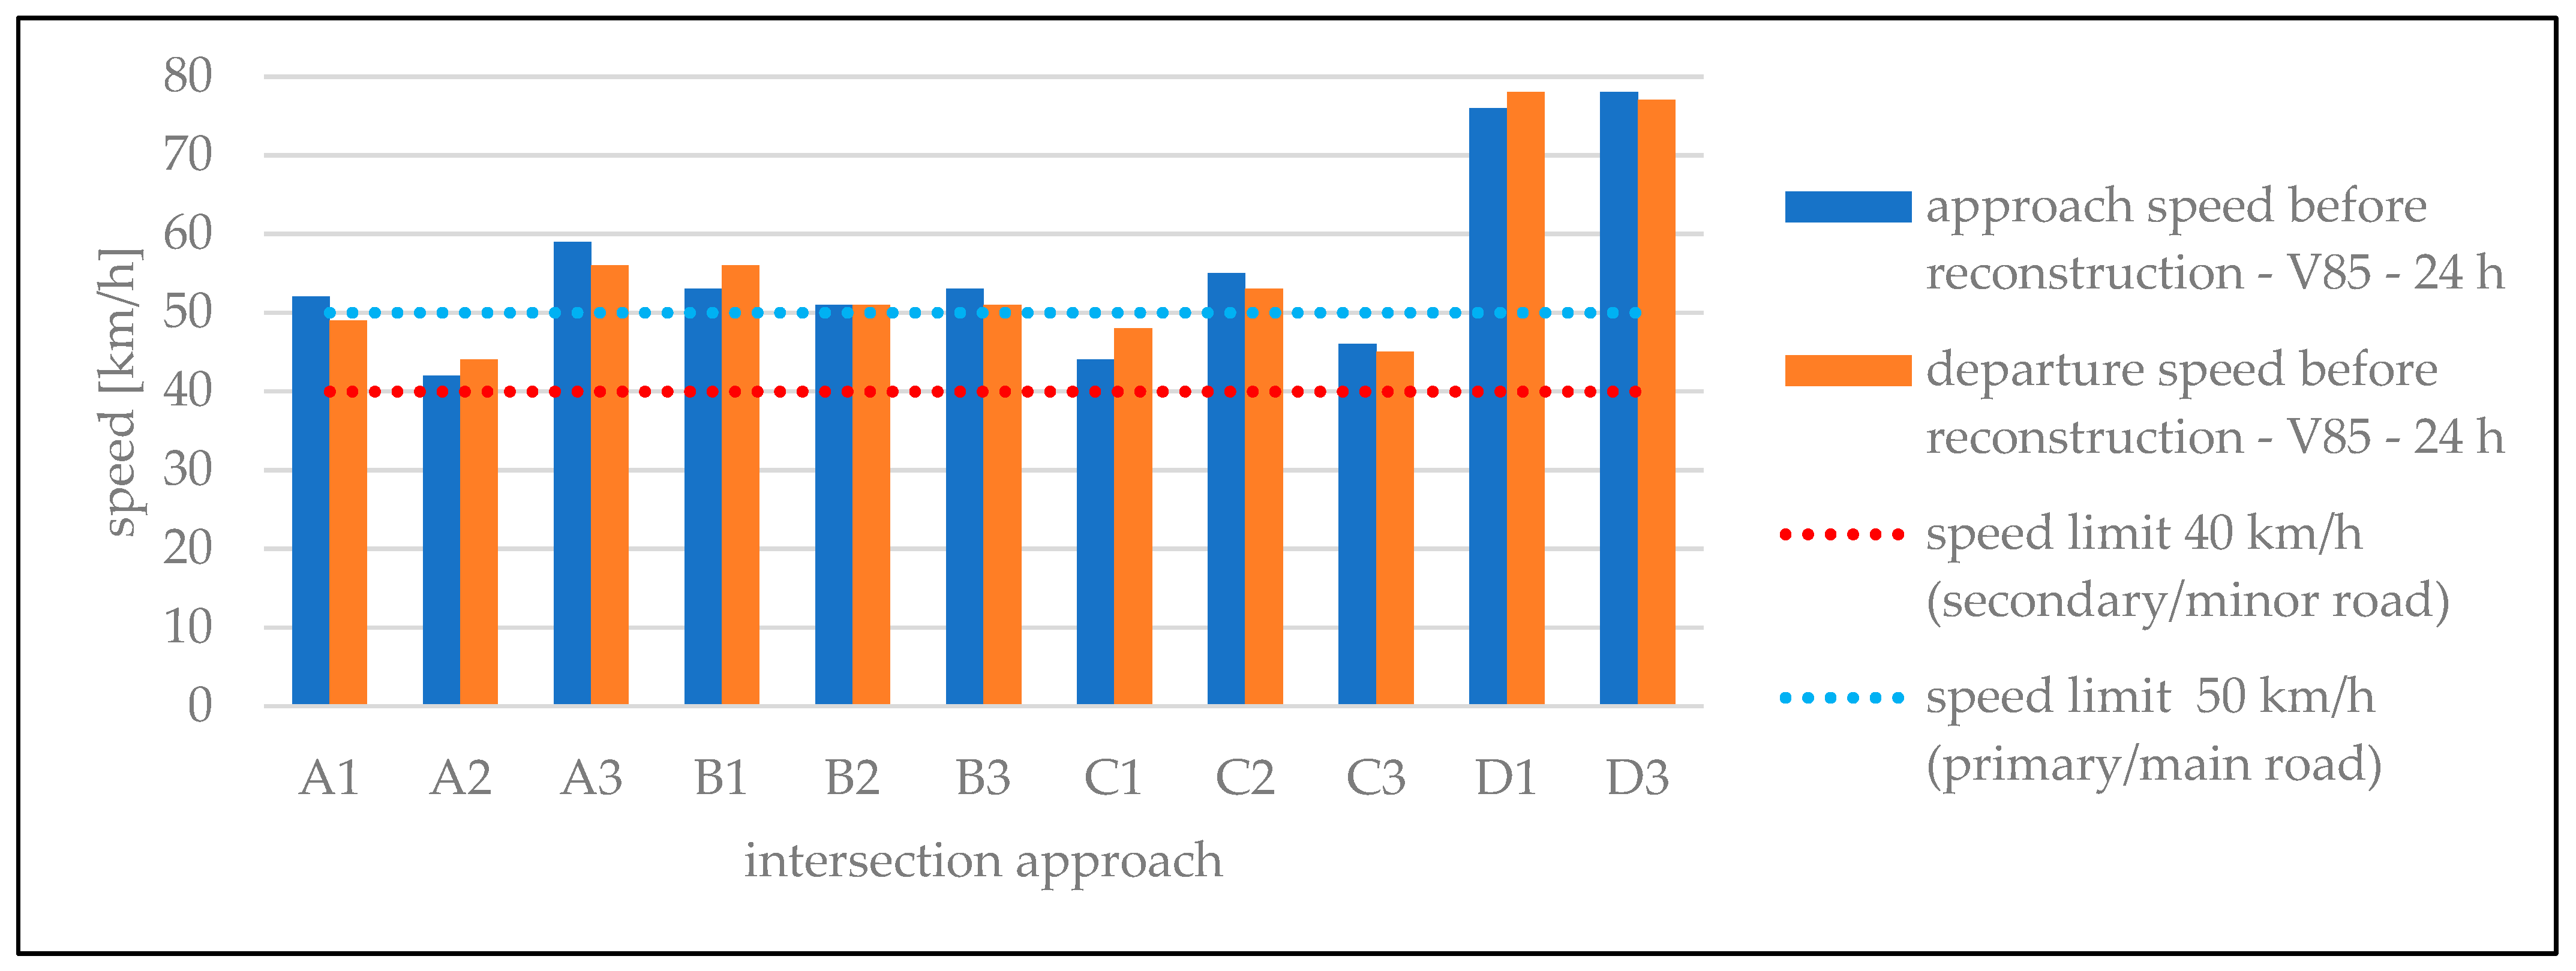
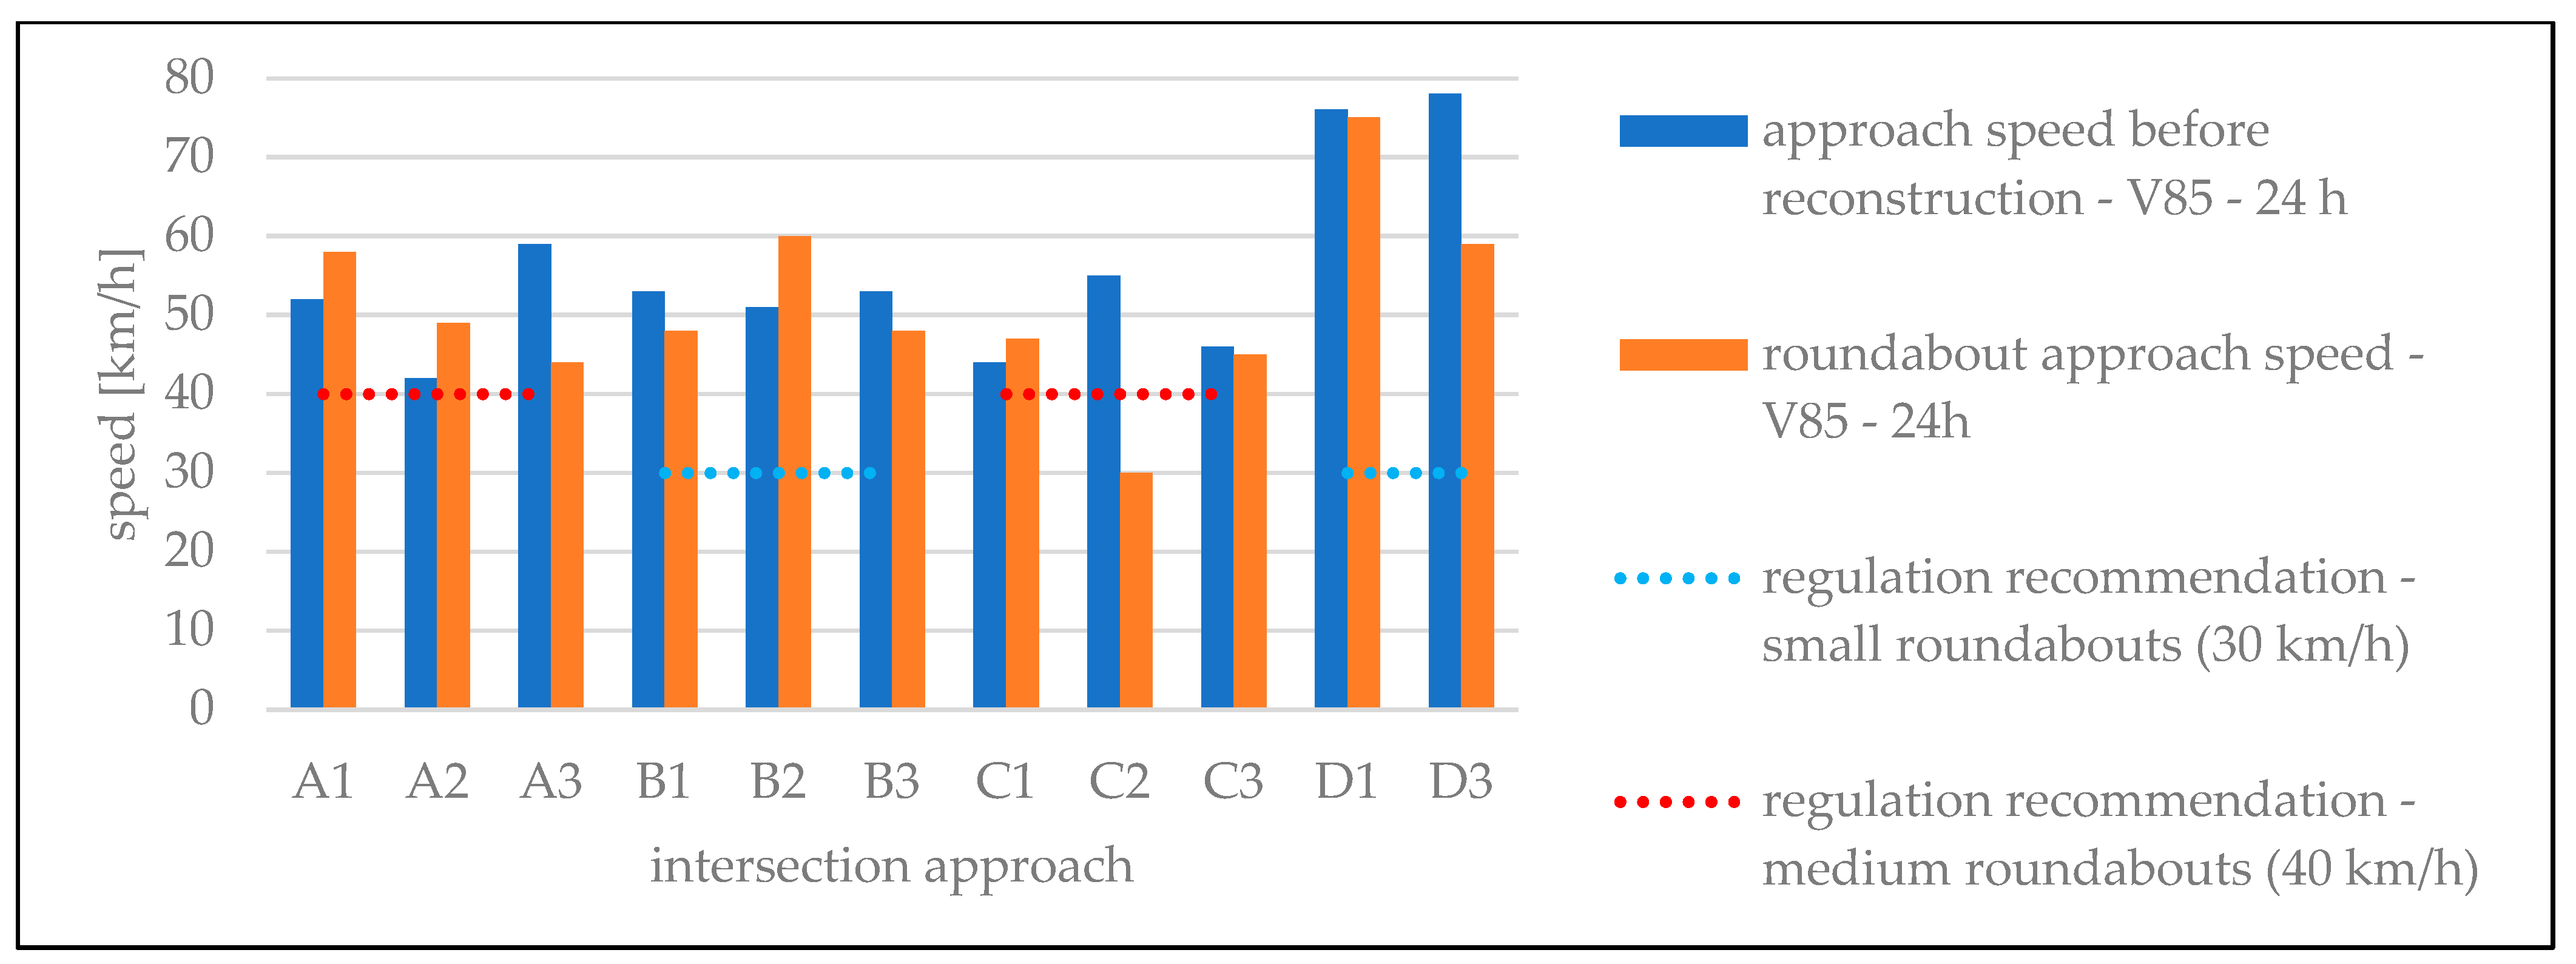
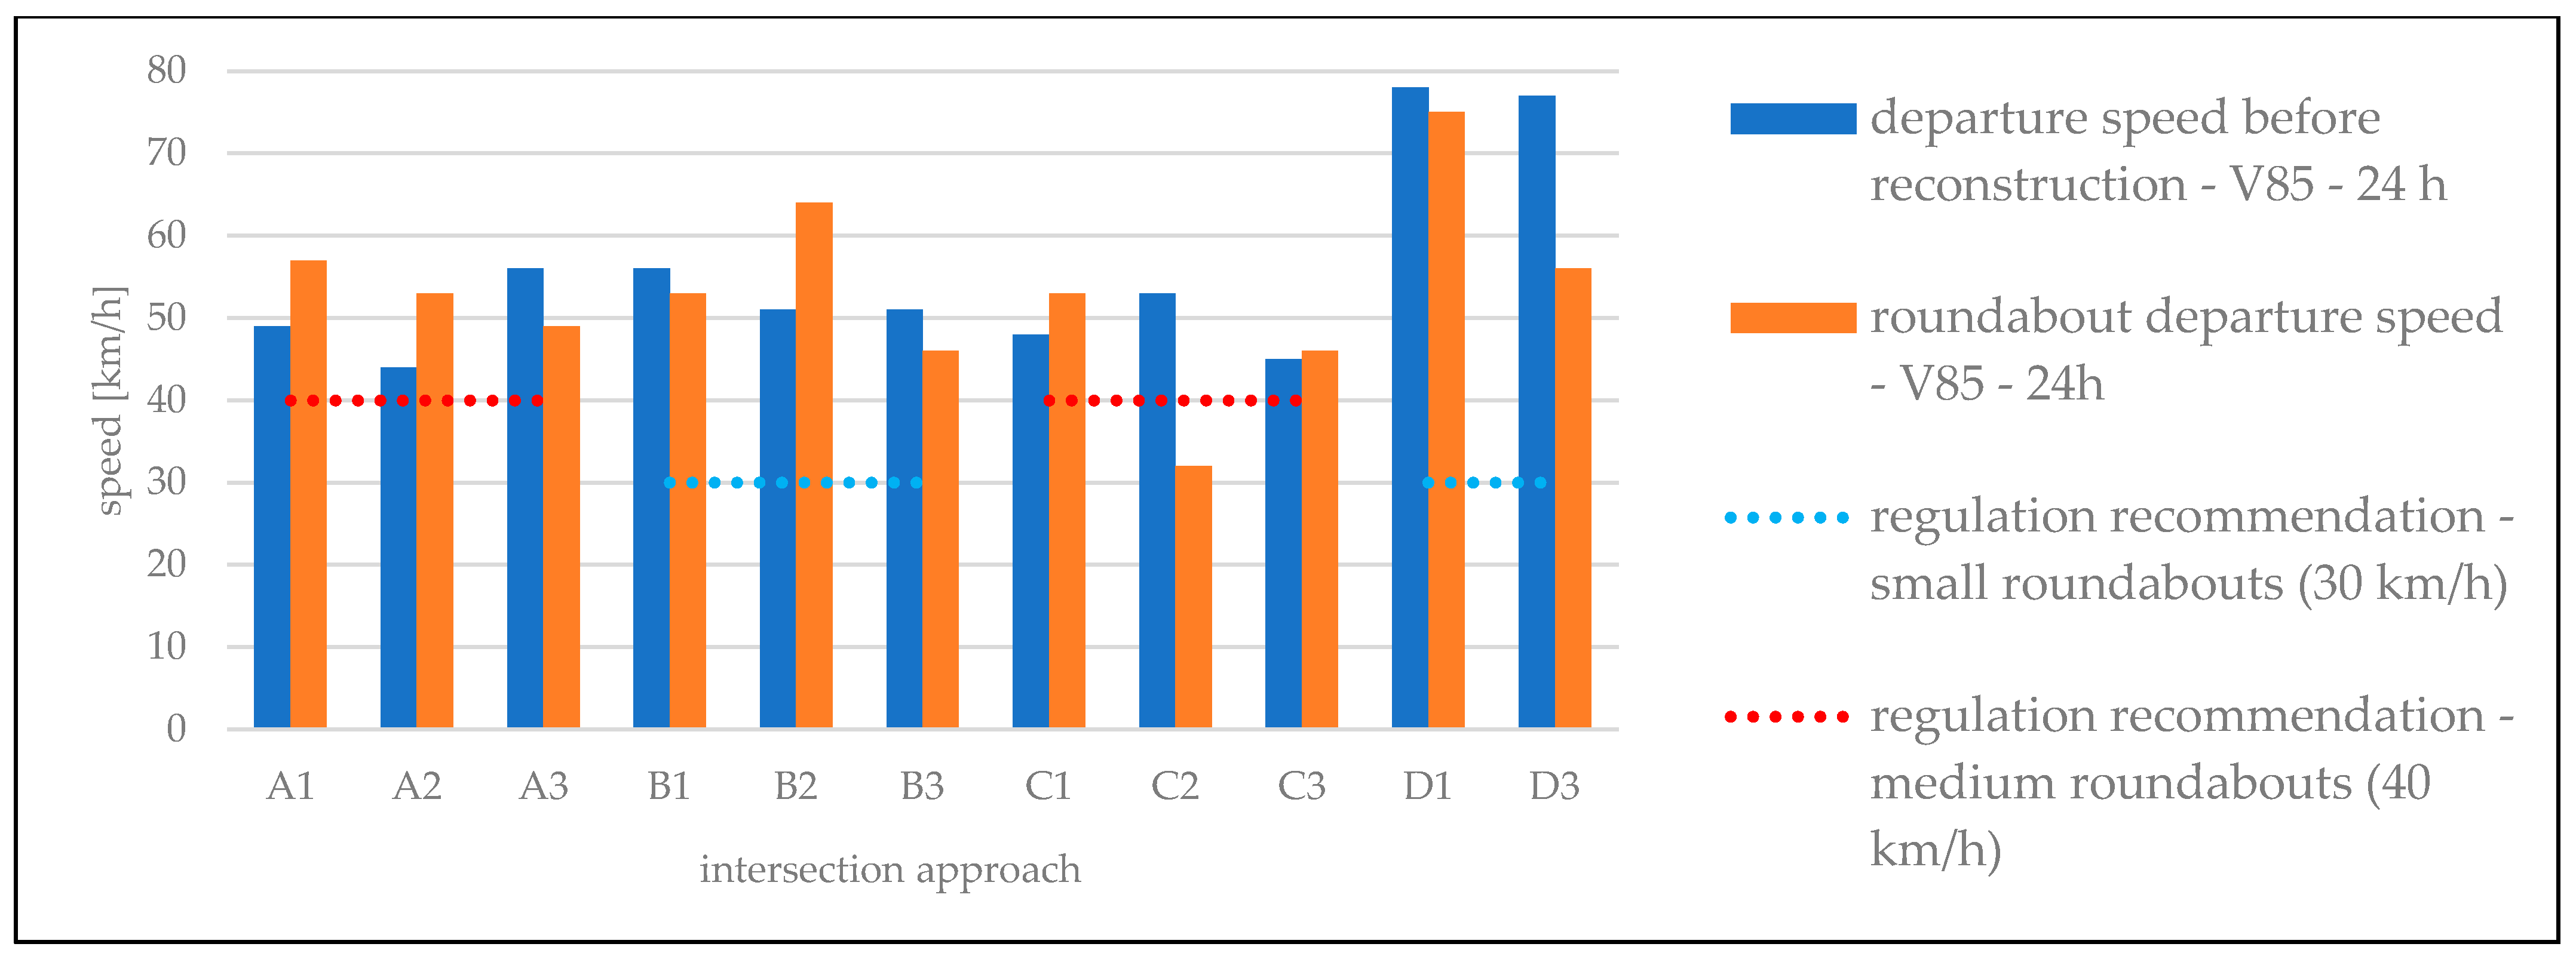
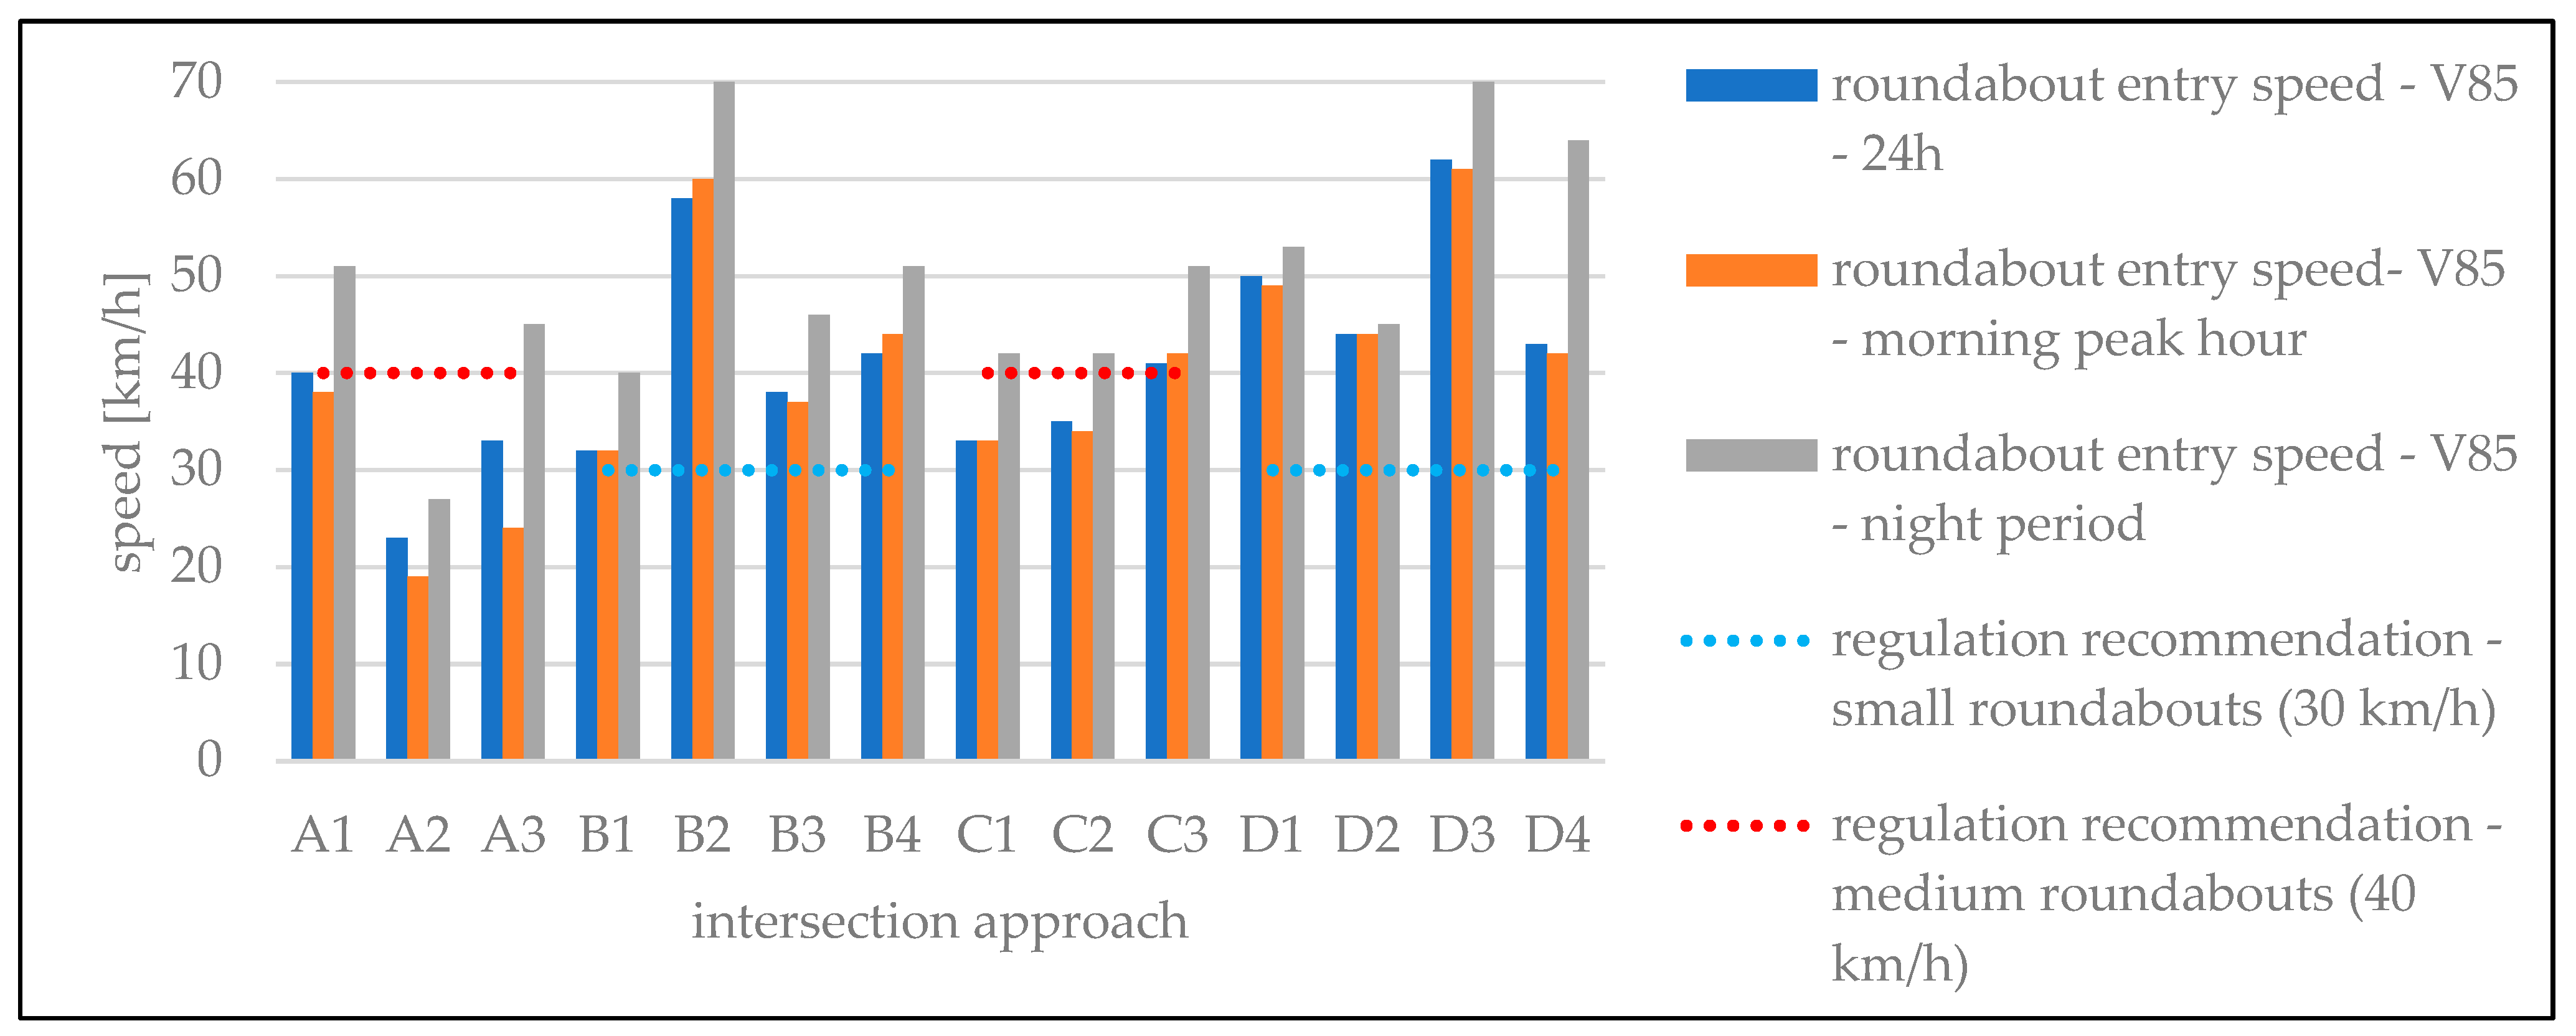
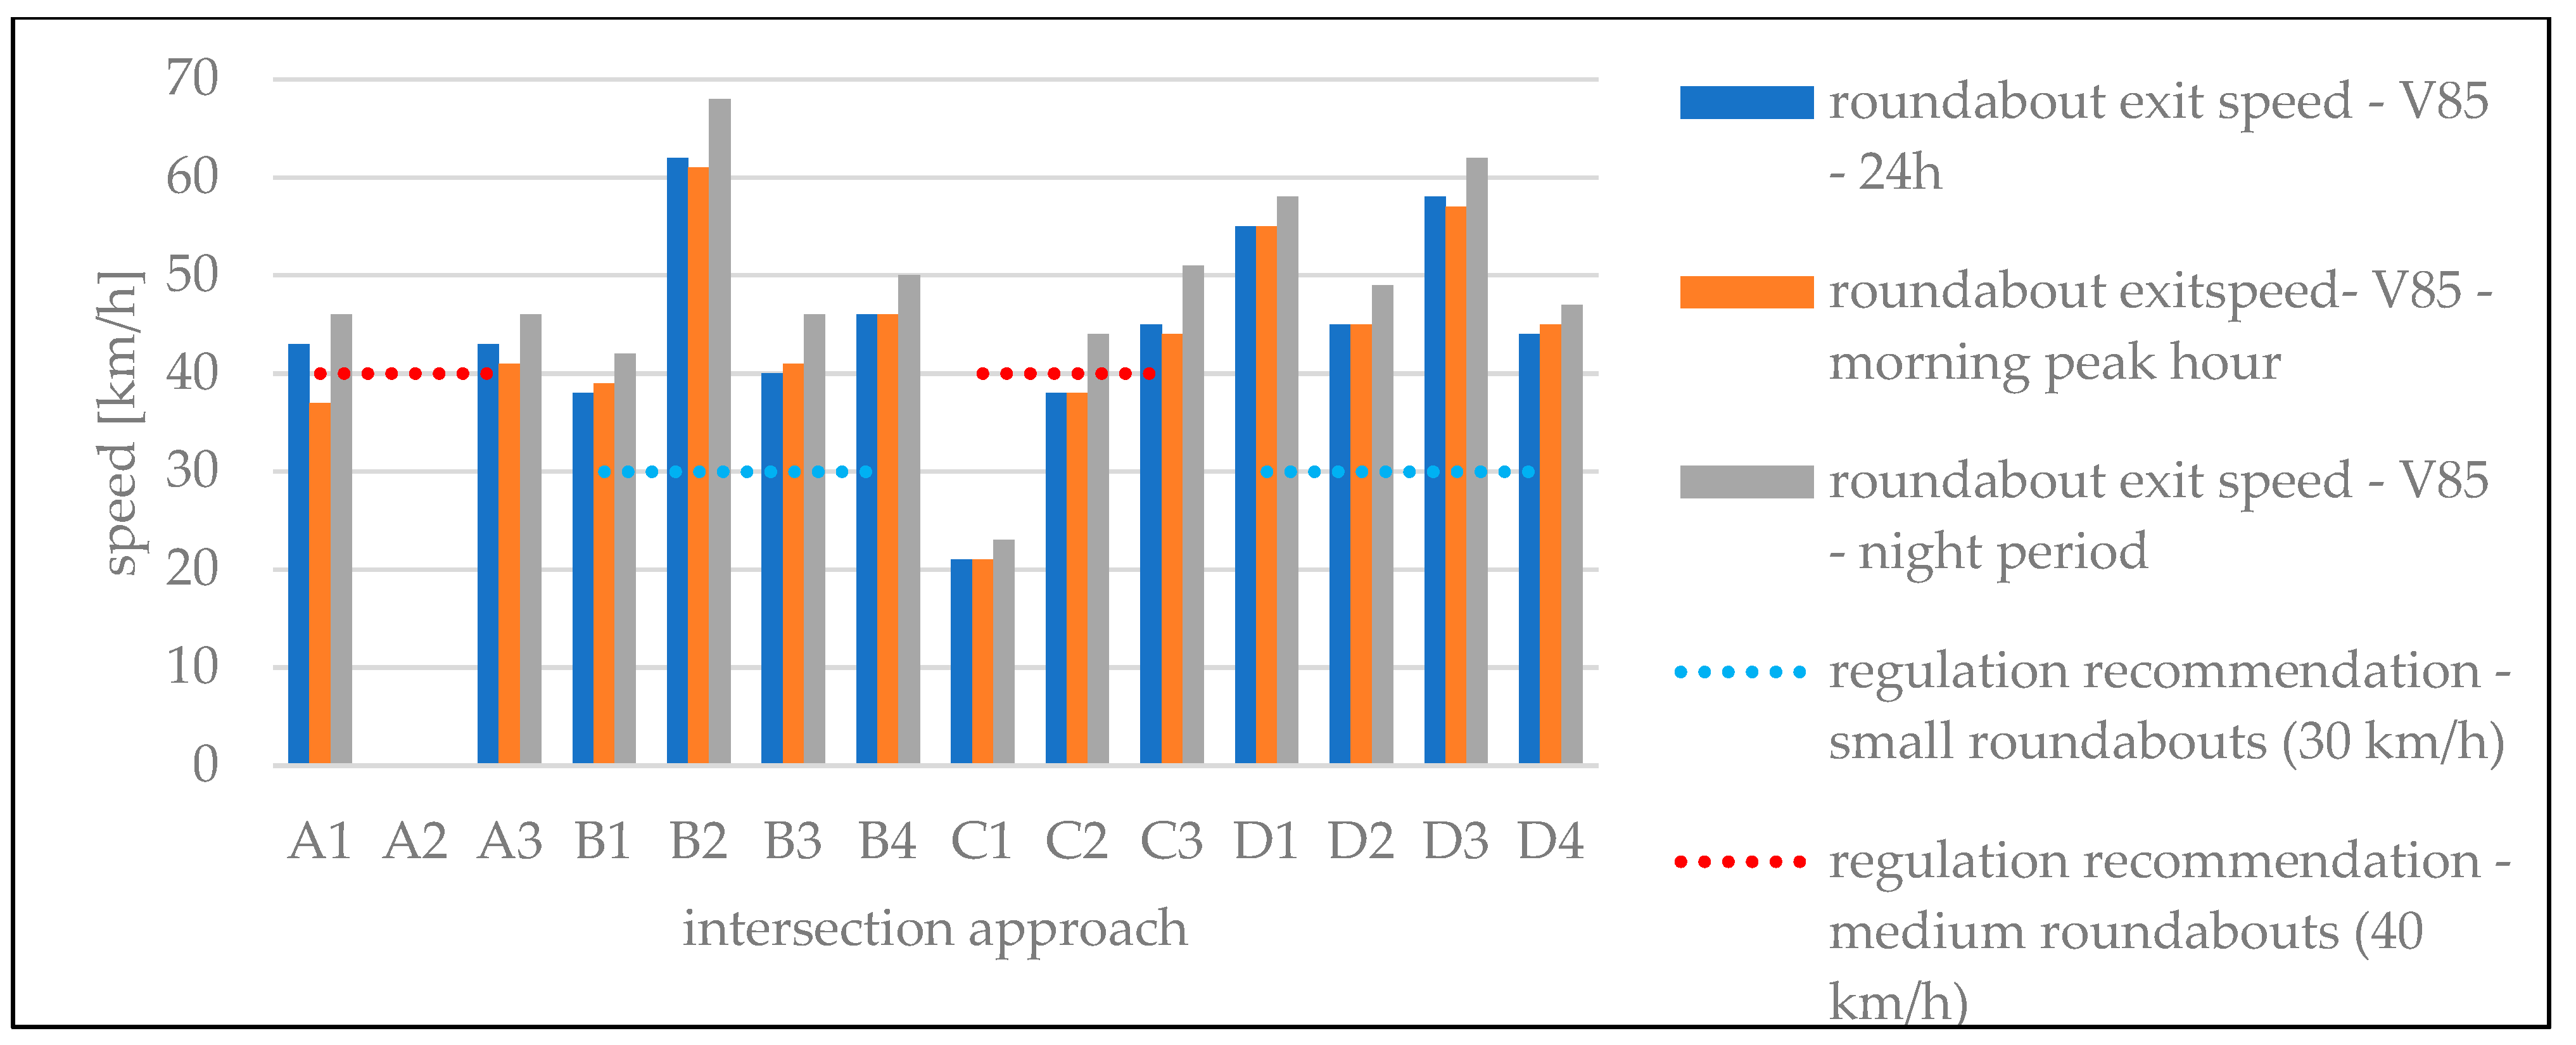
4.2. Operating Speed before–after Analyses

In this research, V85 speed was used as the operating speed for the before–after analysis as the basic parameter for evaluating intersection safety. V85 is the 85th percentile of a distribution of values at which vehicles travel.
In the case of these four intersections, operating speeds were measured before and after the reconstruction of the intersections into roundabouts (Table 2).
Speeds are listed separately for specific time periods, as follows:
  • Daily operating speed or V85-24h;
  • Operating speed during peak periods, V85-MPH (morning peak hour);
  • Operating speed at night, V85-NP (night period).
According to HR regulations [3], in the urban city network, the speed limit on primary roads is 50 km/h, while minor (secondary) roads may have a lower limit of 40 km/h. In the area of a roundabout, regardless of whether it is adjoined to a primary or secondary road, the speed limit is 30 km/h for small roundabouts and 40 km/h for mid-sized roundabouts. The bold values in Table 2 represent operating speeds higher than the regulated speed.
Figure 4 shows the operating speeds (approach and departure speed) measured at intersections before their reconstruction into roundabouts. Intersection approaches A2, B2, and C2 represent the minor direction at the classic intersections, and it is evident that the operating speeds exceed the speed limit of 40 km/h, which is common for the minor direction (secondary roads) in the analyzed city’s traffic network. The other approaches represent the main direction, with a speed limit of 50 km/h, which was not exceeded only in the case of approaches C1 and C3, while in the case of approaches D1 and D3, it was significantly exceeded (by more than 50%).
In Figure 5, in addition to the operating speeds measured before the reconstruction, the operating speeds after the reconstruction are shown, which were measured at approximately the same positions as before the reconstruction. At four intersection approaches (A1, A2, B2, and C1), there was an increase in the approach speed compared to the speed measured at the same position before reconstruction. The recommendation for operating speeds depends on the size of the roundabout (up to 30 km/h for small urban roundabouts and up to 40 km/h for medium-sized urban roundabouts) [5]. According to the selected outer radius of the roundabout, intersections B and D are small roundabouts, and it is evident that the operating speeds after the reconstruction of the classic intersections into roundabouts significantly exceed the recommendation for such intersections (30 km/h), and even for medium-sized roundabouts (40 km/h). In the case of intersections A and C, the operating speed was only lower than the recommended value, 40 km/h, in the case of one approach of the intersection (approach C2). On all other approaches (A1, A2, A3, C1, and C3), the operating speed was higher than the recommendations of the guidelines, and in some cases (A1, A2, and C1), the operating speed on the roundabout was higher than the speed at the same position before reconstruction. The reason may be that drivers select higher speeds at the roundabouts than at the intersections due to the better state of maintenance of the pavement as they were reconstructed.
Table 3 shows descriptive statistics for the approach speed before and after reconstruction. The data are not normally distributed, so the non-parametric Mann–Whitney test was used to compare the speeds before and after the reconstruction [27,28,29].
Figure 6 presents the departure speed results measured before and after roundabout implementation in relation to the regulated speed limit.
The departure speeds at all intersection legs exceed (more so than the approach speeds) the recommendation for a certain roundabout size.
Table 4 shows descriptive statistics for departure speed before and after reconstruction. The data are not normally distributed, so the non-parametric Mann–Whitney test was used to compare the speeds before and after the reconstruction.
The data in Table 3 and Table 4 show a smaller standard deviation of departure speed than that of approach speed, potentially indicating that many parameters influence vehicle approach speed. Consequently, the approach speed range is higher than the departure speed.
Below (Figure 7), the differences in entry speeds (measured at the entrance to the roundabout) are analyzed in more detail regarding their time distribution over 24 h, as follows:
  • Daily operating speed;
  • Operating speeds in the morning peak hour (MPH);
  • Operating speeds in the night period (NP).
Figure 7 shows that for 9 of the 14 approaches, the daily entry speed (V85-24h) was higher than the regulated/recommended speed. Also, on 11 of the 14 approaches, the roundabout entry speed in the morning peak hour (V85-MPH) was lower than the roundabout daily entry speed (V85-24h).
Analyzing the average entry speed for all roundabouts in the same size group shows that for roundabouts with a recommended speed of 30 km/h (small urban roundabouts), the average entry speed is 46 km/h, and for roundabouts with a recommended speed of 40 km/h (medium to large urban roundabouts), it is 34 km/h.
The operating speeds at the exit from the roundabout (Figure 8) are higher than the recommended speed for the specific size of the roundabout for 11 of the 13 approaches (for approach A2, there are no data on the speed at the exit from the roundabout). Operating speeds in the peak period are lower or equal to the daily operating speeds, while in the night period, they are higher, but the increase is lower than that at the entrance to the roundabout, amounting to 10%, on average, with a maximum of 16%.
The data show that the average exit speed at roundabouts with a recommended speed of 30 km/h (smaller urban roundabouts) is 49 km/h, and at roundabouts with a recommended speed of 40 km/h (medium-sized urban roundabouts), it is 38 km/h.

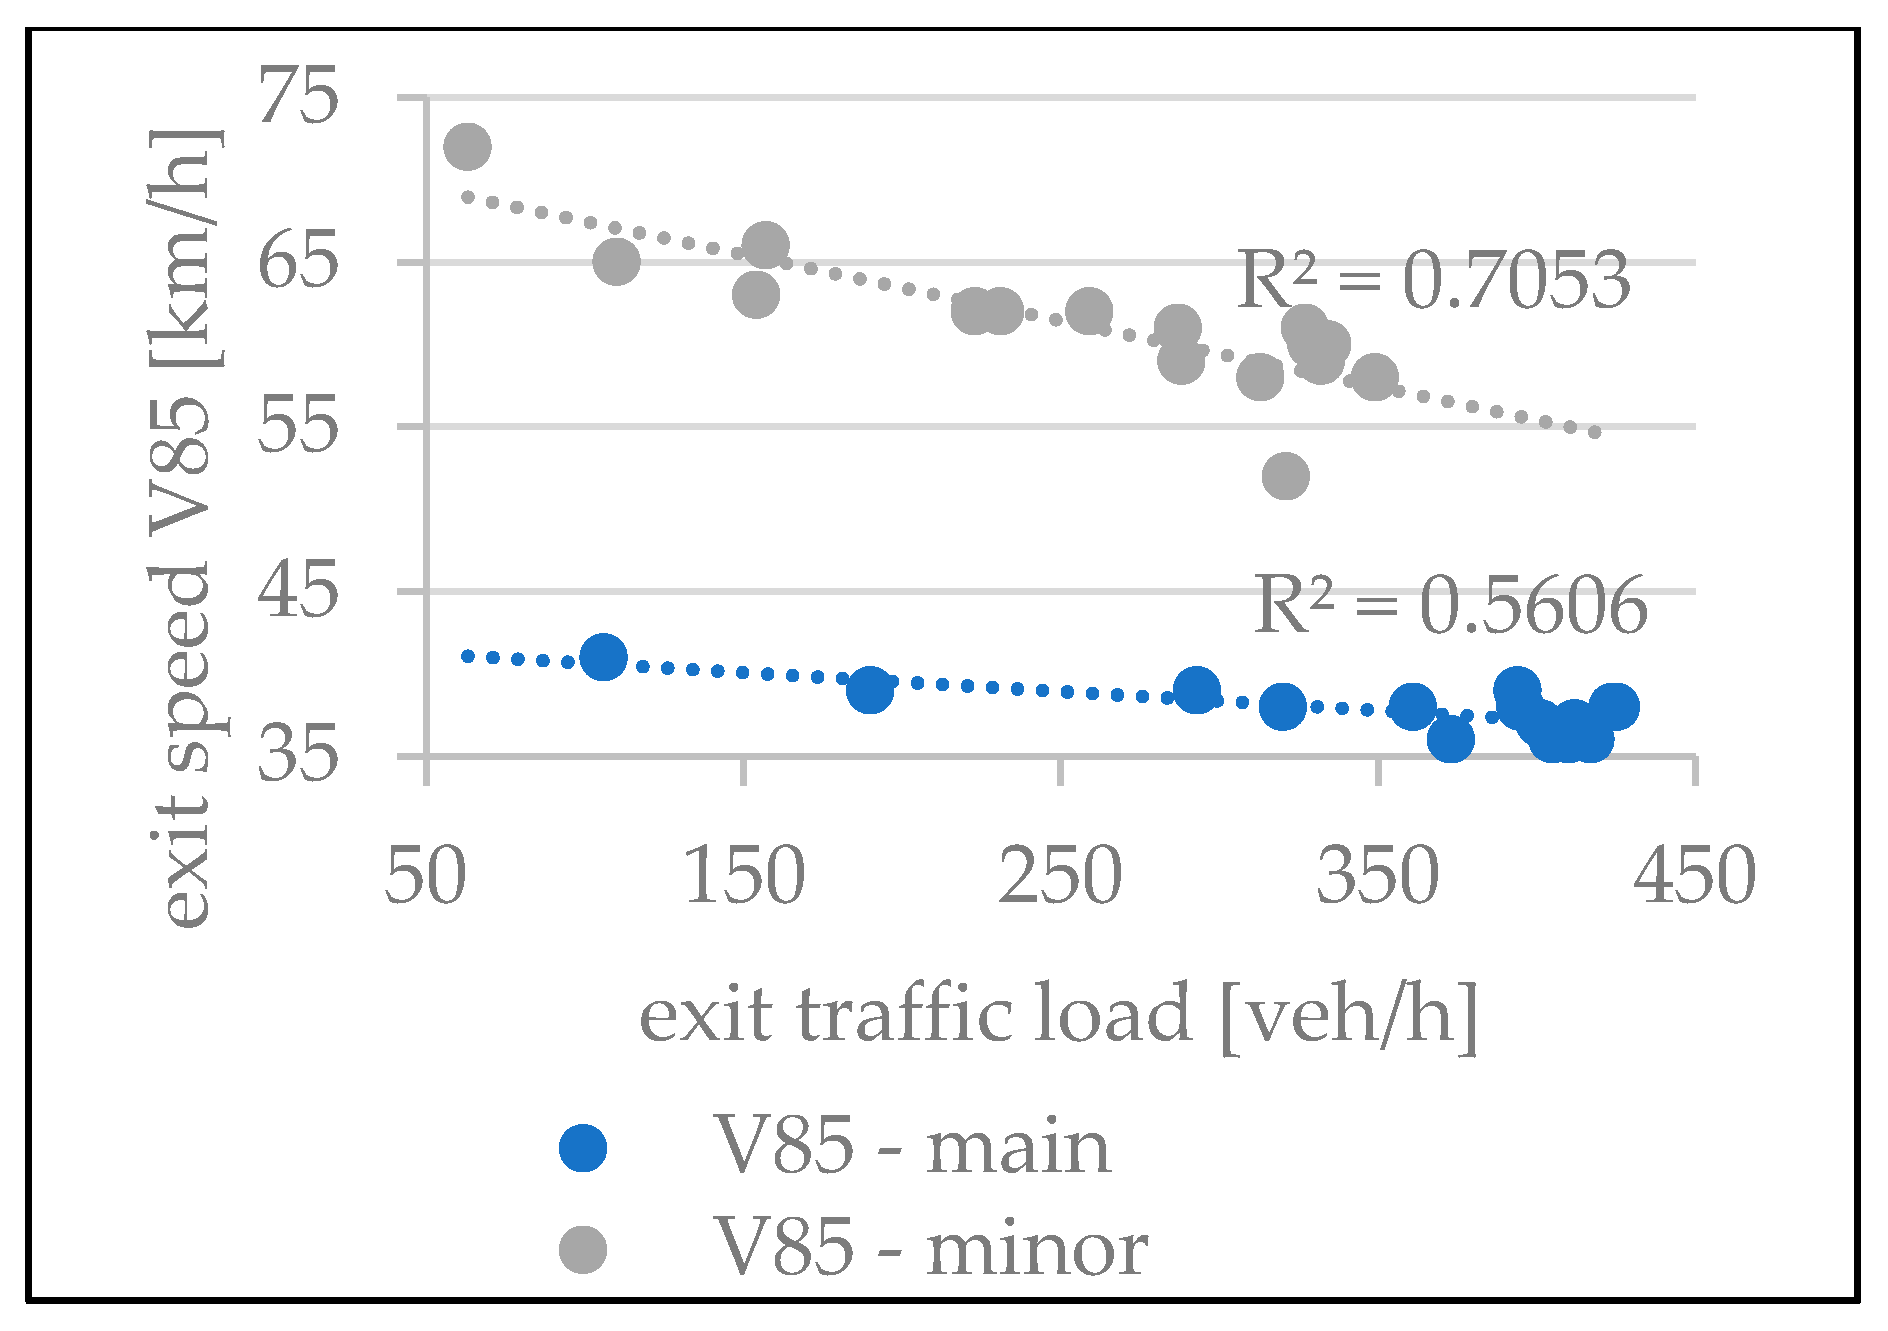
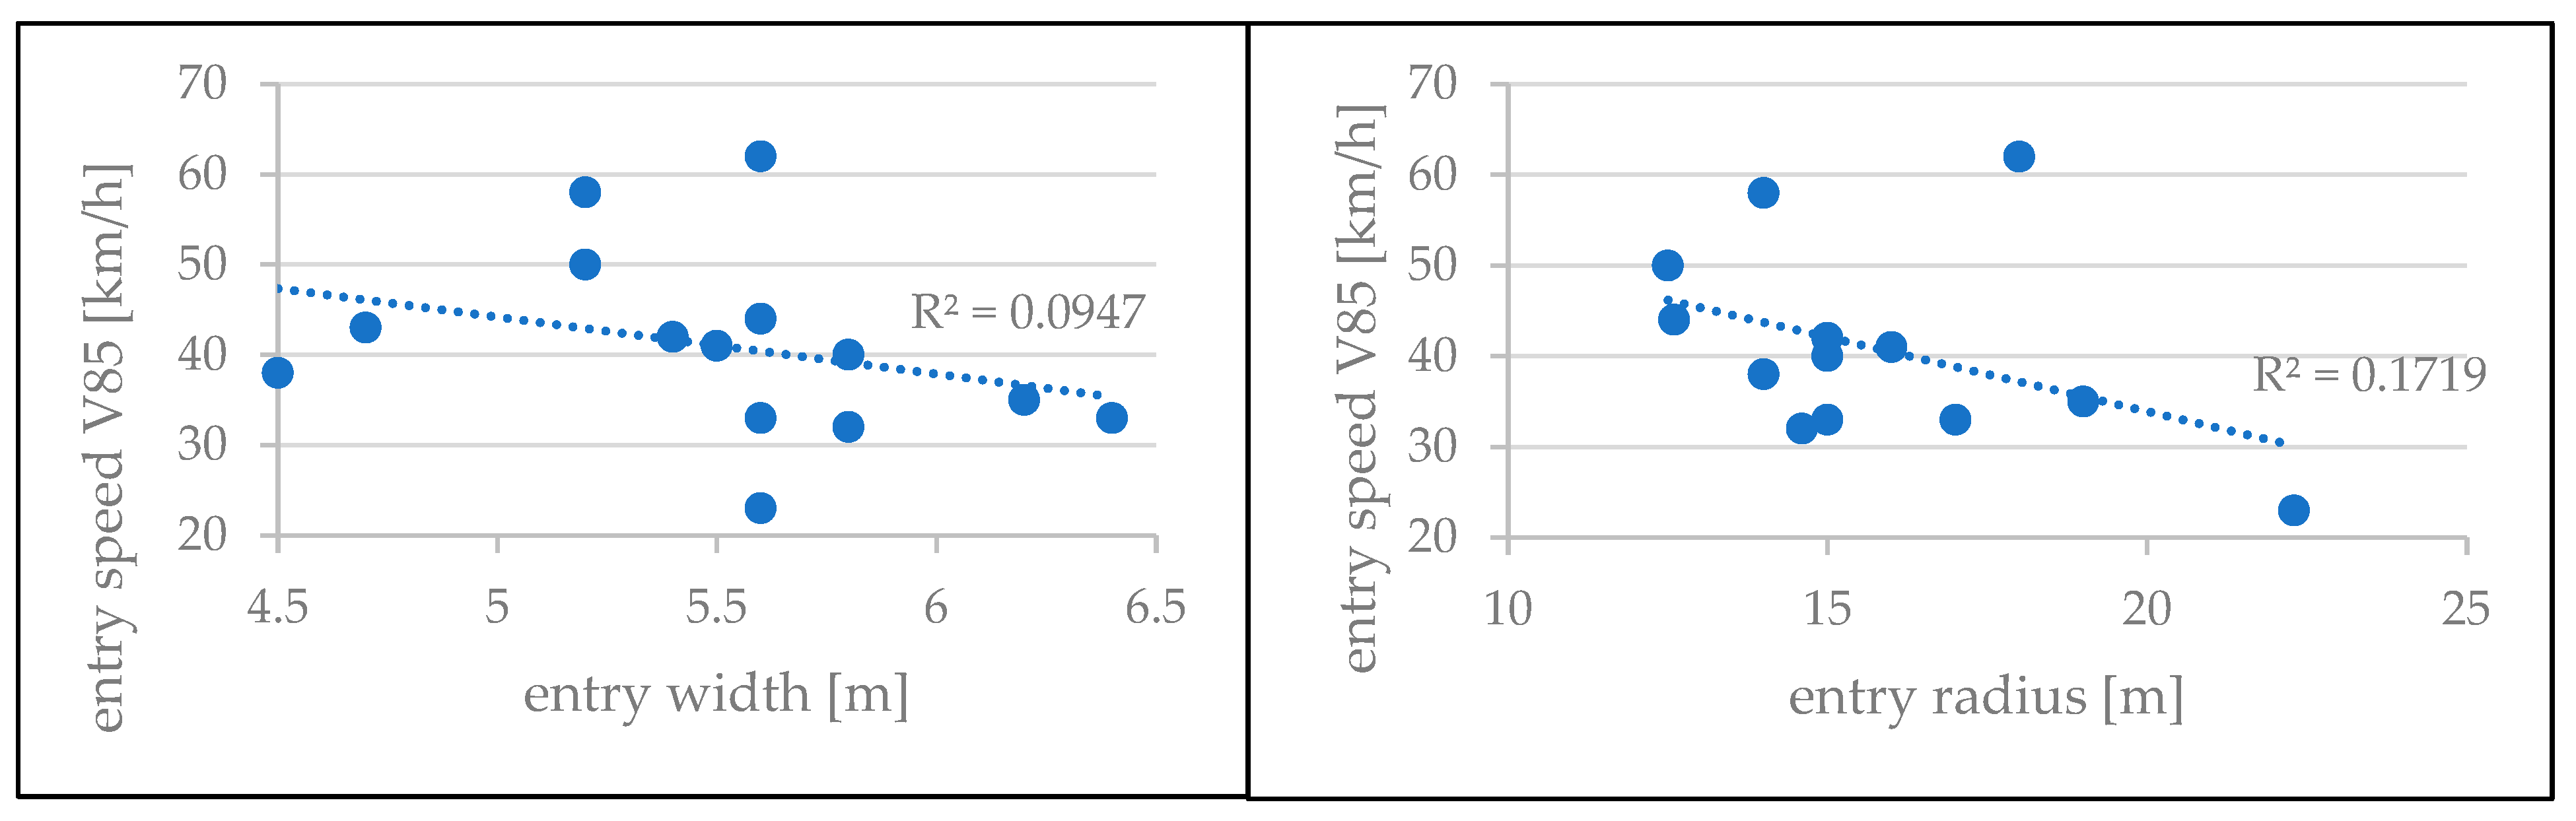
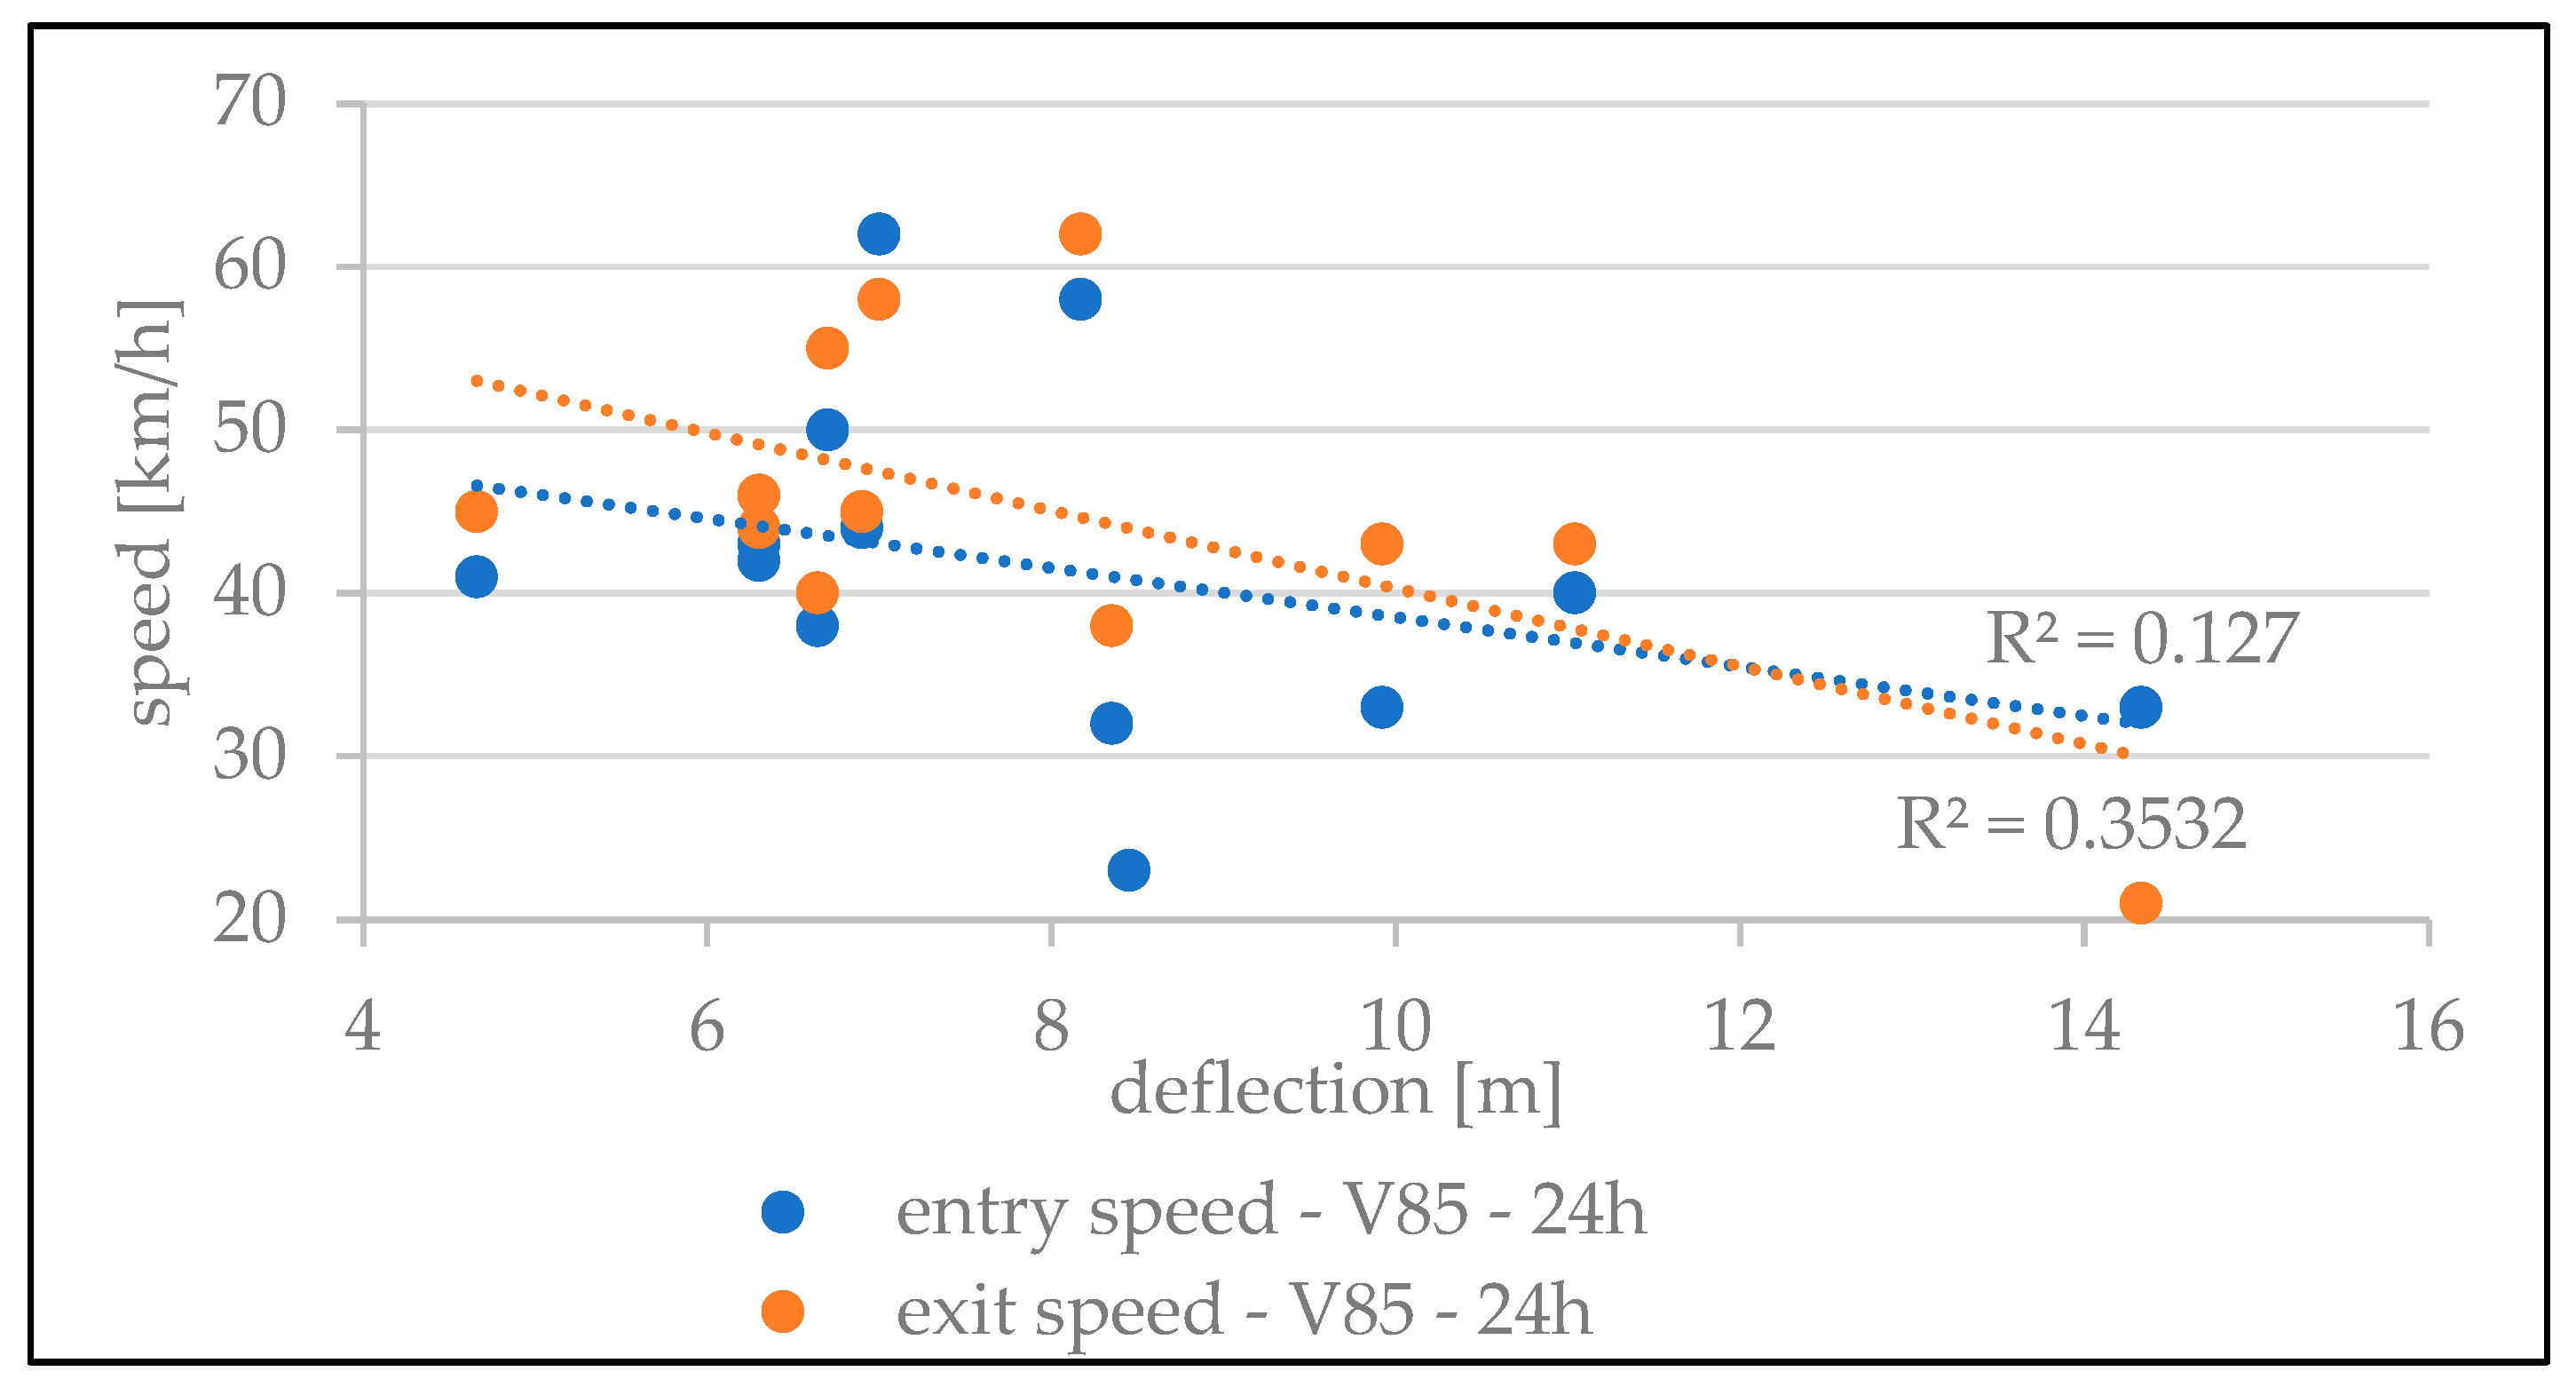
4.3. Correlation between Traffic and Design Elements

Correlation analyses between the selected parameters from different groups (traffic and design) were conducted to detect possible explanations for the roundabout performance regarding operating speed, which, in some of the previously analyzed cases, was higher than expected.
As for the analyzed roundabouts, there are very detailed data on traffic load and operating speeds (acquired over 24 h); the influence of hourly traffic load on hourly operating speeds for one of the four analyzed roundabouts is presented below. Analyses were conducted separately for the entrance to the roundabout (entry speed) and the exit from the roundabout (exit speed). The influence of traffic load on the operating speed is shown for the entrance to the roundabout in Figure 9 and for the exit from the roundabout in Figure 10, separately for the main direction at the intersection (which is normally more loaded) and the secondary/minor direction.
As can be seen in Figure 9 and Figure 10, a stronger correlation exists, especially at the entrance, in the main direction.
The influence of applied design elements on operating speeds was also analyzed. Although the applied width of the circulatory roadway is greater than the minimum recommended values (4.0 m), the analysis did not show the expected impact on speed, similar to the case for the size of the outer radius of the roundabout or the design elements of the entrance and exit (entry/exit radius and entry/exit width) (Figure 11 and Figure 12). A very weak correlation was also found between other design elements (the radius of the central island and the width of the traversable apron of the central island).
In addition to the directly applied design elements mentioned above, the influence of other parameters, such as the entry angle and deflection, which are a consequence of the applied design elements, was also evaluated. The entry angle was not confirmed to have an influence on operating speed, and deflection only had a weak influence on entry speed, with a slightly stronger influence on exit speed (Figure 13).

4.4. Summary of the Results

The methodology explained previously (Section 3) was applied to the case study of four four-leg urban roundabouts with standard outer radii ranging from 15 to 19 m reconstructed from standard at-grade non-signalized intersections.
A comparison with the guidelines shows that all the applied design elements adhere to the Croatian guidelines’ recommended values. However, the limit values for individual design elements are set in a very wide range in these guidelines, leaving the designer with a great deal of freedom when choosing elements and potentially resulting in very different roundabout solutions and, consequently, effects.
Deviations from the guidelines’ recommendations were observed in terms of the width of the entrance/exit and the size of the entrance/exit radius at the individual legs of the roundabout. Considering the deviation from the recommendations on roundabout legs A2, A3, B1, C2, D2, D3, and D4, the entry and exit operating speeds were analyzed and compared. It was shown that on all roundabout legs (except D3), the exit speed is higher than the entry speed, which does not confirm the assumption that using larger values for the exit width and the exit radius in relation to the corresponding entrance width and entrance radius enables a faster exit from the roundabout compared to slowing down vehicles at the corresponding entrance.
A comparison of the operating speeds before and after reconstruction (measured at the same position) shows that the operating speed was often higher than the regulated speed (even when the regulated speed was increased by 10%), especially on the exit from the roundabout and during the night hours.
The approach speeds before and after reconstruction were statistically compared, and a statistically significant difference was found. Although unexpected, an increase in operational speed on 4 of the 11 roundabout legs was observed after the reconstruction. The same comparison was conducted for departure speeds, wherein a statistically significant difference was also found between the speeds before and after the reconstruction, but it was also unexpectedly found that the departure speed at 5 of the 11 roundabout legs was higher after the reconstruction into a roundabout. Although, in this paper, the pavement condition was not analyzed either at the intersections before the reconstruction or at the roundabouts, higher speeds (approaching and departing) at the roundabouts may be a consequence of the better condition of the pavement. The above should definitely be included in the future analysis.
A detailed analysis of roundabout entry speed (measured at the entrance to the roundabouts) showed partially expected results; at most entrances (11 out of 14), the entry speed in the morning peak hour (V85-MPH) was lower than the daytime entry speed (V85-24h). This confirms the influence of traffic volume on operating speeds. In contrast, at all entrances, the nighttime entry speed (V85-NP) was higher than the daytime entry speed. However, the percentages of this increase are troubling; on average, there is an increase of 22%, and at some legs, it is even up to 50%. Another unexpected result is that at 9 out of 11 entrances, the daily entry speed (V85-24h) was higher than that recommended for a roundabout of that size.
A similar detailed analysis was conducted for the exit speeds. The operating speeds at the exit from the roundabout for 11 out of 13 legs were higher than those recommended for the corresponding roundabout size. Operating speeds in the peak period (V85-MPH) were lower or equal to the daily operating speeds (V85-24h) and higher in the night period (V85-NP). However, this increase was lower than at the entrance to the roundabouts, amounting to 10% (on average), with a maximum of 16%.
The influence of traffic load on operating speed during the day period (16 daily hours, from 6 a.m. to 10 p.m.) was analyzed, and it was determined that there is a significant correlation (R2 = 0.56–0.85) between the amount of traffic and operating speed (V85-24h).
The analysis of the main entry/exit design elements showed that the width of the entrance/exit and the size of the radius do not influence the entry/exit operating speed (R2 = 0.01–0.21). Deflection proved to have a slightly better correlation, affecting both the entry and exit speeds, with a greater influence on exit speeds (R2 = 0.35). The results are not in line with existing studies [4,23]. The speed at the entrance and exit is undoubtedly the result of the combination of the mentioned design elements of the entrance and exit, which is partly shown by the correlation in Figure 13. The goodness of fit in regression analyses shown in Figure 11 and Figure 12 is very low. The reason for this could be the limited size of the database, so future expansion of the database may lead to better correlations.
At all four analyzed roundabouts, the width of the circulatory road is significantly greater than the minimum recommended, and a truck apron is also applied as a mandatory element of roundabouts on state roads, but no significant correlation with operational speeds was established with any of the mentioned elements. According to the guidelines, the use of truck aprons at roundabouts on state roads is mandatory due to the expected maneuvering of long vehicles, especially in combination with smaller values of the width of the circulatory road. However, the combination of a larger value of circulatory road width and a truck apron, which makes the trajectory of smaller vehicles straighter, can be questioned when analyzing the speeds of those vehicles.

5. Conclusions

Croatian guidelines for the roundabout design have been applied since 2015, but a systematic analysis of their impact on the expected effects related to traffic safety has not been carried out until now.
The review of the existing research on roundabout performance shows that before–after studies are usually conducted based on an extensive number of roundabouts and traffic accident data. This approach was not possible in this case as there is no systematic monitoring of roundabouts’ safety performance in Croatia. Therefore, the research in this paper aimed to develop a methodology that includes detailed before–after operating speed analyses as a relevant safety performance indicator.
The developed methodology includes the collection of data on speed, traffic, and roundabout design elements as a basis for before/after operating speed analyses and the determination of the possible impact of design elements on the operating speed with the aim of estimating roundabout safety effects.
This methodology was applied to a case study of four intersections reconstructed into roundabouts according to Croatian guidelines. A significant reduction in speed, which was expected due to the implementation of the roundabouts, was not observed. Further analysis included detailed speed temporal distribution, concerning speeds in the peak hour and those in the night hours. It was somewhat expected that the average speeds at the entrance and exit would be lower in the morning peak hour and higher during the night hours. This phenomenon points to a significant influence of traffic volumes on speed and raises a question regarding the influence of applied design elements on speed control at roundabouts. The final step was the analysis of the design elements and their influence on speed control. The impact of basic entry/exit design elements on operating speed was analyzed, but significant correlations were not confirmed, except for a correlation between deflection and operating speed. This could be expected because the operating speed at the entrance and exit from the roundabout is certainly a consequence of the combination of applied design elements.
Considering the above, it can be concluded that roundabouts designed according to the Croatian guidelines for roundabouts do not, by their very application, improve traffic safety because they do not significantly affect speed reduction, nor do they ensure adherence to the expected traffic speeds defined with respect to the size of the outer radius. Even speed checks, which the guidelines recommend should be included as part of the design procedure, do not ensure speed control.
The conducted analyses point to the need to revise the existing guidelines. In order to more precisely define the elements of the guidelines that need to be revised, it is necessary to conduct further research and consistent results. The possible revision of guidelines might go in the direction of including separate recommendations for design elements for different locations (urban/rural), which also imply different potential users.
Applying the developed methodology showed that in cases in which there are no data on traffic accidents, the reliable safety monitoring of roundabouts can be based on real speed data, namely, operating speeds measured on site. The proposed methodology’s limitation relates to the availability of speed data before roundabout implementation.
This research will be continued by increasing the base of collected data and analyzing the influence of roundabout geometry on speed by creating a traffic microsimulation model to test different combinations of design elements. One possible result of traffic microsimulation models is the trajectory of the vehicle with regard to the various applied design elements of roundabouts. In further steps, this can be used to analyze potential conflicts at roundabouts, which can certainly be helpful when evaluating the traffic safety of a future roundabout solution.

Author Contributions

Conceptualization, A.D.-T., R.M. and S.Š.; methodology, A.D.-T. and S.Š.; software, S.Š.; validation, S.Š. and A.D.-T.; formal analysis, A.D.-T. and R.M.; investigation, S.Š.; resources, R.M.; data curation, R.M.; writing—original draft preparation, S.Š. and A.D.-T.; writing—review and editing, R.M.; visualization, S.Š.; supervision, A.D.-T.; project administration, R.M. and A.D.-T. All authors have read and agreed to the published version of the manuscript.

Funding

This research received no external funding.

Data Availability Statement

The data collected through research presented in this paper are available on request from the corresponding authors. These data are not publicly available because their use was approved for this scientific project in particular.

Acknowledgments

This research is the result of the projects “Optimization of the design elements of the wider zone of the intersection” (uniri-iskusni-tehnic-23-86) and “Transportation infrastructure in the function of the safety of vulnerable road users” (uniri-iskusni-tehnic-23-85) supported by the University of Rijeka.

Conflicts of Interest

The authors declare no conflicts of interest.

References

  1. Shirazi, M.S.; Morris, B.T. Looking at intersections: A survey of intersection monitoring, behavior and safety analysis of recent studies. IEEE Trans. Intell. Transp. Syst. 2016, 18, 4–24. [Google Scholar] [CrossRef]
  2. Liu, M.; Lu, G.; Wang, Y.; Wang, Y.; Zhang, Z. Preempt or yield? An analysis of driver’s dynamic decision making at unsignalized intersections by classification tree. Saf. Sci. 2014, 65, 36–44. [Google Scholar] [CrossRef]
  3. Pilko, H.; Brčić, D.; Šubić, N. Istraživanje brzine kretanja vozila pri projektiranju kružnih raskrižja. Građevinar 2014, 66, 407–416. [Google Scholar]
  4. Antov, D.; Abel, K.; Sürje, P.; Rõuk, H.; Rõivas, T. Speed reduction effects of urban roundabouts. Balt. J. Road Bridge Eng. 2009, 4, 22–26. [Google Scholar] [CrossRef]
  5. Deluka-Tibljaš, A.; Tollazzi, T.; Barišić, I.; Babić, S.; Šurdonja, S.; Renčelj, M.; Pranjić, I. Smjernice za Projektiranje Kružnih Raskrižja na Državnim Cestama; Građevinski fakultet Sveučilišta u Rijeci: Rijeka, Croatia, 2015. [Google Scholar]
  6. Ministarstvo Unutarnjih Poslova RH: Bilten o Sigurnosti Cestovnog Prometa 2014, 2016, 2018, 2020, 2021, 2022. Available online: https://mup.gov.hr/pristup-informacijama-16/statistika-228/statistika-mup-a-i-bilteni-o-sigurnosti-cestovnog-prometa/bilteni-o-sigurnosti-cestovnog-prometa/287330 (accessed on 15 November 2023). (In Croatian)
  7. Hydén, C.; Várhelyi, A. The effects on safety, time consumption and environment of large scale use of roundabouts in an urban area: A case study. Accid. Anal. Prev. 2000, 32, 11–23. [Google Scholar] [CrossRef] [PubMed]
  8. De Brabander, B.; Nuyts, E.; Vereeck, L. Road safety effects of roundabouts in Flanders. J. Saf. Res. 2005, 36, 289–296. [Google Scholar] [CrossRef] [PubMed]
  9. Kennedy, J.; Peirce, J.; Summersgill, I. Review of accident research at roundabouts. Transp. Res. Circ. 2005, 2005, 14. [Google Scholar]
  10. Kozić, M.; Šurdonja, S.; Deluka-Tibljaš, A.; Karleuša, B.; Cuculić, M. Criteria for urban traffic infrastructure analyses–case study of implementation of Croatian Guidelines for Rounabouts on State Roads. In Road and Rail Infrastructure IV; Faculty of Civil Engineering, University of Zagreb: Zagreb, Croatia, 2016. [Google Scholar]
  11. Ammanatidou, P.; Palantzas, G.; Nalmpantis, D. Selection between signalized traffic light junction and roundabout with the use of multi-criteria decision analysis (MCDA). In Proceedings of the International Conference on Environmental Design (ICED2020), Athens, Greece, 24–25 October 2020. [Google Scholar]
  12. Pilko, H.; Mandžuka, S.; Barić, D. Urban single-lane roundabouts: A new analytical approach using multi-criteria and simultaneous multi-objective optimization of geometry design, efficiency and safety. Transp. Res. Part C Emerg. Technol. 2017, 80, 257–271. [Google Scholar] [CrossRef]
  13. Bayrak, O.Ü.; Bayata, H.F. Multi-criteria decision-based safety evaluation using microsimulation. In Proceedings of the Institution of Civil Engineers-Transport; Thomas Telford Ltd.: London, UK, 2020; Volume 173, pp. 345–357. [Google Scholar]
  14. Numpaque, N.R.; Anselmi, L.M.; Polo, K.R.; Mendoza, C.G. Alternatives to improve operational traffic in roundabouts using microsimulation. Respuestas 2020, 25, 26–36. [Google Scholar]
  15. Kłos, M.; Sobota, A. Performance evaluation of roundabouts using a microscopic simulation model. Zesz. Nauk. Transp./Politech. Śląska 2019, 104, 57–67. [Google Scholar]
  16. Silva, A.B.; Mariano, P.; Silva, J.P. Performance assessment of turbo-roundabouts in corridors. Transp. Res. Procedia 2015, 10, 124–133. [Google Scholar] [CrossRef]
  17. Gastaldi, M.; Meneguzzer, C.; Rossi, R.; Della Lucia, L.; Gecchele, G. Evaluation of air pollution impacts of a signal control to roundabout conversion using microsimulation. Transp. Res. Procedia 2014, 3, 1031–1040. [Google Scholar] [CrossRef]
  18. Mądziel, M.; Campisi, T.; Jaworski, A.; Kuszewski, H.; Woś, P. Assessing vehicle emissions from a multi-lane to turbo roundabout conversion using a microsimulation tool. Energies 2021, 14, 4399. [Google Scholar] [CrossRef]
  19. Gruden, C.; Otković, I.I.; Šraml, M. Pedestrian behaviour and safety at roundabouts: A comparative study between real and microsimulation outcomes. In Proceedings of the Road safety and Digitalization, RSS 2022, Athens, Greece, 8–10 June 2020. [Google Scholar]
  20. Ambros, J.; Novák, J.; Borsos, A.; Hóz, E.; Kieć, M.; Machciník, Š.; Ondrejka, R. Central European comparative study of traffic safety on roundabouts. Transp. Res. Procedia 2016, 14, 4200–4208. [Google Scholar] [CrossRef]
  21. Persaud, B.N.; Retting, R.A.; Garder, P.E.; Lord, D. Crash reductions following installation of roundabouts in the United States. Insur. Inst. Highw. Saf. 2000, 15, 540–542. [Google Scholar]
  22. Gross, F.; Lyon, C.; Persaud, B.; Srinivasan, R. Safety effectiveness of converting signalized intersections to roundabouts. Accid. Anal. Prev. 2013, 50, 234–241. [Google Scholar] [CrossRef] [PubMed]
  23. Novak, J.; Ambros, J.; Frič, J. How Roundabout Entry design Parameters Influence Safety. Transp. Res. Rec. 2018, 2672, 73–84. [Google Scholar] [CrossRef]
  24. Maycock, G.; Hall, R.D. Accidents at 4-Arm Roundabouts; TRRL Laboratory Report LR. 1120; Transport and Road Research Laboratory: Crowthorne, UK, 1984. [Google Scholar]
  25. Arndt, O. Roundabout Safety Study: Effect of Geometry on Accident Rate; Transport Technology Division, Report DSB01; Queensland Department of Transport: Brisbane, Australia, 1991. [Google Scholar]
  26. Riccardi, M.R.; Augeri, M.G.; Galante, F.; Mauriello, F.; Nicolosi, V.; Montella, A. Safety Index for evaluation of urban roundabouts. Accid. Anal. Prev. 2022, 178, 106858. [Google Scholar] [CrossRef] [PubMed]
  27. Ott, R.L.; Longnecker, M. An Introduction to Statistical Methods and Data Analysis, 5th ed.; Duxbury: Pacific Grove, CA, USA, 2001. [Google Scholar]
  28. Montgomery, D.C. Applied Statistics and Probability for Engineers; John Wiley and Sons: Hoboken, NJ, USA, 2003. [Google Scholar]
  29. Bonett, D.G.; Seier, E. Confidence interval for a coefficient of dispersion in nonnormal distributions. Biom. J. 2006, 48, 144–148. [Google Scholar] [CrossRef] [PubMed]
Figure 1. Applied methodology.
Infrastructures 09 00159 g001
Figure 2. The positioning of the traffic counters: at the entrance of/exit from the roundabout (left) and at a distance of 40–70 m from the entrance to the intersection (right).
Infrastructures 09 00159 g002
Figure 3. Traffic counter positions and design elements of the roundabout selected for analysis.
Infrastructures 09 00159 g003
Figure 4. Operating speed before reconstruction.
Infrastructures 09 00159 g004
Figure 5. Approach speed before and after reconstruction.
Infrastructures 09 00159 g005
Figure 6. Departure speed before and after reconstruction.
Infrastructures 09 00159 g006
Figure 7. Roundabout entry speed.
Infrastructures 09 00159 g007
Figure 8. Roundabout exit speed.
Infrastructures 09 00159 g008
Figure 9. The influence of the entry traffic load on the entry speed V85.
Infrastructures 09 00159 g009
Figure 10. The influence of the exit traffic load on the exit speed V85.
Infrastructures 09 00159 g010
Figure 11. The influence of the entry width (left) and entry radius (right) on the entry speed V85 over 24 h.
Infrastructures 09 00159 g011
Figure 12. The influence of the exit width (left) and exit radius (right) on the exit speed V85 over 24 h.
Infrastructures 09 00159 g012
Figure 13. The influence of deflection on entry/exit operating speeds for the roundabout.
Infrastructures 09 00159 g013
Table 1. The applied design elements of the selected roundabouts and the recommended values.
Intersection AIntersection BIntersection CIntersection DCroatian Guidelines
(Range of Applied Values)
A1A2A3B1B2B3B4C1C2C3D1D2D3D4
Ro191617.51511–25
u776.56.54–9
eent5.85.66.45.85.24.55.45.66.25.55.25.65.64.73.6–10
Rent1522.31514.614141517191612.512.618n/a6–25
eex5.86.45.74.75.34.55.46.45.566.54.96.54.53.6–10
Rex161622.31614.61616181619n/a1511.118.58–50
ɸ413344423933384041.540422238460–77
d118.59.98.48.26.66.314.3n/a4.76.76.976.3no recommendation
Rc12121299991111118.58.58.58.57.5–18
t2221.51.51.51.52.52.52.52222min 1
n/a—not applicable.
Table 2. Operating speed data (V85) before and after reconstruction.
Intersection AIntersection BIntersection CIntersection D
Approach A1A2A3B1B2B3B4C1C2C3D1D2D3D4
before reconstructionapproach speed V85-24h524259535153n/a44554676n/a78n/a
departure speed V85-24h494456565151n/a48534578n/a77n/a
roundaboutapproach speed V85-24h58494448604854473045753659n/a
approach speed V85-MPH53443258634855462950743658n/a
approach speed V85-NP67545248746066653552774166n/a
departure speed V85-24h57534953644654533246753856n/a
departure speed V85-MPH41514759634854513248753955n/a
departure speed V85-NP63525454725959653653854362n/a
entry speed V85-24h4023333258384233354150446243
entry speed V85-MPH3819243260374433344249446142
entry speed V85-NP5127454070465142425153457064
exit speed V85-24h43n/a433862404621384555455844
exit speed V85-MPH37n/a413961414621384455455745
exit speed V85-NP46n/a464268465023445158496247
Note: A1, A3, B1, B3, C1, C3, D1, and D3 represent main approaches; A2, B2, B4, C2, D2, and D4 represent minor approaches; MPH—morning peak hour; NP—night period; n/a—not applicable (measurement was not conducted on this intersection leg); bold—operating speed higher than the regulated speed.
Table 3. Descriptive statistics regarding the approach speed before and after reconstruction.
ApproachNumber of ObservationsV85VminVmaxVavgStd. DeviationMann–Whitneyp-Value
A1before reconstruction790452878457.6−22.110<0.001
roundabout10,988585944711.9
A2before reconstruction6382425703210.5−50.488<0.0001
roundabout772549687418.9
A3before reconstruction7451592185526.999.279<0.0001
roundabout9834445793411.5
B1before reconstruction11,24253698458.736.642<0.0001
roundabout660948874418.3
B2before reconstruction3525516914210.2−31.827<0.0001
roundabout40856061065010.9
B3before reconstruction10,1545310106458.939.1514<0.0001
roundabout779748893408.7
C1before reconstruction10,3634471013510.010.569<0.0001
roundabout6066471080378.3
C2before reconstruction312155987469.166.292<0.0001
roundabout352530541246.3
C3before reconstruction914246689388.3−16.036<0.0001
roundabout5337451082407.5
D1before reconstruction467776221296611.16.458<0.0001
roundabout460575141176510.9
D3before reconstruction40407837120699.268.780<0.0001
roundabout4084592494517.5
Table 4. Descriptive statistics regarding departure speed before and after reconstruction.
ApproachNumber of ObservationsV85VminVmaxVavgStd. DeviationMann–Whitneyp-Value
A1before reconstruction10,68449979437.0−51.863<0.001
roundabout8333579964810.0
A2before reconstruction307744968378.1−30.700<0.001
roundabout2898531286449.3
A3before reconstruction8219561586506.764.057<0.001
roundabout8787491184426.9
B1before reconstruction79165613107498.422.371<0.001
roundabout6045531275467.1
B2before reconstruction474751884447.2−50.803<0.001
roundabout46066481175410.3
B3before reconstruction10,828517102439.235.054<0.001
roundabout802446791397.0
C1before reconstruction860048893399.4−23.361<0.001
roundabout2045531587458.3
C2before reconstruction346053986449.660.530<0.001
roundabout290532449274.9
C3before reconstruction910145689379.9−32.439<0.001
roundabout374646785437.1
D1before reconstruction4074789119699.914.476<0.0001
roundabout32537527124669.7
D3before reconstruction493477161346710.971.847<0.0001
roundabout4675561681497.4
Disclaimer/Publisher’s Note: The statements, opinions and data contained in all publications are solely those of the individual author(s) and contributor(s) and not of MDPI and/or the editor(s). MDPI and/or the editor(s) disclaim responsibility for any injury to people or property resulting from any ideas, methods, instructions or products referred to in the content.

