Article

Pedal towards Safety: The Development and Evaluation of a Risk Index for Cyclists †

1
Laboratoire sur la Perception, les Interactions, les Comportements et la Simulation des Usagers de la Route et de la Rue (PICS-L), Components and Systems Department (COSYS), Gustave Eiffel University, 77420 Champs sur Marne, France
2
Department of Civil, Chemical, Environmental, and Materials Engineering (DICAM), University of Bologna, Viale del Risorgimento 2, 40136 Bologna, Italy
3
Department of Industrial Engineering, University of Bologna, Via Fontanelle 40, 47100 Forlì, Italy
*
Author to whom correspondence should be addressed.
This paper is an extended version of our paper published in Ayad, L.; Imine, H.; Lantieri, C.; De Crescenzio, F. Risk Index Development for a Safer Cycling Environment. Living and Walking in Cities. In Proceedings of theXXVI International Conference LWC 2023, Brescia, Italy, 6–8 September 2023.
Infrastructures 2024, 9(1), 14; https://doi.org/10.3390/infrastructures9010014
Submission received: 21 November 2023 / Revised: 23 December 2023 / Accepted: 29 December 2023 / Published: 15 January 2024
(This article belongs to the Special Issue Sustainable Infrastructures for Urban Mobility)

Abstract

:
Cyclists are at a higher risk of being involved in accidents. To this end, a safer environment for cyclists should be pursued so that they can feel safe while riding their bicycles. Focusing on safety risks that cyclists may face is the main key to preserving safe mobility, reducing accidents, and improving their level of safety during their travel. Identifying and assessing risk factors, as well as informing cyclists about them may lead to an efficient and integrated transportation system. Therefore, the purpose of this research is to introduce a risk index that can be adapted to different road areas in order to measure the degree of how risky these areas are for biking. Cyclists’ behavior and demographics were integrated into the risk index calculation. The methodology followed to obtain the risk index composed of four phases: risk factor identification, risk factor weighting, risk index formulation, and risk index validation. Nineteen risk factors are categorized into four major groups: facility features, infrastructure features, cyclist behavior, and weather and traffic conditions.

1. Introduction

Road safety remains a global concern in road infrastructure management. It is essential to address the concerning increase in accidents involving vulnerable road users, particularly cyclists. Although the Netherlands is known for its cyclist-friendly infrastructure, cyclists accounted for 30.7% of total road accident fatalities in 2020 [1]. A similar pattern can be observed worldwide, where bicycle accident fatalities have increased in many countries, despite an overall decrease in transport fatalities between 2010 and 2019. In the EU, over 2000 cyclists died in traffic in 2019, and the proportion of seriously injured cyclists rose from 7% in 2010 to 9% in 2019 [2]. These statistics underline the urgent need for more powerful cyclist safety initiatives.
The objective of this research is to tackle this challenge by introducing a transformative approach to cyclist safety, distinguished by the following contributions:
a.
Risk Index Development: This study introduces a straightforward risk index that can be adapted to different road areas in order to measure the safety level of different road facilities for cycling. This risk index includes the identified factors influencing cyclists’ safety, including infrastructure, environment, traffic, and cyclist behavior. The identification and analysis of risk factors are based on a literature review related to cyclists’ safety, the collection and analysis of accident data from several countries, and an analysis of recorded videos from real road experiments previously conducted in Stockholm, Sweden.
b.
Cyclist Behavior Integration: A distinctive aspect of this research is the study and integration of cyclists’ behavior in this risk index because it has a major impact on their safety [3,4]. Risk-taking behaviors and traffic violations of cyclists are major contributory factors to accidents [5]. For example, 18% of accidents were a result of the carelessness and inattentiveness of cyclists in France [3], and 30% of cyclists’ injuries are due to driver inattention in the US [6]. It is, therefore, very important to investigate the behavior of cyclists and include it in a risk index approach in order to obtain more precise information that is often neglected in existing studies.
c.
Decision Support for Policy Makers: This risk index will help policy makers and urban planners make powerful decisions to improve road safety and promote safety regulations. By evaluating roadway conditions for bicycle use based on the risk index, policy makers can proactively identify gaps in the road and cycling network, promoting a decision-making framework.
d.
Applications for Automotive Tools: The proposed risk index can also serve as a foundation for the development of automotive tools designed to mitigate different types of accident occurrences or reduce the severity of injuries. Furthermore, this risk index leads to the development of a real-time alert system for cyclists, warning them of the risks associated with certain areas of the road segment, based on their current speed. Warning cyclists of the risks associated with riding a bicycle on a road segment will help prevent future traffic accidents as cyclists will react properly in advance. These innovative countermeasures, such as integrating intelligent transportation systems (ITSs) into bicycles will improve the safety of cyclists as vehicle ITSs have succeeded in decreasing road traffic fatalities, particularly among passenger car occupants, in recent years [7].
In summary, this research introduces innovative concepts that will have a significant impact on the development of a sustainable and safe transportation system.

1.1. Literature Review

With the growing use of bicycles worldwide, urban and transportation planning is dedicating greater attention to preserving the safety of cyclists. Quantifying, assessing, and comparing the causes and consequences of bicycle accidents are essential for improving cyclists’ safety. To this end, there has been an upsurge in interest in researching the factors and attributes of bicycle safety over the years, resulting in several studies and methodologies related to safety indexes. This section includes a comprehensive literature review of the predominant bicycle indexes and risk assessment models obtained by researchers and intended to provide stakeholders such as engineers, planners, and municipalities with methodologies to assess and rank the safety of road networks for potential bicycle infrastructure project improvement.

1.1.1. Bicycle Safety Indexes

The main bicycle indices identified in the literature review are as follows:
  • Bicycle Level of Service (BLOS): The BLOS measures cyclists’ perception of comfort and safety level for specific roadway geometries, taking into account road geometries and traffic conditions [8,9].
  • Bicycle Level of Traffic Stress (BLTS): This measures the desirability of a bicycle facility by considering not only the geometric characteristics but also the suitability of the environment for different user groups within the population [10].
  • Bikeability Index: It is the perceived comfort, safety, and convenience of an entire bikeway network and access to important destinations (community wide/macro-level) [11].
  • Safety Performance Functions (SPFs): They provide a statistical relationship between crash frequency and major predictors. It is used to predict the expected number of crashes on a particular type of facility given specific conditions [12].
  • Bicycle Safety Index: It is developed for specific regions, using a scoring system of different safety factors, ranging from highly safe to highly risky [13,14].
A detailed overview of the comparison is presented in Table A1 in Appendix A, which outlines different indexes, including the factors used, the methodology, and their associated outputs.
While these indexes provide valuable insights, they often focus on infrastructure-related factors. These include the presence of bicycle lanes and their widths, pavement type and condition, roadway type, and road use diversity and intensity (parking lots presence, commercial shops presence, schools, etc.), as well as speed and traffic volumes. However, they tend to overlook an important safety factor such as road user behavior. The absence of such a factor may not provide a comprehensive understanding of safety.

1.1.2. Risk Assessment Model in Bicycling Safety

Recent studies have refined risk management practices to serve bicycle safety purposes as follows:
  • Crash Data Analysis: These studies analyze factors affecting injury severities in different types of bicycle accidents, presenting the relationship between observed factors and cyclists’ safety through statistical analyses such as regression models [15,16].
  • Integrated Risk Models: Integrated models assess exposure, crash data, and the evaluation of severity, likelihood, and frequency for a set of risk factors related to bicycle accidents [17,18].
For crash data analysis, the objective is to study the factors contributing to accidents by analyzing bicycle accident data, which includes information on the types of accidents, their frequencies, contributing factors, and outcomes. The methodology used in the crash data analysis relies on statistical methods to find the relationship between these factors and cyclists’ safety or any other interesting patterns related to bicycle safety.
For integrated risk models, the objective is not to rely solely on accident data but to include additional factors that assess risks in detail, such as bicycle riding trips, environmental factors, driver behavior, etc. A quantitative risk assessment model is then used to develop risk management strategies.
This study, presented in this article, serves as the completion and integration of these works (risk factor identification, the probability of occurrence, and impacts). The objective is to introduce a risk index formula that can be used to measure the degree of risk associated with each road segment.

1.2. Comparative Overview with Risk Index

The literature review and analysis of different studies allowed us to discuss controversial aspects and identify major gaps that need to be addressed in our research. Previous studies did not focus on the impact of cyclists’ behavior on risks such as gender, inattention, and bicycle use in different types of weather and traffic conditions. Also, the existing bicycle safety index, for example, developed in previous studies was based on a macro-scale, and on observing cyclists across different city sites for a certain risk factor, which is maneuver avoidance.
It is therefore necessary to develop a straightforward risk index that integrates all potential risk factors that put the cyclist in danger or probable hazard. This index should not rely on infrastructure and facility features but should also include other important risk factors such as cyclists’ behavior, demographics, and weather conditions. Unlike models based on logistic or Poisson models, this study’s approach focuses on identifying and assessing risk factors for a road layout segment, by developing a systematic method of testing and validation. It is based on a risk assessment model that identifies risk factors, determines accident likelihood due to the risk factor, and measures the severity level of potential accidents.
This risk index incorporates the foundational knowledge from previous indexes, principles of risk assessment, a combination of most factors, analysis of accident data, and severity analysis of risk factors. The aim is to provide a real-time measure of the degree of risk on a given road segment and to serve as a tool for mitigating accident occurrence and reducing the severity of cyclists’ injuries. To preserve cyclist safety, engineers (i.e., automation engineers, systems engineers, etc.) can use this risk index to develop an advanced tool that can be installed on bicycles.

2. Materials and Methods

The current paper aims to produce an adequate risk index for bicycle safety using different variables, which can be attained by following the methodology, composed of different major phases, and presented as a chart shown in Figure 1:
In the first phase, we aim to identify primary safety risks that impact the cyclists’ safety while riding. This phase is based on in-depth research and data analysis. So, we start with a literature review to identify the factors that contribute to cyclists’ safety. Additionally, we use accident data and reports to obtain frequent risk factors leading to bicycle accidents. We refer to documents published between 2012 and 2022 concerning bicycle safety to provide recent studies and obtain relevant findings in this field. The geographic scope of the data comes from the EU countries (the Netherlands, Germany, Switzerland, Belgium, Denmark, Italy, and France), the UK, the USA, Australia, and South Korea. This scope allows us to address potential variations in factors that influence accident patterns, such as infrastructure. We also analyze over twenty videos from previous real road experiments where the cyclists rode an instrumented bicycle equipped with different sensors such as speedometer, accelerometer, GPS, etc. These experiments were conducted on roads with different characteristics and layouts. This analysis allows us to capture the real-world risk that cyclists may encounter. By combining these strategies, all significant contributing factors are identified and added to the risk index.
In the second phase, the focus is to evaluate the probability of occurrence of bicycle accidents due to each risk factor and to understand their impact on overall bicycle safety. This is carried out by using the same approach as in the first phase. Then, the severity of risk factors is deduced by obtaining their probability and impact using the risk matrix. This phase identifies those factors which present a higher level of risk than the others. The outcome of this phase is a hierarchy of risk factors. This prioritization paves the way for the calculation of risk factor weights in the third phase, which combines the risk matrix and Analytic Hierarchy Process (AHP) theory. AHP is one of the relevant methods for combining qualitative and quantitative methods that serve the risk assessment objective. It breaks down the hierarchical structure to assess each risk factor according to its severity. The factors are then compared to determine their level of importance level. The AHP method is used to check that the results are consistent, in order to validate the reliability method. The risk index formula is introduced in the fourth phase of this study. This formula enables roads to be quantitively assessed and high-risk locations to be prioritized. A case study was carried out by selecting a certain road layout and evaluating it by calculating the risk index. Following this evaluation, this phase also aims to validate the risk index and ensure its reliability for real-world application scenarios by comparing it with objective accident data.

2.1. Risk Factors Identification

With reference to the literature review and video analysis, risk factors potentially contributing to accidents are categorized into four groups: (1) facility features, (2) infrastructure features, (3) cyclist behavior and demographics, and (4) bicycle use. Nineteen major risk factors are identified in accordance with the study framework and objective of our study as shown in Figure 2. All of these factors are incorporated into the formula of the risk index.
The summary below provides an overview of the categories with their corresponding key factors, including the likelihood of occurrence of certain risk factors.
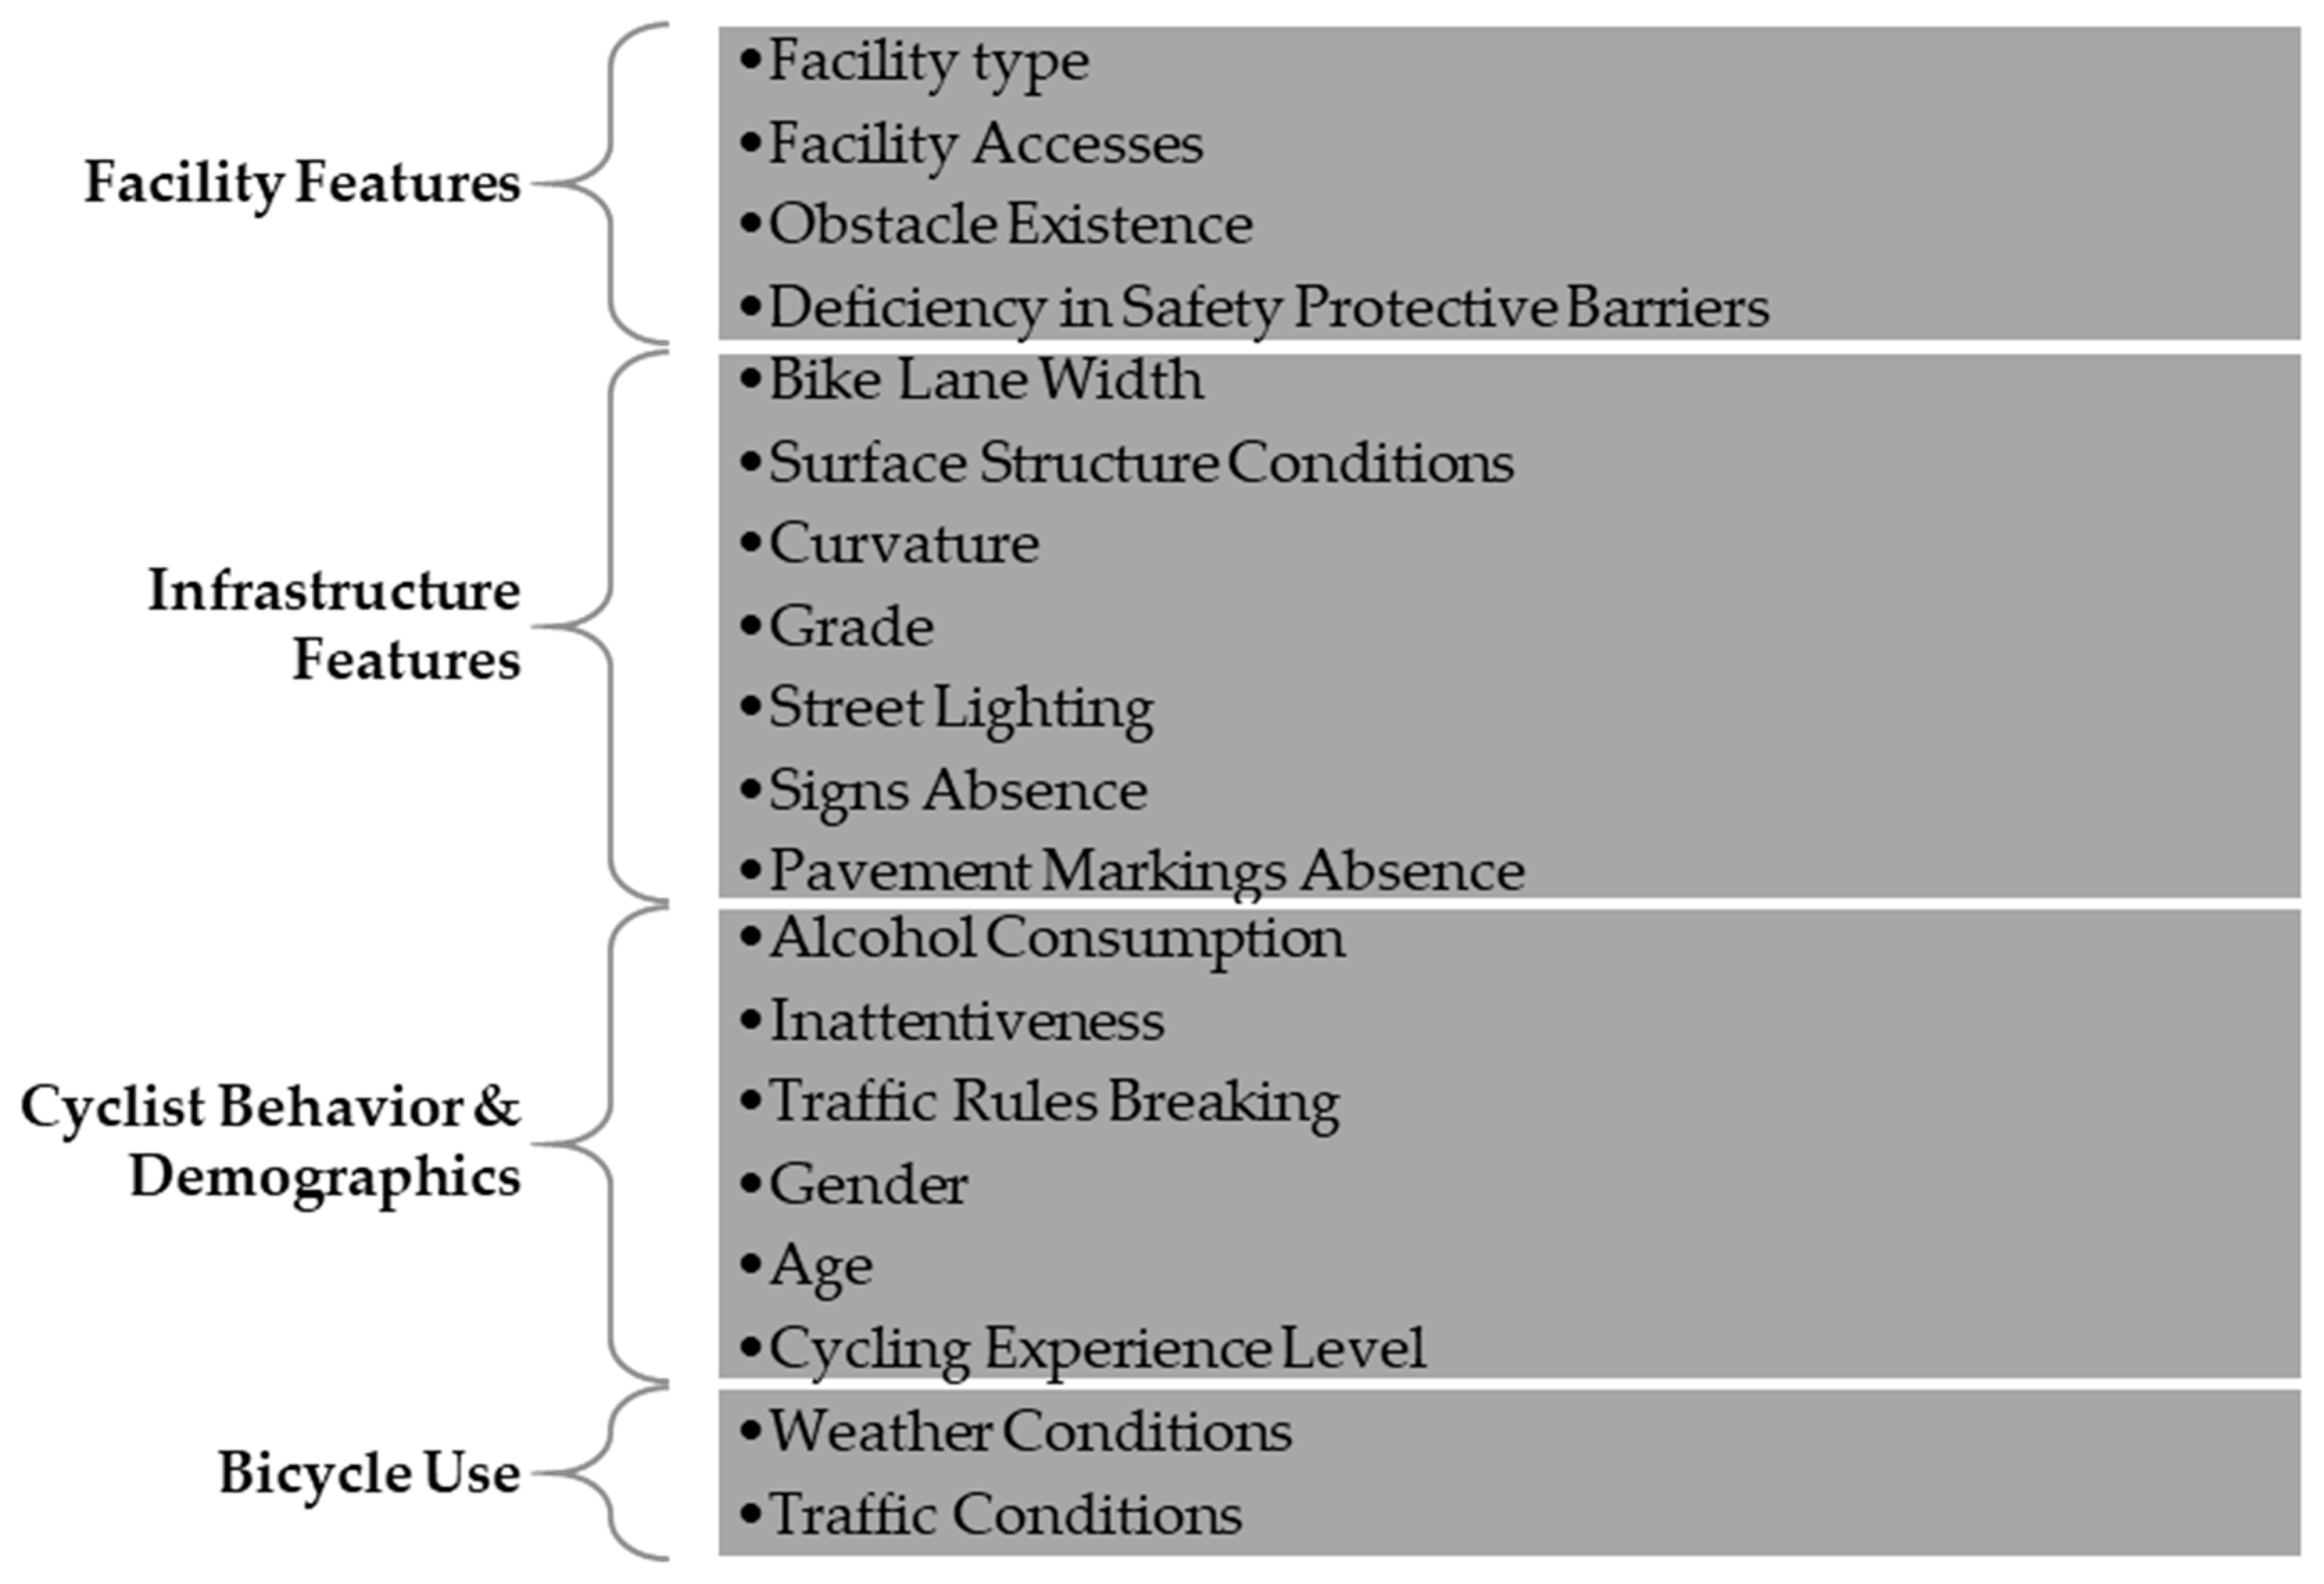
  • Facility Features: The facility is an essential network for meeting road users’ needs. The facility types used by cyclists such as bike lanes, bike paths, shared use paths, significantly affect safety. The bike path is commonly considered the safest depending on the degree of separation [19], while bicycle lanes tend to have less severe accidents than shared-use paths [20]. The highest danger index by facility type is 4.49 for off-road/unpaved paths and 1.39 for multiuse paths [21]. Excessive access points such as intersections, other roads, parking, etc. can increase the likelihood of bicycle accidents, especially on two-way bicycle facilities. The highest number of bicycle accidents is related to facility features and is due to collisions with other road users (more than 65%) [21,22]. Also, the presence of fixed and non-fixed obstacles such as street furniture (benches, bins, poles, signs, barriers, fountains, bus/tram stops), trees, parked cars, door cars, etc., may lead cyclists to collide with them and endanger themselves or have accidents. A total of 24% of cyclists have collided with obstacles and been injured [23], and on-street parked vehicles increase the likelihood of bicycle accidents and conflict due to car doors opening into cyclists’ paths [24]. Safety protective barriers play a crucial role in preventing injuries in any event of hazard such as a run-off road vehicle accident. For example, in the event of an accident, the barriers along the roadway can absorb the kinetic energy of the vehicle by deforming over a certain distance. Therefore, this will considerably reduce the severity of accidents and run-off-road accidents [25]. A total of 55% of the cyclists who participated in the experiments chose an off-road without safety barriers as presenting a higher accident risk [4].
  • Infrastructure Features: The road infrastructure includes different critical geometries, and can frequently increase the risk of bicycle accidents [24]. One critical factor is lane width. By considering the lane width, the number of lanes is also covered at this point. The risk of bicycle accidents increases on narrower widths as cyclists may have limited space to maneuver or are more likely to collide with obstacles or other road users. The minimum required width of a bike lane should be 1.2 m and 1.5 m if it is a bike lane with on-street parking [26]. In addition, the condition of road surface plays a significant role, with well-maintained pavements reducing fatal and injury accidents by 26% compared to deficient pavements [27]. Road curvatures also matter. Curves straightening can reduce accident frequency, with curves having a radius between 200 to 400 m, resulting in a 50% accident reduction [27]. Steep descent grades (higher than 5%) are considered undesirable because they can cause cyclists to exceed safe speeds, increasing the risk of injuries [26]. Also, 36% of their participants considered that the road layout with steep grades is the least comfortable road to ride [4]. The risk of injury from bicycle accidents is 2.3 times higher on roads with downhill slopes compared to roads without slopes [28]. Dark streets pose a significant risk; they can lead to a seven times increase in fatalities and higher rates of vehicle–bicycle accidents due to reduced visibility of the road users [28]. To enhance safety, vertical signs such (stop signs) and horizontal signs (pavement road markings) are important, providing guidance to cyclists of any unexpected or hazardous conditions and warning them of changing conditions while riding [26].
  • Cyclist Behavior and Demographics: Cyclist behavior and demographics have a strong influence on the risk of bicycle accidents. Personal characteristics such as age, gender, cycling experience level, and attention shape how cyclists react differently to other road users and obstacles, consequently affecting their likelihood of collisions [29]. Alcohol consumption while cycling presents a significant risk, but the frequency of intoxicated cyclists varies between countries. For example, the US recorded more than 34% of fatal bicycle accidents because of alcohol consumption by the driver or cyclist in 2020 [29]. Cyclist inattention is one of the leading causes of cyclist injury, accounting for 30% of cyclist injuries in the UK [30]. On the other hand, distraction is responsible for 11% of bicycle accidents in Belgium [31]. Disobeying the traffic rules such as running red lights, using phones/smartwatches, and not wearing a helmet is another danger. For example, a study by [4] showed that 25% of its participants did not stop at a red traffic light, and 6.9% of commuting cyclists break the red lights [32]. Accident risk is also affected by the age of the cyclist, with older cyclists at higher risk due to slower reaction times when facing sudden conflicts or obstacles in their path [23,25]. In terms of age, cyclists aged between 50 to 59 are at the greatest risk of being involved in accidents. For example, in the US, 41% of bicycle accidents involve this age group, followed by the 60–64 age group [6]. France also reported in 2019 that the 55–64 age group had the highest number of cyclists killed [33]. Moreover, gender influences risk, with male cyclists having a higher injury risk and collision rate than women. According to a study by [34], men had a crash risk 1.43 times higher than women. In addition, cycling experience plays a crucial role. Several findings in the literature presented that inexperienced or infrequent cyclists may be involved in accidents compared to confident and experienced cyclists. This group is capable of riding on busy roads in different conditions, and of navigating their way through traffic to reach their destination [26].
  • Bicycle Use: Cyclists’ safety is linked to weather and traffic conditions. Bad weather, such as rain, snow, fog, and wind, has a considerable impact on road surfaces and cycling conditions. These conditions can lead to slippery road surfaces or snow-covered surfaces, making it easier for cyclists to lose their control while riding. Additionally, cyclists may encounter obstacles as these weather conditions decrease the visibility of cyclists. A study shows that 18% of participants were involved in high-risk accidents due to skidding on slippery surfaces (wet, snow, ice) [22]. Furthermore, the time of the day is an important factor to be considered in bicycle accident occurrence. According to national statistics of different countries, a significant number of collisions happen during the commute to or from work. Morning peak hours (around 06:45–09:15 a.m.) and evening peak hours (around 5:00 p.m.–8:00 p.m.) are the critical times when bicycle accidents are most likely to occur on weekdays [6]. This may be due to the high volume of road users during these hours, their greater exposure to traffic, or the cyclist’s behavior. Cyclists tend to drive more aggressively during busy morning travel journeys and such behavior can increase the likelihood of an accident [35]. In the US, 49% of fatal accidents occurred in daylight, compared with 47% in darkness, and the largest group of cyclist fatalities was between 6 p.m. and 8:59 p.m. [6].

2.2. Risk Assessment Concept

Four components are used to apply risk assessment concepts and prioritize contributing factors: risk exposure, the level of likelihood of risk occurrence, the level of risk impact on cyclist safety, and the severity of risk factors [12,36,37]. These are summarized as follows:
  • Risk Exposure: It determines the risk factors to which cyclists are exposed.
  • Level of Probability of Risk Occurrence: It quantifies the probability of a cyclist being involved in an accident due to a specific risk factor. The Likert scale of level of probability is divided into five levels presented in Table 1 [38], ranging from very low, exceptional circumstances (0 to 10%) to very high, very frequent accidents (80 to 100%). The traditional risk assessment model is applied in the bicycle safety domain.
  • Level of Impact of The Risk: It measures the influence of the occurrence of specific risks on the safety of the cyclists. The Likert scale for assessing the impact is divided into five levels presented in Table 2. It ranges from negligible, indicating no impact on the cyclists’ safety to major, indicating that the risk can result in fatal accidents. Negligible injuries are superficial injuries or bruises that may not require medical attention. Minor injuries include minor muscle strains causing discomfort or minor cuts requiring basic first aid. Moderate injuries are fractures that may require medical attention but are not life-threatening. Significant injuries may require surgery for proper healing, or stitches requiring medical intervention. Major injuries include severe conditions such as head injuries leading to disability, severe damage to the spinal cord leading to paralysis, or injuries leading to death of the cyclist such as severe head trauma.
  • The severity of the risk factor: It quantifies the risk severity resulting from potential accidents, as per the risk matrix shown in Table 3 [38]. The risk matrix is a visual tool used in the risk assessment process, categorizing the severity of risks based on the combination of the probability of an accident occurring, represented along the X-axis, and its consequences on cyclist safety, represented along the Y-axis. It is a 5 × 5 matrix that provides a powerful way to prioritize the risks. The use of this matrix is simple to obtain a qualitative assessment of risks. By analyzing the probability and impact of risks, the risk matrix generates various scenarios, each indicating a specific level of severity in the context of cyclist safety.

2.3. Risk Factors Prioritization and Weighting

2.3.1. Severity of Risk Factors

The severity of the risk factor is obtained by referring to the risk matrix shown in the previous section (Table 3). Accordingly, the severity for each category is as follows:
  • Facility features severity is classified as very high;
  • Infrastructure features severity is classified as high;
  • Cyclist behavior and demographics severity is classified as high;
  • Bicycle use severity is classified as medium.
Furthermore, the severity of individual risk factors within each category is identified as detailed in Table 4.

2.3.2. Pairwise Comparison Matrix

The determination of weights for each risk factor in this study is accomplished by using the pairwise comparison matrix within the Analytical Hierarchy Process (AHP). The AHP process serves as a comprehensive framework for representing and quantifying the significance of different elements within a decision problem [39]. It is widely employed worldwide across different domains including engineering, business, education, and government. The AHP process is applied in this study because it enables the identification and quantification of the relative importance of risk factors. This approach is the basis for evaluating risk factors and better understanding their contribution to the overall risk assessment. The methodology of this process involves different steps:
  • Creation Pairwise Comparison Matrix: Develop a single pairwise matrix for the four primary risk categories to compare each category with the others. This matrix establishes the relative importance of one category over the others.
  • Assignment of importance values to each category: Assign importance values reflecting their relative significance compared to others. The values, ranging from equal importance to extreme importance, are shown in Table 5. Table 5 presents the scale indicating the importance of one criterion relative to another. The values range from 1 to 9, where 1 implies equal importance and 9 signifies extreme importance.
  • Weights Calculation: Obtain weights for each category by following the steps below:
  • Normalizing the pairwise comparison matrix by dividing each assigned level of importance by the sum of its respective column using the Equation (1). This leads to a sum of 1 for each column within the matrix:
N i j = P i j i 1 n P i j
where:
○   N i j is the normalized element in the matrix;
○   P i j is the element in the original pairwise comparison matrix (Assigned Importance Value);
○   n is the number of elements in each column.
When a level of importance is assigned to one category, the reciprocal value is used for the inverse comparison.
  • Calculating the priority vector involves finding the row-wise average of the normalized matrix using the Equation (2):
V i = j = 1 n N i j n
where:
○   V i is the priority vector for the i-th row;
○   n is the number of elements in each row.
  • Calculating the principal eigenvector involves finding the eigenvector corresponding to the largest eigenvalue of the normalized matrix using Equation (3):
W = V λ m a x
where:
○   W is the principal eigenvector (normalized weight vector);
○   V is the priority vector;
○   λ m a x is the largest eigenvalue of the normalized matrix (find it from det(A − λ I) = 0.
4.
Validating this process by assessing the consistency ratios, ensuring the reliability of the computed weights by using Equation (4) [39]:
C R = λ m a x n n 1 / R I
RI is the random index obtained from the table of the random consistency index in the function of matrix size [39]. In this study case, the matrix size for the main categories is 4, so RI is 0.9.
The same method is applied to the components within each category to obtain their weights as shown in Table 6. It presents the risk factors along with the corresponding weights. The results indicate that facility features have the highest weight, meaning that these features have a greater impact on cyclist safety, with an overall weighting of 0.568. This is followed by infrastructure features with a weight of 0.224, cyclist behavior with a weight of 0.134, and bicycle use with a weight of 0.074. This hierarchy of weights highlights the ranking of factors influencing cyclist safety. It is essential to ensure that the sum of these weights equals one, an important validation of the weighting process. The final step of our analysis involves calculating the consistency ratio (CR). This ratio is a critical measure of the degree of consistency in our pairwise comparisons. A higher value of the consistency ratio implies less consistency, whereas a lower number means a higher degree of consistency. If the consistency ratio CR ≤ 0.1, the pairwise comparisons are relatively consistent. However, if CR ≥ 0.1, the pairwise matrix should be reconsidered to identify and resolve the sources of inconsistency, and redo the analysis. The consistency ratio obtained in this study is 0.008, reassuring that the pairwise comparison matrix used demonstrates a high level of consistency. This emphasizes the reliability of our weightings.

2.4. Risk Index Formulation

The formula for calculating the overall risk score of a road segment is updated and presented as follows in Equation (5) [25,40,41].
R I = i w i × V i
where: RI = overall risk index of a road segment; wi = weight of a risk factor in a single category; and Vi = value of a risk factor that occurred within a road segment; i stands for the number of the risk factors observed within the road segment.
The risk index is set between 0 and 1, where 1 corresponds to the highest risk criticality of the road segment and 0 to the lowest criticality, as shown in Table 7. The range selected is to be between 0 and 1 because the weights are between 0 and 1, and the number of occurrences is adapted to be between 0 and 1 as shown in Table 8 [25].

3. Results

3.1. Risk Index Validation: Case Study Evaluation

A case study was conducted to validate the effectiveness of the risk index formula, on a 3.5 km road in Stockholm. This road was selected as a real-world test site because of its diverse characteristics and complex infrastructure. The aim is to assess the formula’s ability to evaluate the risks faced by cyclists in their daily activities, such as commuting to and from work, or short distances such as going to coffee shops or shopping trips. The different characteristics of the road provide a challenging environment to test the formula’s application.
This study aims to evaluate how well the formula could predict and quantify the risks associated with cycling in a complex road environment.
The road, illustrated in Figure 3, is divided into nine segments to isolate distinct scenarios. Each segment contributes to obtaining a detailed analysis of the risk index by highlighting different challenges.

3.2. Road Measurement and Assessment

Different participants rode the instrumented bicycle, equipped with different sensors [4], to collect reliable data for studying bicycle movement and completing the road assessment process by having real-time monitoring and conducting post analysis of the bicycle ride.
These sensors were strategically selected to capture the road environment, cyclist behavior, and potential safety risks. These sensors help validate the risk index by gathering the required information for a detailed investigation of the road segments.
Some of the main sensors include:
  • GPS (Global Positioning System): Garmin Edge 130 plus, which includes GPS to detect the precise location and movement of the instrumented bicycle in real time throughout the entire road layout. This device has been attached to the handlebars for easy control.
  • Accelerometer: AlianTeck’s G-link-200 Triaxial accelerometer measures the accelerations of the front part of the bicycle, providing information on speed changes and sudden stops of the bicycle.
  • Inertial Measurement Unit (IMU): Unit+ WLAN “Shell” 4.0 Data Logger from Avisaro to measure rear-end accelerations, orientation, and trajectory of the bicycle. The logger was mounted on the rear seat of the bicycle.
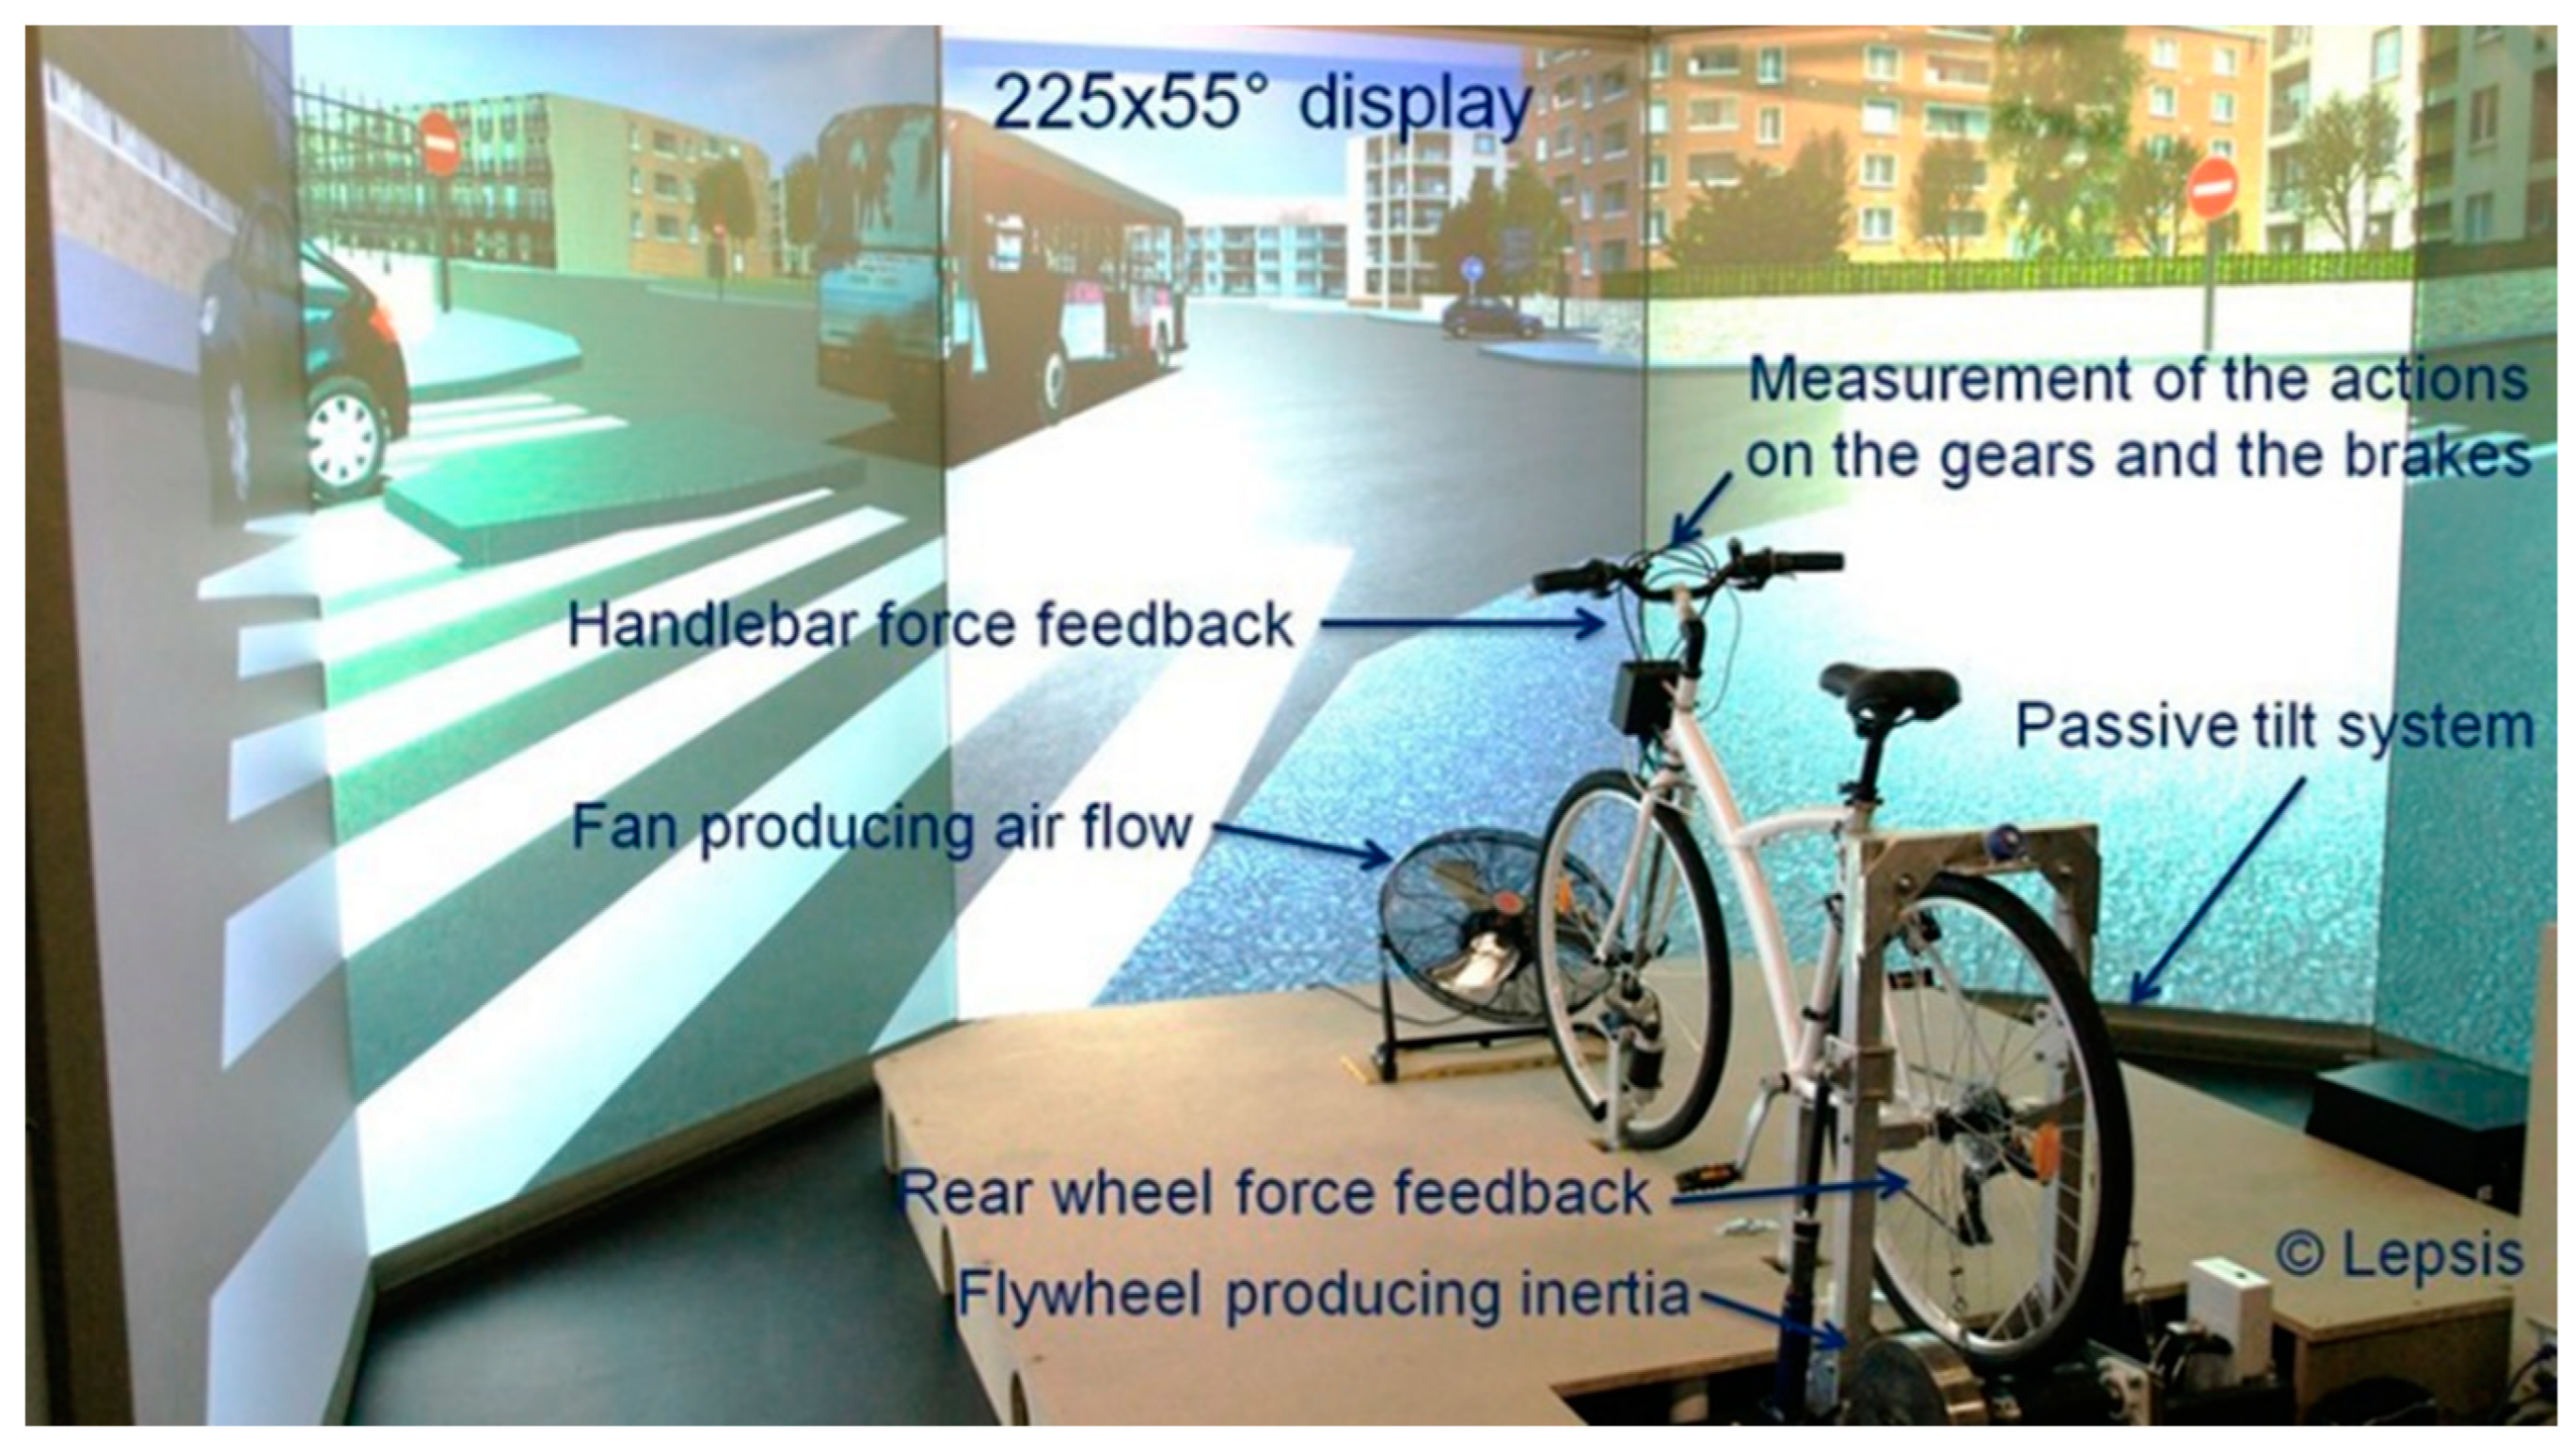
  • Eye Tracker: Pro Glasses 2 Mobile Eye Tracker from Tobii. This tracker was equipped with 4 eye cameras and a scene camera. It was used to record participants’ gaze, to record live video of the road, surrounding environment, weather conditions, and road surface conditions.
The sensors continuously gathered data on the bicycle’s movement, environmental conditions, and participant reactions during the real road experiment rides. Real-time monitoring allowed us to collect dynamic parameters, such as sudden stops, accelerations, and gaze tracking using the Eye Tracker. On the other hand, post-ride analysis further enhanced the analysis by observing recorded videos of the participants’ scenarios and extracting the required data. These combined approaches lead to a profound evaluation of each road segment, considering road features, cyclist behavior, and environmental factors.
With respect to the route characteristics, the road layout is divided into nine segments, as presented in Figure 4.
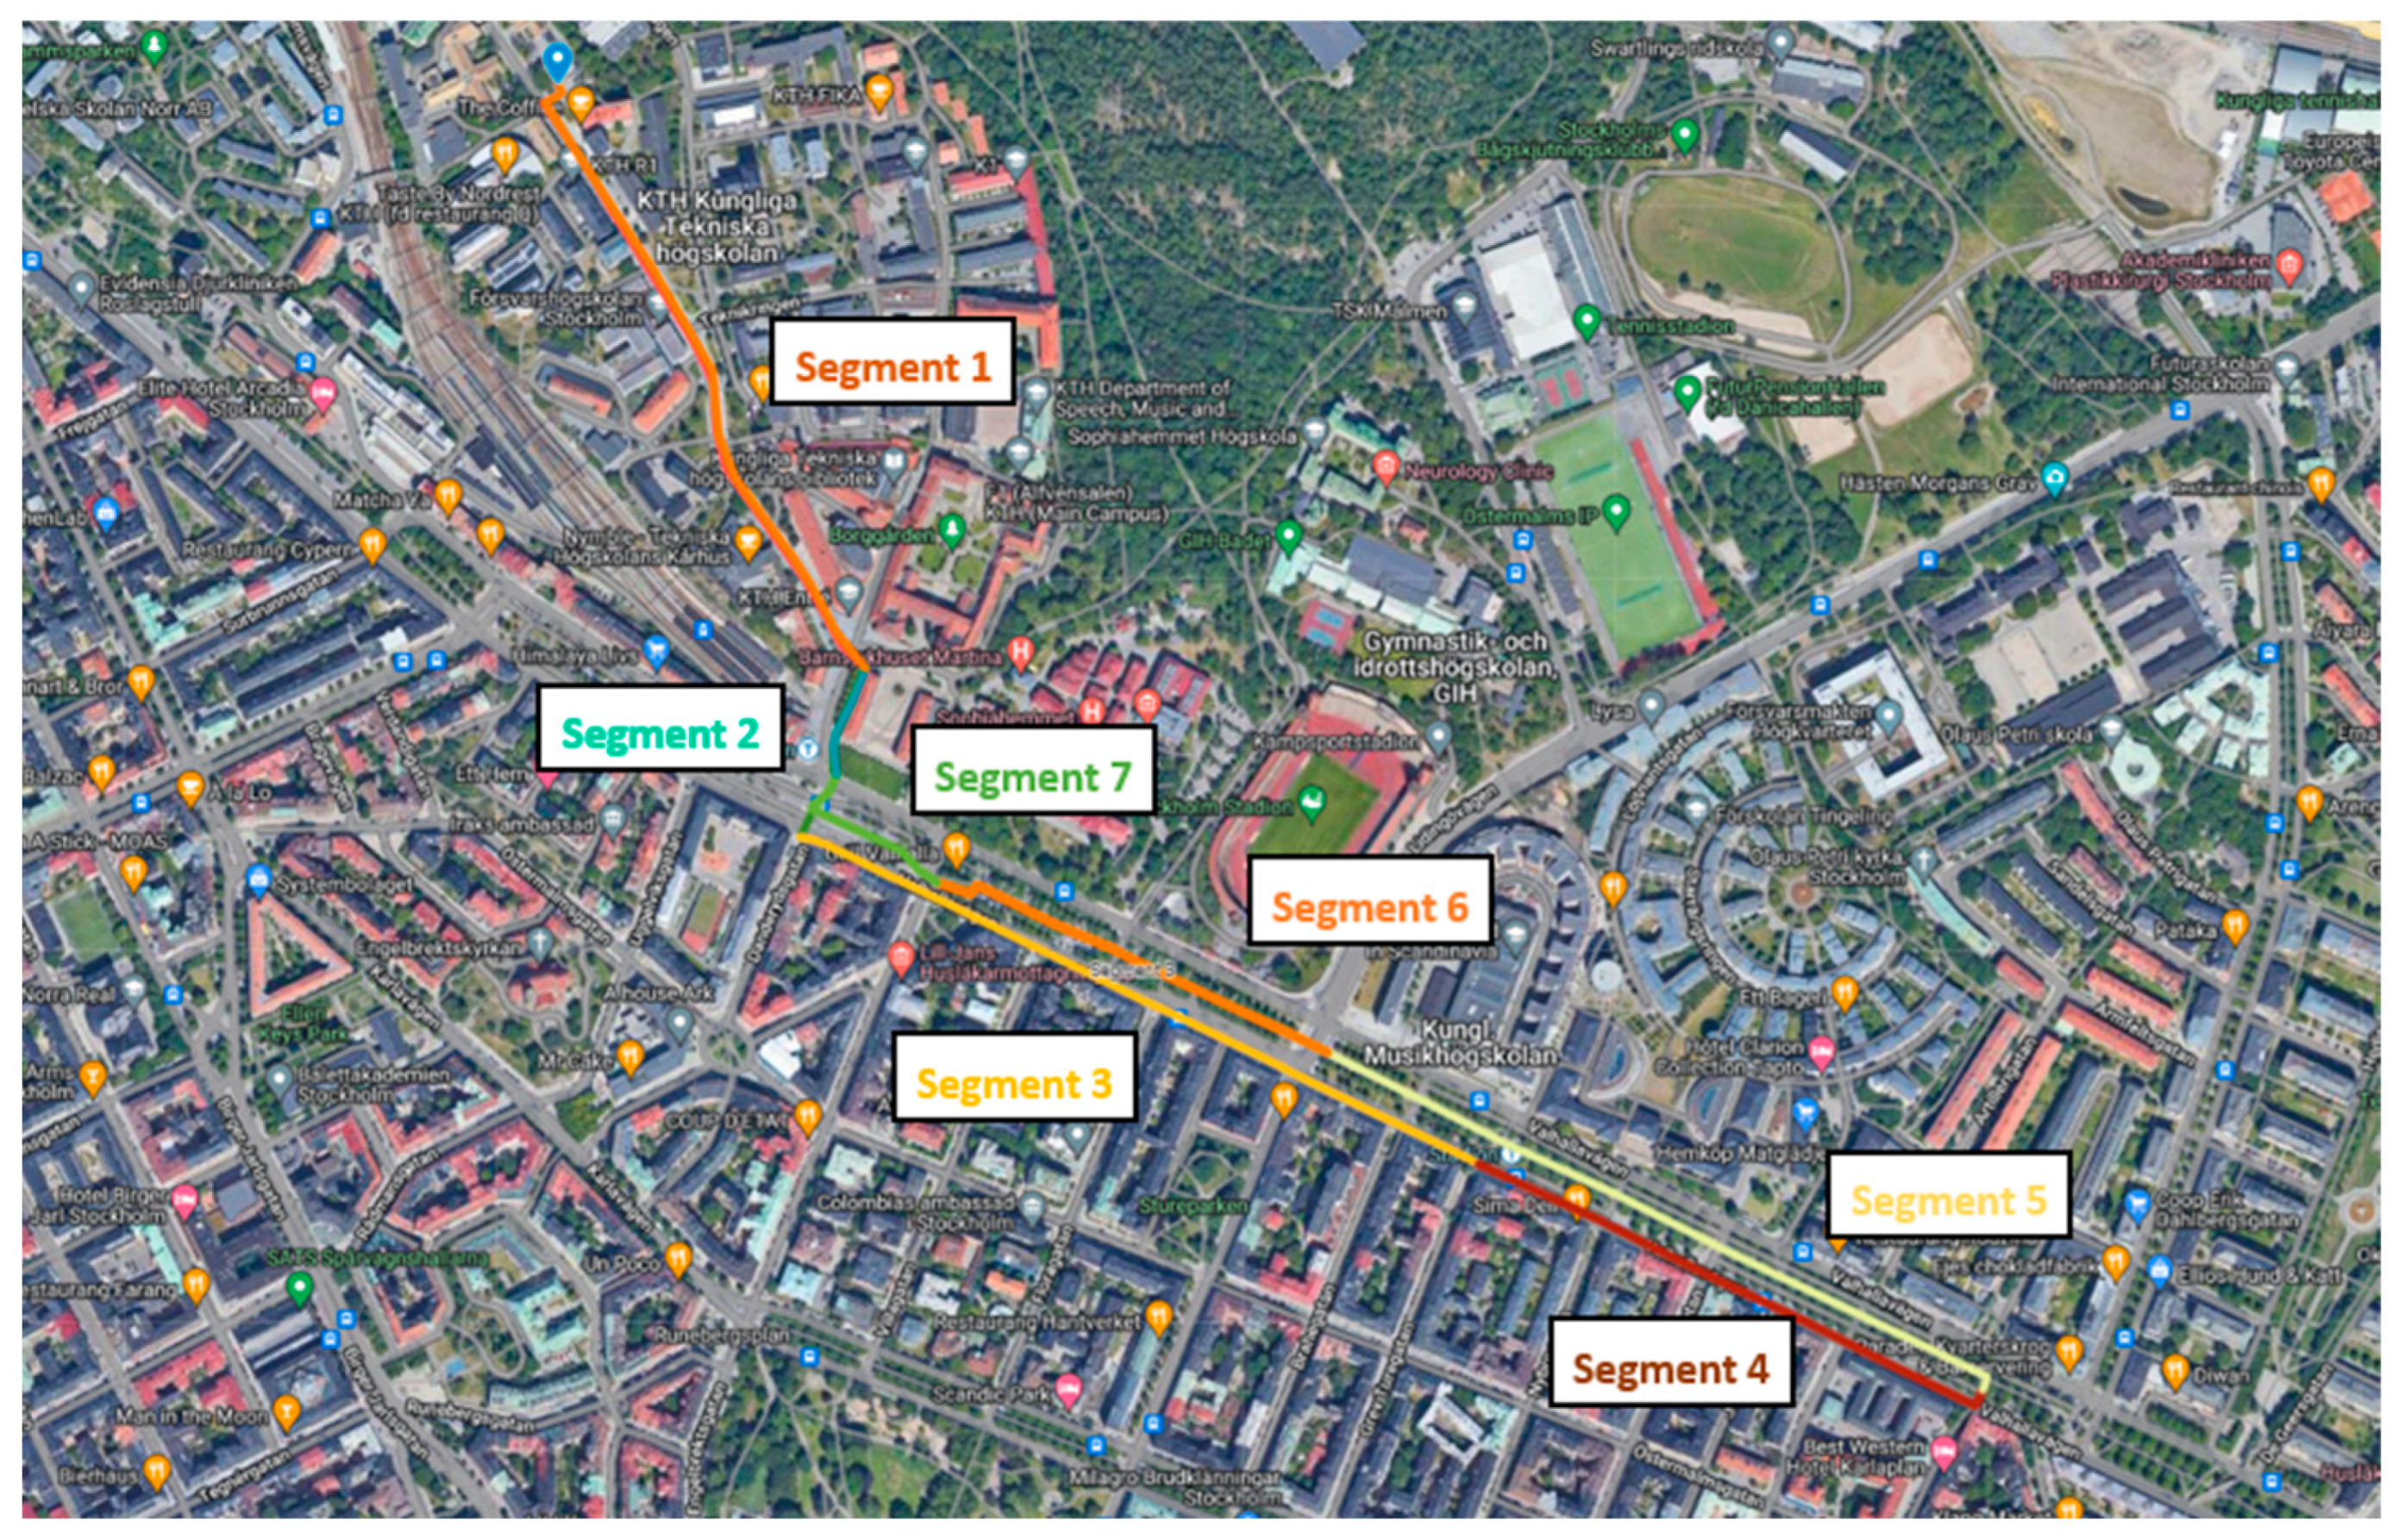
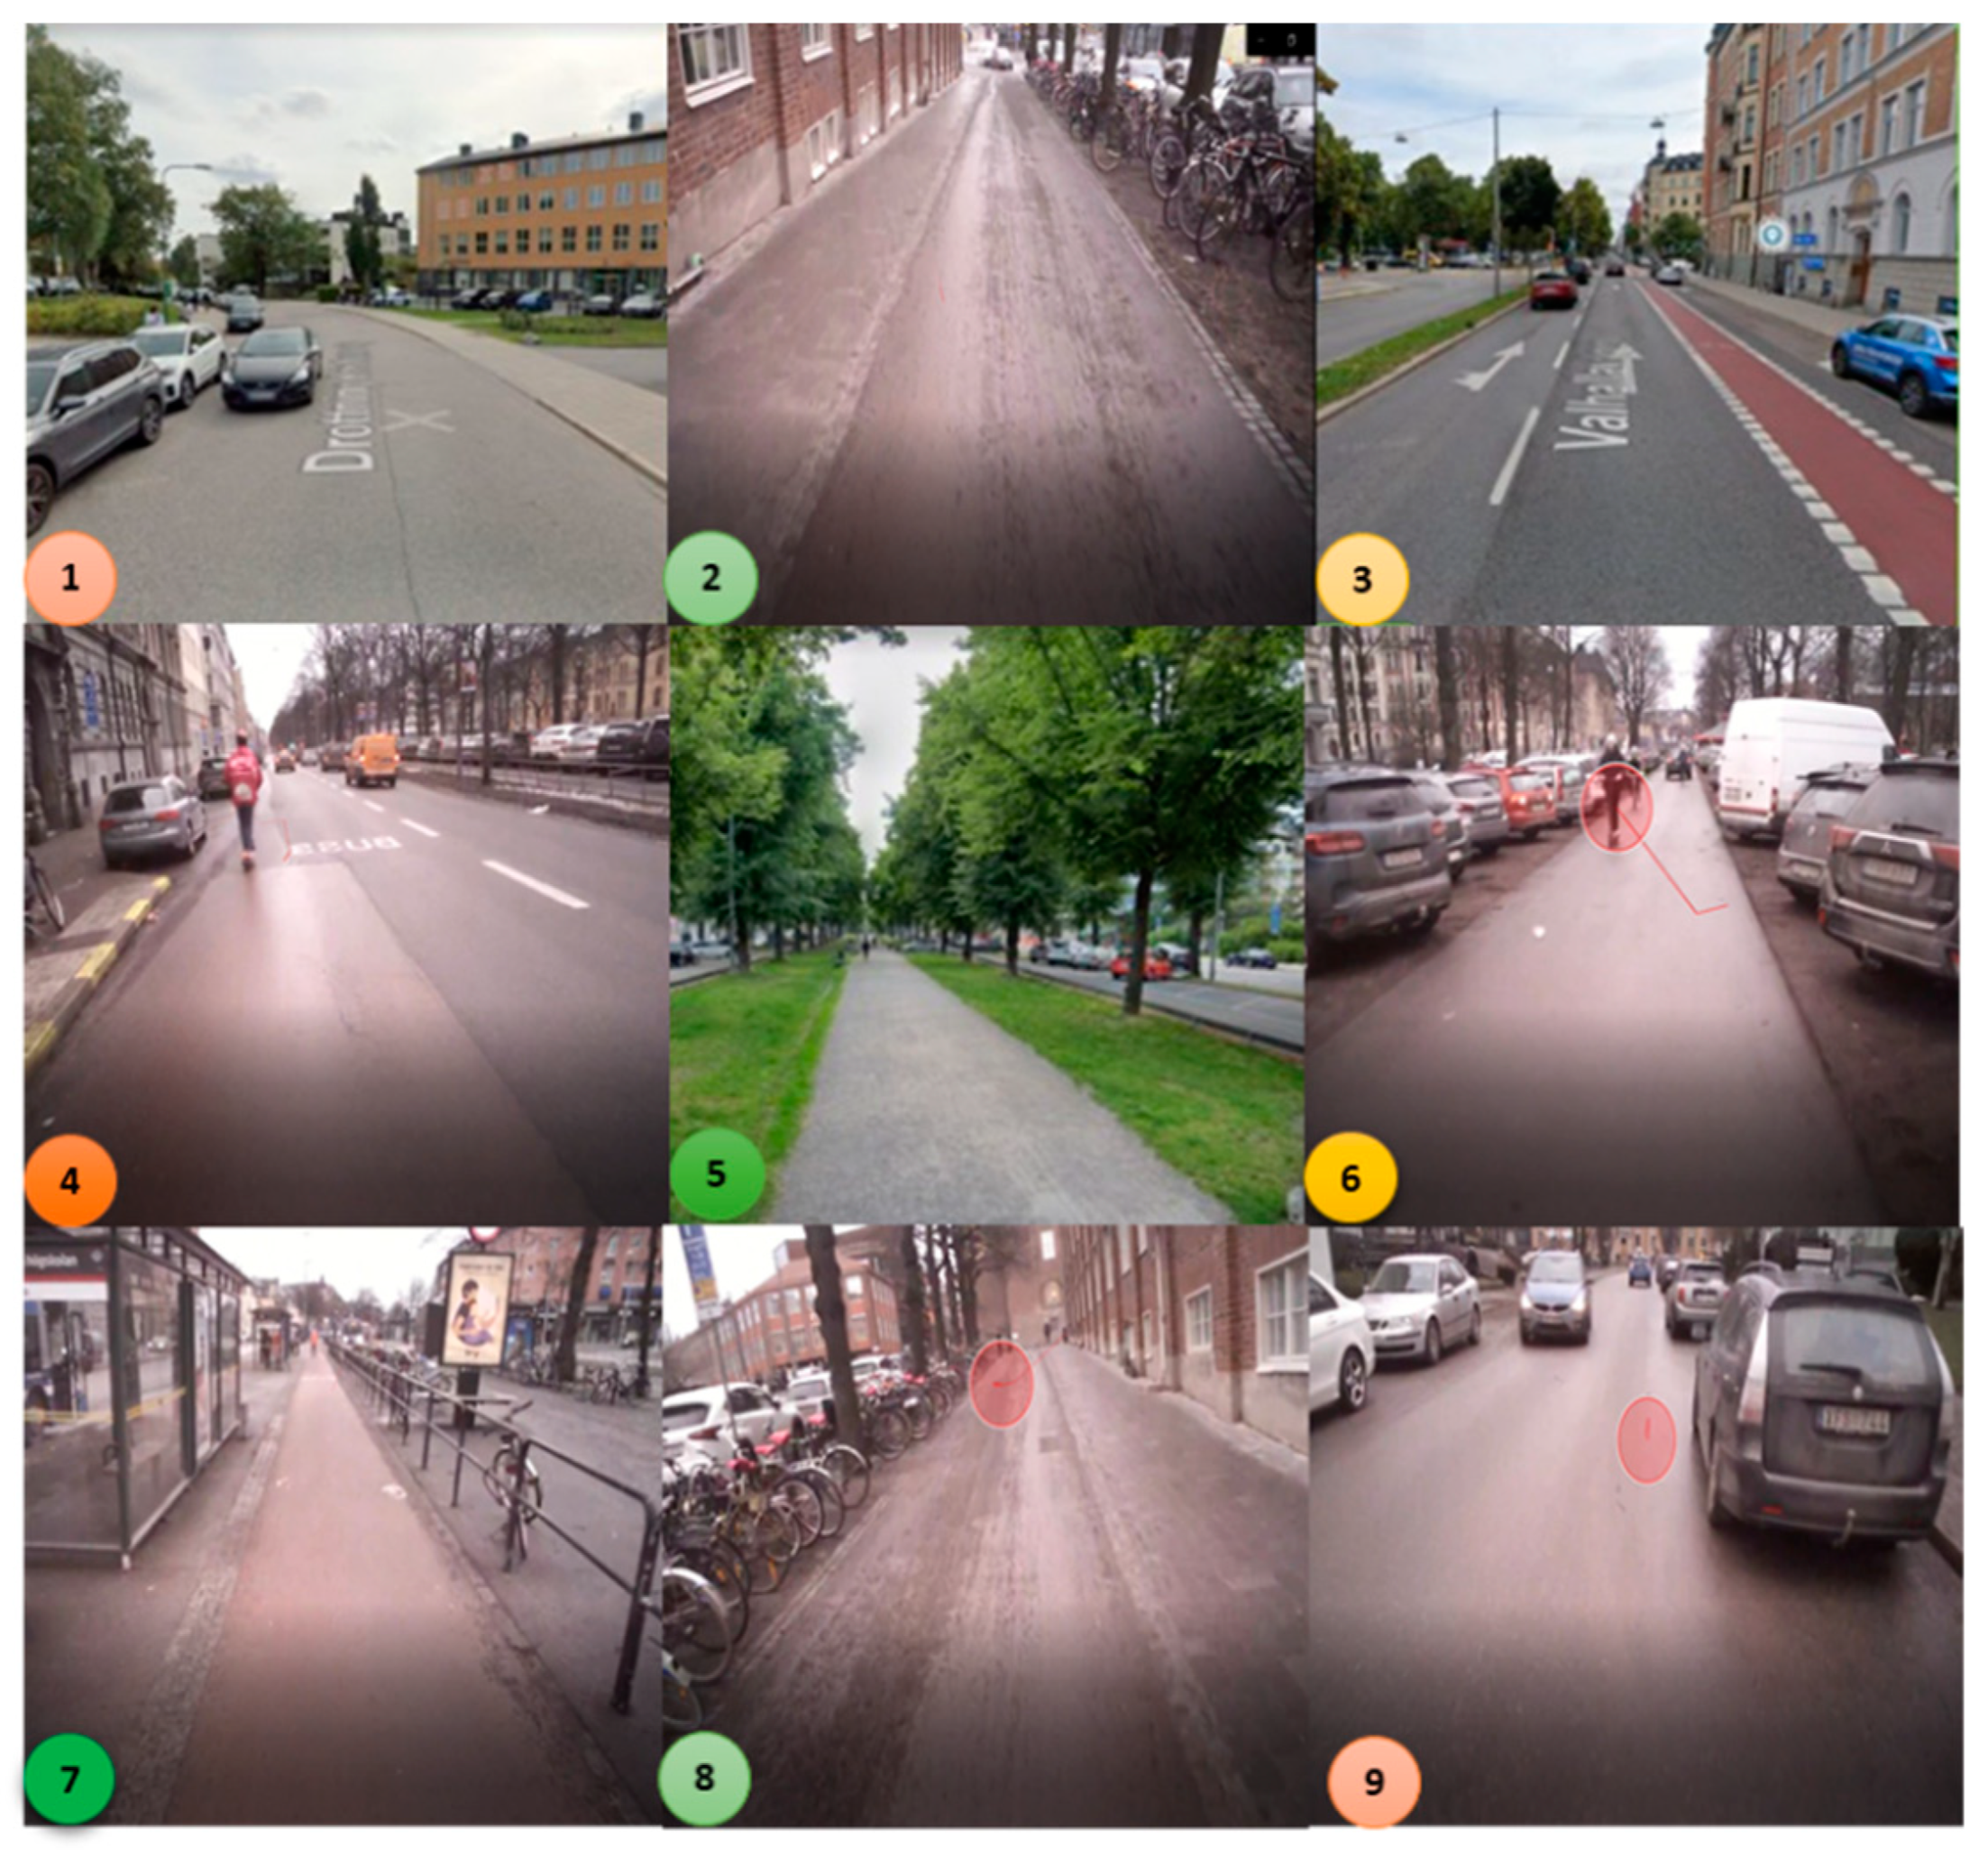
  • Segments 1 and 9: It is 565 m in length and is composed of a shared-use path where participants ride on a roadway not marked as a bicycle lane, but it is open to them to cycle next to the other vehicles. Segment 9 is the return segment.
  • Segments 2 and 8: It is 185 m in length, and above 1.2 m in width. It is composed of a bicycle path connecting segment 1 to segment 3. It is a declined slope. Segment 8 is the same segment of 2, but it is the return path to the start point, so the slope is uphill in this case.
  • Segment 3: It is 630 m in length and is composed of a separate bicycle lane without physical safety barriers. This segment starts immediately after crossing the bicycle path from segment 2. It is a straight lane.
  • Segment 4: It is 370 m in length and is composed of a shared bicycle–bus lane. This lane is not separated from vehicle traffic. It is also not designated and marked as a bicycle lane, but it is open to bicycles, motorcycles, E-scooters, and bus travel.
  • Segment 5: It is 575 m in length and 5 m in width. It is composed of an off-street bike path and separated from vehicle traffic but shared with pedestrians and other road users such as E-scooters. This segment passes between trees.
  • Segment 6: It is 285 m in length and 5 m in width. This segment passes between diagonal parking lots on both sides. It is composed of an off-street bike path and is separated from vehicle traffic but shared with pedestrians and other road users such as E-scooters and cars leaving their parking lots.
  • Segment 7: It is 140 m in length, and above 1.2 m in width. It is composed of a bicycle path connecting segment 6 to segment 8.

Observed Road Features and Data

The risk factors and their level of occurrence within each road segment are identified. The average demographic characteristics of the participants were as follows: male, aged 26–49 years, and with average cycling experience. In addition, it was identified that they had moderate traffic violations and were moderately inattentive while driving. The weather during the ride was foggy and the road surface was frozen. The characteristics and results of measurements and evaluations are included in Table 9, providing an overview of the observed features, cyclist behavior, and environmental factors across the entire route.
The calculation of the risk index for each segment, along with their associated risk ranges, is shown in Table 9.

3.3. Comparing Risk Index with Objective Measures

3.3.1. Statistical Analysis

To evaluate the success and validity of the risk index, objective data based on accident data records from Cambridge, UK are used. Detailed accident data were sourced from police reports, specifically the Department for Transport’s/police STATS19 database, covering the period from 1999 to 2022. Furthermore, CycleStreets [42] provides accident data through visualization on online street maps. So, the frequency of bicycle accidents for seventeen segments in the Cambridge area is collected from 2015 to 2020, as shown in Table 10. The corresponding risk indexes (RI) are also calculated using Equation (5) by observing all their characteristics and features within each segment. These characteristics include factors related to infrastructure, weather conditions, and traffic conditions contributing to the risk assessment. The 2015–2020 timeframe is selected as the period of interest to cover recent changes in the area.
The starting point for this evaluation is applying Pearson’s chi-square test, a statistical test for categorical data, to investigate if the risk index is associated with the accidents’ occurrence [43]. Pearson’s chi-square is chosen due to its appropriateness in analyzing associations within categorical data as the risk index obtained in this study. This test is also well-suited for scenarios where the observations are independent as in the type of bicycle accident data. The use of this test is also supported by the number of observations. The assumption for applying Pearson’s chi-square test is that the expected frequency per category should be at least five. The number of observations of accidents in this study is higher than the minimum requirement, ensuring the validity of the test results. This selection is made after careful consideration of alternative methods, and Pearson’s chi-square is considered the most suitable option for ensuring the accuracy of the statistical analysis and the reliability of the results derived from it. The aim of conducting this test is to determine whether the high occurrence of bicycle accidents is significantly impacted by the risk index value. This analysis aimed to verify the following hypotheses:
  • Null Hypothesis (H0): The risk category of a road segment is independent of the likelihood of accidents occurring. The observed number of accidents in each category is expected to align with a uniform distribution.
  • Alternative Hypothesis (HA): The risk category is dependent on the likelihood of accident occurrence. There is an association between the risk level and accidents occurring.
The chi-square test is then applied by using the following Equation (6):
X 2 = O i E i 2 E i
where:
  • X2 is the chi-square test statistic;
  • ∑ is the summation operator;
  • Oi is the observed frequency of bicycle accidents for the i-th category;
  • Ei is the expected frequency of bicycle accidents for the i-th category;
  • i is the index that traverses all the categories compared in the chi-square test.
To check the validity of the hypothesis of uniform distribution, we assume that the frequency of bicycle accidents is equally distributed despite the risk index, meaning that Ei is = 20 for each category (Low = 20; Medium = 20, High = 20).
In this study, the degrees of freedom are equal to 2. This calculation is based on the number of rows minus 1 multiplied by the number of columns minus 1. Therefore, by considering a significance level (α) of 0.05, corresponding to a confidence level of 95%, it is commonly used in statistical analysis [43]. The obtained chi-square test statistic is 32.4.
To validate the statistical significance of the findings, we refer to the chi-square distribution table with 2 degrees of freedom at a 95% confidence level. This significance level has been widely used in various fields, including transportation research. It is chosen based on common practice in statistical analysis and on the appropriateness of hypothesis testing, providing a balance between Type I and Type II errors. This level allows for a reasonable threshold to assess the statistical significance of results while minimizing the risk of making a Type I error. The critical value extracted from this table is 5.991 [43]. This indicates a strong association between the risk category of road segments and the occurrence of bicycle accidents. In this case, the statistic test of a value of 32.4 significantly exceeds the critical value. This indicates that there is a relationship between the risk index and bicycle accident data occurrence. The association is further supported by a very low (p < 0.05), indicating high statistical significance and leading to the rejection of the null hypothesis. This outcome provides evidence that the risk categorization (Low, Medium, High) is associated with the number of accidents. High-risk roads have more accidents than expected, which supports the validity of the risk index, as evidenced by the rejection of the null hypothesis.

3.3.2. Assessing Risk Index Relationship with Bicycle Accident Data

In addition to the chi-square analysis, Cramer’s V is also calculated to measure the strength of the association between the risk index and the frequency of bicycle accidents. It is used in the context of a chi-square test, and it is a measure for quantifying the effect size of this association [43]. Cramer’s V is used to assess the practical significance of the association. Equation (7) presents Cramer’s V:
Cramer s   V = X 2 / n / min c 1 ,   r 1
where:
  • X2 is the chi-square test statistic;
  • n is the total sample size;
  • r is the number of rows;
  • c is the number of columns.
Cramer’s V ranges between 0 and 1, where 0 indicates no association, and 1 indicates a perfect association based on the degrees of freedom. The calculation yields a Cramer’s V value of 0.52. Table 11 guides the interpretation of Cramer’s V, indicating the level of association between two variables based on the degrees of freedom [43]. In our case, the degree of freedom is 2 as explained before. Therefore, by referring to Table 11, the obtained Cramer’s V is greater than 0.35, indicating a large association between the two variables. It can be concluded that there is a strong relationship between the risk category of a road segment and the occurrence of accidents. This finding provides further validation that the risk index meaningfully categorizes road segments in terms of accident risk. This validation confirms that this risk index can be used to assess road segments for bicycle safety within the city and to develop appropriate risk mitigation strategies accordingly. This risk index can also inform the policy makers in making powerful decisions related to road safety.

4. Discussion

The segment with the highest risk index is segment 4, where there are no dedicated bike lanes, and participants share the same lane with buses and cars. Post-experiment surveys showed that most participants selected segment 4 as the least safe area, matching with the elevated risk index obtained. Moreover, our analysis involved observing various types of potentially risky accidents. The participants might encounter four different types of risky accidents during their bike riding: vehicle/pedestrian collisions, lane departure, rollover, and skidding based on the observations and the data recorded by the sensors concerning steering angle, speed, and acceleration. These types of accidents were categorized by the respective road segments. Therefore, the safety rating term is introduced to compare it with the risk index and to validate the effectiveness of the risk index formula.

4.1. Risk Index Evaluation Based on Participants’ Responses and Observations

The participants’ responses to the survey and the observed accident types in the experiments conducted in Sweden [4] were used to measure the safety level of a road segment. Safety rating categories, including unacceptable, tolerable, average, and acceptable, were chosen to provide an assessment of different road segments. These categories were derived from a detailed analysis of participant responses and aligned with the observed accident types, as summarized in Table 12. Even within the context of riding on the same road layout and under similar weather conditions, participants were recognized for the diversity in their backgrounds, driving experiences, and perceived level of risks based on the developed questionnaire. Their responses may vary in selecting safety ratings based on their personal feelings and interpretations. To further validate the qualitative data, the dynamic movement of participants’ bicycles was observed to analyze parameters such as steering, speed, and deceleration. Through detailed video analysis and parameters analysis, potential accident cases were identified, allowing us to correlate these observations with participants’ perceived safety ratings. Unacceptable means that the highest number of participants chose this road area as the least safe and could be involved in risk accidents up to 4. Tolerable means that the participants chose this road area as the third least safe and could be involved in risk accidents up to 3 based on observations. Average means that the participants chose this road area as the second least safe and could be involved in risk accidents up to 2 based on observations. Acceptable means that the participants chose this road area as the safest and could be involved in risk accidents up to 1 based on observations. Table 13 shows a reasonable match between the road safety rating technique and the risk index obtained for segments 1, 2, 4, 5, 7, 8, and 9. A reasonable match presents alignment between the safety rating and the calculated risk index. This alignment is indicated by 78%, showing the consistency of participants’ responses and potential accident types observation with the risk index for all segments. On the other hand, the values for the remaining segments are approximately matching. Therefore, this confirms the validity and reliability of the proposed formula due to the alignment percentage obtained.
The risk index is validated by comparing its value with the perceived level of safety of participants and bicycle accident data. The chi-square test was used to confirm the relationship between the risk index and bicycle accident data occurrence at a 95% significance level (p < 0.05). Cramer’s V was also used to determine the strength of this relationship, indicating a strong correlation between the risk index and accident data.
The combination of quantitative and qualitative methods strengthens the validation process of RI. This validation confirms that this risk index can be used to assess road segments for bicycle safety within the city and to develop appropriate risk mitigation strategies accordingly. This risk index can also inform policy makers in making powerful decisions related to road safety.

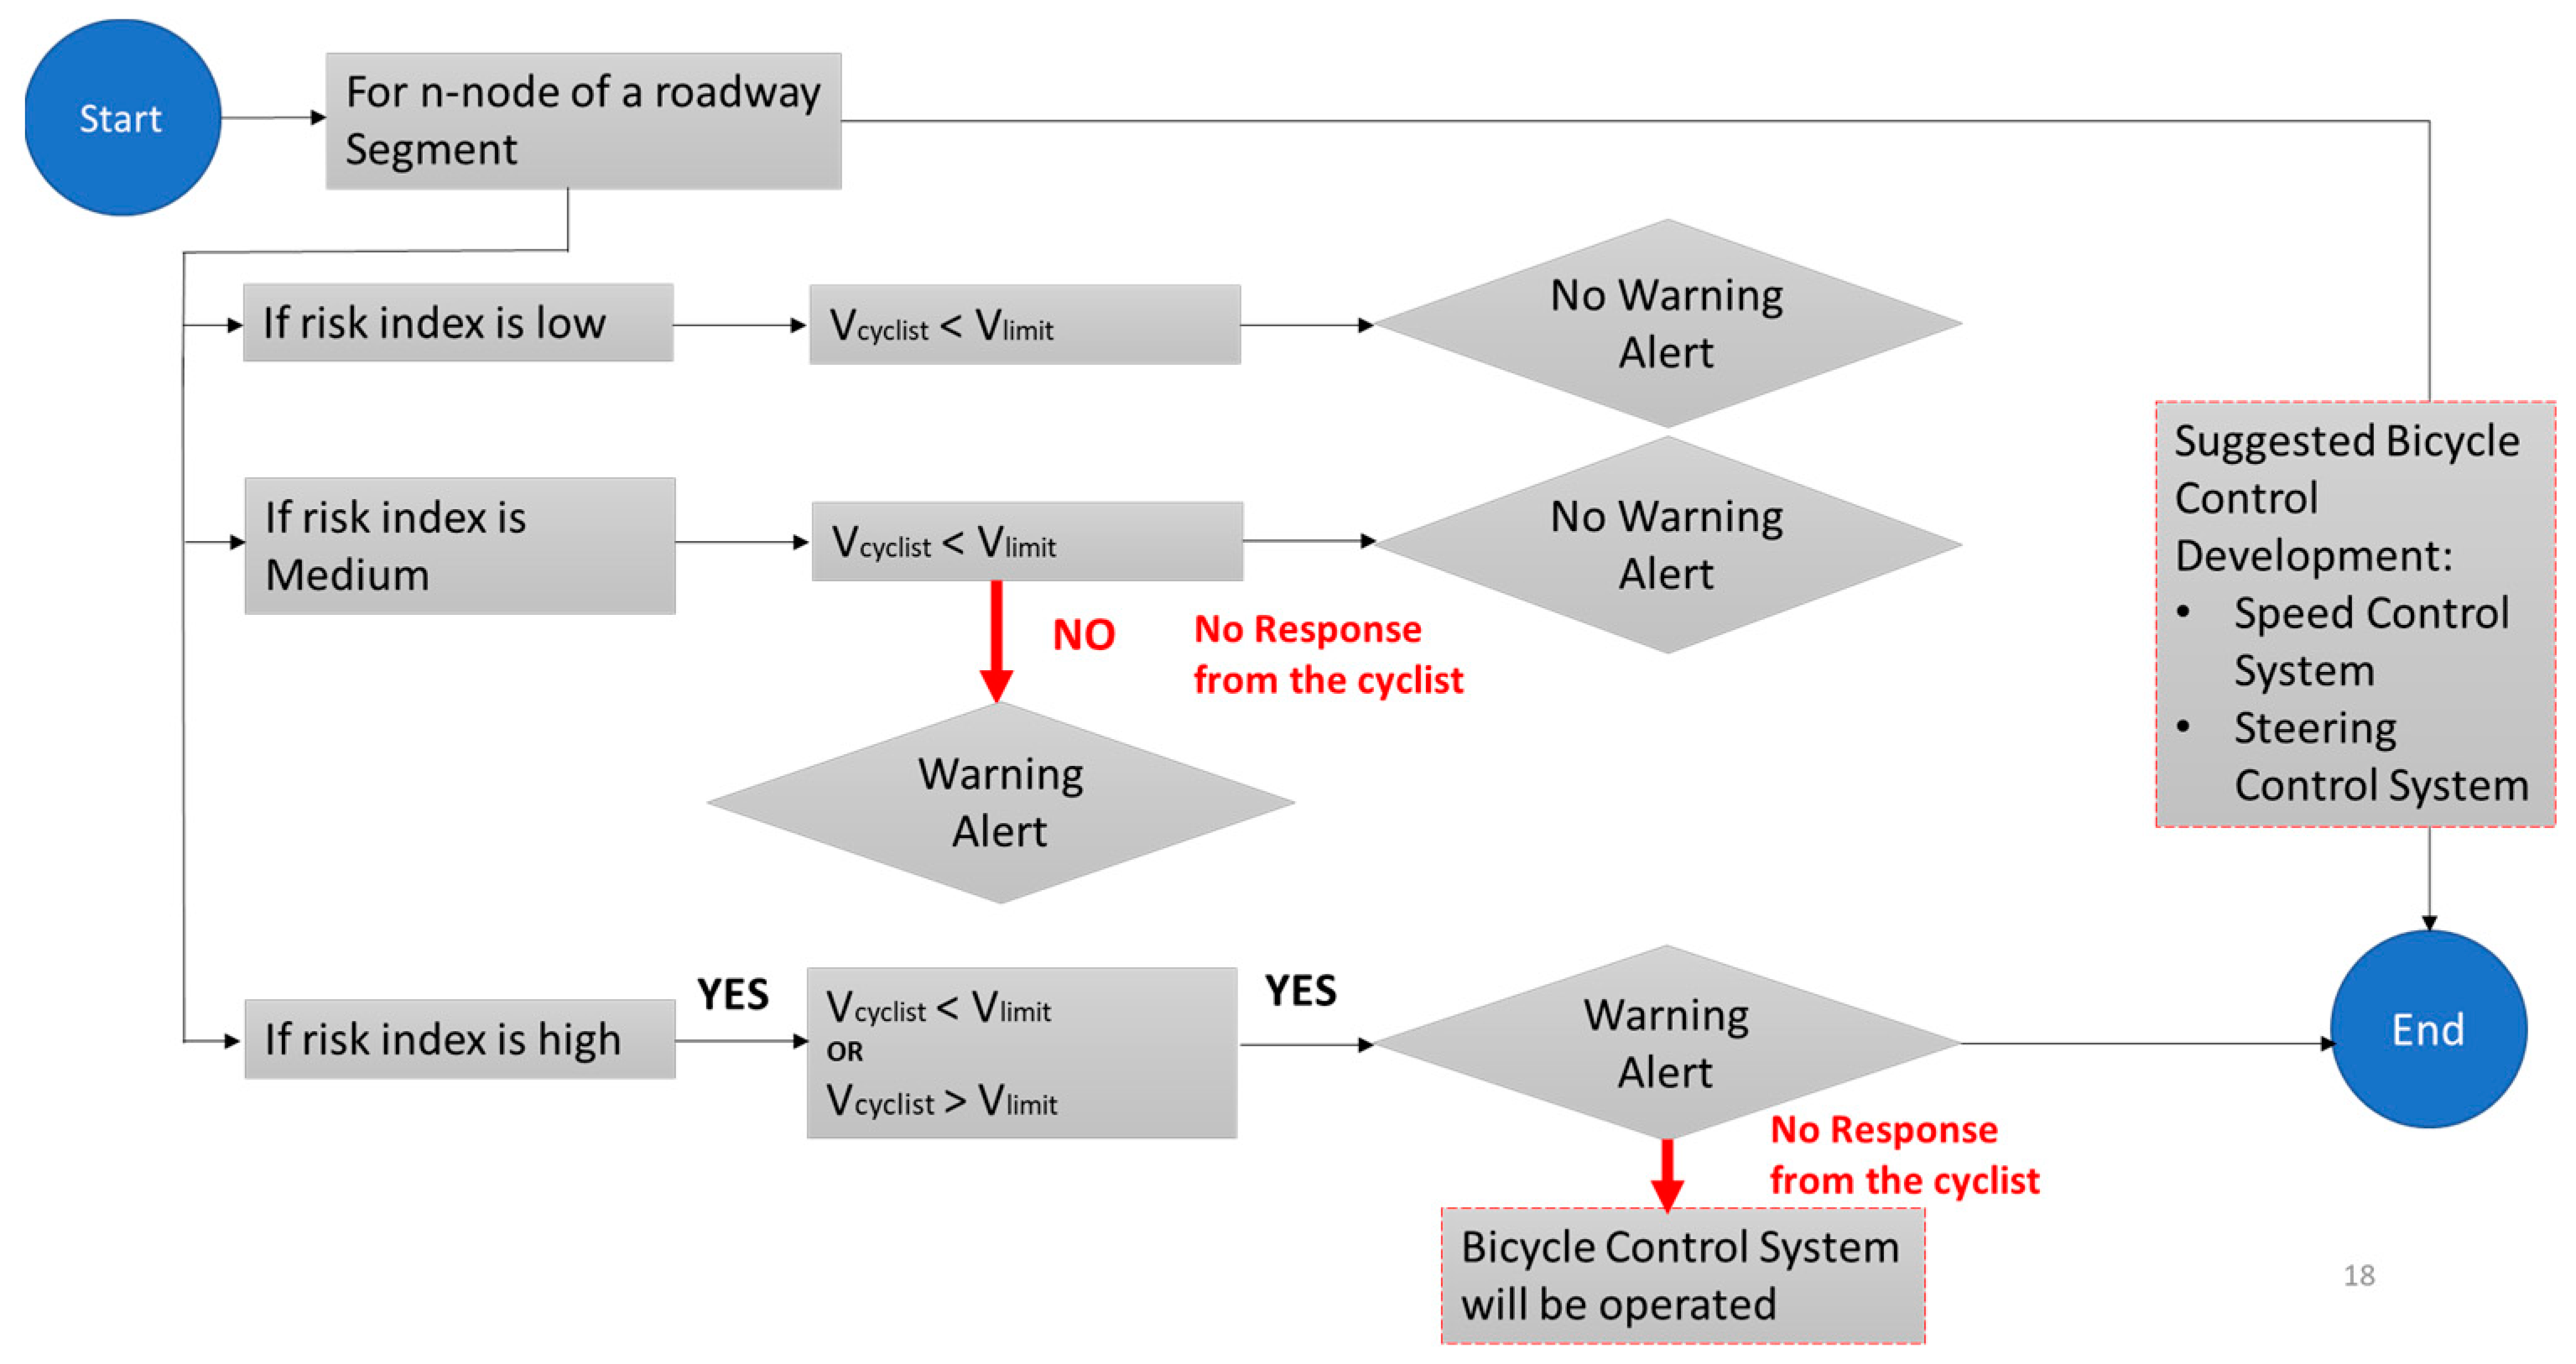
4.2. Alert Tool Development

Given the favorable outcomes of the risk index formula, our purpose extends beyond measuring only the degree of risk associated with a road segment. We aim to rely on the risk index as a proactive tool by integrating it into maps to highlight locations with medium and high-risk indexes. To pursue this goal, a warning alert tool is proposed to be developed that depends on the risk index value and the cyclist’s speed. This real-time warning alert will notify cyclists of the risks associated with riding on the road segment, helping them prevent road accidents in the future. Cyclists can react properly in advance. The development of a warning tool is illustrated in Figure 5. The warning alert message will be sent to cyclists under specific circumstances, such as if the risk index is medium, and the cyclist’s speed exceeds the predefined limit speed. Moreover, the warning alerts will also be activated if the risk index is high, irrespective of the cyclist’s speed. In cases where cyclists may fail to react to these alerts, a bicycle control system will be operated. Different types of controllers are under development to mitigate specific risks that cyclists might face.

4.3. Future Research Considerations

In our purpose to improve bicycle safety, a bicycle simulator is prepared and set up in the PICS-L laboratory at UGE, France. This simulator serves as a tool to conduct experiments to understand and assess the experience of the participants, the risks they face, and their behavior. Participants will be invited and will be immersed in diverse scenarios. They will fill out pre-surveys prior to the simulations, and post questionnaires to share their experiences, the potential risks that they have faced, contributing factors, riding comfort, etc. Their behaviors will also be analyzed, and any incidents the participants encounter while riding (types of accidents/near misses, locations, reasons behind them, etc.) will be recorded. The primary purpose of this work is to validate and refine the risk index.
The bicycle simulator is placed as a real bicycle on a platform, allowing participants to maneuver as if they are cycling in reality, as presented in Figure 6. It is equipped with a model to generate dynamic variables during the ride such as speed, acceleration, steering angle, deceleration, position, pedal forces, etc.

5. Conclusions

An effective framework and tool for producing a risk index to assess road safety and reduce potential accidents is developed in this paper. Municipalities, decision makers, or engineers can use this quantifiable and validated index to evaluate and improve road layouts. This paper describes a systematic process to determine the main risk factors and their severity that influence cyclist safety. The likelihood and impact of identified risk factors are assessed in order to prioritize and weight them, ranking them from the most critical to the least critical risks. The risk index was developed and tested for a road in Stockholm, Sweden, dividing it into segments and defining its characteristics according to the factors identified. The validity of the risk index was also evaluated by comparing results with bicycle accident frequency using the chi-square test. The measure of strength was used to determine the relationship between risk index and bicycle accident frequency. Different segments were ranked according to both the risk index and accident frequency, with the results indicating a strong relationship at a 95% confidence level.
The robust validation and quantifiable type of risk index help support bicycle safety analysis and assess real road scenarios. High-risk road segments can be identified and added to the cycle city maps, enabling the development of a real warning system for cyclists.
The novelty of this research study lies in the introduction of a risk index that includes risk factors identified through accident data analysis, and the weighting calculation based on the AHP method, combining both qualitative and quantitative methods. The development of risk index including cyclist behavior is also new and sets it apart from current practices in the literature.
While this risk index represents a significant advancement in risk assessment techniques, it is essential to acknowledge its limitations. One of the essential limitations of this risk index is that it is based primarily on the percentage probability of accidents related to risk factors collected by researchers over the years, and not entirely on actual accident data from countries. This is because of limited access to reliable data, and not all countries collect the probability of occurrence of cycling precisely and consider all risk factors. This paves the way for future research to focus on the in-depth observation of these risk factors in upcoming activities related to risk assessment methodologies.

Author Contributions

Conceptualization, L.A., H.I., F.D.C. and C.L.;methodology, L.A. and H.I.; validation, L.A., H.I., F.D.C. and C.L.; formal analysis, L.A.; investigation, L.A., H.I. and C.L.; writing—original draft preparation, L.A.; writing—review and editing, L.A., H.I., F.D.C. and C.L.; visualization, L.A.; supervision, H.I., C.L. and F.D.C.; project administration, H.I., C.L. and F.D.C.; funding acquisition, H.I. and C.L. All authors have read and agreed to the published version of the manuscript.

Funding

This project has received funding from the European Union’s Horizon 2020 research and innovation programme under the Marie Skłodowska-Curie COFUND grant agreement No 101034248.Infrastructures 09 00014 i001

Data Availability Statement

The data presented in this study are available on request from the corresponding author (L.A.; [email protected]).

Conflicts of Interest

The authors declare no conflicts of interest. The funders had no role in the design of the study; in the collection, analyses, or interpretation of data; in the writing of the manuscript; or in the decision to publish the results.

Appendix A

Table A1. High-level bicycle indexes summary used in the literature review.
Index/Risk AssessmentMajor Attributed FactorsMethodologyOutputs
Bicycle Level of Service
  • Segment Type
  • Bike Lane Presence
  • Roadway Widths
  • Traffic Speed/Volume
  • Pavement Condition, etc.
  • Observation Model based on comfort/safety
  • Regression Model
Grade (A–F)
Bicycle Level of Stress
  • Segment Type
  • Alongside Parking Lane Existence
  • Street Width (Including Bike Lane)
  • Traffic Speed/Volume
  • Bike Lane Blockage
  • Observation Model
  • Classification based on comfort criteria
Classification level
(LTS 1–4)
Bikebality
  • Roadway Type
  • Traffic Speed/Volume
  • Gradient
  • Bike Lanes Presence/Width
  • Traffic Lights/Sign Presence
  • Riding Frequency/Purpose
  • Surveying
  • Area Evaluation
Score/Value
Safety Performance Factors
  • Traffic Volume
  • Roadway Length
  • Number of Lanes
  • Access Points
  • Curvature
  • Grade
  • Surface Condition
  • Previous Crash History
  • Lighting
  • Regression Model Analysis based on crash data
Expected number
of crashes (Value)
Bicycle Safety Index
  • Traffic Volume
  • Speed Limit
  • Traffic Lanes and Widths
  • Traffic Controllers
  • Bike Lane Presence
  • On-street Parking Presence
  • Cyclist Maneuvers
  • Observation Model for Intersections
  • Regression Model
Value

References

  1. Eurostat. Road Accident Fatalities—Statistics by Type of Vehicle; CARE Database; EU: Brussels, Belgium, 2022. [Google Scholar]
  2. European Road Safety Observatory. Road Safety Thematic Report—Cyclists; European Road Safety Observatory, European Commission, Directorate General for Transport: Brussels, Belgium, 2022. [Google Scholar]
  3. Billot-Grasset, A.; Amoros, E.; Hours, M. How cyclist behavior affects bicycle accident configurations? Transp. Res. Part F Traffic Psychol. Behav. 2016, 41, 261–276. [Google Scholar] [CrossRef]
  4. Shoman, M. Effects of Road Surface Characteristics and Geometries on Safer User Behavior. Ph.D. Thesis, University of Gustave Eiffel, Champs-sur-Marne, France, 2022. [Google Scholar]
  5. Ma, C.; Yang, D.; Zhou, J.; Feng, Z.; Yuan, Q. Risk Riding Behaviors of Urban E-Bikes: A Literature Review. Int. J. Environ. Res. Public. Health 2019, 16, 2308. [Google Scholar] [CrossRef] [PubMed]
  6. National Highway Traffic Safety Administration (NHTSA). Bicycle Safety; United States Department of Transportation: Washington, DC, USA, 2022. [Google Scholar]
  7. Silla, A.; Leden, L.; Rämä, P.; Scholliers, J.; Van Noort, M.; Bell, D. Can cyclist safety be improved with intelligent transport systems? Accid. Anal. Prev. 2017, 105, 134–145. [Google Scholar] [CrossRef] [PubMed]
  8. Landis, B.W.; Vattikuti, V.R.; Brannick, M.T. Real-Time Human Perceptions: Toward a Bicycle Level of Service. Transp. Res. Rec. J. Transp. Res. Board 1997, 1578, 119–126. [Google Scholar] [CrossRef]
  9. Transportation Research Board. Highway Capacity Manual, 6th Edition: A Guide for Multimodal Mobility Analysis; The National Academies Press: Washington, DC, USA, 2016. [Google Scholar] [CrossRef]
  10. Chen, C.; Anderson, J.C.; Wang, H.; Wang, Y.; Vogt, R.; Hernandez, S. How bicycle level of traffic stress correlate with reported cyclist accidents injury severities: A geospatial and mixed logit analysis. Accid. Anal. Prev. 2017, 108, 234–244. [Google Scholar] [CrossRef]
  11. Grigore, E.; Garrick, N.; Fuhrer, R.; Ing, K.; Axhausen, W. Bikeability in Basel. Transp. Res. Rec. J. Transp. Res. Board 2019, 2673, 607–617. [Google Scholar] [CrossRef]
  12. American Association of State Highway and Transportation Officials (AASHTO). Guide for the Development of Bicycle Facilities; AASHTO: Washington, DC, USA, 2012. [Google Scholar]
  13. Carter, D.L.; Hunter, W.W.; Zegeer, C.V.; Stewart, J.R.; Huang, H. Bicyclist Intersection Safety Index. Transp. Res. Rec. J. Transp. Res. Board 2007, 2031, 18–24. [Google Scholar] [CrossRef]
  14. Adinarayana, B.; Mir, M.S. Development of Bicycle Safety Index Models for Safety of Bicycle Flow at 3-Legged Junctions on Urban Roads under Mixed Traffic Conditions. Transp. Res. Procedia 2020, 48, 1227–1243. [Google Scholar] [CrossRef]
  15. Yan, X.; Ma, M.; Huang, H.; Abdel-Aty, M.; Wu, C. Motor vehicle–bicycle crashes in Beijing: Irregular maneuvers, crash patterns, and injury severity. Accid. Anal. Prev. 2011, 43, 1751–1758. [Google Scholar] [CrossRef]
  16. Robartes, E.; Chen, T.D. The effect of crash characteristics on cyclist injuries: An analysis of Virginia automobile-bicycle crash data. Accid. Anal. Prev. 2017, 104, 165–173. [Google Scholar] [CrossRef]
  17. Wage, O.; Bienzeisler, L.; Sester, M. Risk Analysis Of Cycling Accidents Using a Traffic Demand Model. Int. Arch. Photogramm. Remote Sens. Spat. Inf. Sci. 2022, XLIII-B4-2022, 427–434. [Google Scholar] [CrossRef]
  18. Rasch, A.; Moll, S.; López, G.; García, A.; Dozza, M. Drivers’ and cyclists’ safety perceptions in overtaking maneuvers. Transp. Res. Part F Traffic Psychol. Behav. 2022, 84, 165–176. [Google Scholar] [CrossRef]
  19. Cicchino, J.B.; McCarthy, M.L.; Newgard, C.D.; Wall, S.P.; DiMaggio, C.J.; Kulie, P.E.; Arnold, B.N.; Zuby, D.S. Not all protected bike lanes are the same: Infrastructure and risk of cyclist collisions and falls leading to emergency department visits in three U.S. cities. Accid. Anal. Prev. 2020, 141, 105490. [Google Scholar] [CrossRef] [PubMed]
  20. Cyclerap. Methodology Factsheet; The International Road Assessment Programme, iRAP: London, UK, 2022. [Google Scholar]
  21. Vanparijs, J.; Van Cauwenberg, J.; Panis, L.I.; Van Hecke, E.; Gillis, D.; Gautama, S.; Meeusen, R.; de Geus, B. Cycling exposure and infrastructural correlates in a Flemish adolescent population. J. Transp. Health 2020, 16, 100812. [Google Scholar] [CrossRef]
  22. Schepers, P.; Wolt, K.K. Single-bicycle crash types and characteristics. Cycl. Res. Int. 2012, 2, 119–135. [Google Scholar]
  23. Rivara, F.P.; Thompson, D.C.; Thompson, R.S. Epidemiology of bicycle injuries and risk factors for serious injury. Inj. Prev. 2015, 21, 47–51. [Google Scholar] [CrossRef]
  24. Teschke, K.; Frendo, T.; Shen, H.; Harris, M.A.; Reynolds, C.C.O.; Cripton, P.A.; Brubacher, J.; Cusimano, M.D.; Friedman, S.M.; Hunte, G.; et al. Bicycling crash circumstances vary by route type: A cross-sectional analysis. BMC Public Health 2014, 14, 1205. [Google Scholar] [CrossRef]
  25. Vaiana, R.; Iuele, T.; Astarita, V.; Festa, D.C.; Tassitani, A.; Rogano, D.; Zaffino, C. Road Safety Performance Assessment: A New Road Network Risk Index for Info Mobility. Procedia Soc. Behav. Sci. 2014, 111, 624–633. [Google Scholar]
  26. American Association of State Highway and Transportation Officials (AASHTO). Highway Safety Manual, 1st ed.; AASHTO: Washington, DC, USA, 2010. [Google Scholar]
  27. Zeng, H.; Fontaine, M.D.; Smith, B.L. Estimation of the Safety Effect of Pavement Condition on Rural, Two-Lane Highways. Transp. Res. Rec. J. Transp. Res. Board 2014, 2435, 45–52. [Google Scholar] [CrossRef]
  28. Harris, M.A.; Reynolds, C.C.O.; Winters, M.; Cripton, P.A.; Shen, H.; Chipman, M.L.; Cusimano, M.D.; Babul, S.; Brubacher, J.R.; Friedman, S.M.; et al. Comparing the effects of infrastructure on bicycling injury at intersections and non-intersections using a case–crossover design. Inj. Prev. 2013, 19, 303–310. [Google Scholar] [CrossRef]
  29. Twaddle, H. Analysis and Modelling of the Operational and Tactical Behaviour of Bicyclists. In UR:BAN Human Factors in Traffic; Bengler, K., Drüke, J., Hoffmann, S., Manstetten, D., Neukum, A., Eds.; Springer Fachmedien Wiesbaden: Wiesbaden, Germany, 2018; pp. 325–345. [Google Scholar]
  30. Department for Transport. Reported Road Casualties in Great Britain: Pedal Cycle Factsheet, 2020; Road Safety Statistics, National Statistics: Newport, UK, 2021. [Google Scholar]
  31. de Geus, B.; Vandenbulcke, G.; Panis, L.I.; Thomas, I.; Degraeuwe, B.; Cumps, E.; Aertsens, J.; Torfs, R.; Meeusen, R. A prospective cohort study on minor accidents involving commuter cyclists in Belgium. Accid. Anal. Prev. 2012, 45, 683–693. [Google Scholar] [CrossRef] [PubMed]
  32. Johnson, M.; Newstead, S.; Charlton, J.; Oxley, J. Riding through red lights: The rate, characteristics and risk factors of non-compliant urban commuter cyclists. Accid. Anal. Prev. 2011, 43, 323–328. [Google Scholar] [CrossRef] [PubMed]
  33. Placek, M. Cyclists Killed in Traffic Accidents in the European Union (EU-28); Statista Research Department, Transportation & Logistics, Vehicles and Road Traffic, EU: Brussels, Belgium, 2021. [Google Scholar]
  34. Romanow, N.T.R.; Couperthwaite, A.B.; McCormack, G.R.; Nettel-Aguirre, A.; Rowe, B.H.; Hagel, B.E. Environmental Determinants of Bicycling Injuries in Alberta, Canada. J. Environ. Public Health 2012, 2012, 487681. [Google Scholar] [CrossRef] [PubMed]
  35. Barros, A.J.D.; Amaral, R.L.; Oliveira, M.S.B.; Lima, S.C.; Gonçalves, E.V. Acidentes de trânsito com vítimas: Sub-registro, caracterização e letalidade. Cad. Saúde Pública 2003, 19, 979–986. [Google Scholar] [CrossRef]
  36. Fine, W.T. Mathematical evaluations for controlling hazards. J. Saf. Res. 1971, 3, 157–166. [Google Scholar]
  37. Sun, Y.; Zhao, H.; Chen, Z.; Zheng, X.; Zhao, M.; Liang, B. Fuzzy model-based multi-objective dynamic programming with modified particle swarm optimization approach for the balance control of bicycle robot. IET Control Theory Appl. 2022, 16, 7–19. [Google Scholar] [CrossRef]
  38. Lavanya, N.; Malarvizhi, T. Risk analysis and management: A vital key to effective project management. In Proceedings of the PMI® Global Congress 2008—Asia Pacific, Sydney, Australia, 3–5 March 2008; Project Management Institute: Newtown Square, PA, USA, 2008. [Google Scholar]
  39. Saaty, T.L. Fundamentals of Decision Making and Priority Theory with the Analytic Hierarchy Process; RWS Publications: Pittsburgh, PA, USA, 2000; Volume 6. [Google Scholar]
  40. Sun, Y.; Fang, D.; Wang, S.; Dai, M.; Lv, X. Safety Risk Identification and Assessment for Beijing Olympic Venues Construction. J. Manag. Eng. 2008, 24, 40–47. [Google Scholar] [CrossRef]
  41. Ayad, L.; Imine, H.; Lantieri, C.; De Crescenzio, F. Risk Index Development for a Safer Cycling Environment. Living and Walking in Cities. In Proceedings of the XXVI International Conference LWC 2023, Brescia, Italy, 6–8 September 2023. [Google Scholar]
  42. Cycle Streets Ltd. Bicycle Routing & Advocacy Tools—For Cyclists, by Cyclists; City Intelligence; St John’s Innovation Centre: Cambridge, UK, 2009. [Google Scholar]
  43. Cohen, J. Statistical Power and Analysis for the Behavioral Sciences, 2nd ed.; Lawrence Erlbaum Associates: Hisdale, NJ, USA, 1988; pp. 79–80. [Google Scholar]
Figure 1. High-level risk index methodology.
Infrastructures 09 00014 g001
Figure 2. Risk Categories and components identification.
Infrastructures 09 00014 g002
Figure 3. Segments distinction within the route.
Infrastructures 09 00014 g003
Figure 4. Road segments.
Infrastructures 09 00014 g004
Figure 5. Warning alert development.
Infrastructures 09 00014 g005
Figure 6. Bicycle simulator setup.
Infrastructures 09 00014 g006
Table 1. Probability level of risk occurrence.
Probability LevelDefinitionPercent
Very LowThe accident occurs in exceptional circumstances due to the risk<10%
LowThe accident is likely to occur in low circumstances due to the risk10–30%
MediumThe accident may occur frequently due to the risk 31–60%
HighThe accident may occur in most circumstances due to the risk61–80%
Very HighThe accident occurrence is almost certain due to the risk>80%
Table 2. Impact level of risk.
Impact LevelDefinition
NegligibleLittle or no impact on cyclist safety
MinorMinor impact on cyclist safety, for example, first aid treatment
ModerateModerate impact on cyclist safety, for example, necessary treatment
SignificantSignificant impact on cyclist safety, for example, hospitalization required
MajorMajor impact on cyclist safety, for example, fatal accidents
Table 3. Risk matrix.
Severity
ImpactProbability Level
V. LowLowMediumHigh V. High
NegligibleV. LowLowLowMedium Medium
MinorLowLowMediumMedium Medium
ModerateMediumMediumMediumHighHigh
SignificantMediumHighHighV. HighV. High
MajorHighV. HighV. HighV. HighV. High
Table 4. Risk factors severity identification.
Risk FactorsComponentsSeverity
Facility Features
  • Facility Type
Very High
  • Facility Accesses
Very High
  • Obstacle Existence
High
  • Deficiency in Safety Barriers
Medium
Infrastructure Features
  • Bike Lane Width
Medium
  • Surface Structure Conditions
Very High
  • Curvature
High
  • Grade
High
  • Street Lighting
High
  • Signs
Medium
  • Pavement Marking
Medium
Cyclist Behavior and Demographics
  • Alcohol Consumption
Very High
  • Inattentiveness
Very High
  • Traffic Rules Breaking
Medium
  • Gender
Medium
  • Age
Medium
  • Cycling Experience Level
Low
Bicycle Use
  • Weather Conditions
High
  • Traffic Conditions
High
Table 5. Importance scale.
ValueImportance Scale of the Criteria
1When two criteria are equally important
2One criterion is equally to moderately important to the other
3One criterion is moderately important than the other
4One criterion is moderately to strongly important to the other
5One criterion is more strongly important than the other
6One criterion is strongly to very strongly important to the other
7One criterion is very strongly important than the other
8One criterion is very to extremely important to the other
9One criterion is extremely important than the other
Table 6. Weights of risk factors.
Facility FeaturesWeighting Factors
Facility Type0.277
Facility Accesses0.19
Obstacle Existence0.069
Deficiency in Safety Barriers0.031
0.568 1
Infrastructure FeaturesWeighting Factors
Lane Width0.0144
Surface Structure0.0818
Curvature0.0354
Grade0.0354
Street Lighting0.0354
Signs0.0144
Pavement Markings0.077
0.224 1
Cyclist BehaviorWeighting Factors
Age0.0111
Gender0.0111
Level of Experience0.0049
Breaking Traffic Rules0.0111
Inattention0.0479
Alcohol Use0.0479
0.134 1
Bicycle UseWeighting Factors
Weather Conditions0.037
Traffic Conditions0.037
0.074 1
1 Total value of each category.
Table 7. Risk index range.
Value0 < RI ≤ 0.30.3 < RI ≤ 0.6 0.6 < RI ≤ 1
RangeLowMediumHigh
Table 8. Level of occurrence of risk factors within the segment.
LowMediumHigh
Number of Occurrences1–34–5≥5
Vi0.250.51
Table 9. Risk index calculation for segment 1.
Road SegmentObserved/Collected Road Features
Data
Cyclist BehaviorBicycle UseRisk IndexRisk Range
1 and 9
  • Shared use path
  • Low uncontrolled access
  • Minor presence of obstacles
  • Absence of safety barriers
  • High presence of surface anomalies
  • Normal grade
  • No curvature
  • Fair condition of streetlights
  • Deficiency in signs
  • Deficiency in pavement markings
  • Medium Beaking Traffic Rules
  • Low to Medium Inattention
  • No Alcohol Consumption
  • Wet/icy surface
  • Low traffic
0.594Medium
2 and 8
  • Bicycle path
  • Low controlled access
  • Minor presence of obstacles
  • High presence of surface anomalies
  • Medium deficiency in barriers
  • Adequate lane width
  • Downhill grade in certain parts of the segment (uphill grade in the return route)
  • Low curvature
  • Fair condition of streetlights
  • Medium deficiency in signs
  • Presence of pavement markings
  • Medium Breaking Traffic Rules
  • Low to Medium Inattention
  • No Alcohol Consumption
  • Surface accumulated with snow
  • Low traffic
0.323Medium
3
  • Bicycle lane
  • High accesses
  • Intermediate presence of obstacles
  • Intermediate presence of surface anomalies
  • Absence of safety barriers
  • Adequate lane width
  • Normal grade
  • No curvature
  • Fair condition of streetlights
  • Deficiency in signs
  • Presence of pavement markings (not visible when the surface is covered with snow)
  • Medium Breaking Traffic Rules
  • Low to Medium Inattention
  • No Alcohol Consumption
  • Wet/icy surface
  • Medium traffic
0.58Medium
4
  • Shared use path (with bus)
  • Medium accesses
  • Intermediate presence of obstacles
  • Absence of safety barriers
  • Intermediate presence of surface anomalies
  • Normal grade
  • Medium presence of curvature
  • Fair condition of streetlights
  • Deficiency in signs
  • Deficiency in pavement markings
  • Medium Breaking Traffic Rules
  • Low to Medium Inattention
  • No Alcohol Consumption
  • Wet/icy surface
  • Medium traffic
0.645High
5
  • Bicycle path
  • Medium accesses
  • Intermediate presence of obstacles
  • High presence of surface anomalies
  • Absence of safety barriers
  • Adequate lane width
  • Normal grade
  • Low curvature
  • Fair condition of streetlights
  • Deficiency in signs
  • Deficiency in pavement markings
  • Medium Breaking Traffic Rules
  • Low to Medium Inattention
  • No Alcohol Consumption
  • Wet/icy surface
  • Waterlogged on the road
  • Medium traffic
0.4Medium
6
  • Bicycle path (diagonal parking lots on both sides)
  • High accesses
  • High presence of obstacles
  • High presence of surface anomalies
  • Absence of safety barriers
  • Adequate lane width
  • Normal grade
  • Low curvature
  • Fair condition of streetlights
  • Deficiency in signs
  • Deficiency in pavement markings
  • Medium Breaking Traffic Rules
  • Low to Medium Inattention
  • No Alcohol Consumption
  • Wet/icy surface
  • Waterlogged on the road
  • Medium traffic
0.527Medium
7
  • Bicycle path
  • Low controlled access
  • Minor presence of obstacles
  • Intermediate presence of surface anomalies
  • Presence of safety barriers
  • Adequate lane width
  • Normal grade
  • Low curvature
  • Fair condition of streetlights
  • Deficiency in signs
  • Presence of pavement markings
  • Medium Breaking Traffic Rules
  • Low to Medium Inattention
  • No Alcohol Consumption
  • Surface accumulated with snow
  • Low traffic
0.256Low
Table 10. Frequency of bicycle accidents in different road segments from 2015 to 2020.
RIObserved
Low2
Medium20
High38
Statistical Analysis
Chi-square Test32.4
Table 11. Carmer’s V interpretation.
Degrees of FreedomSmallMediumLarge
10.10.30.5
20.070.210.35 1
30.060.170.29
40.050.150.25
50.040.130.22
1 Indicates the large association between two variables for degrees of freedom = 2.
Table 12. Road safety rating.
Types of AccidentsParticipant ResponsesSafety Rating
4Least SafeUnacceptable
3Third Least SafeTolerable
2Second Least SafeAverage
1SafeAcceptable
Table 13. Risk index validation.
Participant Responses/Risks InvolvedSafety RatingRisk Index
1Slipping
Rollover
Lane Departure
Might involve in collision with vehicles
Third Least Safe
Tolerable to UnacceptableMedium
2Slipping
Rollover
Second Least Safe
AverageMedium
3Slipping
Rollover
Lane Departure
Might involve in collision with vehicles
Most Least Safe
UnacceptableMedium
4Slipping
Rollover
Safest
UnacceptableHigh
5Slipping
Rollover
Might involve in collision with pedestrians and vehicles
Second Least Safe
AverageMedium
6Slipping
Safest
Tolerable to AverageMedium
7Slipping
Rollover
AcceptableLow
Disclaimer/Publisher’s Note: The statements, opinions and data contained in all publications are solely those of the individual author(s) and contributor(s) and not of MDPI and/or the editor(s). MDPI and/or the editor(s) disclaim responsibility for any injury to people or property resulting from any ideas, methods, instructions or products referred to in the content.

