1. Introduction
In Japan, there are about 730,000 bridges with a length of 2 m or longer [
1], and many of these were built during a period of high economic growth. The ratio of aged bridges (50 years or older) was about 25% in March 2018. This is expected to rapidly increase to about 66% in 2033 [
2]. To take preventive countermeasures, bridges must be inspected and diagnosed routinely, and the soundness of bridges must be well understood. In 2014, the close visual inspection of all bridges was required every five years. By performing routine inspections, the most up-to-date status should be understood, and the information required to determine needed measures is acquired, thus making preventive maintenance management possible.
However, among local public organizations, there are some that have insufficient manpower relative to the number of bridges they must manage, as well as insufficient funding for maintenance. Thus, these organizations are unable to perform routine close visual inspections. In a questionnaire on mandating local public organizations to perform close visual inspections every five years [
3], insufficient funding and manpower were noted as problems with inspection tasks. In particular, in small municipalities (cities, wards, towns, and villages), there are not many civil engineers involved with bridge maintenance work, and the inspection costs that can be spent on each bridge are much lower compared to large-scale municipalities such as prefectures. Therefore, municipalities such as cities, towns, and villages have difficulty conducting continuous preventive maintenance owing to insufficient funding and manpower.
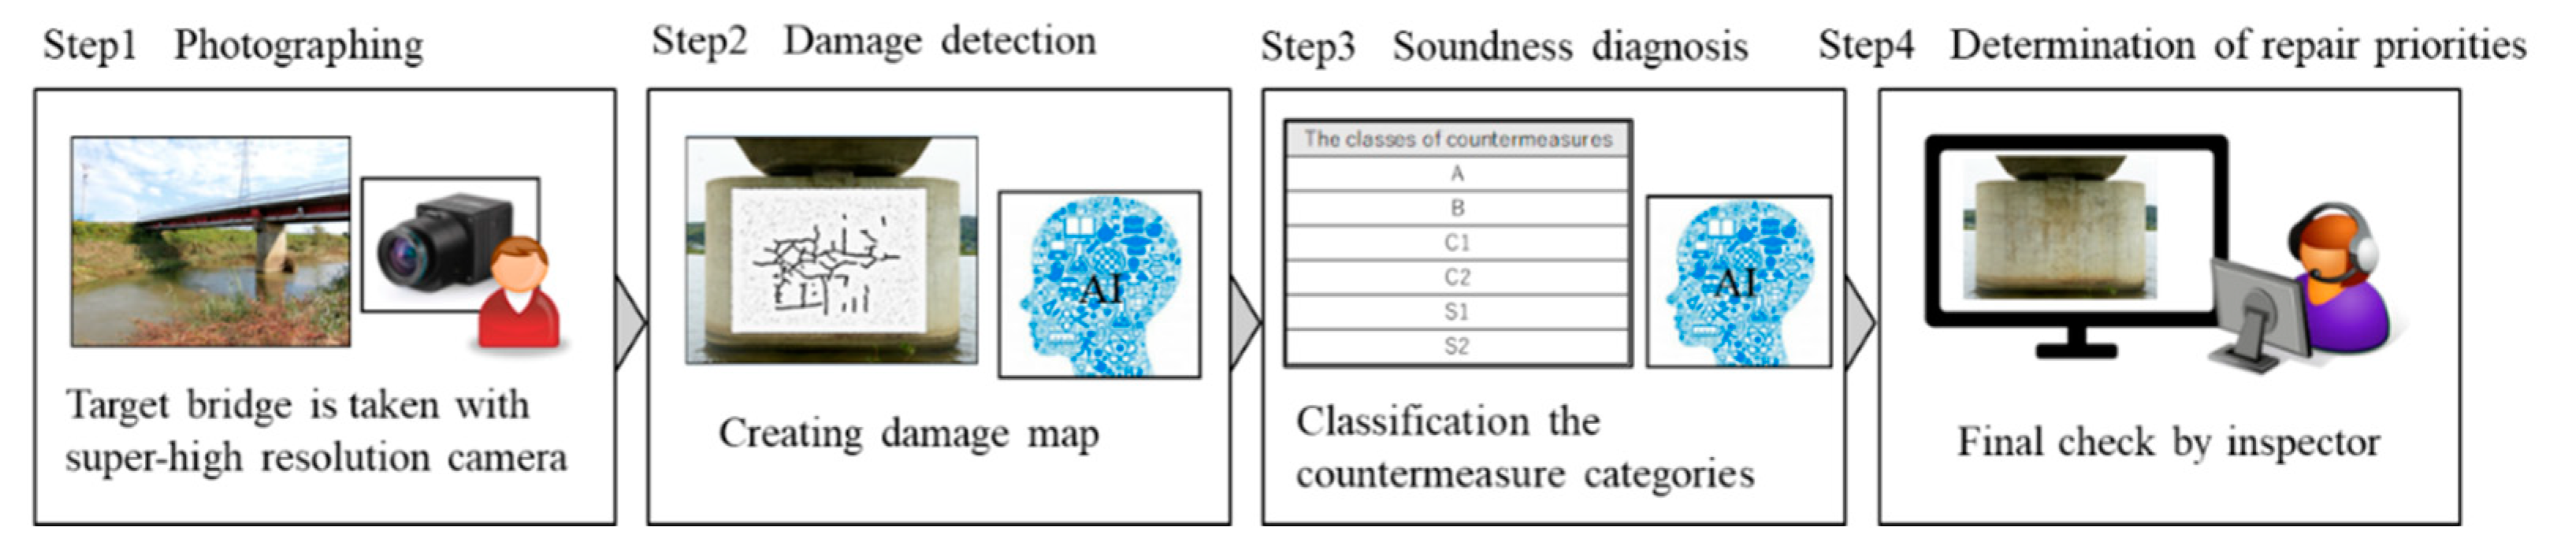
As issues with the continuing close visual inspection of bridges are surfacing, remote imaging systems are expected to become a new inspection method that replaces close visual inspection.
Figure 1 shows the flow of the proposed remote inspection of bridges. At the inspection site, the inspection point is photographed. After that, the AI (Artificial Intelligence) will automatically detect damage and diagnose soundness to help the inspector make a final decision.
Various research about automatic damage detection was conducted to automate the inspection of bridges. Christian Koch et al. [
4] summarized studies on the deterioration of infrastructures using methods such as deep learning, neuro-fuzzy theory, and support vector machines. Young-Jin Cha et al. [
5] proposed a method to automatically classify the degree of damage using deep learning. However, the method gave only laboratory results, and the deterioration of concrete used outdoors could not be accurately classified owing to the impact of shadows, dirt, etc. A series of studies by Sunil K. Sinha et al. [
6,
7] showed the possibility and concept of automatically detecting damage such as cracks using images, and actually attempted to detect cracks in target samples using AI. The results showed that cracks can be detected, but to detect various types of cracks, model parameters must be stabilized using more photographs of cracks. Lee, S. et al. [
8], Yeum and C. M. et al. [
9] attempted to automatically detect cracks using image recognition. The results showed that cracks on concrete bridges and bolts on steel bridges can be identified. Yamane and Chun [
10] applied Semantic Segmentation, a deep learning method that associates labels to all pixels in an image, to cracks to automatically detect cracks on a pixel-by-pixel basis. They also proposed a method for removing concrete formwork marks, which can cause false positives. However, to accurately identify cracks and bolts, many photographs that are independent of angles are necessary. Takahiro M. et al. [
11] examined the improvement of crack detection accuracy by using Averaged Shifted Histograms (ASH) theory.
On the other hand, there are few studies that focus on methods for diagnosing damage based on information such as the location and shape of the damaged part in order to classify and assess the soundness of each part. In periodic inspections, damage is detected and diagnosed once every five years. However, the results of the diagnosis are inconsistent due to the fact that the diagnostician differs each time. There are cases in which soundness has been restored even though no repairs have been made, and this is a major problem in the planning of maintenance management. Considering that the number of skilled engineers will decrease in the future, the diagnosis of soundness should be automated. Aoshima et al. [
12] used deep learning for image classification to detect concrete damage and classify the degree of damage. Image classification models have been developed that use deep learning to estimate the degree of damage and the factors causing the damage based on images. However, considering the need for accountability of diagnosis results, it is desirable to have a model that can explain the features used in the diagnosis.
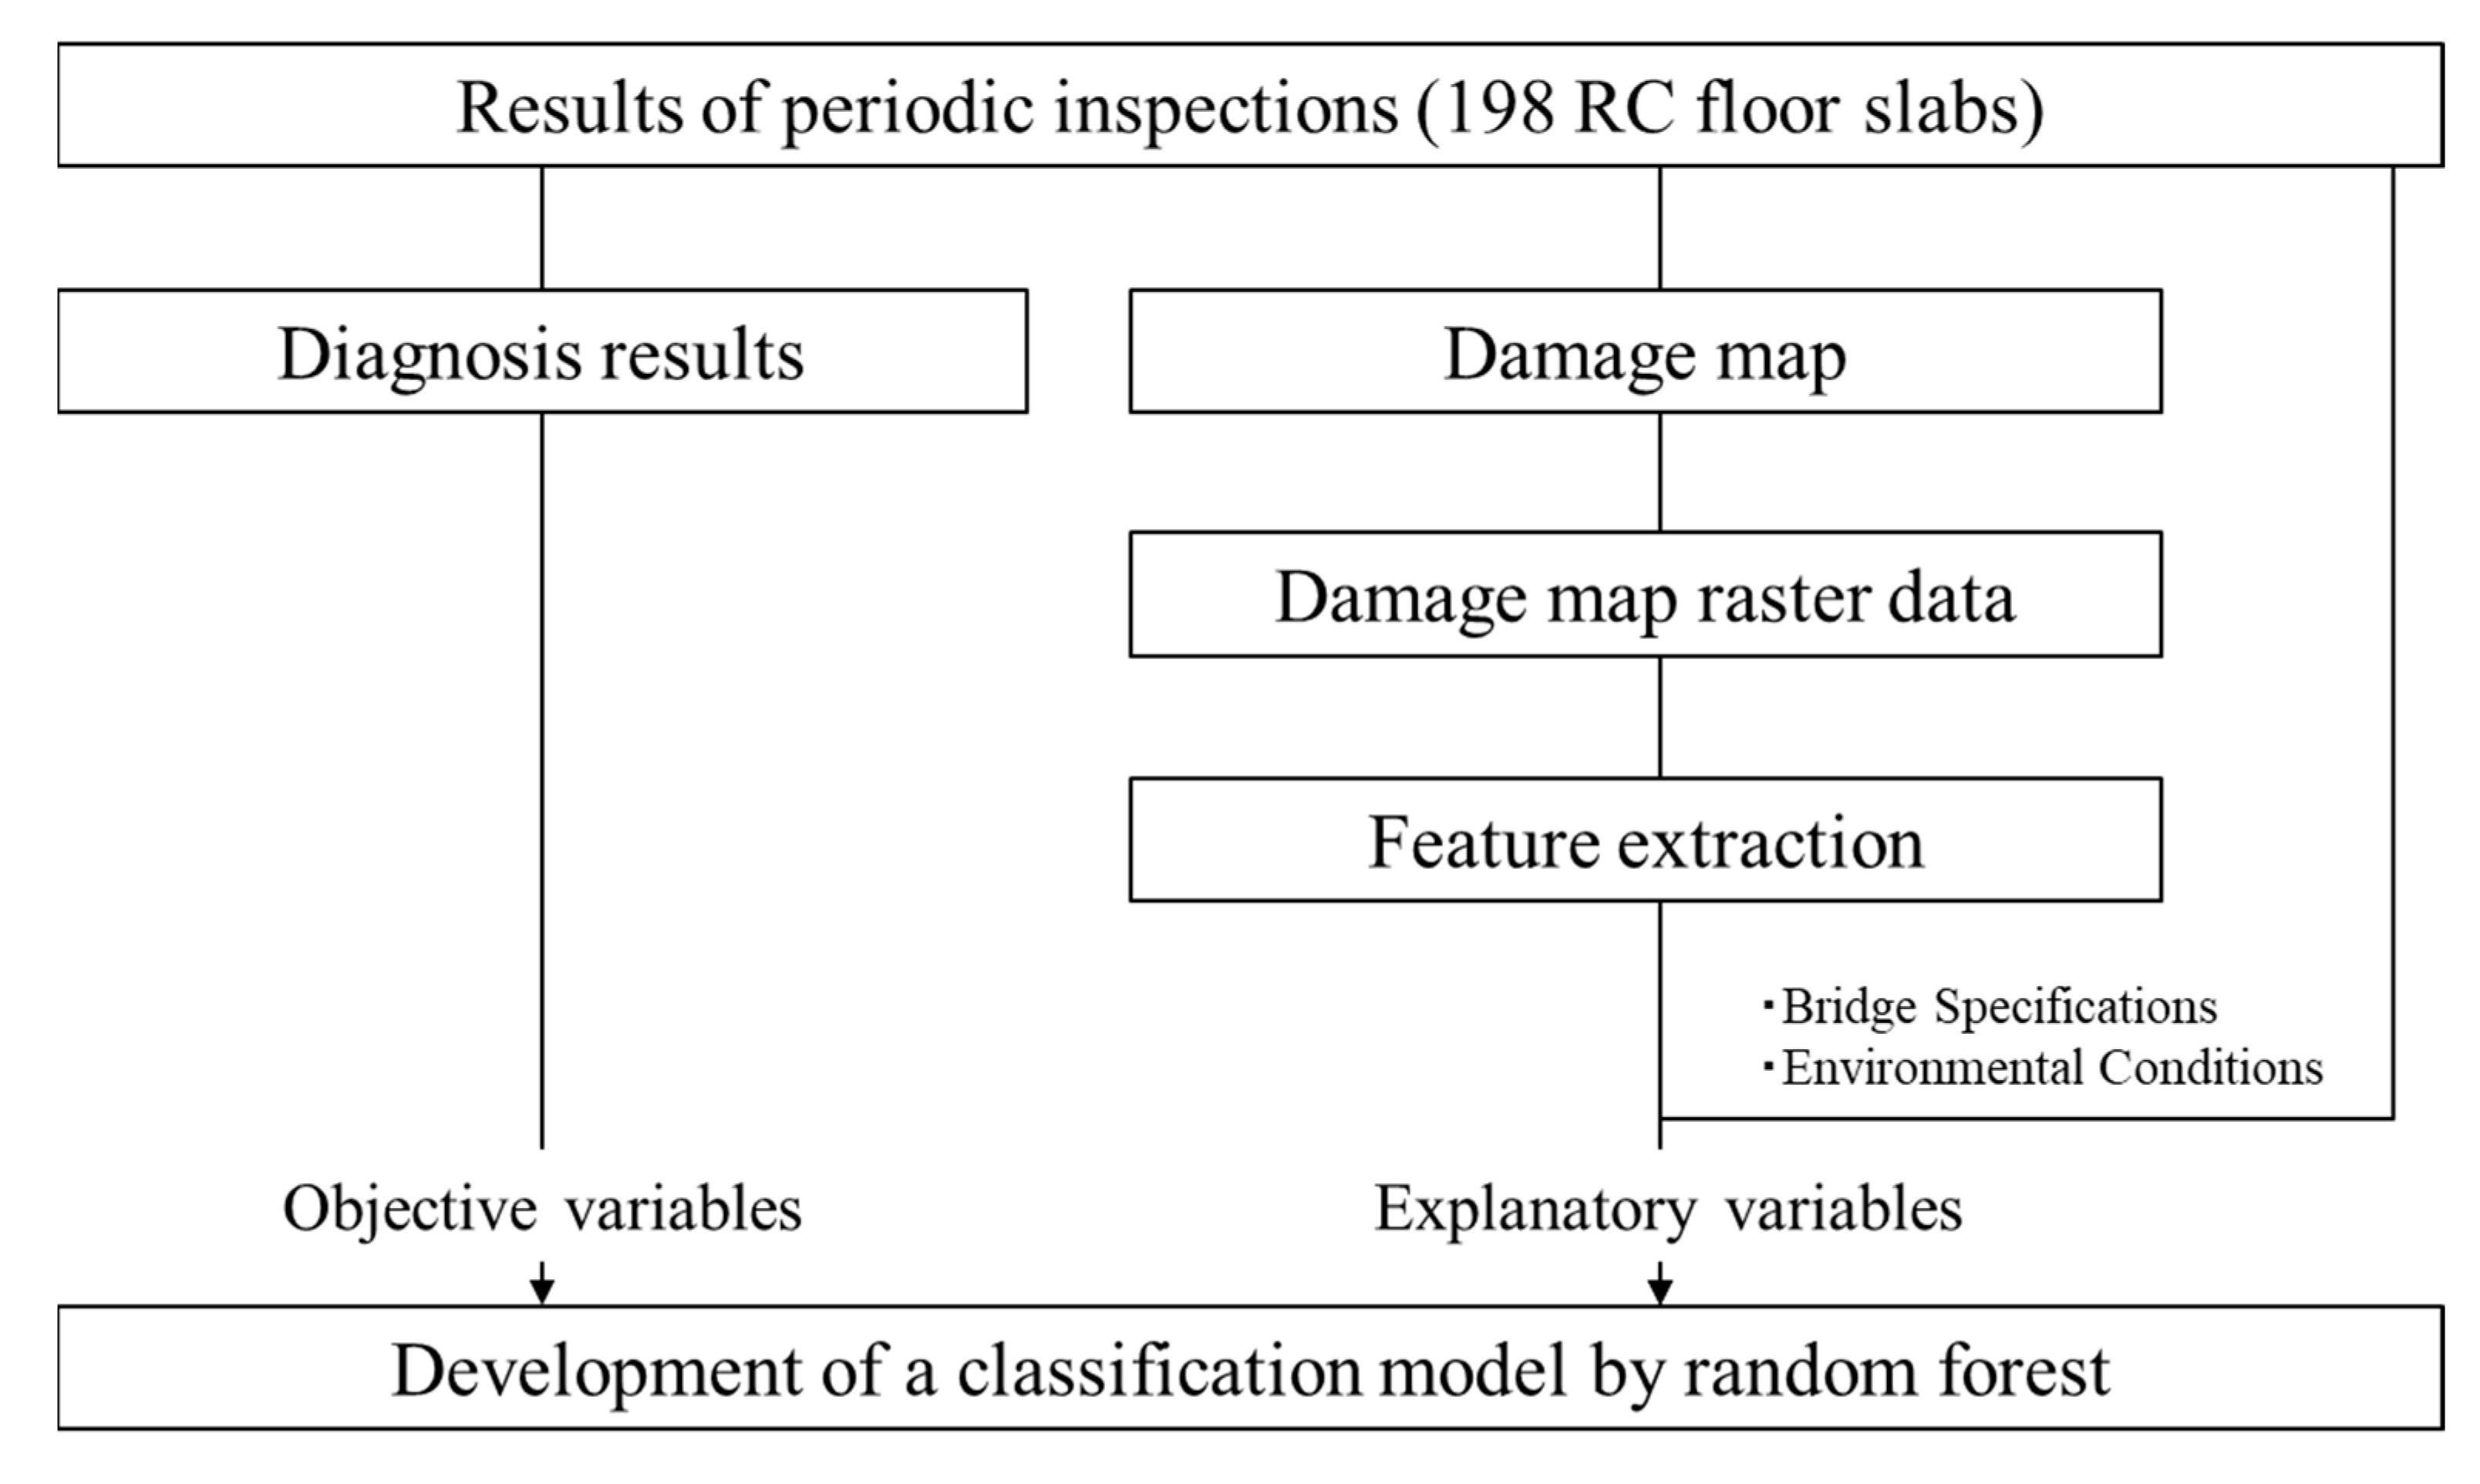
The objective of the study is to develop a classification model of countermeasure categories using the results of past periodic inspections of bridges conducted by skilled inspectors and analyze the relationship between damage records and the diagnosis results of countermeasure categories. Focusing on concrete slabs, a model was constructed to classify the countermeasure categories based on the characteristics of the damage maps by random forest classification (
Figure 2). The novelty of this study is to develop classification model of countermeasure categories by extracting characteristics such as the scale, shape, and position of the crack from damage maps. A classification model of countermeasure categories is constructed using the inspection results conducted by skilled engineers in the past, it will enable us to clarify the factors that affect the diagnosis results, which are the tacit knowledge of skilled engineers. By constructing a classification model of countermeasure categories, it will be possible to support the diagnosis of young inspectors. And the importance of the factors influencing the diagnosis of the countermeasure category was clarified by random forest classification. It will help to determine the damage and features that do not affect the diagnosis when automatically detecting damage using images.
2. Bridge Inspection Data
The data used in this study are the results of periodic inspections of government-managed bridges conducted in I Prefecture from 2014 to 2019. RC slabs were selected as the target among the concrete components, so bridges that do not consist of RC slabs were excluded from the analysis. Among the results of periodic inspections of bridges, we used the diagnosis results determined by bridge diagnosticians and damage maps that record the damage status. In this study, we used the inspection results of 49 bridges (198 RC floor slabs).
2.1. Diagnosis Results
During the periodic inspection, the location and degree of damage are identified by close visual inspection, and the location and degree of damage are recorded as a damage map. Based on the damage map and the location of the bridge and so on, the countermeasure category is diagnosed. There are nine classes of countermeasures (
Table 1) as defined by the Ministry of Land, Infrastructure, Transport, and Tourism (MLIT) in Japan. In the periodic inspection, the need for some kind of countermeasure, such as repair, emergency response, maintenance work, or detailed investigation, is determined for each damaged part of the bridge.
In this study, a classification model for the countermeasure category of concrete slab cracks was developed using the information on the external damage obtained from the damage map. The data set (damage map and diagnosis results) used in this study consists of 198 RC floor slabs, and the classes of countermeasure categories is as follows: Category B: 188 samples, Category C1: 6 samples, Category S1: 2 samples, and Category S2: 2 samples.
Judgment Category B is a state in which, although there is damage and repair is necessary, the cause and scale of the damage are clear, and there is no urgency to immediately repair it. Judgment Category C1 is a state in which the damage has progressed, and it is necessary to carry out repairs at least before the next periodic inspection for preventive maintenance. Judgment category S1 is a state in which there is damage, and it is judged that a detailed investigation is necessary to determine the cause of the damage in order to judge the necessity of repair. Judgment category S2 is a state in which a follow-up investigation is judged to be necessary, although a detailed investigation is not necessary. In this study, we developed a two-class classification model to classify “Judgment Category B” and “Judgment Category C1, Judgment Category S1, and Judgment Category S2”.
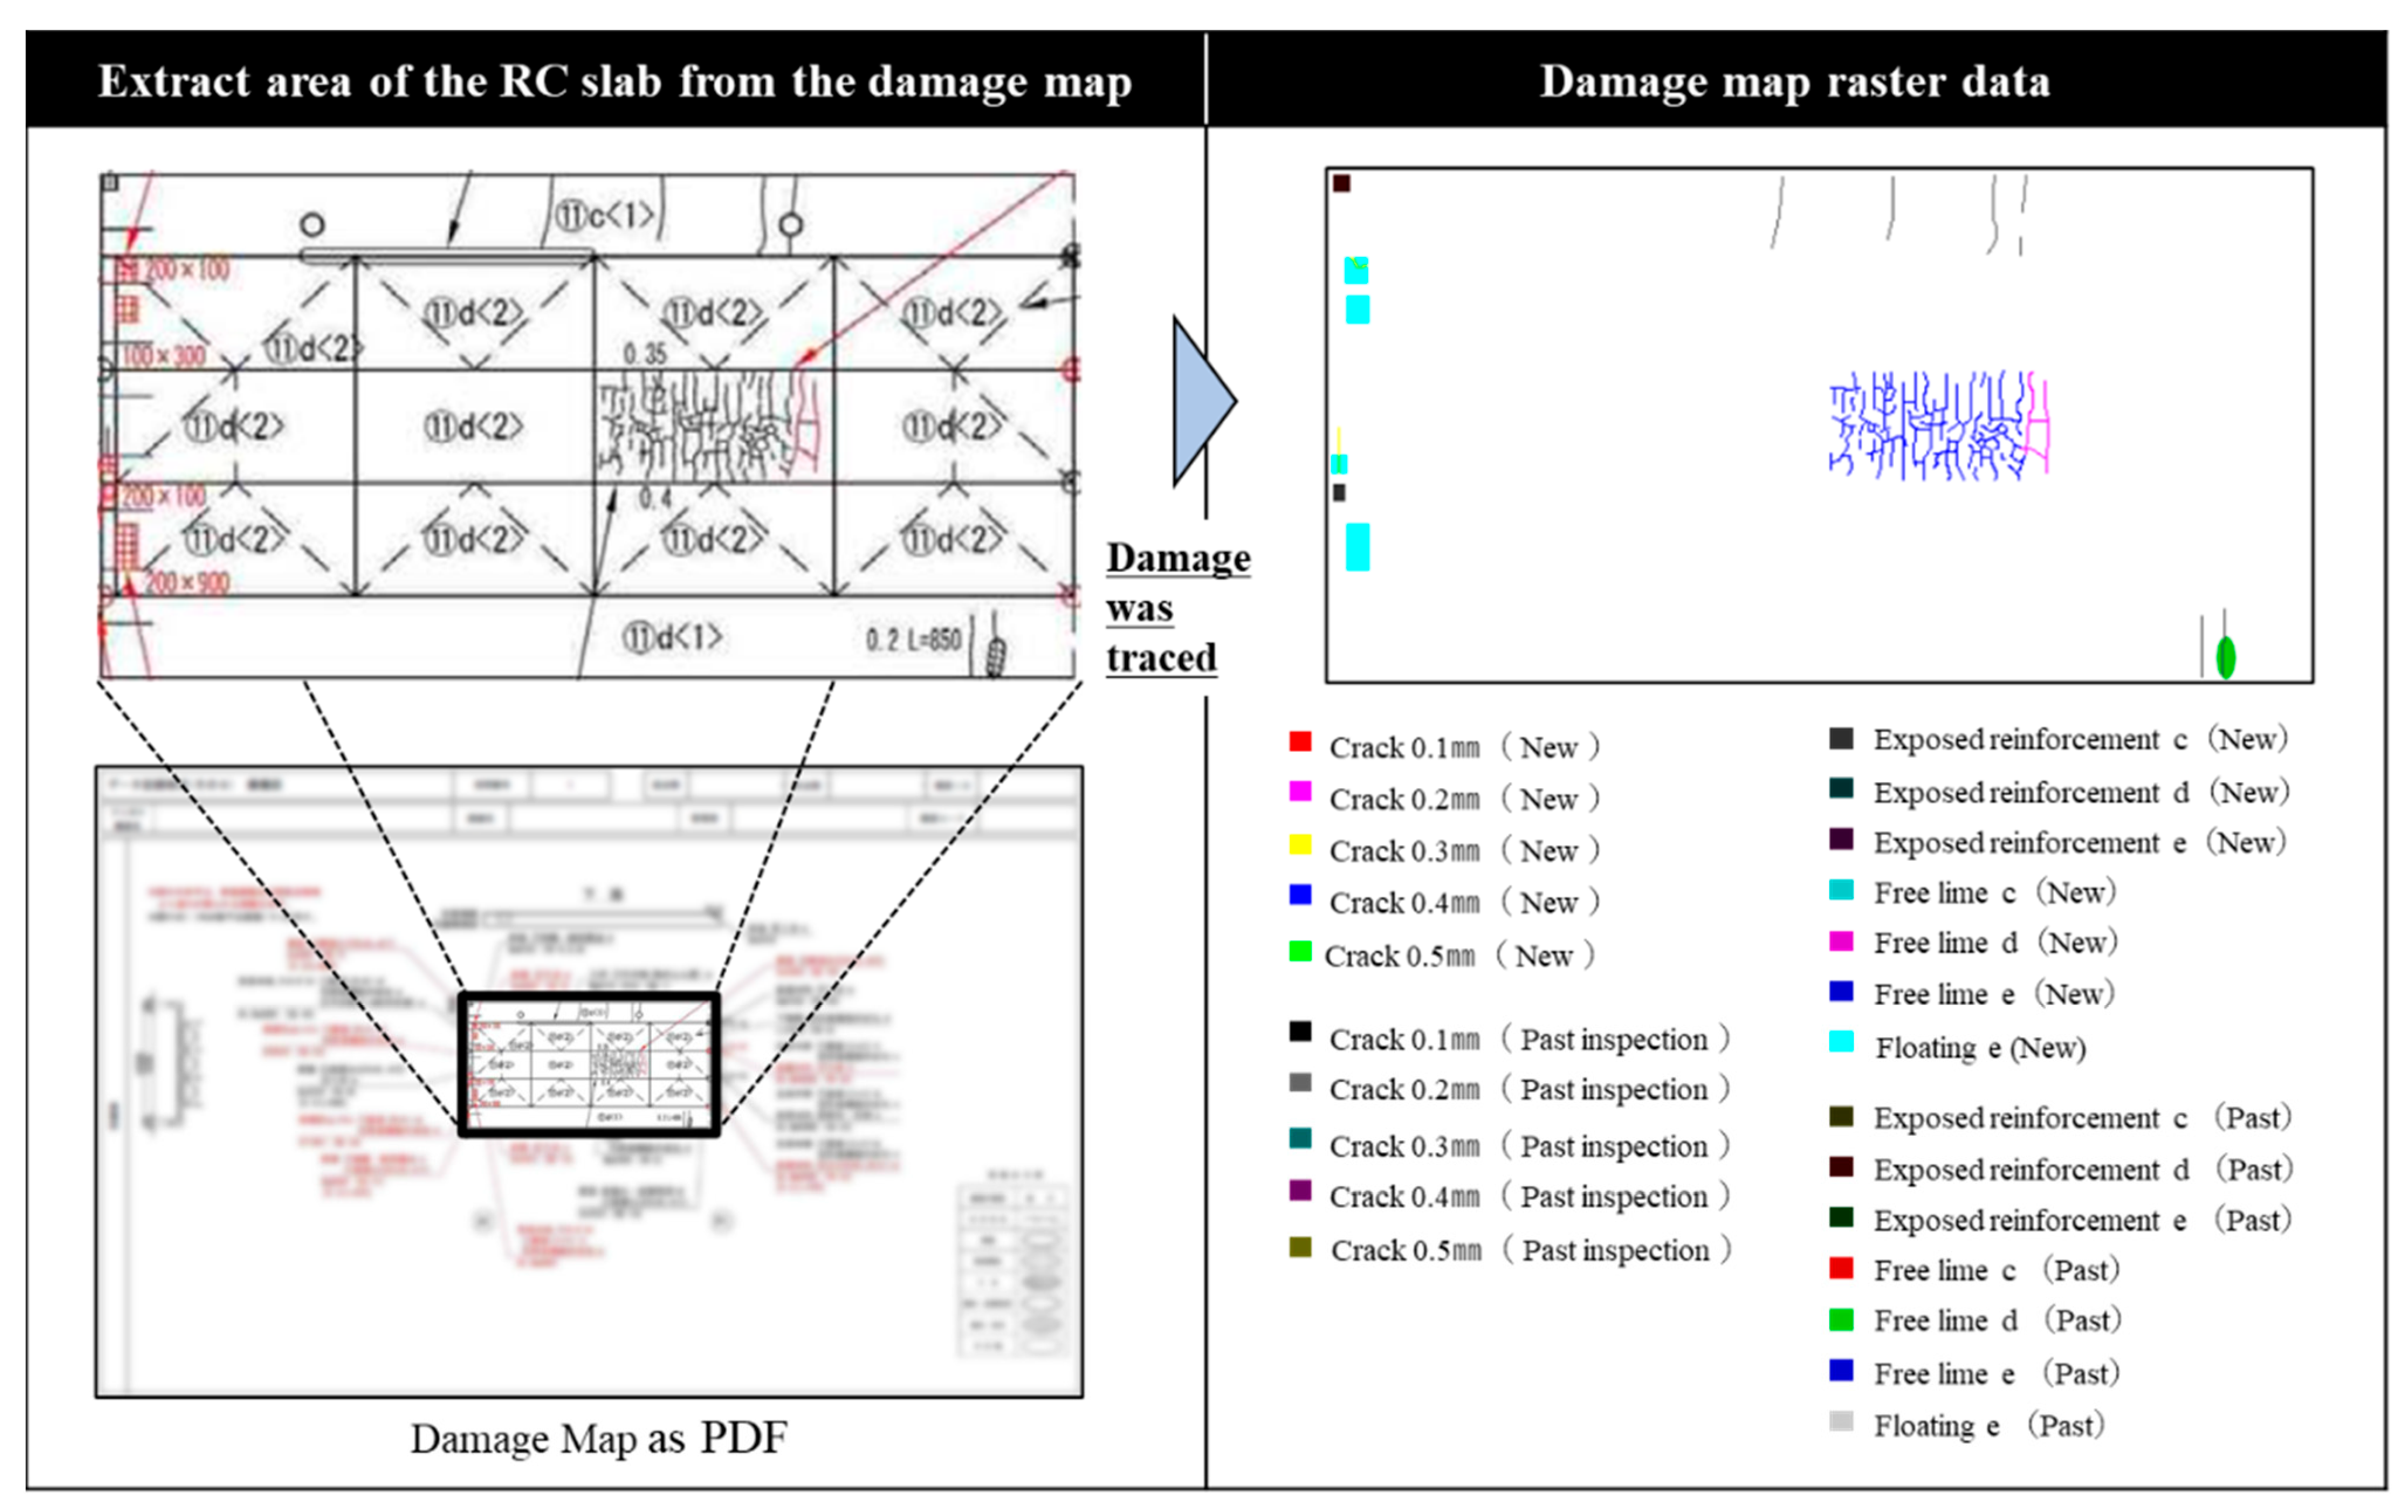
2.2. Damage Map
In the periodic inspection of bridges, damage detected by close visual inspection is recorded as a damage map. When diagnosing the countermeasure category of damage, it is important to have a damage map that shows not only the presence or absence of damage, but also the position of the damage in the inspected component, the degree of progress of the damage since the past inspection, and new damage. Especially in the case of concrete cracks, the shape of the cracks is important information for investigating the cause of the cracks, and the damage map is an important source of information. In the case of concrete slab cracks, the degree of damage varies depending on the width and spacing of the cracks and whether or not the cracks are connected to other damage.
In addition to the damage detected during the periodic inspection, the damage detected during the past periodic inspection is also recorded separately in the damage map. For cracks in floor slabs, the width as well as the shape of the crack are recorded. The position and degree of damage for “exposed reinforcement”, “free lime”, and “floating” are sketched on the damage map.
2.3. Damage Map Raster Data
The damage maps were created by CAD and recorded and stored as PDF data. Therefore, damage raster data containing only useful information for diagnosis was created from the damage maps using the following procedure.
- (a)
The image editing tool was used to extract only the rectangular area of the RC slab from the damage map.
- (b)
Overlay an image with high transmittance on the damage map of the rectangular area of the RC slab, and trace over the cracks with a 1 pixel freehand pen tool. The color of the tracing was changed for every 0.1 mm of the crack width so that the cracks could be distinguished. The color of the traces was changed to distinguish the degree of damage for “exposed reinforcement”, “free lime”, and “floating”. For damage other than cracks in the floor slab, the fill function was used instead of the pen tool. The color of the tracing was changed to distinguish between damage detected in past inspections and damage newly detected or developed in the inspection of the corresponding year.
- (c)
The damage map was deleted and the image in which only the damage was traced (damage map raster data) was obtained.
Figure 3 shows the above creation procedure and an example of the created damage map raster data. The number of pixels in each damage map raster data differs depending on the scale of the slab.
3. Feature Extraction from Damage Map Raster Data
The analysis focused on five features that may be taken into account when diagnosing the degree of damage and the cause of occurrence of cracks in floor slabs: the scale of the crack, the shape of the crack, the position of the crack, the scale of other damage, and the bridge characteristics and environmental conditions. Each feature was extracted from the damage map data. The following sections describe the extraction method of each feature from the damage map raster data.
3.1. Scale of Cracks
The crack scale is an indicator of how many cracks are contained in the entire concrete slab, which is the target member. The number of pixels tracing the cracks was divided by the total number of pixels in the damage raster data and multiplied by 100 to obtain the crack scale. In this study, three features, “The percentage of total cracks”, “The percentage of cracks larger than 0.2 mm in width”, and “The percentage of new cracks”, were used as indicators of crack size. The percentage of total cracks is a feature that indicates the current state of the crack scale. The percentage of cracks larger than 0.2 mm is a feature that indicates the current crack size considering the width of the cracks. The percentage of new cracks is a feature that indicates the progress of the crack from past periodic inspection.
3.2. Shape of Cracks
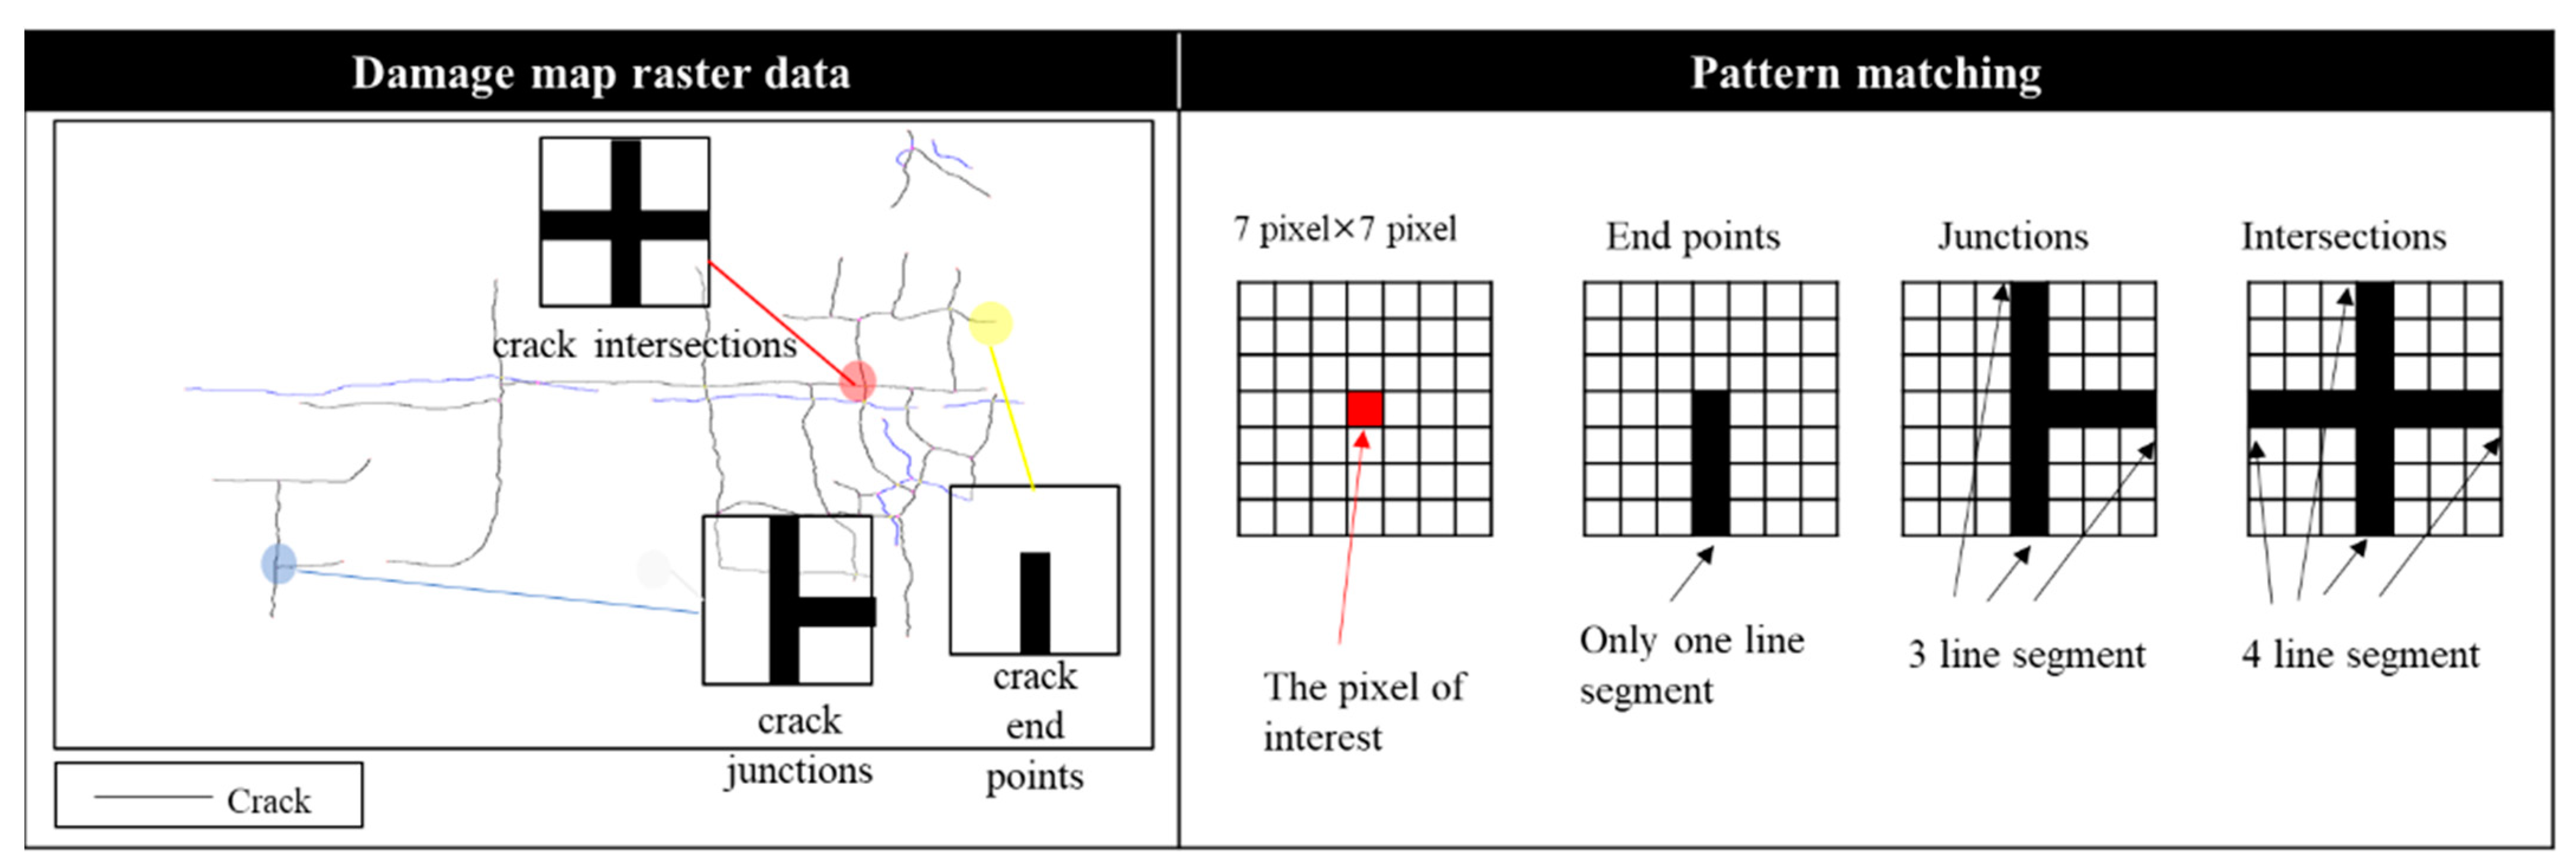
The shape of the cracks is an important feature in examining the factors that cause cracks. The directionality of cracks is also an important factor to be considered in determining the damage classification of floor slab cracks. In this study, the following features were used to describe the shape of cracks: the total number of crack intersections, the total number of crack junctions, and the total number of crack end points.
Figure 4 shows an example of the number of cracked intersections, junctions, and end points, and the judgment method. Pattern matching was used to determine the intersection, junction, and end points of the cracks. In pattern matching, pixels are checked systematically by moving a rectangular area of 7 pixel × 7 pixel against the damage diagram raster data. For the edge, the detection was based on the condition that the pixel of interest was traced by a crack and that there was only one line segment that reached the periphery. For intersections and junction points of the cracks, the number of pixels of the line segments where the pixel of interest is traced by the crack and exists in the periphery was used as a condition for detection.
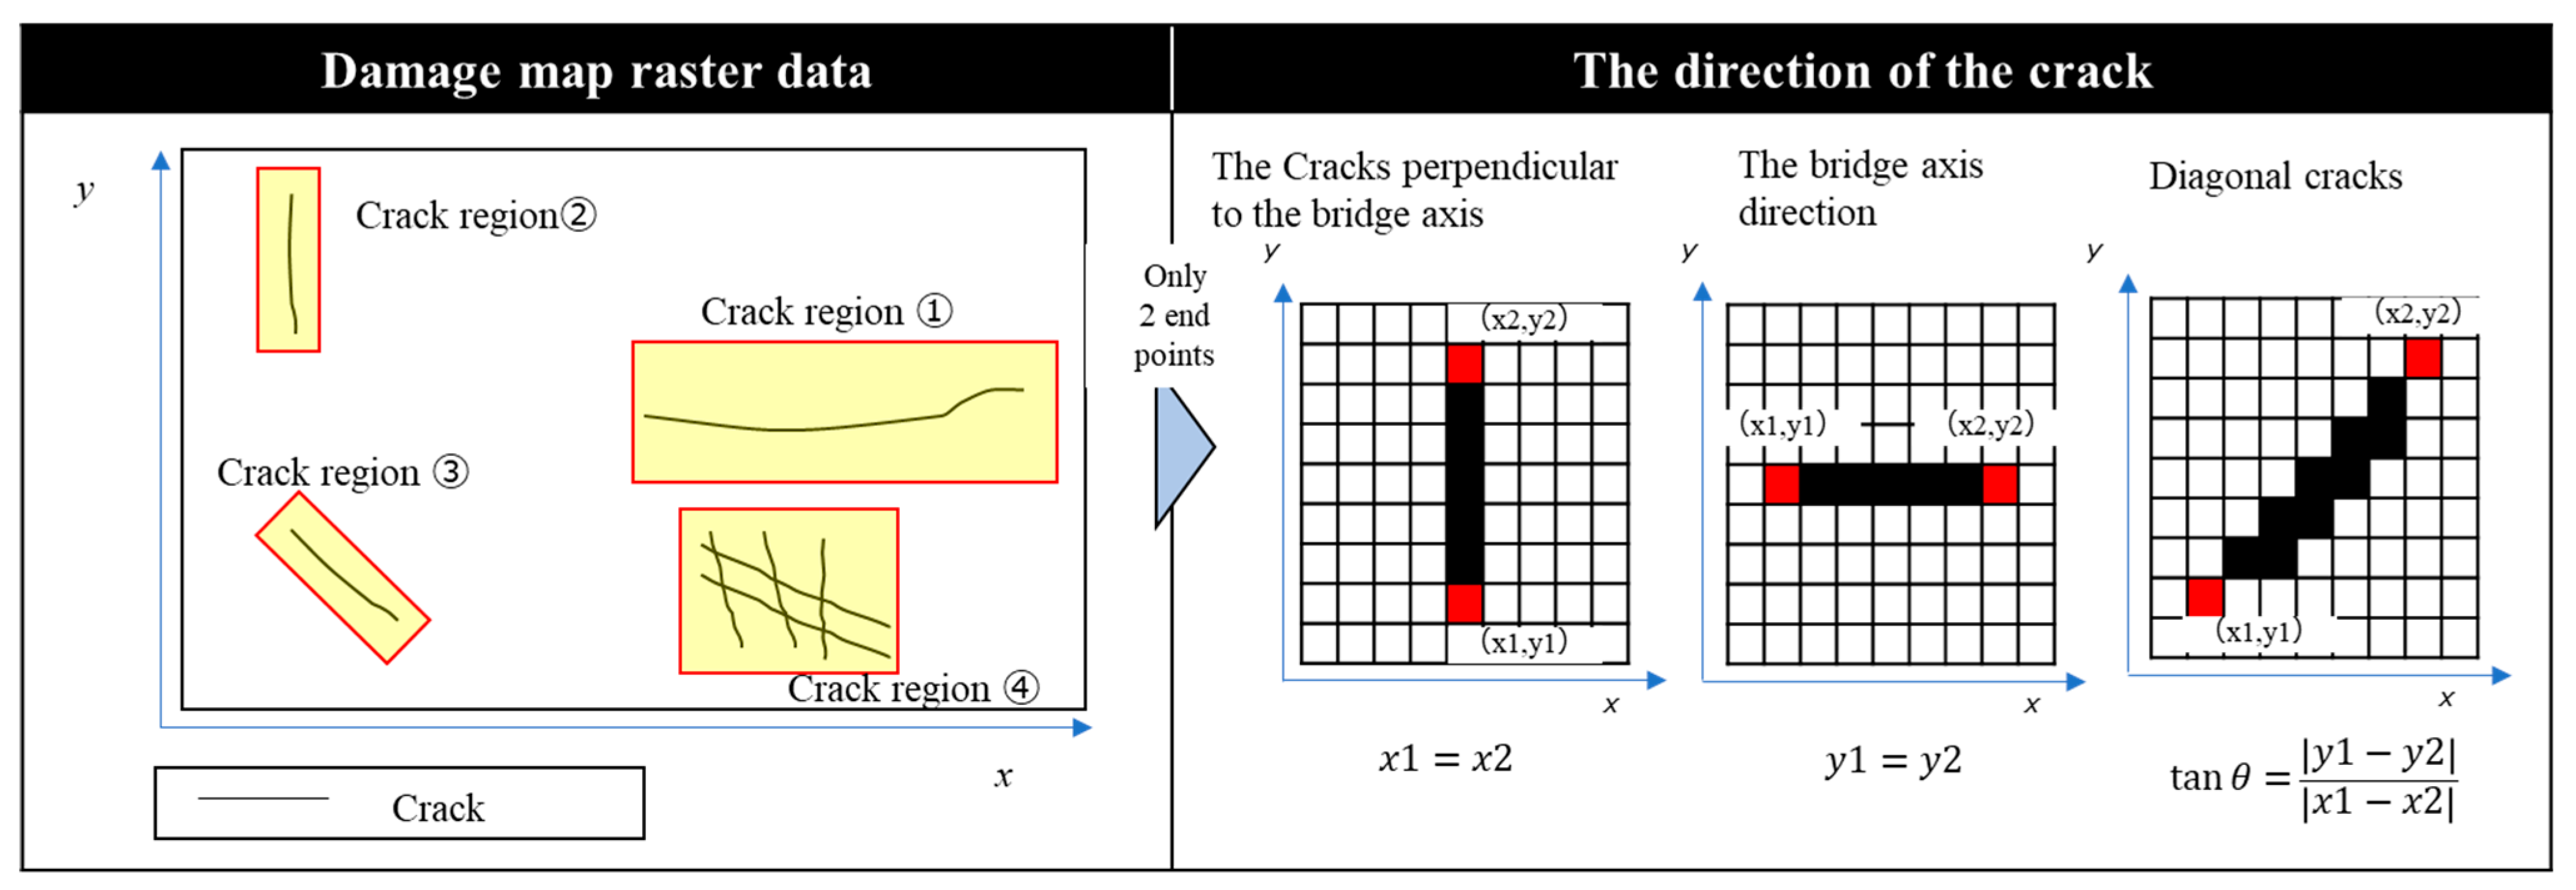
In this study, the direction of the crack is also considered as a feature that represents the shape of the crack. The calculation method for the crack direction is shown in
Figure 5. As shown in the left side of
Figure 5, all cracks in the damage diagram raster data are divided into contiguous individual crack regions (yellow rectangular regions in
Figure 5). Extract the end points of the cracks (red pixels in the right side of
Figure 5) from the divided individual crack regions by pattern matching. Only for the crack area with two extracted end points is the angle calculation process performed for the two points. The
x-axis is the direction of the bridge axis, and the
y-axis is the direction perpendicular to the bridge axis, and the coordinates of the two end points are (x1, y1) and (x2, y2). If the x-coordinates of the two points are the same, i.e., x1 = x2, the crack is perpendicular (90 degrees) to the bridge axis direction. If the y-coordinates of the two points are the same, i.e., y1 = y2, the crack is horizontal (0 degree) to the bridge axis direction and is considered to be a crack in the bridge axis direction. Otherwise, the tangent is obtained from the difference of x-coordinate (x1 − x2) and y-coordinate (y1 − y2) (tan(θ= |y1 − y2|⁄|x1 − x2|), and the angle is obtained. If the absolute value of the angle is less than 30, the cracks are counted in the direction of the bridge axis; if the absolute value is more than 60, the cracks are counted in the direction perpendicular to the bridge axis; otherwise, the cracks are counted as diagonal cracks. The number of cracks in the perpendicular direction, the number of cracks in the axial direction, and the number of diagonal cracks were calculated for each RC slab by judging all the cracked areas as perpendicular cracks, cracks in the axial direction, and diagonal cracks, and totaling the entire damage diagram raster data. In this study, three features, “the number of cracks perpendicular to the bridge axis”, “the number of cracks in the bridge axis direction” and “the number of diagonal cracks” were used as indicators of the crack direction.
3.3. Position of Cracks
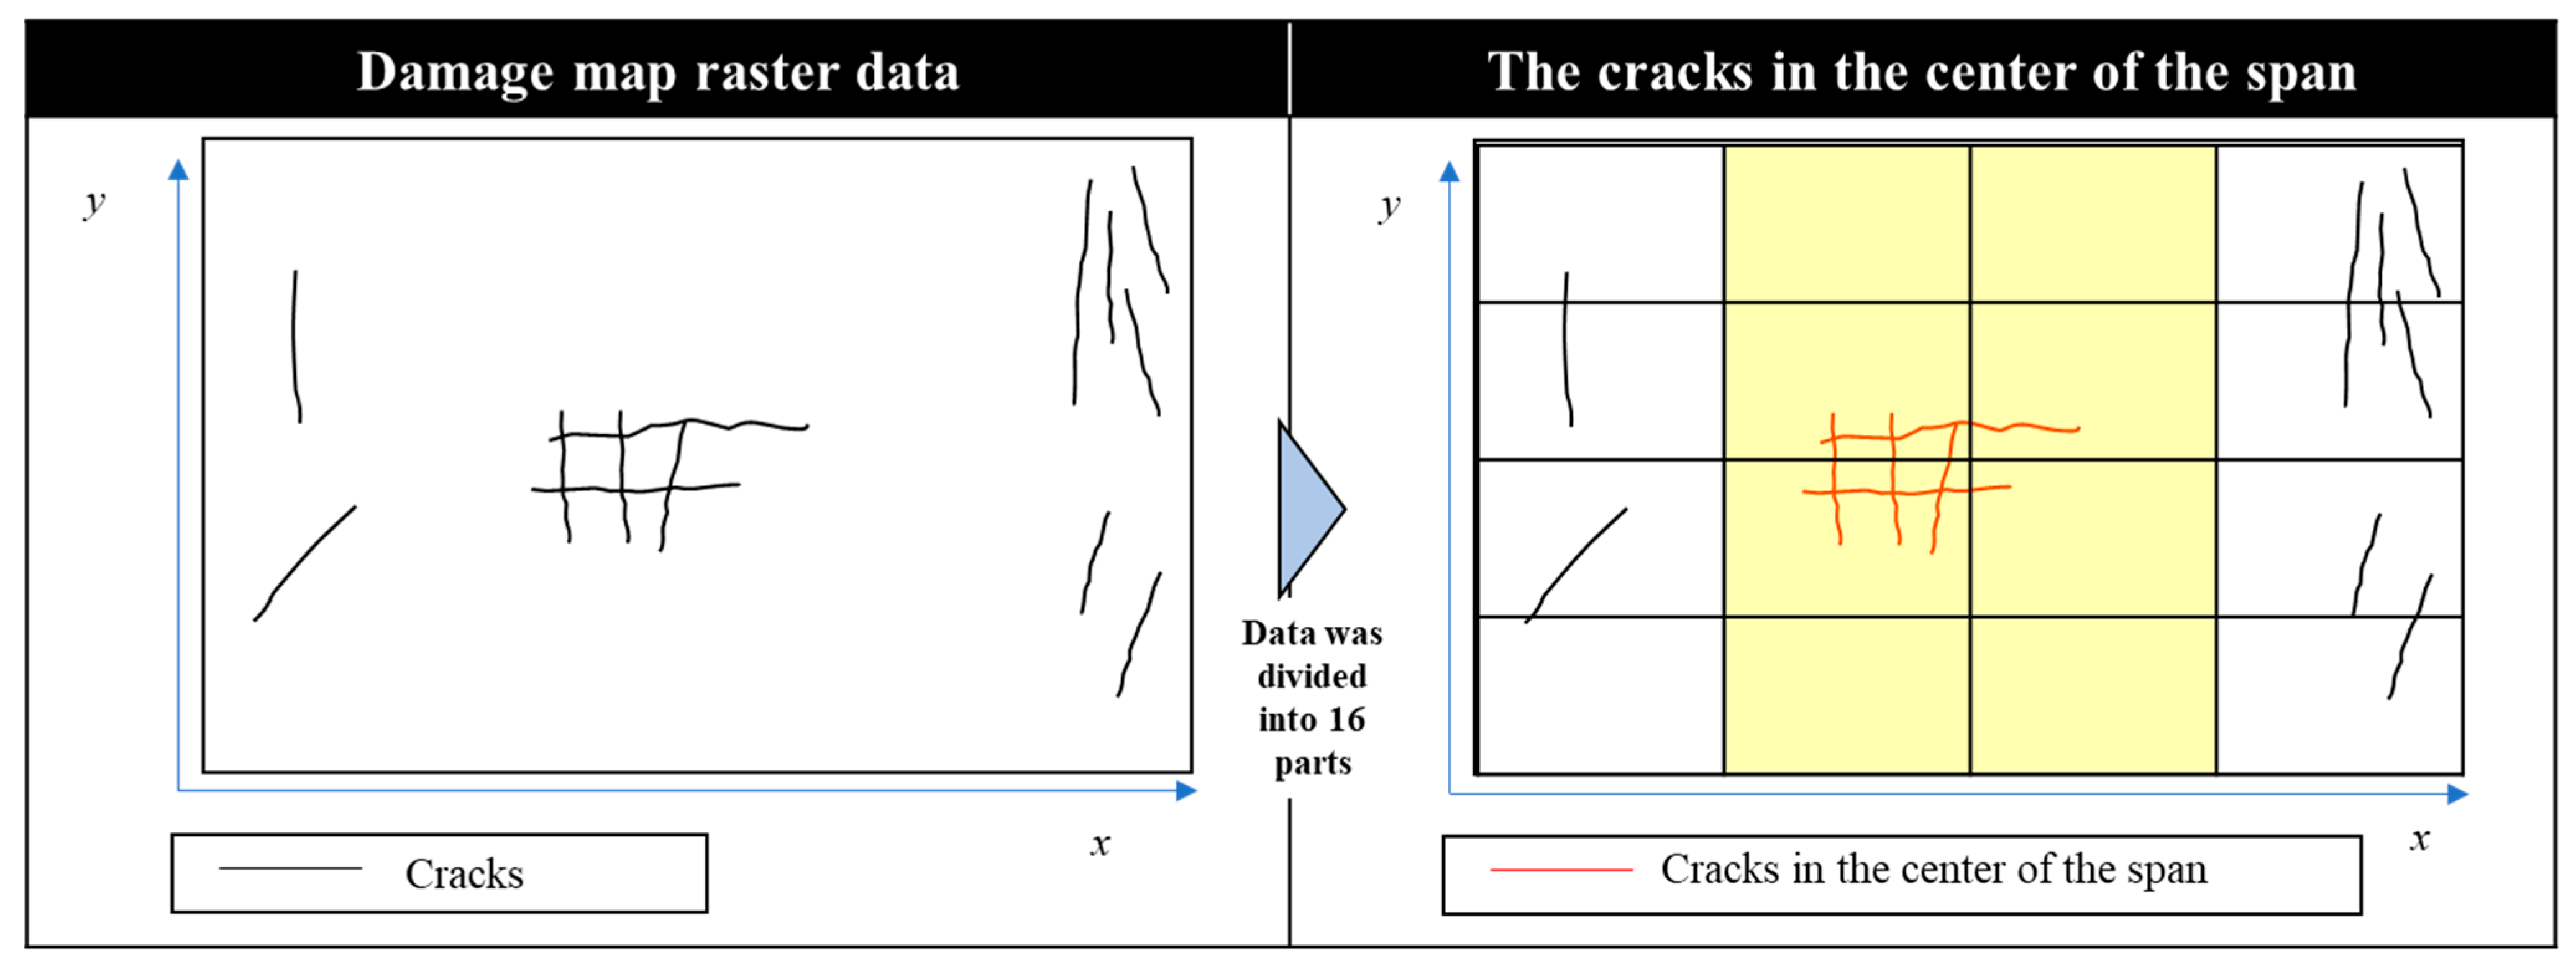
The position of cracks can be a factor affecting diagnosis. In this study, in order to take into account the characteristic value that represents the position of crack occurrence, the damage map raster data was divided into 16 parts as shown in
Figure 6, and only the number of pixels of cracks that exist in the 8 meshes in the center of the fulcrum was counted. This value was divided the total number of pixels in the damage map raster data and multiplied by 100 to obtain “the percentage of cracks in the center of the span”.
3.4. Scale of Other Damages
For other types of damage, “exposed reinforcement”, “free lime” and “floating” that occurred on the same surface as the cracks were considered. Exposed reinforcement, free lime, and floating are recorded in the damage classification. The number of pixels for each damage in the damage map raster data was counted, divided by the total number of pixels in the damage map raster data, and multiplied by 100 to obtain the feature value.
3.5. Bridge Specifications and Environmental Conditions
When a bridge inspector diagnoses a countermeasure category, he considers not only the current state of damage, but also the bridge’s characteristics and the environmental conditions in which the bridge is located. In this study, the “service life”, which is the period from the year of construction to the year of inspection, was used as an indicator of “bridge characteristics and environmental conditions”. In addition, three variables were used: “traffic volume”, “heavy vehicle traffic volume” and “Service life” which were obtained from the 12-h daytime data of the Road Traffic Census.
4. Development of a Classification Model for Countermeasure Categories
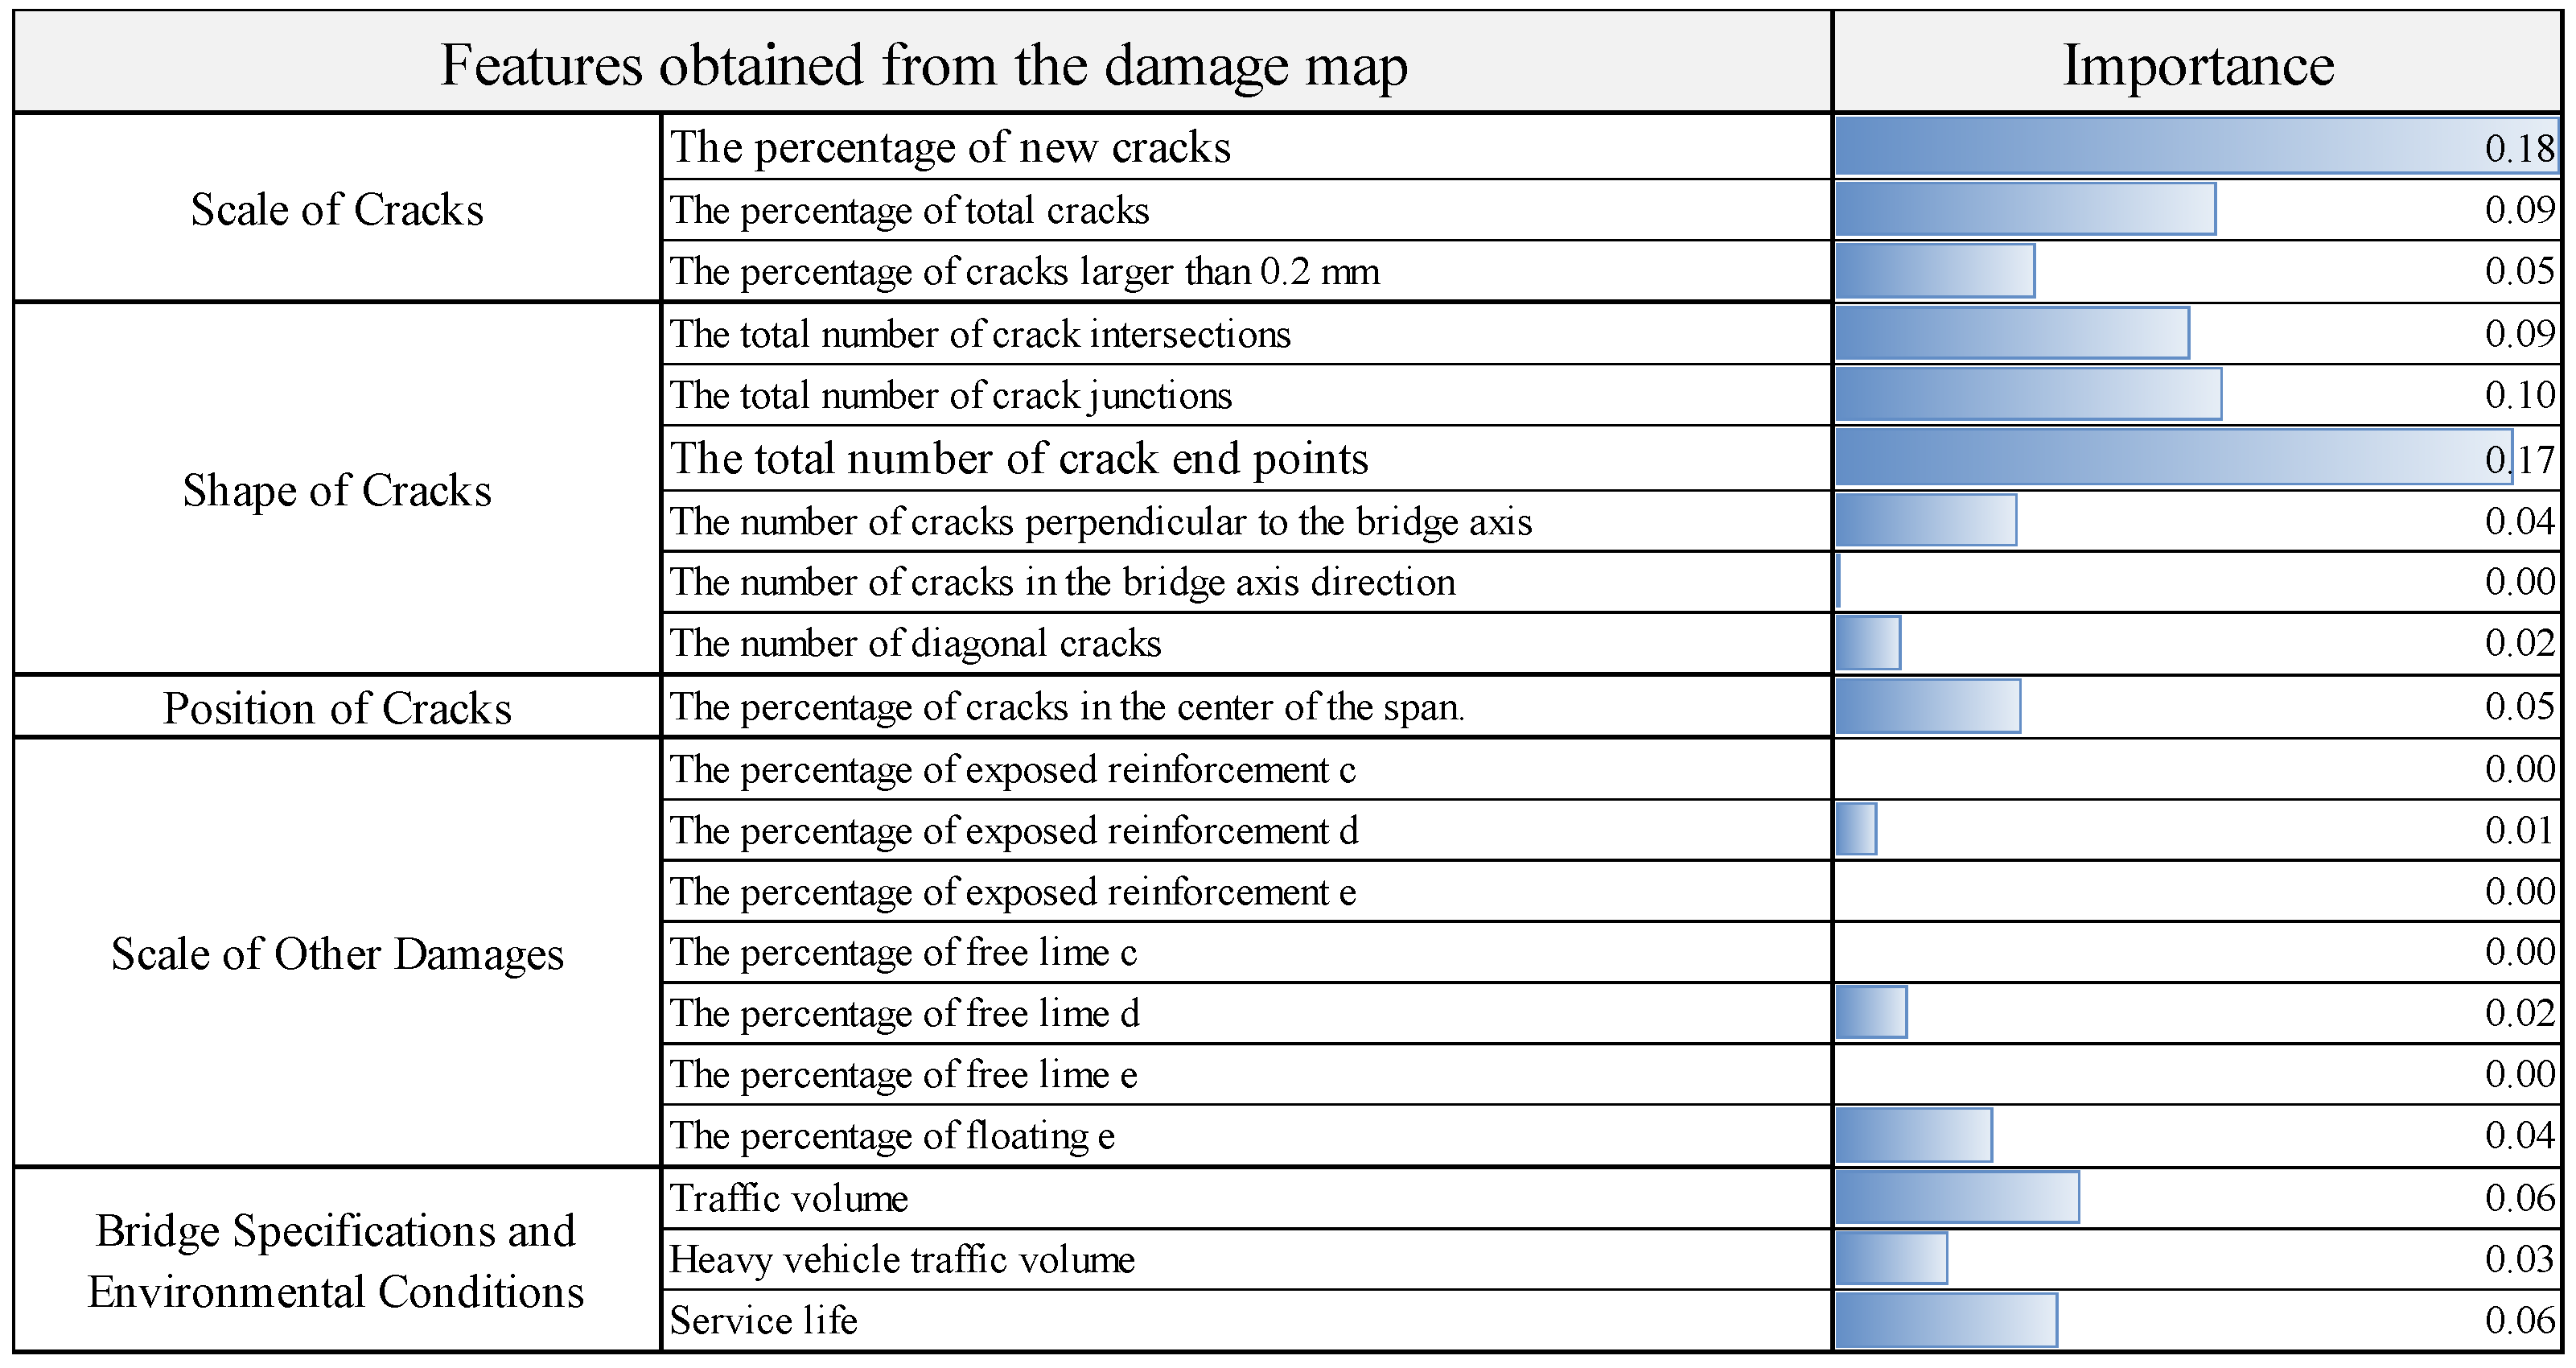
In this study, 17 features obtained from the damage map data and three indicators of bridge characteristics and environmental conditions are used as explanatory variables as shown in
Figure 7, and the classification of floor plate cracks diagnosed by close visual inspection is used as the objective variable. In addition, the importance of explanatory variables is clarified, and the explanatory variables that affect the classification of measures are discussed.
4.1. Analysis Method
Random forest classification is a machine learning algorithm; it is an ensemble learning method that combines multiple weak learners to build a strong learner. Random forest classification employs bagging for ensemble learning, and the learner is a decision tree model. Bagging is a method that uses boosted sampling to create multiple independent training subsets by sampling the training data with some overlap, creates a weak learner in each training subset, and outputs the final prediction result by taking a majority vote of the prediction results of each weak learner. The decision tree model bifurcates the values of explanatory variables based on some criteria and builds a model for discrimination and prediction. The advantage of this method is that the process of branching can be illustrated in a tree structure and easily expressed by production rules such as IF–THEN, so that it can be easily understood by humans. In addition, when graphing hierarchically, the variables are divided from top to bottom in the order of their influence, making it possible to grasp the degree of influence of explanatory variables on the target variable. The decision tree model can be used for analysis even when numerical data and text data are mixed. In this study, CART (Classification and Regression Tree by R) is used to create a decision tree by repeating the process of splitting the data into two nodes so that the information gain is maximized. In CART, Gini impurity (GI: Gini index) is used as the branching criterion. The Gini index is an index of diversity, and it takes a large value when the target variable is equally present in the nodes and a small value when the target variable is close to having only one value. A branch is created so that this evaluation function is reduced the most. In the case of classifications such as the classification model of countermeasure categories, impurity is defined as in Equation (1). In the equation,
t is an arbitrary node in the decision tree, c is the number of classes, and p(i|t) is the ratio of data belonging to a certain class to the total number of nodes.
The information gain is the difference between the Gini impurity of the parent node and the child node, as shown in Equation (2). where D
i is the node of class i, N
i is the sample size contained in the node, and when i = p, it indicates the parent node. When the Gini impurity of the parent node is large and the Gini impurity of the child node is small, the information gain is large. In other words, the information gain is highest when the parent node contains samples of various classes, and these samples are correctly distributed to the child nodes.
By increasing the number of layers in the decision tree, the classification model is overtrained for the training data, resulting in a model with poor generalization performance. In order to prevent overtraining, it is necessary to prune and limit the number of layers in the decision tree.
4.2. Development of a Classification Model for Countermeasure Categories and Evaluation of Accuracy
In this study, RandomForestClassifier [
13] was used from scikit-learn, a machine learning library. In setting the hyperparameters, we considered the weight of the classification class, the number of decision trees used for bagging, and the maximum depth of the decision tree. The data used in this study was unbalanced because the sample size of “countermeasure categories C1, S1, and S2” is smaller than that of “countermeasure category B”. For this reason, we set the hyperparameter for the class weights so that the weights of “countermeasure category C1, S1, and S2”, which have smaller sample sizes, become larger. The number of decision trees used for bagging and the maximum depth of decision trees were set to multiple patterns (the number of decision trees = 10, 20, 30, 40, 50, 60, 70, 80, 90, 100, 200, 300, 400, maximum depth = 2, 3, 4, 5, 6, 7, 8) and grid search was conducted to determine the most accurate parameters. As a result, “the number of decision trees” = 50 and “maximum depth” = 2 were adopted.
In this study, the accuracy of the classification model was verified by k-split cross-validation. To account for the number of samples in each class, we set k = 3 and used stratified k-partition cross-validation, which divides the model so that the ratio of classes in each partition is the same.
Three indices were used as indicators of the accuracy of the multi-class classification model: the macro-average precision rate, which is the average of the fit rates of each class; the macro-average recall rate, which is the average of the recall rates of each class; and the macro-average F-measure, which is the average of the F-values of each class. Equations (3)–(5) show the formulas for calculating the precision, recall, and F-measure of each class from the confusion matrix in
Table 2. The precision rate is a measure of how many of the numbers (
NTP +
NFP) classified by the classification model into the target class are correctly classified (
NTP). The recall rate is a measure of how many of the target class data (
NTP +
NFN) are actually classified correctly by the classification model (
NTP). In general, the precision rate and the recall rate are in a trade-off relationship, so the
F value is the harmonic mean of the precision rate and the recall rate.
The generalization performance of the classification models for the countermeasure category of floor slab cracks in RC slabs is shown in
Table 3. Based on the features of the external damage, it is possible to classify category B and categories C1, S1, and S2 with a macro-average precision rate of about 79% and 64% macro-average recall rate.
Table 3 also shows the generalization performance of the countermeasure classification models when three indicators (service life, traffic volume, and heavy vehicle traffic volume) were added as explanatory variables. The generalization performance of the two-class classification model is greatly improved, with the macro-average precision rate improving by about 9 points, the macro-average recall rate by about 10 points, and the macro-average F-value, improving by about 10 points. In other words, it become clear that the information on the service life, traffic volume, and heavy vehicle traffic volume is also taken into account in classifying “countermeasure categories B” and “C1, S1, and S2”. By taking into account not only the external damage but also the bridge characteristics and environmental conditions, we were able to construct a classification model that can classify the two classes of countermeasures with an accuracy of about 88% macro-average precision rate and 74% macro-average recall rate.
Next, we evaluate the importance of each feature. The importance is a measure of how much the partitioning by each explanatory variable contributes to the classification of the target variable. The importance of each explanatory variable is calculated by the Gini impurity, and the amount of decrease in Gini impurity is the importance of each explanatory variable.
Figure 7 shows the results of the importance evaluation by random forest classification for the classification models. The results of the importance evaluation by the two-class classification model show that “the percentage of new cracks” and “the total number of end points of cracks” are particularly important in classifying the countermeasure category. These results make clear the statistical analysis using the damage diagram, and it is necessary to verify the consistency with the actual inspection results. In other words, the degree of crack development and the number of cracks (end points) are more important factors in the classification of judgment categories B and C1, S1, and S2 than in the previous inspection. The method proposed in this study was found to be capable of revealing the features of exterior damage that affect the diagnosis. Therefore, it is possible to study the features that should be focused on when automatically detecting damage from images.
5. Summary and Future Challenges
A classification model for RC slabs was developed using a damage map. As a result, it was possible to classify two classes of countermeasure categories, Category B and Categories C1, S1 and S2, with a macro-average precision rate of about 88%. In addition, it was clear that the important features for classifying the countermeasure classifications were the “percentage of new cracks” and the “total number of end points of cracks”. The degree of crack development and the number of cracks (end points) were important criteria for the classification of judgment classifications B and C1, S1, and S2. The method proposed in this study clarifies the features of exterior damage that affect diagnosis. Therefore, it is an analytical method that can be used in research on the automatic detection of damage using images to examine the damage and features that should be focused on, and the damage and features that should be avoided or missed.
In this study, we were able to clarify the factors that affect the determination of the countermeasure category for floor slab cracks, but we did not analyze the causal relationship. It is necessary to clarify the comparison and the causal relationship between the results of this study and the perception of actual inspectors by conducting interviews with inspectors and analyzing the remarks in the inspection reports.
The data used in this study are the results of bridge inspections conducted by the national government, which has a relatively well-developed method of recording damage diagrams. Only RC decks, which are managed by the national government and have relatively good countermeasure classification, were used as valid samples. It is necessary to analyze and compare the results of bridges managed by municipalities, especially those with financial and human resource shortages. Since the amount of information recorded on damage maps may differ among road managers and inspectors, it is necessary to consider the process of matching the amount of information on damage maps when comparing damage maps with different recording methods. In addition, the dataset was not large enough, so the generalization accuracy was not sufficient for the amount of data. In particular, because there were only a small number of samples with bad judgments in the countermeasure category, the classification accuracy of the judgment category C1 and the judgment categories S1 and S2 could not be obtained. Therefore, it is necessary to consider the efficient acquisition and recording method of the data set as a future issue. Based on those analyses, bridge inspection may be able to predict deterioration and improve the efficiency of inspection points using AI based on damage diagrams.


