1. Introduction
Railway management administrations around the world provide the distance between sleepers based on their experience, which seem to be mainly derived from questions of historical nature. In Europe, the most common distance between sleeper axes is 600 mm. However, this distance varies in other countries around the world, and it depends on several factors, such as track gauge, the thickness of the ballast layer, or the dimension and materials of the sleepers. Design manuals for railway projects in the United States recommend the spacing between sleepers depending on the material of the sleeper and the thickness of the ballast [
1]. The recommended separation between supports (sleepers) can vary between 0.546 m (wooden cross sleepers and a 0.152 m thick section of ballast) and 0.711 m (concrete sleepers and a 0.203 m thickness of ballast), and in these cases, the continuous welded rail is recommended. The distance between sleepers can also be 0.61 m when there are steel sleepers in a ballast section of 0.203 m thickness [
1].
Sleeper density is the number of sleepers per track length, usually given per km. Sometimes it is better to define the number of sleepers per distance because the sleeper spacing is variable depending on their location along the track, as in cases of turnouts, switches and crossings, and rail joints, where sleeper spacings are variable. Previous works [
1,
2,
3] studied the effects of increasing the support position between the slab track and ballast track. The results showed that the best option was to separate the first sleeper, at 0.6 m, from the axle of the last support on the slab track side. Normal values of sleeper density are around 1660 sleepers per km [
4]. It must be considered that a reduction in the distance between sleepers causes an increase in the stiffness of the track. This effect is similar to the increase in the size of the sleeper [
5]. Normally, a high stiffness is desirable and better than a low stiffness. However, both extremes are detrimental. High stiffness produces accelerated wear, fatigue, and cracking problems [
6]. On the other hand, the appearance of differential settlements, loss, and the wear of the ballast that can result in the hanging sleepers are common problems in tracks with a low stiffness [
7]. It is important to note that the poor quality of a track may lead to a decrease in passenger comfortability and safety [
8], and the deterioration of the vehicle–overhead system interaction performance [
9].
It is necessary to study the distance between supports (sleepers) in the ballast track, as it can reduce considerably the initial construction costs, and because it implies the reduction of the material. Therefore, it is desirable to carry out this analysis, but always without jeopardising safety and good quality conditions. It is important to save materials in the short term (during construction, estimated from 15 to 40% cost savings, depending on distance) and in the long term [
10].
All track elements are important to have an overall understanding of the track performance. It is known that cost of the track can be assumed proportional to the number of these elements. This cost can vary depending on different factors, such as orography or the structures and punctual elements that can be found along the track, the latter of which being the ones that most affect the cost. The track cost in railways it is usually given per km. To have an idea of this, the total cost of the first high speed line (Madrid–Sevilla) in Spain was EUR 2.704 M, which means a cost of EUR 5.4 M per km [
11]. Infrastructure costs (ICt) can be divided into construction costs (IC
C) and maintenance costs (IC
M) (ICt = IC
C + IC
M) [
12]. All elements of track structure are inside these two components. Sleepers in the track are included in the construction costs, as they are a track material necessary to build a proper railway track, but they also need to be maintained, and therefore they are also included in the maintenance costs. The infrastructure costs are fixed costs that evolve linearly with the length of the corridor. Construction cost is proportional to the number of kilometres of the railway line, and as sleepers are also proportional to the track length, it can be said that the number of elements is proportional to the construction cost. A reduction in the number of track elements per track length can help to reduce this part of the equation ICC. Therefore, a reduction in IC
C may cause a reduction of ICt.
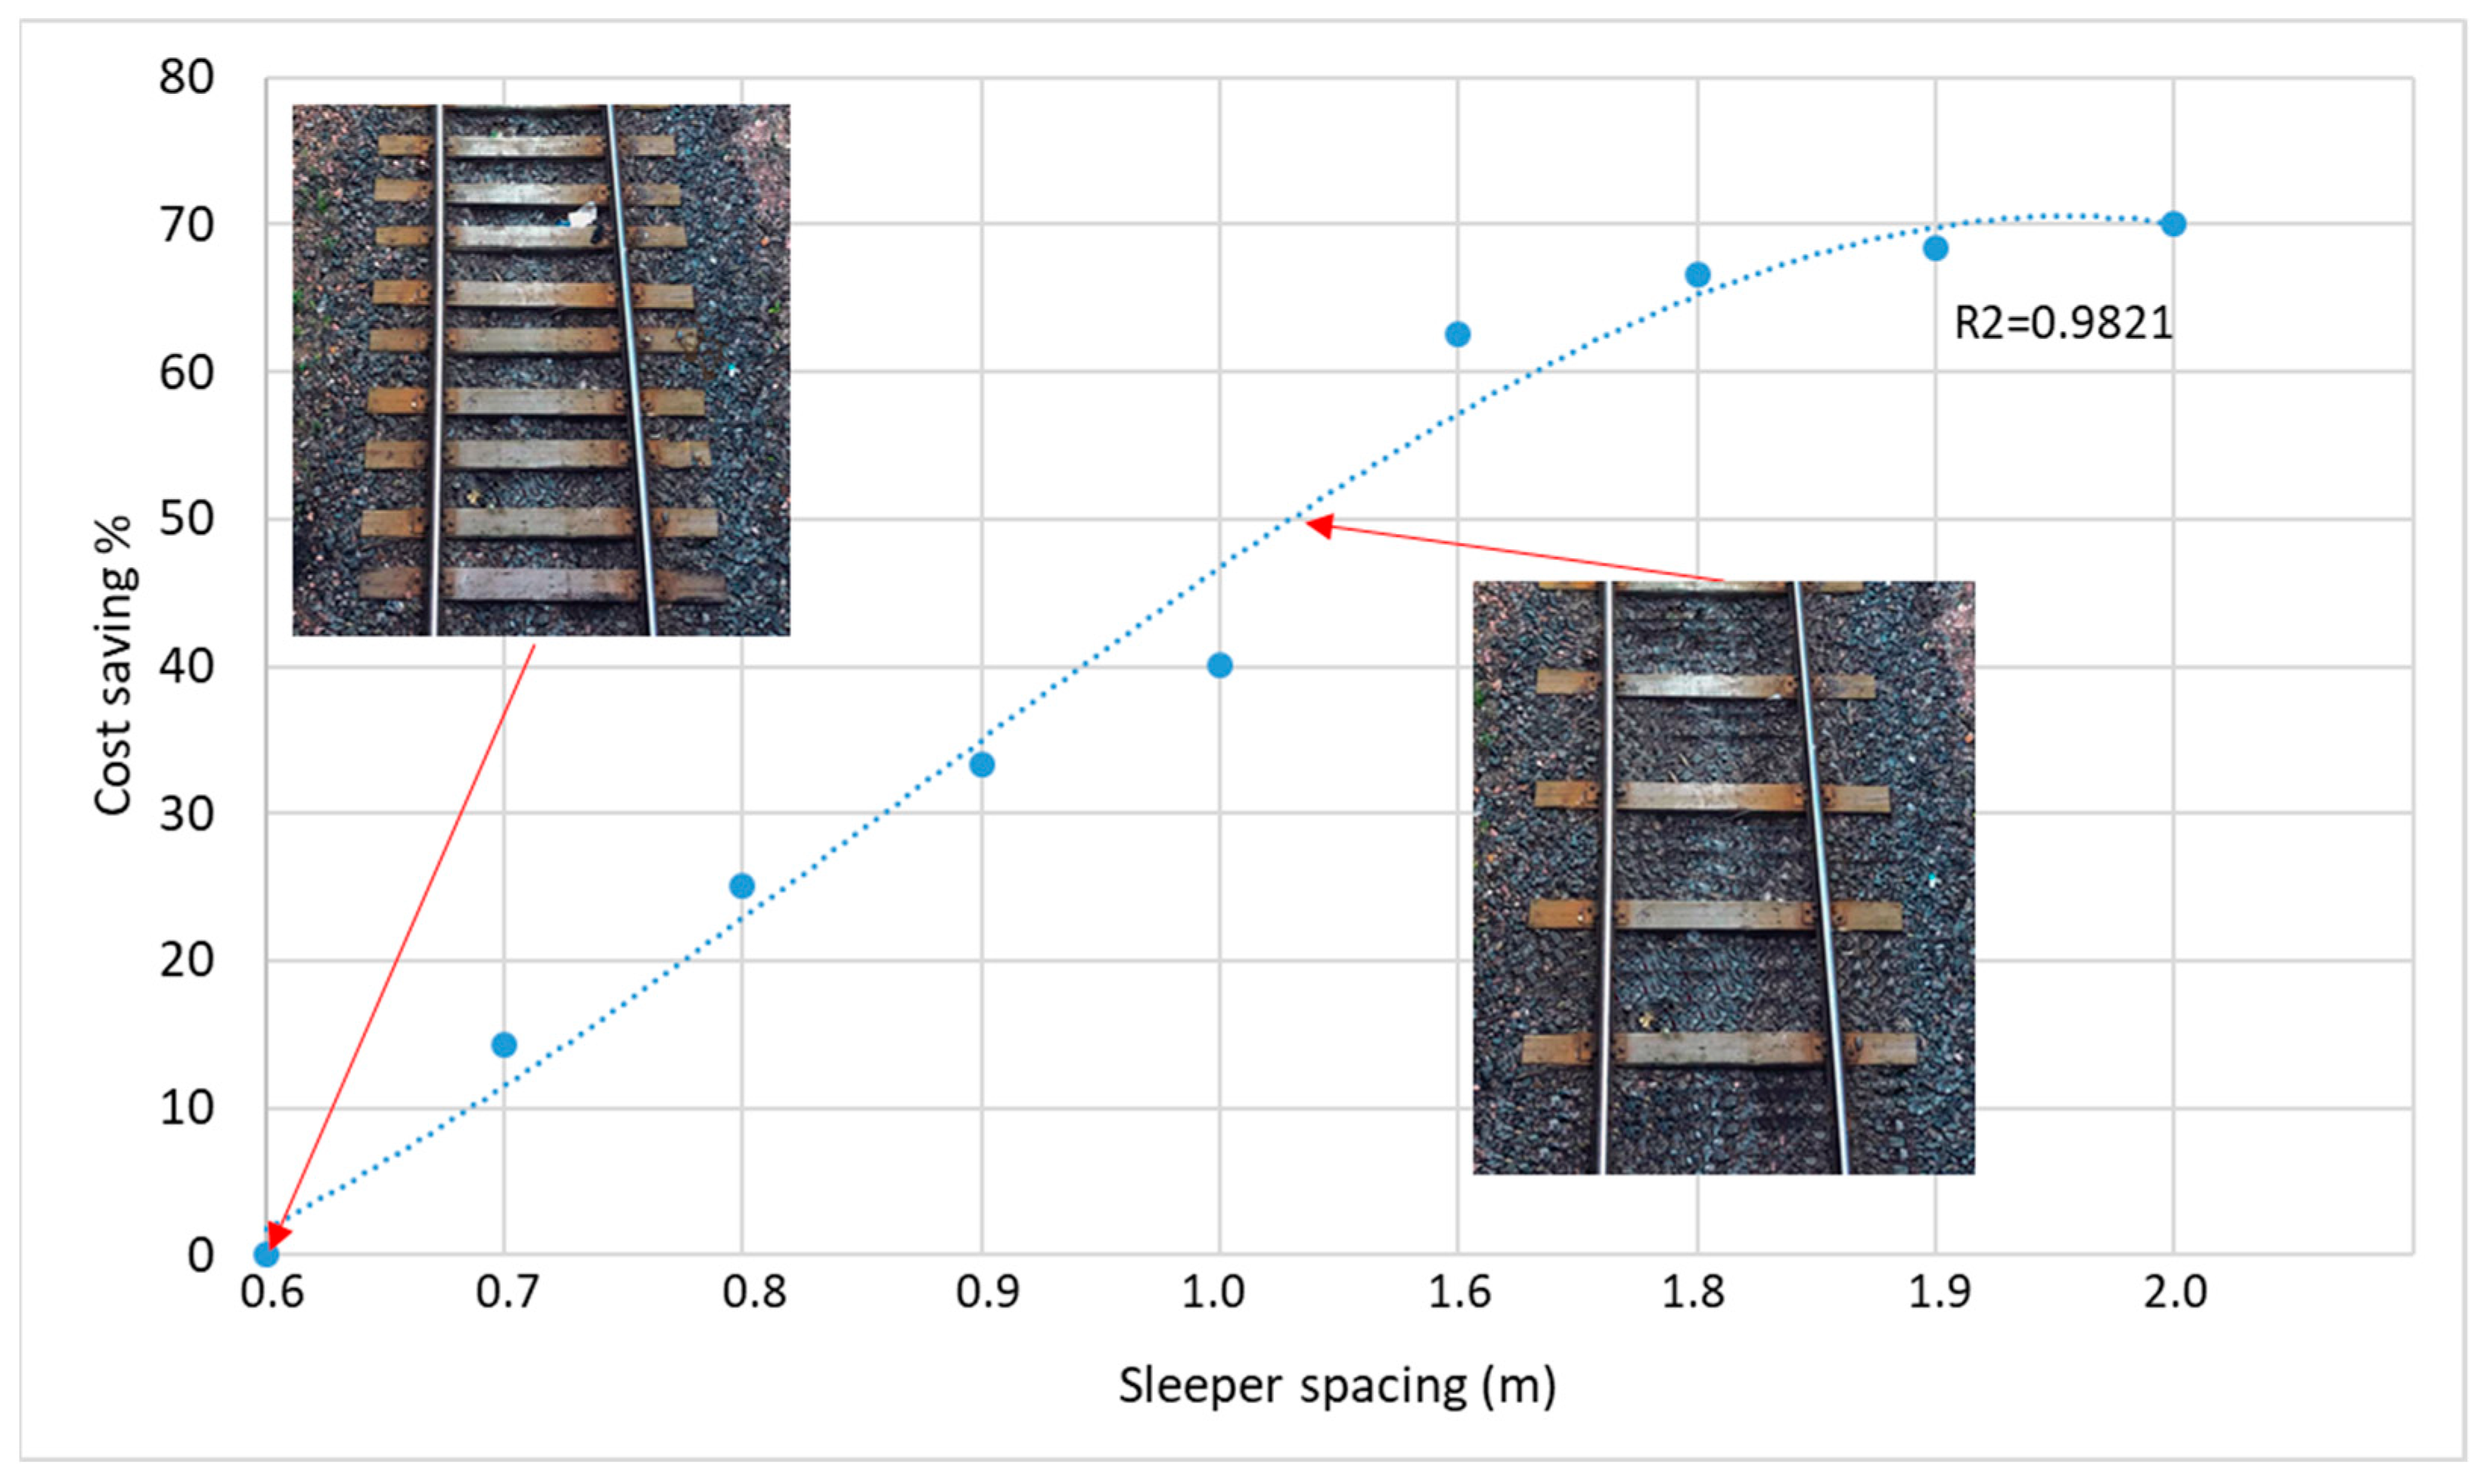
Figure 1 shows the savings in relation to the increase in the sleeper spacing. In order to achieve this, it is necessary to analyse the options to increase the sleeper spacing under the safety limits to the circulations (moving material, passengers, and users) as well as the track structure. This figure was taken from [
13], where there is an important discussion about this matter. It is important to consider that track construction costs will change, but so will track maintenance and renewal. The distance between sleepers will affect the frequency of track maintenance [
13].
Up until now, there have been some studies showing that it is possible to increase the commonly used sleeper distance in Spain and most European countries, which is 0.6 m between axes. Several countries use longer distances, as with UIC (Union Internationale de Chemins de Fer). For example, the sleeper spacing varies depending on the track gauge [
14], reaching values up to 0.73 m. According to [
15], the spacing between sleepers depends on several factors, such as the resistance of the rail, the type of the sleeper, the ballast thickness, the bearing capacity of the subbase, the axle loads, the volume, and the speed of the traffic. The ORE (Office of Recherches et Essais de L’union de Chemins de Fer), today known as UIC, recommendations consider values between 450 and 650 mm as acceptable for the distance between sleepers. In addition, sleeper spacing in the range of 630 and 790 mm had a negligible influence on the vertical stress level in the subgrade for a unit loading applied to the sleeper [
14]. Some authors, like Wu and Thompson (2000), study the optimal arrangement [
15] by the repetition of a track unit composed of five sleeper bays of 0.6 m spacing and five bays of 0.7 m. Other authors [
16] have recommended to choose the optimum sleeper spacing between 0.54 and 0.67 m. American railroads present an increase of just 10% of rail stresses and no increase on the bearing pressure between sleepers and the ballast when the sleepers that are 12 inches (0.305 m) wide are spaced at 30 inches (0.762 m) instead of the conventional distances (0.6 m) [
17]. Most railway administrators limit this spacing depending on the track loads and train speed. For example, Indian railways have three main distances between sleepers’ axes, and depending on the type of line and sleeper spacing, they can be increased up to 1.0 m.
From data obtained in previous studies, it seems that the distance between sleepers can be increased but there is no maximum clear value or recommendations for it [
13]. In the research of [
13], the authors talk about the transversal direction in relation to sleeper spacing. The theoretical results show a more than 40% reduction in the track lateral resistance from a spacing of 600 mm to a spacing of 1000 mm. Therefore, it will be important to keep studying the effects of changing the sleepers’ distance and providing more data to clarify the possibilities and give some guidelines to increase the distance between sleepers. This work presents a numerical 2D study to analyse the performance of the ballast track when the distance of the sleepers is varied. Several parameters, such as the sleepers’ material, dimensions, rail type, and train velocity, are analysed. This paper is focused on sleepers spacing in classical railway tracks (ballasted tracks), while the analysis of slab track support spacing is out of the scope of this paper.
Recent studies have analysed the structural response of monoblock railway concrete sleepers and fastening systems under vertical and lateral loads [
18]. Here, the researchers present a three-dimensional finite element railway model to study the structural response of concrete sleepers and the fastening system. As a complement, its authors study the influence of sleeper spacing. They conclude that the influence of sleeper spacing on the behaviour of railway tracks is only tangible. This previous parametric analysis sheds some light over the sleeper spacing. Here, some of the study’s magnitude includes an experiment with a slight increase with the sleeper spacing, for example, the lateral contact force at the rail angled guide plate interface, the maximum compressive stress of concrete material, or the compressive stress in the rail pad; however, other parameters experiment with increasing the sleeper spacing, and the vertical rail-seat contact force. The results presented here go further and offer more solutions in relation to sleeper spacing.
The manuscript is structured as follows. After this introduction, the next section describes the numerical model, where the train and track models are described. The next section presents all the results obtained in the numerical analysis. After that, a parametric analysis of the results is carried out to find a suitable sleeper spacing. An extended discussion of the results is found in
Section 4. To finish the study, the conclusions section resumes the most important findings of this research, providing a range of potential sleeper spacings.
2. Numerical Analysis
Finite elements analyses, using the 2D finite element software [
3], were performed to study the track behaviour and the effect on all the elements of the railway superstructure when the distance between sleepers is modified. The feasibility of increasing the sleeper distance without jeopardising the safety of the track will be analysed by modelling a reference case, followed by parametric studies to analyse the effects on various track configurations, on the track displacements, stresses, and strains. Numerical models have helped in numerous applications to railways, in track transition structures analysis [
1,
2,
3,
7,
18,
19,
20,
21,
22], in evaluating the structural analysis of the variable railway gauge [
23], or to evaluate the slab track (asphalt), as in [
24]. Although the model uses real parameters and the mechanical properties of the materials, a similar model was validated in [
25].
It is important to highlight that this model is a simplified model (compared with others like the one presented in [
8,
9] in the preliminary analysis (within the ODSTRACK project)). Thanks to these initial results, researchers can manage and develop laboratory tests in the next phase of the project in order to have an experimental understanding of the phenomena.
Train and Track Model
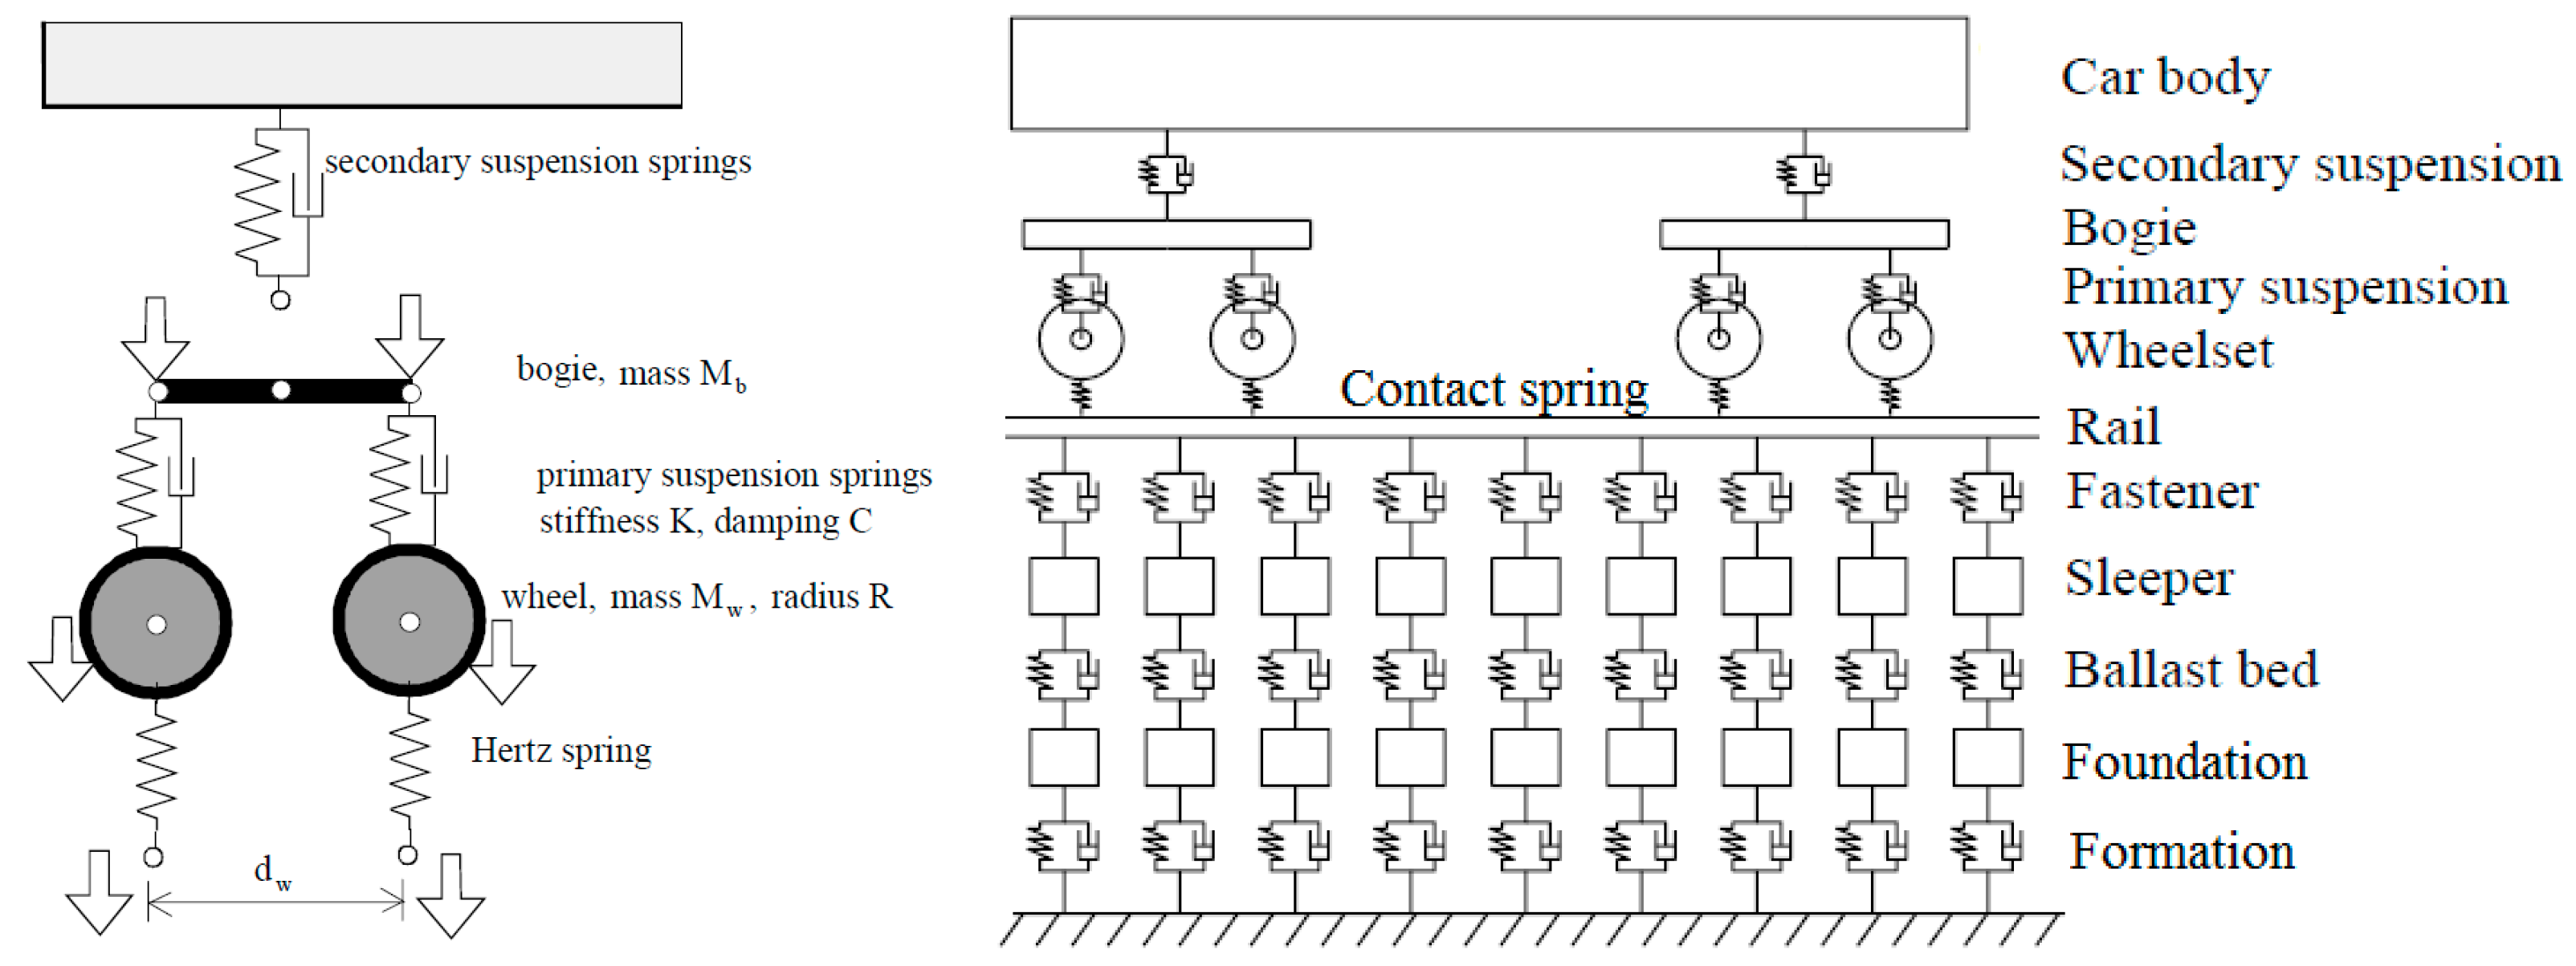
A ballasted track is chosen to perform the analysis. The model represents a 200 m length straight track. This distance is considered enough to obtain reliable results given the characteristics of the program and the length of the trains in the simulation [
3]. The finite element size of the track is 0.05 m, which means that there is a total of 4000 elements. To optimise the computational effort and time, central symmetry with respect to the vertical plane that passes through the centre of the track is assumed. Rail surface defects are not considered, and constant longitudinal stiffness is assumed. Elements of the track are formed by an inertial system of masses, springs, and dumpers. As with other models [
19], this uses a combination of spring and dumpers to represent the track and vehicle. Their properties are given in
Table 1 and shown in
Figure 2. The bending of the sleeper was not considered, as this will be the next step within the investigation for future work. Rail–wheel interaction follows the Hertz contact theory.
The train model used in the analysis is an ICE3 train (Siemens Velaro model). It consists of 5 cars modelled as a suspended mass and an inertial system of springs and dampers, whose mechanical characteristics are shown in
Table 2 and in
Figure 2. The simulations are carried out for different train speeds, varying from 40 km/h to 350 km/h, to cover high-speed velocities. Transient time of calculation was between 2 and 4 s depending on train speed and finite element size.
The sleeper distance is varied between 0.6 m and up to 1 m in 0.1 m intervals. To characterizes the performance of the track in each case, the rail, sleepers, ballast displacement, shear forces, and bending moments were also studied. To complement these variables, vertical accelerations in the sleepers and the train are also analysed. These variables have been chosen in the study from a physical/degradation point of view (of the track).
It is important to consider initial assumptions in the used model:
- -
The model analyses a straight track section.
- -
The structure is loaded by vertical loads only.
- -
In the horizontal plane, the structural properties are symmetric with respect to the track axis.
- -
No track transversal stability has been analysed.
- -
The contributions of the axial forces in the layers are neglected.
- -
Bending length of deformations of the stiff layer is bigger than the thickness of the stiff layer.
- -
Thermal effects have not been considered in the study.
The model represents a conventional high-speed track with the typical elements commonly used in Spanish railways lines (conventional and high-speed). This is the reference case, and no elements are considered under the ballast layer. This initial configuration is chosen because the authors wanted to see the performance of the different superstructure elements in first place and to have an initial model to compare with the rest of the cases. Infrastructure layers are considered as a case itself. To broaden the analysis to other track configurations, materials, and train conditions, a parametric study varying the train speed, dimensions, and the materials of the sleepers and the infrastructure layers are analysed. All the different studied cases are summarized in
Table 3.
This model has been used and checked in other previous analysis performance [
1,
7,
10,
11,
20,
21,
22]. The model was also used before to solve the track transition problem. It only considered vertical loads and symmetry with respect to the track axis. The initial assumptions considered straight track and track axe symmetry. According to [
26], the investigation shows a new approach to evaluate the lateral resistance associated with extended sleeper spacing. This research shows laboratory tests and investigates the effect of the interference between adjacent sleepers on the lateral resistance per sleeper. Here, the researchers proposed a new method to estimate the lateral resistance of a ballast with an extended sleeper spacing.
3. Results
Results of the parametric study are presented in this section. As was said previously, the classical ballasted track has been used in this study. For each case, the vertical displacements of the rail and the sleepers, the shear forces on the rail and sleepers together with bending moments, and the contact pressure between the sleeper and ballast are presented. In some cases, the vertical accelerations in the train and sleepers are also presented.
3.1. Conventional High-Speed Superstructure (Reference Case)
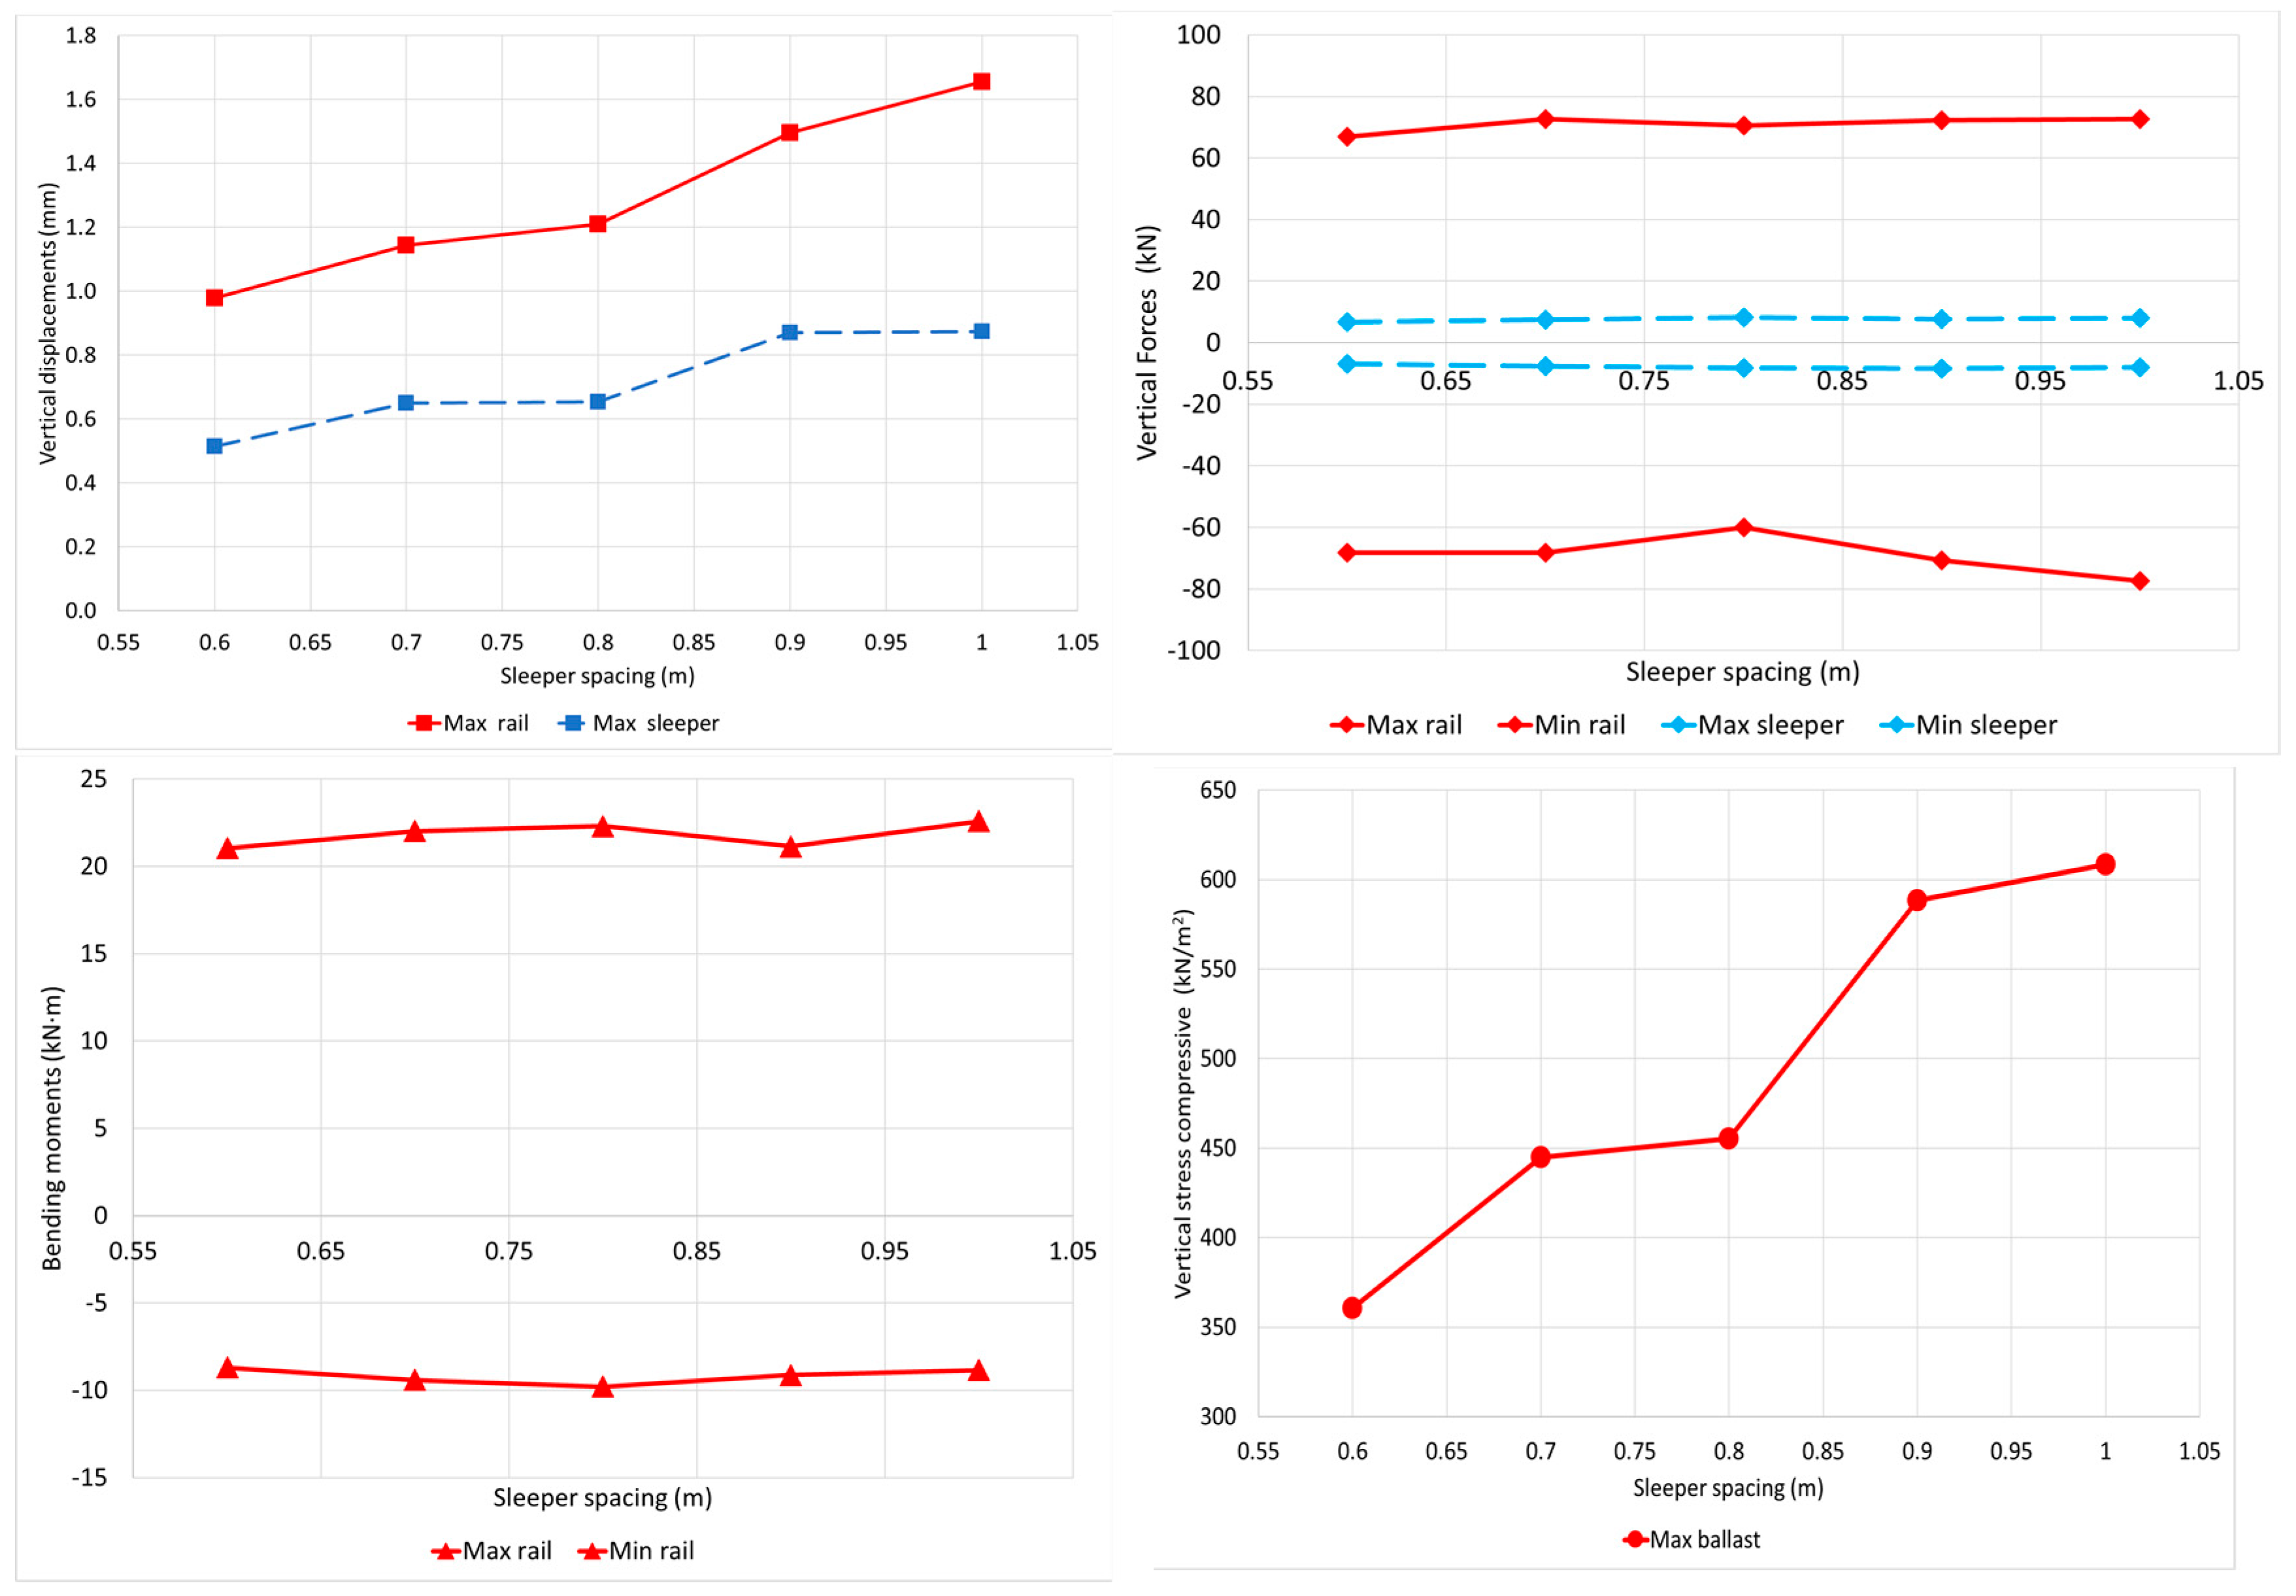
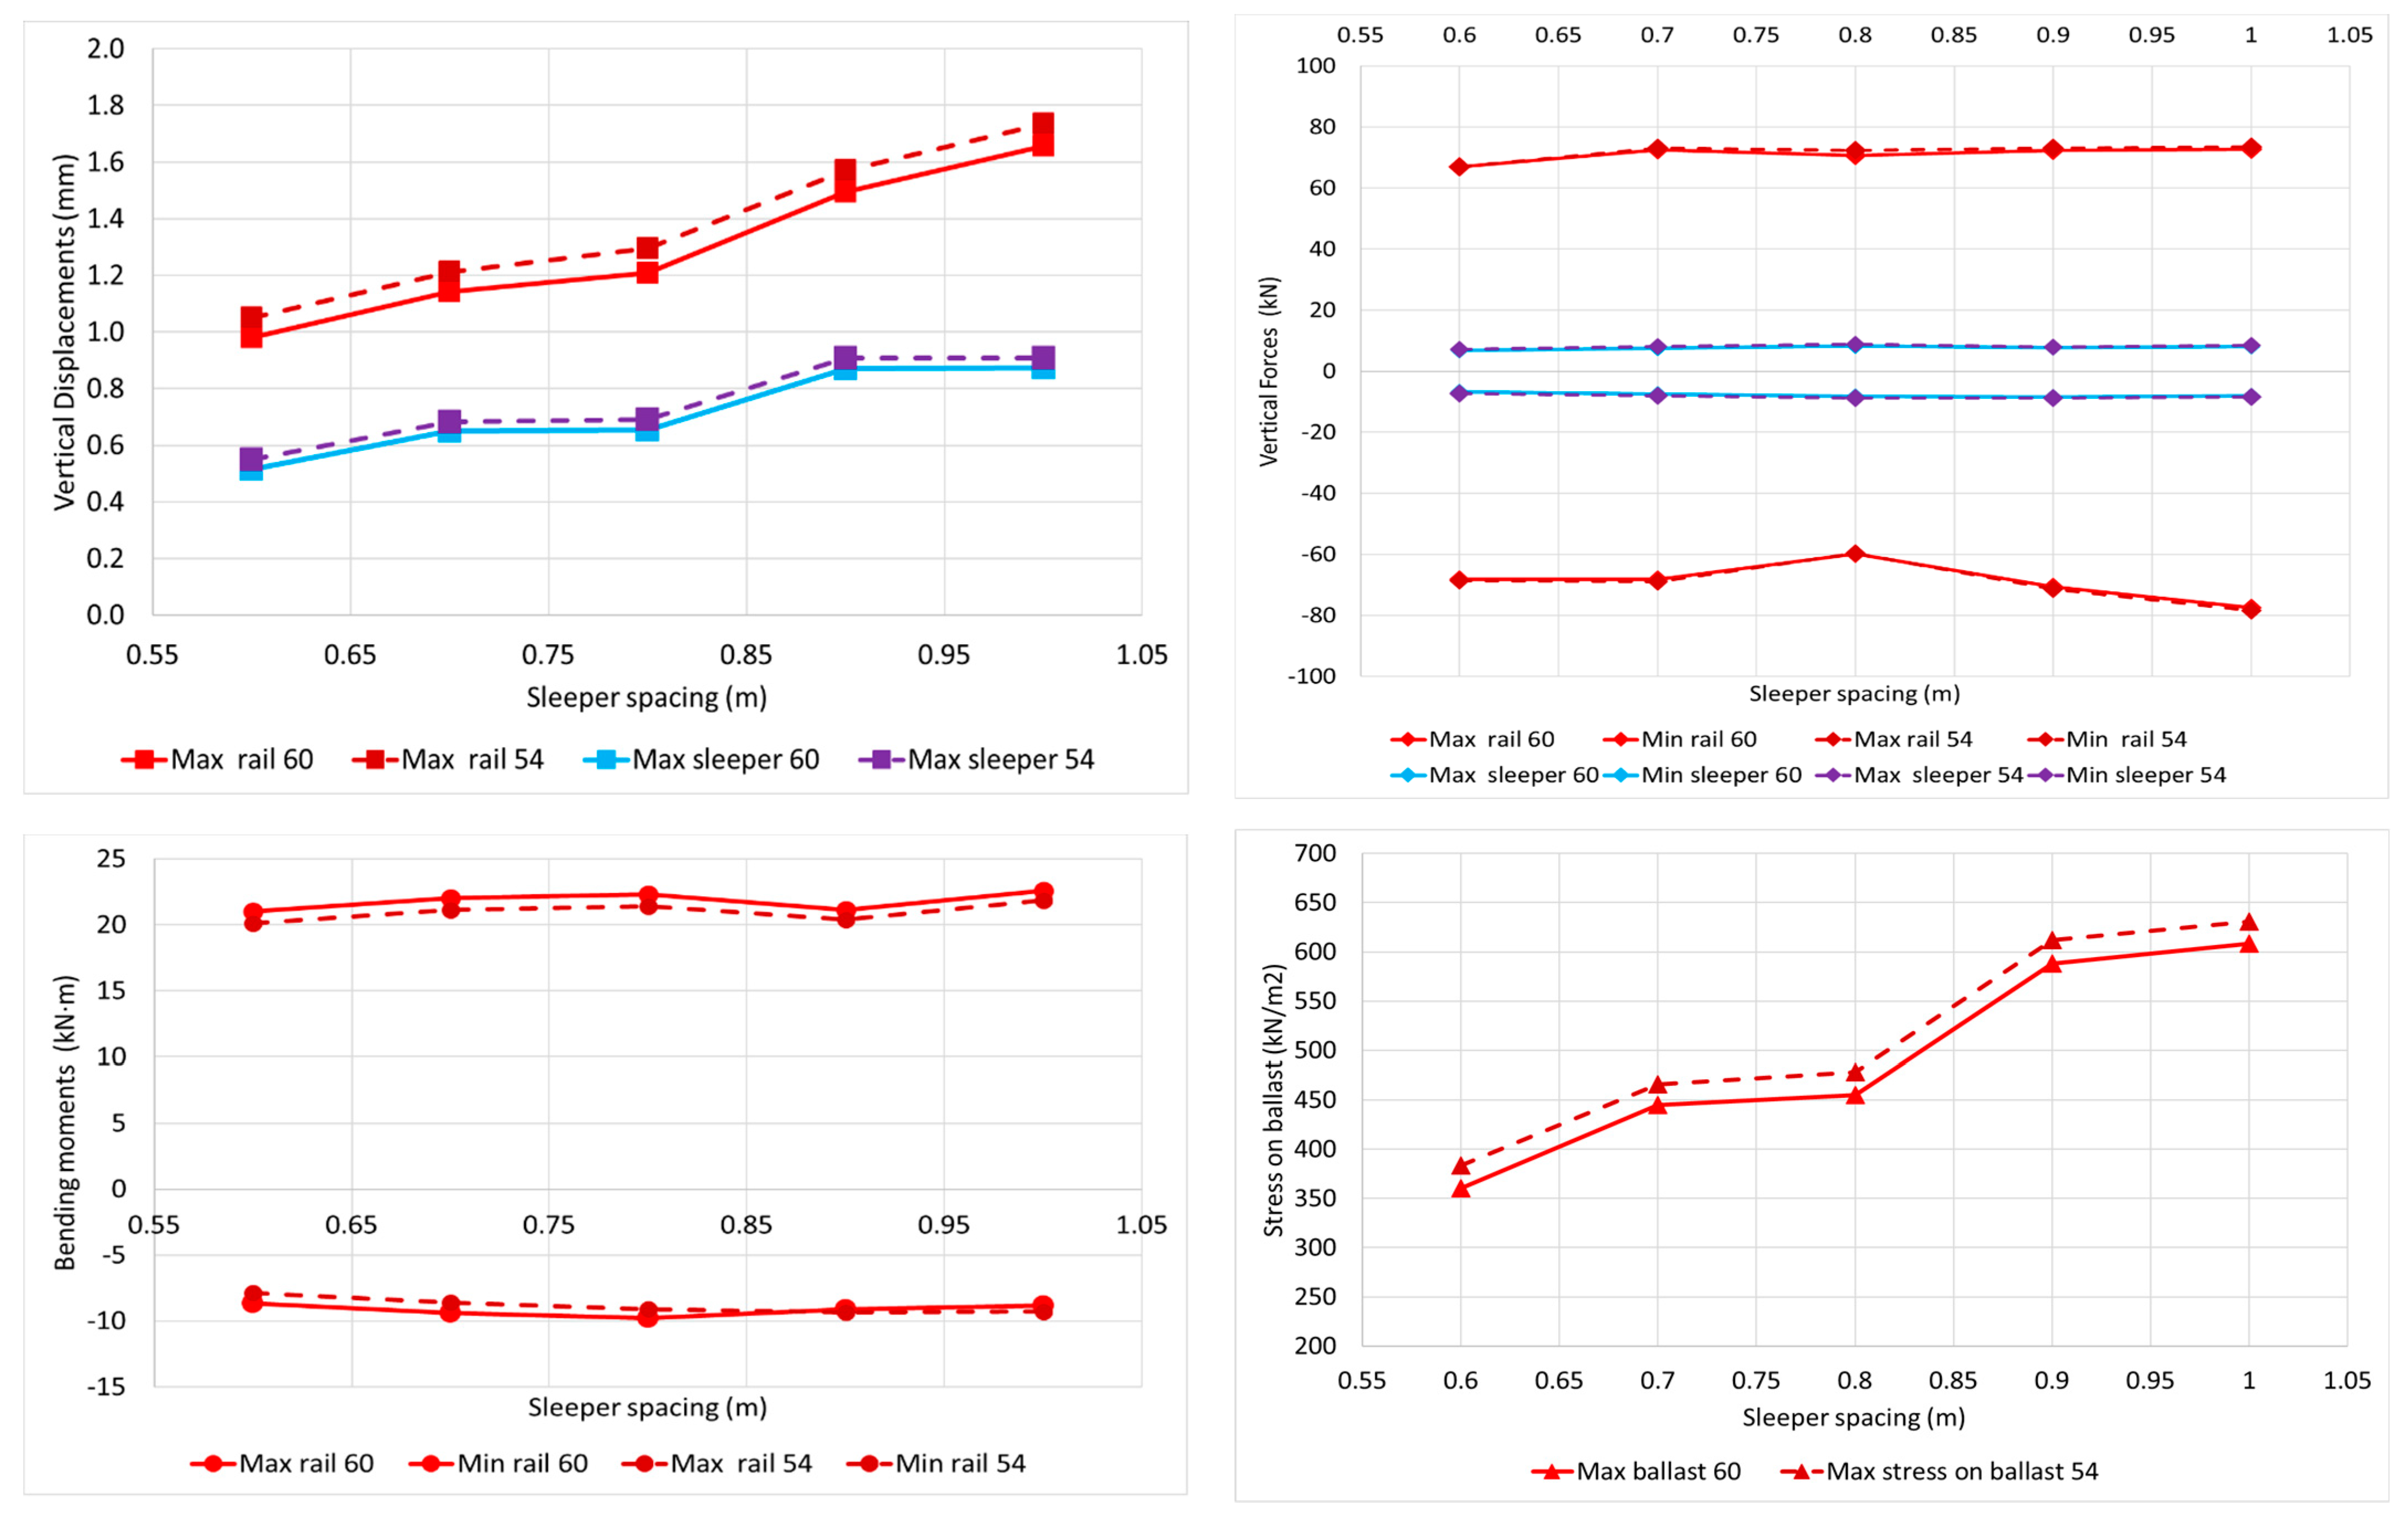
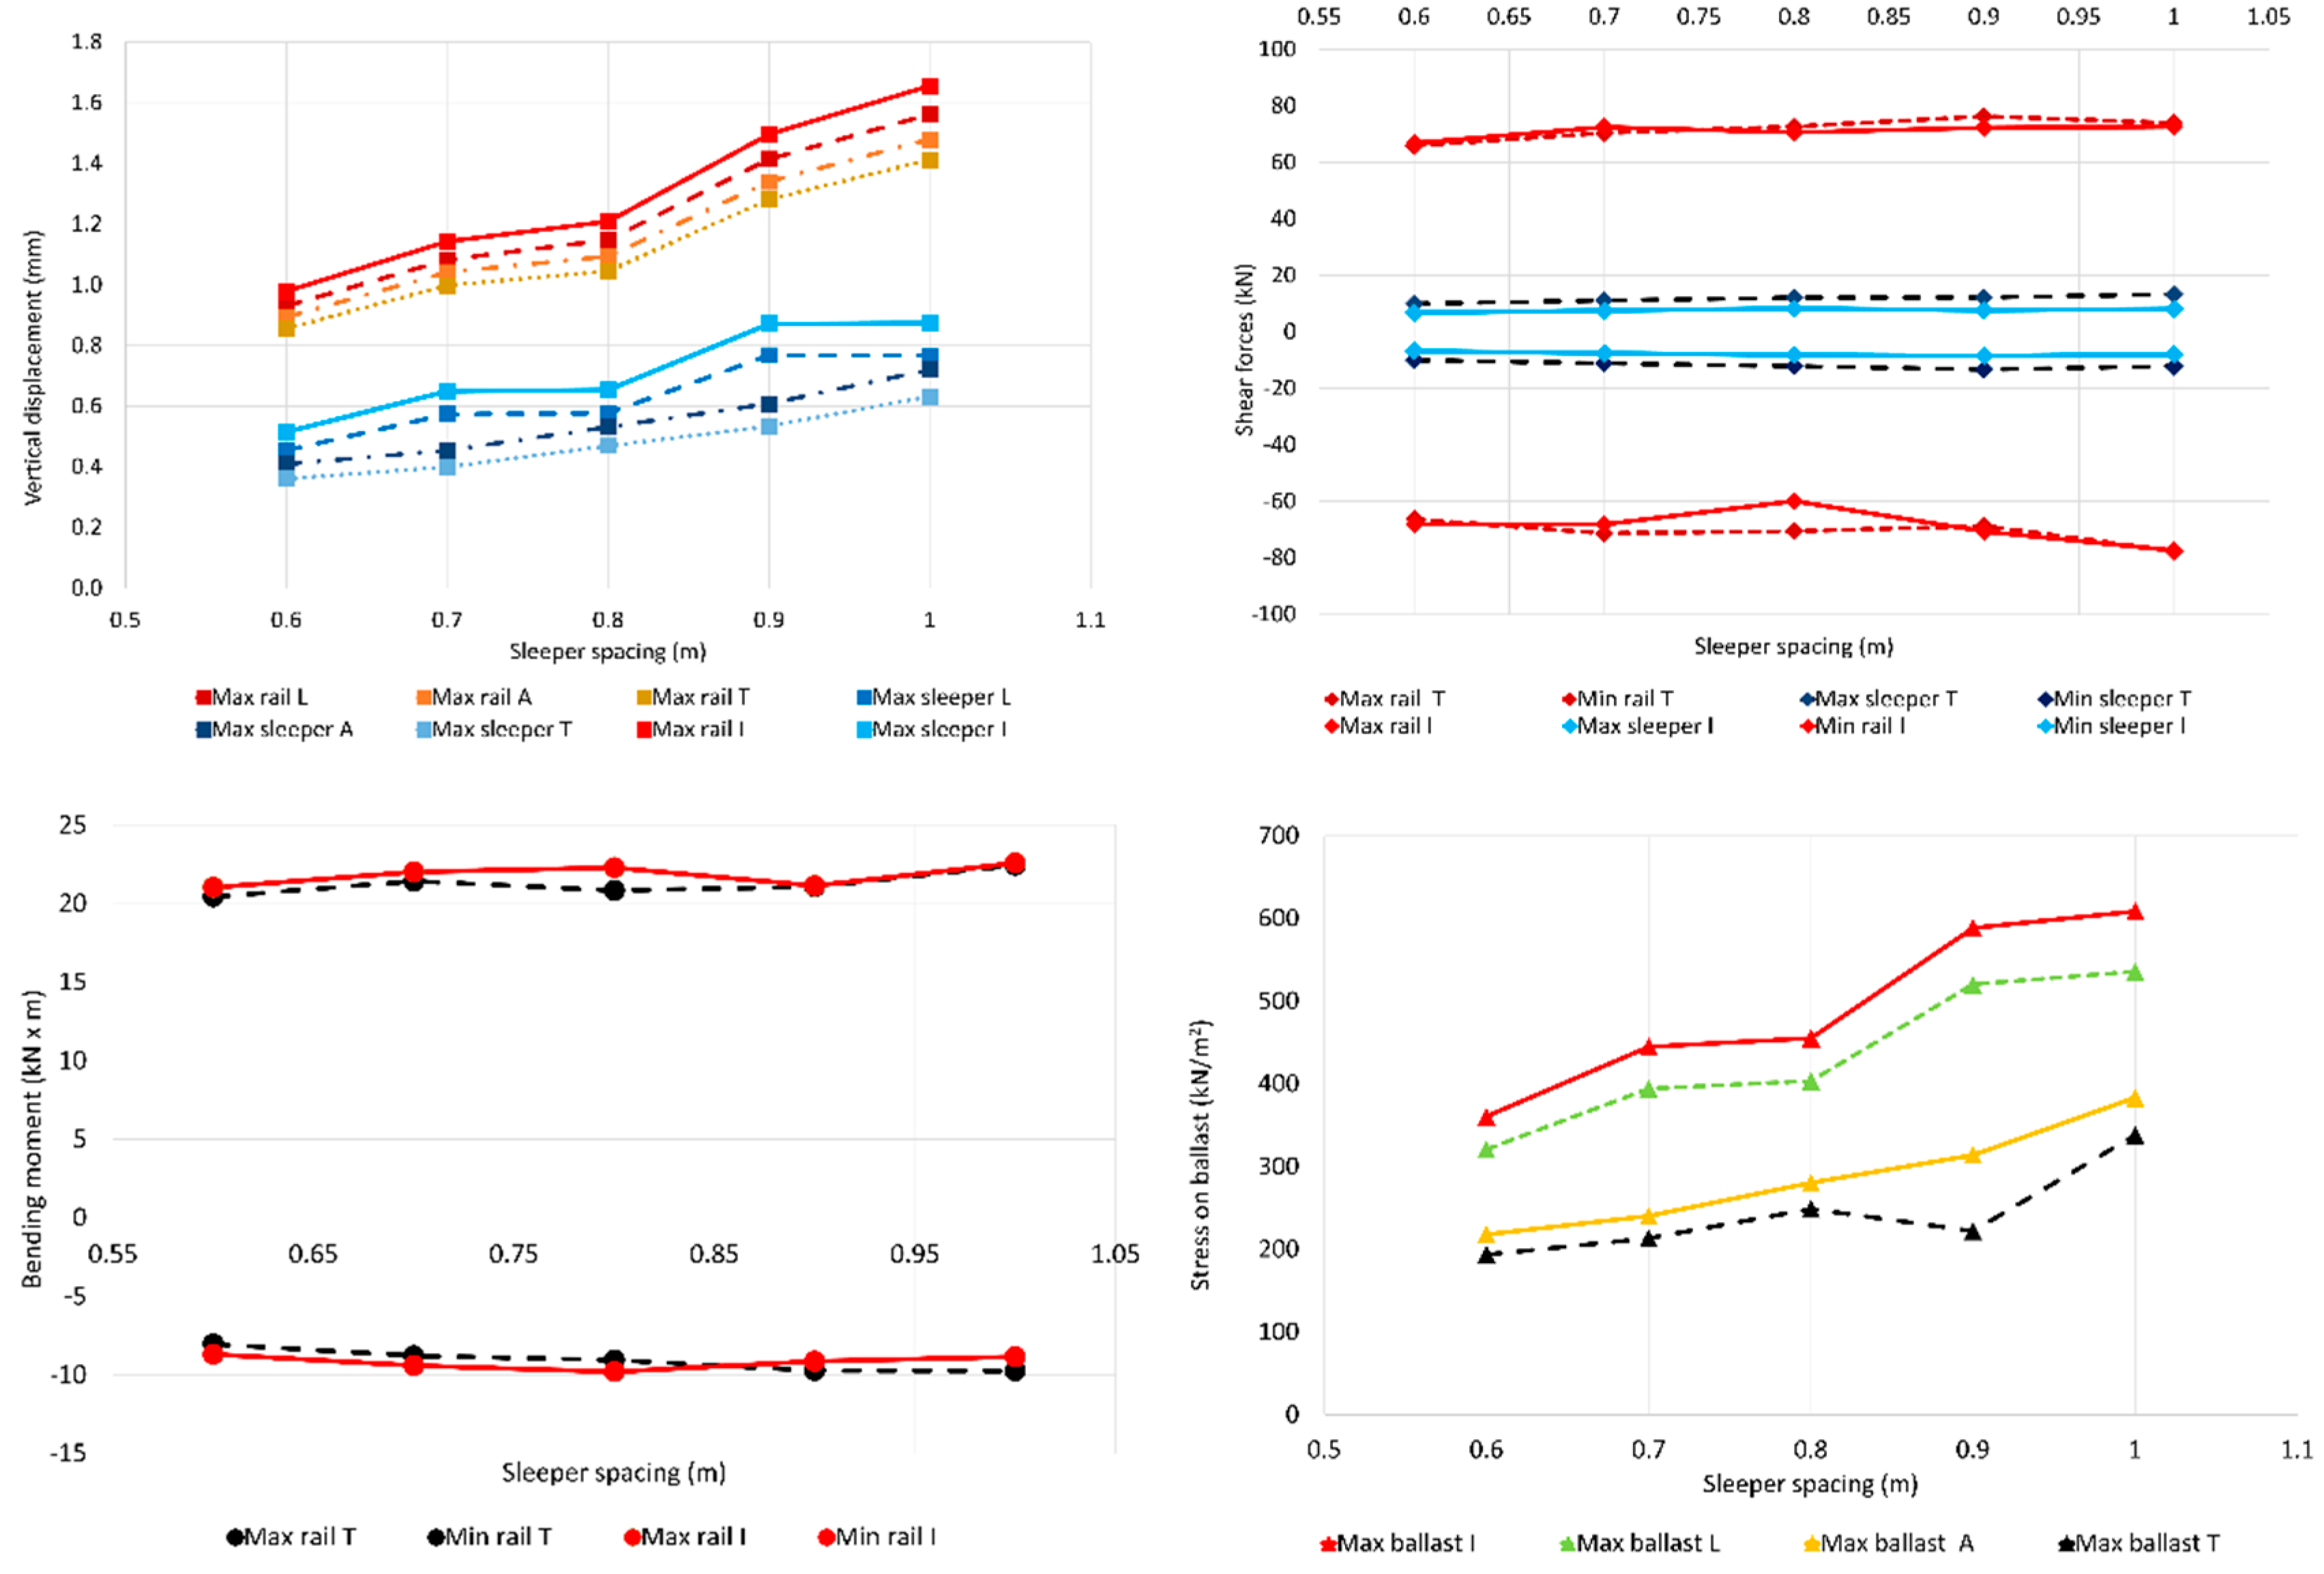
Results obtained in terms of vertical displacements, shear forces, bending moments, and vertical stresses are presented in
Figure 3 for the different spacings between sleepers. The positive values of vertical displacements represent the rail deflection. The positive values of forces and stresses are tension, and the negative ones refer to the compressive effects. In order to obtain the stresses on the ballast, recommendations from [
27] are followed, using a half sleeper area. This will be discussed in depth in
Section 4.
As expected, there is an increase of the maximum vertical displacements in the rails when the distance between the sleepers increases (see
Figure 3). The maximum vertical displacement of the rail is around 1 mm for the conventional sleepers’ distance of 0.6 m, and it increases to slightly more than 1.6 mm for the separations between the sleepers of 1 m. This means that attending the current rail maximum vertical displacements recommended values, the sleeper distance could not be increased because the rail vertical displacement goes up more than 1 mm [
28]. However, this limit of 1 mm is too conservative, and in most cases this value goes up to more than 1 mm [
29]. Therefore, it might be possible to increase it.
The maximum vertical displacement of the sleeper is affected in the same way. It is 0.5 mm when the distance between the sleepers is 0.6 m, and it increases up to 0.9 mm for the maximum distance analysed of 1 m. These values are all below the limits proposed, so there are no problems in this sense [
30].
The rail shear force does not exceed 80 kN in any case. It is not noticeably affected by the separation of the sleepers. The rail bending moments are not significantly affected by the sleepers’ distances. Their values are between 21 and 23 kN·m. The last variable denotes the stresses under the sleeper, and they are highly affected by the distance between the sleepers. They increase by almost 200 kN/m
2 when the distance goes from 0.6 to 1 m. Looking at
Figure 3, the trend for the variables considered can be appreciated. Vertical displacements and contact stresses between the sleeper and the ballast are the most sensitive variables to the increase of the sleeper spacing. This initial conclusion derived from the reference case needs to be checked in the rest of the analysed cases, so a parametric study is developed.
3.2. Speed Variation
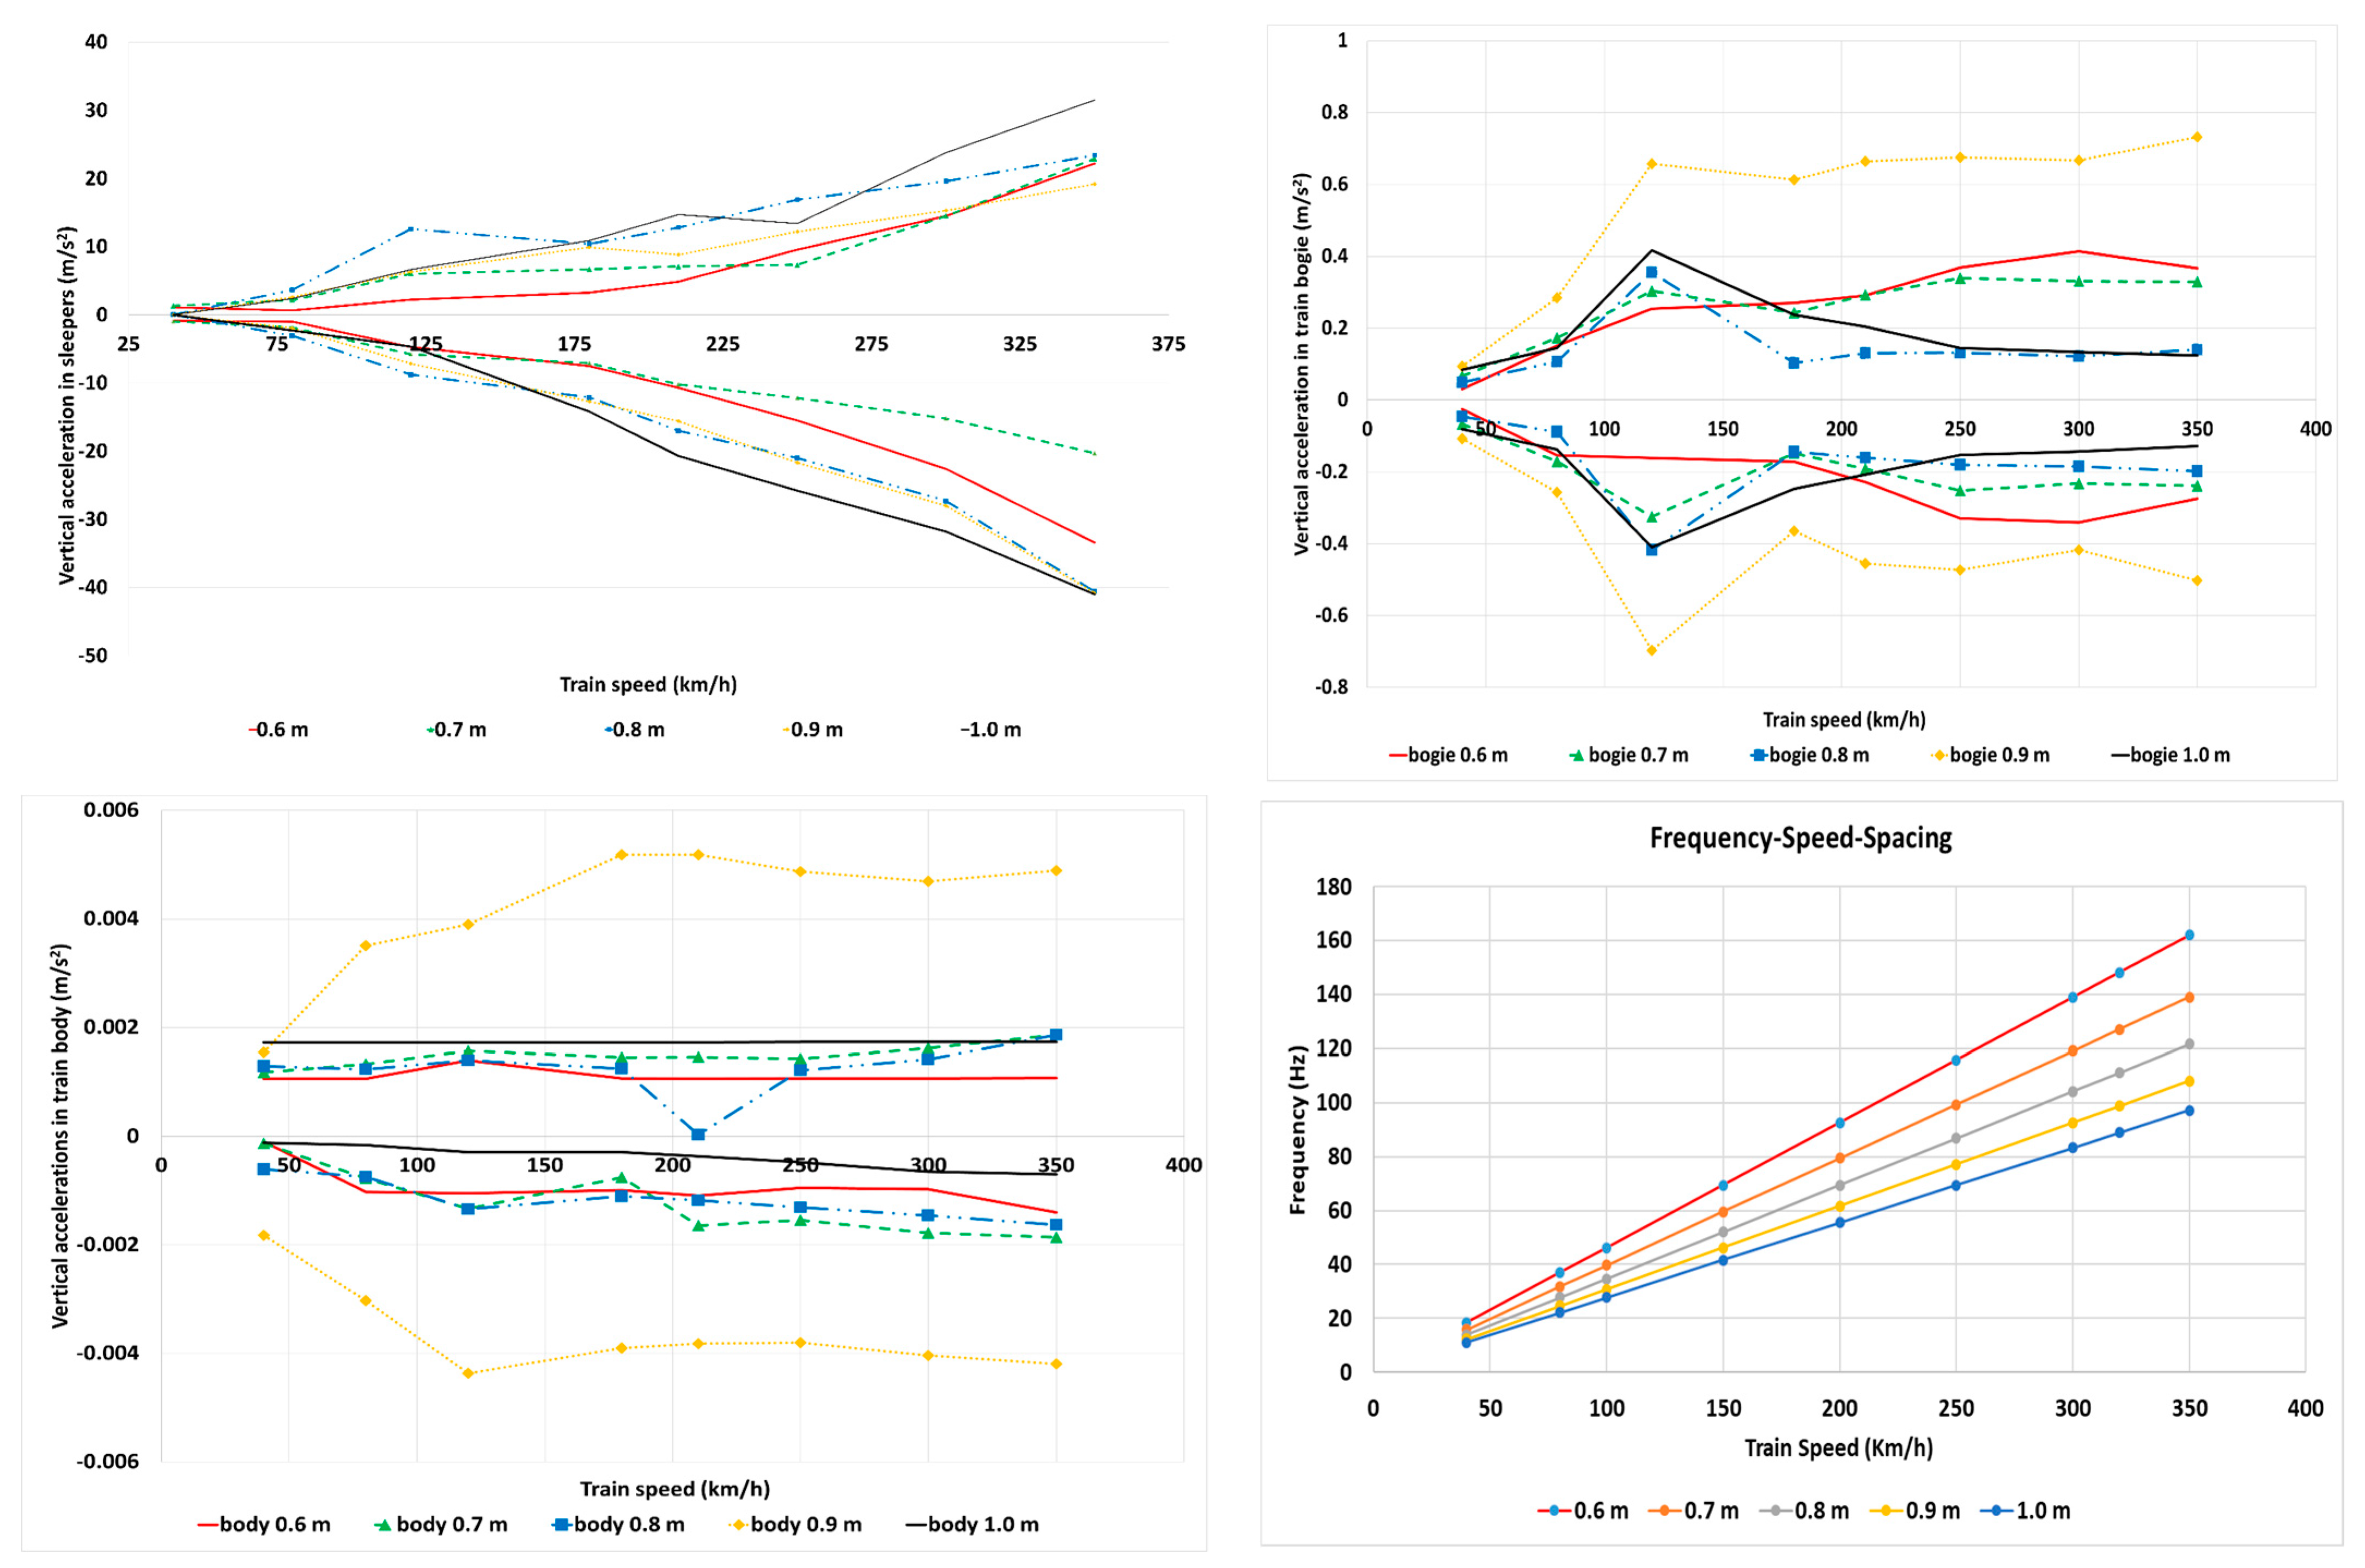
As presented before, speeds from 40 km/h to 350 km/h are analysed to cover all values up to high-speed lines. Due to the assumption of considering a constant vertical stiffness along the railway track, and not considering rail surface defects, there are very small variations in the values analysed with the increasing speed. To show the track performance when the train speed increases, in this case, the authors focused on the vertical accelerations on the sleepers and the vertical accelerations on the train (body and bogies), as shown in
Figure 4. The frequencies of the wheel force show a linear increase with the train speed and decrease when sleeper spacing increases (
Figure 4).
Vertical accelerations on the sleepers increase when the sleeper spacing increases. The smallest differences are found in the separations of 0.8 and 0.9 m. Accelerations go from 3 m/s
2 to almost 30 m/s
2 and up to 40 m/s
2 for speeds of 350 km/h. Admissible values can go from 10 m/s
2 [
31,
32] to more than 100 m/s
2 [
33,
34] according to different authors.
Vertical accelerations on the train, both in the bogie and in the body, initially increase and then, when reaching 120 km/h, they are more or less invariant when increasing the distance. In the case of the bogie, they do not exceed more than 0.8 m/s2. The accelerations measured in the passenger train go from less than 0.002 m/s2 to less than 0.06 m/s2. It is curious to observe that in the case of 0.9 m distance, the accelerations are much higher than in the other cases, even for the case of the 1 m distance between the sleepers’ axes. The motive of these anomalous values is not clear.
Vertical accelerations in the train (bogies and body) seems not to vary greatly when increasing the train speed. However, the vertical accelerations in sleepers increase with the train speed. This increase follows an almost a linear variation from 50 km/h onwards for all analysed sleeper distances. As presented before, the limits in the literature vary from 10 to 100 m/s
2, so considering an average value, it allows for sleeper spacings of 1.0 m. However, this is the most restrictive variable for the ones presented in
Figure 4. The simulation time is enough, and as can be seen in
Figure 4, the initial disturbances were stabilized in a steady state solution (train bogie and body). The track irregularities have not been considered in the analysis’ vertical accelerations, and this is the main reason why the obtained values are low, but indicative for the trend of the vertical accelerations.
3.3. Case 3. Rail Type
Two commonly used rails in Spain are used in the simulation, namely UIC 54 (54 kg per lineal metre) and UIC 60 (60 kg per lineal metre). High-speed railways use UIC 60 nowadays, and the UIC 54 rail is disappearing in most conventional tracks. Only narrow-gauge tracks in Spain keep this type of rail.
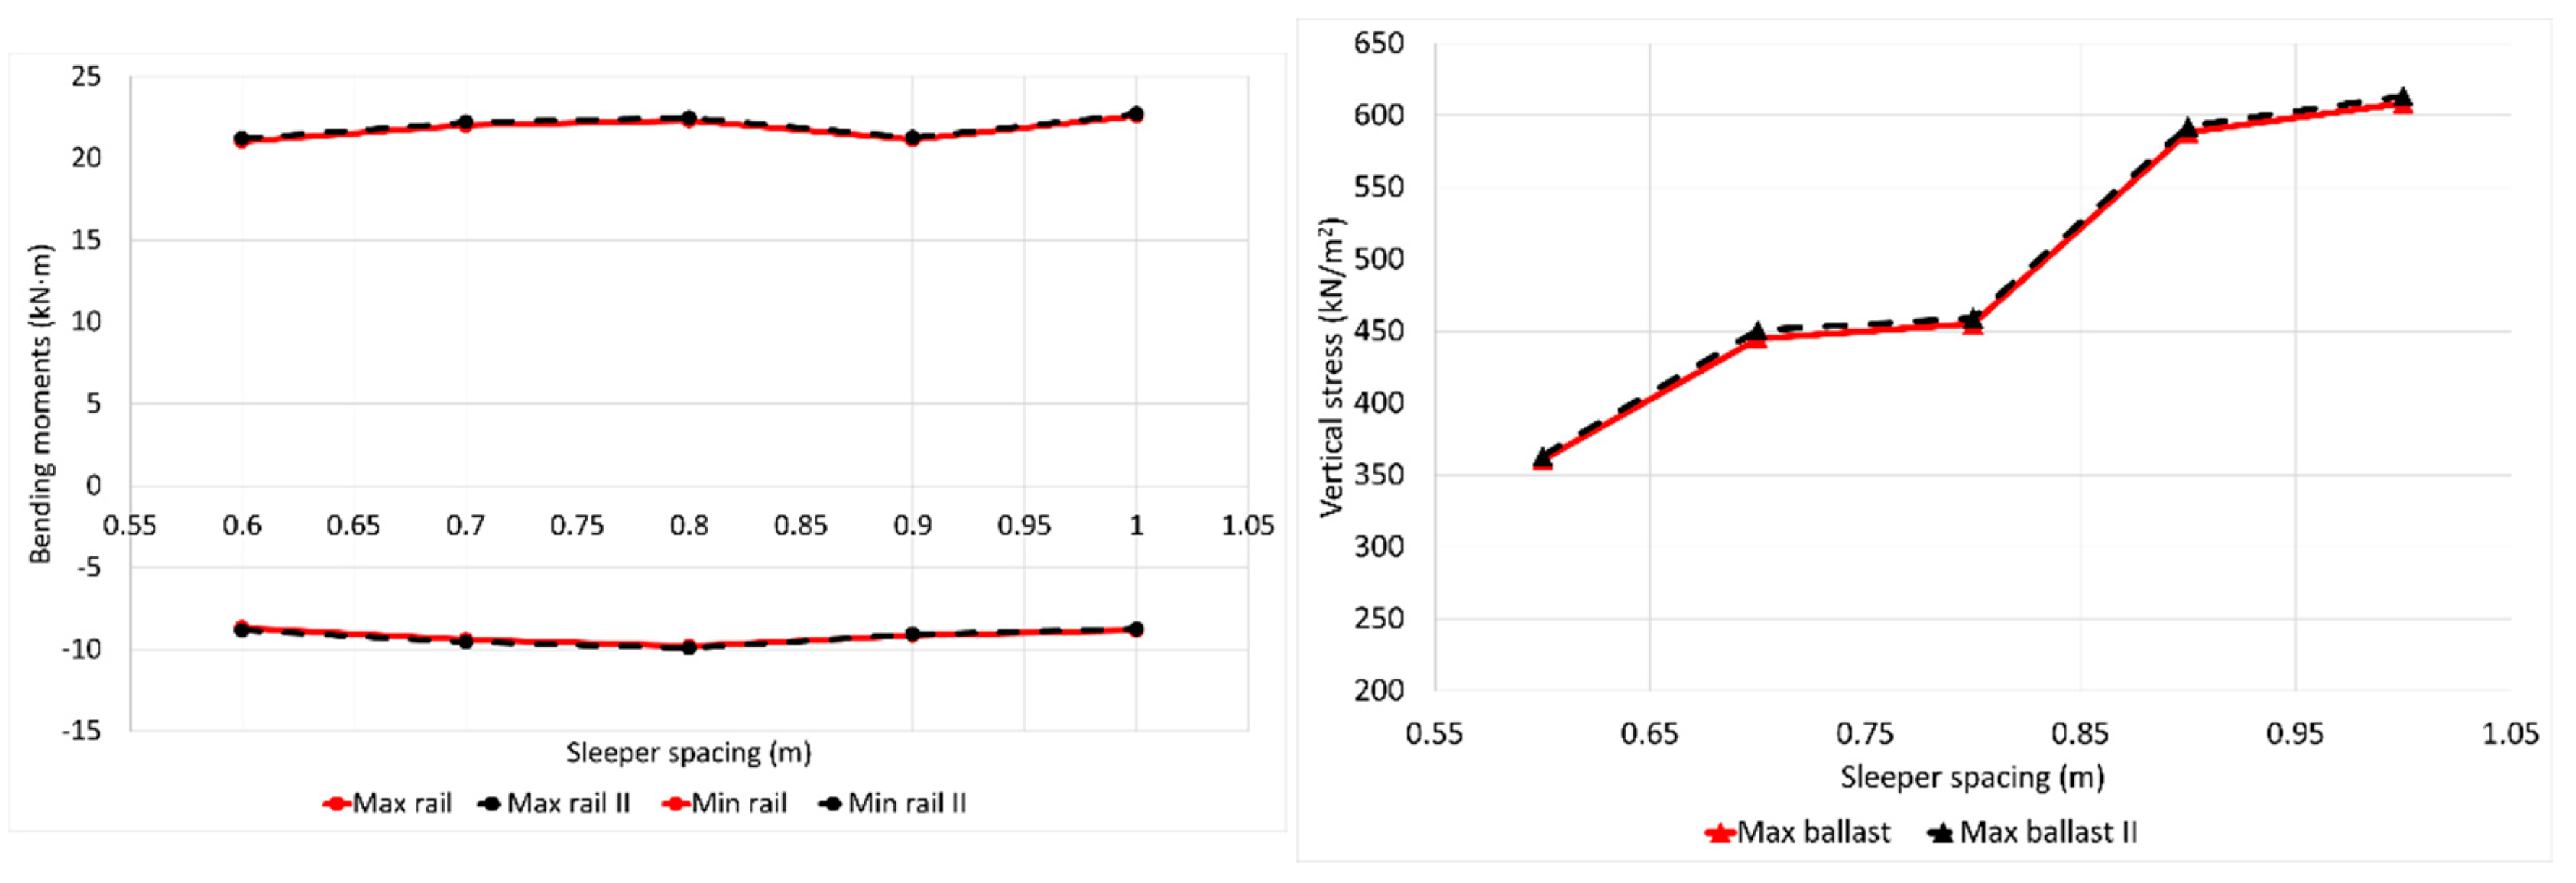
Figure 5 shows the vertical displacements in the sleepers and rails, as well as the forces and stresses for the two considered types of rails.
The differences between both types of rails are negligible, as, for example, the shear force on the rail, which increases when the distance between the sleepers increases, and as expected, the lighter rail suffers more. In the same way, the stresses transmitted to the ballast are lower when using the UIC 60 rail (heavier rails). The vertical displacements of the rail are around 7.5% less in the case of the heavier rail, as expected. All the values obtained are in the range of admissible values, presented later in
Section 4. When the sleeper distance increases, the vertical displacement in the sleepers increases as well, and the trend is similar in both cases. The differences are around 3.5%.
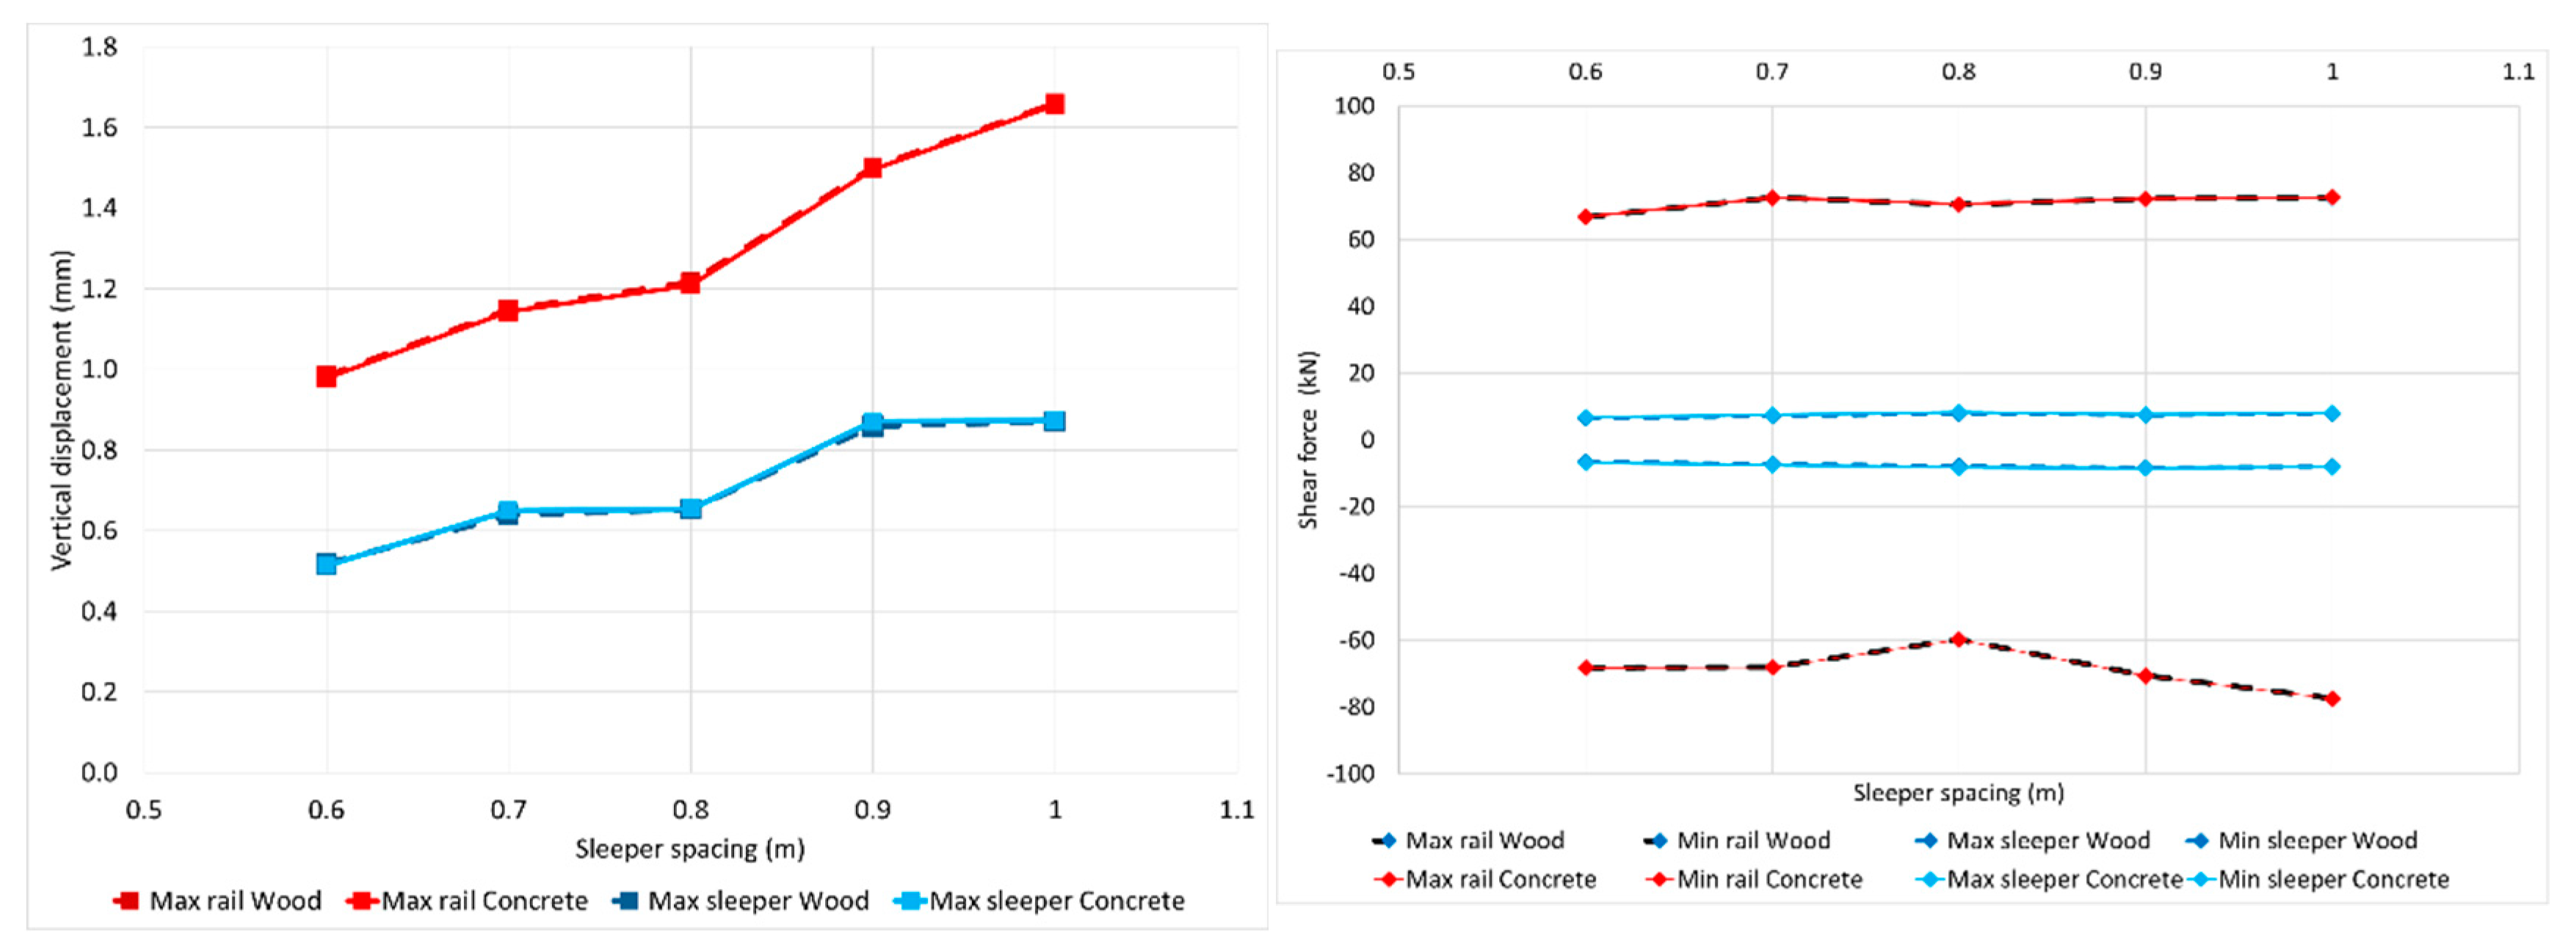
3.4. Sleepers’ Material
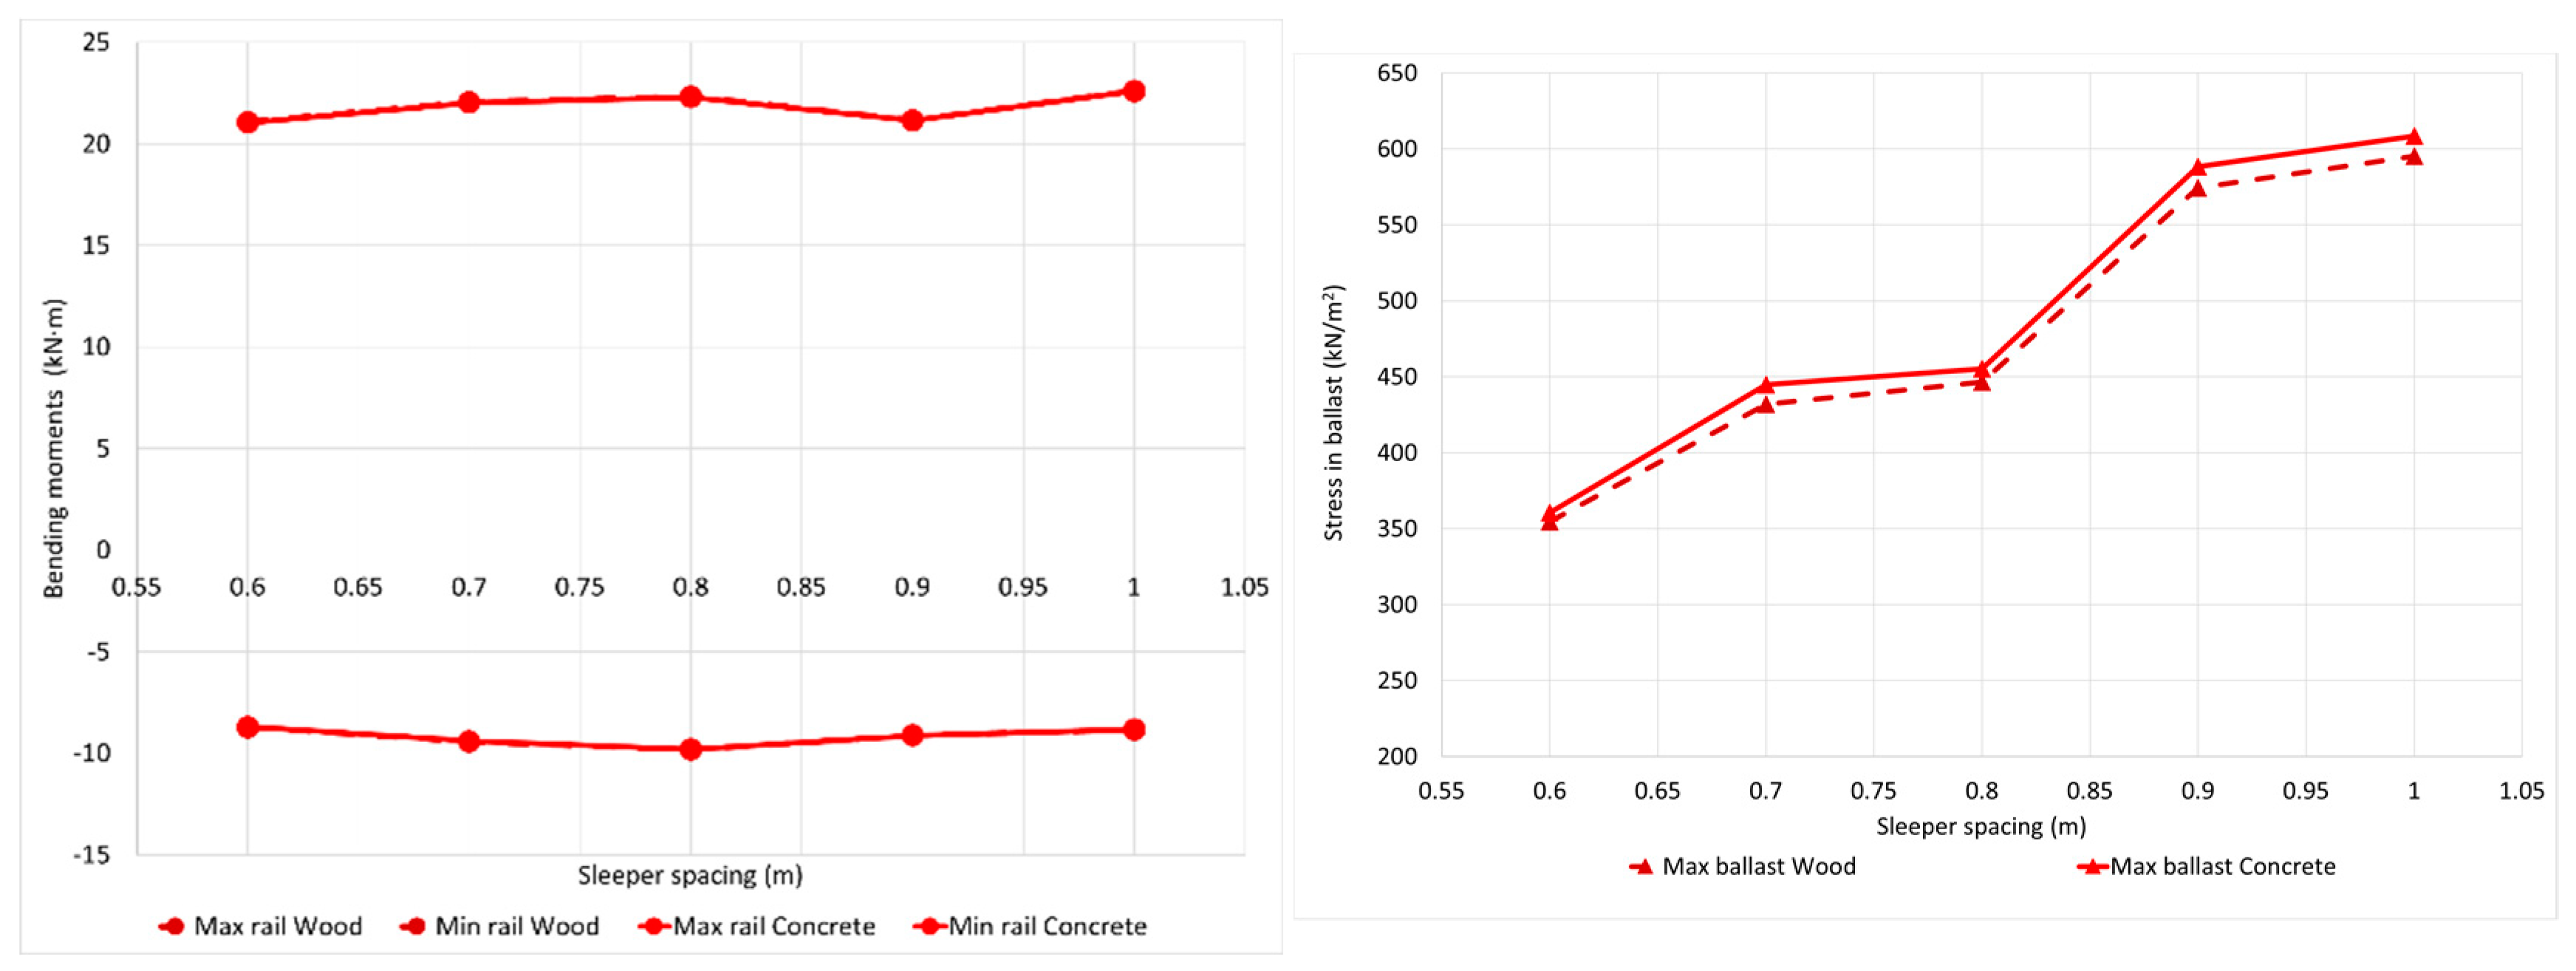
The influence of the sleepers’ material on the track performance is presented here. Two types of sleepers commonly used in Spanish railway lines are considered, the classic wooden one made by coniferous oak and the conventional prestressed monobloc concrete sleeper (type AI-04). Their properties are presented in
Table 4. Sleeper material in this model only resulted in sleeper mass variation.
In the same way, as for the two types of rails, the behaviour of the sleepers is similar from one material to the other. There are negligible differences in the shear forces on the rails and sleepers, and the stresses on the ballast. (
Figure 6).
3.5. Sleeper Dimensions and Size
The dimensions of the sleeper considered in the reference case are 2.6 m long × 0.3 m wide × 0.22 m high, which corresponds to a conventional prestressed concrete sleeper used in Spain in cases of an international gauge of 1435 mm. In this section, the effect of varying one dimension in the longitudinal direction and another in the transverse direction will be analysed (
Table 5).
The idea is not to increase considerably the size because the costs of the sleepers will increase as well. Therefore, the first two cases are to keep one dimension the same as the old sleeper, the AI-04. The last case increases both dimensions (length and width) to increase the support area of the sleeper (over the ballast). The sleeper length was chosen to be increased up to 3 m, as longer lengths can create structural problems of sleeper bending stresses and can be problematic during tamping works. The second case increases sleepers up to 0.4 m. This value gives a distance between the sleepers of 0.2 m in normal conditions (considering a sleeper spacing of 0.6 m). The last case considered increases the length and width at the same time, which gives the biggest support area of all. Obviously, the last case is the best of all considered.
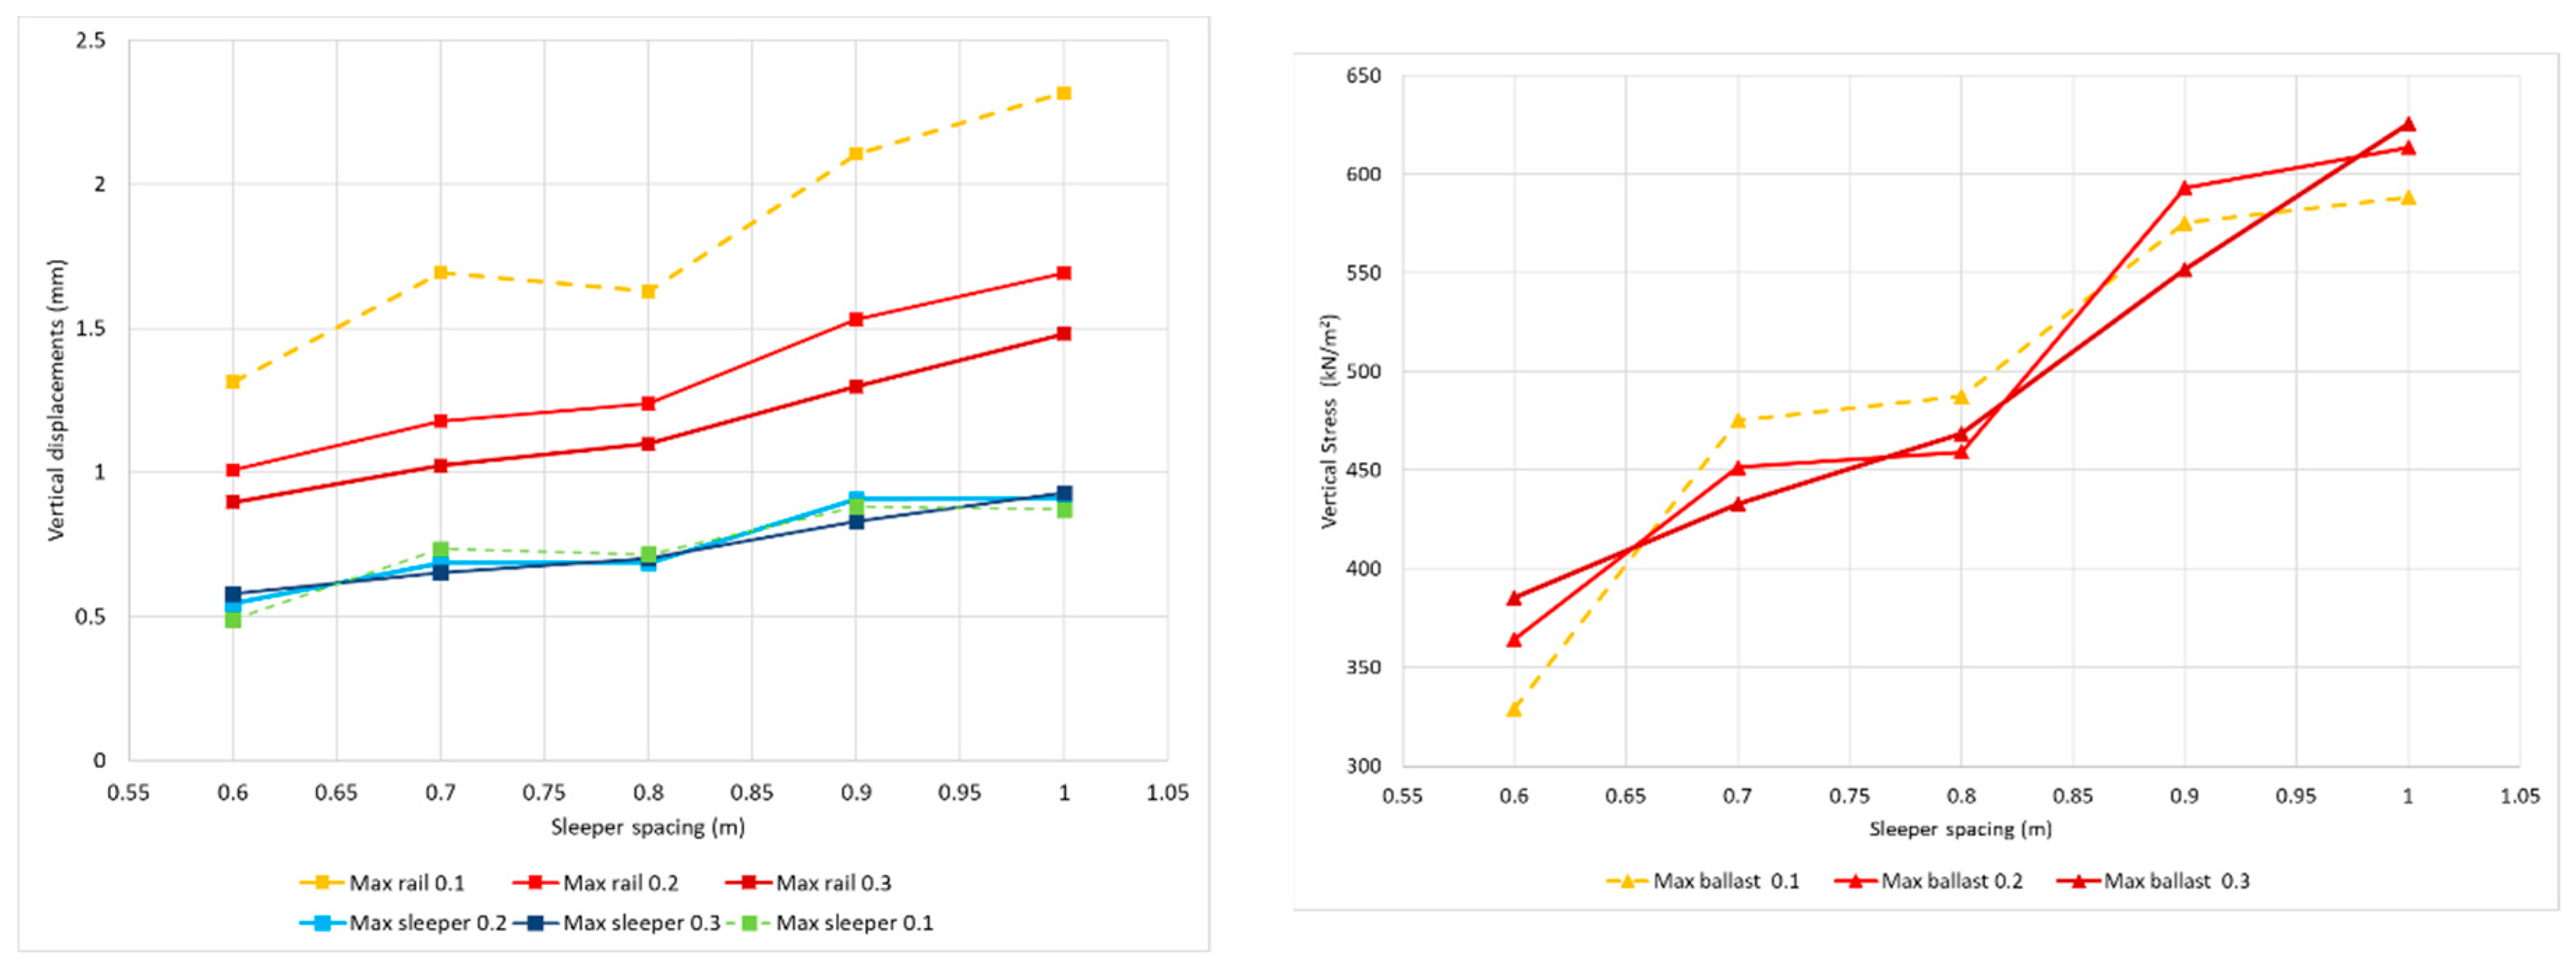
Figure 7 shows the most important values for the variables obtained.
The most important variable is the stress on the ballast (
Figure 7). The influences on the vertical displacements, shear forces, and rail bending moments are negligible. This might be explained because the support area is really important, especially for vertical displacements and the stress under the sleeper.
The effective area of the sleeper is the contact area of the sleeper base with the ballast layer. This effective area is usually defined as F, and there are several references which give different values for this “Fi”, i.e., half-sleeper or less (depending on if it is prestressed monobloc, or a reinforced twin block sleeper) [
27], to more than 5900 cm
2 [
35]. This is needed to make a hypothesis of the contact area between the ballast and the sleeper.
As expected, it is better to increase the total area of the sleeper pad. By increasing the sleeper pad area, there is a reduction on the vertical displacements on the rail and the sleepers, and there is a reduction on the stresses over the ballast.
3.6. Infrastructure Layers
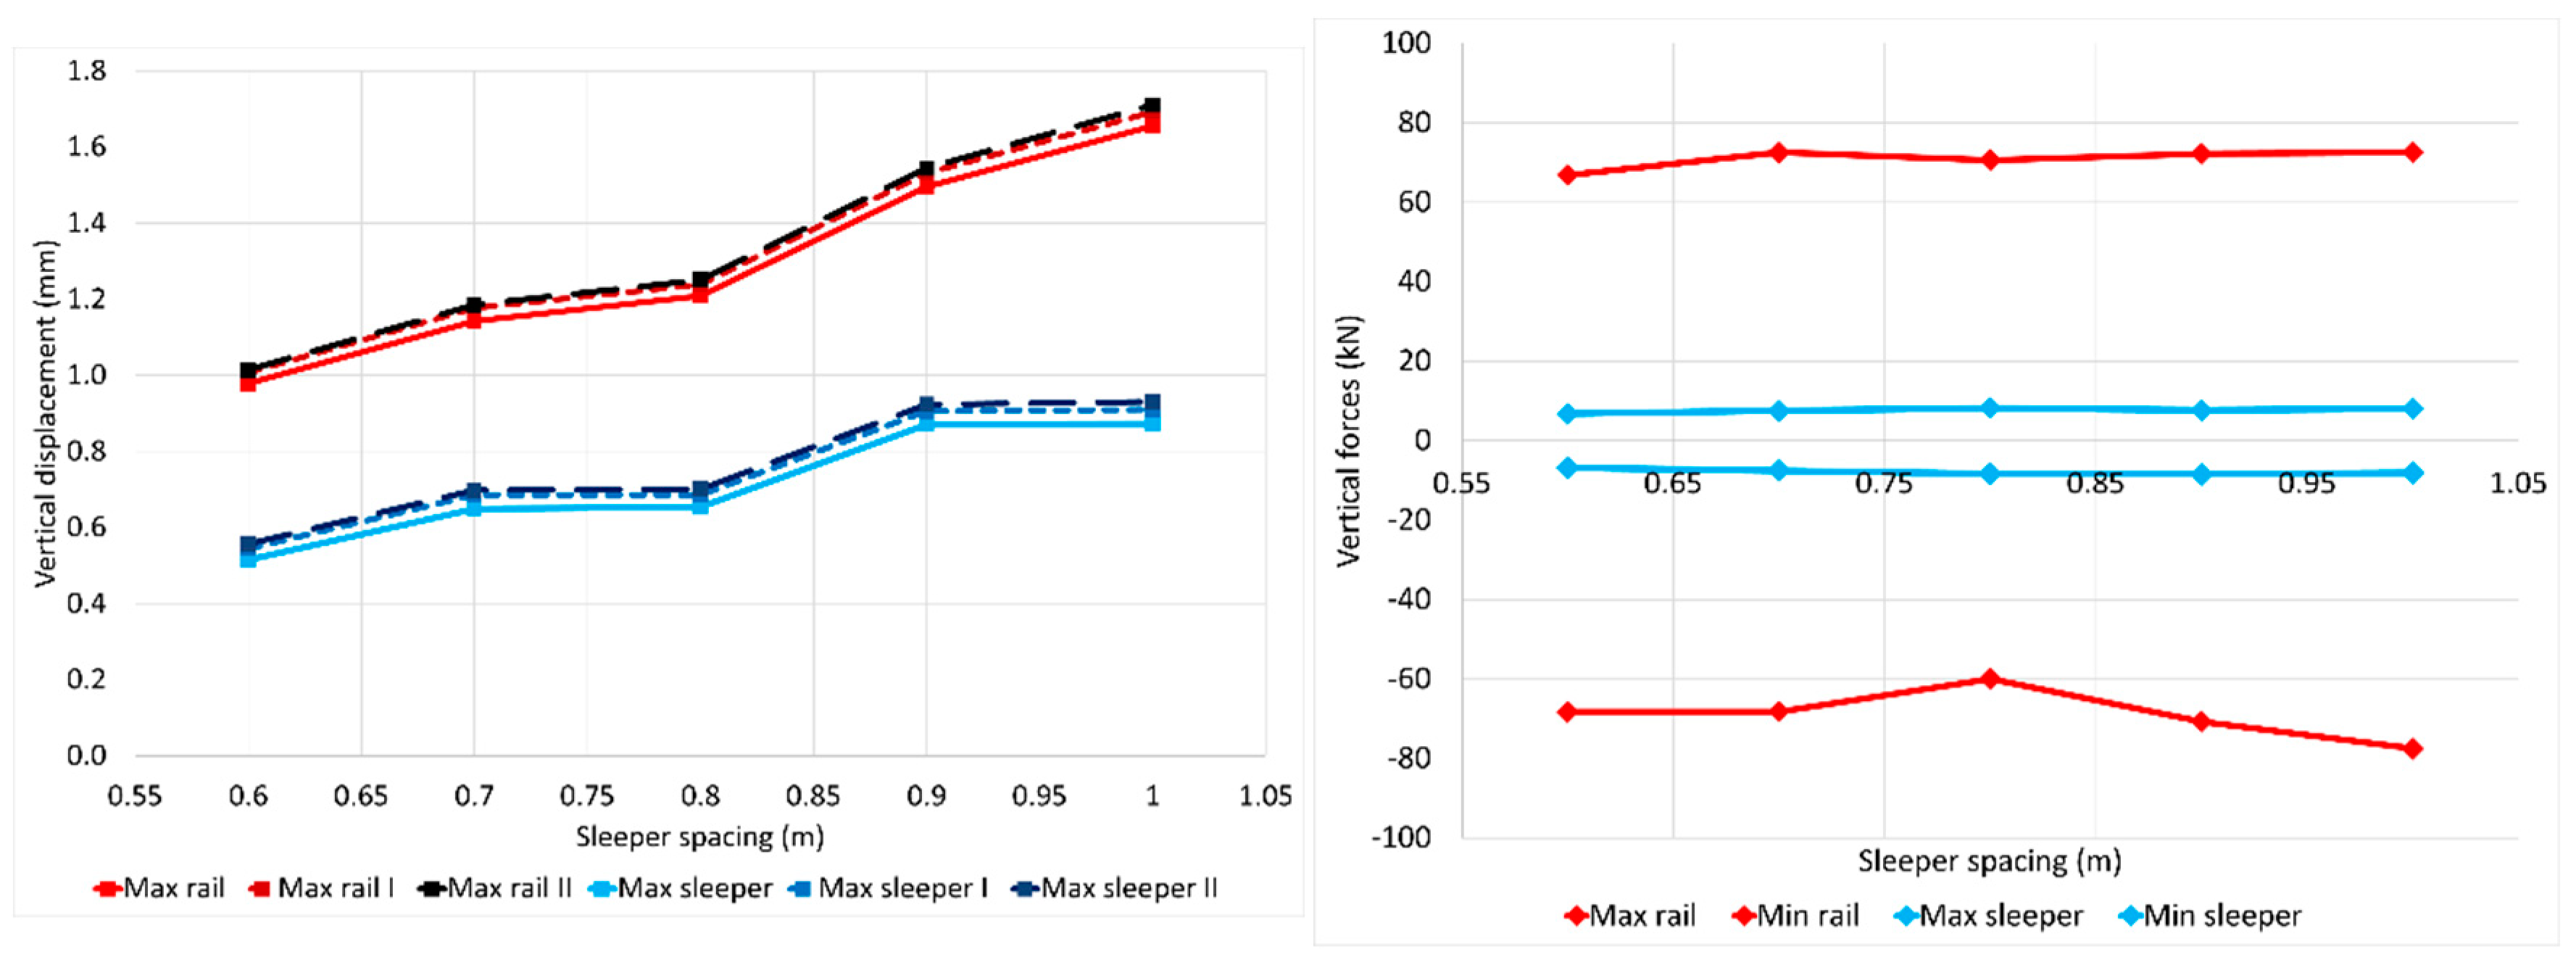
This case analyses the influence of the infrastructure layers. In order to see the effect of the type of infrastructure layers on the track performance when the distance between the sleepers is increased, three cases for subgrades have been simulated. The first case shows a track over a nondeformable ground (no subbase) considering a support on a material of infinite stiffness, the second case uses a stiff material, “subbase I”, and the third case uses a soft material, “subbase II”.
Table 6 shows the values for the adopted materials, always using ballast track (classical track), as the slab track is out of the scope of this paper.
It can be appreciated that the uses of a better or worse infrastructure layer slightly affects the vertical displacements of both the rail and the sleeper (
Figure 8). The rest of variables are slightly influenced by this change. When focusing on the vertical displacements (rail and sleeper), bending moments, and stresses on the ballast, all of them tend to increase as the separation between the sleepers increases. If the shear forces on the rails and the sleepers and the bending moments are analysed, the trend is to keep more or less constant.
In relation to the stress on the ballast, there is no big difference between the stiffer and softer subbase, and there are small differences when considering an infinite stiffness subbase. The same happens with the shear forces in the rails. There is no difference between the considered cases. Stresses on the ballast increase with the spacing, as happened in the previous cases. Stresses on the ballast are slightly higher when the subbase is softer, as the stiffer layers resist the majority of the force. Differences in the stress over the ballast are minimum, but slightly worse for the deformable layers such as subbase II.
3.7. Rail Pad Stiffness and Dimensions
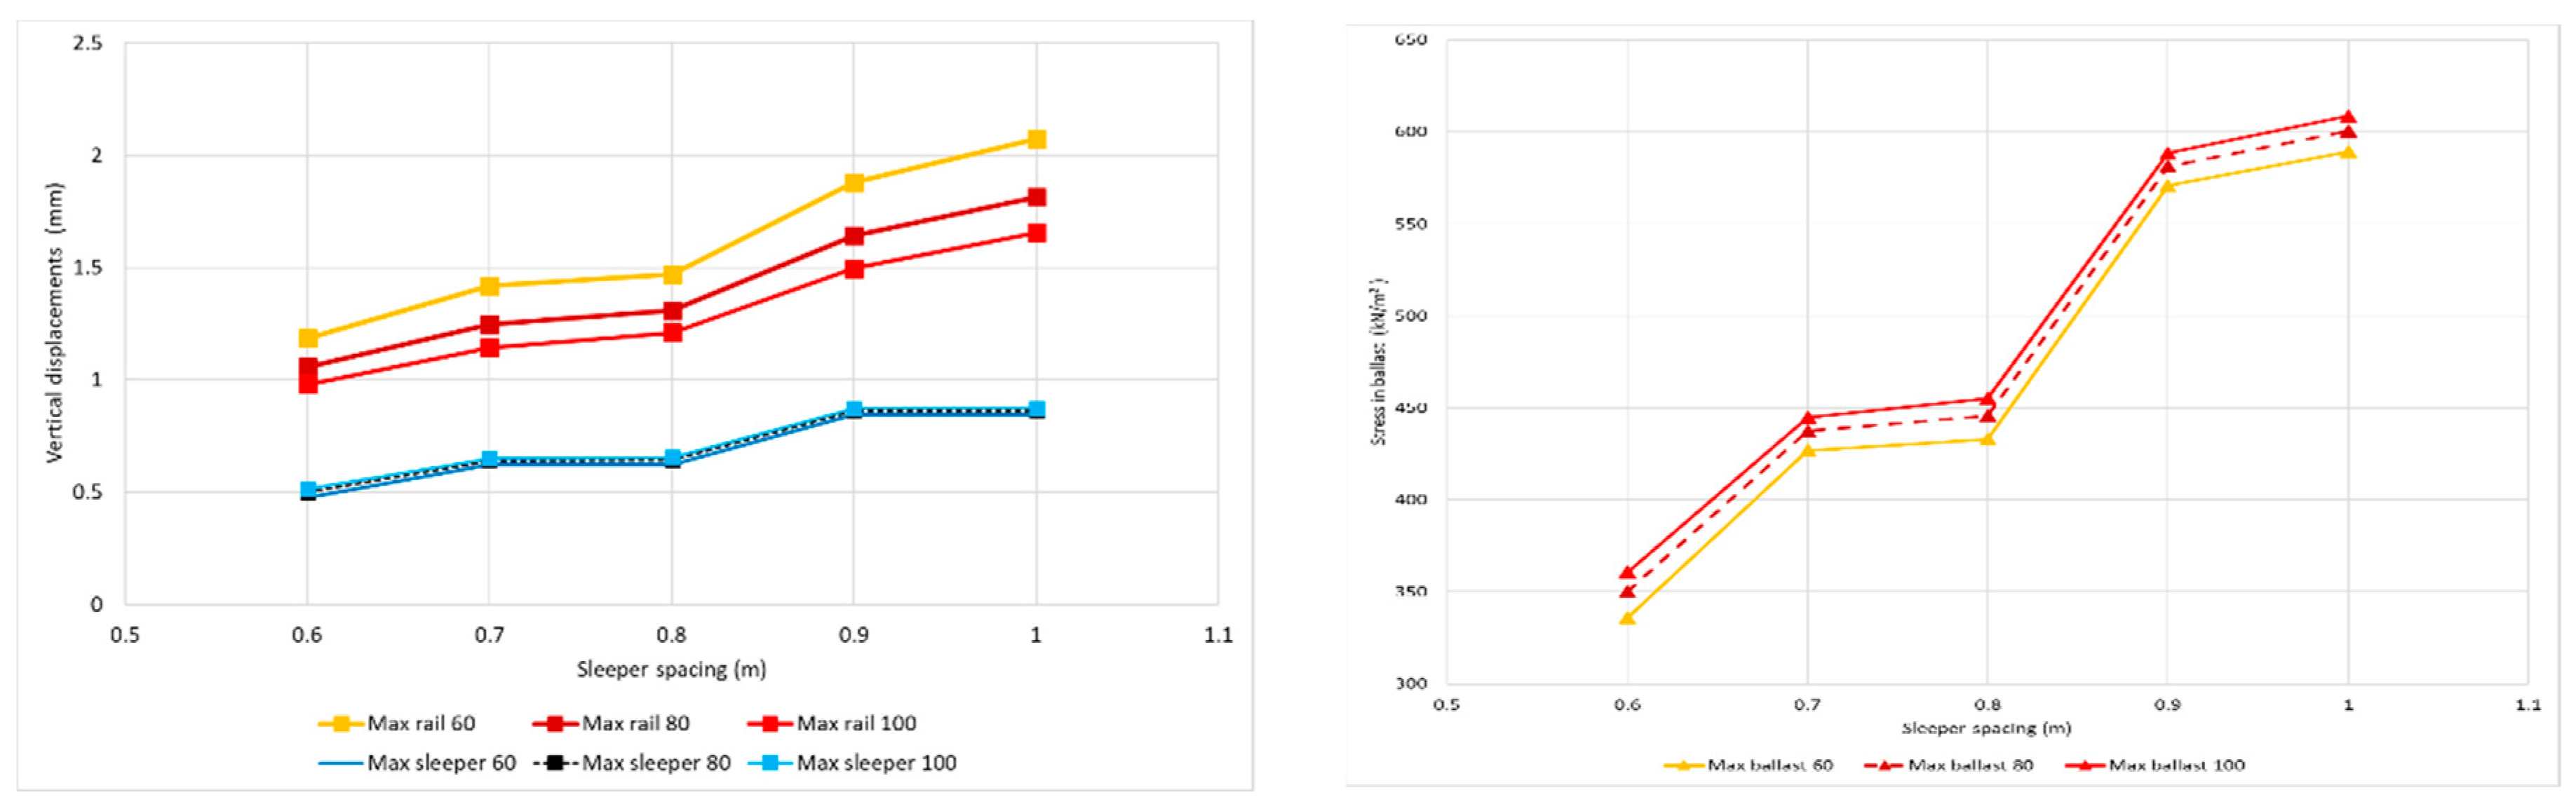
The material and dimensions of the under-rail pads are also analysed. The rail pad material is characterised by its stiffnesses. They are the three conventional rail pad types in Spain: 60 kN/mm, 80 kN/mm, and 100 kN/mm. Fastening clips have not been studied in this analysis, and the authors refer to [
36] for relevant conclusions of the failure mechanism regarding high-frequency excitation (580–680 Hz).
The initial model considers 100 kN/mm stiffness pads. Simulations have also been carried out for pads of 60 kN/mm and pads of 80 kN/mm. The results showed that when the stiffness of the rail pad increases, the vertical displacements of the rail decrease, but the vertical displacements on the sleepers increase. There is no difference in shear stresses on the rails, but the stiffer pads generate a slight increase of shear stresses on the sleepers, which means a higher stress over the ballast layer. Rail bending moments have a slight increase (the biggest difference is less than 4.5% when the pad stiffness decreases (
Figure 9)).
The variation with pad dimensions is also analysed. Simulations were performed by changing one of the dimensions of the pad, the longitudinal direction of the pad, and keeping the transverse direction constant. Normal pad dimensions are 150 × 180 mm. For the analysis, the longitudinal values were varied from 100 mm and 200 mm to 300 mm so to see clearly their influence in the results.
Generally speaking, the results are better for the larger pads. The vertical displacements, the shear stress on the sleepers, and the moments on rails decrease. However, on the other hand, the forces on the pad are considerably greater in the case of the smaller-dimension pads. Regarding the increase in the spacing between the sleepers, an increasing trend can be considered with an increasing distance (
Figure 9).
The distance between axle bogies in the train is also considered and simulated. The results showed that increasing the distance between the axles in the bogies from 1.8 m to 2.5 m is positive for all variables except one, the bending moments in rails. Values for rail bending moments have a slight increase in this case, but there are always values under the maximum allowed ones (see
Table 7).
4. Discussion
This section establishes a range of possible distances between the sleepers’ axes by comparing the maximum allowed values of the different values found in the guidelines, standards, and literature with the results obtained in the analyses performed. A summary of the maximum admissible values for displacement and stresses is presented in
Table 7.
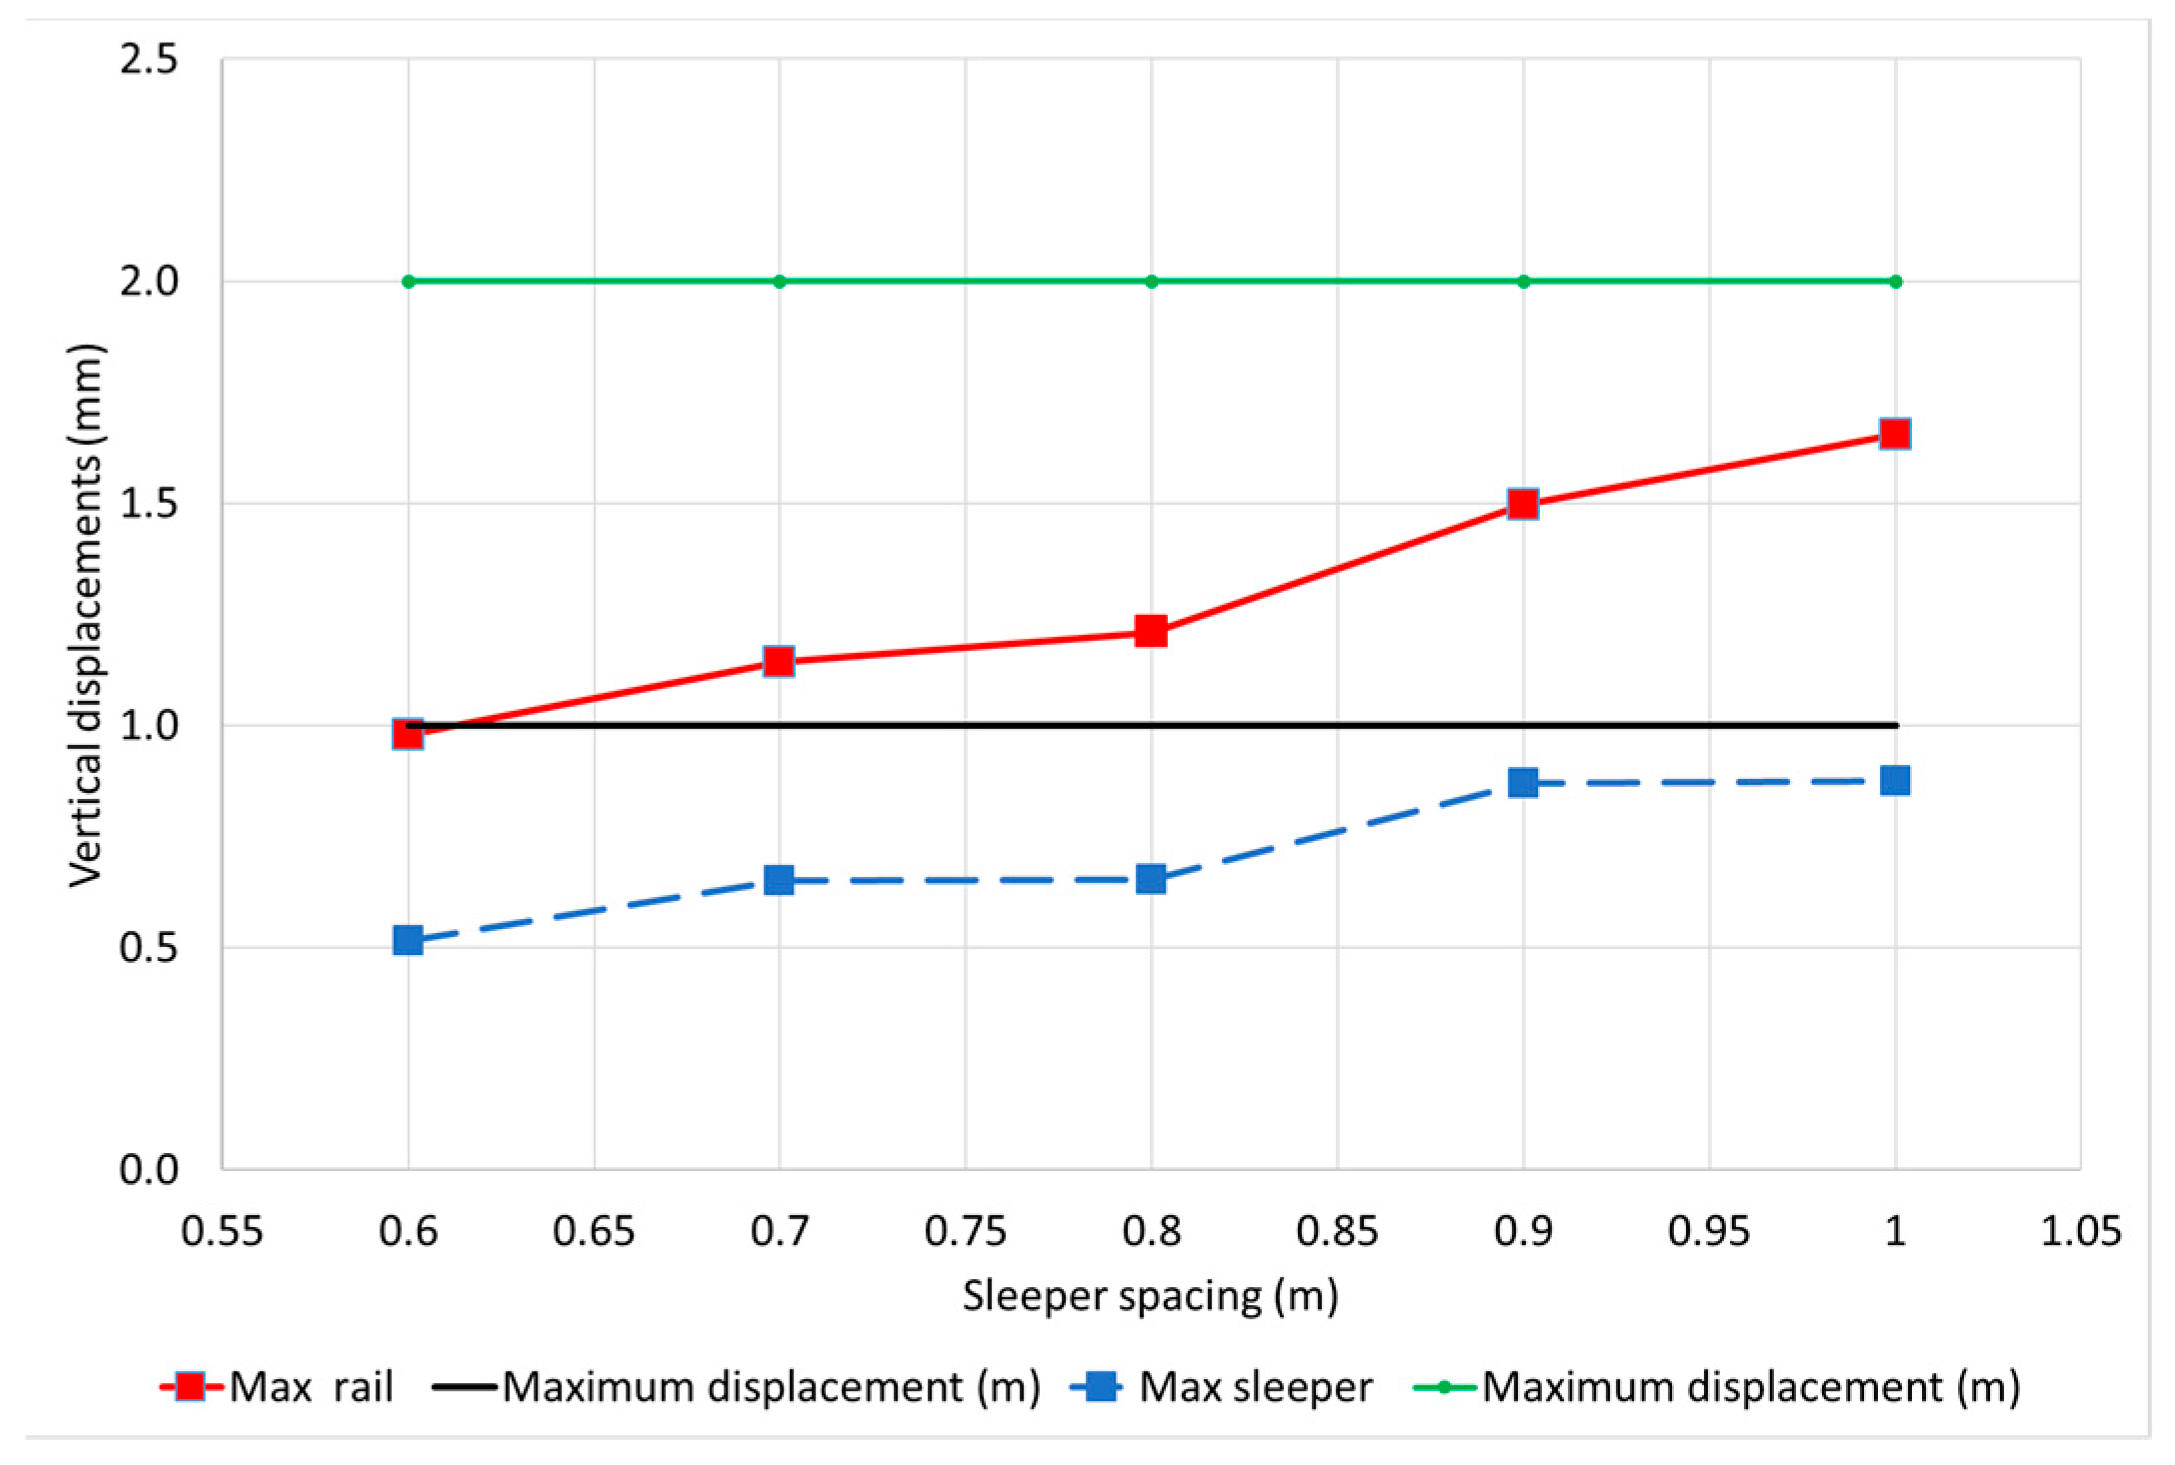
One of the most restrictive variables is the vertical displacement of the rail. Nowadays, it is limited to 1 mm of vertical displacement. This value is overcome when the sleeper spacing is higher than 0.6 m or 0.65 m. However, there are several works providing limiting values higher than 1 mm, as it is increased to 2 mm [
28,
29]. If this limit is increased to 2 mm, all distances between the sleepers’ axes analyses give values lower than this (
Figure 10). Increasing the limit to just 1.5 mm, the distance between the sleepers can be increased up to 0.9 m.
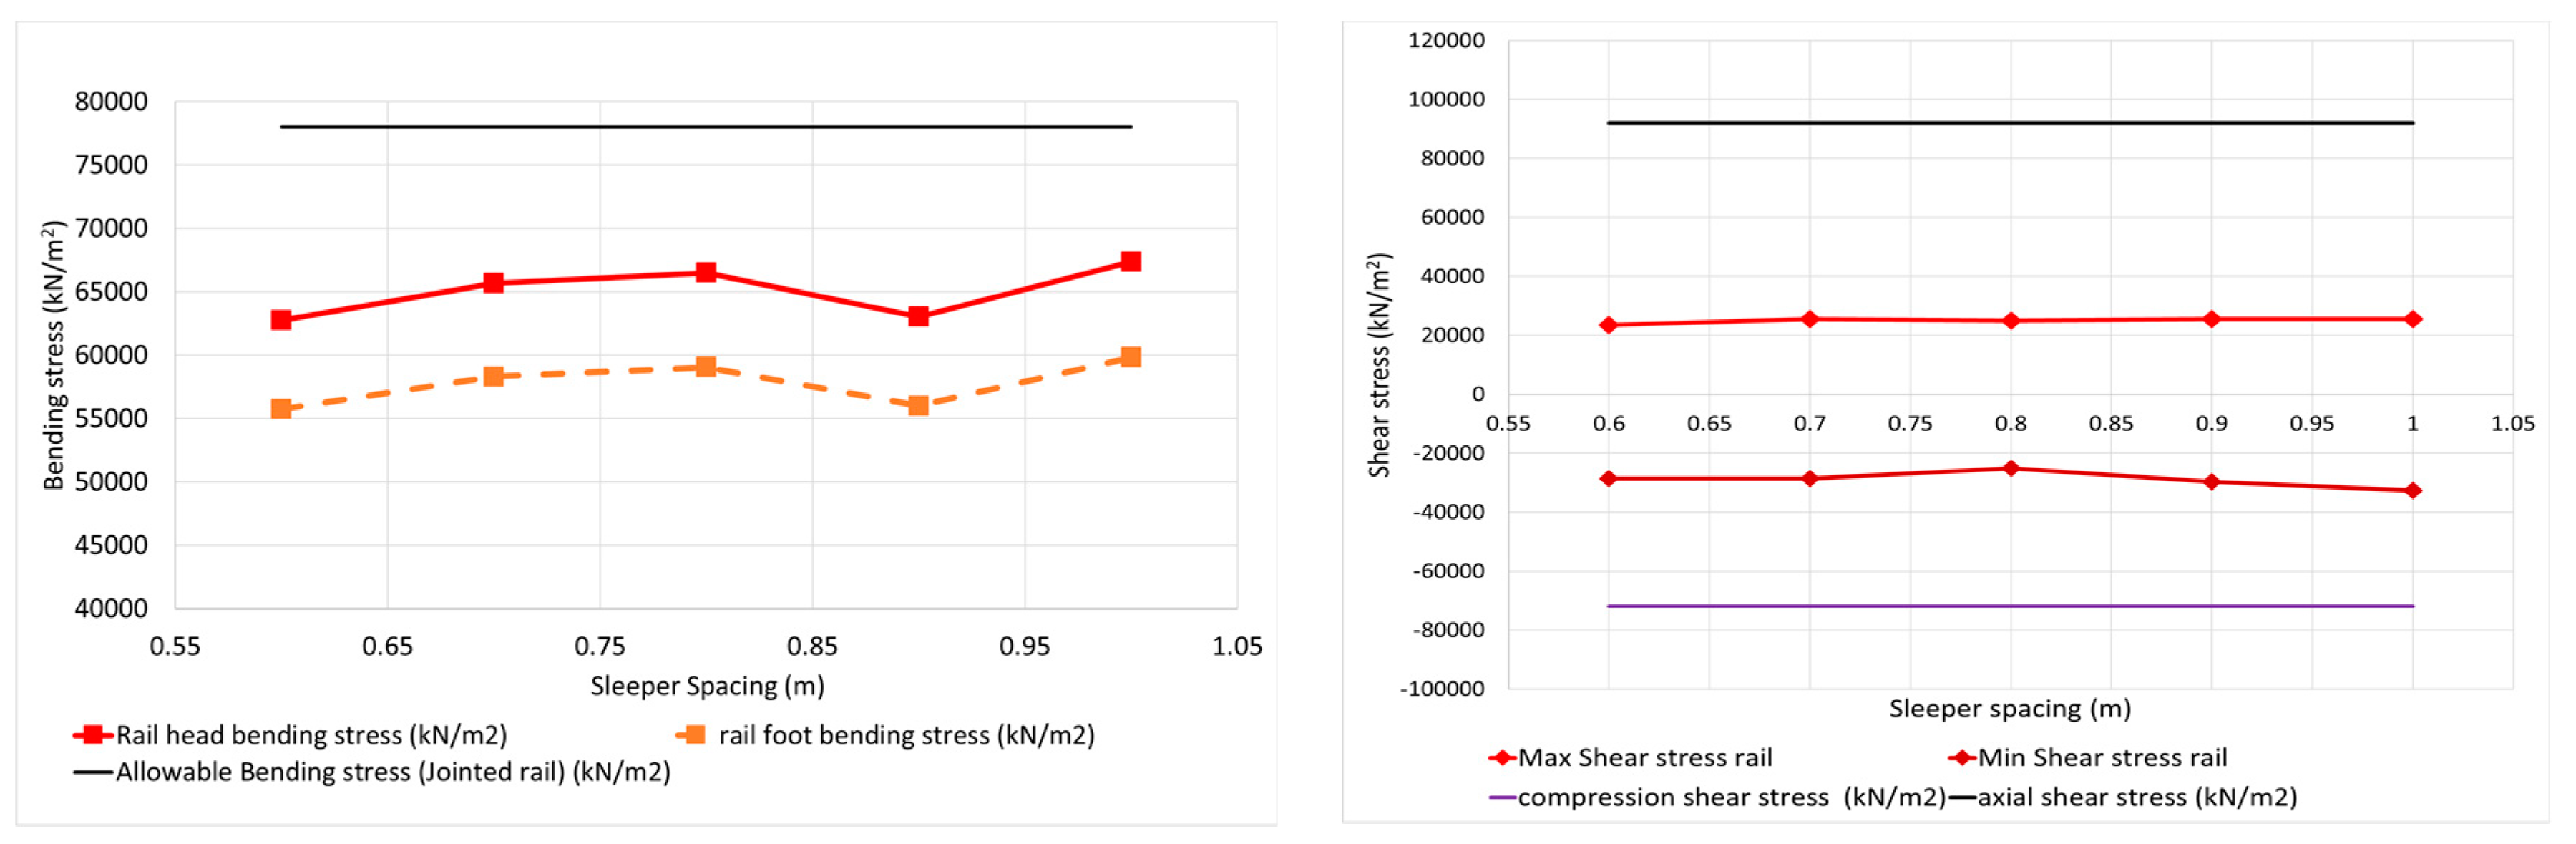
Shear stresses on rails are for all analysed cases are lower than the ones allowed. The same happens with the shear stress and bending stress on the sleepers (
Figure 11). In the same way, the shear forces in rails, sleepers, and rail bending moments are well within the maximum allowed values. Therefore, this preliminary analysis shows that vertical displacements in the rail seems to be the most restrictive variable of all analysed, together with the stresses on the ballast.
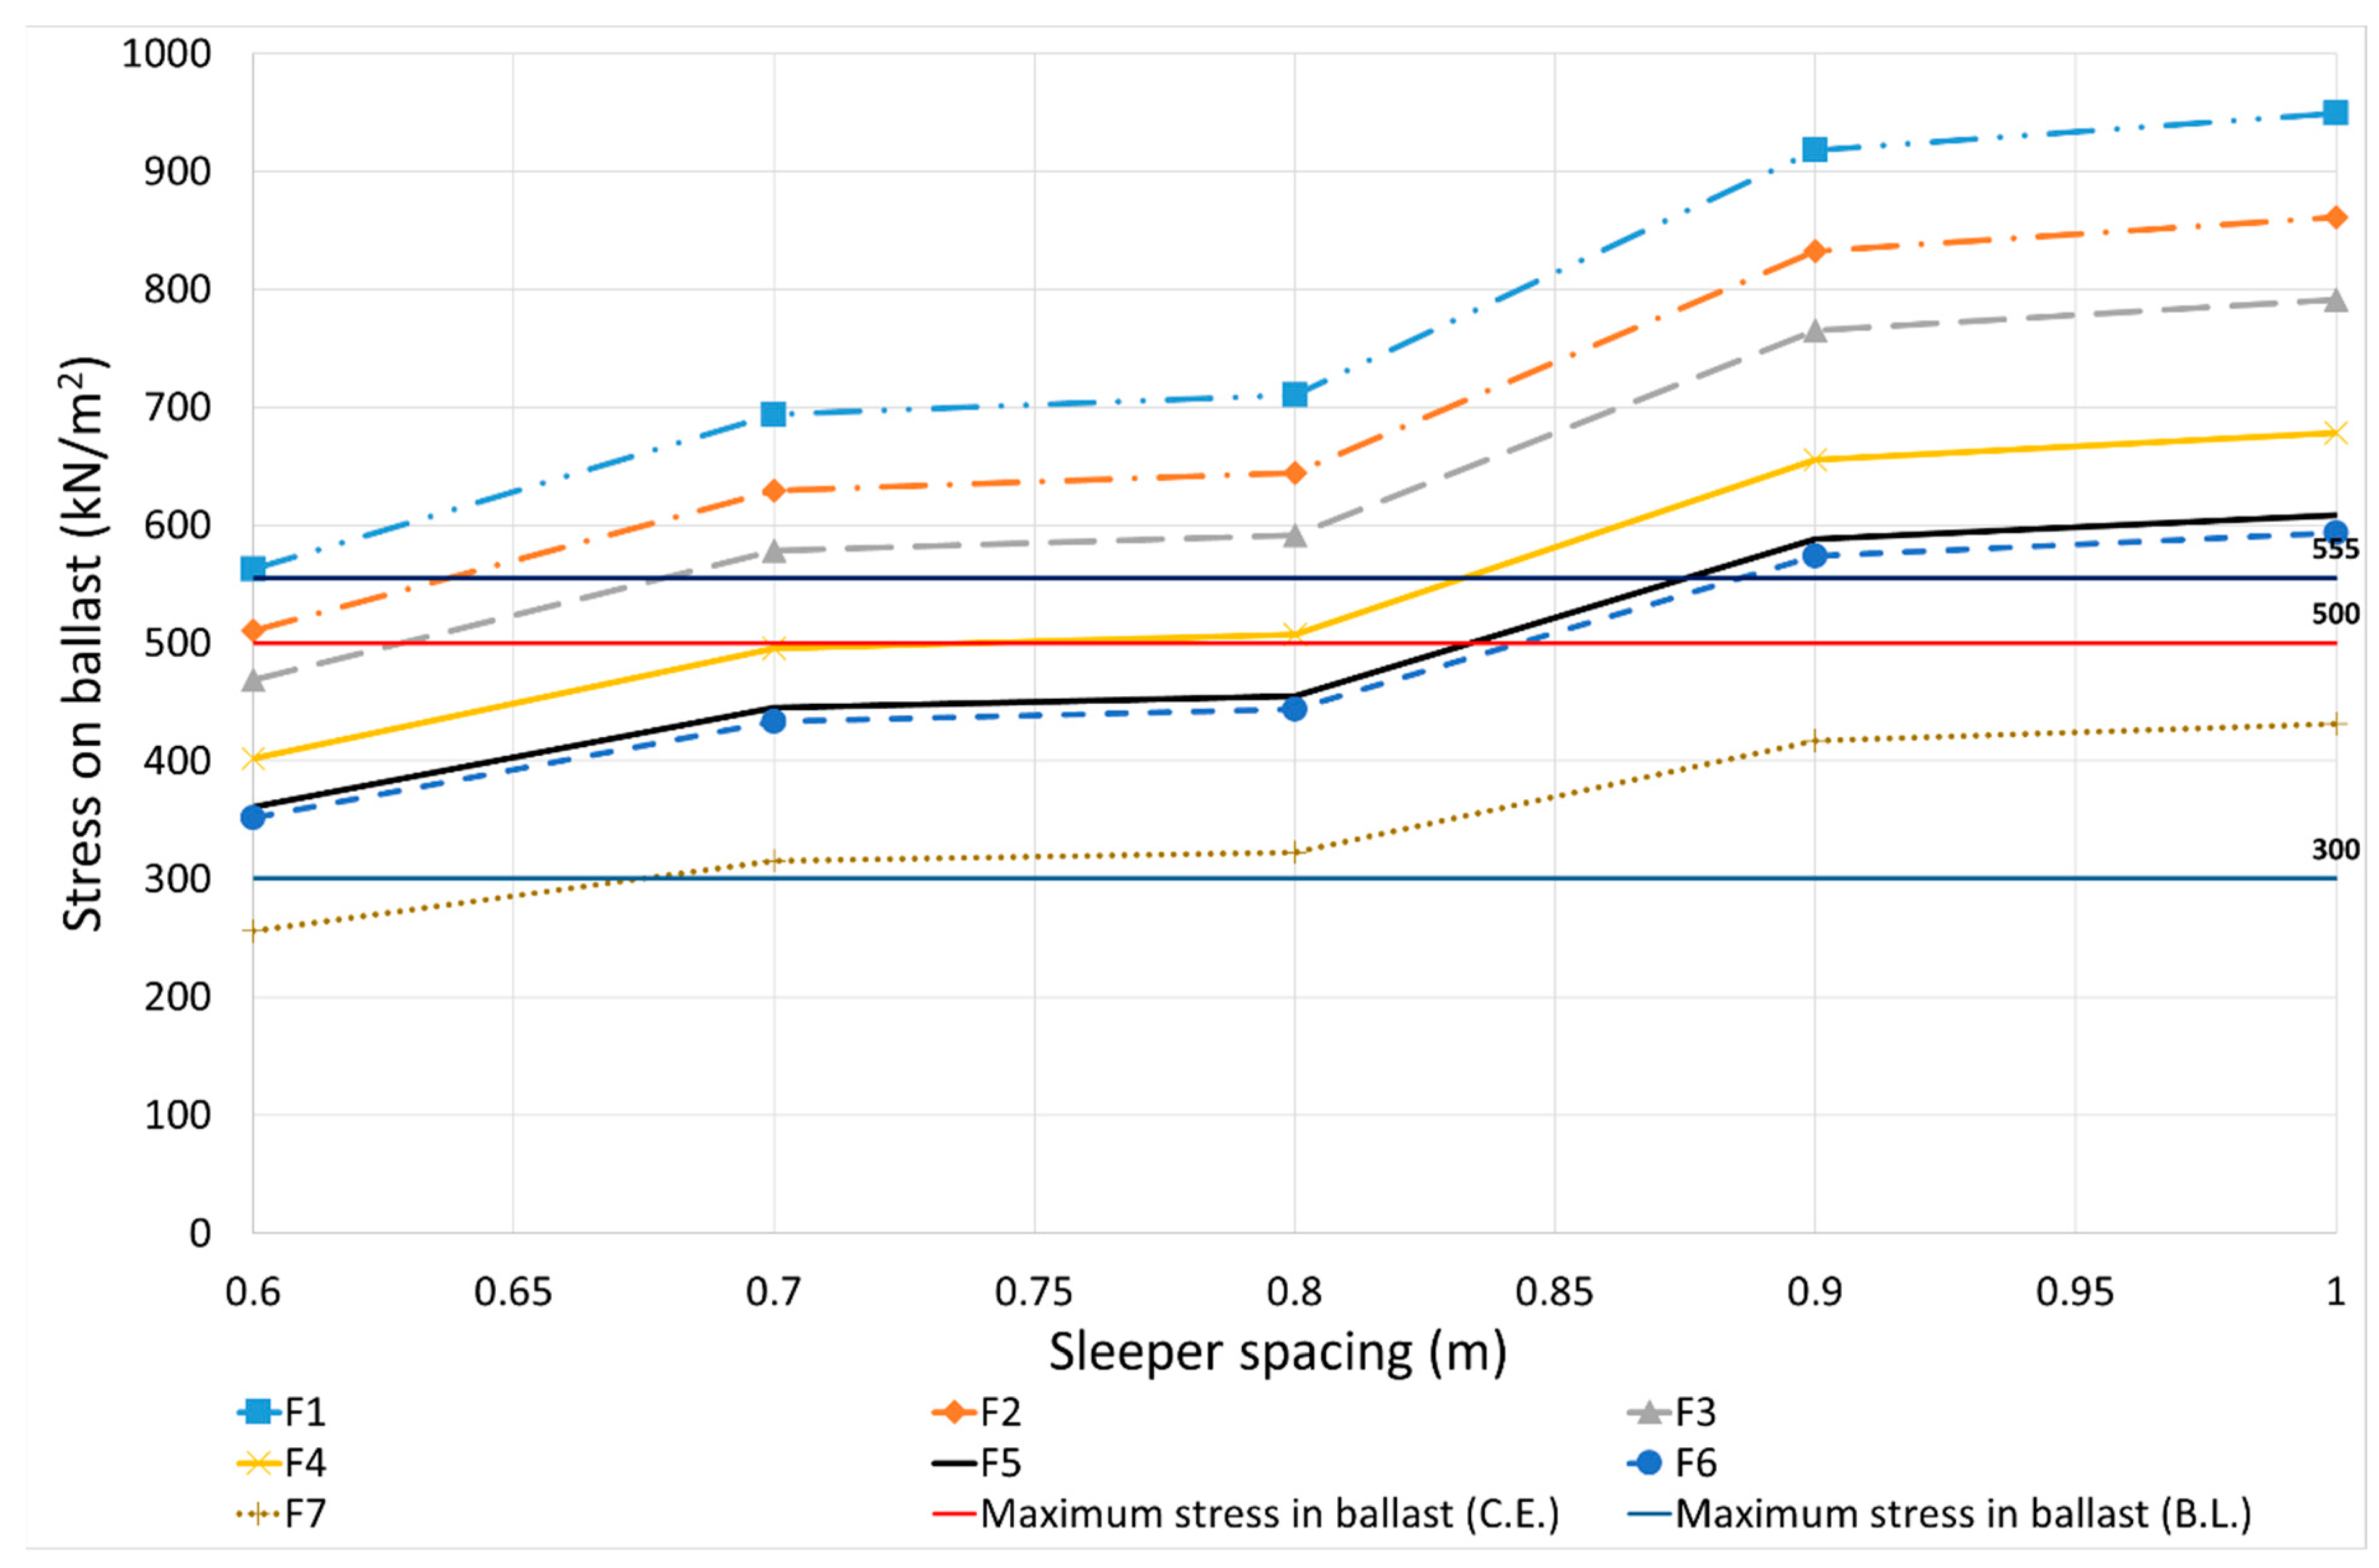
Stresses on the ballast are a clear limitation for the sleeper’s distance, although there is not a clear limit, as it can be 300 kN/m
2, 500 kN/m
2, or 555 kN/m
2 according to [
27,
30,
35]. These stresses are directly affected by the support area considered; therefore, it is important to consider a suitable effective support area of the sleeper. In this case, the assumption taken to calculate the support area is the one proposed by [
27], which is to consider half of the sleeper area. This corresponds to the case F5 (see
Table 8). As other authors consider different assumptions, in this study several values have been considered. Other lower values are chosen, as they give more restrictive results and with just one being bigger (
Table 8).
From the analysed cases, there is no possibility to have the desirable stress under 300 kN/m
2. However, when considering 500 kN/m
2 as the limiting values, four of the support options (F3, F4, F5, and F6) accomplish the value for different sleeper spacings up to 0.85 m in some cases (
Figure 12).
It is important to consider that, many times, the limitations for the track elements are difficult to reach and at many times, the values are over these values [
28,
29], such as for the example of the vertical displacements of the rail.
Vertical accelerations obtained in the train body and the bogies are low if they are compared, for example, to the limits of 0.7·g (6.86 m/s
2) in Chinese railways [
33], or 0.22 m/s
2 [
1] or 0.20 m/s
2–0.30 m/s
2 [
34]. In all simulated cases, the vertical body accelerations obtained are far away from these values. For wheelsets, some authors give standard deviation values (STD values) of 0.18 m/s
2 and 0.47 m/s
2 for a train speed of 137 km/h, and the bogie frame reaches values up to 1.83 m/s
2 [
40]. Values for comfort in trains are under 1 m/s
2.
Values of vertical acceleration on sleepers measured in the field are between 11·g (107.8 m/s
2) and 16·g (156.8 m/s
2) when the sleeper is unsupported [
33]. Other authors present limiting values up to 80 m/s
2 and impact values up to 100 m/s
2 [
34]. Normal vertical acceleration values for conventional speeds are around 10–11 m/s
2 [
31,
32] and 1.8·g (17.64 m/s
2) or 2·g (19.6 m/s
2) [
38].
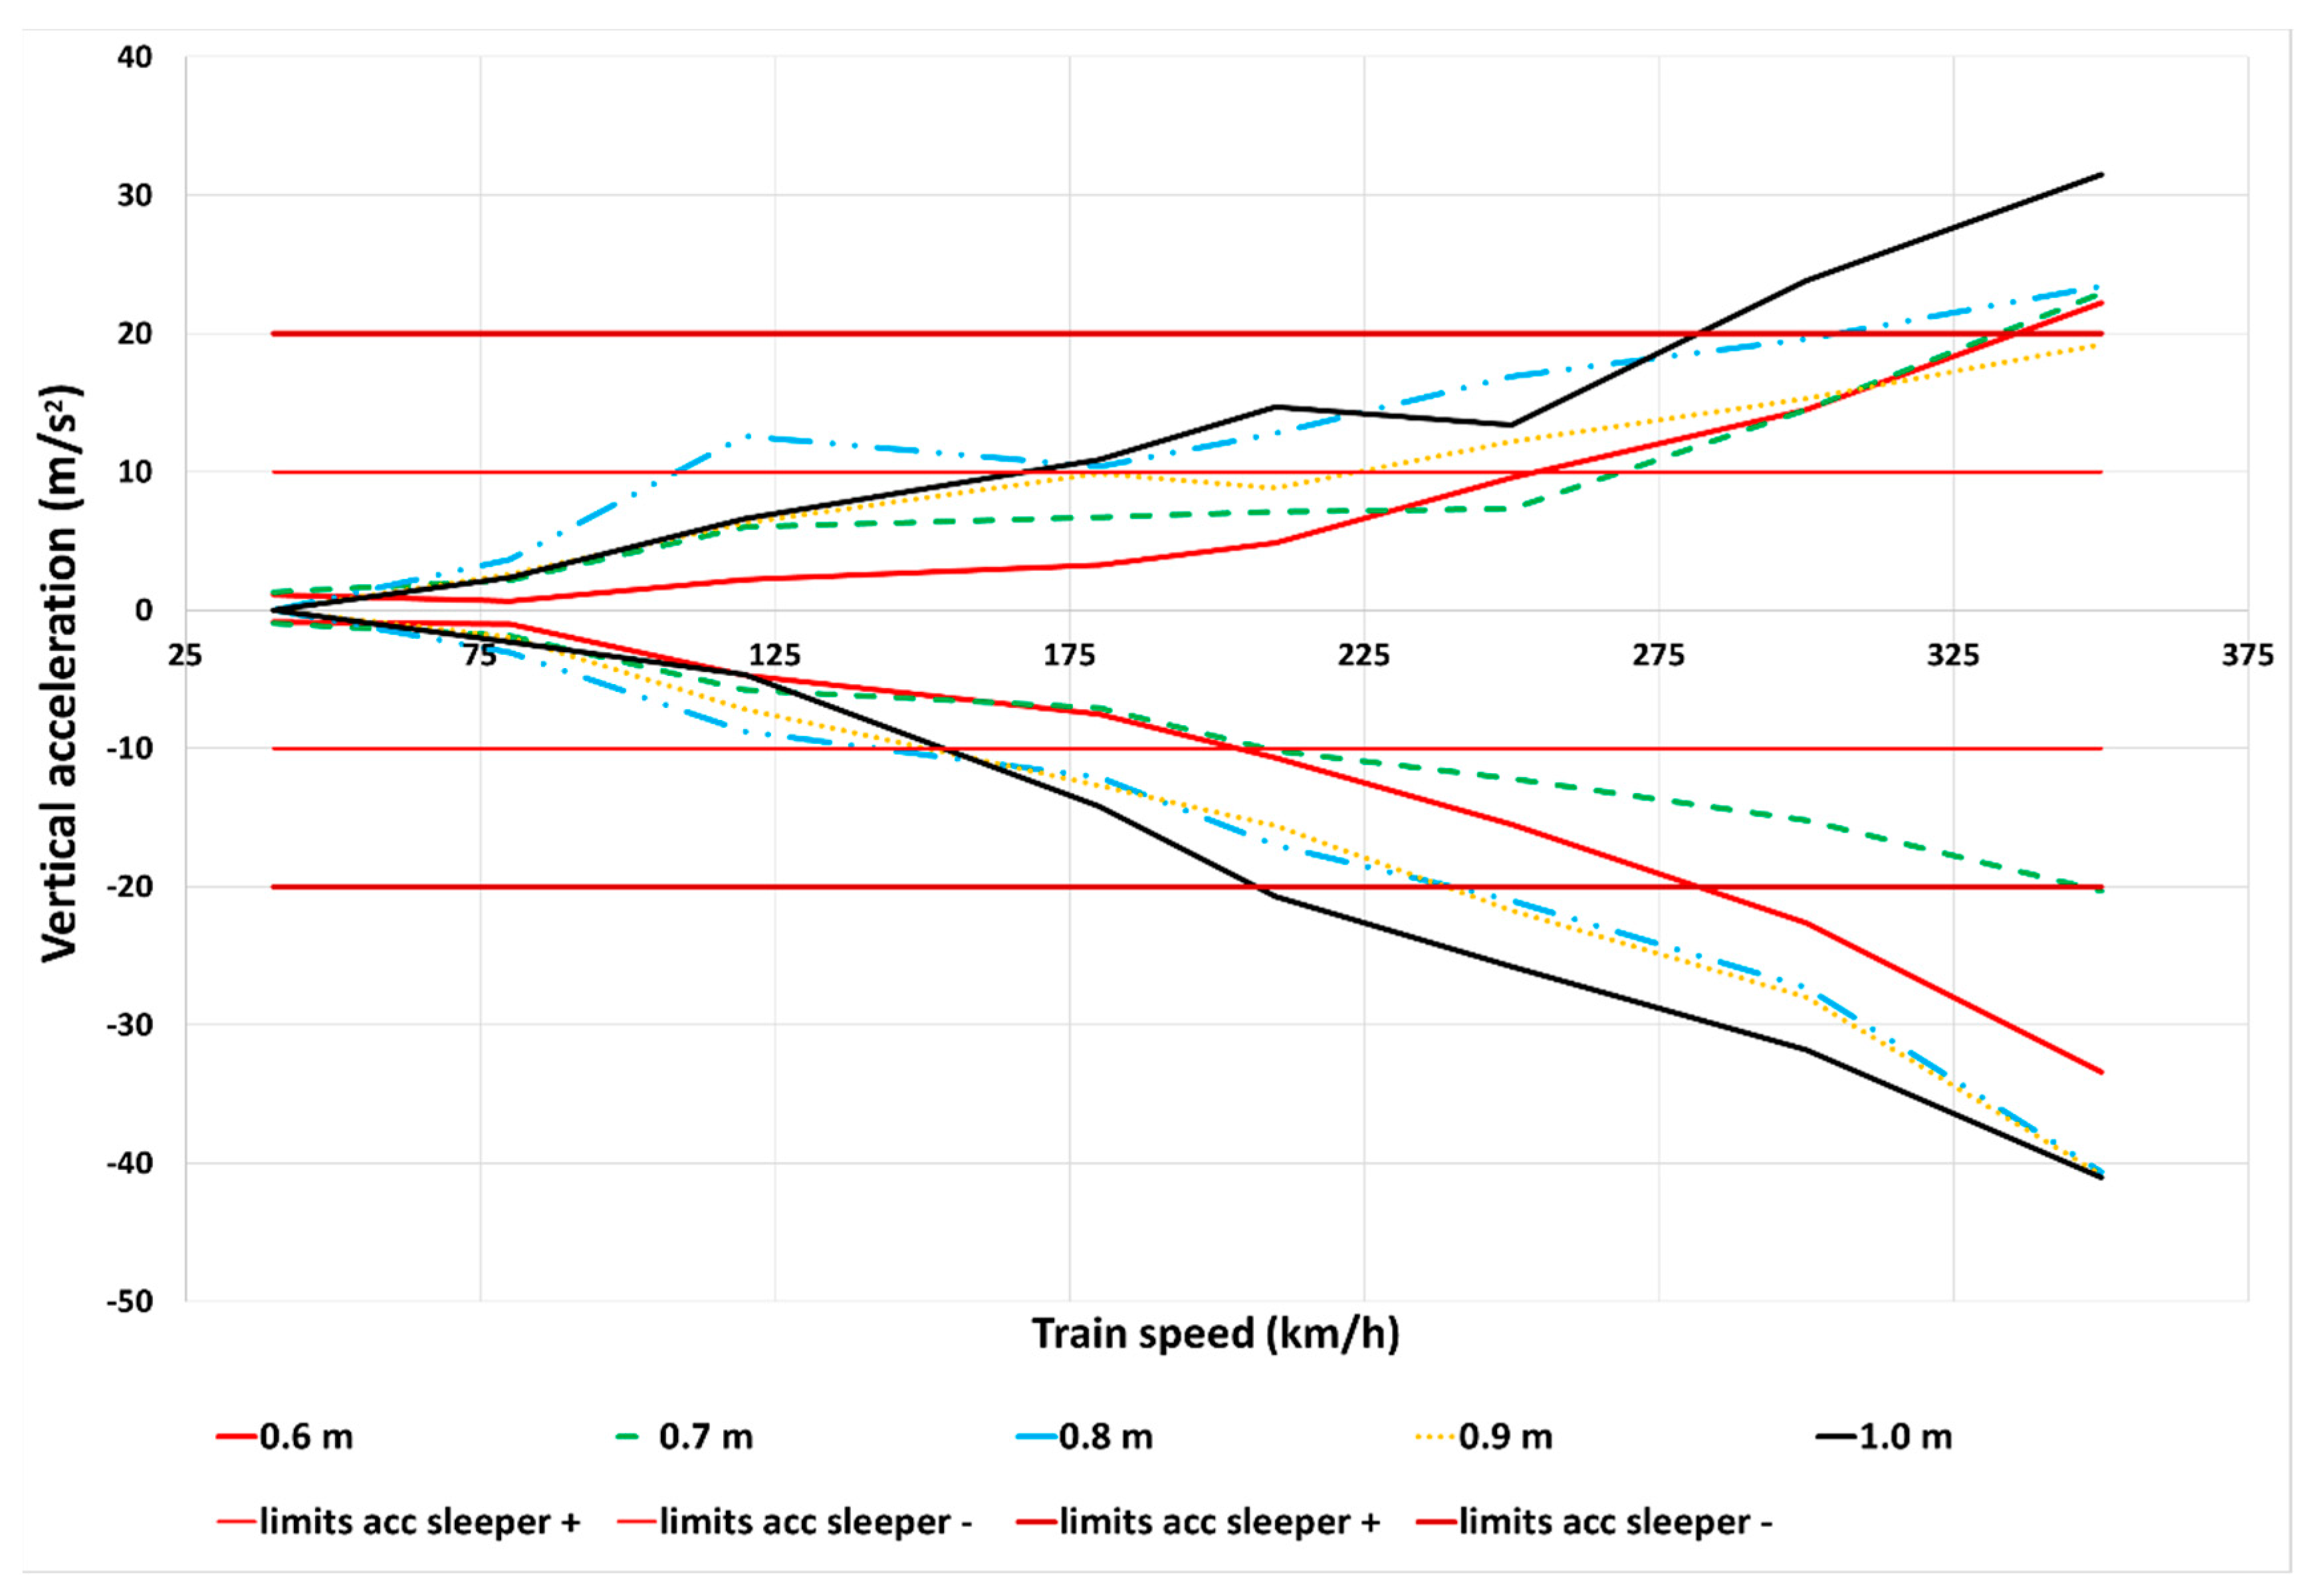
If the most restrictive values of vertical acceleration are chosen as the limit 10 m/s
2, it is overcome when the sleepers spacing is 0.8 m with train speeds from 110 km/h onwards (
Figure 13). However, with lower distances between the sleepers’ axes, such as 0.7 m, trains can reach speeds higher than 200 km/h. On the other hand, if this limiting value is increased up to 20 m/s
2, which is still much lower than the accelerations measured in the field, there are no problems with train speeds up to 275 km/h or sleeper spacings.
Vibrational analysis and fatigue are not considered in this initial study. In the mentioned article by Zou et al. [
16], in their vibrational study for urban tracks, they recommended to choose the optimum sleeper spacing between 0.54 m and 0.67 m. Other distance arrangements can be found in [
15], by the repetition of a track unit composed of five sleepers’ bays of 0.6 m spacing and five bays of 0.7 m.
Maximum values for the vertical acceleration in bogies [
40] and the train body [
33] are under the allowable limits (please notice that track irregularities have not been considered in the simulation). The most sensible parts are the sleepers, but depending on the limits imposed, as maximum values can go from 10 m/s
2 [
31,
32] to more than 150 m/s
2 [
33]. By considering vertical accelerations up to 100 m/s
2, there is no problem with increasing the sleeper spacing. Considering lower values, such as 20 m/s
2, a distance of 0.8 m between sleepers can be achieved for train speeds of more than 220 km/h (
Figure 13). Therefore, it can be said that for a distance over 0.8 m, normal train speeds (more than 200 km/h) will not be a problem.
According to all previous numerical simulations, the most restrictive variables are vertical displacements on rails and the stress in the ballast. These two parameters are defined by their limits, in the case of vertical displacements they go from 3 mm in conventional tracks to 1 mm in high-speed tracks, while the maximum admissible ballast stress depends mainly on the maximum allowable limit for this value (300 or 500 kN/m2) and the effective support of the sleeper.
Results for these two most restrictive variables are summarized in
Table 9. Looking at it, it can be said that it is possible to increase the sleeper spacing from 0.6 m to 0.65 in the most restrictive cases and to intervals between 0.8 m and 0.85 m in other cases.
Sleeper spacing is important in the design and optimization of railway superstructures. This parametric analysis shows an initial study of how it can affect the track performance. Results have demonstrated that it is possible to increase this distance from the current 600 mm commonly used in different railway administrations around the world. It is important from two points of view. The economic, as saving sleepers per km of track means saving money, and it also involves environmental savings (as it is possible to reduce energy consumption in the process and reduce the carbon footprint as well). If one concrete sleeper produces 0.83 KgCO2/sleeper [
41,
42], if the sleeper spacing changes from 0.6 m to 0.8 m, it is possible to save 346 Kg/CO2 per km of the track. Therefore, environmental implications also need to be considered.
5. Conclusions
Sleeper spacing analysis is an important issue in railways from an economic, environmental, and safety point of view. Railway track costs can be reduced if these elements of the track superstructure are reduced. Not only the cost, but the safety values are reduced when the sleeper spacing is increased. Therefore, in order to check the feasibility of increasing this distance and to reduce some sleepers per km, a dynamic numerical analysis has been carried out. This study is within the frame of the ODSTRACK project, which aims to analyse the track performance under different sleeper spacings.
The aim of this initial analysis was to study the effect produced by the distance between sleepers in several elements of the railway structure. The distances analysed go from the conventional 0.6 m (in Europe) to 1.0 m between sleeper axes every 0.1 m. The elements analysed of the track structure were the rail, sleepers, and ballast. The parametric study carried out served to determine the most sensitive variables to sleeper spacing changes, which are the rail displacements and the ballast stresses. The used software is a powerful tool for such parametric analysis.
This preliminary analysis determined that it is possible to increase the distance between sleepers beyond the conventional distance of 0.6 m, and therefore it is possible to save costs on these track elements, not only during new track construction, but during track maintenance and renewal.
Results showed that the distance between the sleepers’ axes between 0.8 and 0.85 m is feasible (
Table 9), but more studies should be performed to validate it. With this increase in the distance between sleepers, it is possible to save between 20 and 30% of the construction costs [
10,
13]. This must be compared with the expected degradation rate of the ballast. In this case, it is important to analyse the ballast contact stress limits and the effective area of the sleeper support. Thermal effects were considered in [
13], resulting an increase of three times the longitudinal rail axial forces when the sleeper spacing increased. These initial results will help to develop, with accuracy, a laboratory test for a deeper knowledge of the sleeper spacing.
Following this premise, more numerical and experimental studies are being performed to validate further the limits of sleeper spacings. The bending of sleepers has to be considered. Vibrational analysis and fatigue analysis should be performed to have a complete knowledge of the consequences of increasing the distance between the sleepers’ axes. More complex numerical analysis should be carried out, as well as a 3D analysis so to have further knowledge of the influence on the track structure (with a focus on rail fastenings and rail joints). In addition, experimental analysis should also be performed to fully understand the impact of increasing the sleepers’ spacing. Future lines of research should follow these mentioned steps.


