Article

Multi-Criteria Methodology for the Location of Photovoltaic Solar Energy Production Facilities in Tenerife (Spain)

1
Faculty of Sciences and Arts, Catholic University of Ávila, C/Canteros s/n, 05005 Avila, Spain
2
Canary Islands Government, Rambla de Santa Cruz, 147, 38001 Santa Cruz de Tenerife, Spain
3
GA. Ingenieros, Calle Cronista Eduardo Ruiz Ayúcar, 10, 05004 Avila, Spain
4
Silvanet Research Group, Universidad Politécnica de Madrid, Ciudad Universitaria s/n, 28040 Madrid, Spain
*
Authors to whom correspondence should be addressed.
Infrastructures 2022, 7(3), 28; https://doi.org/10.3390/infrastructures7030028
Submission received: 24 January 2022 / Revised: 13 February 2022 / Accepted: 18 February 2022 / Published: 23 February 2022
(This article belongs to the Special Issue Planning Peripheral and Ultra-Peripheral Infrastructures)

Abstract

:
This paper presents a multi-criteria methodology for the detection of optimal locations for solar photovoltaic installations connected to the electrical grid. The proposed methodology has been applied to the island of Tenerife, as it is one of the territories in Spain with the greatest solar potential. This methodology integrates an Aptitude Model (which covers variables such as connections to the electrical grid, accessibility, cloudiness, solar irradiation and slope) together with an Impact Model (which considers variables such as landscape vulnerability, land use and hydrology). Each one of the variables considered has been transformed into standardized decision criteria, which have been weighted by means of Saaty’s pair method, having also assigned them relative weights by means of expert consultation. The integration of both Models in a Hosting Capacity Model makes it possible to consider urban and environmental constraints in different possible scenarios. Finally, the Hosting Capacity Model generated is implemented through a Geographic Information System (GIS) on the island of Tenerife, so that it has been possible to detect the optimum locations for each municipality and region.

1. Introduction

In the last 10 years, the photovoltaic sector in Spain has been immersed in a social upheaval, motivated mainly by the reduction of the costs of the installations, and by the support of certain regulations [1,2]. Ley 24/2013 of 26 December [3] on the Electricity Sector generally established the granting of a specific remuneration system through a competitive tendering procedure. However, an additional provision of this law established an investment incentive for the reduction of generation costs with the aim of replacing conventional generation by renewable sources in the island territories. In the Canary Islands, photovoltaic installations under RD 413/2014 [4] are a good alternative for electricity generation due to investment incentives, economies of scale and the reduction in the price of solar panels [5,6,7]. Therefore, this type of facility is currently profitable as long as it is located in an area with high solar radiation and is close to a connection point to the electricity grid [8,9], despite the fact that tariff-based remuneration and the elimination of premiums for photovoltaic electricity production will slow down the expansion of the sector [10,11].
The environmental degradation suffered by the planet, together with the reduction of fossil energy sources, has led to the need to commit to clean energy [12]. The fight against climate change requires proper management and planning of renewable energy [13,14], since around 80% of greenhouse gas emission in Europe are caused by the energy sector. In 2016, 16.91% of all energy consumed in the EU was already coming from renewable energy [15]; Spain in 2017 occupies the third place in terms of photovoltaic solar energy production figures in the EU (only surpassed by Germany and Italy). The solar photovoltaic industry has increasingly lower production costs of panels [16,17], so works such as those of Akrami et al. [18] and Eslami et al. [19] propose multi-generation energy systems to mitigate the effects of climate change, in which the solar photovoltaic industry has a leading role.
Currently, Real Decreto Ley 23/2020 of 23 June [20], which approves measures in the field of energy and other areas for economic revival, promulgated by the Spanish Government, aims to promote the process of transition of the Spanish energy system to a climate-neutral one, and in which renewable energies are expected to play a fundamental role for this objective.
Managing the transition to a renewable energy future is a major policy priority in many countries [21]. It is necessary to reflect on why Spain does not lead the ranking of European countries in terms of photovoltaic electricity production, if it has the most favourable conditions for doing so [22,23]. In fact, according to the Atlas of Solar Radiation in Spain together with data from the EUMETSAT Climate PAS [24,25], Spain, Greece and Portugal are the countries that on average receive the greatest amount of radiation on a horizontal surface [26,27]. Santa Cruz de Tenerife is the Spanish capital that receives the greatest amount of global radiation (average global irradiance of 5.40 kWh/m2 per day), with the Canary Islands capitals receiving the greatest diffuse irradiance in all of Spain [28].
The average global irradiance from October to February is much higher in the two Canarian capitals than in any other peninsular capital. This difference is even more noticeable in the diffuse irradiance than in the direct irradiance [29,30,31]. However, the capitals of the southern half of the peninsula receive a greater amount of radiation in spring and summer than in the Canary Islands. It is clear that the orographic diversity of the Iberian Peninsula and both archipelagos condition the existence in Spain of a great variety of climatic regions, which results in important contrasts in the distribution of radiative energy at a national level [24,25].
The information collected in the AEMET Solar Radiation Atlas is of great importance for the planning of solar energy installations [32,33], especially when choosing optimal sites. Due to the need for correct and efficient energy planning, the administrations in charge of promoting territorial planning strategies should promote, enhance and maximize the appropriate implementation of energy infrastructures [34,35]. In the Autonomous Community of the Canary Islands there are guidelines for the Energy Sector Planning (DOSE), and institutionally work is being carried out on a preliminary document that develops the Canary Islands Energy Strategy for the period 2015–2025 [36].
The strategic situation of the Canary Islands with respect to solar radiation and their condition as isolated systems dependent on energy from the outside, justified the setting up more than 25 years ago of pioneering installations for the production of renewable energies, both in the solar and wind energy sectors, which have been consolidated over these years [37]. Despite the fact that the first installations for the production of these types of renewable energy in the Canary Islands proved to be a success, it is essential to develop methodologies that take into consideration the limitation of the territorial resource and that integrate multi-criteria evaluation techniques when detecting the ideal location of new photovoltaic solar energy installations [38,39].
The objectives of this study are: (1) to develop a methodology based on multi-criteria evaluation techniques for the optimal location of solar photovoltaic installations; (2) to apply this methodology to the island of Tenerife in order to identify the optimal locations of solar photovoltaic installations at a regional and municipal level; (3) to contrast the results obtained from location with respect to the solar photovoltaic installations that currently exist in operation on the island.

2. Materials and Methods
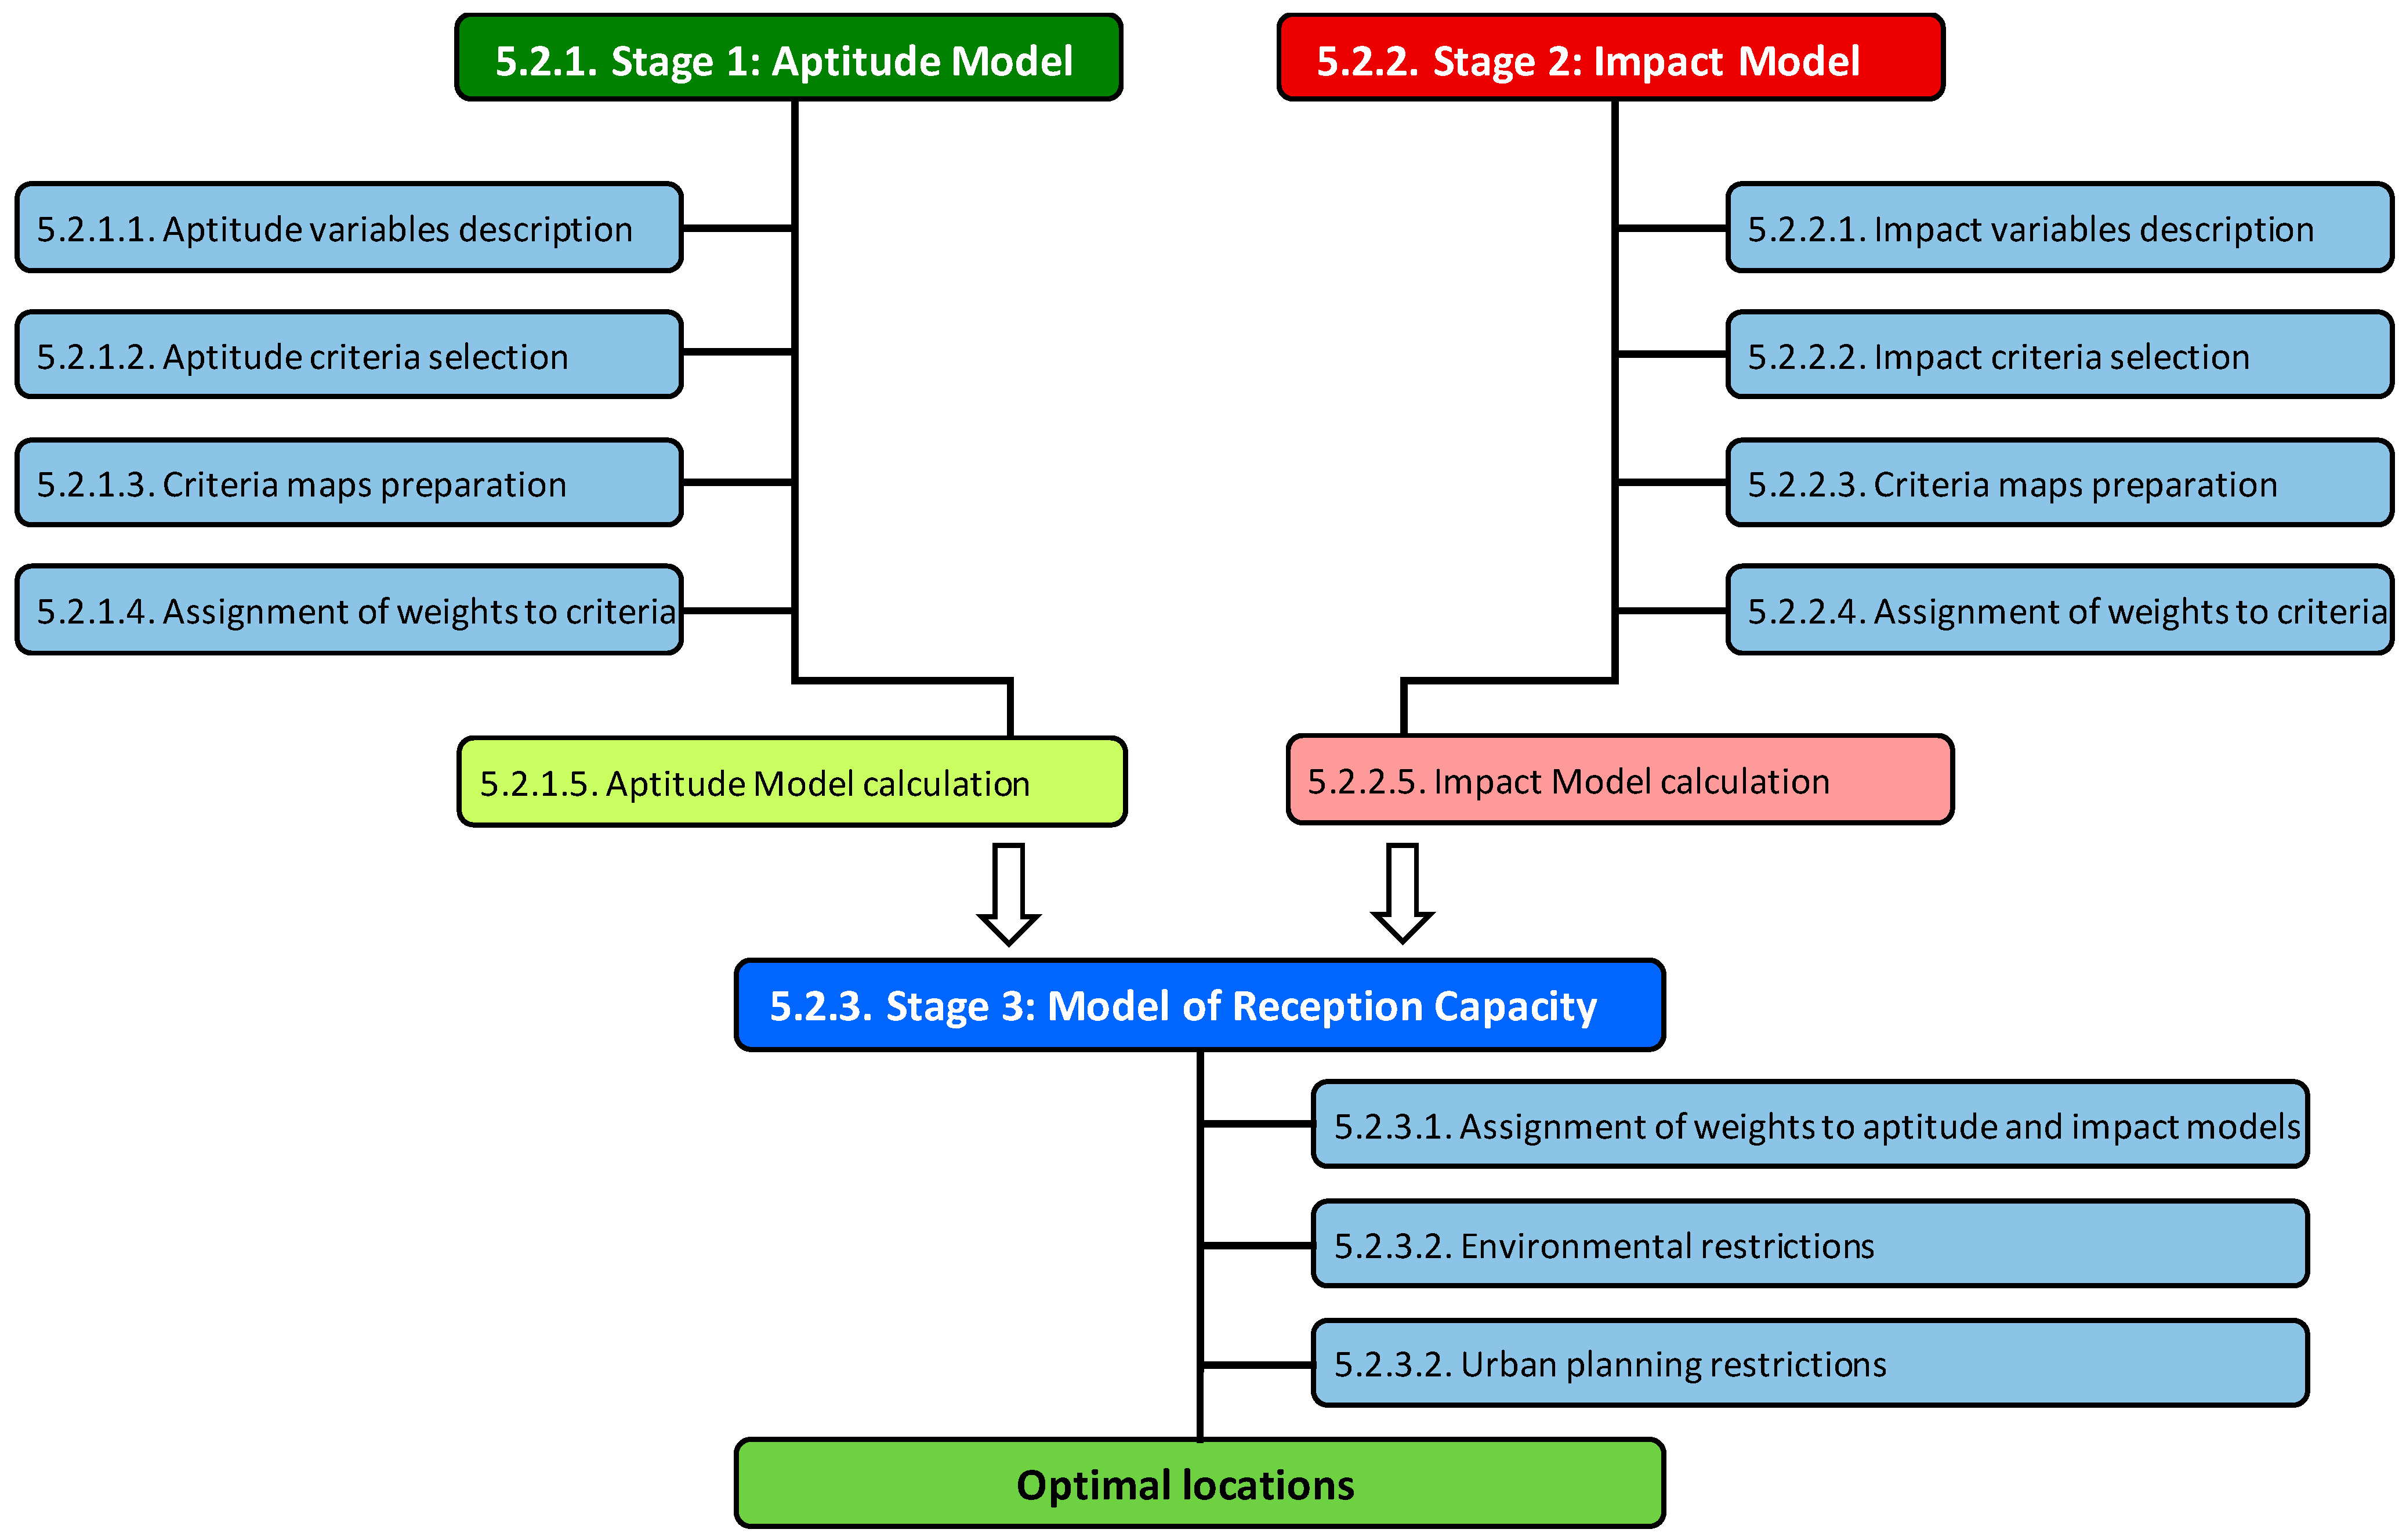
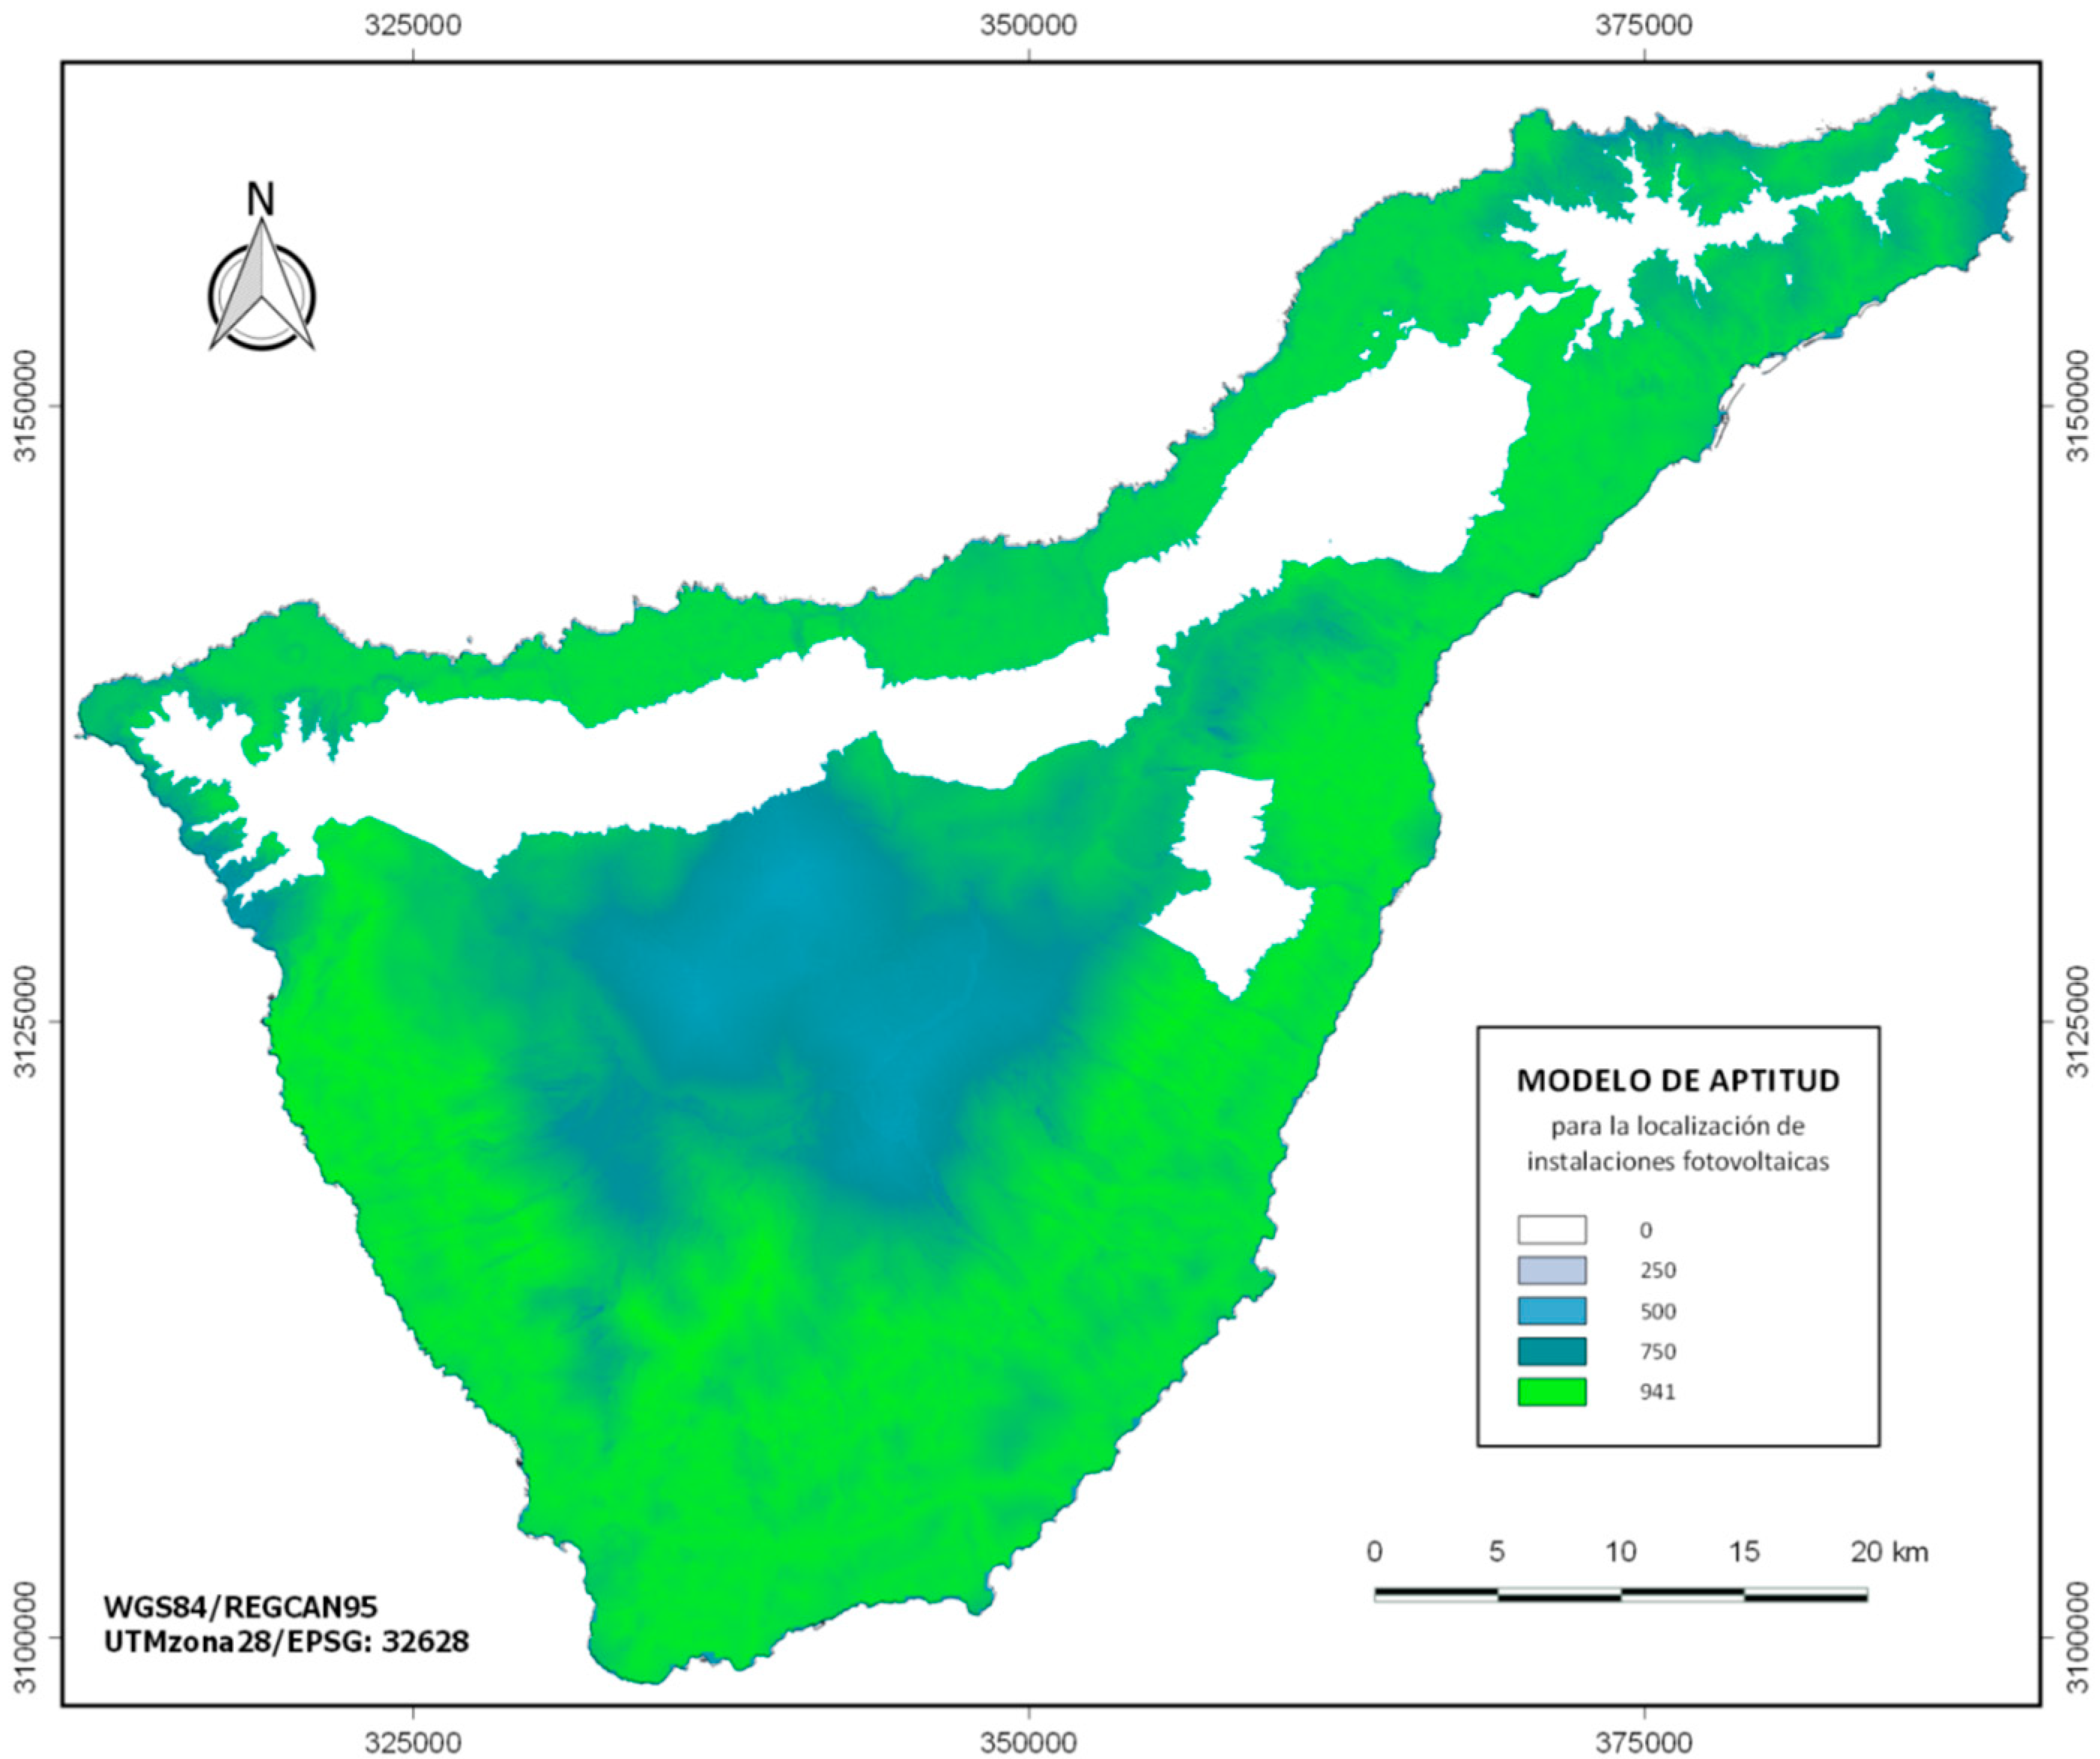
The area of application and development of this work was the island of Tenerife (Spain). It is the island of the Canary Islands with the largest population (917,841 inhabitants in 2019) and extension (2034.28 km2), and its 31 municipalities are distributed in 11 regions: Abona, Acentejo, Anaga, Metropolitan Area, Icod-Isla Baja, Macizo Central, Southeast, Southwest, Valle de Güímar, Valle de La Orotava and Teno.
The study aims to develop a method for selecting the optimal location of photovoltaic solar energy installations by means of multi-criteria evaluation techniques [40,41,42], applying it in a concrete way for its implementation on the island of Tenerife. To this end, we worked with a physical planning model based on the analysis and comparison of a series of significant variables or elements, which in a first phase were transformed into suitability criteria for integration into the suitability model by assigning weights to the selected criteria. In a second phase, the Impact variables that influenced the location of solar photovoltaic installations were selected, which, once transformed into criteria and after the assignment of their corresponding weights, would allow the Impact Model to be obtained. These Aptitude and Impact Models were integrated in a third phase, which determined the Hosting Capacity Model, in which, after applying certain restrictions, the optimal alternatives and their geographical location were selected by means of multi-criteria evaluation techniques (EMC).
To carry out the relevant analyses required in the proposed methodology, the free license software QGIS (version 3.10. A Coruña), and gvSIG (version 2.5) were used. Figure 1 shows the diagram of the proposed methodology to detect the best locations for solar photovoltaic installations [43].
This physical planning model used employs a set of significant variables that are analyzed, compared and integrated [44]. Its implementation goes through three phases described below.

2.1. Aptitude Model

Firstly, the variables of the physical environment were selected, which allowed the selection criteria and the assignment of their relative weights to be correctly defined. The suitability criteria are the standards to be applied as the basis for selecting the optimal alternatives. To compare compliance with the suitability criteria, evaluation matrices will be developed. Thus, each possible location constitutes an alternative that can be selected on the basis of the results of these matrices.
These variables were as follows:
-
Physical Environment Variables:
(1)
Slope, one of the variables with the greatest influence on the performance of the panels [45,46,47], considering that minimum slope values imply maximum levels of suitability (less land movements and costs for land conditioning);
(2)
Solar irradiation, so that the maximum levels of the Horizontal Global Irradiation (HGI) variable provide maximum levels of suitability with respect to this criterion of degree of sunshine [48]; and
(3)
Cloudiness, the extent and thickness of the cloud cover has a very negative effect on the surface incidence of direct solar radiation and increases the proportion of diffuse radiation [49]. Although for our area of study it is not necessary, in territories with a greater Saharan influence it would be interesting to add the variable atmospheric dust from the Sahara to the model, because of its negative influence on the performance of solar panels [50,51,52].
-
Development Pattern Variables:
(1)
Communication routes, considering that greater accessibility to these routes implies greater suitability; and
(2)
Connection to electrical energy networks, the greater the proximity to a medium voltage electrical line, the greater the suitability of this location for the location of a photovoltaic solar energy installation.
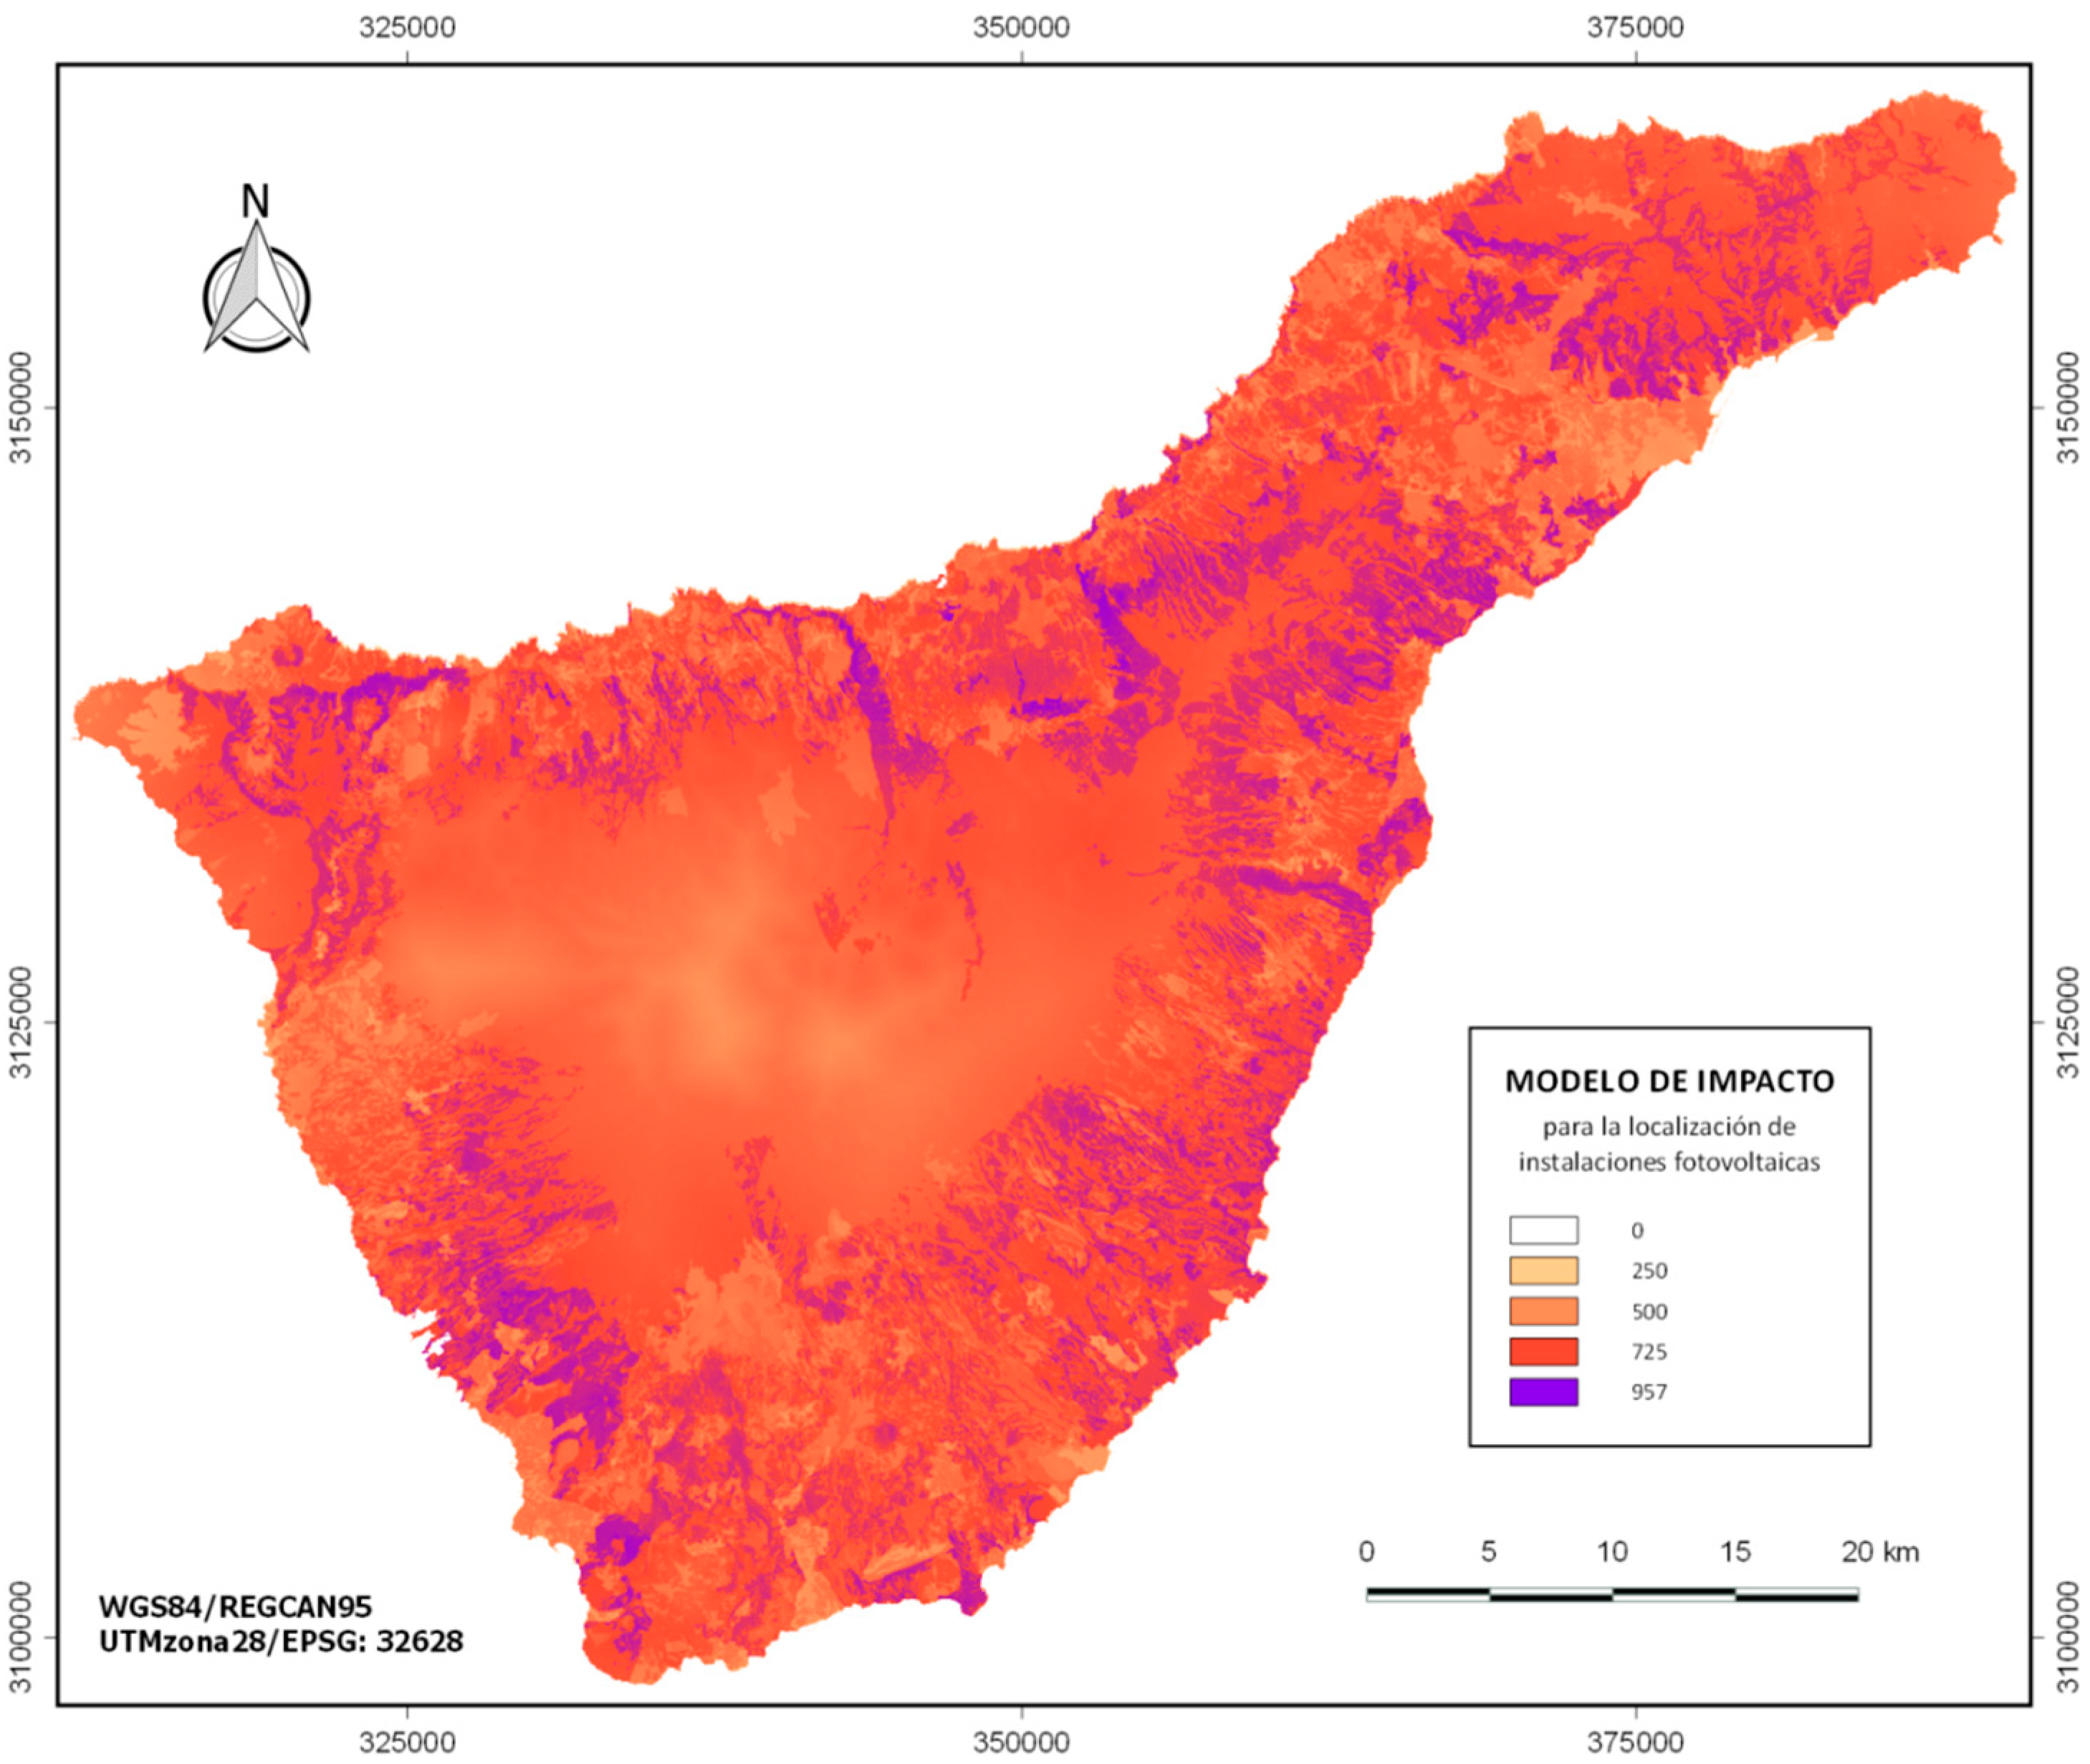
The treatment of the information related to each and every one of the previous variables was carried out by means of geoprocessing in the previously mentioned Geographic Information Systems (GIS) software.
Once the selection criteria for each of these variables were selected and defined, they were integrated with the physical environment variables related to each of them. Thus, it was possible to create a map-criteria which showed the degree of compliance with each criterion.
Then, the standardization of the criteria maps was carried out. In this sense, a scale of 0 to 1000 was established, where the value 1000 corresponded to the maximum value of the scale for measuring both Aptitude and Impact. This normalization allowed both the comparison between criteria-maps and their subsequent integration to obtain the Aptitude Model that would later be integrated with the Impact Model.
The next step was to apply Saaty’s Analytical Hierarchy Method (1980) to assign weights (W) to the selected criteria, thanks to the collaboration of experts. After checking the consistency of the experts’ Saaty matrices, it was already possible to assign the weights to each of the criteria selected for the Aptitude matrices (Table 1).
As all these criteria did not prove to be equally significant, the additive compensatory technique of weighted linear sum was performed to ensure that at each point in the territory the accumulated value calculated represented the degree of suitability of that alternative.
The Suitability Map for the locations of these energy facilities was obtained thanks to the integration of all the maps-criteria elaborated, previously weighted with the assigned weights.

2.2. Impact Model

The implementation of photovoltaic solar energy installations has an inevitable impact on the territory [34,53]. Among the positive impacts we find the favouring of the economy and local development [34,36], but there are also many negative impacts generated, especially those related to the alteration of the land.
In this second phase, for the creation of the Impact Model, only the impact variables that had an influence in relation to the location of the installations were taken, and these were:
(1)
Hydrology (greater impact according to shorter distance from the riverbeds);
(2)
Land uses (Land uses of the Corine Land Cover 2012 and Map of Crops of the Canary Islands); and
(3)
Landscape vulnerability (with two sub-variables:
(a)
Proximity and
(b)
Cumulative visibility), establishing that the maximum impact values coincide both with the values of maximum visibility from the centroids of the towns, and with the values of greater proximity to the centroids of the towns and roads.
In a process analogous to that developed in Phase 1, certain criteria were selected from these variables in order to constitute the criteria-maps, which were then standardized.
Next, weights were assigned using the Analytical Hierarchy Method and the compensatory technique of weighted linear summation, so that the degree of adaptation to the facility was accumulated at each point in the territory (Table 2).
Since the variable “landscape vulnerability” is divided into two sub-variables, the decision was made to weight the Cumulative Visibility by 40% and the Weighted Proximity by 60%, their respective weights being 0.194 (Cumulative Visibility) and 0.291 (Weighted Proximity).
The Impact Model generated by geoprocessing accumulated at each point in the territory all the impacts expected from this type of energy facilities.

2.3. Hosting Capacity Model

The ideal location on the territory of a solar photovoltaic installation will be the one that presents a maximum Aptitude and at the same time generates the least impact. Therefore, the elaboration of the Hosting Capacity Model will be given by the integration of the Aptitude and impact matrices according to the following expression:
HC = [α · Aptitude ] − [β · Impact]
where α is the weight to be assigned to fitness and β is the weight to be assigned to impact in order to obtain the carrying Capacity.
The analysis of the Hosting Capacity was carried out in three different scenarios, so that all possible subjectivity in the assignment of weights was eliminated, and thus the results obtained were objective:
More weight to the Aptitude Model versus the Impact Model:
HC60-40 = [0.60 · Aptitude Map] − [0.40 · Impact Map]
Same weight to Aptitude and Impact:
HC50-50 = [0.50 · Aptitude Map] − [0.50 · Impact Map]
More weight to the Impact Model versus the Aptitude Model:
HC40-60 = [0.40 · Aptitude Map] − [0.60 · Impact Map]
From each of them, the range of positive and negative values was analyzed, so that the scenario with the largest range of positive values was selected, as it showed more possible locations with more suitability than impact [43].
Before determining the optimal locations in the territory for these energy facilities, environmental and urban restrictions had to be considered. Among the former, it is essential to point out that the main environmental restriction involved having to reject the implementation of this type of installation within the Natural Protected Spaces (NPS) existing on the island of Tenerife (48.6% of the extension of the island), since the already repealed Decreto Legislativo 1/2000, of 8 May [54], which approved the Revised Text of the Laws of Territorial Planning of the Canary Islands and Natural Spaces of the Canary Islands, did not contemplate this use in any of the 7 categories of NPS that it recognizes.
This legal impossibility of locating photovoltaic solar installations for energy production in the PNS was included in the Hosting Capacity Model, and a value of 1 (suitable) to the rest of the island territory.
With regard to urban planning restrictions, it should be noted that Tenerife’s urban planning regulations specify that any use of rural land transformation requires a minimum of 10,000 m2 of plot, the prohibition of opening new access roads longer than 400 metres, and a maximum slope limitation of the land set at 25%. On the other hand, Ley 4/2017 of the Land and the PNS of the Canary Islands [55], with regard to renewable energy installations, does admit their authorization as a use of public and social interest on rustic land for economic protection and on common rustic land, as long as it is not expressly prohibited in the Island Ordinance Plan (PIOT, which defines a series of Homogeneous Regulation Areas) or in the planning of the PNS.
The Territorial Protection Areas are a typology of Homogeneous Regulation Areas (HRA) that despite being destined for agricultural use or landscape protection, it is possible to implement energy facilities in them, and in fact, this is the current reality in Tenerife, since all the renewable energy production facilities are located in HRA of Territorial Protection.
In order to implement these urban planning restrictions, it was necessary to verify the minimum requirements already mentioned, as well as the basic regime of uses that the PIOT establishes in each type of Homogeneous Regulation Area. To demarcate the areas where it would be possible to authorize this type of energy facility (HRA for Economic Protection and HRA for Territorial Protection), only the 353 polygons corresponding to these HRAs were considered.
Once this vectorial layer of the HRAs was obtained, it was used as a mask to extract the raster values of the Hosting Capacity Model selected in each of the 353 polygons. Thus, it was possible to reclassify and adjust the selected Reception Capacity Model to the geographical limits of the HRAs of the PIOT.
Likewise, all the photovoltaic solar energy facilities in Tenerife that are currently in operation and belonged to the previous 353 estates were also georeferenced.

2.4. Selection of Municipalities and Regions

As with the extraction of results from the Hosting Capacity Model, which was selected and already reclassified and adjusted to the geographical limits of the PIOT HRAs, the same results were then extracted, but by region, taking into account the minimum, maximum and average values of their corresponding raster [43].
For the detailed analysis of regions and plots, the polygonal vectorial layer of cadastral plots and sub-plots of the 31 municipalities of the island of Tenerife was used, obtained through the WMS service of the Electronic Headquarters of the Cadastre. Since this polygonal layer has information about the average surface and slope of each plot and subplot, grid statistics were carried out using this vectorial layer together with the regional models of Reception Capacity adjusted to the HRA of PE and PT. Thus, it was possible to select those plots that met the minimum requirements of Area > 10,000 m2 and Slope < 25%.
Once all the plots where the installation of photovoltaic solar panels was possible were known, all the possible plots were arranged according to the average value of the Hosting Capacity they presented. Two filters were carried out per HC: a first filtering in which the HC was equal to or greater than 300, and a second in which the HC was equal to or greater than 250. In this second filtering the possible options were notably increased with respect to the first filtering.
It should be stressed that, at county level, the average HC values obtained from the grid statistics should be considered as a guide for identifying the prevalence between counties. The determination of the optimal plots goes through identifying exactly and at a higher level of detail, those that have the maximum HC values.

3. Results

3.1. Aptitude Model

Once all the criteria-maps related to the Aptitude variables were obtained, they were weighted with the average weights assigned by the experts, and integrated in the following mathematical model:
[(HInsolation·0.363) + (HElectrical connection·0.265) + (HSlope·0.222) + (HAccessibility·0.150)] · (HCloudiness)
The result was the subsequent Aptitude Model for the Island of Tenerife (Figure 2):
Since the methodology established that the values taken by the models’ pixels should be between 0 and 1000, it was found that the maximum value was indeed 942, thus meeting this criterion.
The areas under the influence of the sea of clouds were discarded, since the formation of cloudiness associated with the reversal of the trade winds and their persistence in the summer months means that they cannot be considered suitable for the development of this energy production activity. Basically, the areas discarded for this reason are those between 600 and 1500 m above sea level in a N and SE orientation.

3.2. Impact Model

As with the procedure carried out for the Proficiency Model, the impact criteria maps were integrated using the weights assigned by the group of experts, and in this case using the following weighting model:
[(HDistance Courses·0.142) + (HLand Uses·0.373) + (VisibilityAccumulated from urban settlements·0.194) + (Weighted Proximity to urban settlements and roads ·0.291)]
The result was the map below (Figure 3):
The maximum value was 957, therefore also less than 1000, so the result was validated, as was the case with the Proficiency Model.
It is necessary to point out that there are geographical areas of the island of Tenerife (in particular the midlands) where agricultural uses were not found to be correctly reflected in the Corine Land Cover, due to the fact that these are very small and dispersed lands. Therefore, when the information concerning the Map of Crops of the Canary Islands was introduced, the impact values of these midlands areas were lowered.

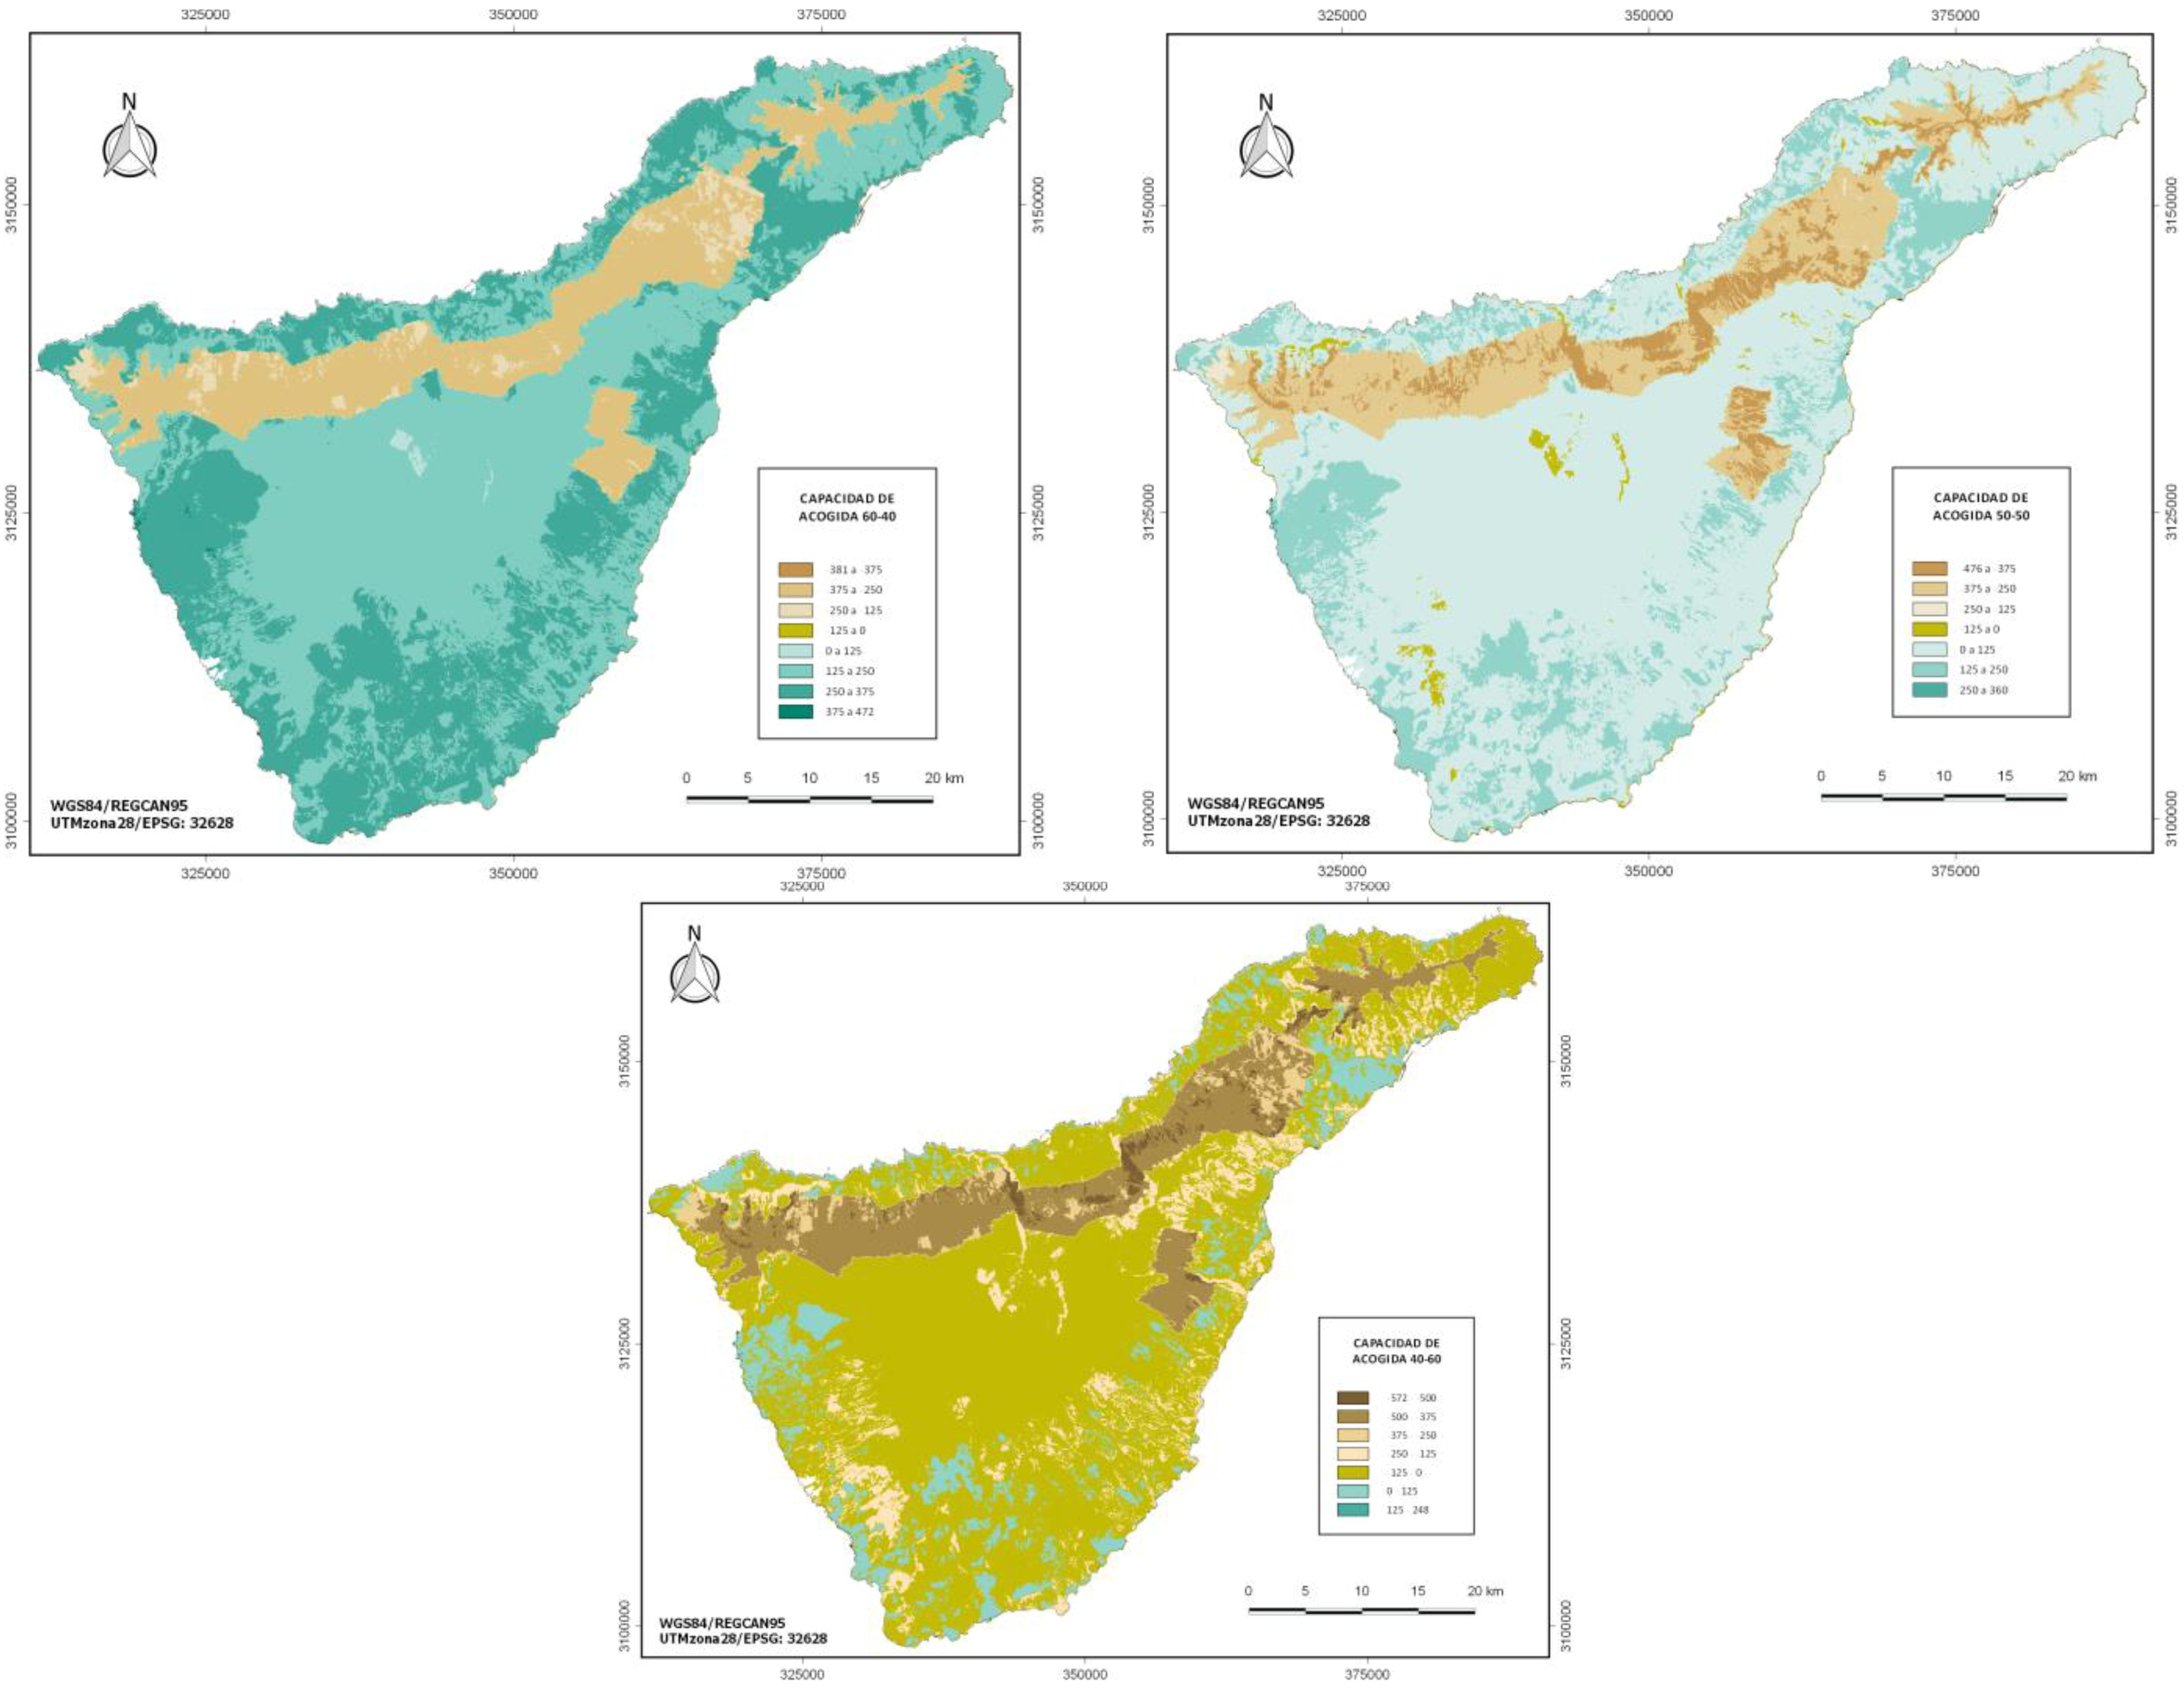
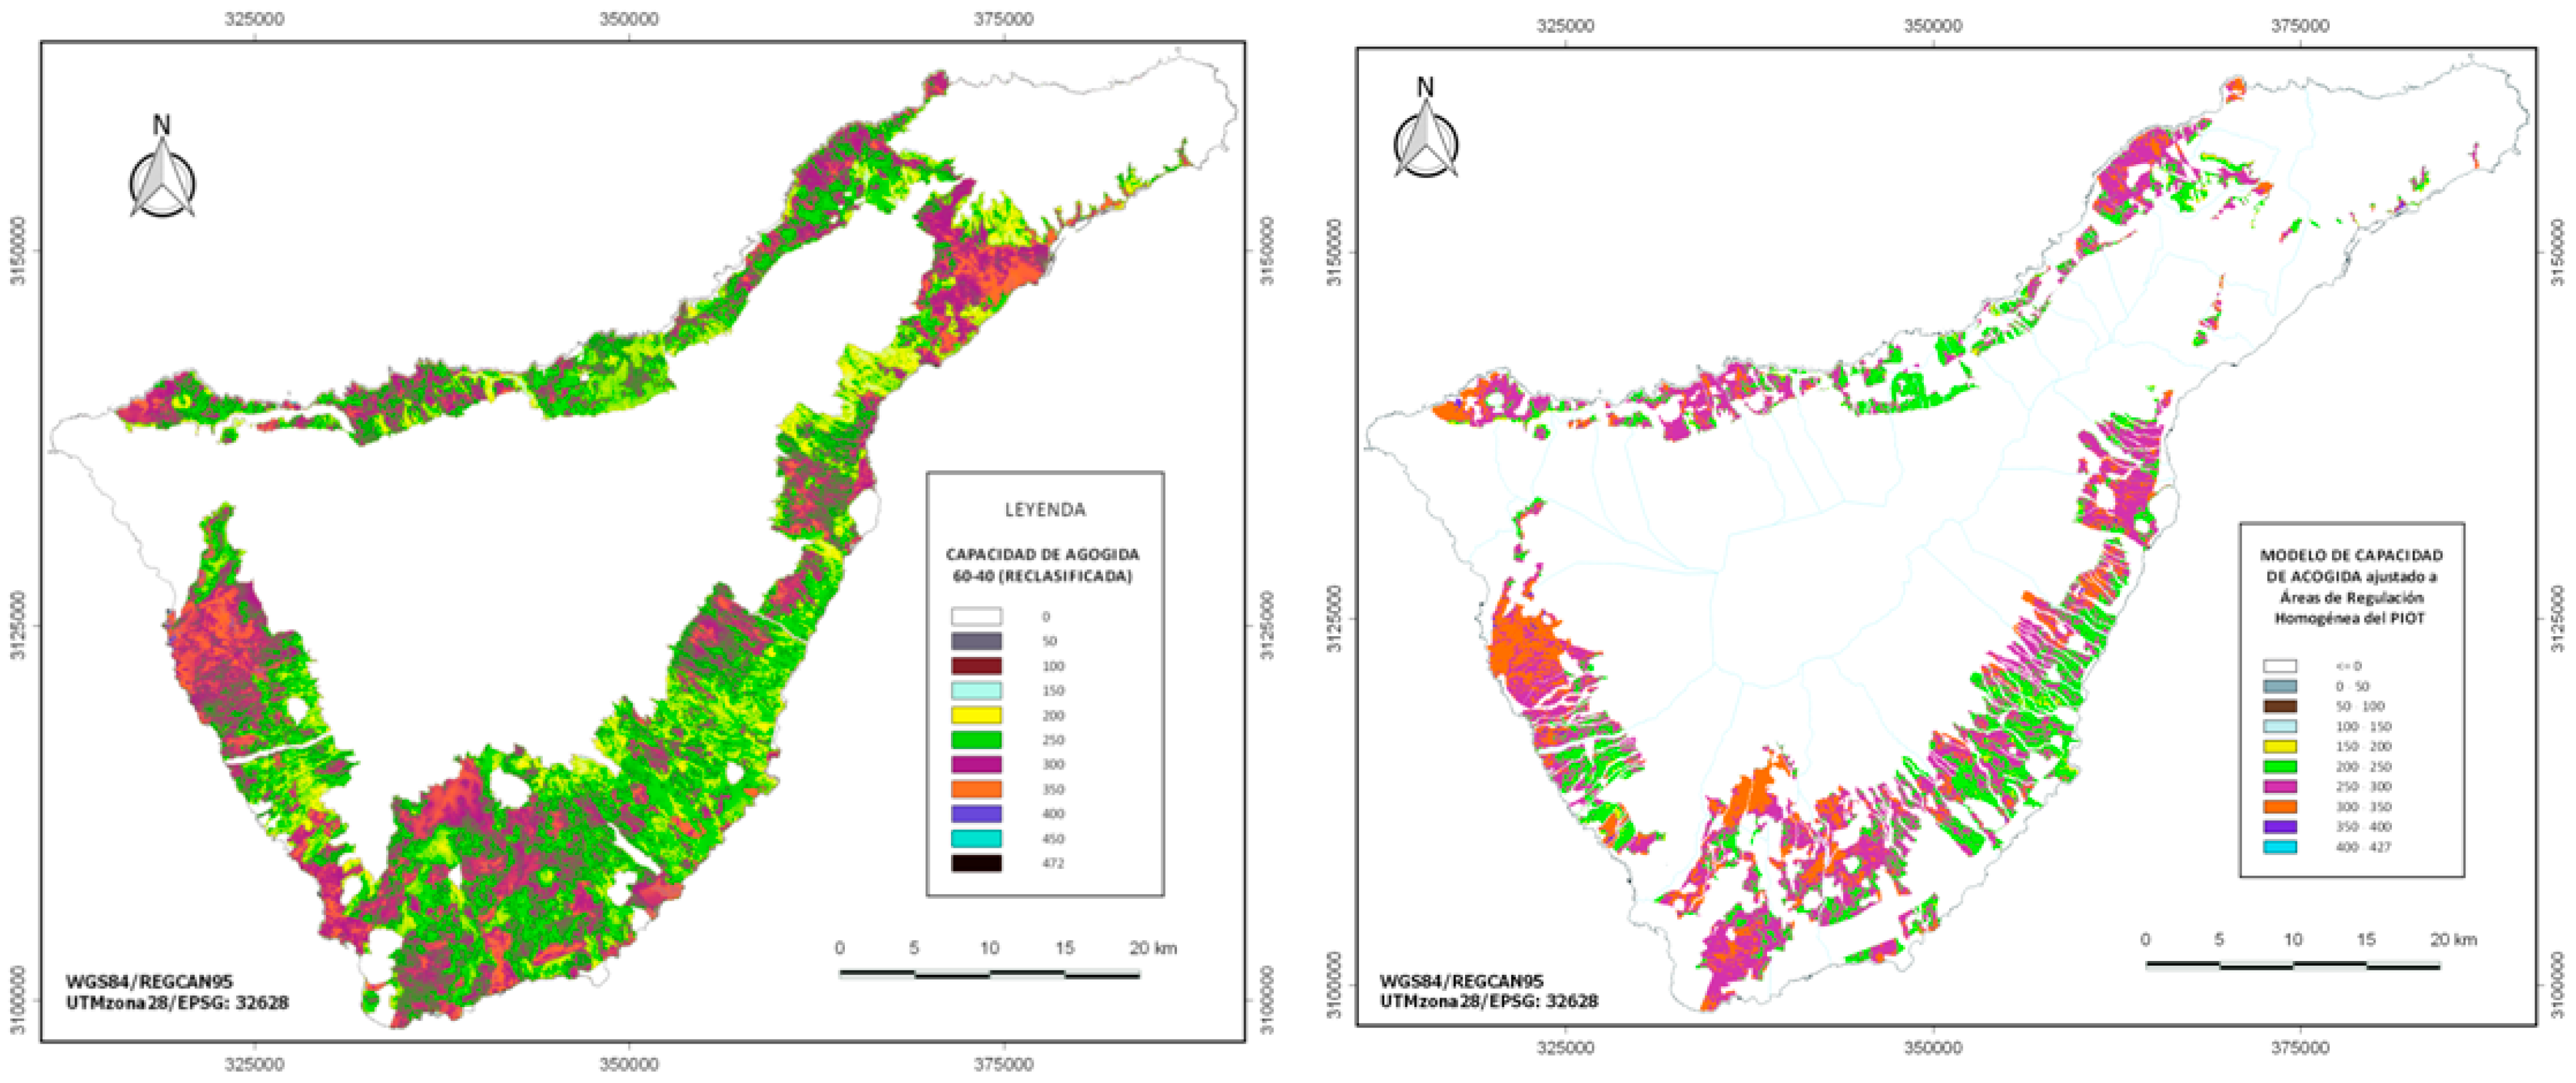
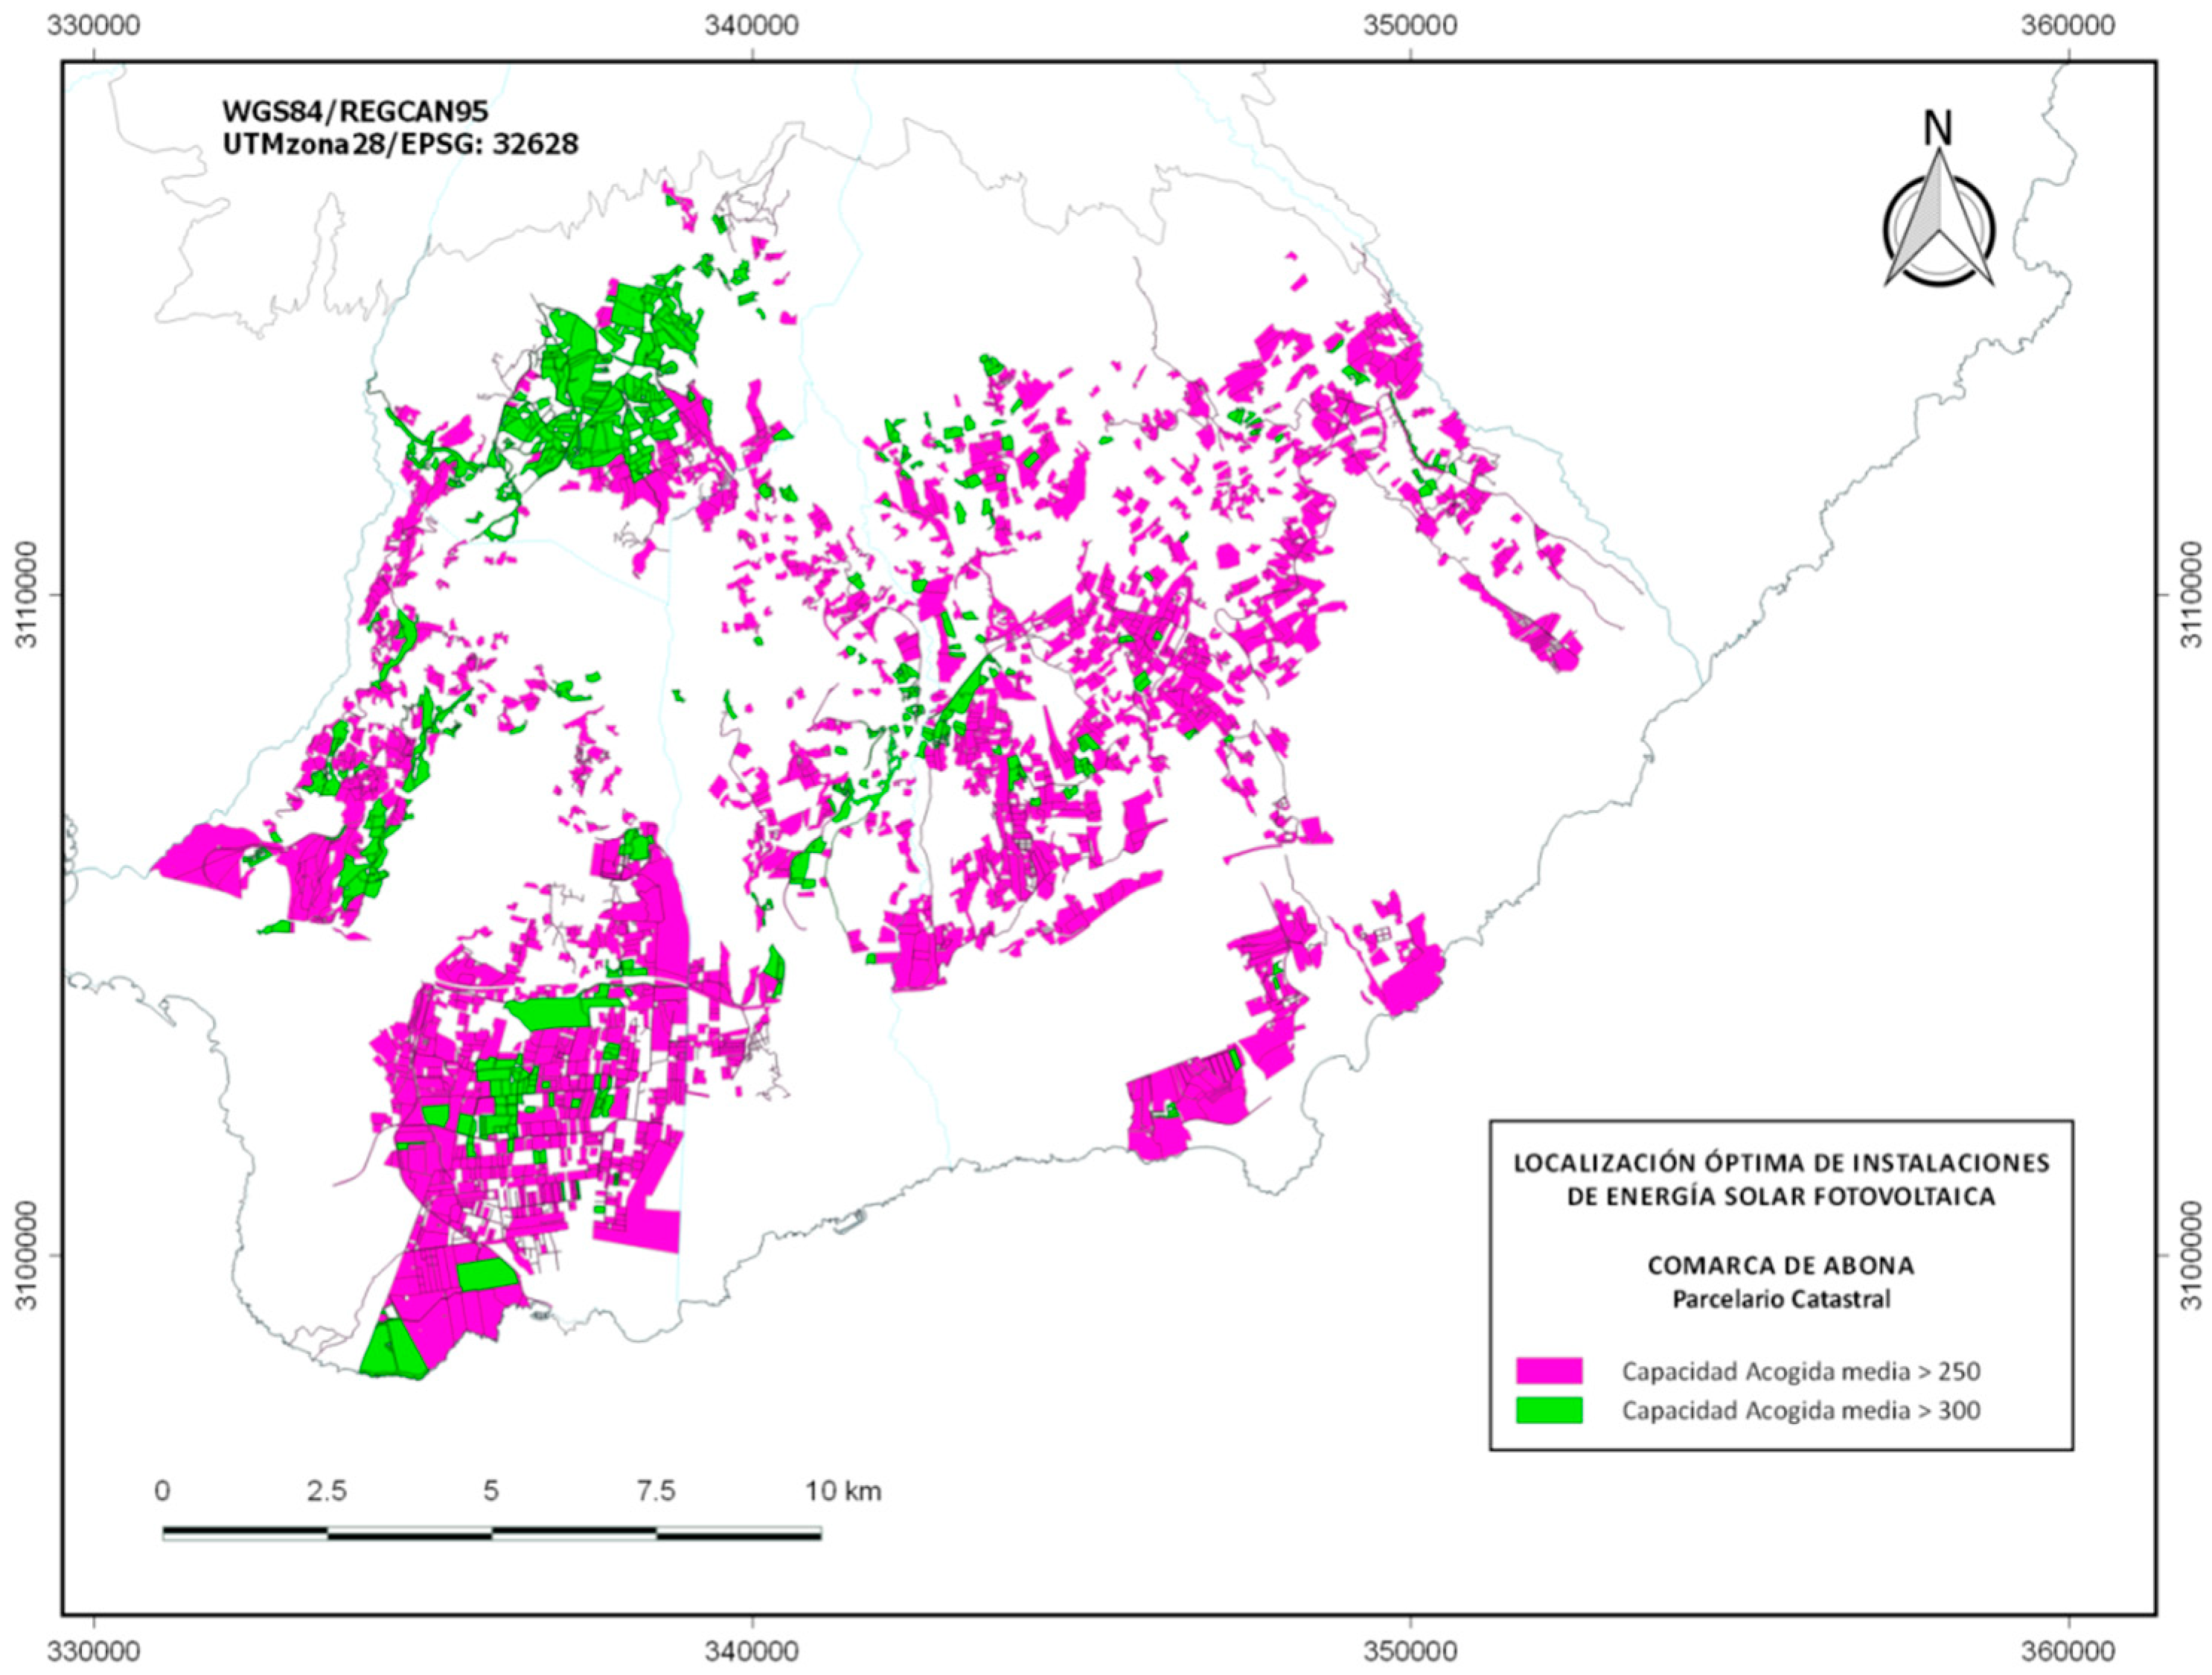
3.3. Hosting Capacity Model
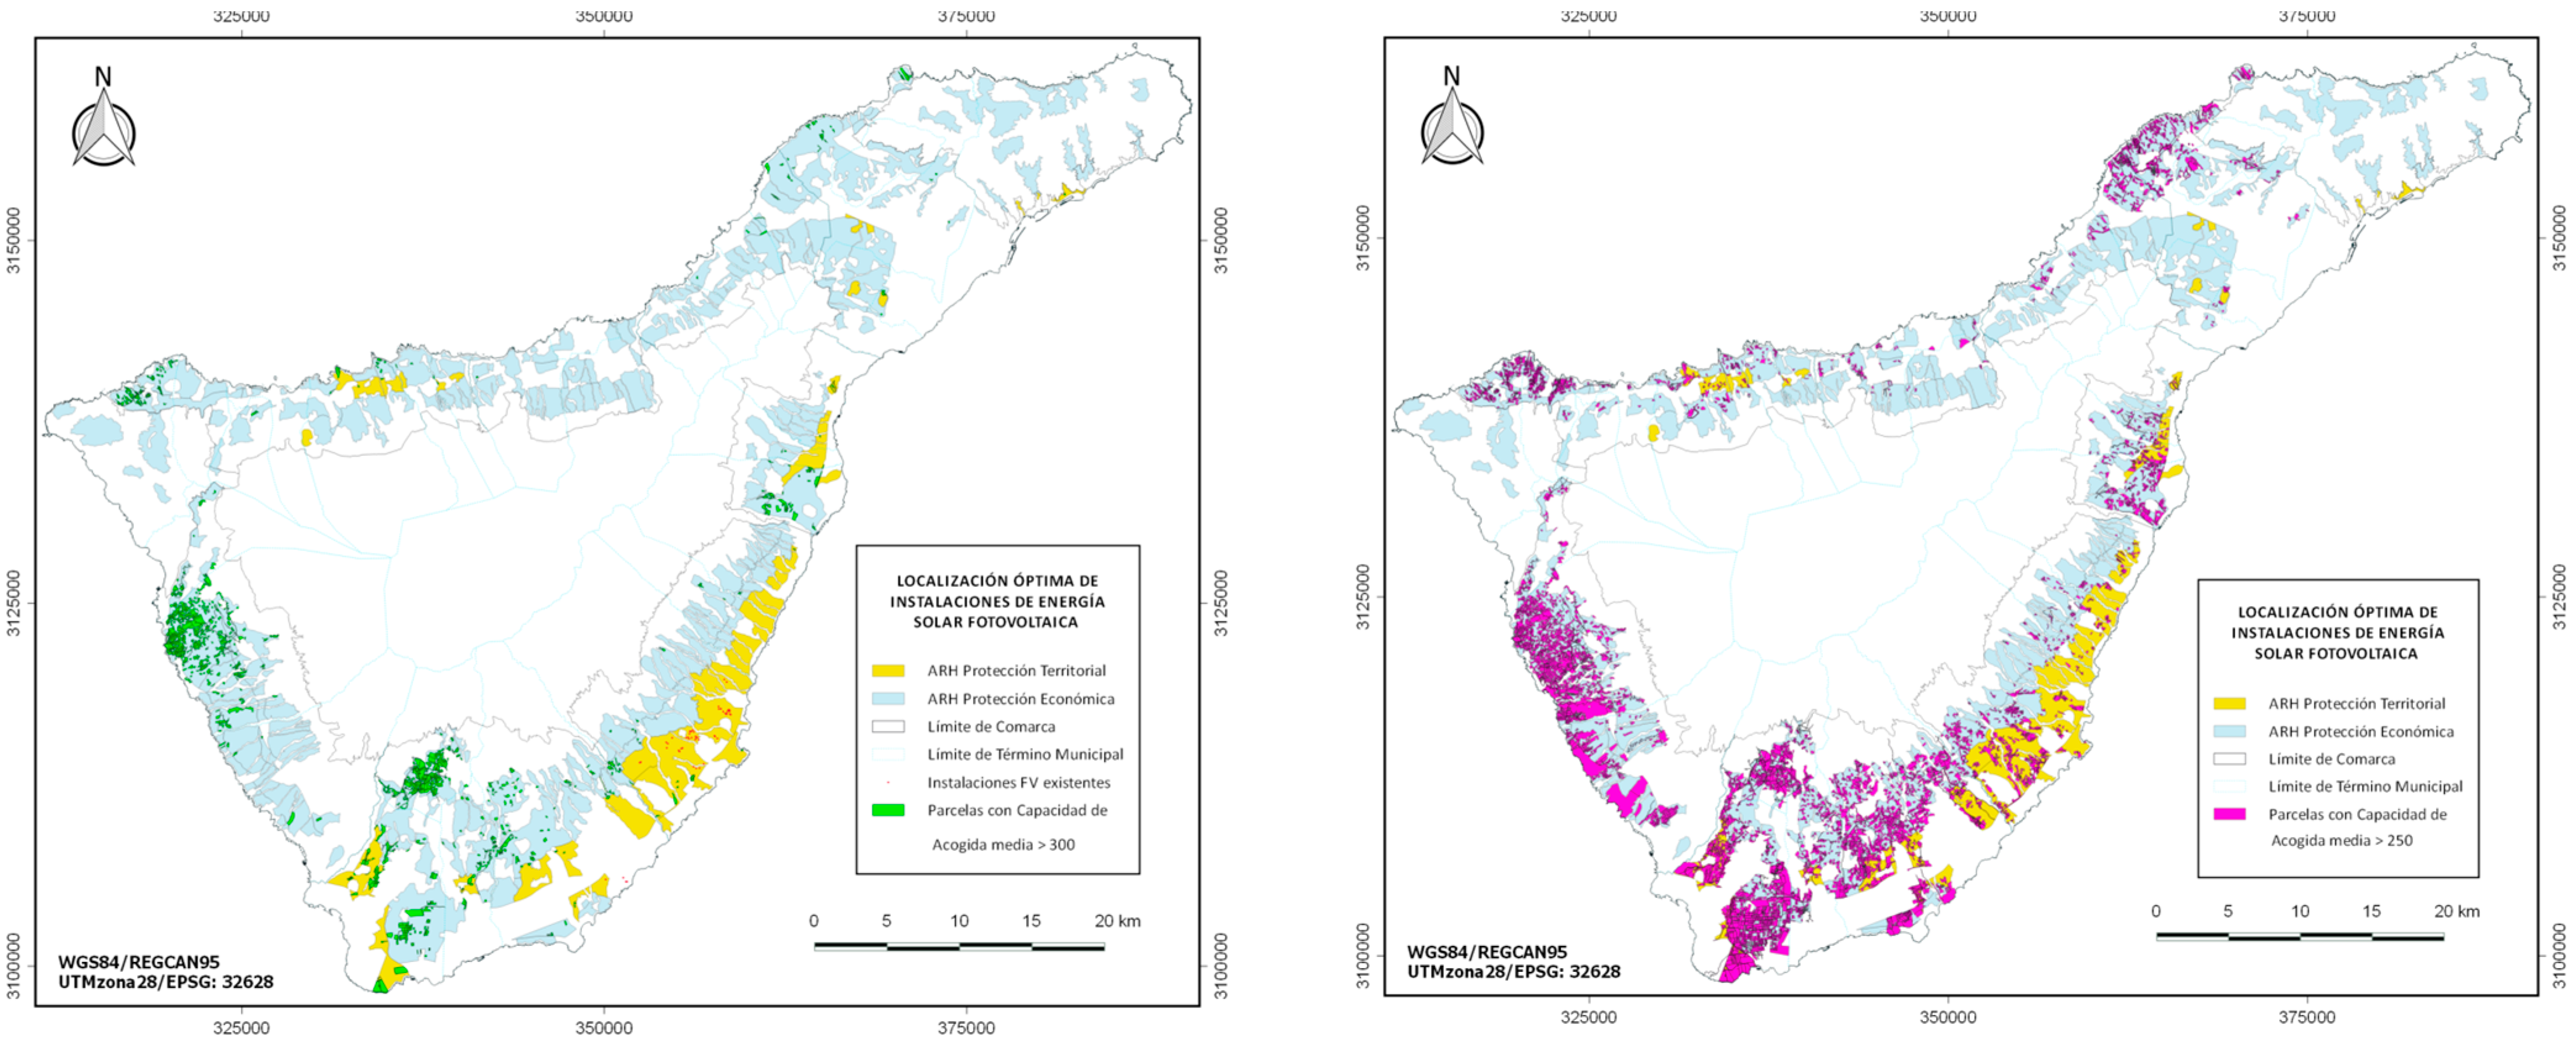
The Hosting Capacity Model was obtained by integrating the Aptitude and Impact Matrices, according to the weights assigned in each of the three scenarios considered, resulting in the following maps (Figure 4):
In each of the three maps relating to the Hosting Capacity Model, the analysis of their ranges of values was carried out, as well as a comparison of the dominance of positive and negative values. In the HC60-40 scenario the values were between −381.40 and 472.87; for the HC50-50 scenario the values were between −476.76 and 360.85; and finally for the HC40-60 scenario they were −572.11 and 248.84.
Therefore, the scenario selected to continue the methodology for the location of this type of energy facilities was the one represented by HC60-40. Thus, the HC60-40 model was reclassified by eliminating the negative values, as these represent the non-viable location options.

3.4. Restrictions

Based on both the environmental (represented by the PNS) and urban restrictions discussed above, it was possible to generate the following restriction maps that were applied to the CA60-40 scenario (Figure 5):

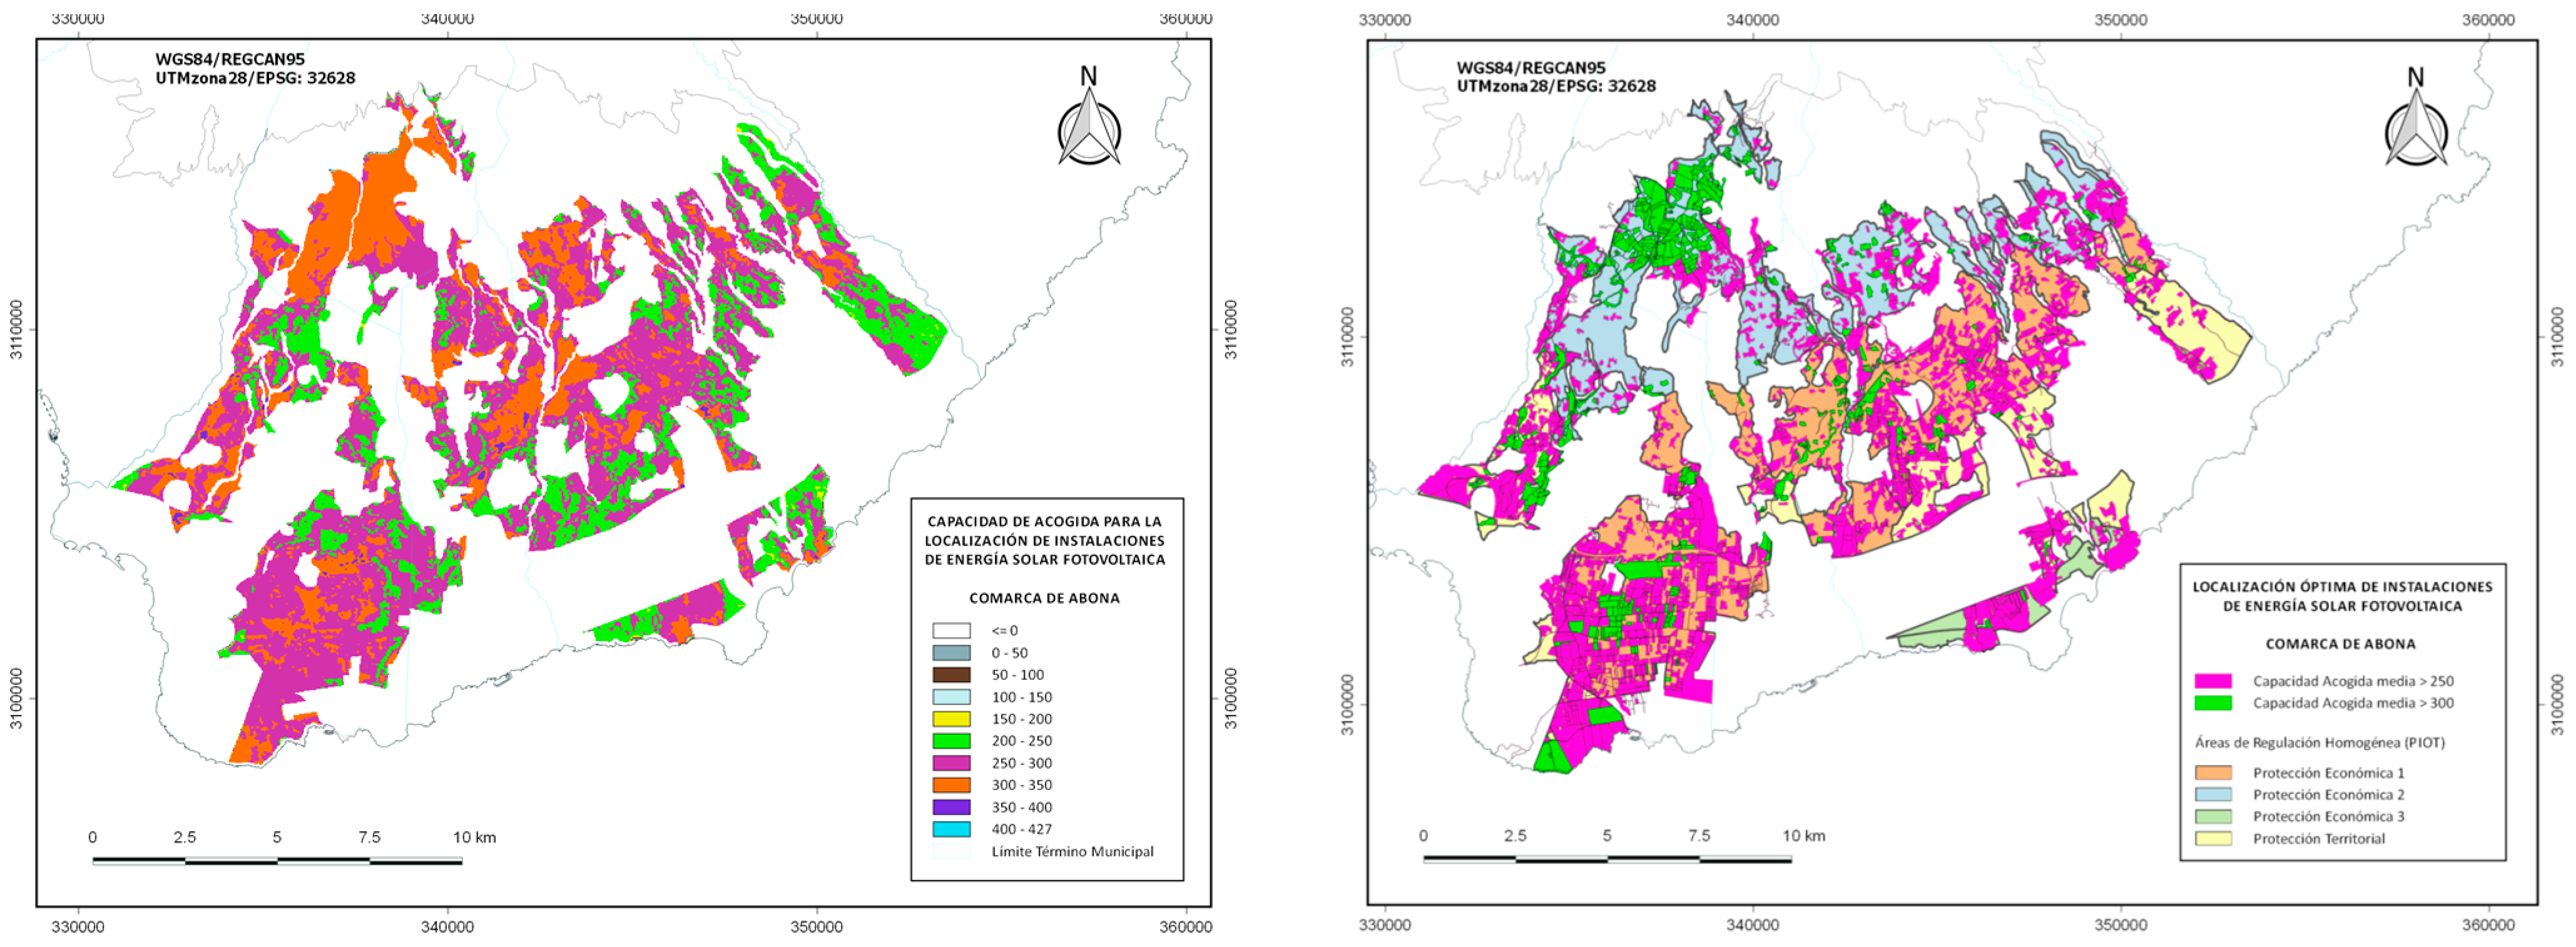
3.5. Optimal Municipalities and Districts

Once the possible location plots were ordered based on their HC values, and having applied the HC filter equal to or greater than 250, the result obtained was that the counties with the greatest Capacity for the installation of these types of panels are, in order from highest to lowest: Abona, Suroeste, Valle de Güimar and Sureste, since all of them have an HC greater than 200 (Table 3).
It should be noted that an analysis of the regions of Teno, Anaga and Macizo Central was ruled out, since their geographical delimitation coincides with that of several Natural Protected Areas.
In order to improve the analysis carried out by regions, grid statistics by municipality were carried out. The result that was observed was that the maximum values of Average Hosting Capacity were reflected in those municipalities that had a greater number of optimum locations, despite the existence of certain exceptions.
As an example, the following map shows the result for the region of Abona (Figure 6):
With regard to the cadastral parcel that represents the best locations for this type of facility, and whose HC is at least 250 (parcels in green), the following map was obtained (Figure 7) for the region of Abona:
The optimum location for this type of facility that has been identified through the application of this methodology can be compared to the location of existing operations, by means of the following figure (Figure 8):

4. Discussion

The Fitness Model shows values that are very high on practically the whole island. It can be seen that, overall, the optimum location of this type of installation is much better suited to the mapping criteria for sunshine than, for example, the maps—criteria of accessibility, slope and connection to the electricity grid.
With regard to the Impact Model, it should be noted that the highest values generally corresponded to areas close to towns, with high slopes and also in areas of extensive valleys where greater visibility is required. In addition, the value of the impact was considerably reduced in the midlands, as explained in the results of this research. This fact invites us to think about the possibility that these scattered farms with low profitability (and which are often abandoned) can be reconverted into areas dedicated to the production of photovoltaic solar energy.
Of the three Hosting Capacity scenarios, the HC60-40 scenario obtained the highest proportion of positive values (the suitability far exceeds the impacts generated), and therefore represents a greater number of possible locations for this type of facility. The HC50-50 model would be in second place (as the impact values increase with respect to the HC60-40 model) and finally, the worst scenario would be the HC40-60, as the impact (negative) values in absolute terms would double the range of Aptitude (positive) values.
After the georeferencing of the photovoltaic solar energy facilities in operation, it can be seen that it is the municipality of Arico that houses all the photovoltaic plants located on rural land, and they are also located in ARH of territorial protection. The Granadilla Technology Park also houses two high-powered photovoltaic installations, but they are already on industrial land. This fact is consistent with the research of Marques Perez et al. [39], who employs a GIS-based approach combined with a Multi-Criteria Evaluation methodology to create a map showing a classification of areas with high potential for solar farm development.
By means of comparison with results obtained in other works (e.g., Monedero et al., [56]), it is possible to detect that the distribution of the current farms does not exactly coincide with the geographical positions that have the highest values of the Reception Capacity, but also, the HC values of these locations that currently house the existing farms are considerably high.

5. Conclusions

The proposed methodology has made it possible to detect optimal locations for the installation of photovoltaic solar energy plants, a fact that can be considered of extraordinary importance and applicability for the energy industry. Although in this work it has been applied to the island of Tenerife, it is a generalist methodology that can be extrapolated to any geographical area, as long as the restrictions set out in current legislation are met.
It is possible to develop different Hosting Capacity Models, depending on the importance given to the Aptitude Model and the Impact Model, all depending on the variables and criteria selected at the beginning. Once the best Hosting Model has been selected, and after applying the relevant restrictions to it, it is capable of identifying the best locations to house solar photovoltaic installations. In future research, new variables such as available resources and useful life of these photovoltaic plants could be considered when building and improving the models.
For the island of Tenerife, it has been found that most of the vectorial cartography of urban planning is not adapted to the guidelines of territorial planning of the Island Plan of Tenerife. Therefore, it is difficult to find a correlation between the different categorizations of rustic land and the Homogeneous Regulation Areas (ARH) of the PIOT.
The information required to generate the models necessary to apply this methodology, and thus be able to carry out studies similar to this one, is easily obtained, as it is available in repositories of official bodies destined for this purpose. In addition, a GIS environment with a free license has been selected, such as gvSIG and QGIS, in order to facilitate the application of the proposed methodology.
The requirements that are most important for the installation of this type of plant respond to the need for land of considerable extension and which is close to the electricity grid in order to connect them to it. At present, there is no detailed energy planning for the geographical distribution of this type of facility on the island of Tenerife, as this is evidenced by the location of the facilities in operation. In any case, the farms that are currently in operation are located on land with high HC.
It is necessary that territorial and urban planning promote the reconversion of those lands that are especially suitable for housing energy plants of this type, since in the Canary Islands and in many other places there are specific economic incentives for this purpose, which do not exist on the peninsula. The sustainability of the energy model requires a commitment to the generation of renewable and clean energy, guiding the planning and optimization of resources with systems such as those envisaged in this study.

Author Contributions

Conceptualization, J.V. and M.L.A.; methodology, J.G.; validation, A.H., F.H. and I.G.; formal analysis, C.J.; investigation, M.L.A.; resources, M.L.A.; data curation J.V. and V.R.; writing—original draft preparation, J.G. and M.L.A.; writing—review and editing, F.H. and C.J.; visualization, M.L.A.; supervision, J.V. and L.E.C.; project administration, J.V. All authors have read and agreed to the published version of the manuscript.

Funding

This research received no external funding.

Data Availability Statement

The data presented in this study are available on request from the corresponding author.

Conflicts of Interest

The authors declare no conflict of interest.

References

  1. Orbegozo, C.; Arivilca, R. Energía Solar Fotovoltaica. Manual Técnico para Instalaciones Domiciliarias; Green Energy Consultoría y Servicios: Lima, Peru, 2010. [Google Scholar]
  2. Cabildo Insular de Tenerife. Revisión del Programa de Actuación del Plan Insular de Ordenación de Tenerife. Documento de Aprobación Definitiva. 2011. Available online: https://www.tenerife.es/planes/PTEOTrenNorte/adjuntos/MemoInfo_01.pdf (accessed on 10 January 2022).
  3. Gobierno de España. Ley 24/2013, de 26 de diciembre, del Sector Eléctrico (LSE). Boletín Of. Estado 2013, 310, 105198–105294. [Google Scholar]
  4. Gobierno de España. Real Decreto 413/2014, de 6 de junio, por el que se regula la actividad de producción de energía eléctrica a partir de fuentes de energía renovables, cogeneración y residuos. Boletín Of. Estado 2014, 140–186. [Google Scholar]
  5. Huacuz, J.M.; Villaseñor, F.; Urrutia, M. Photovoltaicrural Electrification and the Electric Power Utility; Cocoyoc. In Proceedings of the Photovoltaic Rural Electrification and the Electric Power Utility, Cocoyoc, Mexico, 8–12 May 1995. [Google Scholar]
  6. Hochmuth, F. Assessment of Photovoltaic Battery Charging Stations to Provide Basic Electricity Services for Remote Rural Households; DME: Arcadia, South Africa, 1997. [Google Scholar]
  7. Gonçalves Pereira, A. Cuatrecasas. Nota Monográfica/Energía: Real Decreto 413/2014, que Regula la Actividad de Producción de Energía Eléctrica a Partir de Fuentes de Energía Renovables, Cogeneración y Residuos. 2014. Available online: https://www.boe.es/diario_boe/txt.php?id=BOE-A-2014-6123 (accessed on 10 January 2022).
  8. Rodríguez-Borges, C.G.; Sarmiento-Sera, A. Sizing through simulation of systems for photovoltaic solar energy applied to rural electrification. Ing. Mecánica 2011, 14, 13–21. [Google Scholar]
  9. Instituto para la Diversificación y Ahorro de la Energía—IDAE. Instalaciones de Energía Solar Fotovoltaica. Pliego de Condiciones Técnicas de Instalaciones Conectadas a Red. (PTC-C-Revisión Julio 2011); IDAE: Madrid, Spain, 2011. [Google Scholar]
  10. López Díaz, A.I.; Blanco Silva, F. Instalaciones de Energía Solar Fotovoltaica. Servicio de Publicaciones; Universidad Católica de Ávila, UCAV: Avilla, Spain, 2012. [Google Scholar]
  11. Perpiñán Lamigueiro, O. Enaergía Solar Fotovoltaica. 2015. Available online: https://github.com/oscarperpinan/esf (accessed on 10 January 2022).
  12. Gholami, Y.; Gholami, A.; Ameri, M.; Zandi, M. Investigation of applied methods of using passive energy in iranian traditional urban design case study of Kashan. In Proceedings of the 4th International Conference on Advances in Mechanical Engineering, Istanbul, Turkey, 19–21 December 2018; pp. 3–12. [Google Scholar]
  13. Guidi, D. A Model for the Evaluation of Sustainable Development Investments: The Case Ofrural Electrification in Morocco. Ph.D. Thesis, Department of Agricultural Economics and Policy, University of Siena, Siena, Italy, 1997. [Google Scholar]
  14. Van Campen, B.; Guidi, D.; Best, G. Energía Solar Fotovoltaica para la Agricultura y el Desarrollo Sostenible. Documento de Trabajo sobre Medio Ambiente y Recursos Naturales n° 3; FAO: Rome, Italy, 2000. [Google Scholar]
  15. Agencia Europea de Medio Ambiente—European Environment Agency. Renewable Energy in Europe—2017 Update Recent Growth and Knock-On Effects; EEA Report No. 23/2017; European Environment Agency: Luxembourg, 2017.
  16. Pillai, U. Drivers of cost reduction in solar photovoltaics. Energy Econ. 2015, 50, 286–293. [Google Scholar] [CrossRef]
  17. Strupeit, L.; Neij, L. Cost dynamics in the deployment of photovoltaics: Insights from the German market for building-sited systems. Renew. Sustain. Energy Rev. 2017, 69, 948–960. [Google Scholar] [CrossRef]
  18. Akrami, E.; Gholami, A.; Ameri, M.; Zandi, M. Integrated an innovative energy system assessment by assisting solar energy for day and night time power generation: Exergetic and Exergo-economic investigation. Energy Convers. Manag. 2018, 175, 21–32. [Google Scholar] [CrossRef]
  19. Eslami, S.; Gholami, A.; Bakhtiari, A.; Zandi, M.; Noorollahi, Y. Experimental investigation of a multi-generation energy system for a nearly zero-energy park: A solution toward sustainable future. Energy Convers. Manag. 2019, 200, 112107. [Google Scholar] [CrossRef]
  20. Gobierno de España. Real Decreto-ley 23/2020, de 23 de junio, por el que se aprueban medidas en materia de energía y en otros ámbitos para la reactivación económica. Boletín Of. Estado 2020, 175–223. [Google Scholar]
  21. Lüthi, S.; Wüstenhagen, R. The price of policy risk—Empirical insights from choice experiments with European photovoltaic project developers. Energy Econ. 2012, 34, 1001–1011. [Google Scholar] [CrossRef] [Green Version]
  22. Espejo, C. La energía solar fotovoltaica en España. Nimbus 2004, 13–14, 5–31. [Google Scholar]
  23. Hadjipanayi, M.; Koumparou, I.; Philippou, N.; Paraskeva, V.; Phinikarides, A.; Makrides, G.; Efthymiou, V.; Georghiou, G.E. Prospects of photovoltaics in southern European, Mediterranean and Middle East regions. Renew. Energy 2016, 92, 58–74. [Google Scholar] [CrossRef]
  24. Torres, C.J.; Cuevas, E.; Guerra, J.C.; Carreño, V. Caracterización de las masas de aire en la región subtropical sobre Canarias. In Proceedings of the V Simposio Nacional de Predicción, INM, Madrid, Spain, 20–23 November 2001. [Google Scholar]
  25. Sancho Ávila, J.M.; Riesco Martín, J.; Jiménez Alonso, C.; Sánchez de Cos Escuin, M.C.; Montero Cadalso, J.; López Bartolomé, M. Atlas de Radiación Solar en España Utilizando Datos del SAF de Clima de EUMETSAT; Gobierno de España: Madrid, Spain, 2012. [Google Scholar]
  26. Castañer, L. Energía solar fotovoltaica. Investig. Cienc. 1981, 56, 6–15. [Google Scholar]
  27. Capel Molina, J.J. El Clima de la Península Ibérica; Ariel: Barcelona, Spain, 2000; 281p. [Google Scholar]
  28. Gobierno de Canarias. Consejería de Economía, Industria, Comercio y Conocimiento. Anuario Energético de Canarias 2015; Gobierno de Canarias: Santa Cruz de Tenerife, Spain, 2016. [Google Scholar]
  29. Dorta, P. La inversión térmica en Canarias. Investig. Geográficas 1985, 115, 109–126. [Google Scholar]
  30. Marzol Jaén, M.V.; Máyer Suárez, P. Algunas reflexiones acerca del clima de las Islas Canarias. Nimbus 2012, 29–30, 399–416. [Google Scholar]
  31. Fundación CIEC. Caracterización Climática de las Islas Canarias para la Aplicación del Código Técnico de Edificación CLIMCAN-010 y su Aplicación Informática; Ministerio de Fomento, Gobierno de España: Madrid, Spain, 2013. [Google Scholar]
  32. Gobierno de Canarias; Consejería de Industria, Comercio y Nuevas Tecnologías; Viceconsejería de Industria y Nuevas Tecnologías; Dirección General de Industria. Guía Técnica de Aplicación para Instalaciones de Energías Renovables: Instalaciones Fotovoltaicas. Available online: http://www.agenergia.org/wp-content/uploads/2018/05/1234263307_GuiaFotovoltaicaGobCan.pdf (accessed on 10 January 2022).
  33. Antón, M.; Gil, J.E.; Fernández-Gálvez, J.; Lyamani, H.; Valenzuela, A.; Foyo Moreno, I.; Olmo, F.J.; Alados-Arboledas, L. Evaluation of the aerosol forcing efficiency in the UV erythemal range at Granada, Spain. J. Geophys. Res. Atmos. 2011, 116, D20214. [Google Scholar] [CrossRef]
  34. Cabildo Insular de Tenerife. Plan Insular de Ordenación de Tenerife. Documento de Aprobación Definitiva. 2002. Available online: http://www.gobiernodecanarias.org/boc/2002/140/boc-2002-140-001.pdf (accessed on 10 January 2022).
  35. Cabildo Insular de Tenerife. Criterios Generales de Implantación Territorial de las Plantas Fotovoltaicas Aprobados por Acuerdo del Consejo de Gobierno Insular en Sesión Ordinaria Celebrada el 12 de Noviembre de 2007. S/C Tenerife. 2007. Available online: http://www.conama11.vsf.es/conama10/download/files/conama2018/CT%202018/222224176.pdf (accessed on 10 January 2022).
  36. Gobierno de Canarias. Consejería de Industria, Comercio y Nuevas Tecnologías. Directrices de Ordenación Sectorial de Energía. Documento de Aprobación Inicial. 2013. Available online: https://www.boe.es/buscar/act.php?id=BOE-A-2003-13621 (accessed on 10 January 2022).
  37. Gobierno de España. Orden IET/1953/2015, de 24 de septiembre, por la que se modifica la Orden IET/1459/2014, de 1 de agosto, por la que se aprueban los parámetros retributivos y se establece el mecanismo de asignación del régimen retributivo específico para nuevas instalaciones eólicas y fotovoltaicas en los sistemas eléctricos de los territorios no peninsulares. Boletín Of. Estado 2015, 232, 86952–86956. [Google Scholar]
  38. Sánchez-Lozano, J.M.; García-Cascales, M.S.; Lamata, M.T. Evaluación de ubicaciones adecuadas para la instalación de plantas de energía solar termoeléctrica. Comput. Ing. Ind. 2015, 87, 343–355. [Google Scholar] [CrossRef]
  39. Marques-Perez, I.; Guaita-Pradas, I.; Gallego, A.; Segura, B. Territorial planning for photovoltaic power plants using an outranking approach and GIS. J. Clean. Prod. 2020, 257, 120602. [Google Scholar] [CrossRef]
  40. Santos Preciado, J.M. El planteamiento teórico multiobjetivo/multicriterio y su aplicación a la resolución de problemas medioambientales y territoriales, mediante los S.I.G. Ráster. Espac. Tiempo Forma Ser. VI Geogr. 1997, 10, 129–151. [Google Scholar] [CrossRef]
  41. Galacho Jiménez, F.B.; Arrebola Castaño, J.A. Modelo de evaluación de la capacidad de acogida del territorio con SIG y técnicas de decisión multicriterio respecto a la implantación de edificaciones en espacios rurales. Investig. Geográficas 2013, 60, 69–85. [Google Scholar] [CrossRef] [Green Version]
  42. Velázquez Saornil, J.; Hernando Gallego, A.; Arroyo Méndez, L.A.; Chasco Yrigoyen, C.; Díaz Gutiérrez, V.; García Angulo, C.; Gutiérrez Velayos, J.; Mongil Manso, J.; Rincón Herráez, V.; Sánchez Reyes, B. Aplicaciones de los Sistemas de Información Geográfica y la Teledetección a la Gestión Ambiental. Ejercicios con software libre. Phytoma España Rev. Prof. Sanid. Veg. 2017, 294, 27–30. [Google Scholar]
  43. Aguiló Pastrana, M.L. Metodología para la localización óptima de instalaciones de energía solar fotovoltaica en la isla de Tenerife, España. In Proceedings of the 2018 Congreso Nacional del Medio Ambiente, Madrid, Spain, 26–29 November 2018. [Google Scholar]
  44. Kazem, H.A.; Chaichan, M.T. Effect of environmental variables on photovoltaic performance-based on experimental studies. Int. J. Civ. Mech. Energy Sci. 2016, 2, 1–8. [Google Scholar]
  45. García Rodríguez, J.L.; Giménez Suárez, M.C. Aplicación de algoritmos matemáticos en la determinación de la inclinación de pendiente en un entorno SIG. Aqua-LAC 2010, 2, 78–82. [Google Scholar]
  46. Abdolzadeh, M.; Mehrabian, M.A. Obtaining maximum input heat gain on a solar collector under optimum slope angle. Int. J. Sustain. Energy 2011, 30, 353–366. [Google Scholar] [CrossRef]
  47. Kim, B.; Han, S.; Heo, J.; Jung, J. Proof-of-concept of a two-stage approach for selecting suitable slopes on a highway network for solar photovoltaic systems: A case study in South Korea. Renew. Energy 2020, 151, 366–377. [Google Scholar] [CrossRef]
  48. Kaushik, S.C.; Rawat, R.; Manikandan, S. An innovative thermodynamic model for performance evaluation of photovoltaic systems: Effect of wind speed and cell temperature. Energy Convers. Manag. 2017, 136, 152–160. [Google Scholar] [CrossRef]
  49. Urrejola, E.; Antonanzas, J.; Ayala, P.; Salgado, M.; Ramírez-Sagner, G.; Cortés, C.; Pino, A.; Escobar, R. Effect of soiling and sunlight exposure on the performance ratio of photovoltaic technologies in Santiago Chile. Energy Convers. Manag. 2016, 114, 338–347. [Google Scholar] [CrossRef]
  50. Rezazadeh, M.; Irannejad, P.; Shao, Y. Climatology of the Middle East dust events. Aeolian Res. 2013, 10, 103–109. [Google Scholar] [CrossRef]
  51. Saidan, M.; Albaali, A.G.; Alasis, E.; Kaldellis, J.K. Experimental study on the effect of dust deposition on solar photovoltaic panels in desert environment. Renew. Energy 2016, 92, 499–505. [Google Scholar] [CrossRef]
  52. Gholami, A.; Ameri, M.; Zandi, M.; Ghoachani, R.G.; Eslami, S.; Pierfederici, S. Photovoltaic Potential Assessment and Dust Impacts on Photovoltaic Systems in Iran: Review Paper. IEEE J. Photovolt. 2020, 10, 824–837. [Google Scholar] [CrossRef]
  53. Cabildo Insular de Tenerife; Consejo Insular de Aguas de Tenerife. Plan Hidrológico de Tenerife. Documento de Aprobación Definitiva. Cabildo Insular de Tenerife: Santa Cruz de Tenerife, Spain, 2015. [Google Scholar]
  54. Gobierno de Canarias. Decreto-Legislativo 1/2000, de 8 de mayo, por el que se aprueba el Texto Refundido de las Leyes de Ordenación del Territorio de Canarias y de Espacios Naturales de Canarias. Boletín Of. Canar 2000, 60, 5989–6307. [Google Scholar]
  55. Gobierno de España. Ley 4/2017, de 13 de julio, del Suelo y de los Espacios Naturales Protegidos de Canarias. Boletín Of. Estado 2017, 216, 88273–88515. [Google Scholar]
  56. Monedero, J.; García, J.; Dobon, F.; Yanes, M.A.; Hernandez, F. Calculation of the PV Potential Maps in the Canary Island. In Proceedings of the 22nd European Photovoltaic Solar Energy Conference and Exhibition, Milan, Italy, 3–7 September 2007. [Google Scholar]
Figure 1. Methodology diagram for locating photovoltaic solar energy installations.
Infrastructures 07 00028 g001
Figure 2. Aptitude Model.
Infrastructures 07 00028 g002
Figure 3. Impact Model.
Infrastructures 07 00028 g003
Figure 4. Provisional Model of Reception Capacity: CA60-40 (top left), CA50-50 (top right) and CA40-60 (down).
Infrastructures 07 00028 g004
Figure 5. Reception Capacity Model 60-40 reclassified after applying the environmental restriction of Protected Natural Space (left) and Reception Capacity Model adjusted to Homogeneous Regulatory Areas (PIOT) (right).
Infrastructures 07 00028 g005
Figure 6. Abona Region: Reception Capacity Map reclassified and adjusted to the limits of the PIOT ARH (left); and Map of optimal locations for photovoltaic solar energy installations (right).
Infrastructures 07 00028 g006
Figure 7. Plots with optimal locations in Abona region.
Infrastructures 07 00028 g007
Figure 8. Optimal locations on the Tenerife island together with existing PV facilities: Plots with average RC > 300 (left) and Plots with average RC > 250 (right).
Infrastructures 07 00028 g008
Table 1. Average weights of the Aptitude criteria.
Expert 1Expert 2Expert 3Expert 4Average Weights
Insolation0.3270.4480.3100.3650.363
Power lines0.1910.2390.3100.3200.265
Slope0.3270.2160.2590.0870.222
Roads0.1550.0970.1210.2280.150
Table 2. Average weights of the impact criteria.
Expert 1Expert 2Expert 3Expert 4Average Weights
Hydrology0.0720.1030.1620.2310.142
Vulnerability0.5890.6050.5290.2150.485
Land uses0.3390.2920.3090.5540.373
Table 3. Statistics relating to the cadastral plots by municipalities and regions (example of the Abona region).
ABONA RegionCadastral PlotsPlots Surface >10.000 m2Plots Slope < 25%Plots with Average RC Value > 250Plots with Average RC Value > 300Average RC Value (V Maximum)
Granadilla15.5122.793204190891324.25
San Miguel de Abona7.93863845723442331.23
Arona10.7241.2191.036730110354.36
Vilaflor6.154815461266181340.14
Publisher’s Note: MDPI stays neutral with regard to jurisdictional claims in published maps and institutional affiliations.

