Article

Experimental Study on the Structural Response of Reinforced Fly Ash-Based Geopolymer Concrete Members

1
Department of Structural Engineering, Faculty of Engineering, Zagazig University, Zagazig 44511, Egypt
2
Laboratory Center CVIS, The Faculty of Civil Engineering, Technical University in Košice, 04200 Košice, Slovakia
*
Author to whom correspondence should be addressed.
Infrastructures 2022, 7(12), 170; https://doi.org/10.3390/infrastructures7120170
Submission received: 4 November 2022 / Revised: 25 November 2022 / Accepted: 7 December 2022 / Published: 13 December 2022
(This article belongs to the Topic Advances on Structural Engineering, 2nd Volume)

Abstract

:
Geopolymer concrete is concrete made from industrial materials, such as fly ash, GGBS, silica fume, and metakaolin, used as a cement alternative. In this study, geopolymer concrete will be based on fly ash as a binder material, alkaline activators of sodium hydroxide and sodium silicate, GPC beams of dimensions 800 mm × 250 mm × 100 mm, circular columns with diameter 350 mm and depth of 700 mm and GPC slabs of dimensions 500 mm × 500 mm × 100 mm are all cast with fly ash content of 350 kg/m3. The ratio of alkaline solution to fly ash was equal to 0.5 and was kept constant, and the Na2SiO3-to-NaOH ratio was 2.5 and the NaOH molarity was kept constant at 12 M. The beams reinforcement was changed to study the shear and flexural behaviour, and the slabs and columns reinforcement ratio was kept constant. The load capacity, stress–strain behaviour of the GPC and load-deflection behaviours of the members were also examined. The results showed that reinforced geopolymer members can be used as an alternative to reinforced concrete structural members, but they are more expensive than reinforced concrete. Further study is recommended to provide more practical design recommendations for incorporating geopolymer concrete into structural elements in order to accelerate the adoption of this concrete for large-scale field applications in the future.

1. Introduction

There are many environmental issues associated with traditional concrete-based building materials. Much research has been conducted to develop reliable and environmentally friendly concrete [1,2,3], recycled aggregate in concrete has been widely tested in an effort to reduce dependence on traditional concrete component materials and to find a viable way to reuse waste materials [4,5], using crumb rubber as a substitute for sand in a flowable concrete grout enhances ductility and the strength-to-weight ratio [6]. A concrete mix containing 0.6% rubber crumb demonstrated the ideal strength of 40 MPa and air-entrainment capabilities after 56 freeze/thaw cycles with minimal damage. Additionally, we can use recycled aggregate in the production of concrete, the construction of roadways, and also it can be used in civil works, some discussions on decreasing CO2 emissions have been included [7], crushed glasses can be used as aggregates for concrete but caused some bad effects on concrete properties [8]. Li et al. (2021) demonstrated that when BP (specific surface area 4.6582 m2/g) replaced up to 15% of the specified UHPC, the greatest compressive strength (220 MPa) was attained [9]. When compared with quartz powder, the pozzolanic activity of BP was modest and increased with reaction temperature. On the other hand, the presence and accuracy of BP in the UHPC pastes increased the value of the total self-shrinkage and reduced the total heat release at an early age for the designed UHPC pastes, and this effect becomes more obvious with the increase in temperature.
The large quantity of carbon dioxide emitted during the manufacturing of cement is one of the most serious environmental issues with concrete-based construction materials. There is growing recognition that the cement sector contributes significantly to global CO2 emissions, approximately 5% of global carbon dioxide emission [10,11]. This industry is projected to face increased regulatory pressure to decrease CO2 emission and participate more actively to global warming mitigation. It is critical that industry stakeholders become more aware of greenhouse gas (GHG) emissions and related global warming challenges, as well as new legislation that may influence the sector’s future. As a result, extensive research is being conducted to produce a type of concrete that does not include cement.
Geopolymer concrete, a cementless binder that eliminates the need for cement in concrete, has lately acquired importance in concrete research. Geopolymer is formed by the interaction of aluminosilicate material with alkaline liquids, a process known as ‘geopolymerization.’ Fly ash and slag are two major aluminosilicate ingredients utilised in geopolymer manufacturing. Both of these materials emit significantly less carbon dioxide than cement [12]. According to research findings, geopolymer concrete has equivalent qualities to ordinary concrete and can be used in civil engineering constructions [13]. The investigation revealed that geopolymer concrete had superior mechanical characteristics, greater durability, and more desired structural performances than conventional concrete, allowing it to be used in place of traditional concrete [14]. Further study on practical design criteria is still required and, finally, comprehensive studies of structural elements must be conducted to ensure their feasibility in practice.
When compared to the usage of cement, the use of geopolymer can cut overall carbon dioxide emissions by up to 64% [3]. McLellan (2011) showed that the projected financial and environmental ‘cost’ of geopolymers varies greatly, which can be beneficial or negative depending on the source region, energy source, and mode of transport. [15]. The majority of geopolymer concrete research focuses on the mechanical characteristics of the combinations–Sumajouw, Hardjito, Wallah et al.–and the examination of the properties of geopolymer concrete based on fly ash and heat treated [16,17]. The results of these studies indicate that geopolymer concrete can be used as a building material. According to these studies, geopolymer concrete has great compressive strength, very low drying shrinkage, less creep, strong bond with steel reinforcement, and exceptional resistance to acids, fire and sulfates.
Ramujee and PothaRaju (2017) discovered that the mechanical properties of GPC are virtually identical to those of conventional Portland cement (OPC) concrete [18]. Tanyildizi and Yonar (2016) discovered that as the PVA fibre ratio grew, so did the compressive and flexural strength of geopolymer concrete [19]. Furthermore, when exposed to high temperatures, the samples’ compressive and flexural strength decreased [20]. Fly ashes differ from cement in their density, fineness and chemical composition. Similar to Portland cement, concrete water in geopolymer concrete has a major role in the hydration process, and disappears during the polymerization phase. As a result, workability is proposed to achieve the desired strength.
To assess the viability of adopting geopolymer concrete in the construction industry, the conforming of reinforced geopolymer concrete members to current design requirements should be determined. Studies have been conducted to determine the behaviour of reinforced concrete’s structural members using geopolymer concrete [21]. In all the studies, 18 flexural beams were produced and tested. OPC was used to prepare six beams, and fly ash and GGBS were used to prepare 12 beams. Three different tensile reinforcement percentages were examined, ranging from 1.82 to 3.33%. All specimens were examined using a four-point loading system, and the findings showed that the load-bearing capability of all geopolymer concrete specimens was greater than typical ordinary concrete beams. The ultimate moment of rubber geopolymer concrete beams (RGPC) was greater than that of rubber Portland concrete beams (RPC). The experimental behaviour of statically loaded RGPC beams was investigated in [22].
Carbonation, acid corrosion, sulphate solution, chloride penetration, heat temperature, freezing and thawing, drying and wetting, and thermal shock were all used to test the durability of geopolymeric materials exposed to industrial residues. Finally, some conclusions and future predictions about AAM durability were made [23].
At a test age of 90 days, geopolymer concrete with OPC and CKD as partial replacements for 30% by weight of VPD increased compressive strength by 23% and 8%, respectively. Meanwhile, when 20% VPD was replaced by CKD, the compressive strength of the VPD-CKD samples was 11% higher than the control mixture. Furthermore, water absorption rates decreased by 25% and 20%, respectively [24].
A total of 16 beams were manufactured and tested, four of which were made with regular Portland concrete (OPC) and the other 12 were made with a mix of granulated ground blast furnace slag (GGBS) and fly ash. The target compressive strength that all the specimens were designed for is 40 MPa at 28 days. The results showed that the load-deflection and failure modes for both the geopolymer and ordinary Portland concrete beams were nearly similar. The behaviour of the geopolymer concrete beams, including fly ash and the GGBS as a binder ingredient, was studied in [25]. Eight beams were produced and tested, four of which were made of geopolymer concrete and four of which were made of standard Portland concrete OPC with identical reinforcing features, where the primary tensile reinforcement is 220 mm, and the compression zone is 210 mm. The beams were subjected to four different heating treatments: room temperature and 400 °C for one hour. The results showed that geopolymer concrete beams have a poorer fracture resistance and flexural stiffness. The load capacity of thermally treated geopolymer concrete beams was 110, 107 and 90% of that of room-temperature-cured specimens, respectively, while the load-capacity of thermally treated typical Portland concrete beams was 103, 97 and 80% of that of the room-temperature-cured specimens. As a result, geopolymer concrete beams outperformed OPC concrete beams in terms of fire resistance.
According to the findings, GFRP increased the total capacity of the columns by 7.6%. The hoop and spiral transverse reinforcement containing columns failed at 66 and 82% load, respectively, indicating that the spirally confined columns have more ductility and confinement efficiency than the hoop confined columns. Geopolymer concrete slabs have a similar flexural behaviour as standard concrete slabs [26]. The geopolymer concrete slabs were made with low calcium fly ash and slag with a mix of 70:30, strengthened with high yield-strength steel bars, and then tested experimentally. The loading applied to the slab was a point load in the centre of the slab, and the results showed that geopolymer concrete may be employed in situ. The behaviour of the reinforced geopolymer concrete slabs was similar to ordinary concrete slabs, and the ductility demonstrated that the displacement of geopolymer concrete GPC was in the range of 1.5 to 2.7.
Reference [27] indicates that for the preparation of the geopolymer concrete (GPC), a 2.5:1 mixture of alkaline activators, such as sodium silicate (Na2SiO3) and sodium hydroxide (12 M NaOH), was used. Based on the mechanical strength and workability of the HSGPC, the optimal mix was chosen from various copper slag dosages. Micro-silica was added up to 5% by volume of the binder (i.e., 1%, 2%, 3%, 4%, and 5%) to improve the particle-packing density of the developed HSGPC mix, which further improves strength and durability properties. When 2% micro-silica was added to the optimised GPC mix, the maximum compressive strength was 79.0 MPa. In addition to mechanical tests, the developed HSGPC quality was evaluated using ultrasonic pulse velocity (UPV) tests, water-absorption tests, sorptivity tests, and microstructural analyses.
More research [28,29] has found that geopolymer concrete has comparable technical features that make it suitable for use as a building material. Substantial research was conducted to confirm that geopolymer concrete can be used as building material, see [30,31]. The development of alternative concretes, such as geopolymer concrete, is critical in India, where businesses create enormous amounts of industrial waste [32].
In this paper, extensive experimental work on 24 members was performed to study the structural response of different reinforced geopolymer concrete members. Fifteen concrete mixtures of different fly ash content ranging from 250 to350 kg/m3 and an Na2SiO3-to-NaOH ratio ranging between 0.5 and 2.5. The ratio of alkaline solution to fly ash equalled 0.5 and was kept constant, and an NaOH molarity of 12 M was utilised. The optimum geopolymer concrete mixture was then used to prepare the structural members. The experimental programme includes reinforced geopolymer concrete elements of six beams, six slabs, and six columns. Performance characteristics, such as load-bearing capacity, stress–strain behaviour and deflections at various stages, were investigated.

2. Experimental Programme
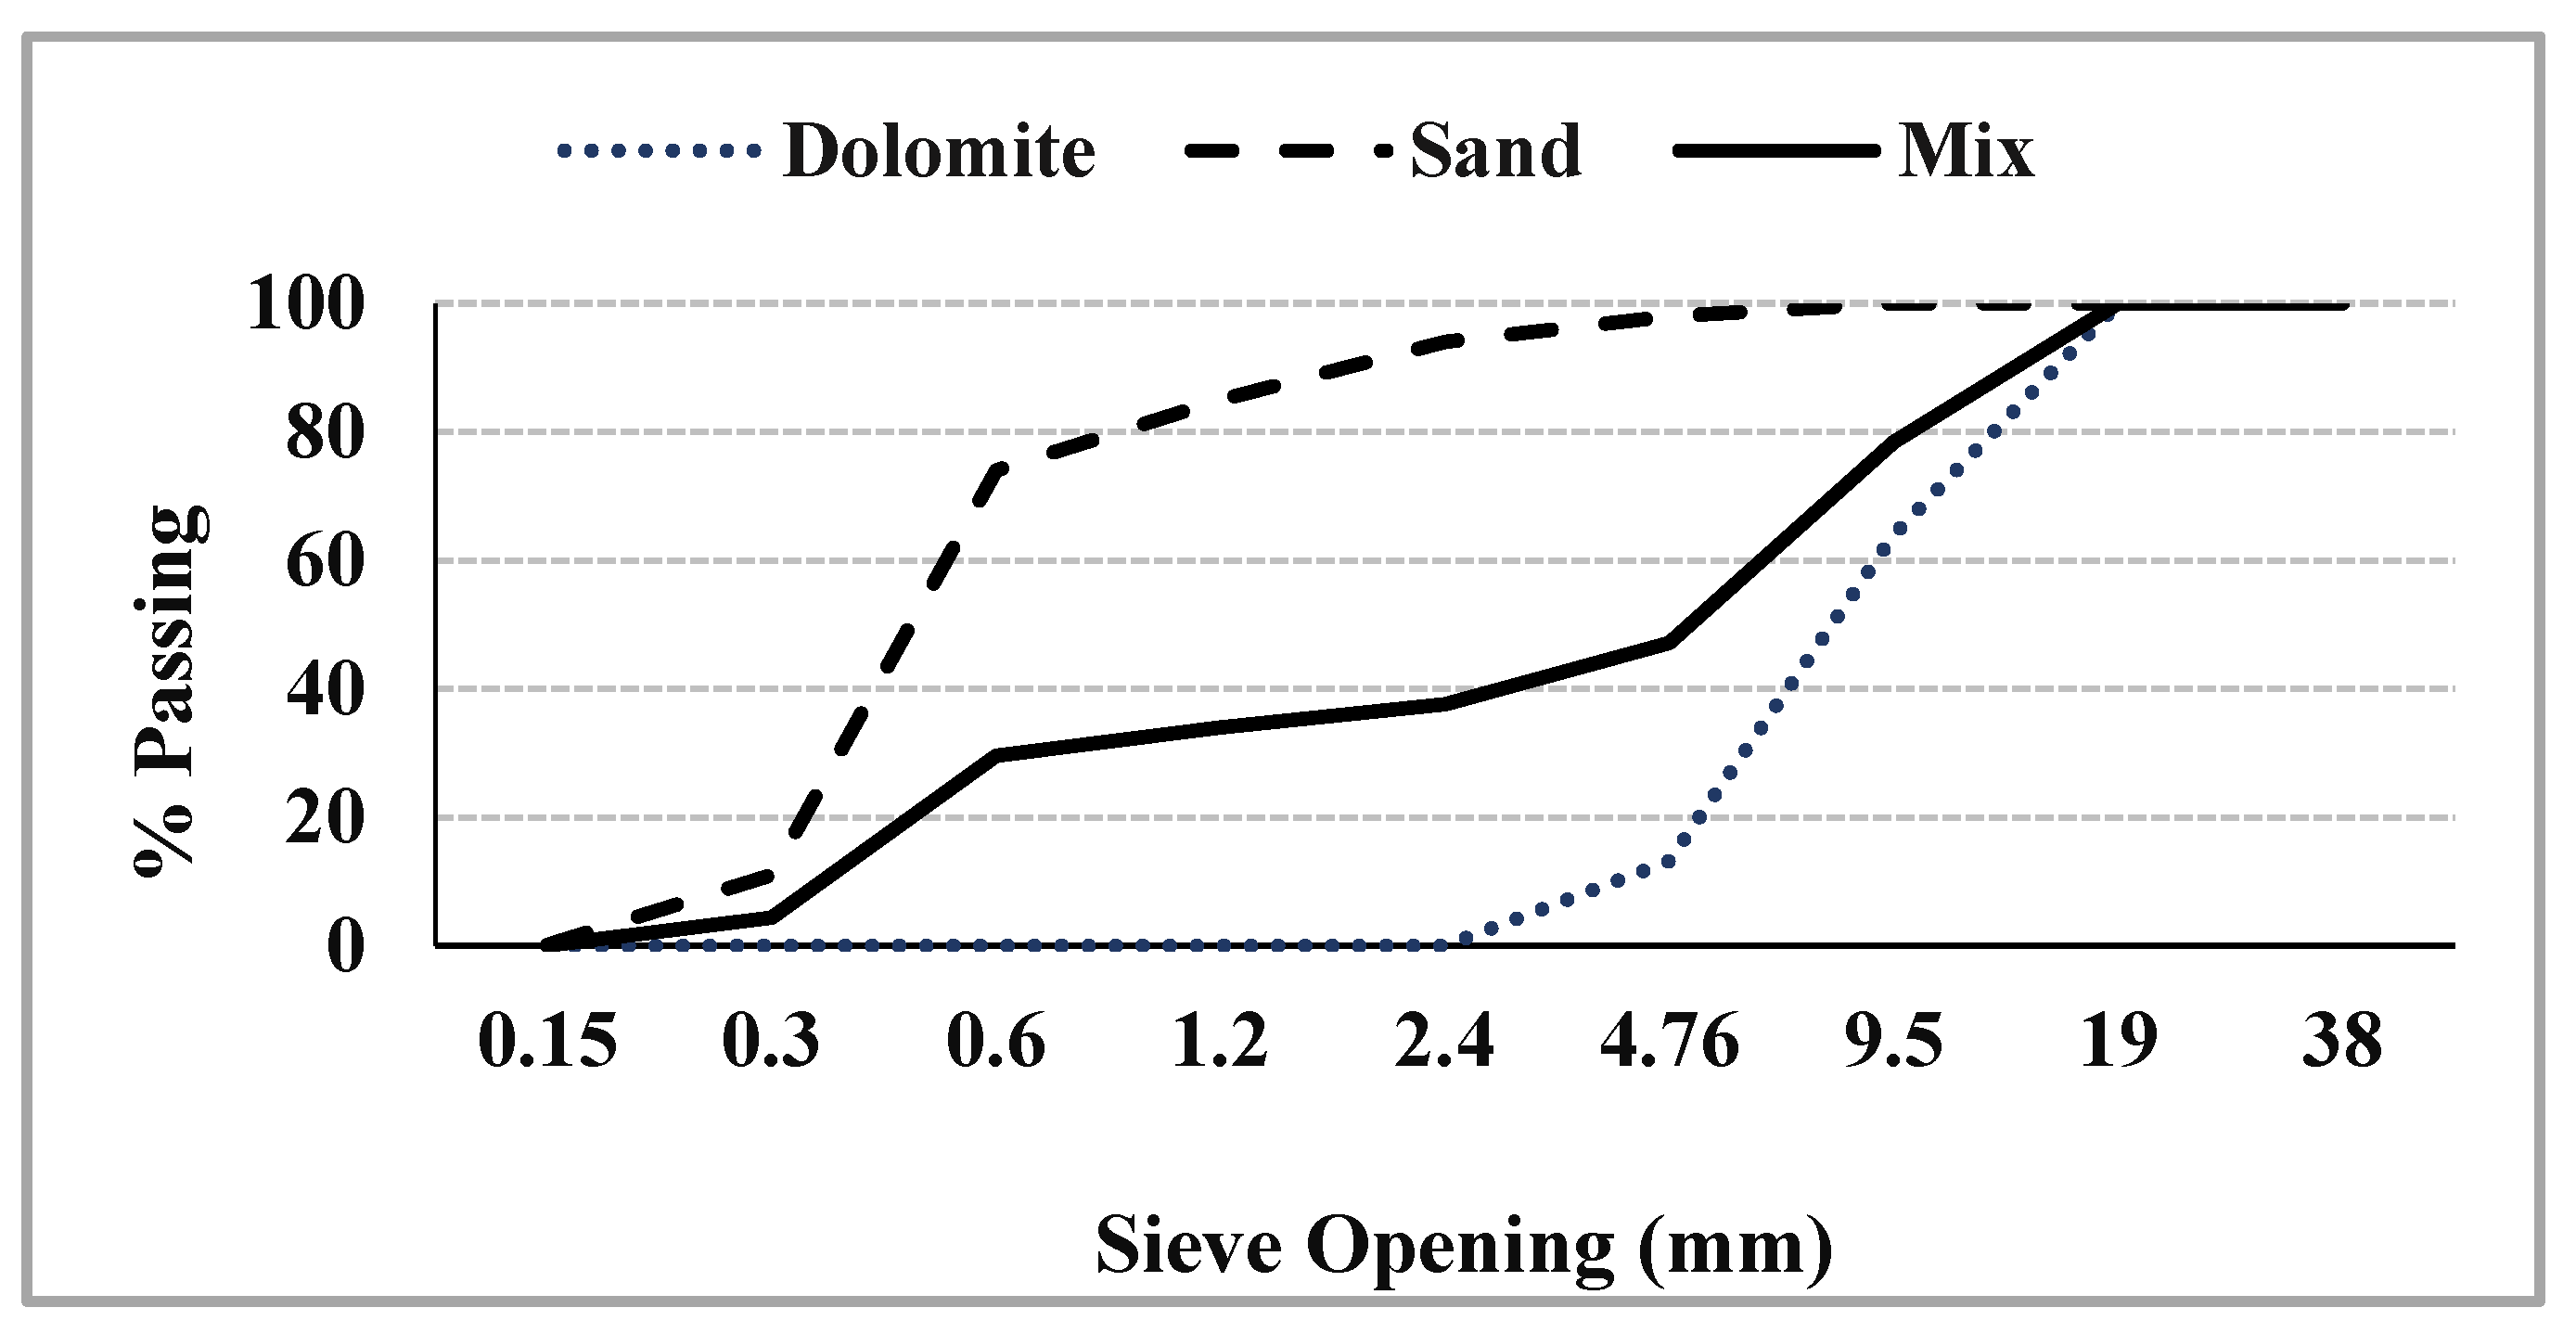
2.1. Materials Used

Because of its coarser texture and uneven surface, crushed dolomite was found to be more appropriate for usage as coarse aggregates than gravel. Furthermore, dolomite has a higher surface-area-to-volume ratio than gravel, and its mineralogical compatibility with the cement matrix aids in the production of high-strength concrete. Crushed dolomite in two sizes was utilised. The two sizes were blended, with nominal maximum diameters of 9.6 mm and 19 mm. The natural sand utilised was devoid of contaminants, silt, loam, and clay.
The specific gravity and moisture absorption for fine and course aggregates measured according to ASTM C127 [33] and ASTM C128 [34] as well as the grain size distribution for the employed aggregate Figure 1. To produce an appropriate surface area, a coarse and fine aggregate were mixed with a ratio of 0.6 coarse aggregate and 0.4 fine aggregate. Concrete mixes were created using locally available ASTM C150, Type II Portland cement [35].
Fly ash (class F) with specific gravity of 2.8 bought from Sika was utilised in accordance with ASTM C618-19 [36]. Table 1 shows the chemical parameters of a sample that was chemically analysed at the laboratory of Zagazig University’s Faculty of Science.
A liquid sodium silicate (LSS) solution was utilised, which included 25.5% Na2O, 24.7% SiO2, and 49.8% water. A powerful alkali, NaOH, was utilised as pellets that can be dissolved in water. The molarity of NaOH was set at 12 moles, with 98% purity NaOH slices utilised. A 12 M concentration requires 490 grammes of NaOH, which is diluted in distilled water to generate 1 L of NaOH solution. The physical and chemical properties of NaOH and Na2SiO3 solution are shown in Table 2.
  • 12 mol./L = X/40/1 L, X = 480 gm (pure), used naoh of 98% purity
  • 0.98 X = 480
  • X = 489.7 gm
Table 2. Physical and chemical properties of NaOH and Na2SiO3 solution performed at Zagazig University faculty of science laboratory.
Sodium silicatePhysical and Chemical Properties
Appearancecolourless
Module by weight SiO2/Na2O3.19
Module by Molecule SiO2/Na2O3.3
Be (at 20 °C)39.4
Na2O (%)8.52
SiO2 (%)27.09
Sodium HydroxideTotal alkalinity>990
Na2SO4 (mg/kg)<80
Na2CO3 (mg/kg)<4
NaCl (mg/kg)<200
Fe (mg/kg)<10
Cr (mg/kg)<1
Pb (mg/kg)<0.5
Se (mg/kg)<5
Ni (mg/kg)<2

2.2. Reaction Mechanism

Concrete gains strength in general by the formation of hydrates, such as CSH (calcium silicate hydrate; 3CaO2SiO23H2O), which is produced by the hydration reaction of water and the ordinary Portland cement commonly used as a binder. Furthermore, geopolymerization is the hardening of a fly-ash-based geopolymer achieved by dissolving the Al and Si components of fly ash with alkaline activators. Davidovits proposed this geopolymerization process in 1978, indicating a chemical reaction between Al-Si oxides that forms the three-dimensional polymer chain SiAOAAlAO. These structures are classified into three types: poly(sialate) (ASiAOAAlAOA), poly(sialate-siloxo) (SiAOAAlAOASiAO), and poly(sialate-disiloxo) (SiAOAAlAOASiAO) (SiAOAAlAOASiAOASiAO). The polycondensation of hydrolysed aluminate and silicate species is thought to be responsible for geopolymer’s hardening. MOH-type caustic alkalis and R2O(n)SiO2-type silicates are the most commonly used alkaline activators, either alone or in combination. M denotes the alkaline activator, which is typically sodium hydroxide (NaOH), potassium hydroxide (KOH), sodium carbonate (NaCO3), or sodium sulphate (Na2SO4) containing alkaline metal ions, such as Na, K, and Ca and acting as a reaction accelerator by activating Al and Si via a reaction with the binder. The second chemical reaction depicts water dissolution. The acceleration of water dissolution by curing during geopolymerization is known to provide discontinuous gel nanopores to the paste, resulting in an improvement in the paste’s performance. The SiO2/Al2O3 and Al2O3/Na2O ratios are important in alkali-activated fly-ash-based concrete.

2.3. Mix Design

The NaOH was converted into a solution using distilled water. To form a 12 M concentration of NaOH to make one litre of NaOH solution, dissolve 480 grammes in distilled water. After many trials, it was found to be preferable to prepare the sodium hydroxide solution immediately before casting, so we can benefit from the heat released during the preparation process, which decreases the time and temperature needed for curing. Pans made of aluminium should be avoided, as they cause a dangerous reaction that can burn the skin. The needed quantity of sodium silicate gel was added to the sodium hydroxide solution and was thoroughly mixed for around 2 min to make a suitable solution.
According to the literature review, it was found that the optimum mix design for GPC can be produced using fly ash content ranging from 250 to350 kg/m3 and a 0.5 ratio of alkaline solution to fly ash [37]. Kadlag et al. suggests keeping the Na2SiO3-to-NaOH ratio between 1.0 and 2.5 [38]. Moreover, NaOH molarity of 12 M was recommended by [39].
Based on the literature recommendations, 15 geopolymer concrete mixtures were prepared and tested to find the optimum concrete mix as designed in [20]. One more ordinary concrete mix was prepared using ordinary Portland cement for comparison. The absolute volume method was used to determine quantities in cubic metres for the required materials.quantities are shown in Table 3.
  • Fly ash = 350 kg/m3
  • Water = 175 kg/m3
  • alkaline solution/fly ash = 0.5
  • mass of alkaline solution (NaOH + Na2SiO3) = 175 kg/m3
  • Na2SiO3/NaOH = 2.5, mass of Na2SiO3 = 125 kg/m3, /NaOH = 50 kg/m3
  • Mass of Na2SiO3 solids = solid ratio * total Na2SiO3 = 0.514 * 125 = 64.25 kg/m3
  • Mass of NaOH solids = solid ratio * total NaOH = 0.368 * 50 = 18.4 kg/m3
  • Needed water = total mass of water–water in alkaline solution
  • Needed water = 175–82.65 = 92.35 kg/m3
  • W F l y a s h G   f l y a s h + W Na 2 SiO 3 G   Na 2 SiO 3 + W NaOH G   NaOH + W w a t e r G   w a t e r + W s a n d G   s a n d + W g r a v e l G   g r a v e l = 1000
  • 350 2.33 + 64.25 1.6 + 18.4 1.38 + 175 1 + W s a n d 2.65 + W g r a v e l 2.65 = 1000
  • Wagg = 1646.24 kg/m3
  • Wsand = 0.3 * 1646.24 = 494 kg/m3
  • Wgravel = 0.7 * 1646.24 = 1152.36 kg/m3
Table 3. Mix quantities.
NameLSS/
NaOH
Fly Ash
(kg/m3)
SolutionWater Needed
(kg/m3)
Sand
(kg/m3)
Gravel (kg/m3)Gravel (kg/m3)
NaOHLSS4.76–10 mm10–15 mm
R0.5F2500.525083.3341.66772.75581.9678.9678.9
R1F250162.562.569.75581677.8677.8
R1.5F2501.5507567.95580.5677.26677.26
R2F250241.6783.3366.74580.15676.8676.8
R2.5F2502.535.71489.28665.89579.9676.5676.5
R0.5F3000.53001005087.3539.3629.18629.18
R1F3001757583.7538.24627.9627.9
R1.5F3001.5609081.54537.6627.21627.21
R2F30025010080.1537.19626.7626.7
R2.5F3002.542.857107.1479536.89626.3626.3
R0.5F3500.5350116.6758.33101.8496.6579.4579.4
R1F350187.587.597.65495.45578578
R1.5F3501.57010595.13494.7577.17577.17
R2F350258.33116.67117.95506.64591591
R2.5F3502.55012592.35494576576
P.C Cement
(kg/m3)
Water
(L)
Sand
(kg/m3)
Gravel (Kg/m3)
4.76–10 mm
Gravel (kg/m3)
10–15 mm
350175567.5662.13662.13

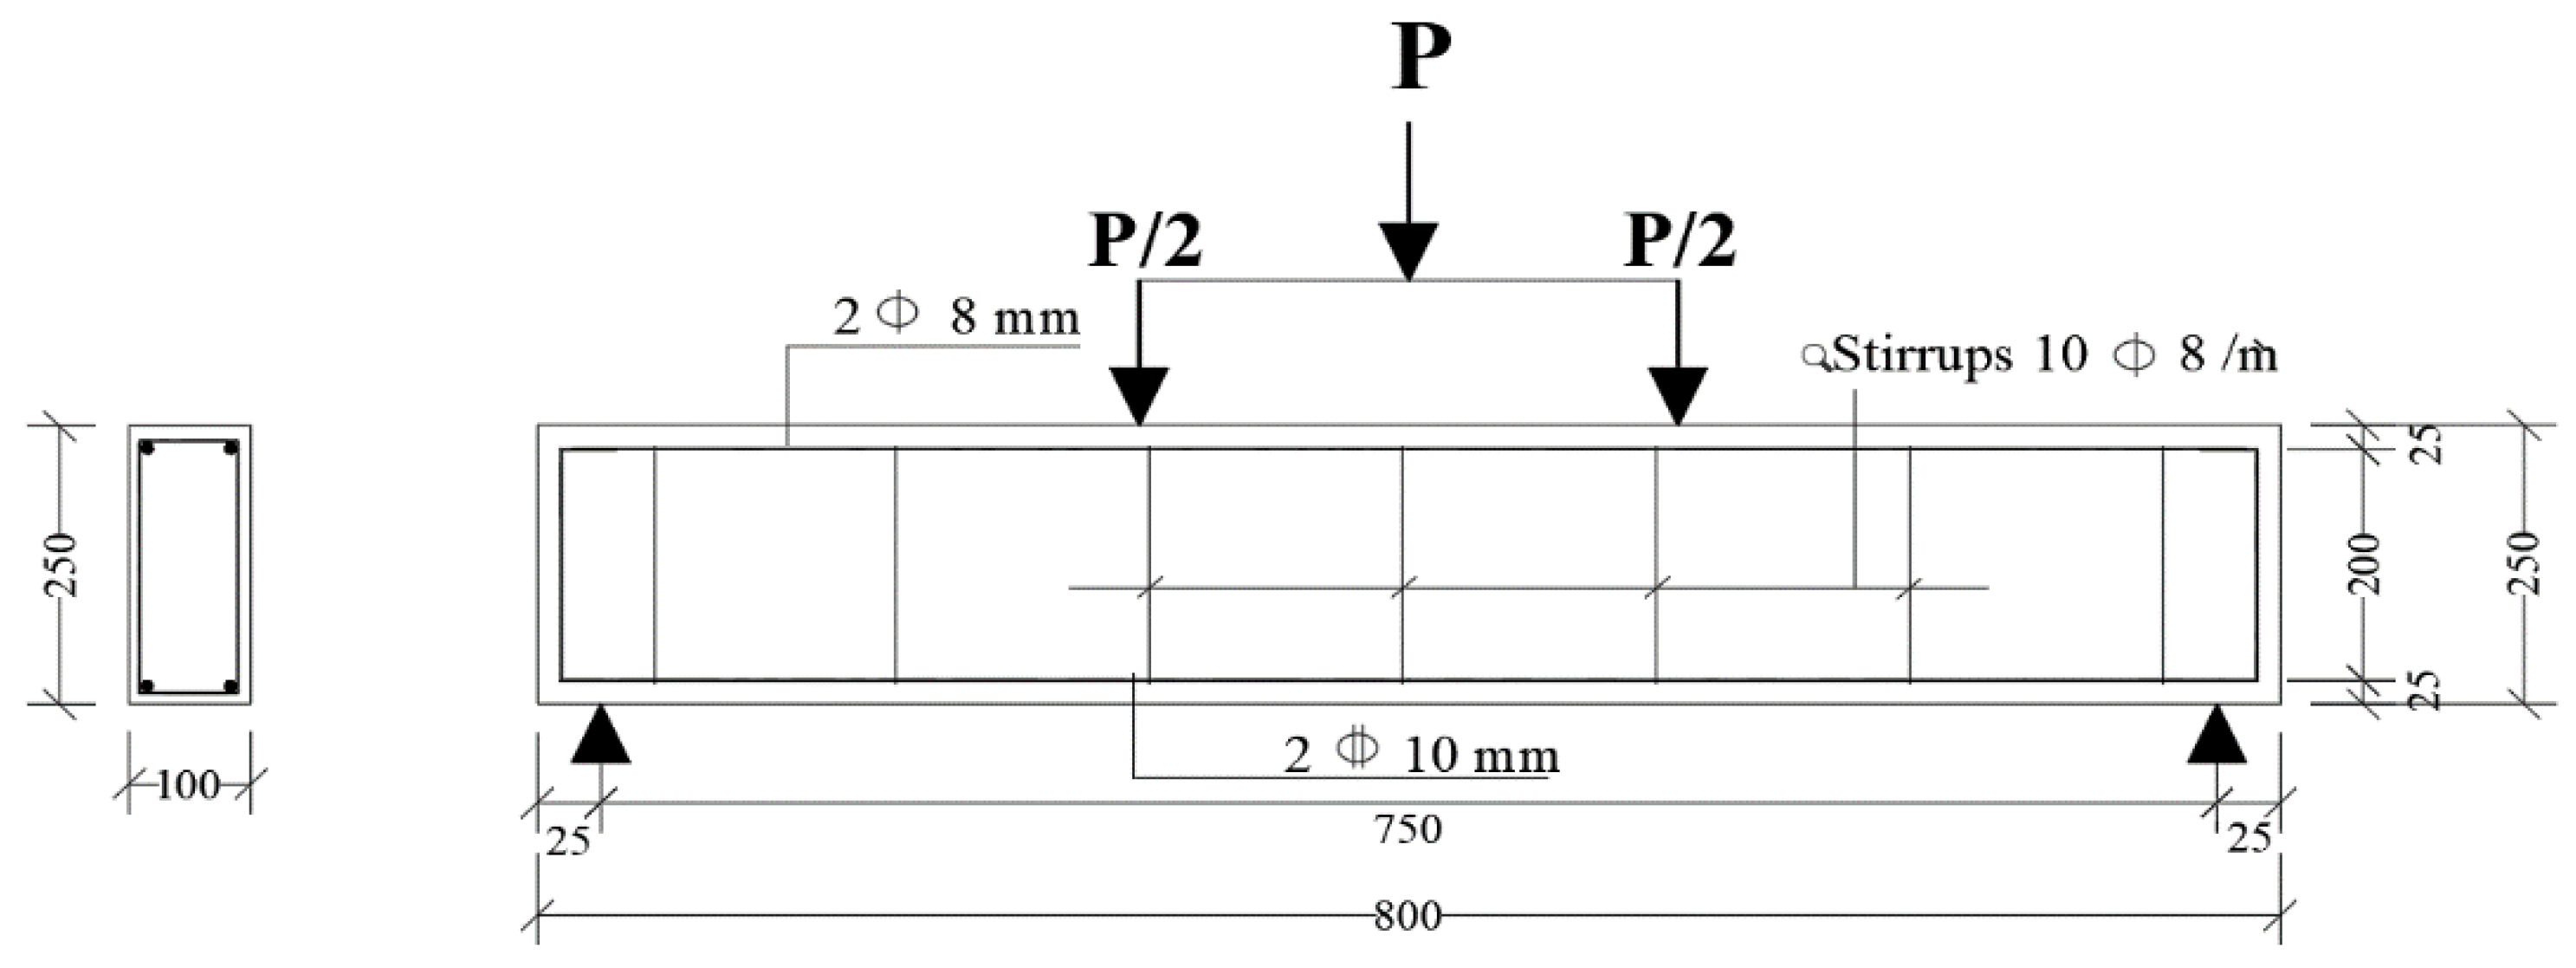
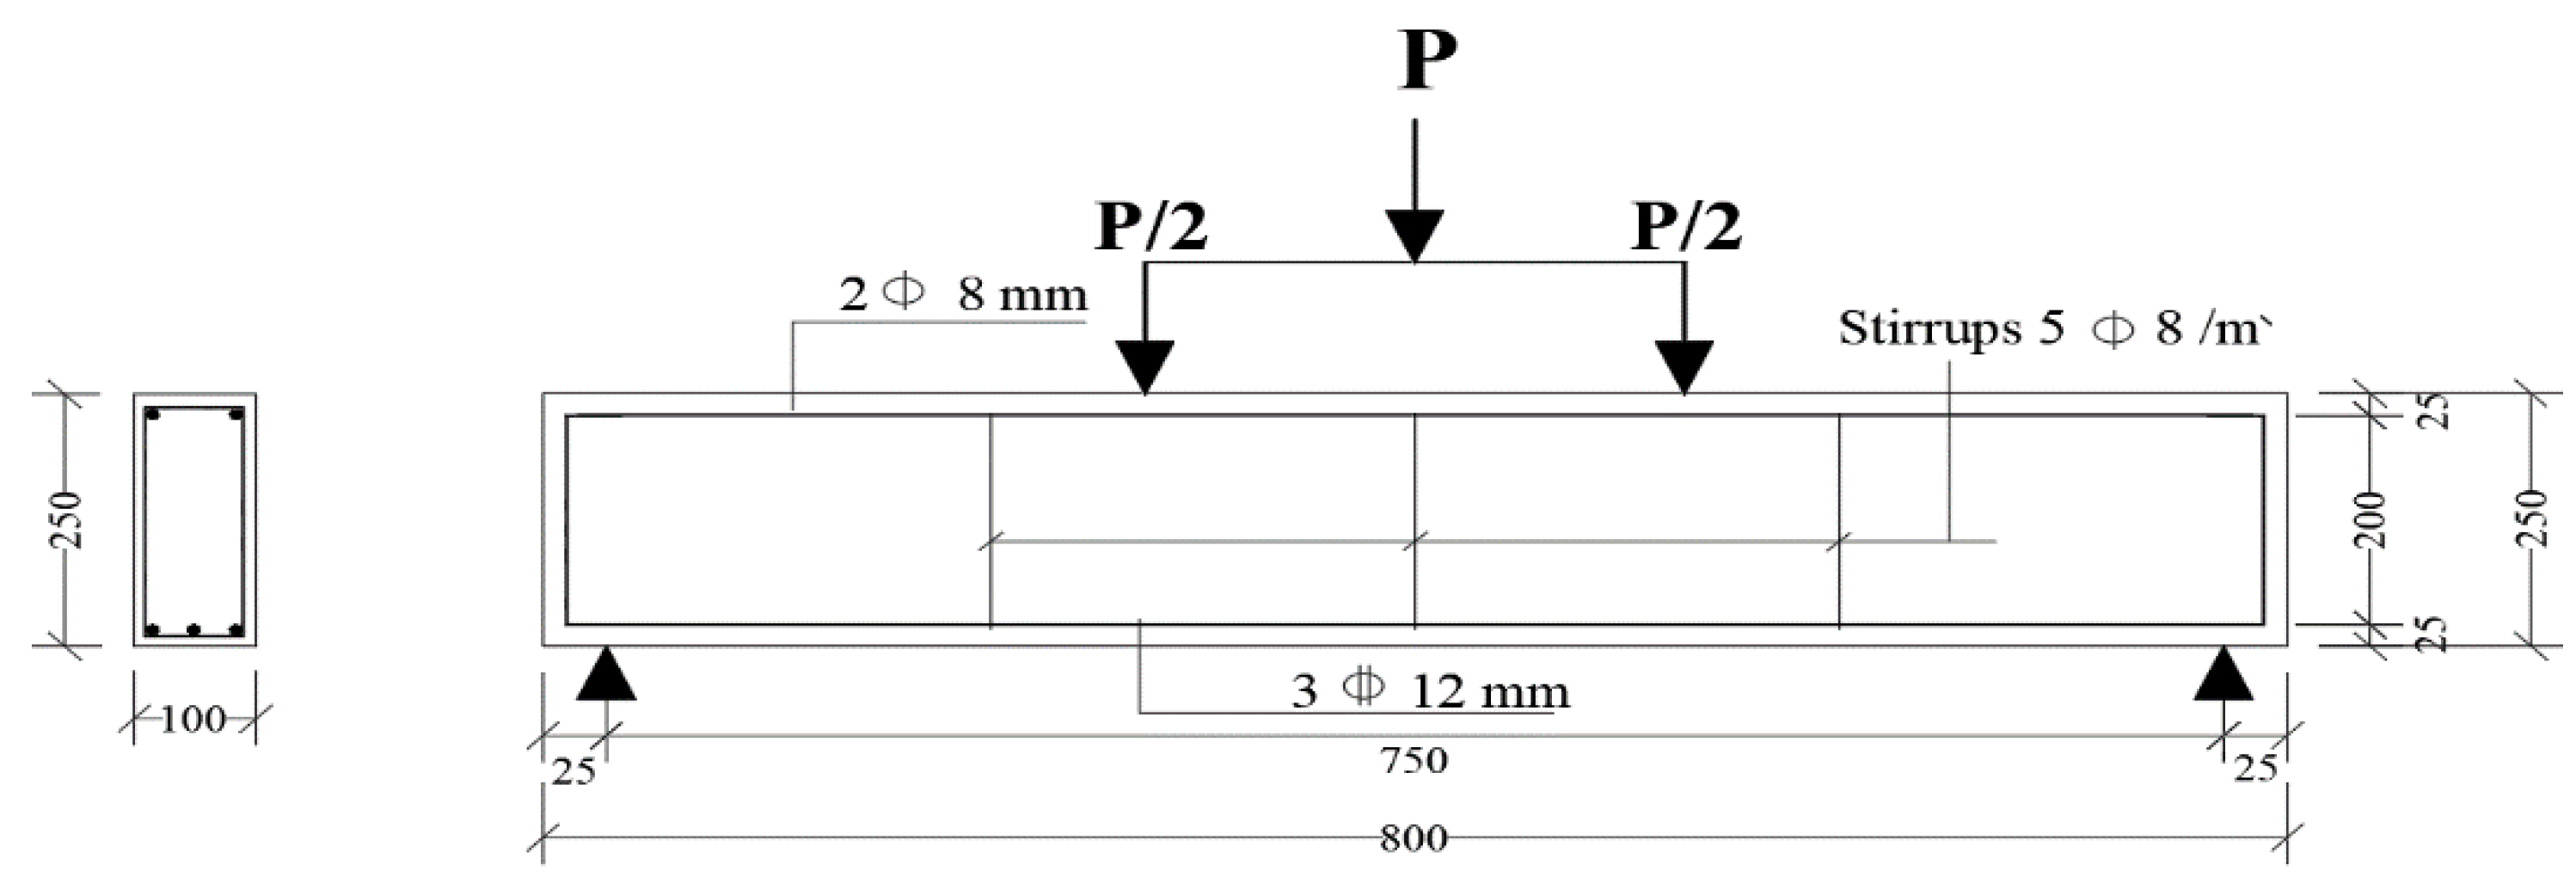
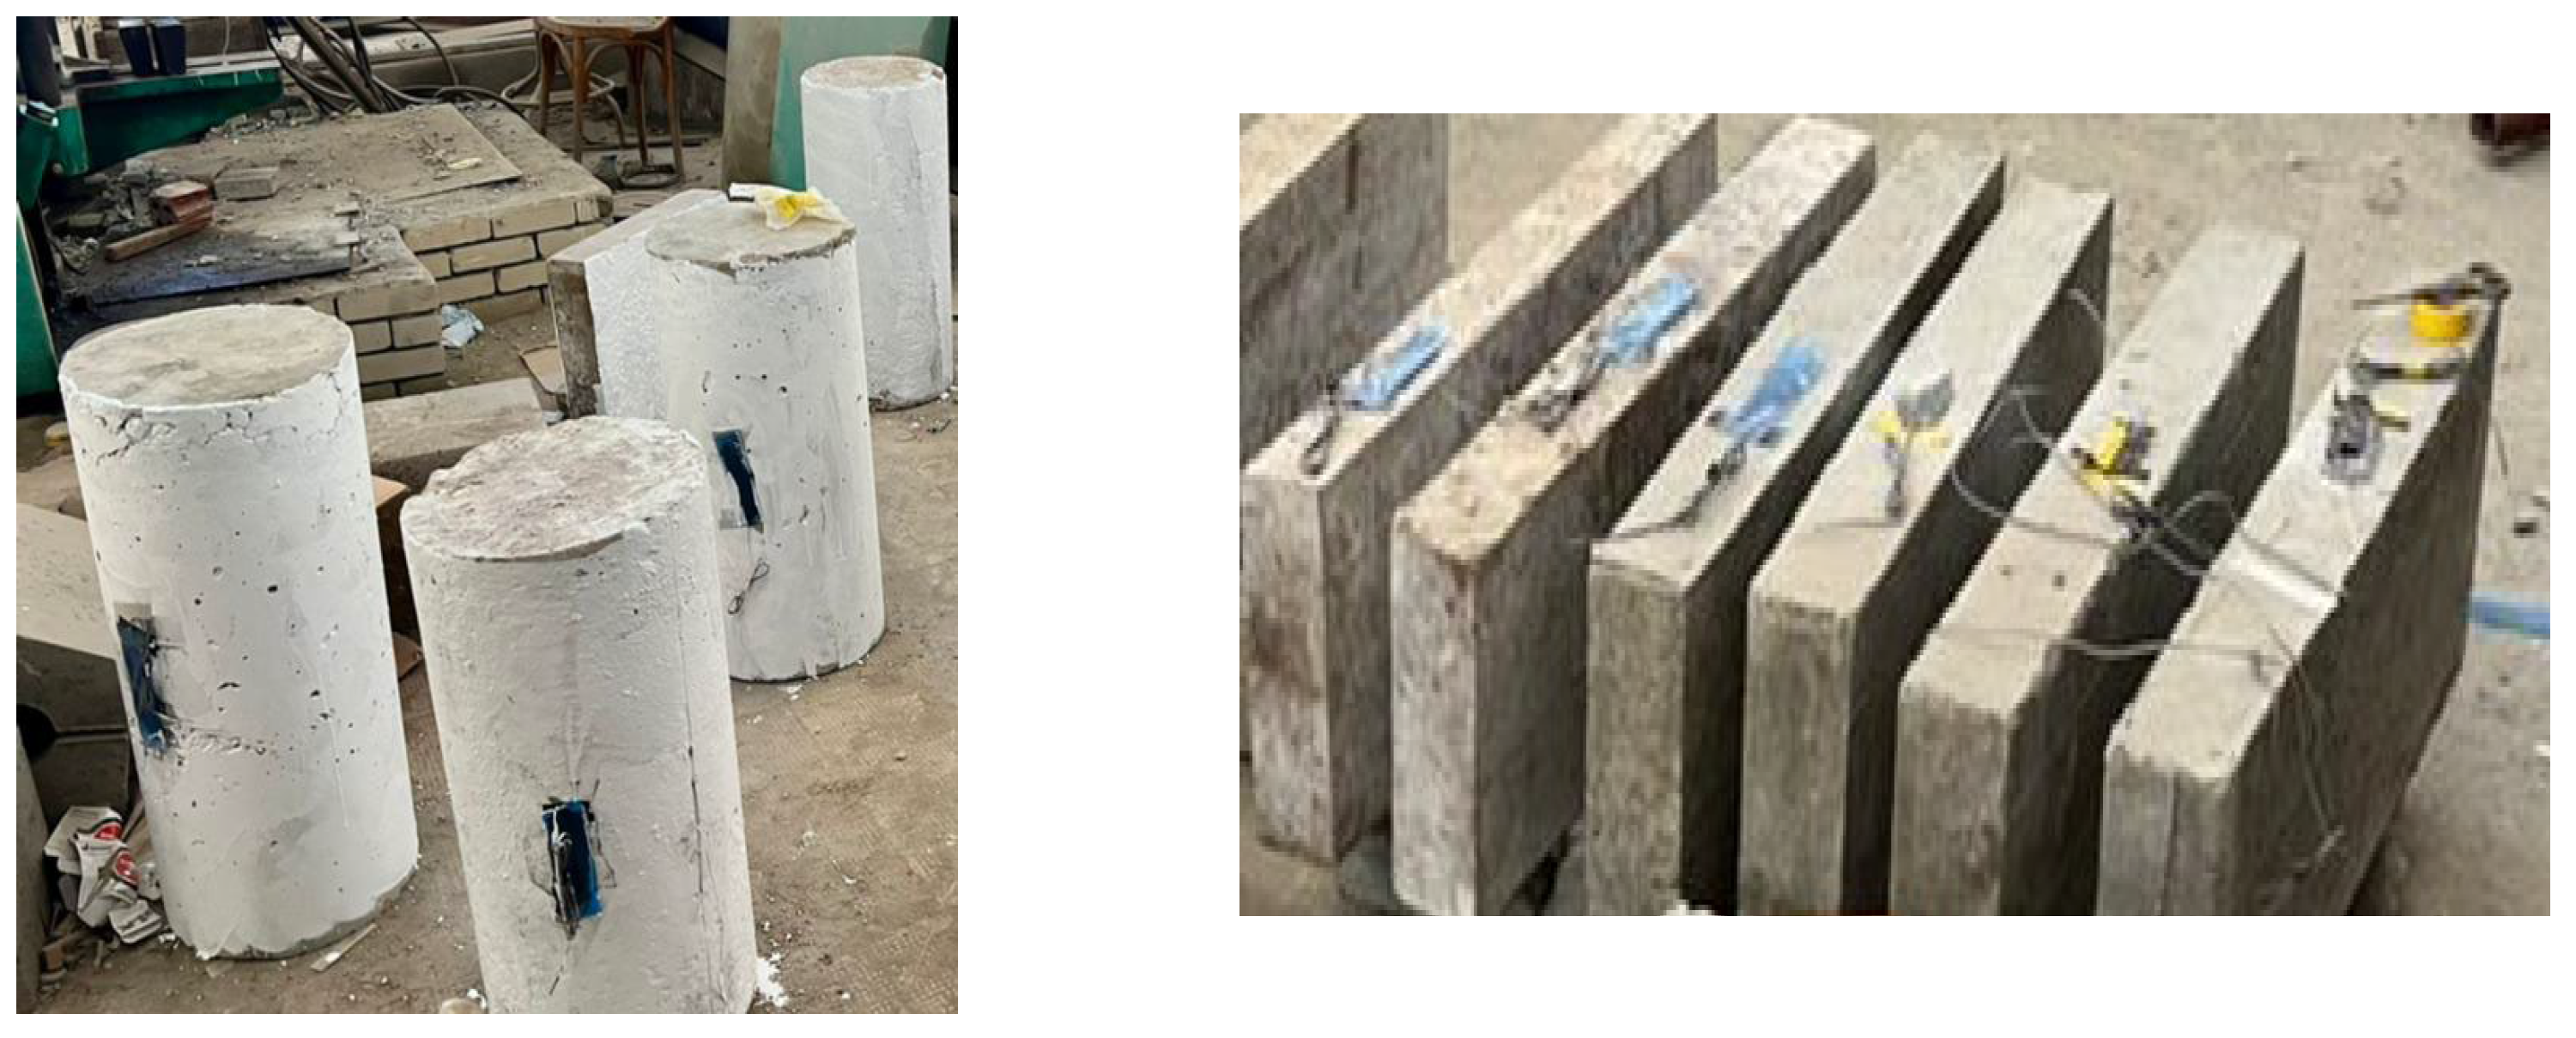
2.4. Specimen Details

A total of 90 cubes of 150 mm × 150 mm × 150 mm, 90 cylinders, with a height of 300 mm, a diameter of 150 mm and 45 prism specimens (150 × 150 × 500 mm) were prepared for testing under compressive strength according to ASTM C109 [40], splitting tensile strength according to ASTM C496 [41], and flexural strength specimens according to ASTM C78 [42], arranged into three groups according to the fly ash content and LSS/NaOH ratios.
Six reinforced geopolymer concrete beams were prepared; three of them were designed to fail by flexure, Figure 2, and the other three were designed to fail by shear, Figure 3. In addition, three reinforced geopolymer concrete slabs, Figure 4, and three reinforced geopolymer concrete columns, Figure 5, were prepared.
Reinforcement details and dimensions of geopolymer and Reinforced concrete members are shown in Table 4.

2.5. Preparation of Geopolymer Concrete
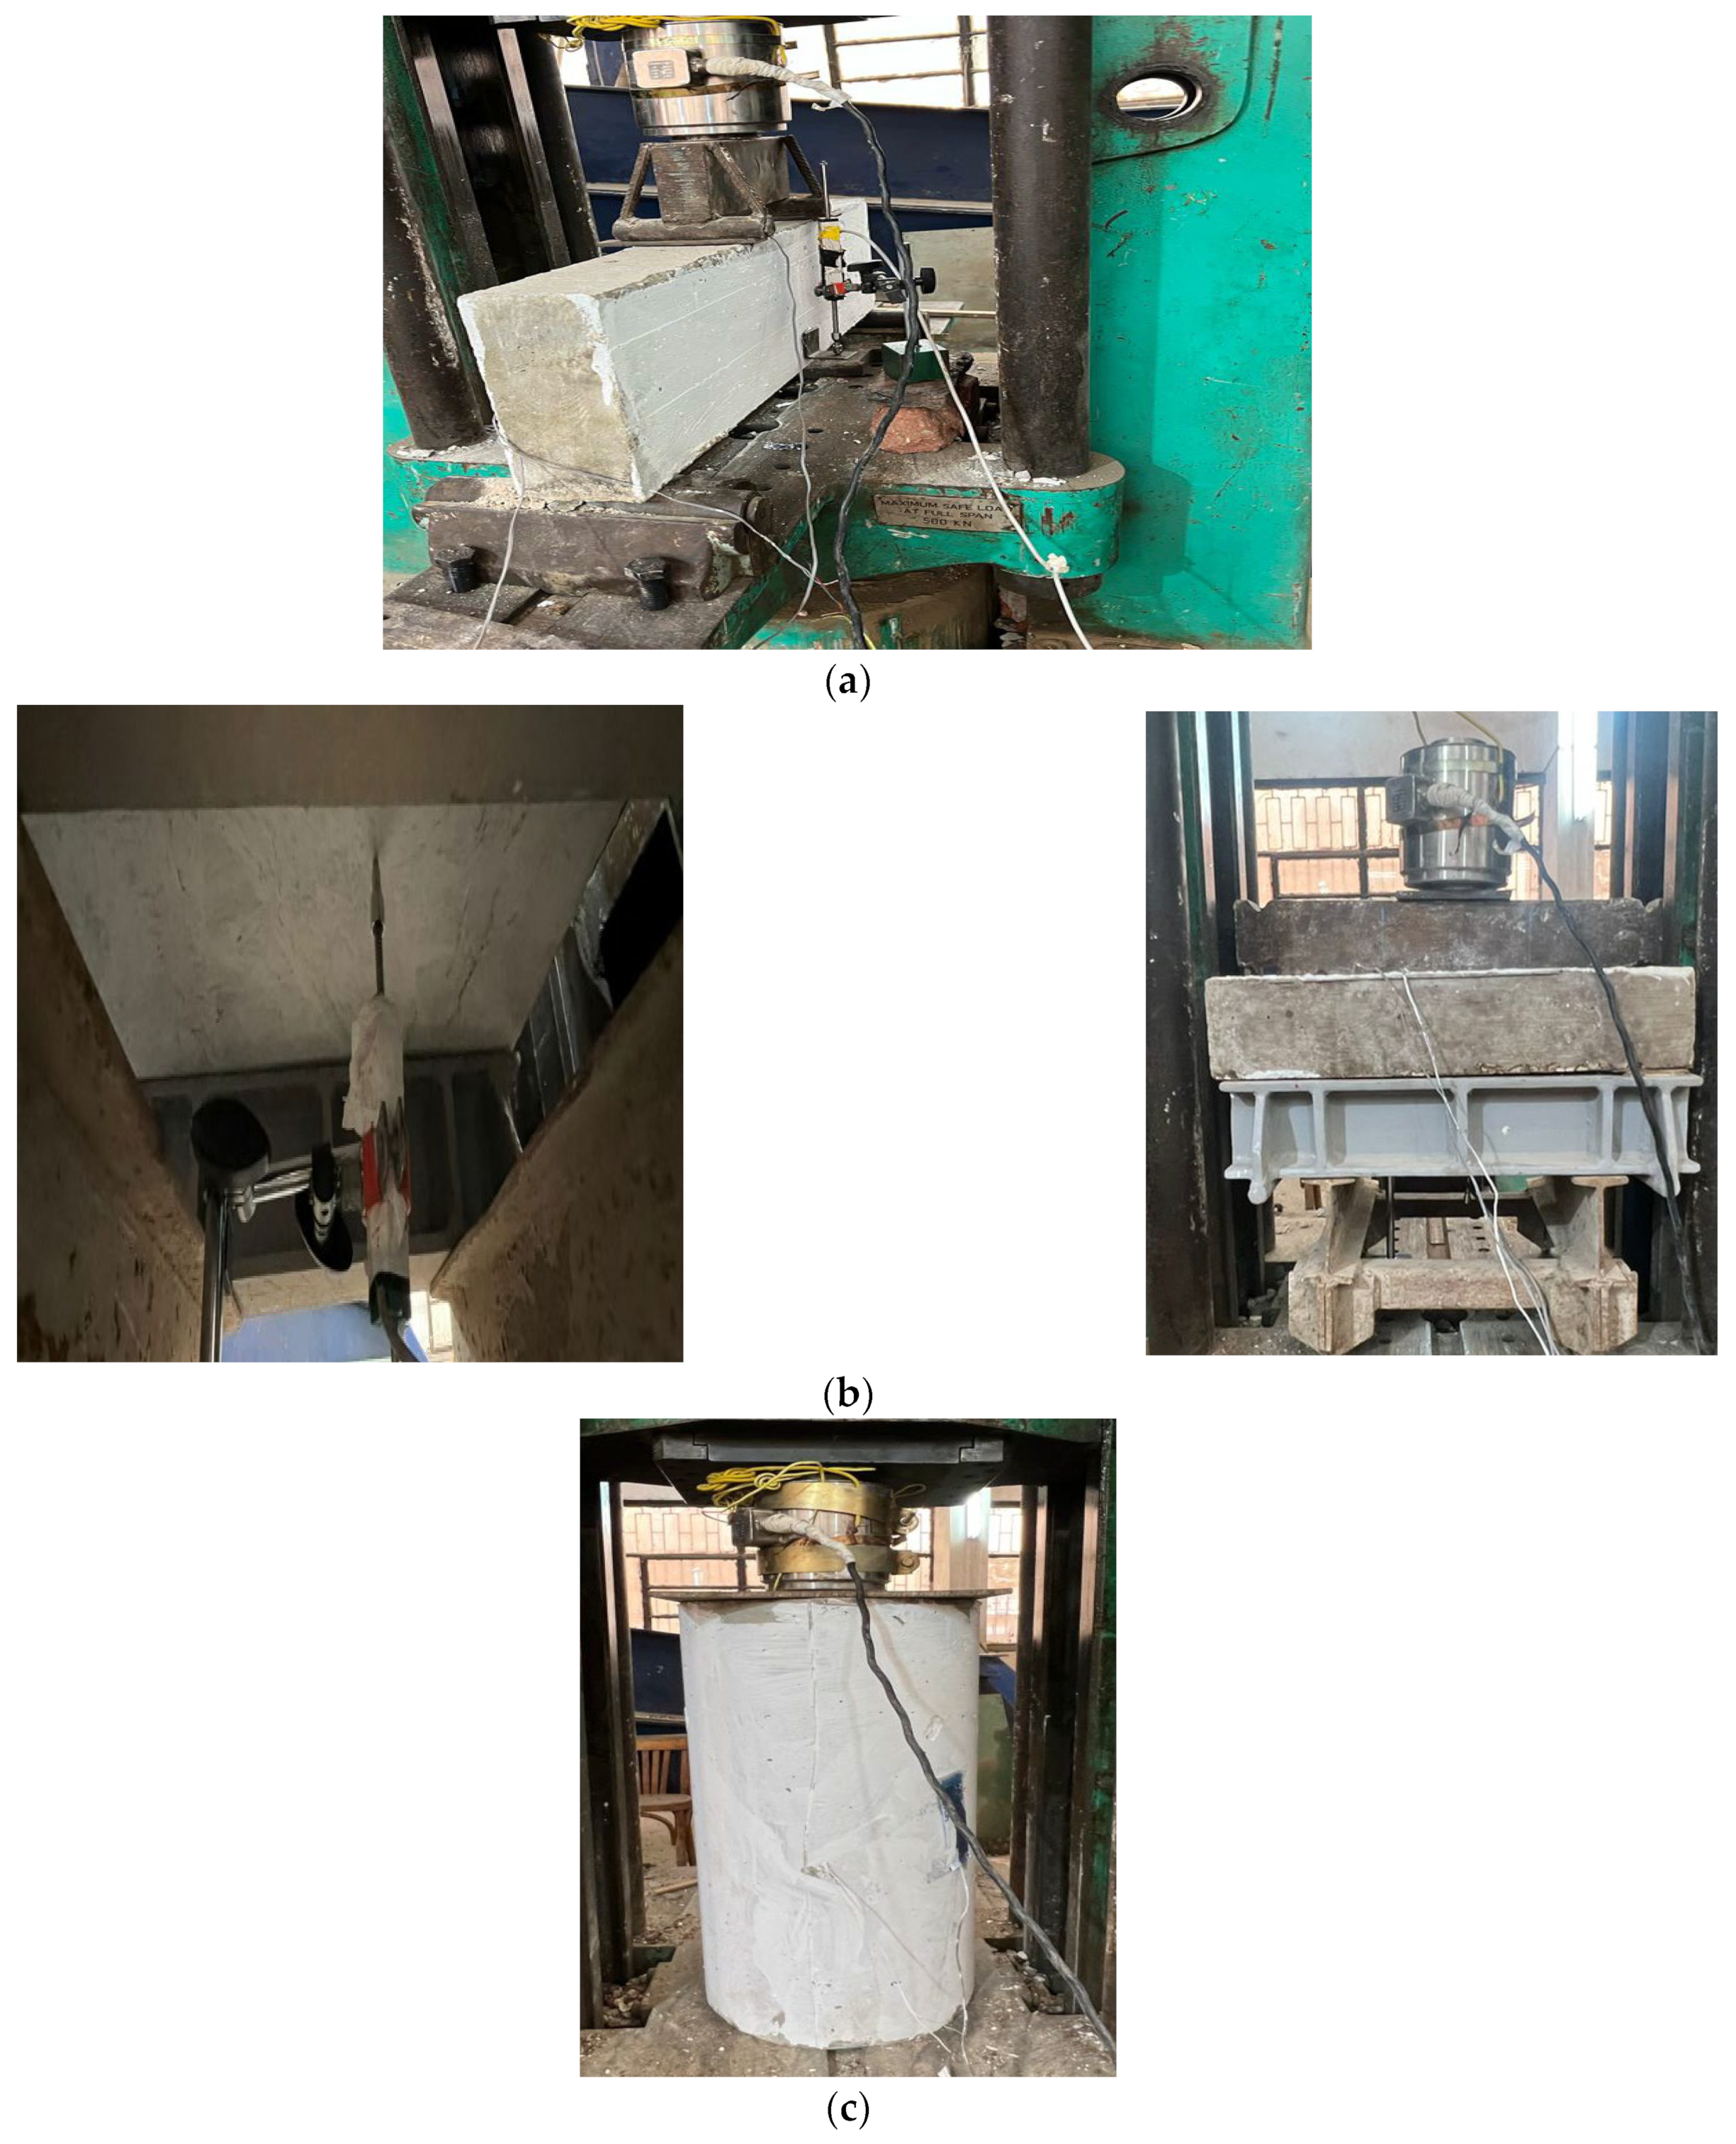
The geopolymer concrete mixing technique is identical to that of ordinary P-C concrete. In the laboratory, all of the components were combined at room temperature. First we mixed fly ash and aggregate for 3 min in a pan, then added alkaline solution to the dry component, and kept mixing for 5 min. Immediately after mixing, geopolymer concrete was cast into forms in layers, with each layer having 25 manual strokes using a 20 mm rod. The specimens were then vibrated using a vibration machine for another 10 to 15 s. Geopolymer samples were left for 24 h before being demoulded, Figure 6, and kept at room temperature until the day of testing after 28 days. Concrete strain gauges were attached to the midspan of the concrete elements, and all members were painted white to observe crack propagation and mark the crack pattern as the testing process proceeded, Figure 7.

2.6. Test Setup

2.6.1. Beam Test Setup

The hydraulic testing machine (Avery Denison-England, 1000 kN) used can accommodate the concrete dimensions of the tested specimens. The beams were supported by two rollers. The testing machine’s applied load was transmitted to the tested beams via a spreader beam (I-beam or steel box section) supported on two cylinder bars, resulting in a zone of constant bending moment and zero shear.
Just after the completion of the initial inspections, a complete set of zero readings of deflection and concrete strains on the sides were taken. At the commencement of the test, the load was added in 10 kN increments until it reached about 50% of the target ultimate load; then, the load increments were reduced to 5 kN until the final failure. With hand magnifiers and lights, careful observations were made on all cracks that had opened or extended during the previous load increment, and the end of each crack was marked with the amount of the load. Loading was continued until the beam completely collapsed.
The four-point loading test ASTM C78 was used for testing 12 beams, as seen in Figure 8a. The load deflection, fracture pattern, failure mechanism, and associated compressive and tensile strain were the key characteristics studied. To measure the strain on the tension side, the tensile reinforcement bars’ outer rough surface was sanded to achieve full coherence between the strain gauges and the reinforcement bars. The strain gauges were then placed to the centre of each tensile rebar to measure the average strain in the beams’ primary reinforcement. Strain gauges were fitted to stirrups to monitor the average strain in the beams’ major reinforcement. After curing, a strain gauge was mounted to the top surface of the beams in the mid-span to measure the concrete strain during loading. The test set-up of R.C beams was placing the beam between two supports with a clear span of 750 mm. There was a 25 mm free distance on each side. Loads were applied at 250 mm from each support, and were measured in kN using the load cell, and deflection was measured in millimetres (mm) by LVDT and a data logger.

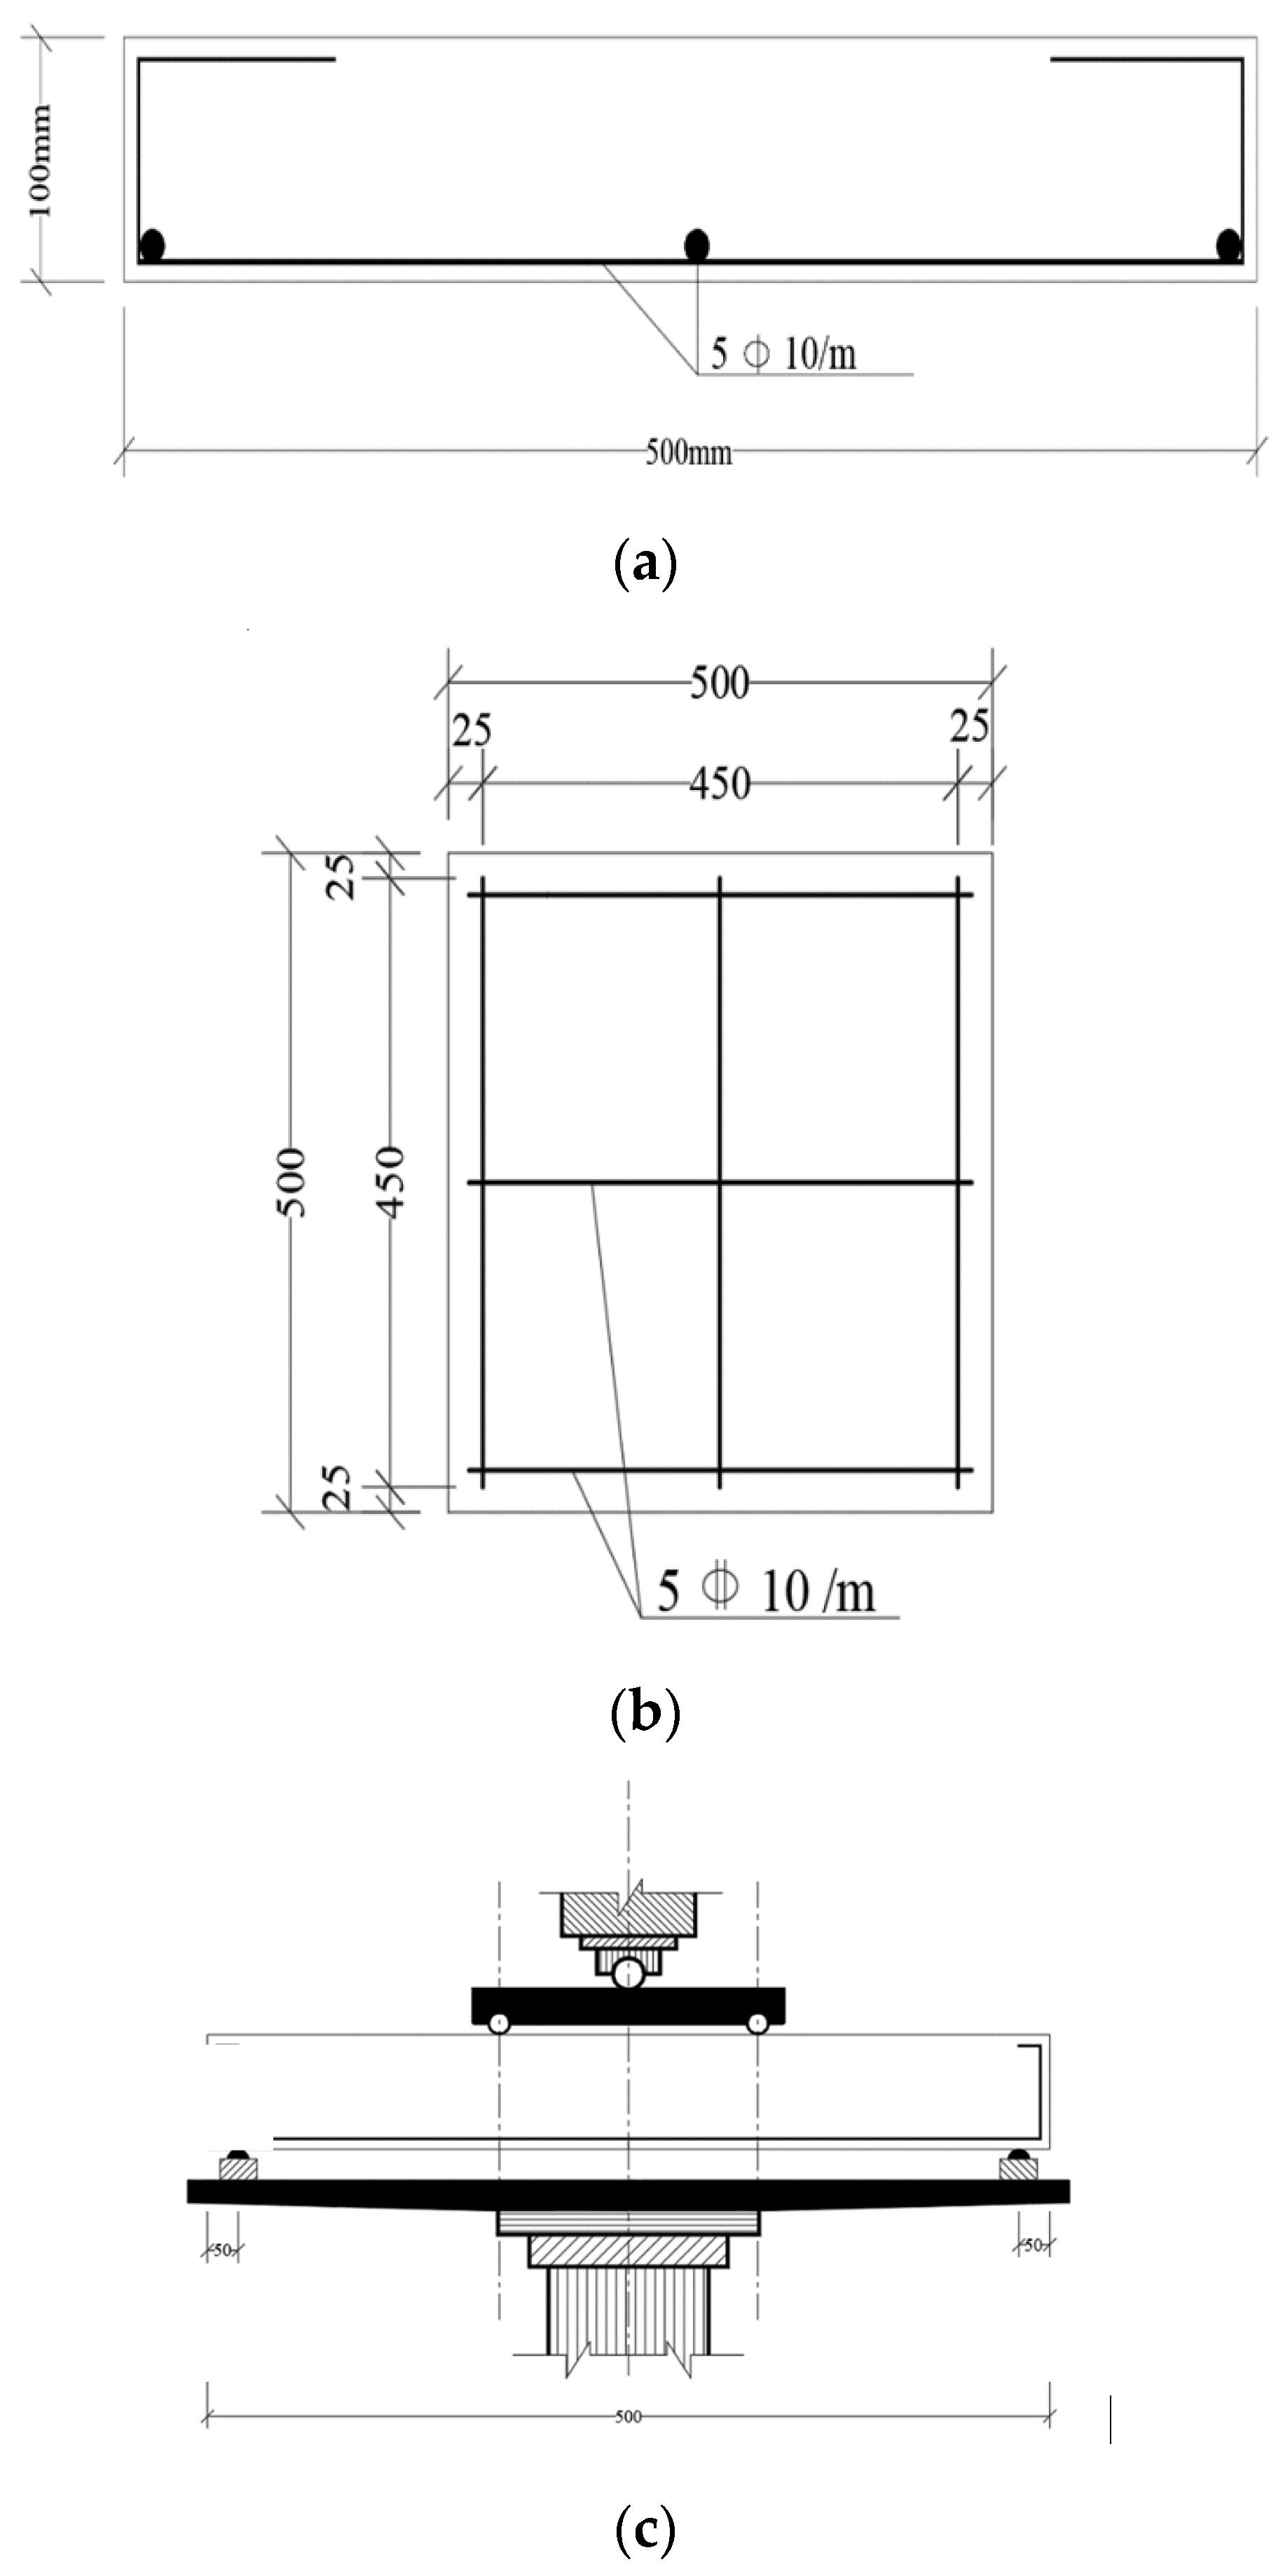
2.6.2. Slab Test Setup

Four slabs were tested by a loading frame with simply supported boundary conditions. A linear variable displacement transducer LVDT was placed at the centre of the slab at the bottom to determine the deflection of the slab until failure. The test setup is shown in Figure 8b.

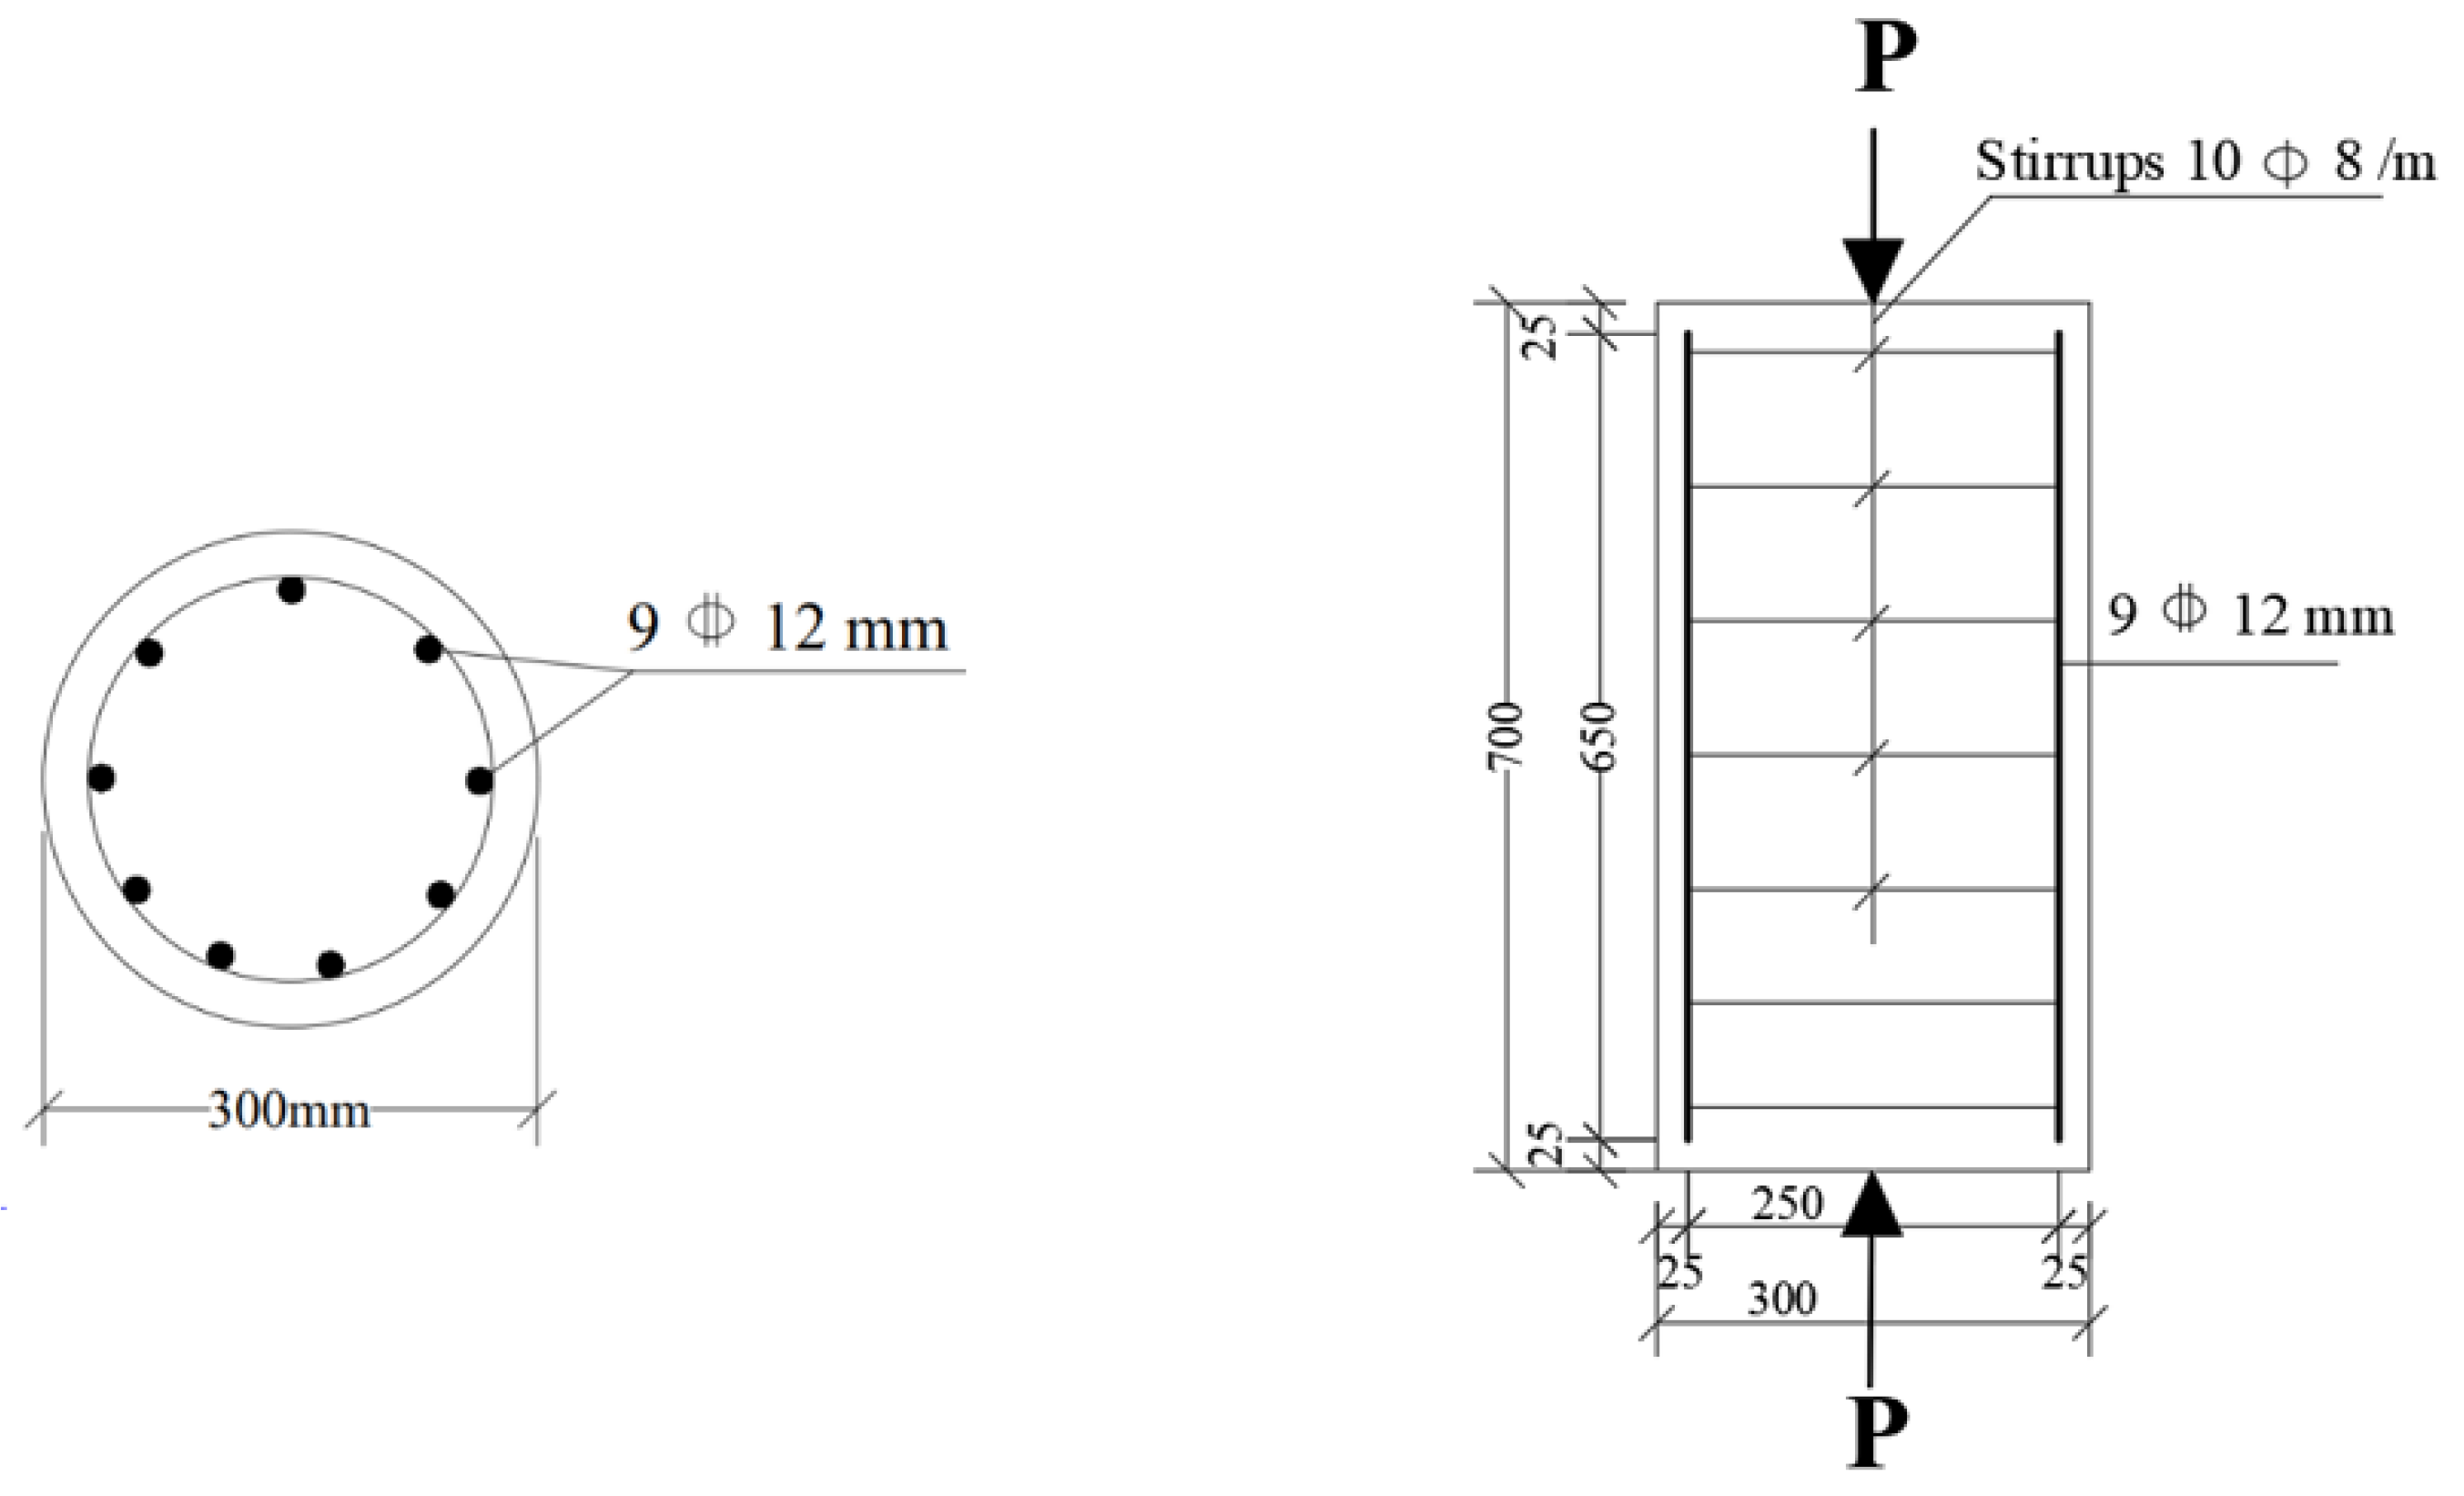
2.6.3. Column Test Setup

Six columns were tested under a pure axial compression load by a loading frame. Before casting, a strain gauge for steel was installed on the longitudinal steel at mid-height, and after curing the concrete, the strain gauge was installed on the concrete surface at mid-height, Figure 8c. A steel rectangular plate was attached on the top surface of the column to distribute the loads.

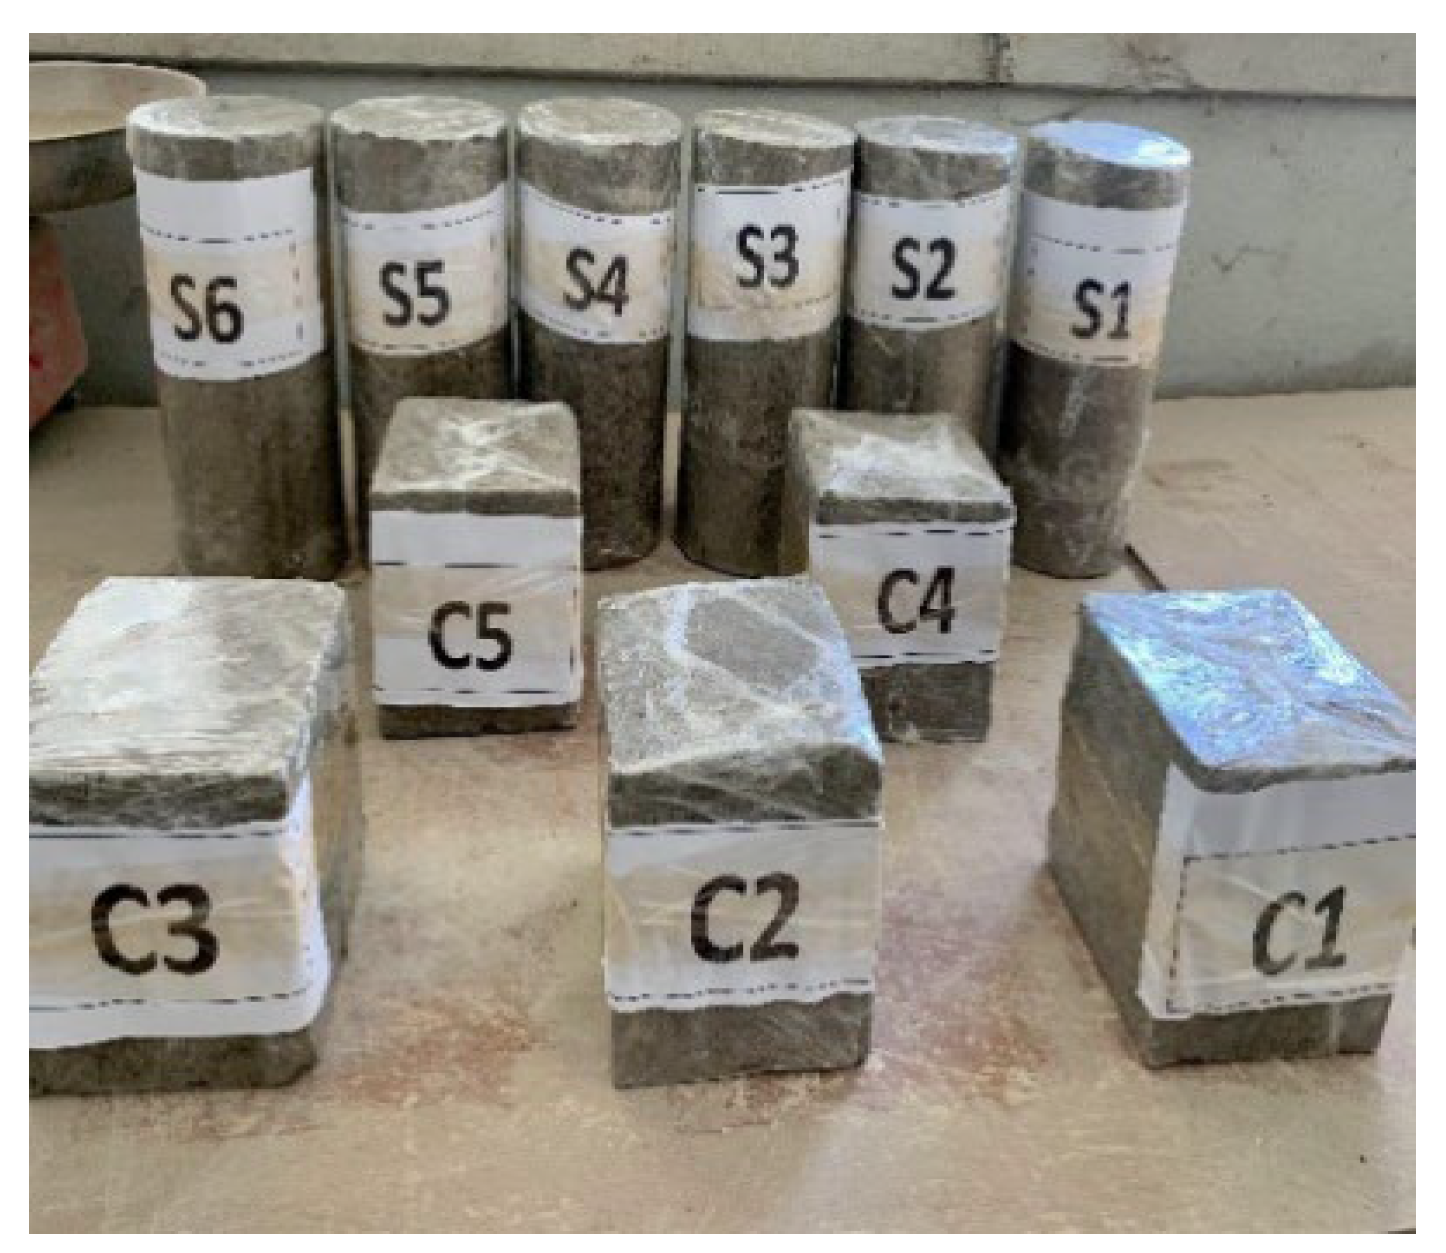
2.7. Mechanical Properties Results

Compressive, flexural strength, and splitting tensile strength results are shown in Table 5.

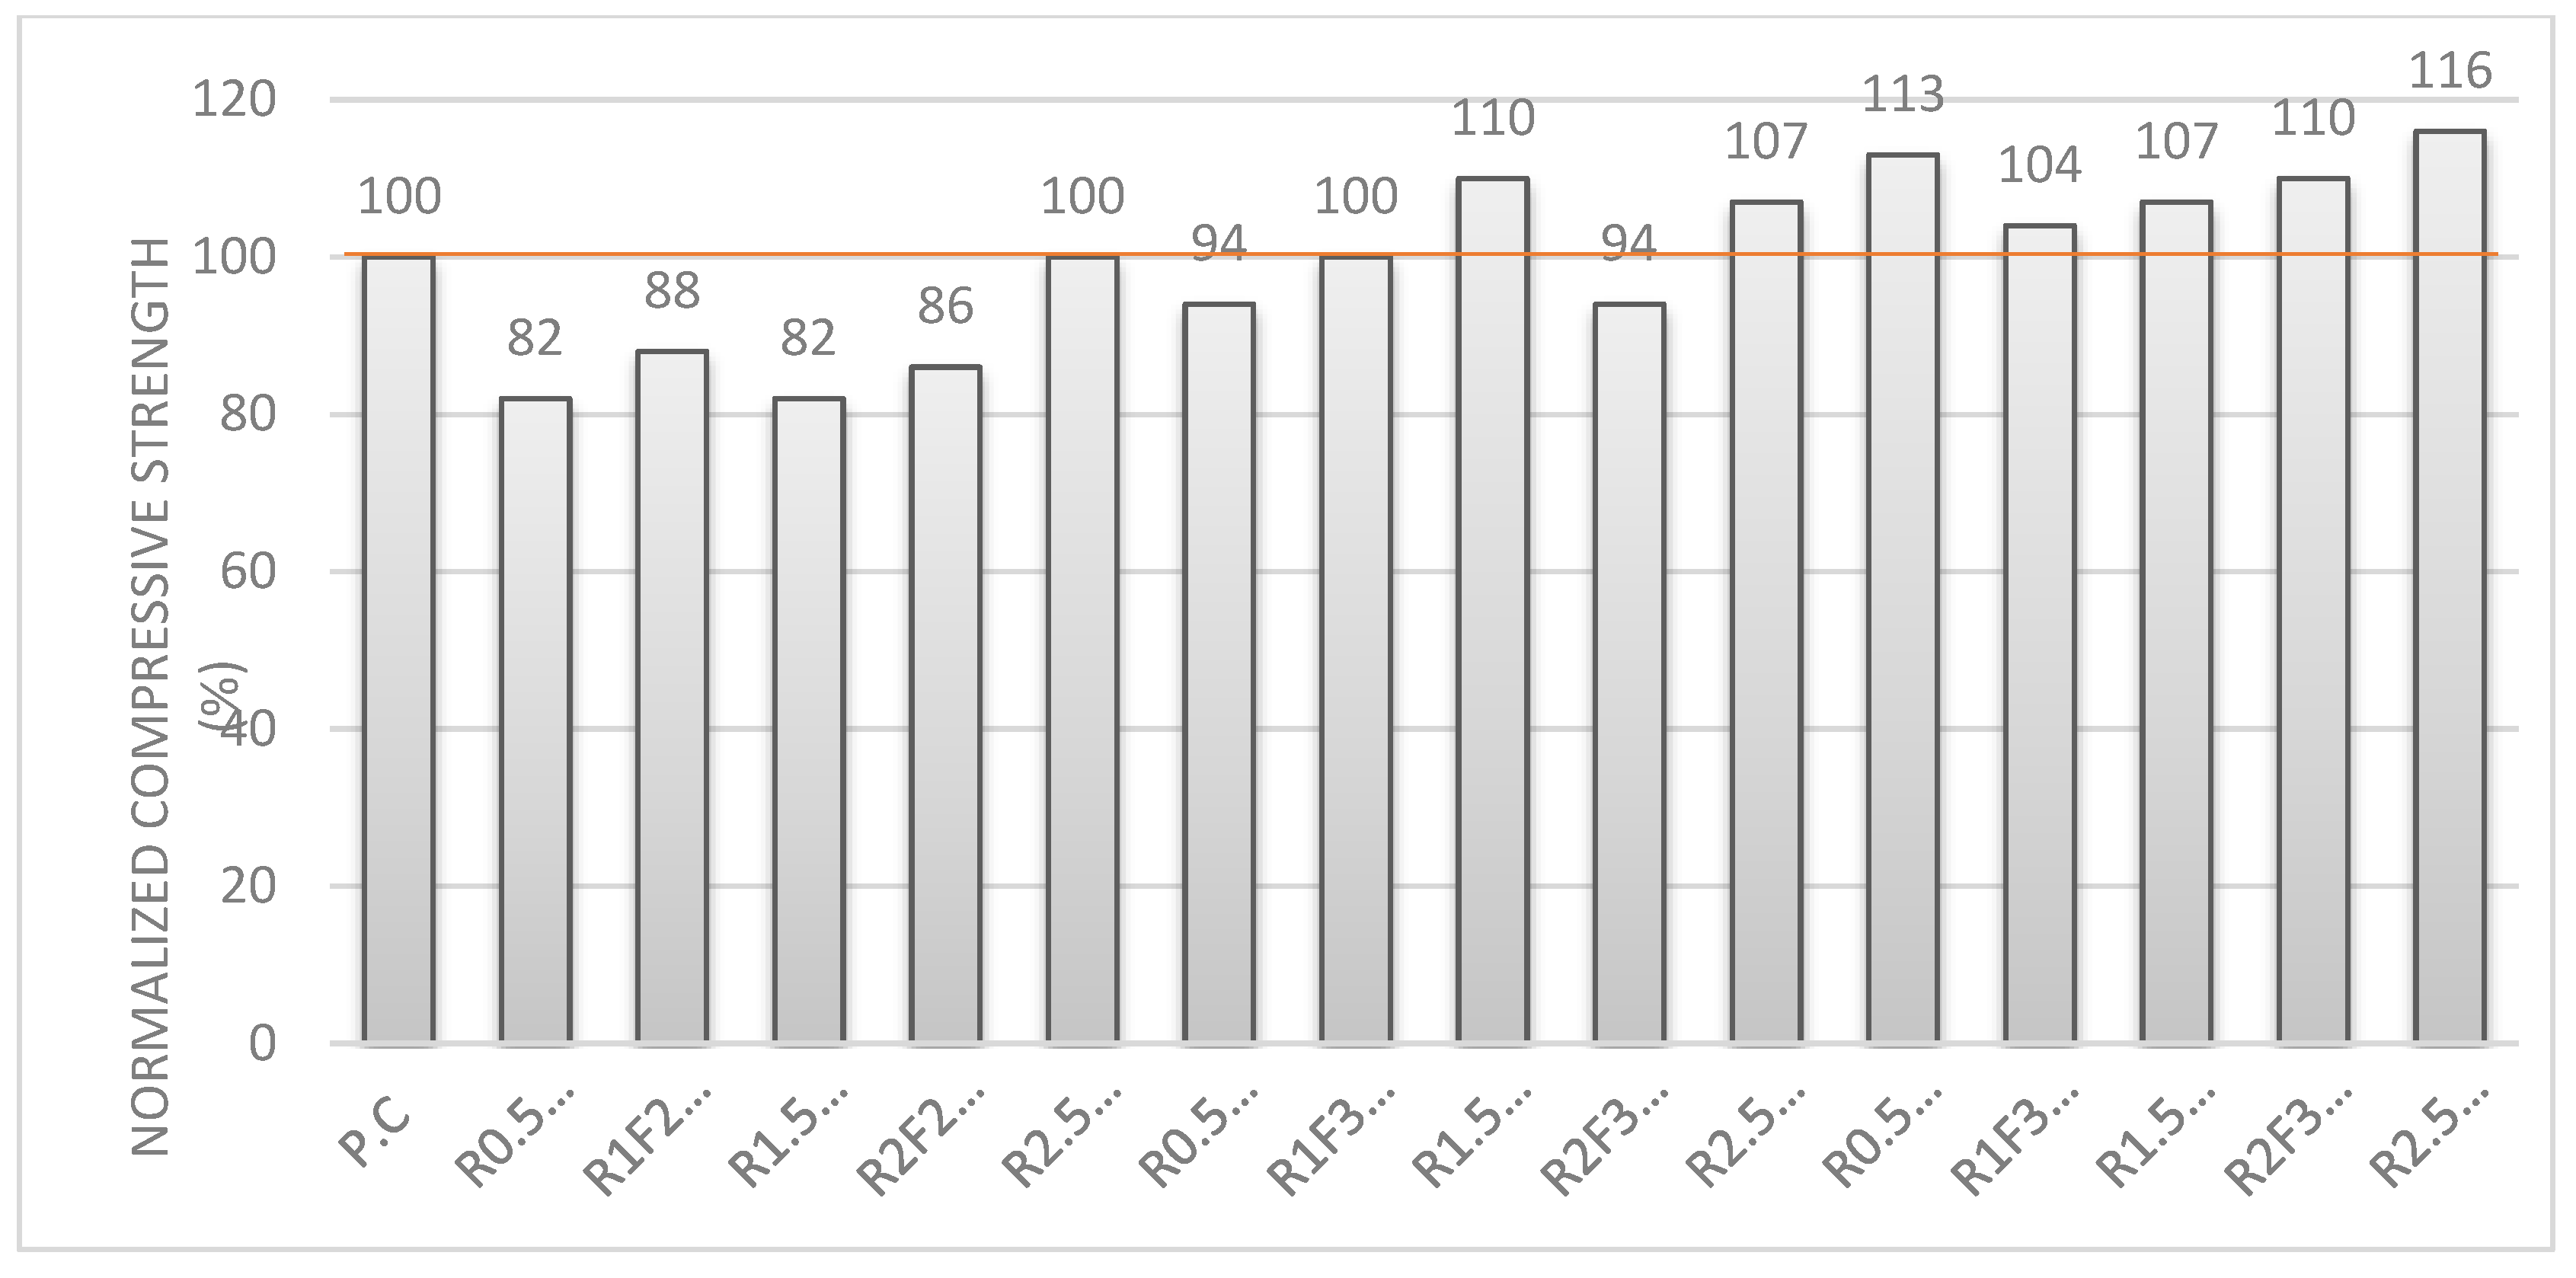
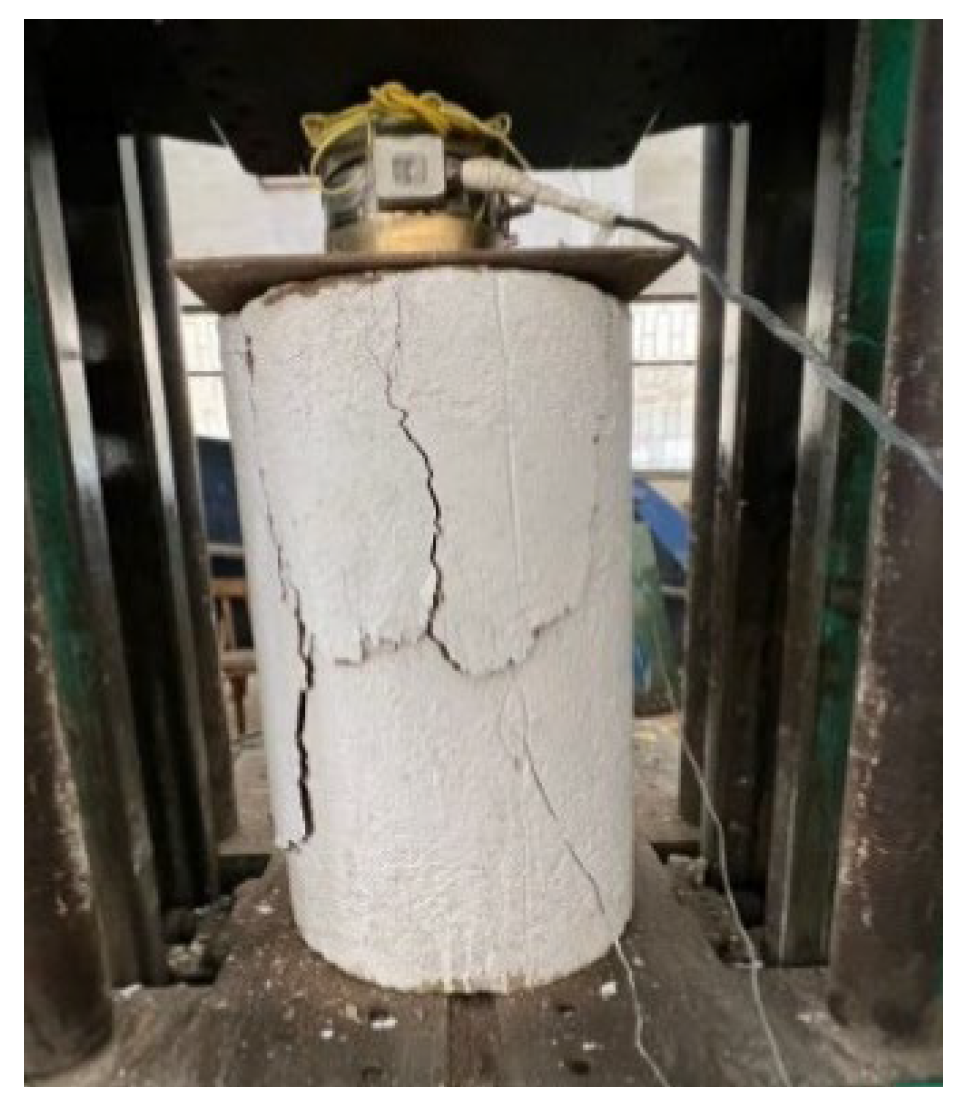
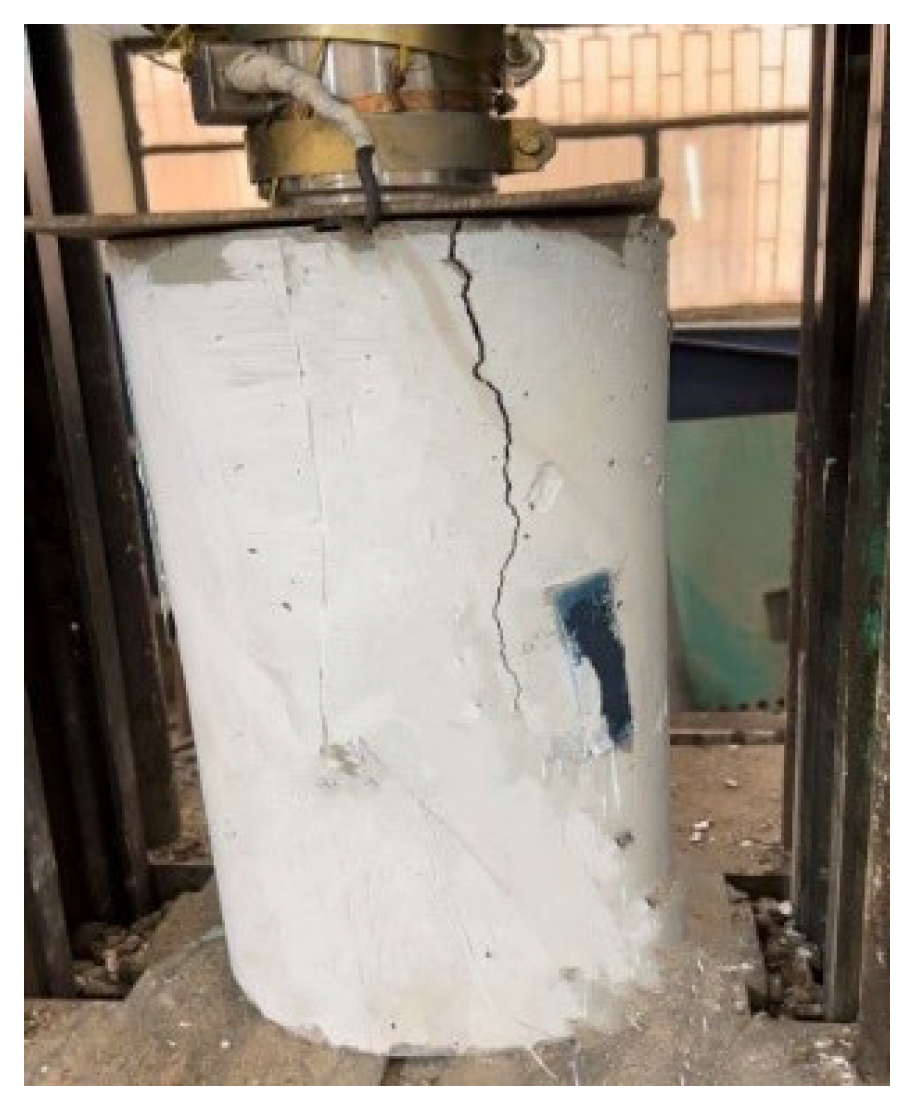
2.7.1. Compressive Strength

The results of geopolymer concrete using 250 kg fly ash showed a reduction in compressive strength compared with PC. However, an increase in the Na2SiO3-to-NaOH ratio caused an increase in the compressive strength. As a result, the R2.5F250 showed almost the same compressive strength as the PC. Overall, increasing the percentage of fly ash will lead to an increase in the compressive strength results. The optimum mix design to obtain maximum compressive and tensile strength occurs at an Na2SiO3-to-NaOH ratio equal to 2.5 and an NaOH molarity equal to 12 M. Normalized strength results are shown in Figure 9.

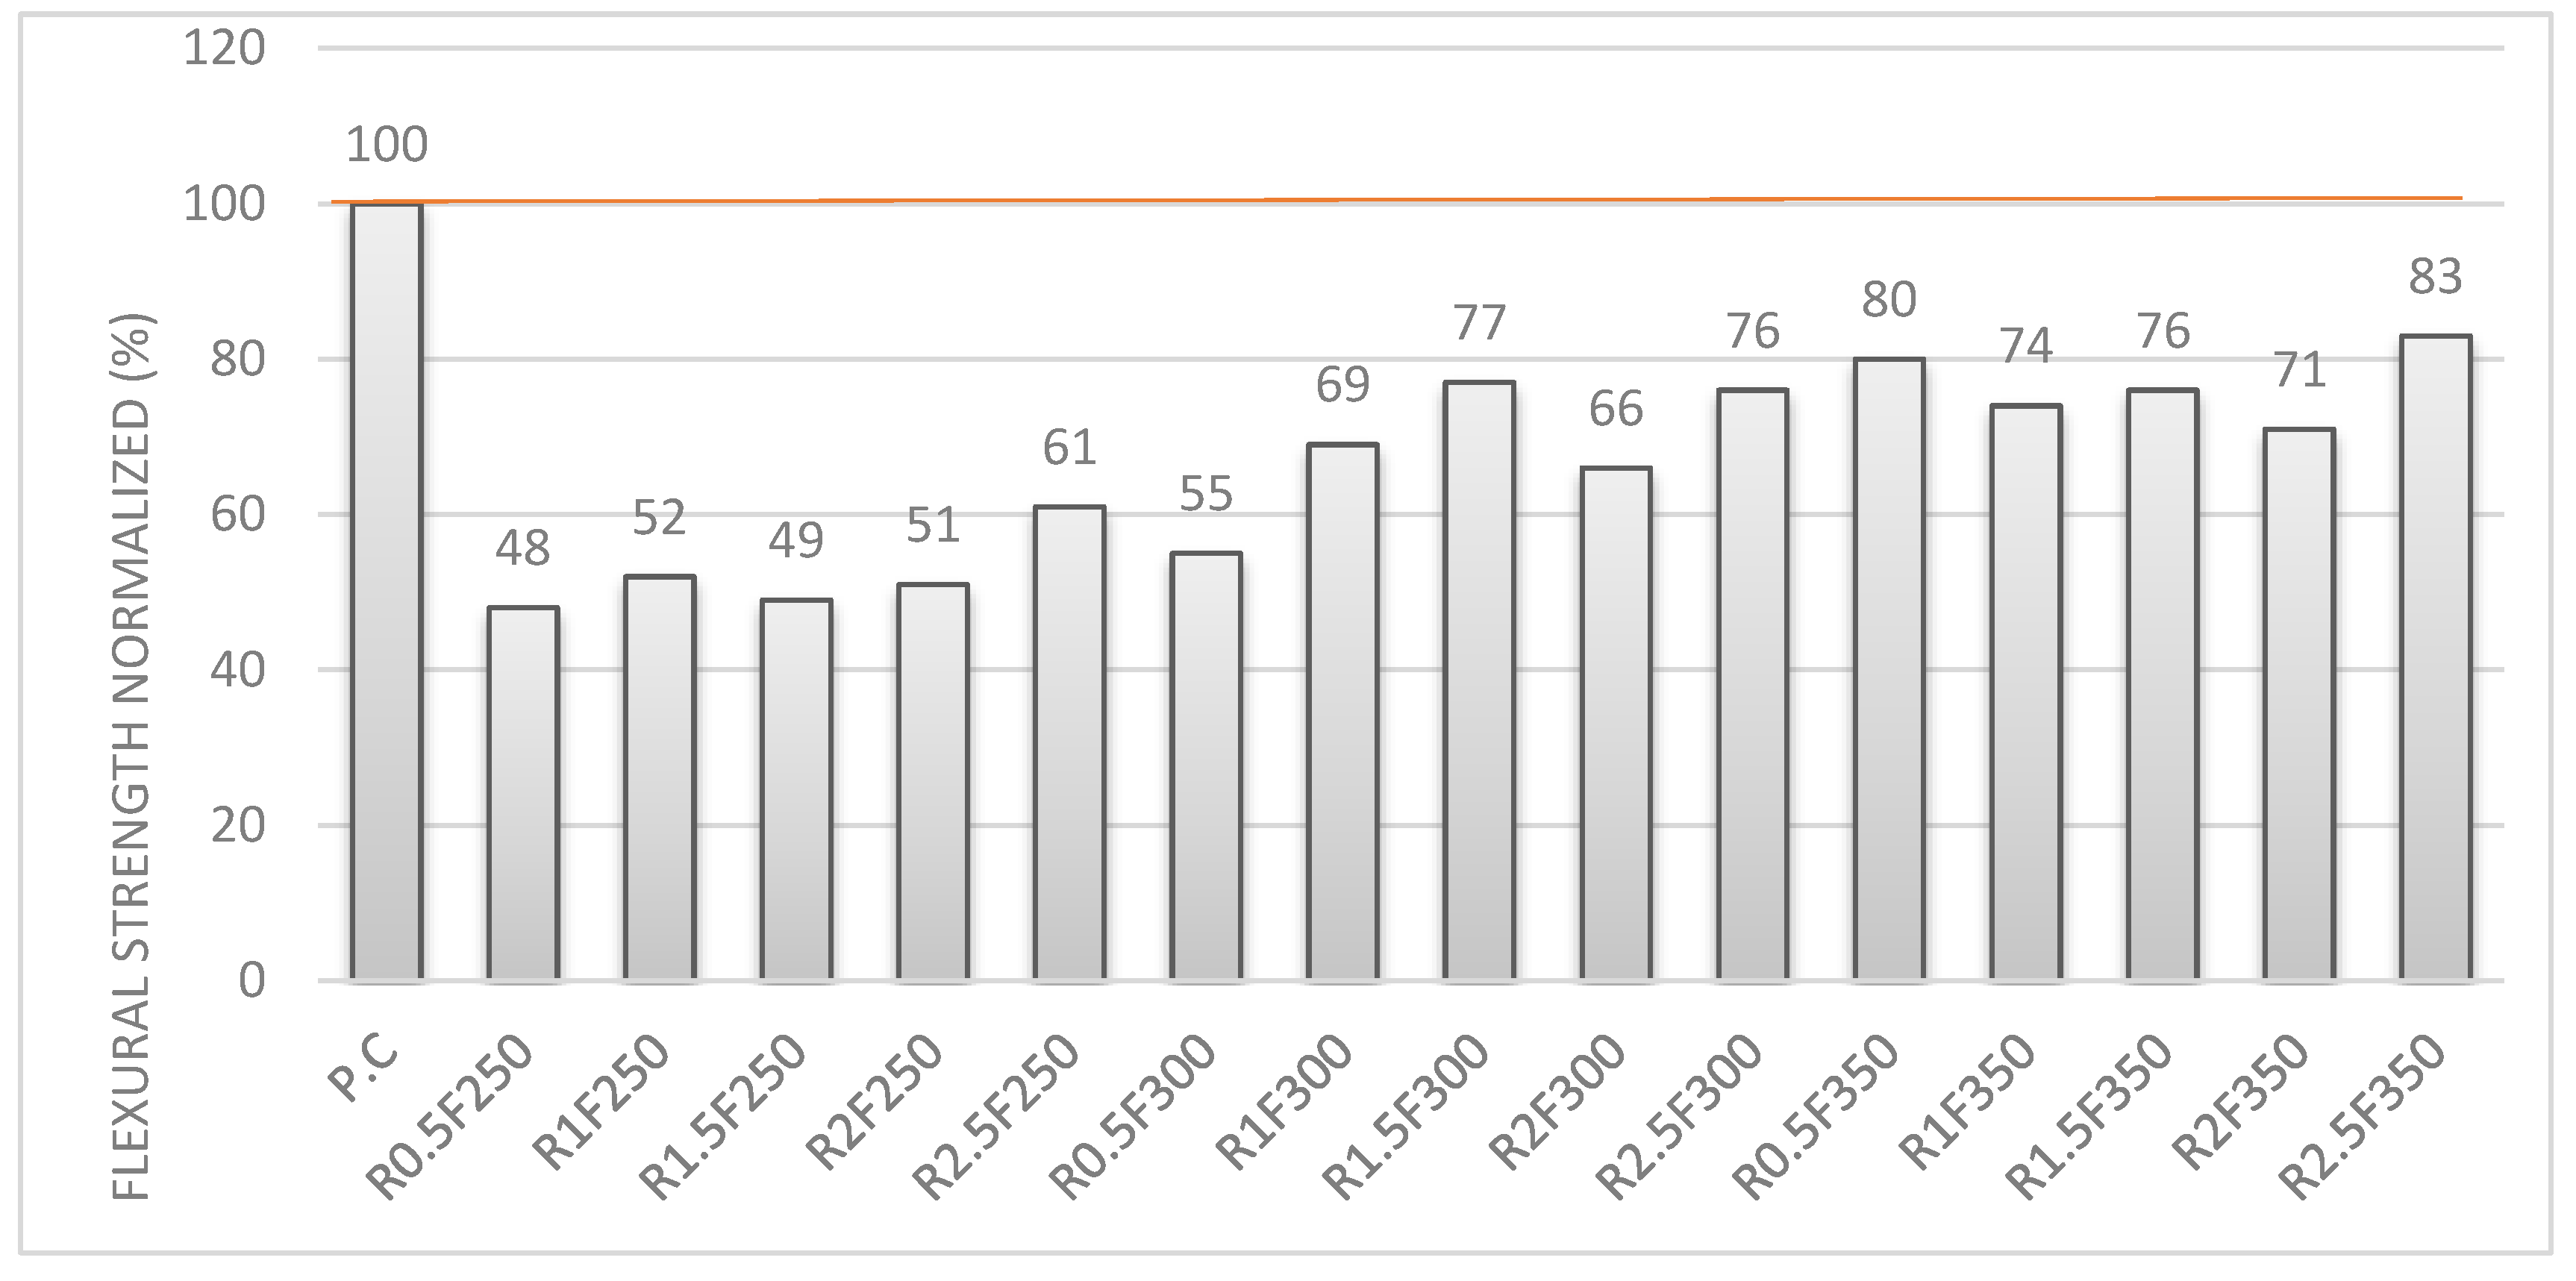
2.7.2. Flexural Strength

The flexural behaviour of fly-ash-based geopolymer concrete is lower than O.P.C concrete even after increasing fly ash content and the Lss-to-NaOH ratio. The results showed a reduction of around 50% for 250 kg fly ash, 30–45% for 300 kg, and 15–25% for 350 kg fly ash content. Normalized strength results are shown in Figure 10.

2.7.3. Splitting Tensile Strength

The splitting tensile behaviour of fly-ash-based geopolymer concrete is also lower than ordinary Portland concrete even after increasing fly ash content and the Lss-to-NaOH ratio. The results showed a reduction of around 40% for 250 kg fly ash, 23–34% for 300 kg, and 15–25% for 350 kg fly ash contents. However, the increase in the Na2SiO3-to-NaOH ratio improves the split-tensile strength results. Normalized strength results are shown in Figure 11.

3. Structural Member’s Response

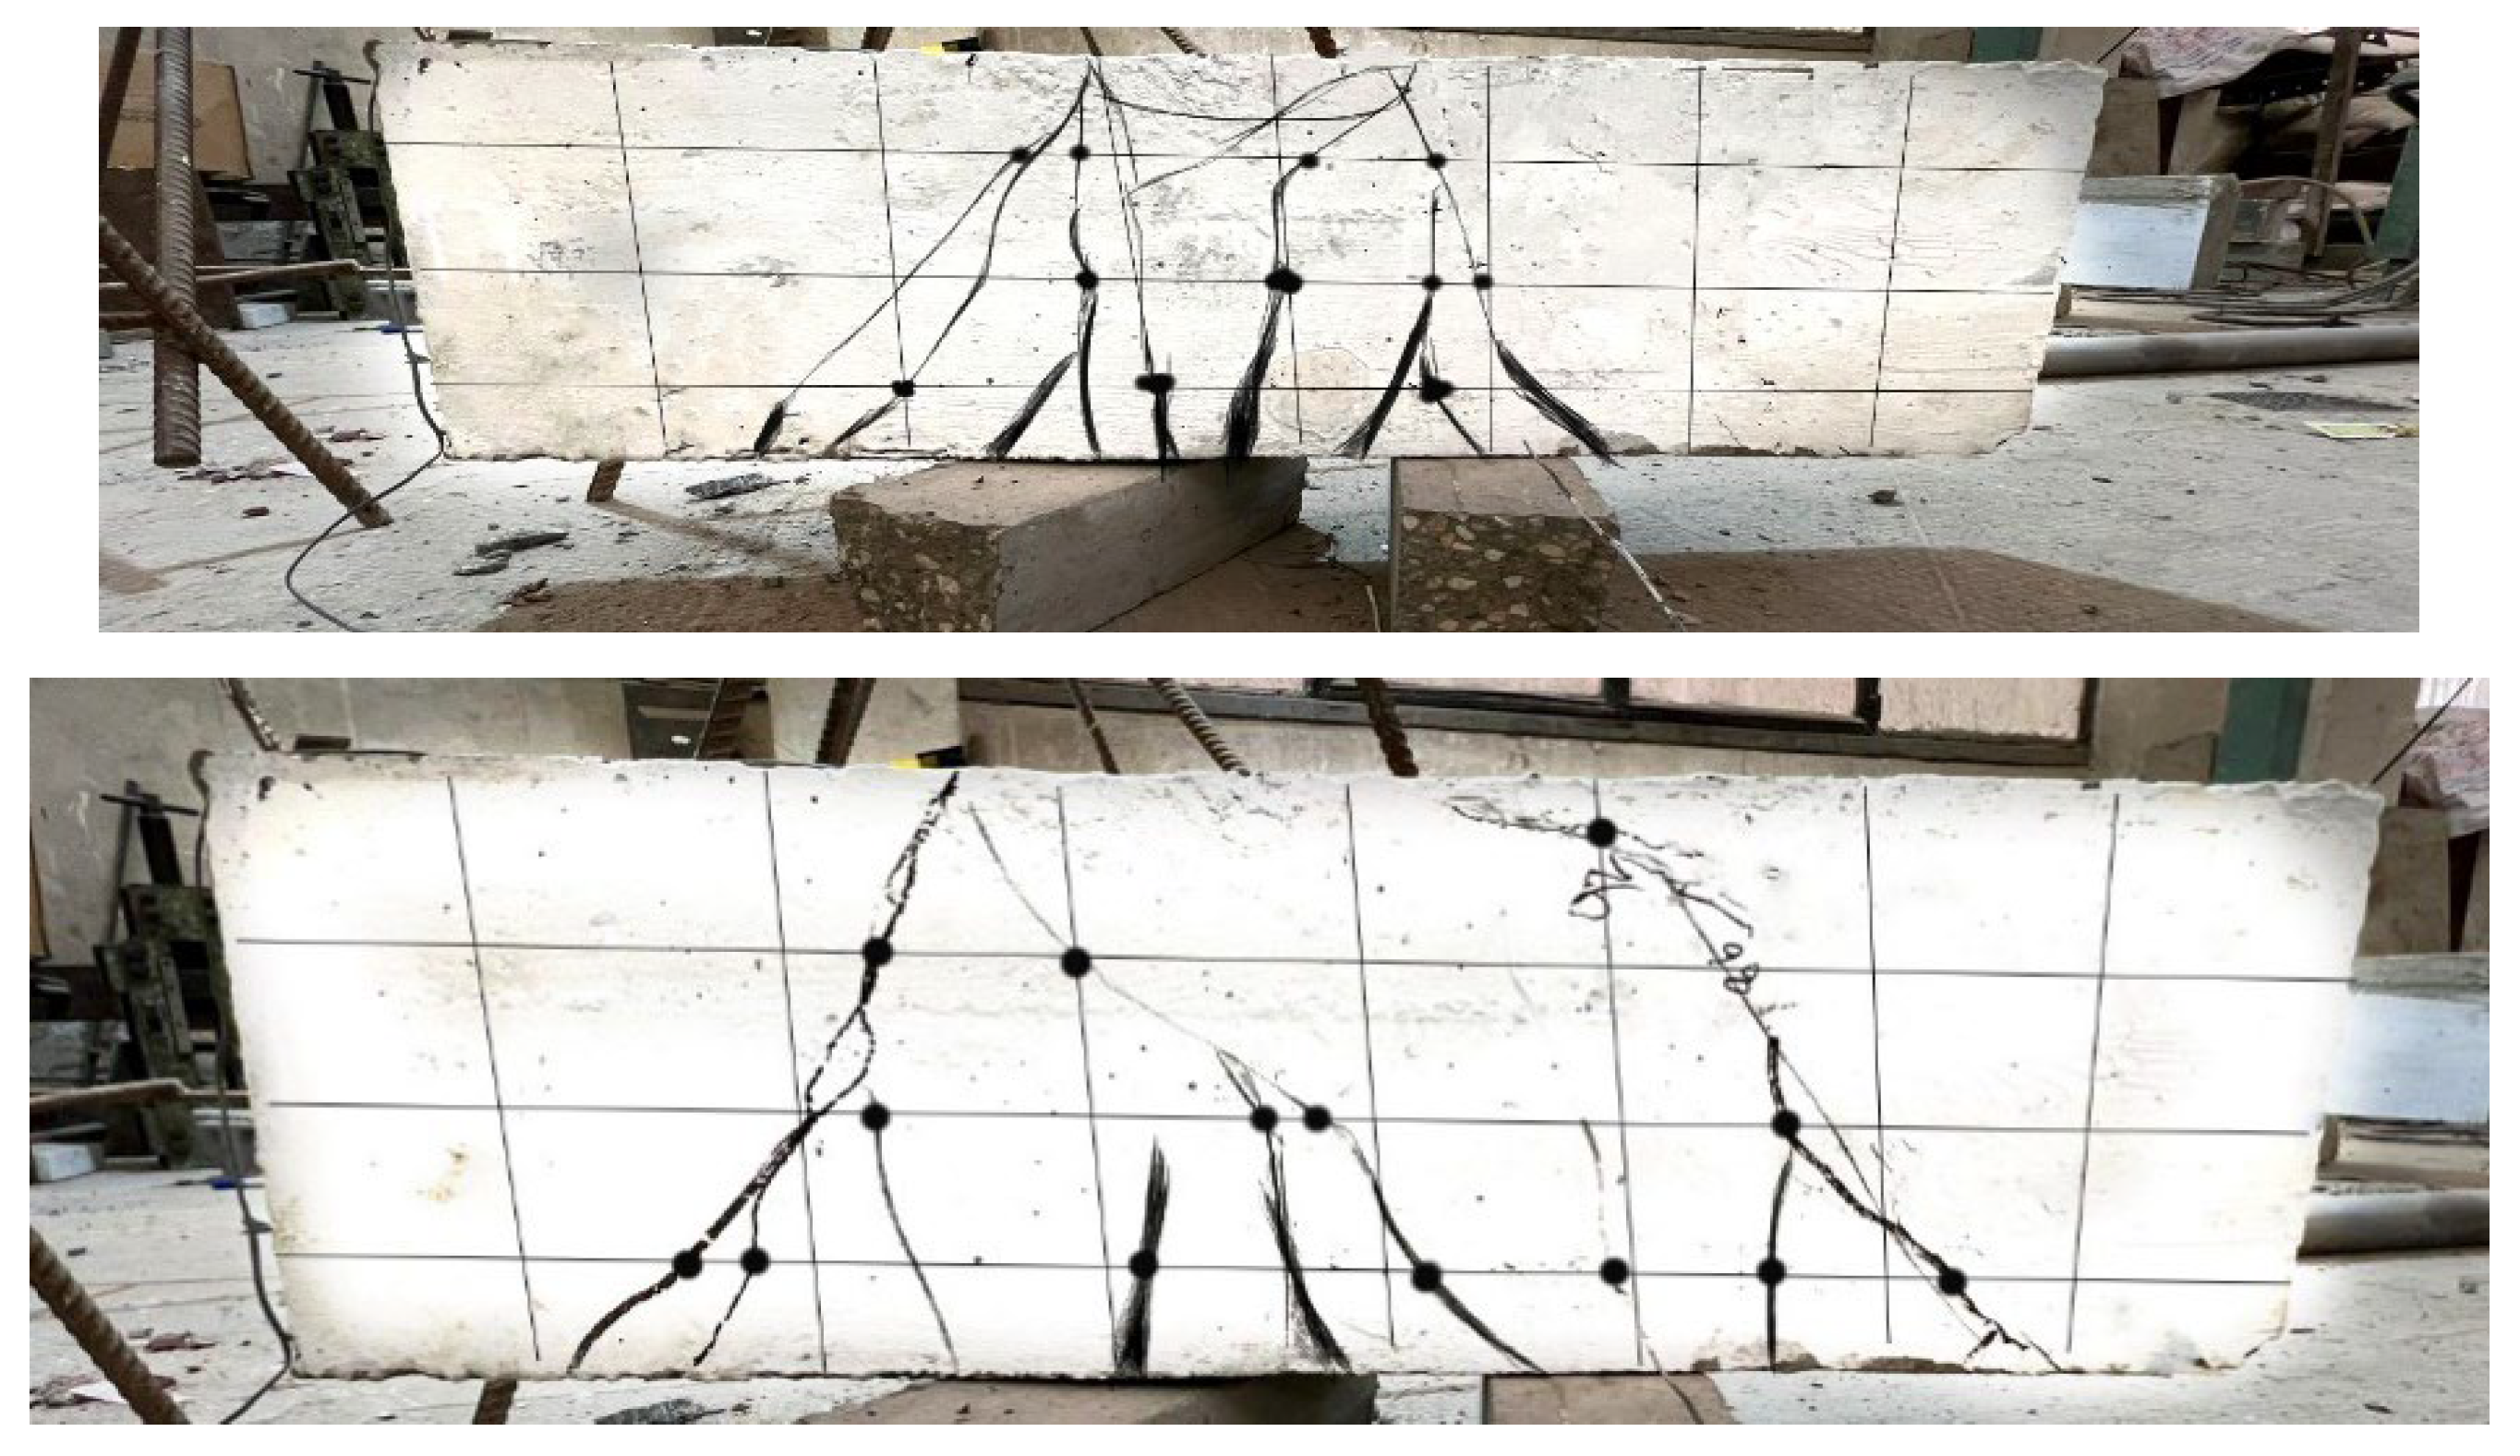
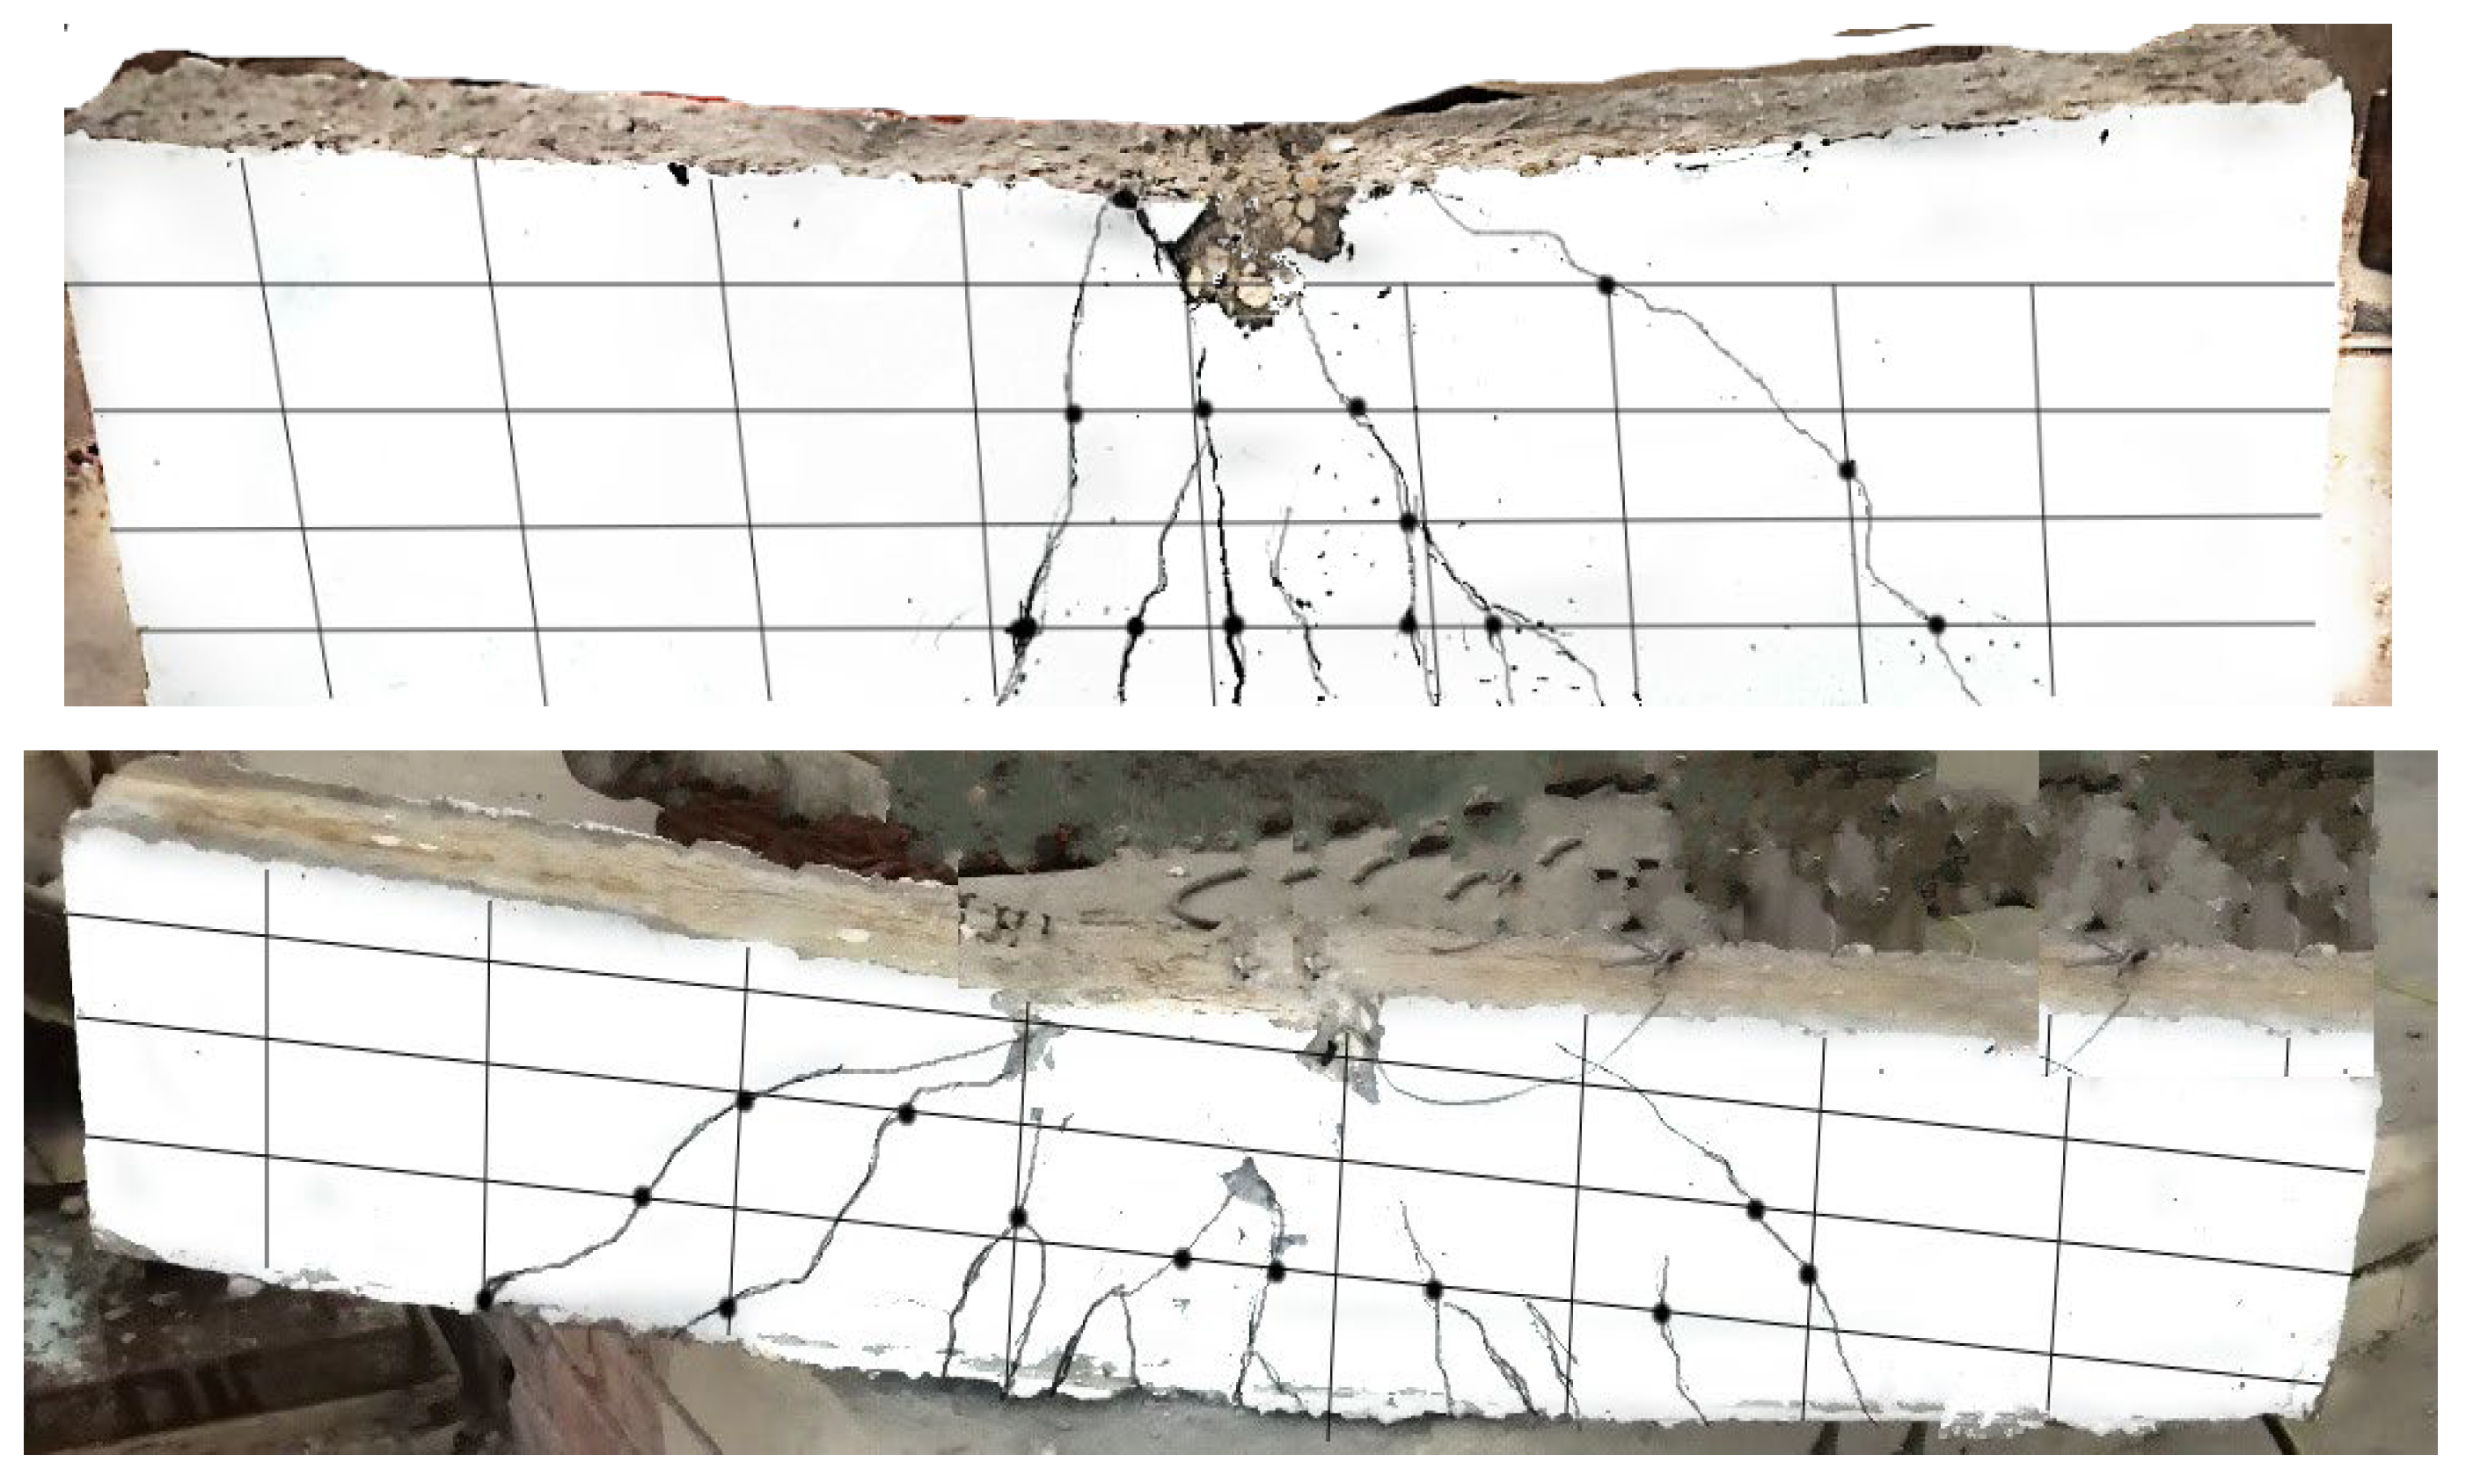
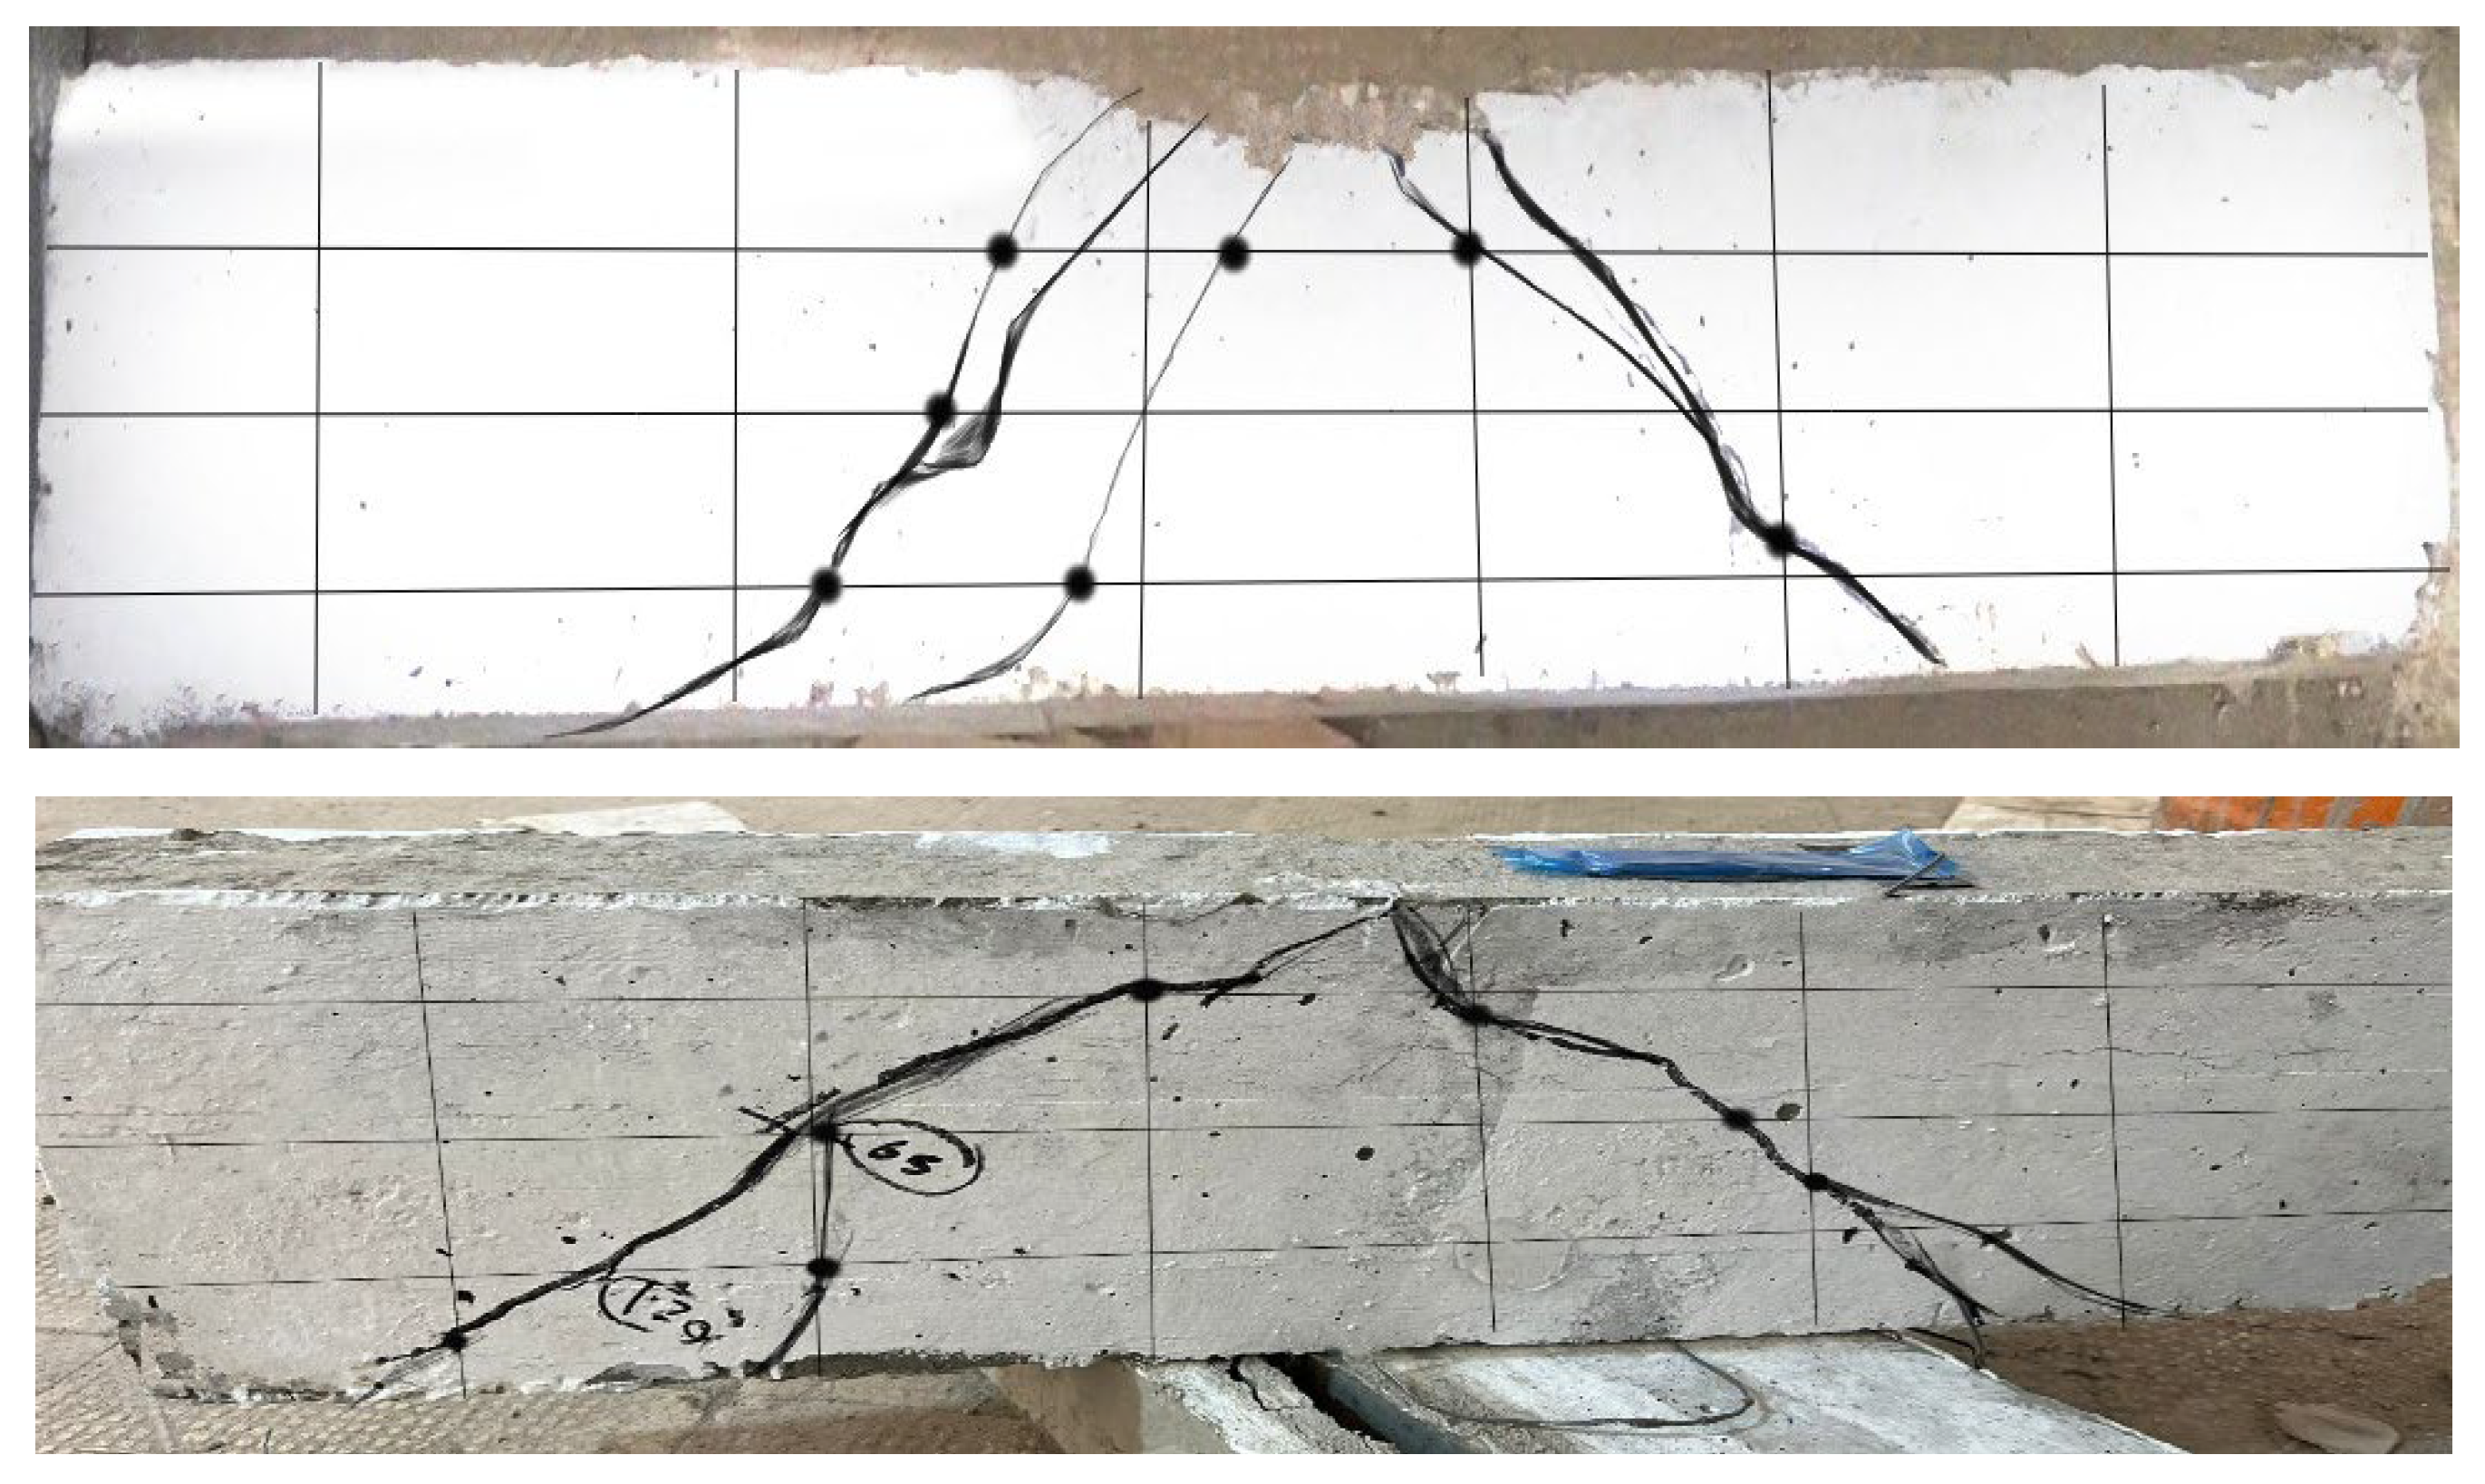
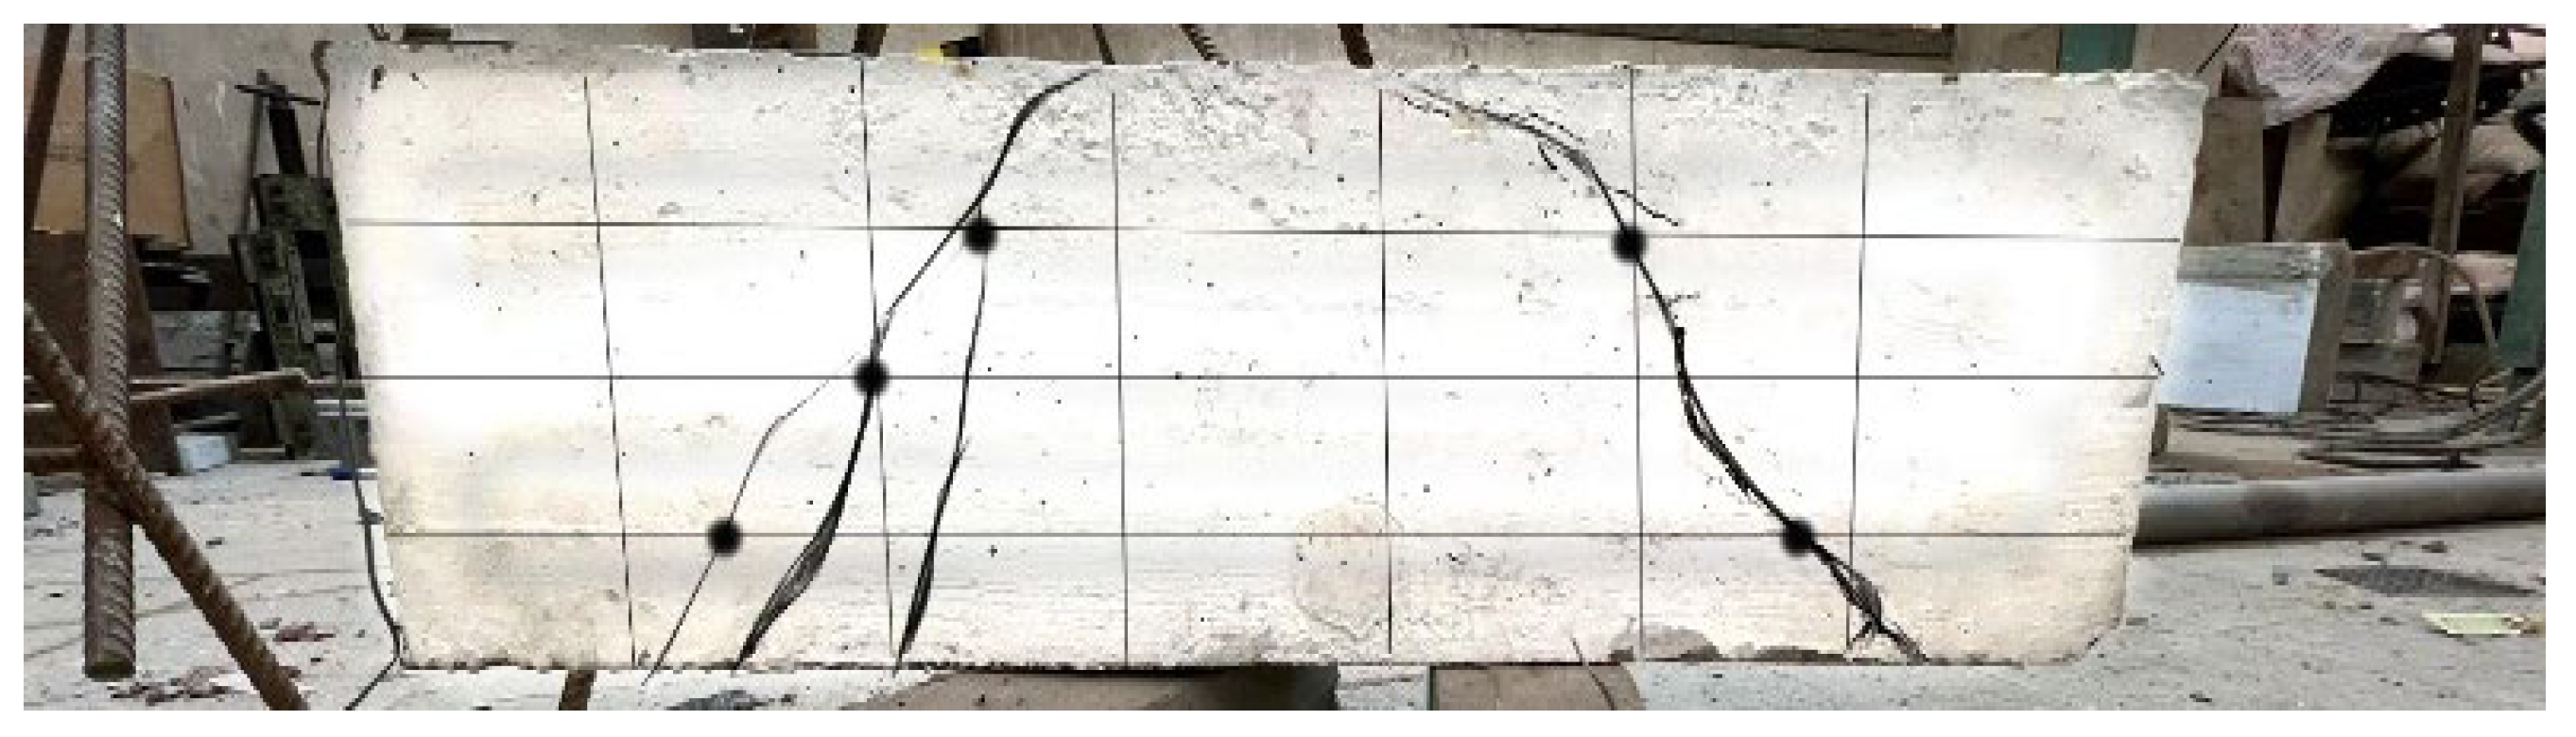
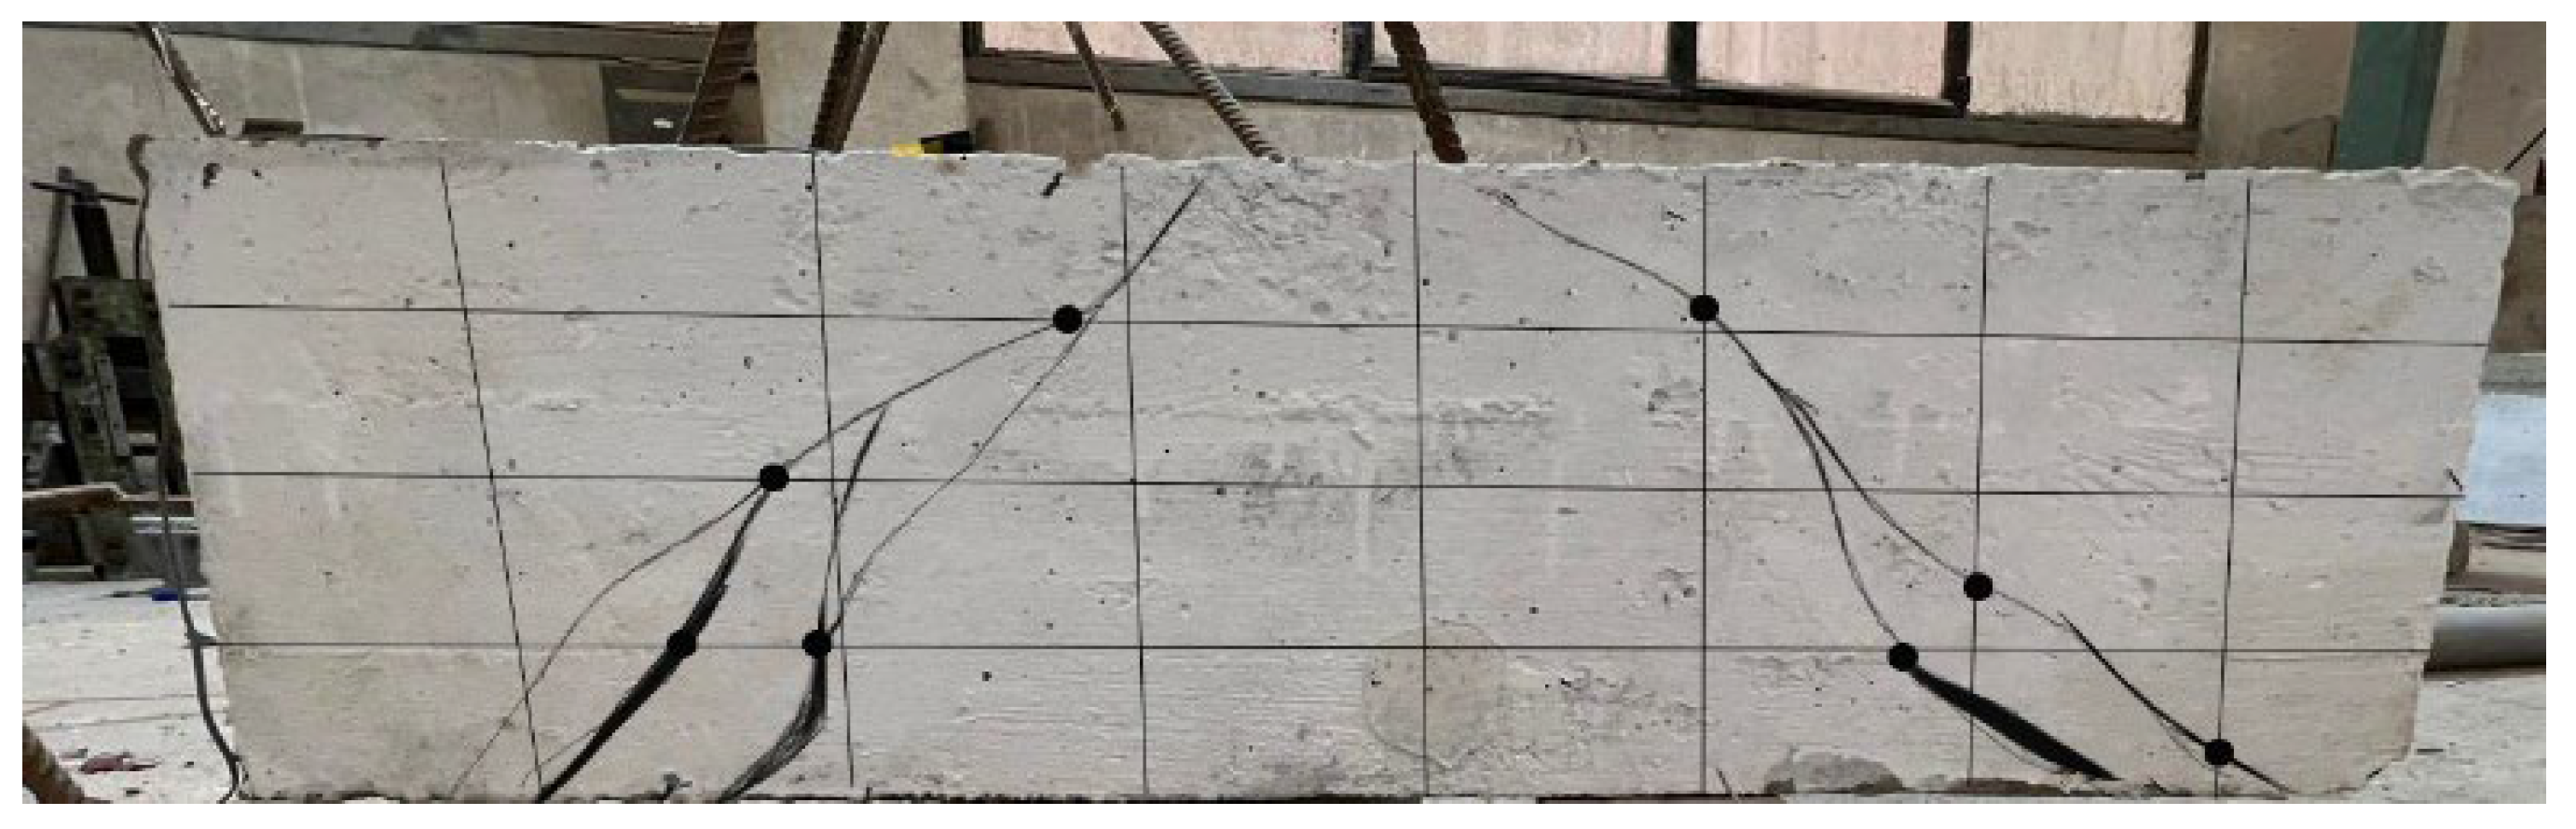
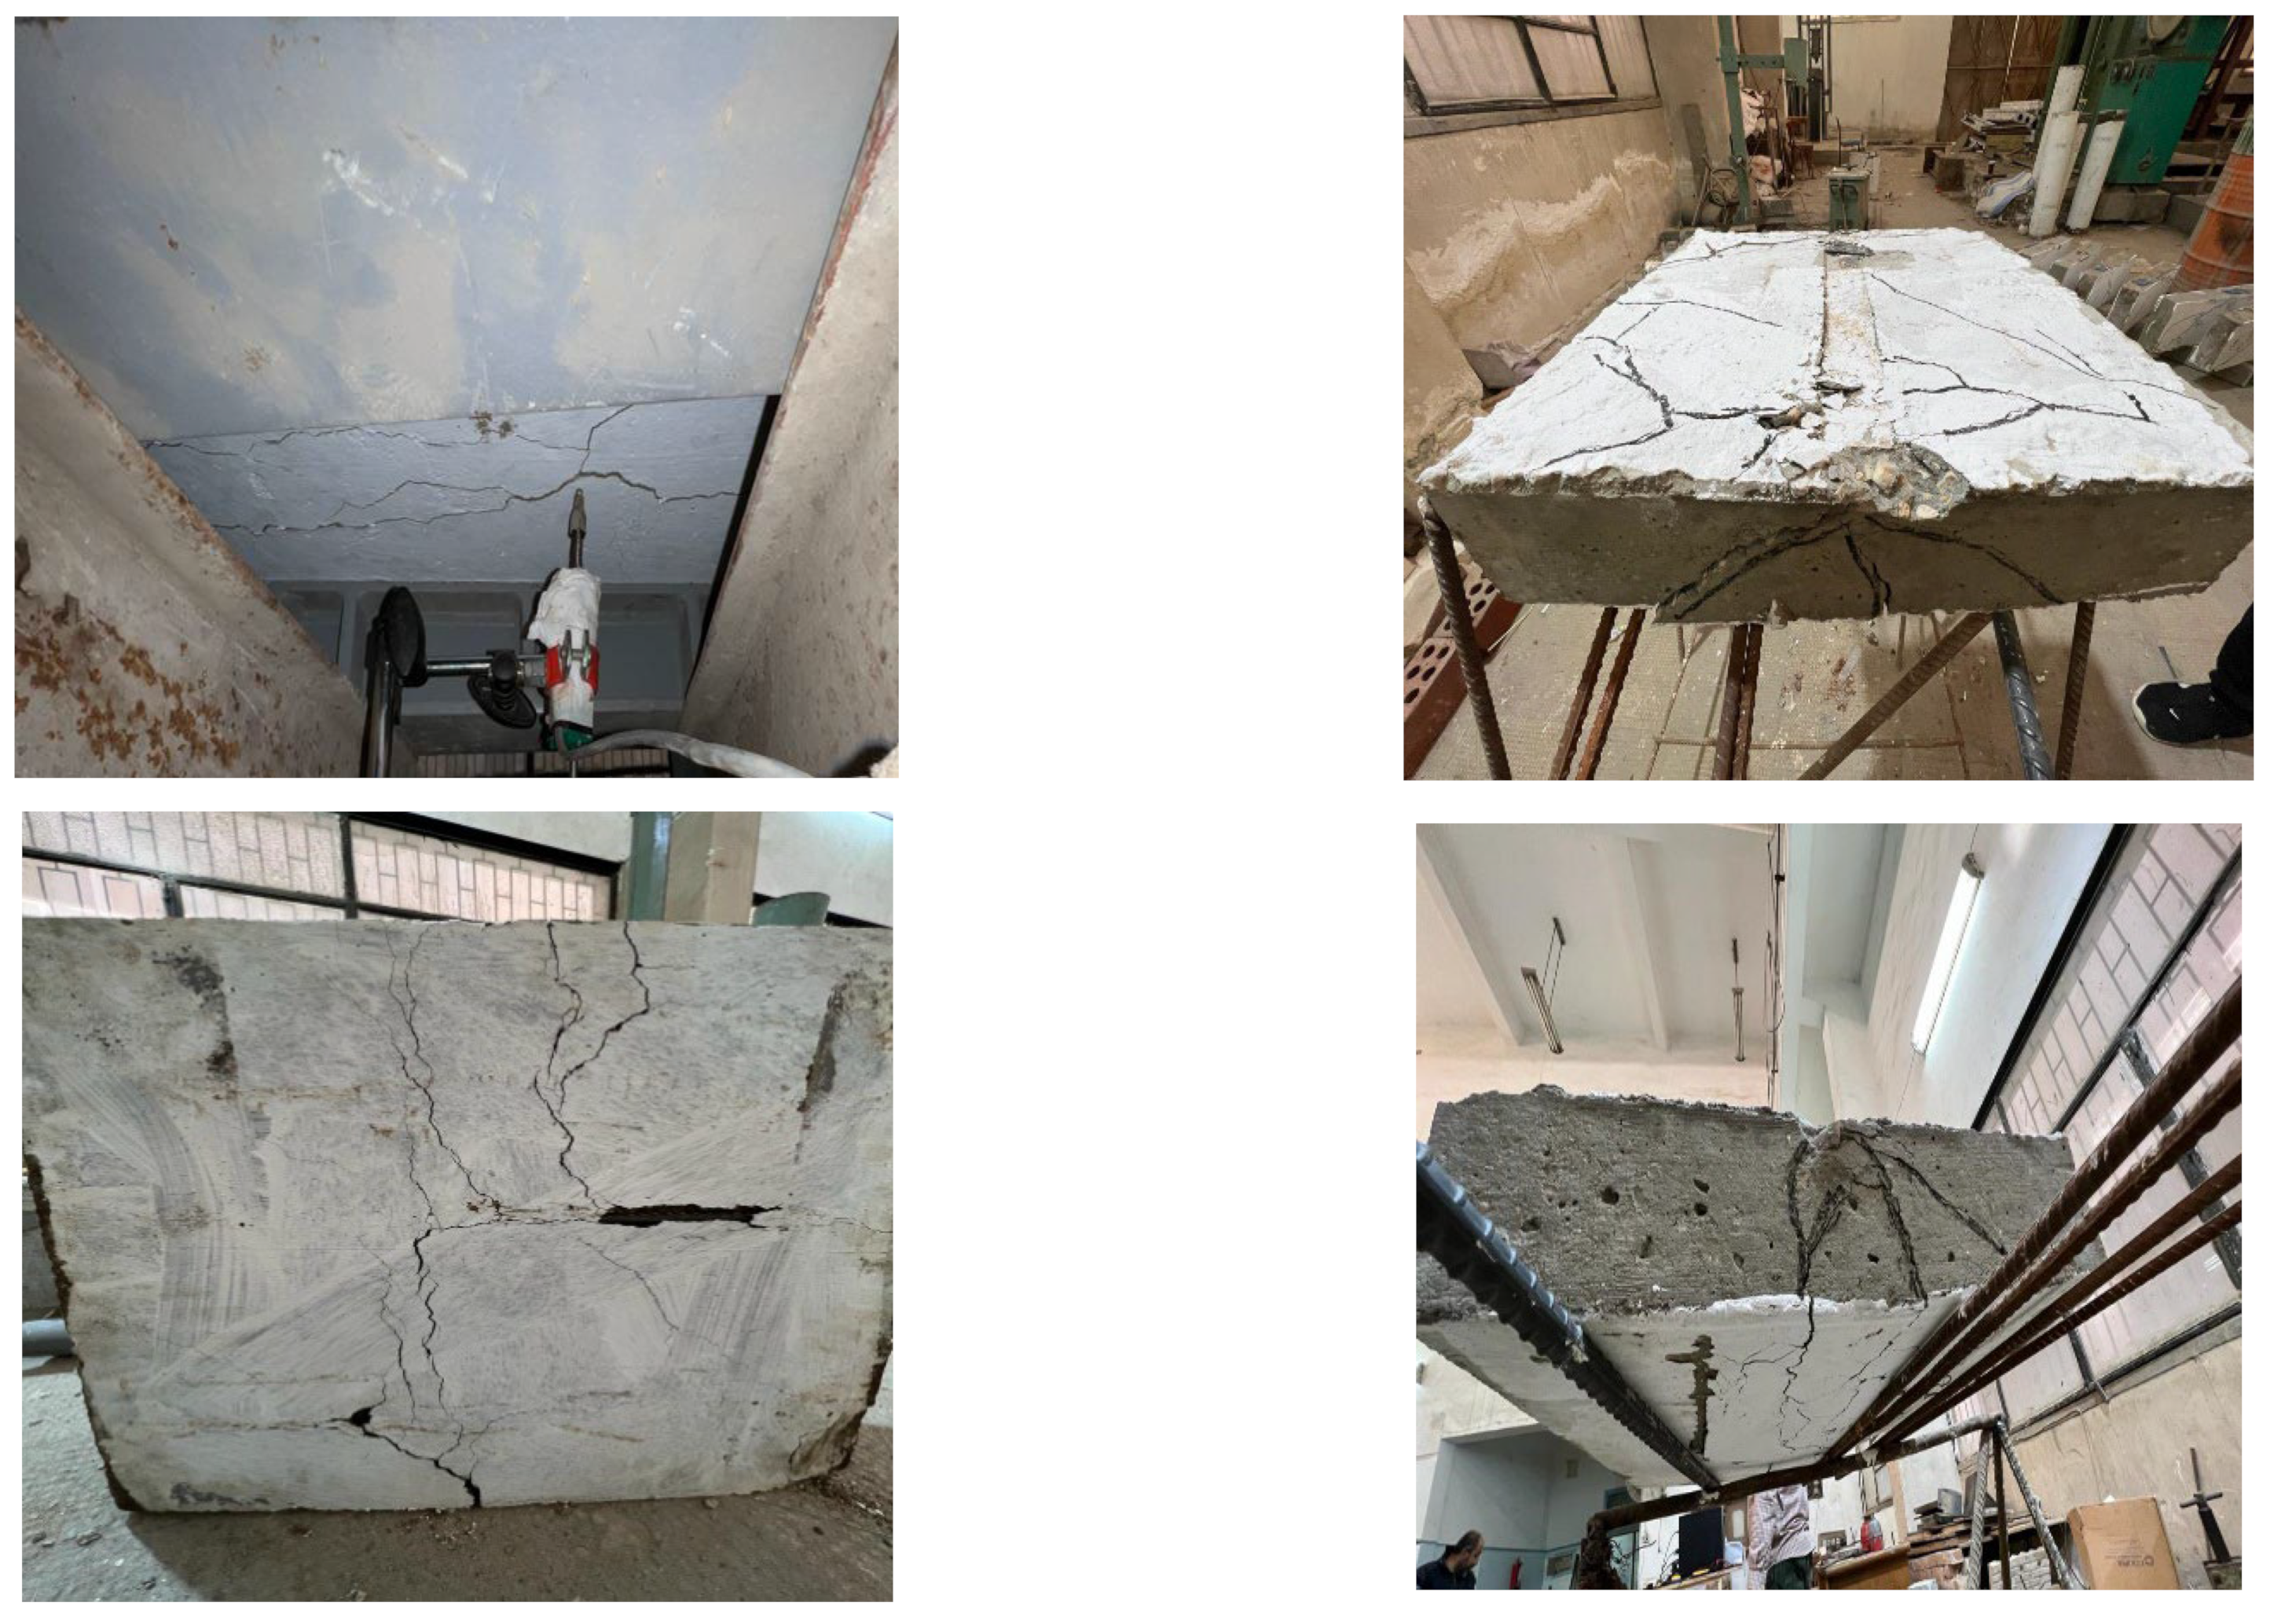
3.1. Modes of Failure of Tested Beams

Fracture patterns and the mode of failure were observed for all the tested beams. The first set of Figure 12 and Figure 13 shows two identical normal Portland cement concrete beams and two geopolymer beams with the main reinforcement of 10 mm diameter, with all beams failing in bending (tension), indicating a typical main failure under loading section. first crack occurred in the middle of the span on the tension side under an average load of 45 kN for conventional concrete and 34 kN for geopolymer concrete with a reduction of 24%; the average ultimate load was 60 kN for ordinary concrete and 55 kN for geopolymer concrete with a reduction of 8%; the deflection at failure was 4 and 3 mm, and the ultimate elongation load values were 0.0032 and 0.0025 for ordinary and geopolymer concrete, respectively.
The second set (Figure 14 and Figure 15) shows two normal Portland cement concrete beams and two geopolymer beams with the main reinforcement of 12 mm diameter. Both beams broke owing to concrete crushing in the compression zone at mid-span, which was followed by substantial bending. The first crack occurred under an average load of 49 kN for ordinary concrete and 37 kN for geopolymer concrete, with a reduction of 24.4%; the average ultimate load was 65.6 kN for the conventional concrete and 48 kN for the geopolymer concrete, with a reduction of 26.8%; the deflection at failure load was 4 and 4.9 mm and the ultimate elongation values were 0.0031 and 0.0023 for conventional and geopolymer concrete, respectively. The results were shown in Table 5, where the initial crack load, the ultimate load and the mode of failure of the experimental test are presented.

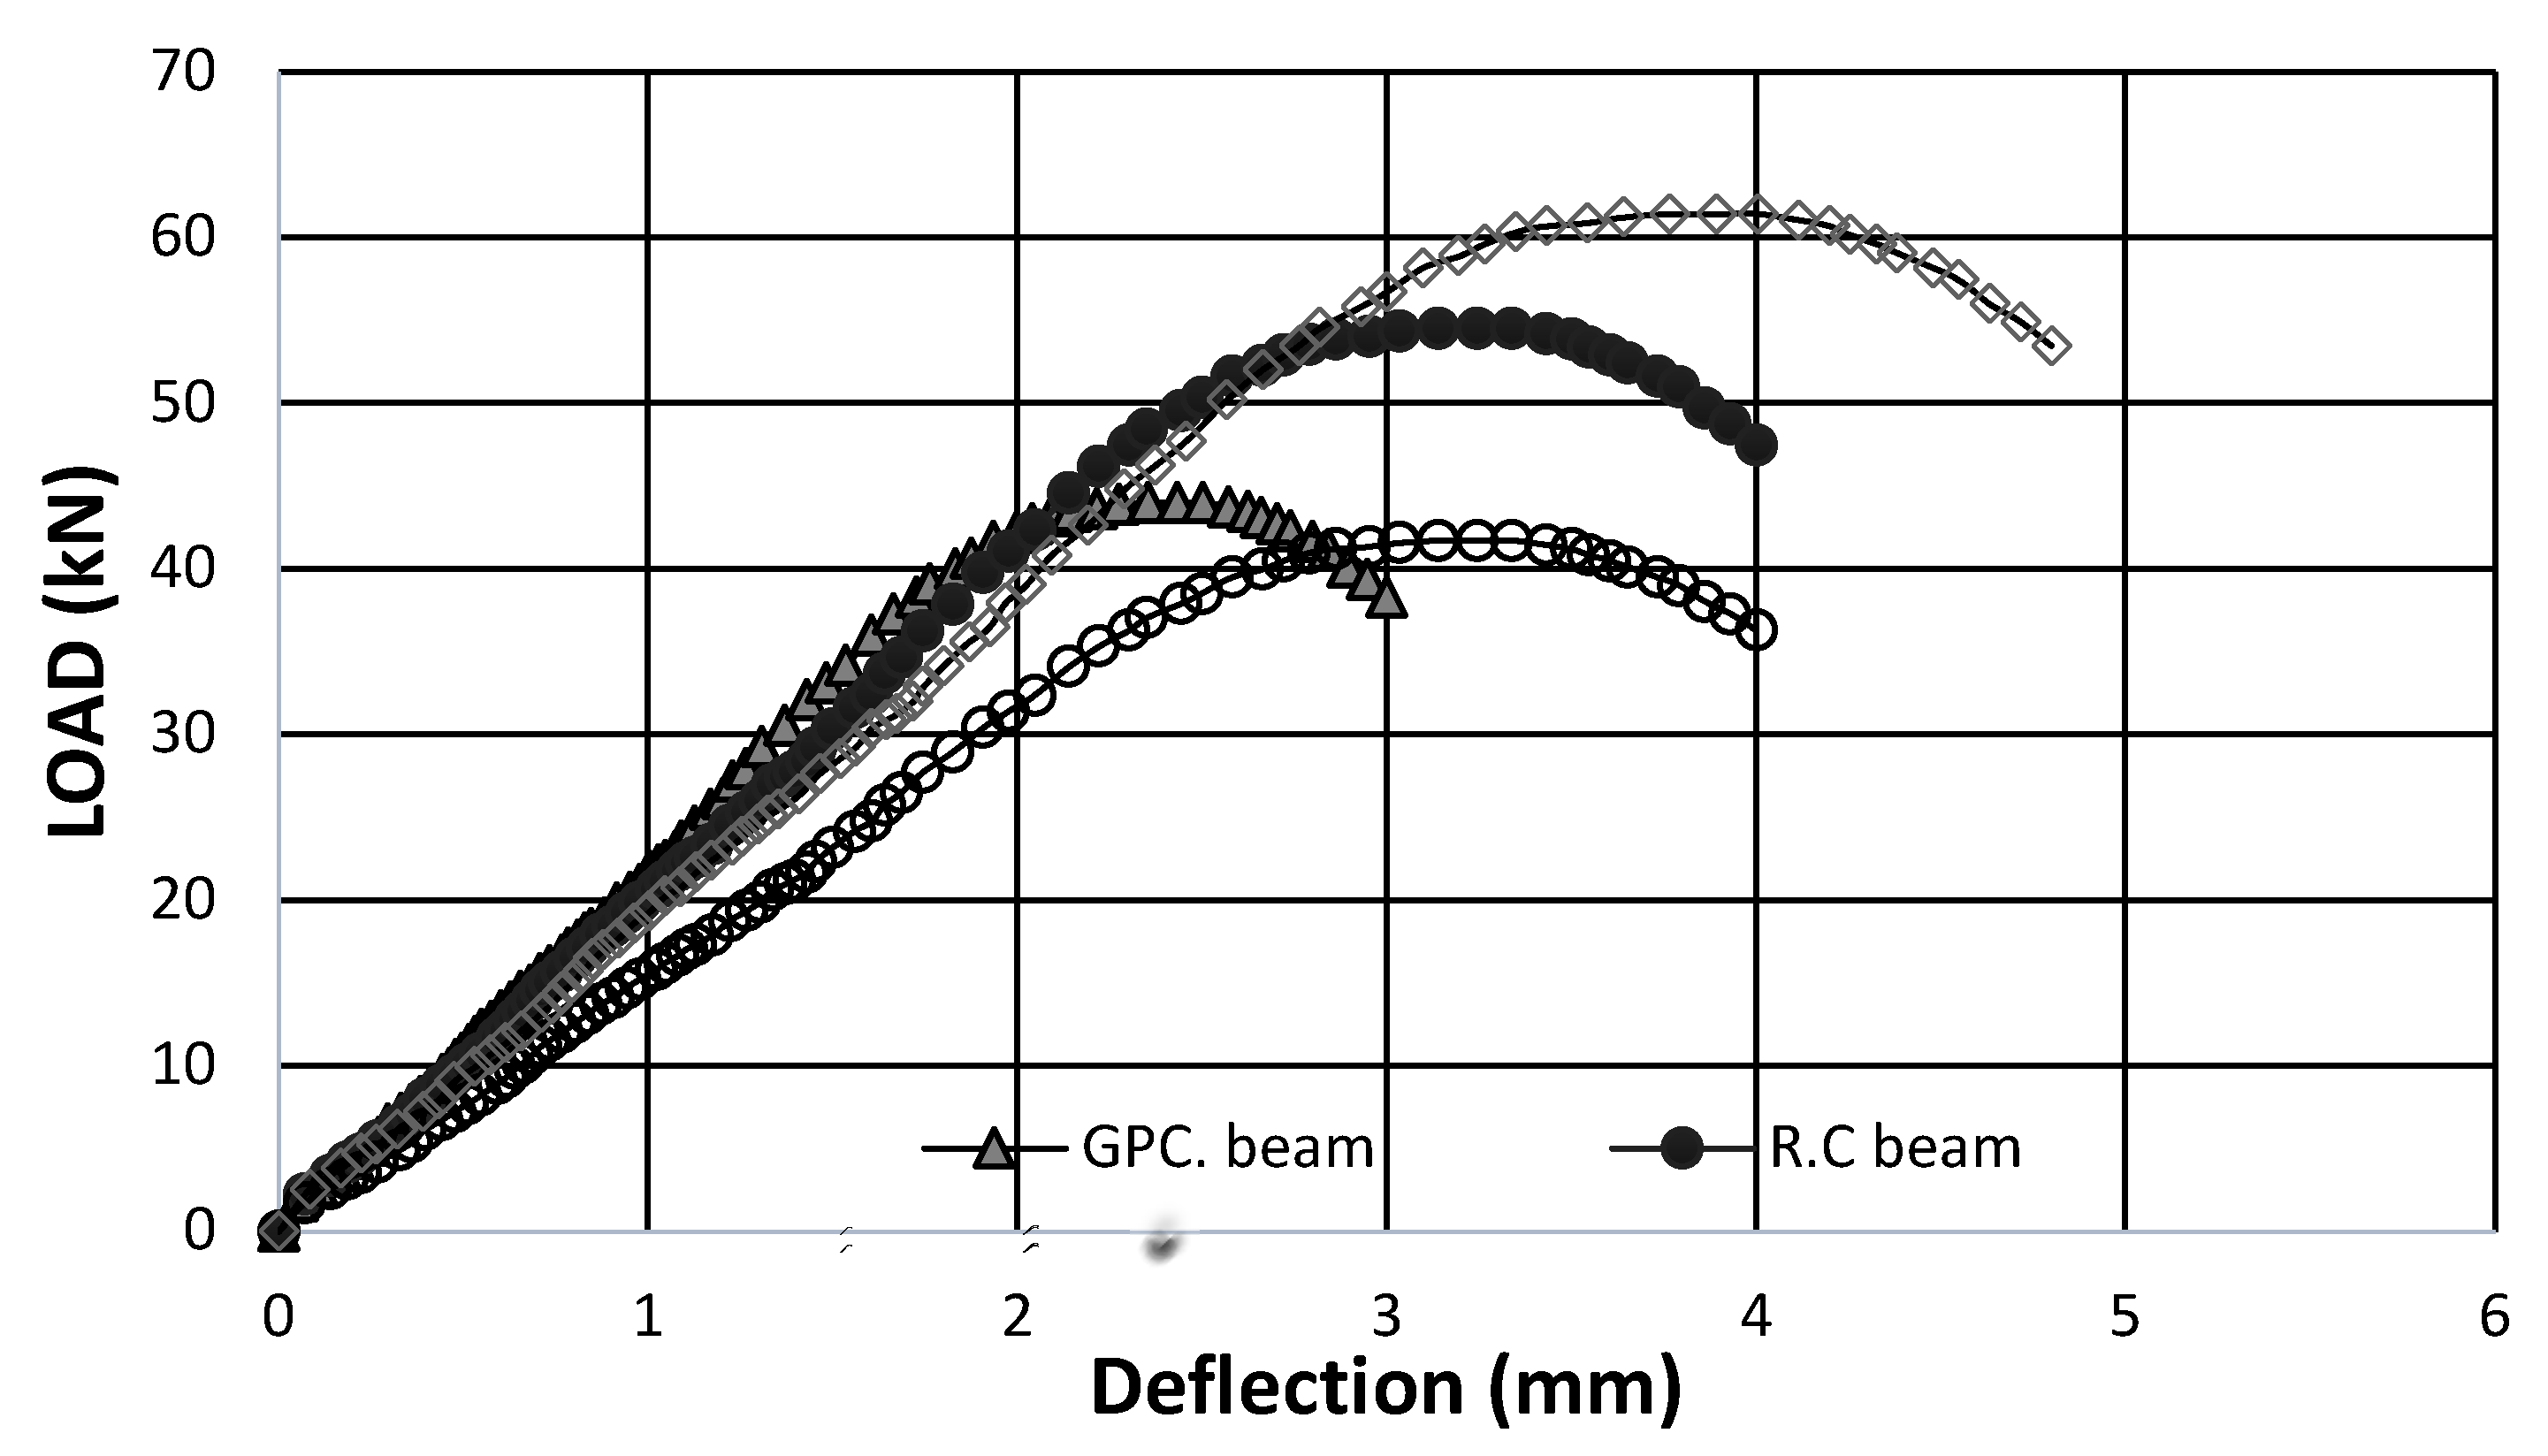
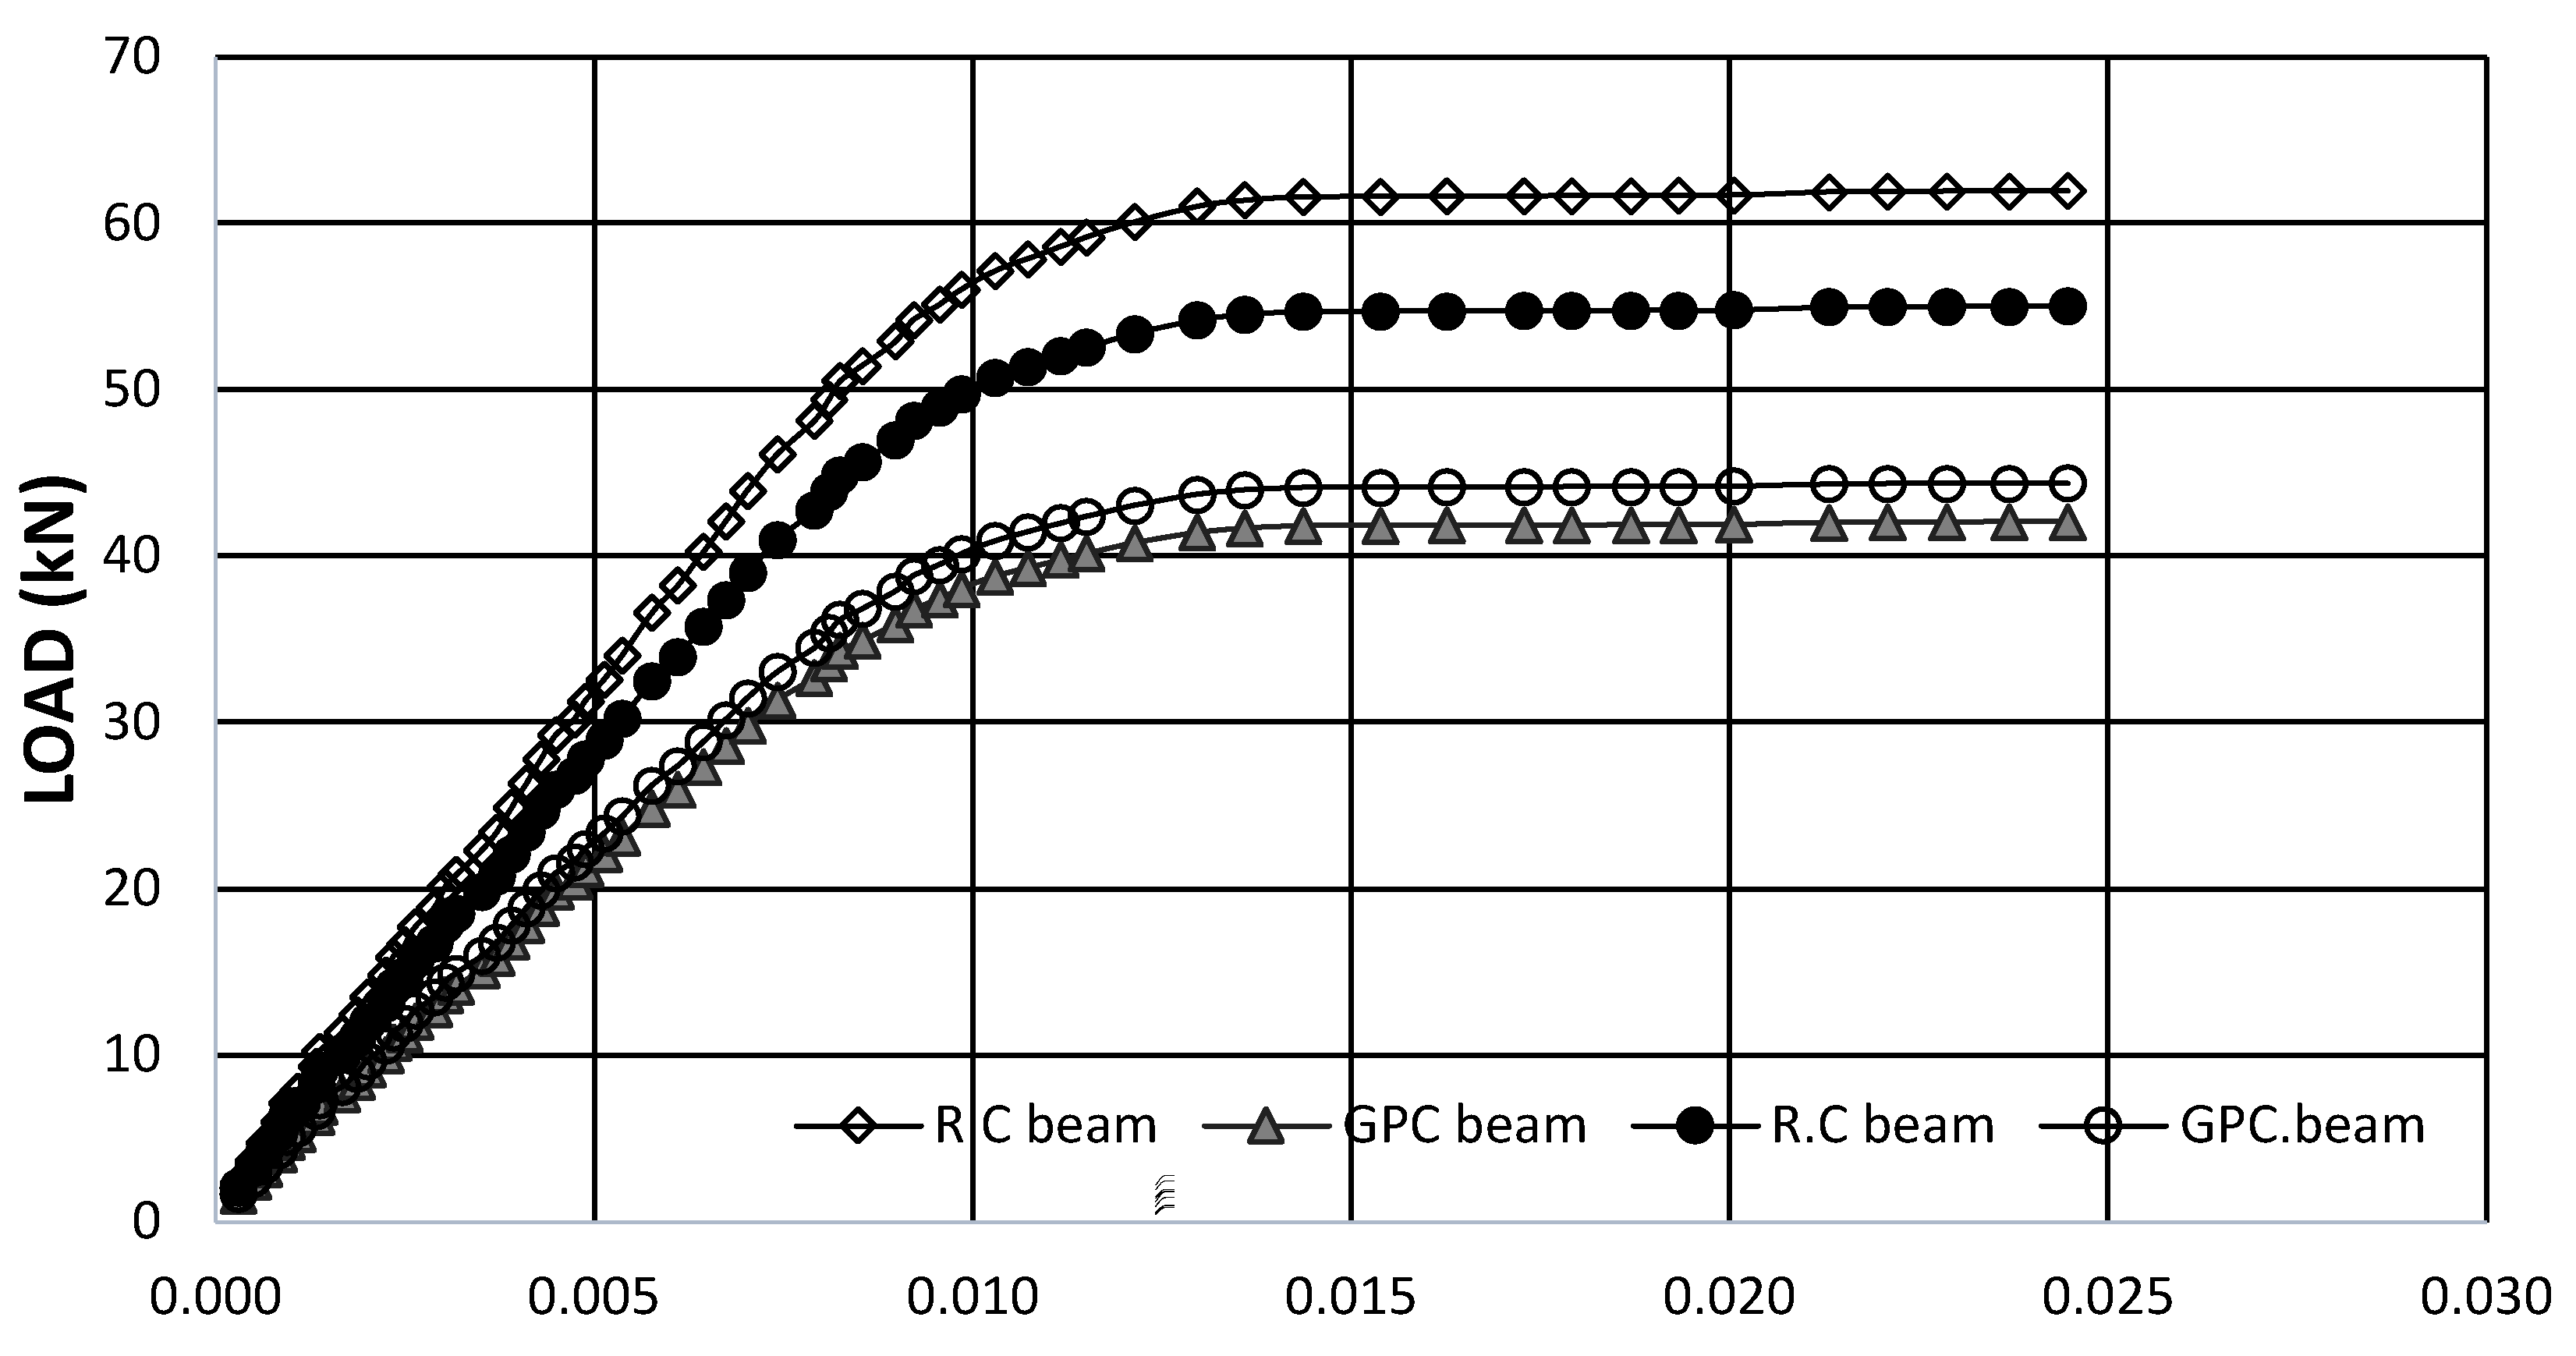
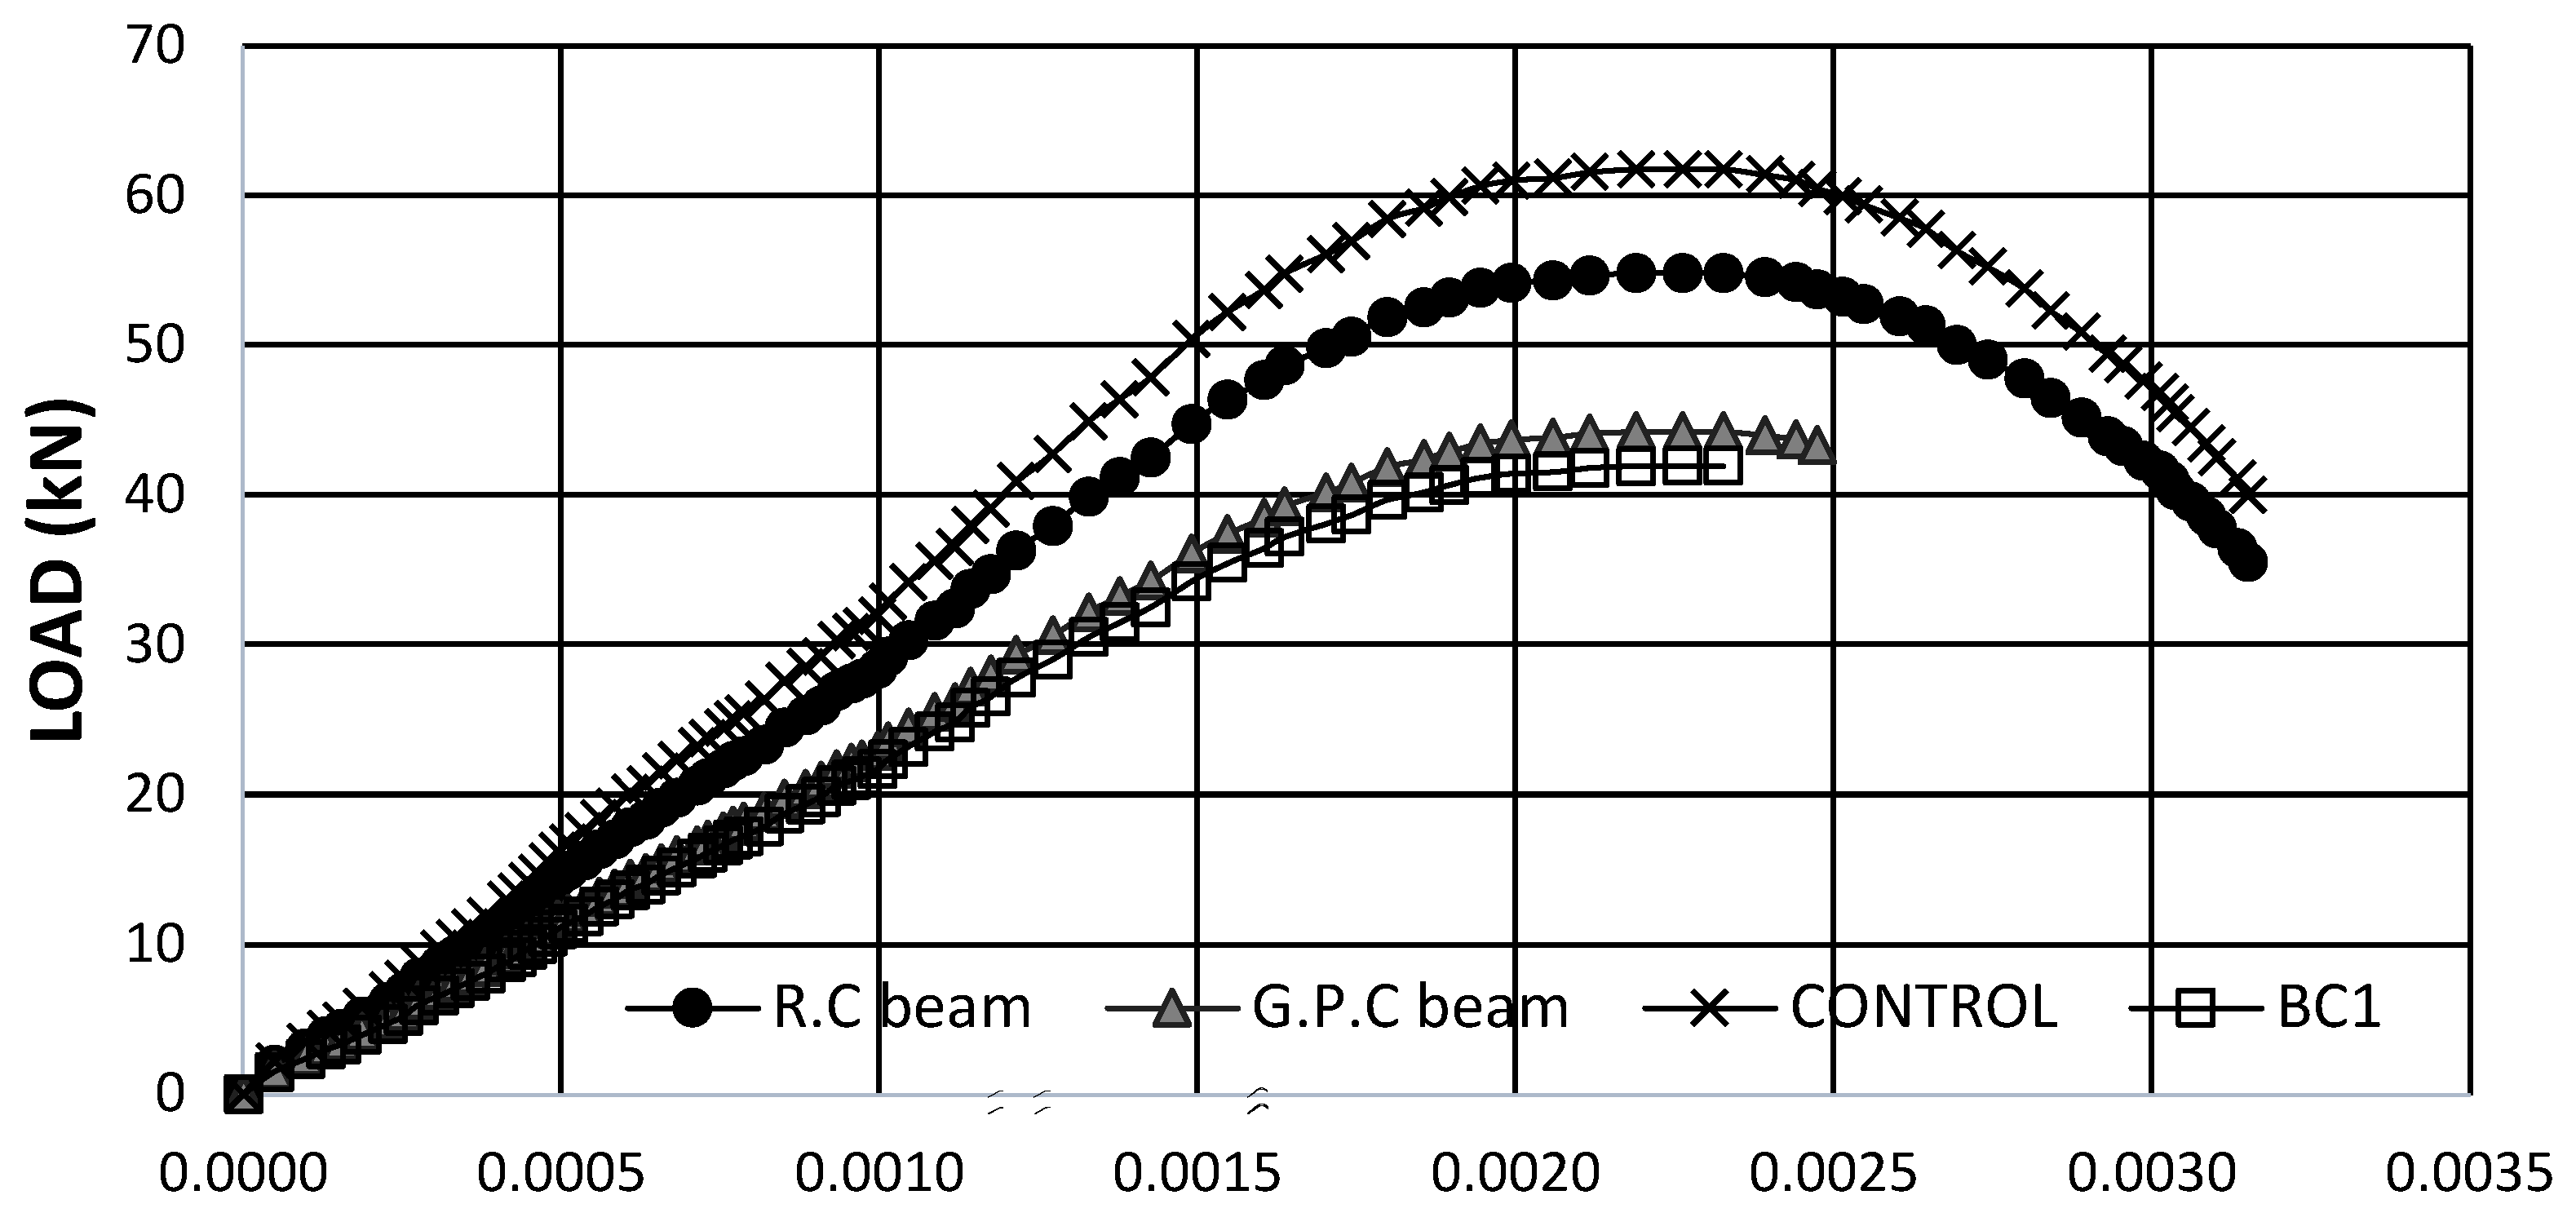
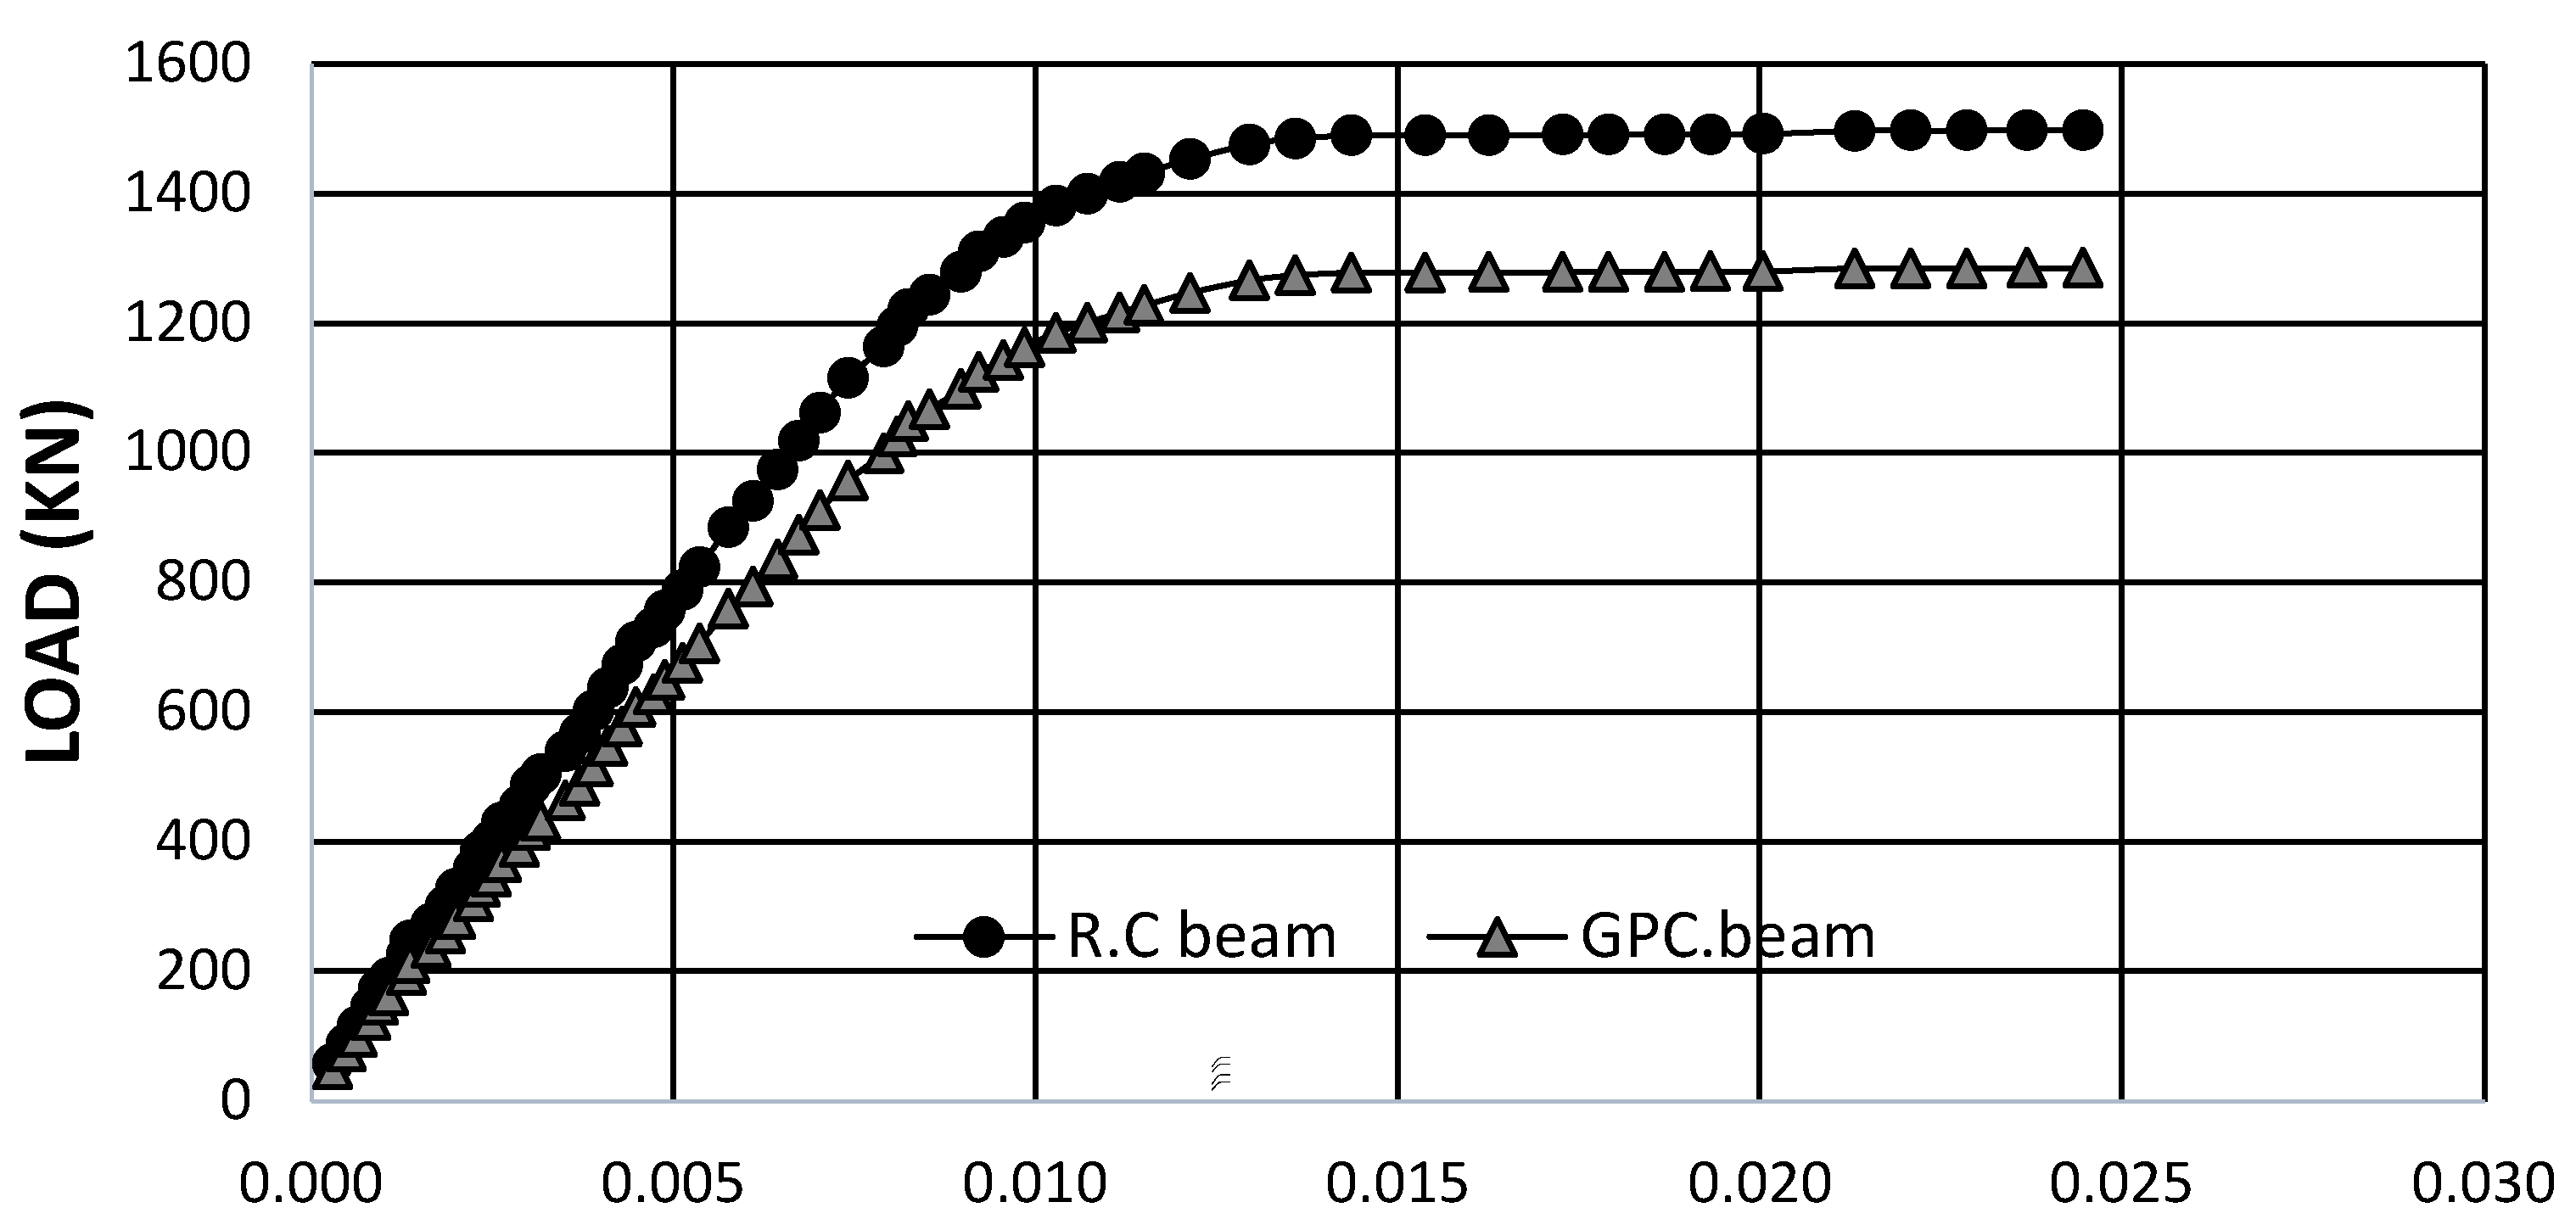
3.2. Behaviour of Test Beams

The Table 6 shows the load of the first crack, the ultimate load and the mode of failure found after the completion of the experimental tests. Geopolymer concrete beams are more brittle compared with conventional cement-based concrete, and the relationship between applied load, deflection, and strain for concrete and steel is linear for all test beams before the initial crack load, followed by a non-linear behaviour until failure. The following figures show the relationship between load-deflection Figure 16, load-strain in steel Figure 17, and load-strain in concrete Figure 18.

3.3. Mode of Failure of Tested Columns

All columns were tested without eccentricity under compressive axial stress. The geopolymer concrete columns failed in a manner similar to the reinforced concrete columns, with longitudinal fissures of concrete in the compression face around the middle height of the columns depicted in Figure 19 and Figure 20.

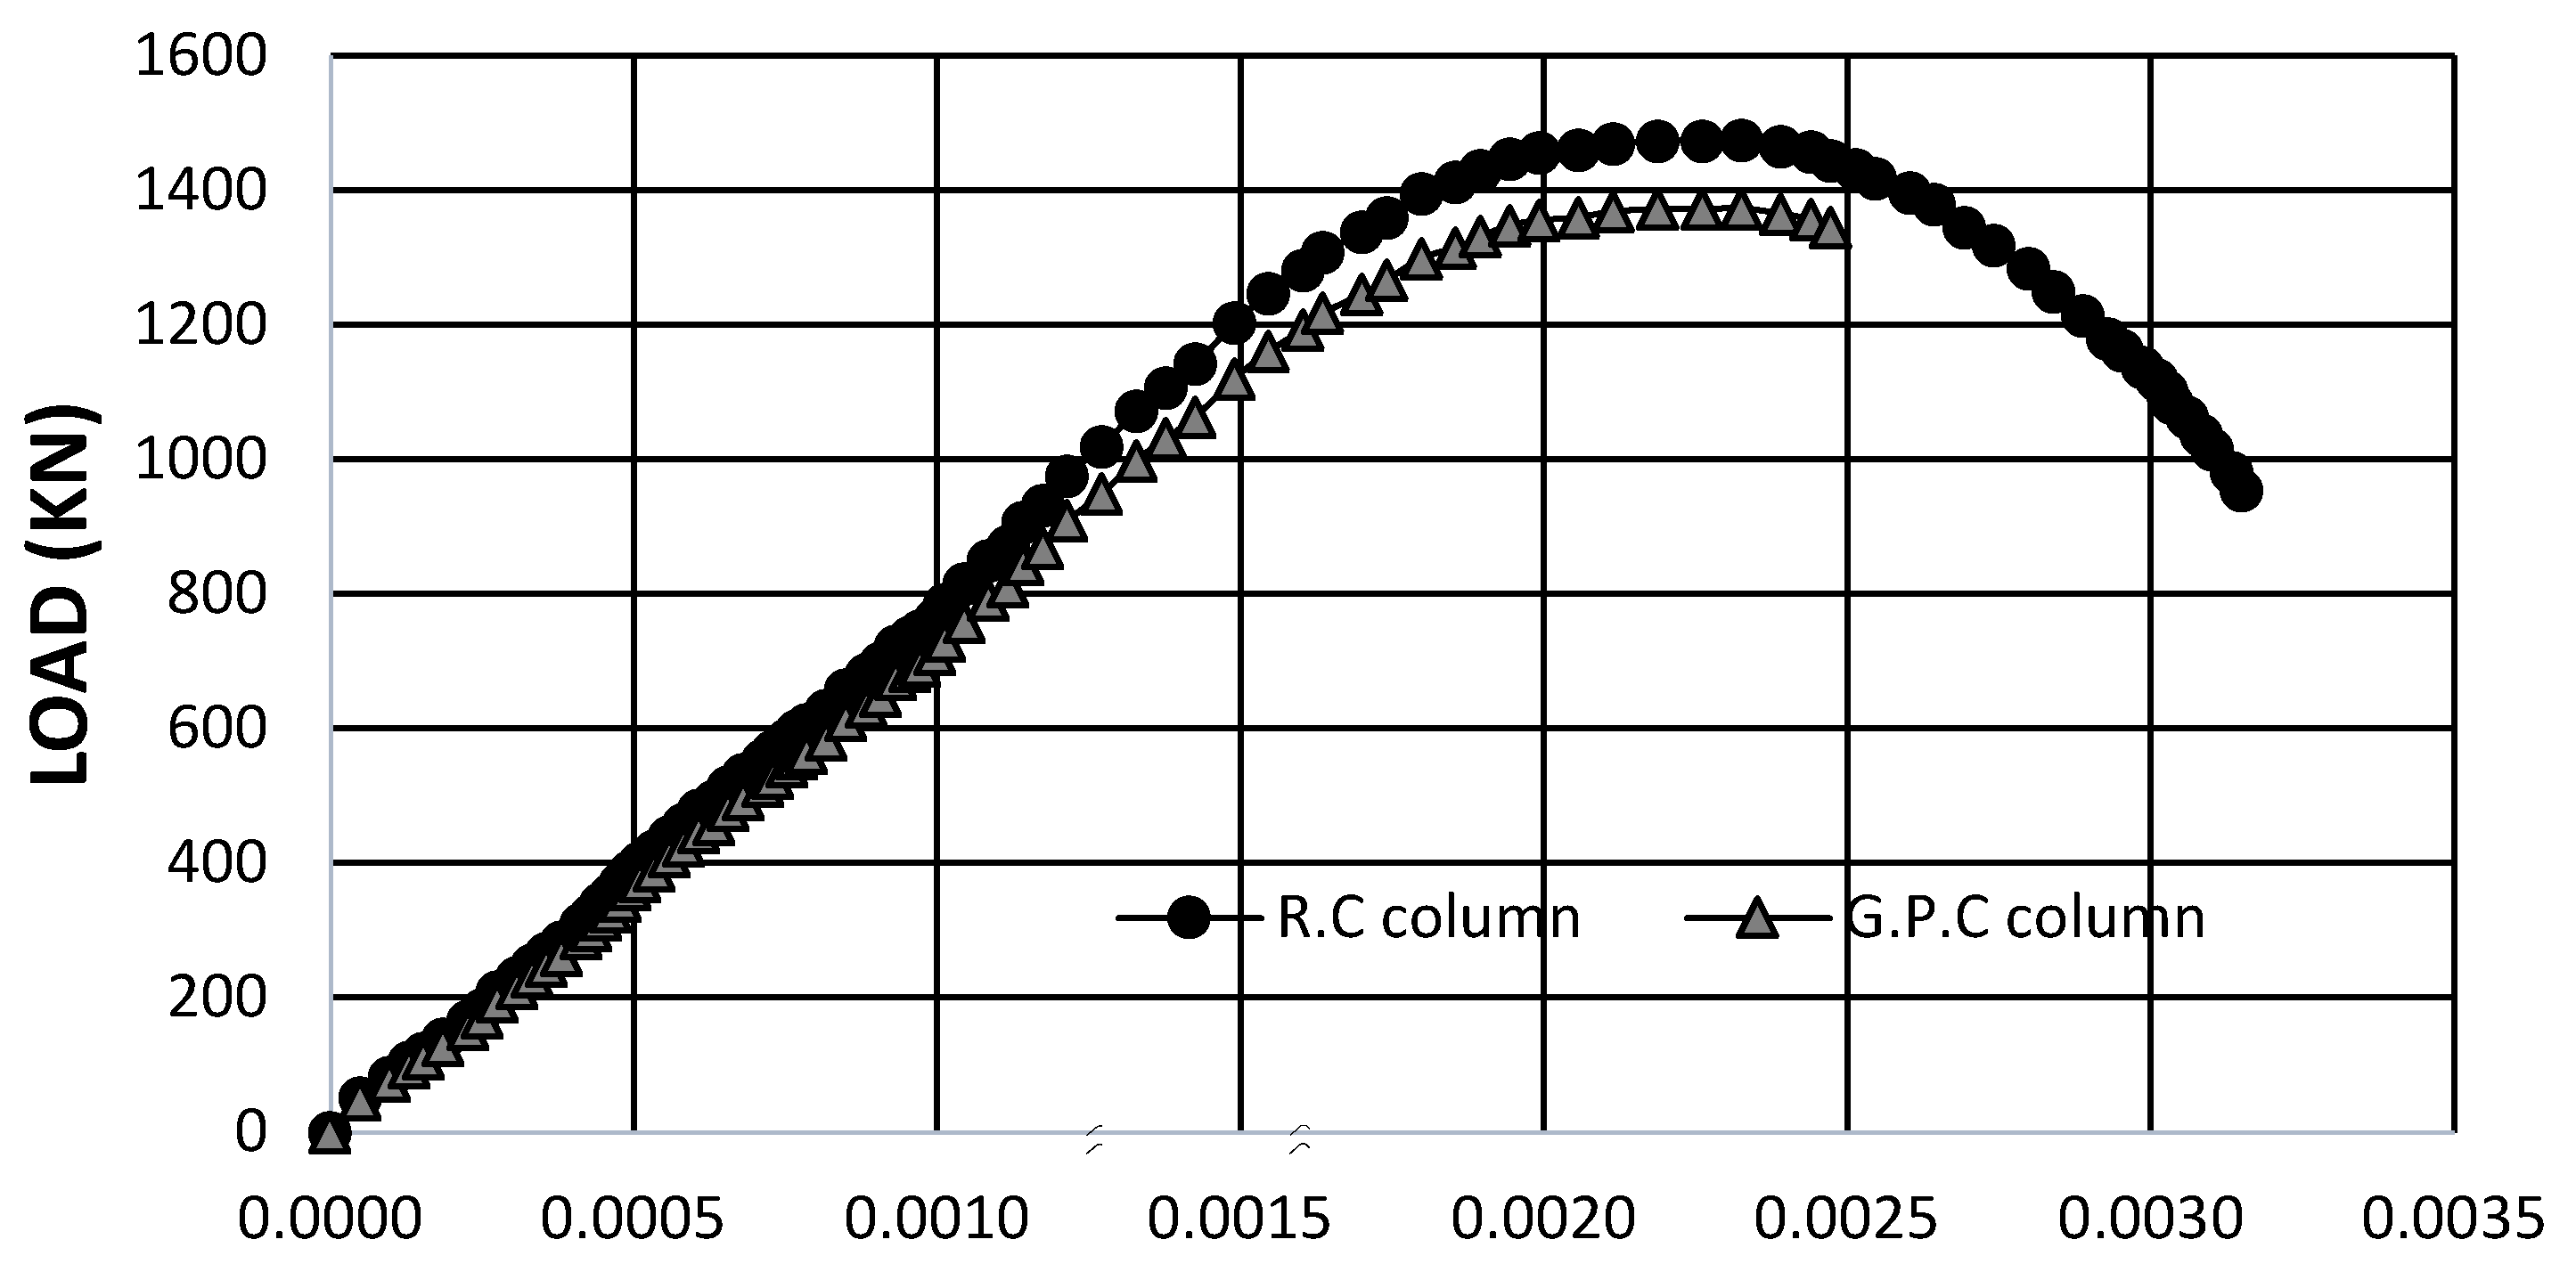
3.4. Behaviour of Columns

Three columns of OPC and three columns of GPC were tested under axial compression load. The RC columns had average initial cracking and ultimate loads of 1243 kN and 1489 kN, respectively. The average initial cracking and final loads of the GPC column were 1210 kN and 1390 kN, respectively. The ultimate elongation values were 0.0031 and 0.0025 for conventional and geopolymer concrete, respectively. Geopolymer concrete columns were shown to have up to 8% poorer load capacity and stiffness when compared to ordinary concrete columns. Load-steel strain and load-concrete strain relationships for the OPC and GP columns are shown in Figure 21 and Figure 22.

3.5. Mode of Failure of Tested Slabs

Both types of GPC and RC slabs have similar cracking patterns and modes of failure. The failure mode was the crushing of the concrete towards the edges, which was accompanied by substantial lateral deflections, with the highest values at the mid-span. The load-deflection curves were linear until the first fractures appeared, at which point they became nonlinear, Figure 23. Geopolymer concrete members are more brittle compared to conventional cement-based concrete.

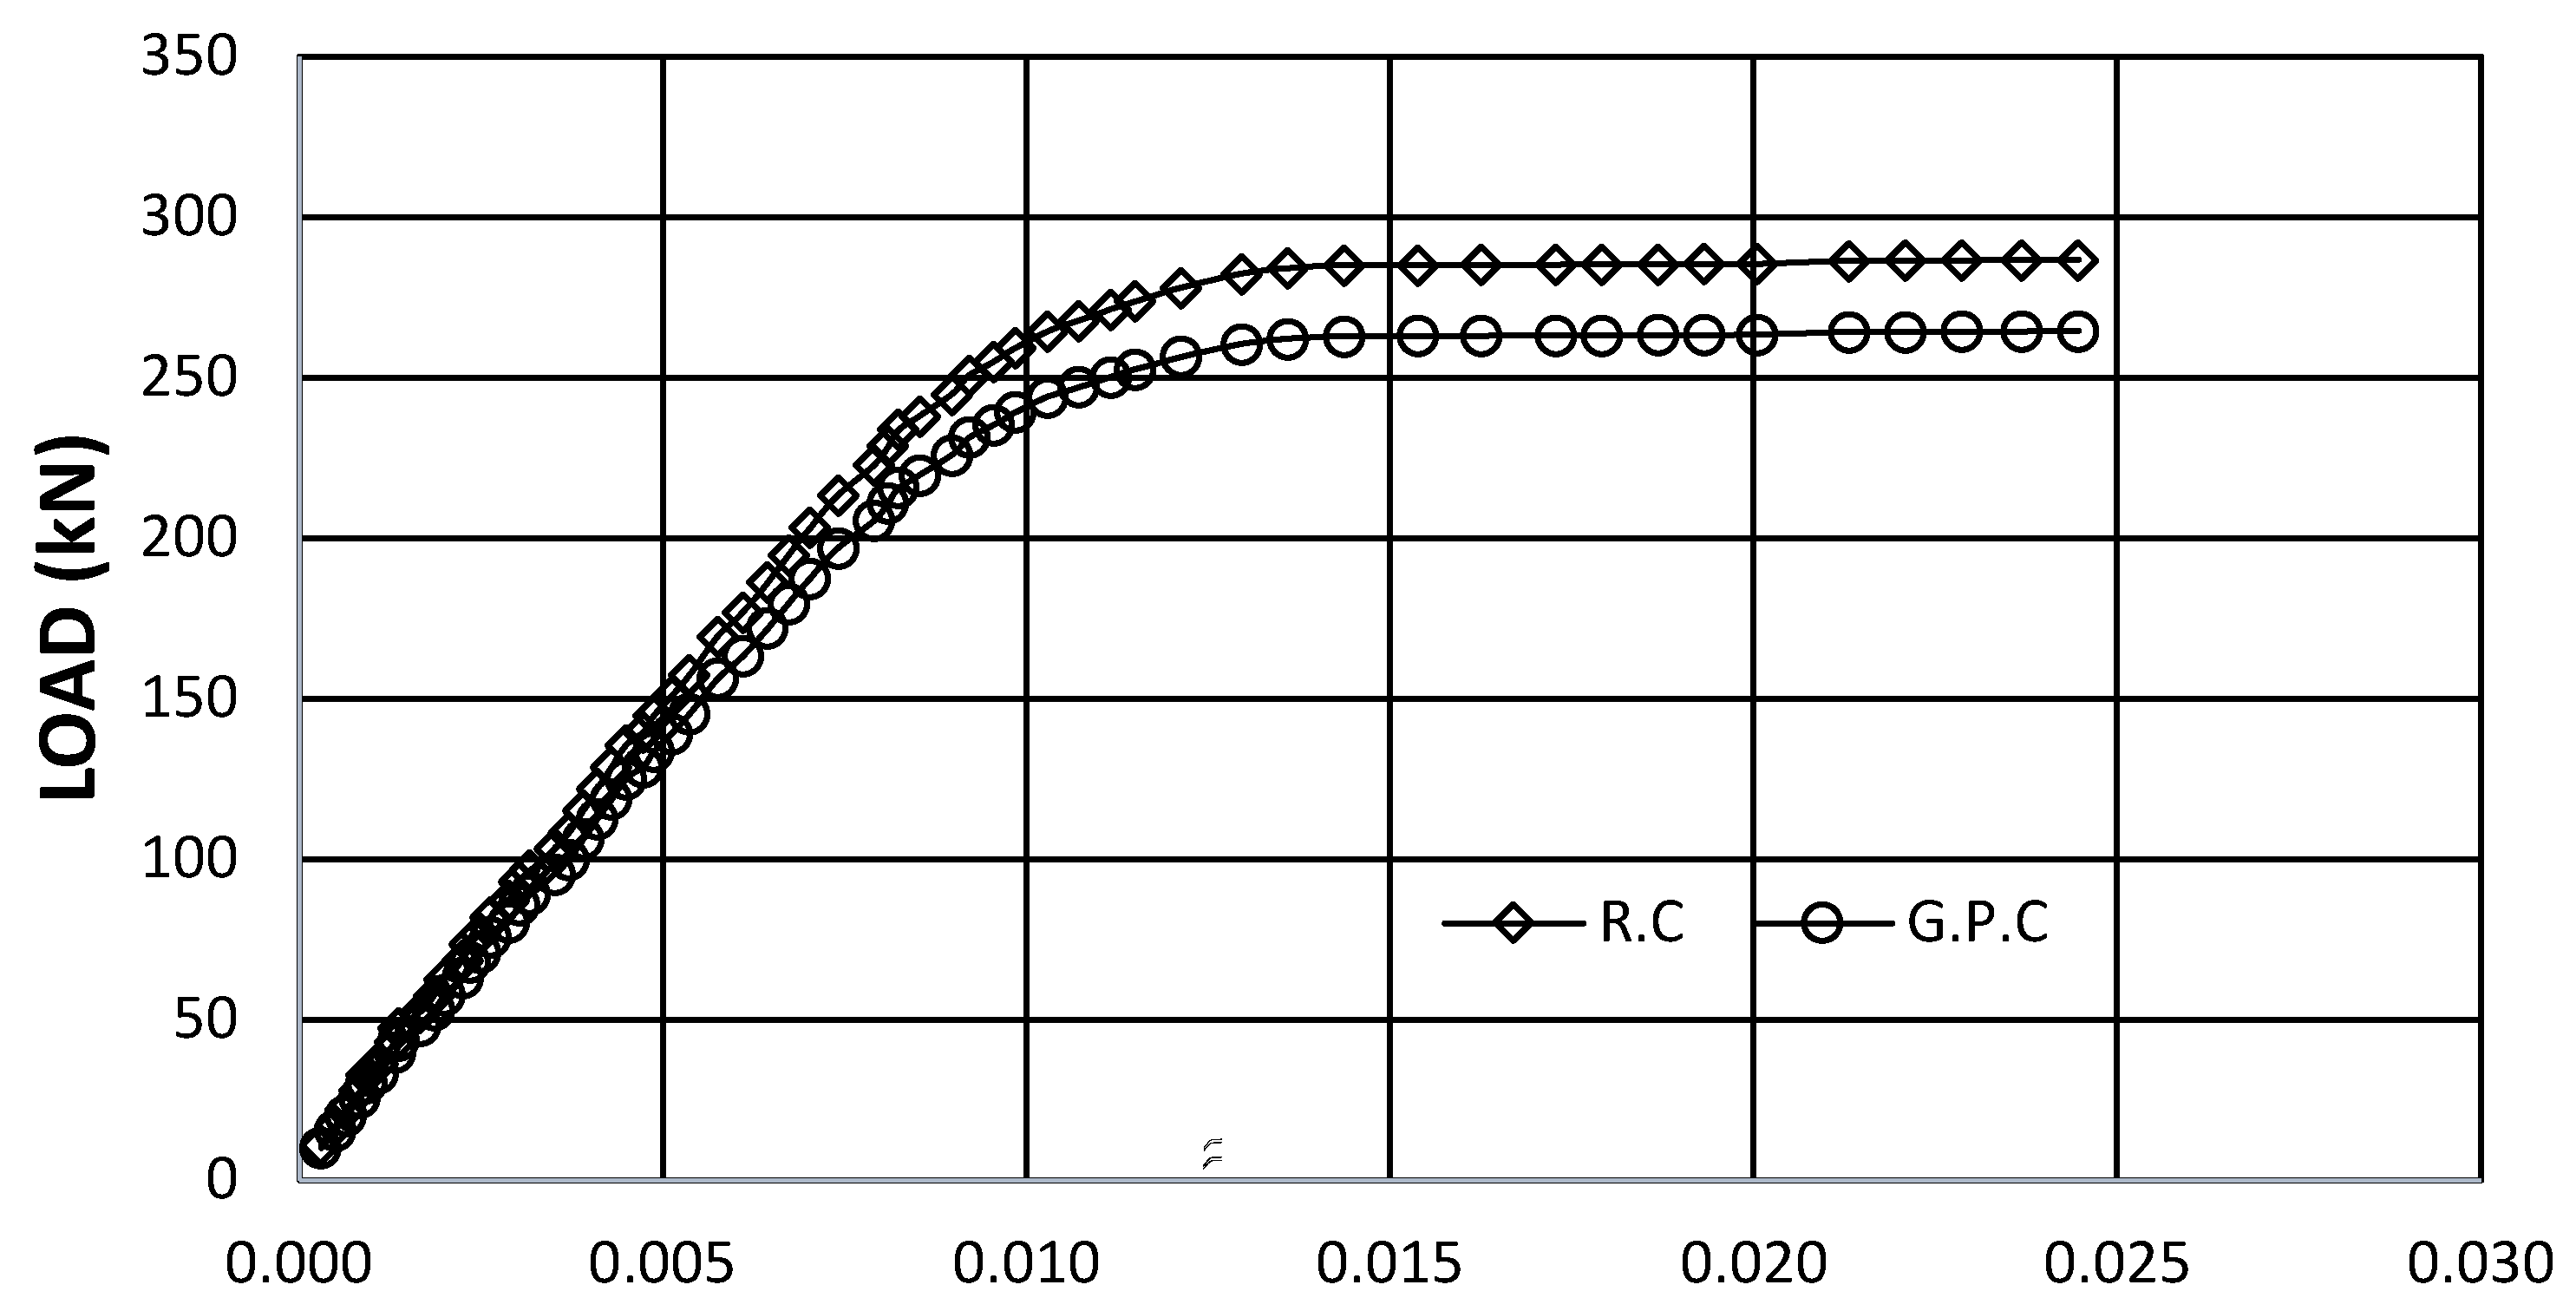
3.6. Behaviour of Tested Slabs

It has been revealed that the flexural behaviour of reinforced GPC solid slabs is comparable to that of OPC reinforced concrete slabs. From the test, it is observed that no visible cracks are formed for the load range of 15–25% of the ultimate load. The first crack occurred in the middle of the span on the tension side under an average load of 224 kN for ordinary concrete and 214 kN for geopolymer concrete with a reduction of 4.5%; the RC slab failed at a maximum load of 286 kN, while the GPC slabs failed at 262 kN with a reduction of 8.4% and the deflection at failure was 11.6 mm and 10.2 mm for conventional and geopolymer concrete, respectively. The measured deflections at failure at mid-span are shown in Figure 24, the load-steel strain relationship for OPC and GP slabs in Figure 25, and the load-concrete strain relationship in Figure 26.

4. Conclusions

This paper investigated the results of the structural behaviour and the strength of reinforced fly-ash-based geopolymer concrete members. Based on these results, the following conclusion are drawn:
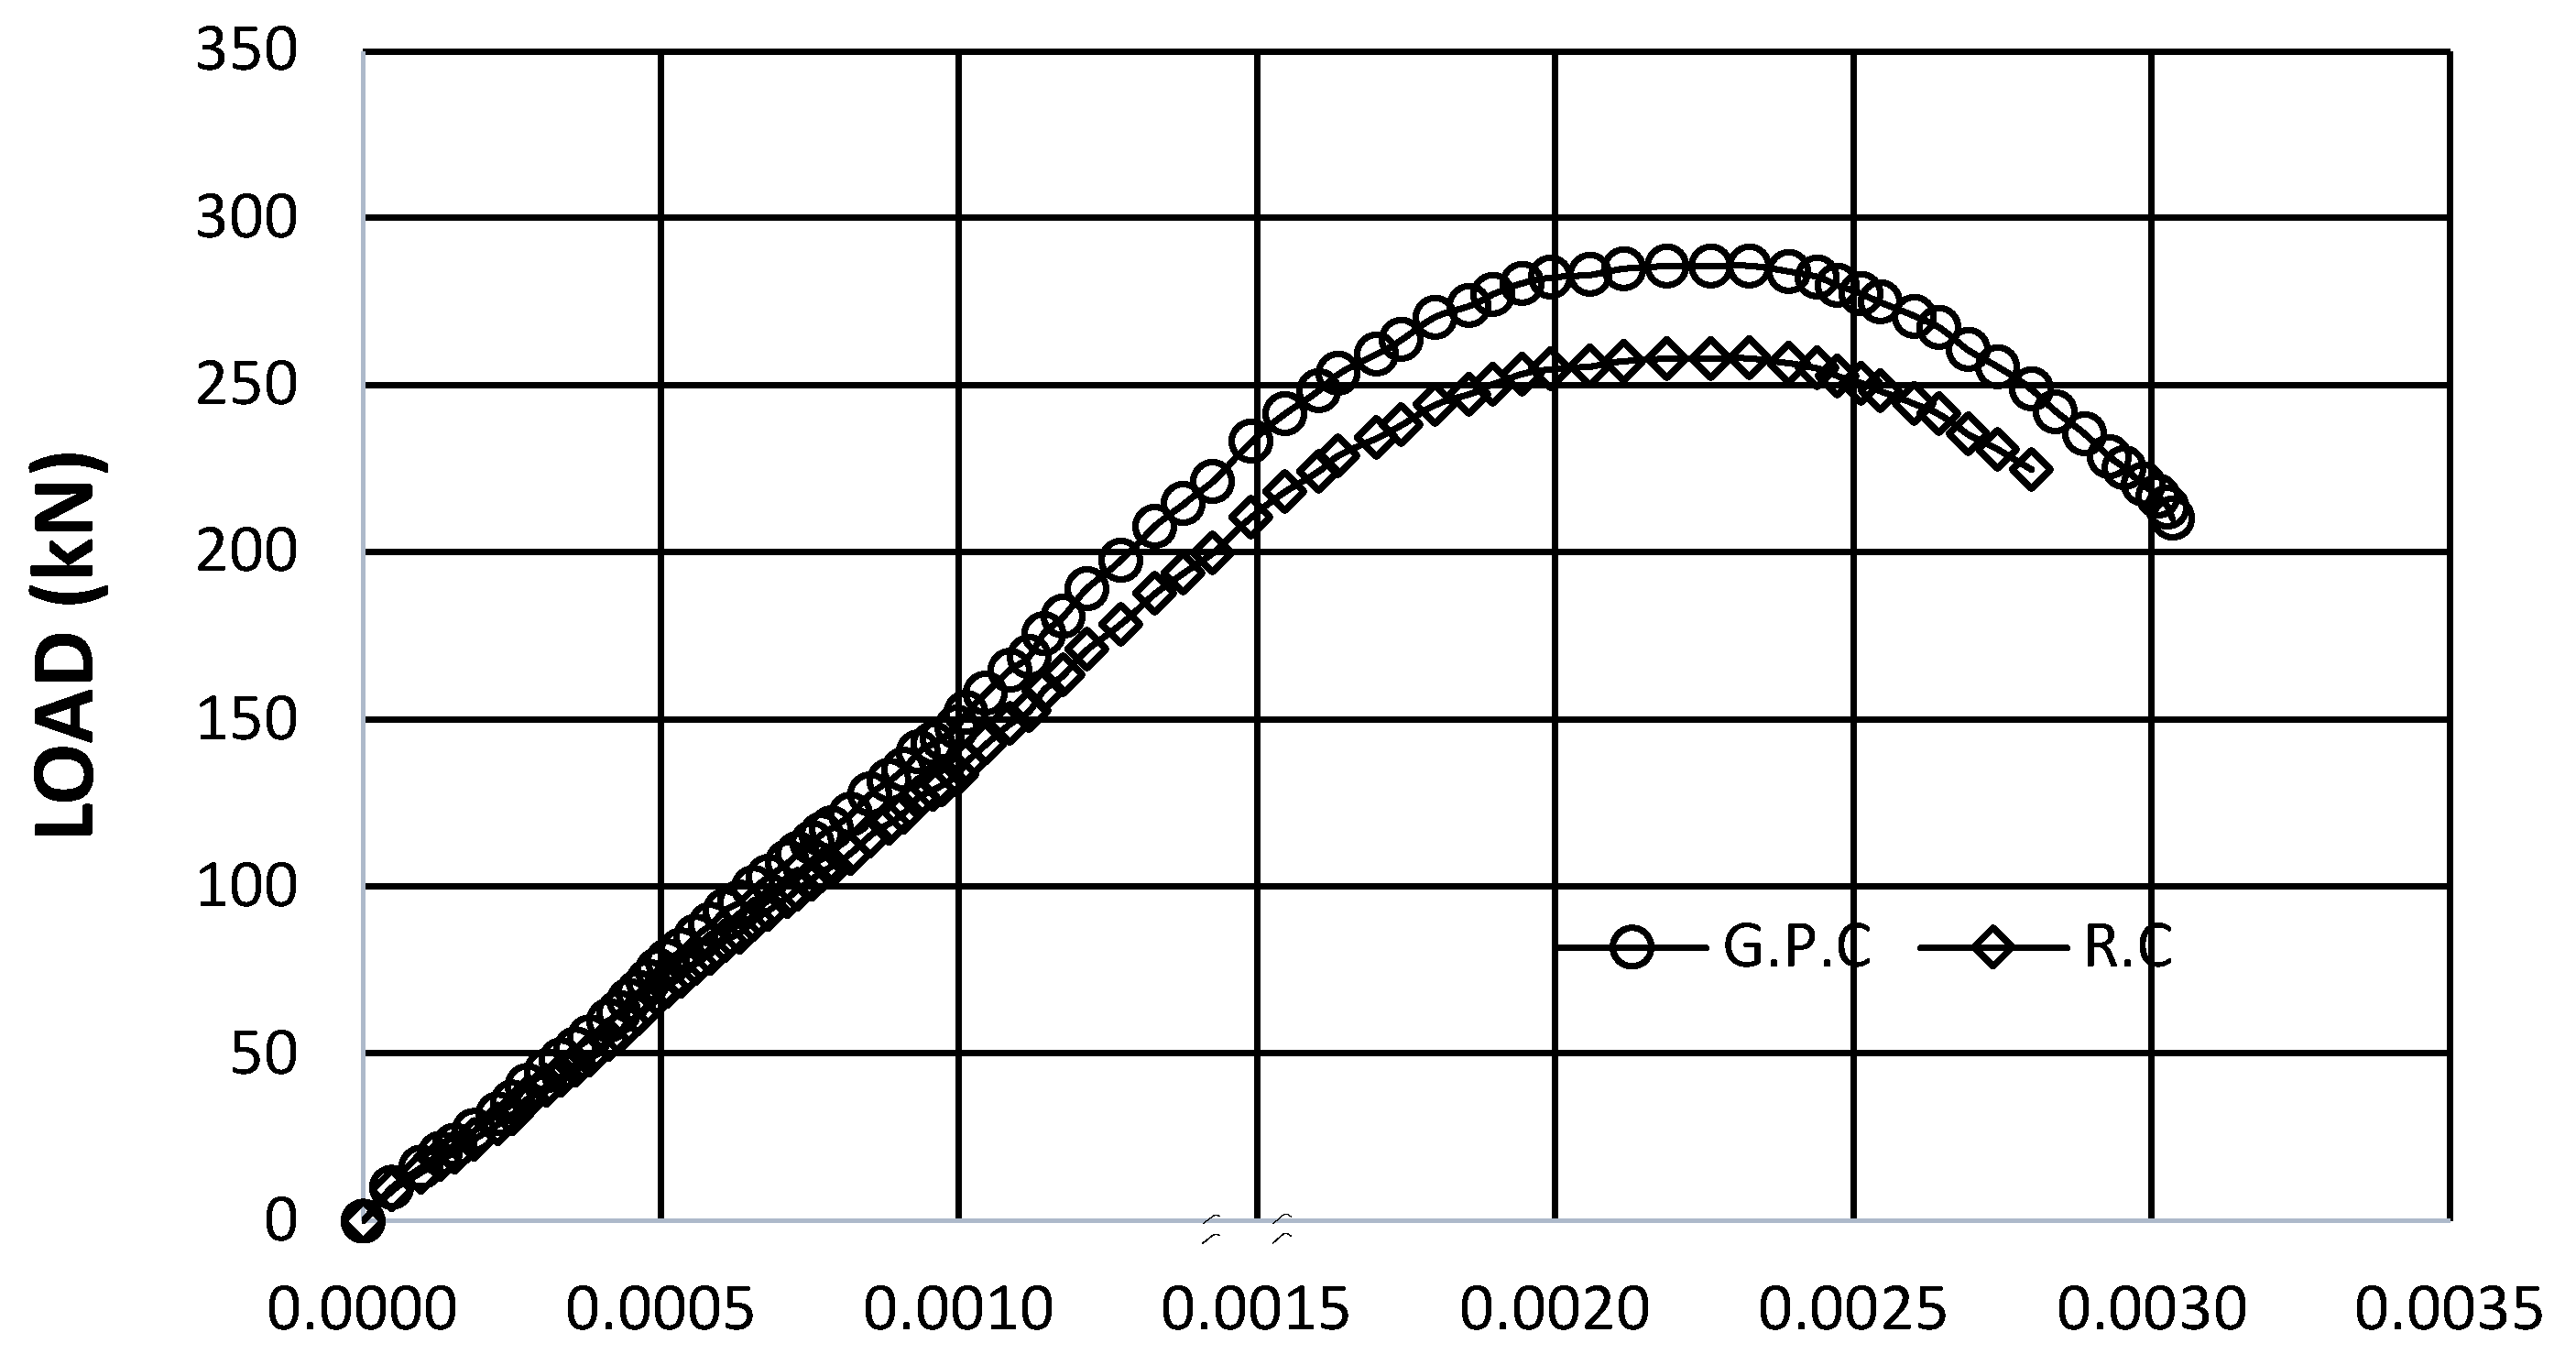
  • The load-deflection curve characteristics of GPC and OPC are nearly identical.
  • The cracking behaviour of geopolymer specimens shows that the number of cracks, the cracking region and the cracking space are more prominent in the geopolymer specimens compared with the conventional concrete specimens.
  • Fly-ash-based geopolymer concrete members responded similarly to conventional R.C beams exposed to flexural stress (initial cracking load, crack breadth, flexural stiffness, ultimate load).
  • The relationship between applied load, deflection and strain for concrete and steel is linear for all tested members before the initial crack load, followed by non-linear behaviour until failure.
  • Due to the similarity of structural behaviour of geopolymer concrete and ordinary concrete, such as load-deflection, cracking characteristics, and failure mechanism, geopolymer concrete members may be designed in the same way as conventional concrete.
  • Increase in the binder content from 250 to 350 kg/m3 and the Na2SiO3-to-NaOH ratio from 0.5:2.5 consequently increases the compressive strength by nearly 12, 19, and 34%.
  • The binder content from 250 to 350 kg/m3 and the Na2SiO3-to-NaOH ratio from 0.5:2.5 consequently leads to an increase in flexural strength by nearly 6, 22, and 35%, but still lower than Portland cement concrete.
  • Tensile strength increased by increasing the binder content and the Na2SiO3-to-NaOH ratio by 5, 8, and 27%, but also still lower than Portland cement concrete.
  • The optimum mix design to obtain maximum compressive strength, flexural strength and tensile strength occurs at an Na2SiO3-to-NaOH ratio equal to 2.5 and a fly ash content of 350 kg/m3.
  • It is preferred to prepare the sodium hydroxide solution immediately before casting so we can benefit from heat released during the preparation process in the curing of geopolymer concrete so it can start curing the geopolymer concrete at ambient temperature and decrease the time and temperature needed for curing it in the oven.

Author Contributions

Conceptualization, A.S.E. and K.M.K.; methodology, A.A.A.; software, A.A.A.; validation, A.A.A., A.S.E. and P.S.; formal analysis, A.A.A.; investigation, K.M.K.; resources, K.M.K.; data curation, A.A.A.; writing—original draft preparation, A.A.A.; writing—review and editing, A.A.A.; visualization, A.S.E.; supervision, A.S.E.; project administration, A.A.A.; funding acquisition, P.S. All authors have read and agreed to the published version of the manuscript.

Funding

This research received no external funding and the APC was funded by [Peter Sabol].

Conflicts of Interest

The authors declare no conflict of interest.

References

  1. Ali, A.; Yazdani, M.; Hosseini, M.; Akbarzadeh, H.; Farrokh, H. The prediction analysis of compressive strength and electrical resistivity of environmentally friendly concrete incorporating natural zeolite using artificial neural network. Constr. Build. Mater. 2022, 317, 125876. [Google Scholar] [CrossRef]
  2. García, J.A.; Gómez, J.F.; Castellanos, N.T. Properties prediction of environmentally friendly ultra-high-performance concrete using artificial neural networks. Eur. J. Environ. Civ. Eng. 2020, 26, 2319–2343. [Google Scholar] [CrossRef]
  3. Naran, J.M.; Eva, R.; Gonzalez, G.; Castillo, R.; Toma, L.; Almesfer, N.; Van Vreden, P.; Saggi, O. Incorporating waste to develop environmentally-friendly concrete mixes. Constr. Build. Mater. 2022, 314, 125599. [Google Scholar] [CrossRef]
  4. Nwakaire, C.M.; Yap, S.P.; Onn, C.C.; Yuen, C.W.; Ibrahim, H.A. Utilisation of recycled concrete aggregates for sustainable highway pavement applications; a review. Constr. Build. Mater. 2020, 235, 117444. [Google Scholar] [CrossRef]
  5. Anderson, D.J.; Smith, S.T.; Au, F.T.K. Mechanical properties of concrete utilising waste ceramic as coarse aggregate. Constr. Build. Mater. 2016, 117, 20–28. [Google Scholar] [CrossRef]
  6. Mohajerani, A.; Burnett, L.; Smith, J.V.; Markovski, S.; Rodwell, G. Resources, Conservation & Recycling Recycling waste rubber tyres in construction materials and associated environmental considerations: A review. Resour. Conserv. Recycl. 2020, 155, 104679. [Google Scholar] [CrossRef]
  7. Tam, V.W.Y.; Soomro, M.; Catarina, A.; Evangelista, J. A review of recycled aggregate in concrete applications (2000–2017). Constr. Build. Mater. 2018, 172, 272–292. [Google Scholar] [CrossRef]
  8. Shi, C.; Zheng, K. A review on the use of waste glasses in the production of cement and concrete. Resour. Conserv. Recycl. 2007, 52, 234–247. [Google Scholar] [CrossRef]
  9. Li, Y.; Zeng, X.; Zhou, J.; Shi, Y.; Abdullahi, H. Development of an eco-friendly ultra-high performance concrete based on waste basalt powder for Sichuan-Tibet Railway. J. Clean. Prod. 2021, 312, 127775. [Google Scholar] [CrossRef]
  10. Rehan, R.; Nehdi, M. Carbon dioxide emissions and climate change: Policy implications for the cement industry. Environ. Sci. Policy 2012, 8, 105–114. [Google Scholar] [CrossRef]
  11. Hasanbeigi, A.; Price, L.; Lin, E. Emerging energy-efficiency and CO2 emission-reduction technologies for cement and concrete production: A technical review. Renew. Sustain. Energy Rev. 2012, 16, 6220–6238. [Google Scholar] [CrossRef] [Green Version]
  12. Amran, Y.H.M.; Alyousef, R.; Alabduljabbar, H.; El-Zeadani, M. Clean production and properties of geopolymer concrete; A review. J. Clean. Prod. 2019, 251, 119679. [Google Scholar] [CrossRef]
  13. Singh, B.; Ishwarya, G.; Gupta, M.; Bhattacharyya, S.K. Geopolymer concrete: A review of some recent developments. Constr. Build. Mater. 2015, 85, 78–90. [Google Scholar] [CrossRef]
  14. Ma, C.; Zawawi, A.; Omar, W. Structural and material performance of geopolymer concrete: A review. Constr. Build. Mater. 2018, 186, 90–102. [Google Scholar] [CrossRef]
  15. Mclellan, B.C.; Williams, R.P.; Lay, J.; Van Riessen, A.; Corder, G.D. Costs and carbon emissions for geopolymer pastes in comparison to ordinary portland cement. J. Clean. Prod. 2011, 19, 1080–1090. [Google Scholar] [CrossRef] [Green Version]
  16. Hardjito, D.; Wallah, S.E.; Sumajouw, D.M.J.; Rangan, B.V. On the Development of Fly Ash-Based Geopolymer Concrete. Mater. J. 2004, 101, 467–472. [Google Scholar]
  17. Rangan, B.V. Fly ash-based geopolymer concrete: Study of slender reinforced columns. J. Mater. Sci. 2007, 42, 3124–3130. [Google Scholar] [CrossRef]
  18. Ramujee, K.; Potharaju, M. ScienceDirect Mechanical Properties of Geopolymer Concrete Composites. Mater. Today Proc. 2017, 4, 2937–2945. [Google Scholar] [CrossRef]
  19. Tanyildizi, H.; Yonar, Y. Mechanical properties of geopolymer concrete containing polyvinyl alcohol fiber exposed to high temperature. Constr. Build. Mater. 2016, 126, 381–387. [Google Scholar] [CrossRef]
  20. Patankar, S.V. Mix Design of Fly Ash Based Geopolymer Concrete. In Advances in Structural Engineering; Springer: Berlin/Heidelberg, Germany, 2015. [Google Scholar] [CrossRef]
  21. Parshwanath, R.N.; Nataraja, M.C. Sulphate resistance and eco-friendliness of geopolymer concretes. Indian Concr. J. 2012, 86, 13. [Google Scholar]
  22. Aldem, A. Experimental Behaviour of Shear-Critical Beams Produced from Geopolymer Concrete Jeopolimerik Betondan Imal Edilmiş Kesme. Master’s Thesis, Hacettepe University, Ankara, Turkey, 2021. [Google Scholar]
  23. De Oliveira, L.B.; de Azevedo, A.R.G.; Marvila, M.T.; Pereira, E.C.; Fediuk, R.; Vieira, C.M.F. Durability of geopolymers with industrial waste. Case Stud. Constr. Mater. 2022, 16, e00839. [Google Scholar] [CrossRef]
  24. Zeyad, A.M.; Magbool, H.M.; Tayeh, B.A.; Garcez de Azevedo, A.R.; Abutaleb, A.; Hussain, Q. Production of geopolymer concrete by utilizing volcanic pumice dust. Case Stud. Constr. Mater. 2022, 16, e00802. [Google Scholar] [CrossRef]
  25. Ren, J.; Chen, H.; Sun, T.; Song, H.; Wang, M. Flexural Behaviour of Combined FA/GGBFS Geopolymer Concrete Beams after Exposure to Elevated Temperatures. Adv. Mater. Sci. Eng. 2017, 2017, 6854043. [Google Scholar] [CrossRef] [Green Version]
  26. Maranan, G.B.; Manalo, A.C.; Benmokrane, B.; Karunasena, W.; Mendis, P. Behavior of concentrically loaded geopolymer-concrete circular columns reinforced longitudinally and transversely with GFRP bars. Eng. Struct. 2016, 117, 422–436. [Google Scholar] [CrossRef]
  27. Arunachelam, N.; Maheswaran, J.; Chellapandian, M.; Murali, G.; Vatin, N.I. Development of High-Strength Geopolymer Concrete Incorporating High-Volume Copper Slag and Micro Silica. Sustainability 2022, 14, 7601. [Google Scholar] [CrossRef]
  28. Fernández-Jiménez, A. Engineering properties of alkali-activated fly ash. ACI Mater. J. 2006, 103, 106. [Google Scholar]
  29. Lukey, G.C. Bond performance of reinforcing bars in inorganic polymer concrete (IPC). Adv. Geopolym. Sci. Technol. 2007, 42, 3107–3116. [Google Scholar] [CrossRef]
  30. Davidovits, J.; Quentin, S. Geopolymers Inorganic polymerie new materials. J. Therm. Anal. Calorim. 1991, 37, 1633–1656. [Google Scholar] [CrossRef]
  31. Duxson, P.; Fernández-Jiménez, A.; Provis, J.L.; Lukey, G.C.; Palomo, A.; van Deventer, J.S. Geopolymer technology: The current state of the art. J. Mater. Sci. 2007, 42, 2917–2933. [Google Scholar] [CrossRef]
  32. Verma, M.; Dev, N.; Rahman, I.; Nigam, M.; Ahmed, M.; Mallick, J. Geopolymer Concrete: A Material for Sustainable Development in Indian Geopolymer Concrete: A Material for Sustainable Development in Indian Construction Industries. Crystals 2022, 12, 514. [Google Scholar] [CrossRef]
  33. ASTM C127-15; Standard Test Method for Relative Density (Specific Gravity) and Absorption of Coarse Aggregate. ASTM International: West Conshohocken, PA, USA, 2015.
  34. ASTM C128-15; Standard Test Method for Relative Density (Specific Gravity) and Absorption of Fine Aggregate. ASTM International: West Conshohocken, PA, USA, 2015.
  35. ASTM C150/C150M-21; Standard Specification for Portland Cement. ASTM International: West Conshohocken, PA, USA, 2021.
  36. ASTM C618-19; Standard Specification for Coal Fly Ash and Raw or Calcined Natural Pozzolan for Use in Concrete. ASTM International: West Conshohocken, PA, USA, 2019.
  37. Chi, M. Effects of the alkaline solution/binder ratio and curing condition on the mechanical properties of alkali-activated fly ash mortars. J. Sci. Eng. Compos. Mater. 2016, 24, 773–782. [Google Scholar] [CrossRef]
  38. Kadlag, P.V.; Tushar, S.; Rajguru, D.; Reddy, N.; Engineering, C.; Soet, D.Y.P. Study of Fly Ash Based Geopolymer Concrete with Varying Alkaline Activator Ratio. Int. Res. J. Eng. Technol. 2017, 4, 913–917. [Google Scholar]
  39. Pane, I.; Imran, I.; Budiono, B. Compressive Strength of Fly ash-based Geopolymer Concrete with a Variable of Sodium Hydroxide (NaOH) Solution Molarity. MATEC Web Conf. 2018, 147, 01004. [Google Scholar]
  40. ASTM C109; Standard Test Method for Compressive Strength of Cylindrical Concrete Specimens. ASTM International: West Conshohocken, PA, USA, 2021.
  41. ASTM C496/C496M-17; Standard Test Method for Splitting Tensile Strength of Cylindrical Concrete Specimens. ASTM International: West Conshohocken, PA, USA, 2017.
  42. ASTM C78/C78M-21; Standard Test Method for Flexural Strength of Concrete (Using Simple Beam with Third-Point Loading). ASTM International: West Conshohocken, PA, USA, 2021.
Figure 1. Grain size distribution for the used aggregate.
Infrastructures 07 00170 g001
Figure 2. Beam reinforcement for bending failure.
Infrastructures 07 00170 g002
Figure 3. Beam reinforcement for shear failure.
Infrastructures 07 00170 g003
Figure 4. (a) slab reinforcement (side view), (b) slab reinforcement (plan view), (c). slab test setup.
Infrastructures 07 00170 g004
Figure 5. Column reinforcement.
Infrastructures 07 00170 g005
Figure 6. Geopolymer cubes and cylinders.
Infrastructures 07 00170 g006
Figure 7. All members painted white, and concrete strain gauges were installed.
Infrastructures 07 00170 g007
Figure 8. (a) beam test setup, (b) slab test setup, (c) column test setup.
Infrastructures 07 00170 g008
Figure 9. Compressive strength results compared to the control mix PC.
Infrastructures 07 00170 g009
Figure 10. Flexural strength results normalized to the control mix PC.
Infrastructures 07 00170 g010
Figure 11. Splitting tensile strength results compared to the control mix PC.
Infrastructures 07 00170 g011
Figure 12. Mode Failure of Group A (R.C).
Infrastructures 07 00170 g012
Figure 13. Mode Failure of Group A (GPC).
Infrastructures 07 00170 g013
Figure 14. Mode Failure of Group B (R.C).
Infrastructures 07 00170 g014
Figure 15. Mode Failure of Group B (G.P.C).
Infrastructures 07 00170 g015aInfrastructures 07 00170 g015b
Figure 16. Load-deflection relationship.
Infrastructures 07 00170 g016
Figure 17. Load-strain curve for steel.
Infrastructures 07 00170 g017
Figure 18. Load-strain curve for concrete.
Infrastructures 07 00170 g018
Figure 19. Crack of G.P.C column.
Infrastructures 07 00170 g019
Figure 20. Crack of R.C column.
Infrastructures 07 00170 g020
Figure 21. Load–steel strain diagrams.
Infrastructures 07 00170 g021
Figure 22. Load-concrete strain diagrams.
Infrastructures 07 00170 g022
Figure 23. Cracks of tested slabs.
Infrastructures 07 00170 g023
Figure 24. Load-deflection diagram.
Infrastructures 07 00170 g024
Figure 25. Load-steel strain diagrams.
Infrastructures 07 00170 g025
Figure 26. Load-concrete strain diagrams.
Infrastructures 07 00170 g026
Table 1. The chemical analysis was performed at Zagazig University faculty of science, laboratory.
Fly AshSand
Compound.Measured Value (%)PropertyValue
SiO257.90Fineness modulus2.56
Fe2O35.07Voids (%)38
Al2O331.11Dry volume weight (t/m3)1.66
Cao1.29Specific gravity2.65
MgO0.97Clay and fine dust content1.4
SO30.05
Na2O0.09
K2O1.00
LOI0.80
CL0.04
Table 4. Structural elements, details.
Elements.IDCross-SectionMain SteelStirrups HangerStirrups
BeamsG.P.C beamsG. Beam (1)100 × 250 × 8002Ø102Ø8Ø8 @ 100 mm
G. Beam (2)100 × 250 × 8002Ø102Ø8Ø8 @ 100 mm
G. Beam (3)100 × 250 × 8002Ø102Ø8Ø8 @ 100 mm
G. Beam (4)100 × 250 × 8003Ø122Ø8Ø8 @ 200 mm
G. Beam (5)100 × 250 × 8003Ø122Ø8Ø8 @ 200 mm
G. Beam (6)100 × 250 × 8003Ø122Ø8Ø8 @ 200 mm
R.C beamsRC. Beam (1)100 × 250 × 8002Ø102Ø8Ø8 @ 100 mm
RC. Beam (2)100 × 250 × 8002Ø102Ø8Ø8 @ 100 mm
RC. Beam (3)100 × 250 × 8002Ø102Ø8Ø8 @ 100 mm
RC. Beam (4)100 × 250 × 8003Ø122Ø8Ø8 @ 200 mm
RC. Beam (5)100 × 250 × 8003Ø122Ø8Ø8 @ 200 mm
RC. Beam (6)100 × 250 × 8003Ø122Ø8Ø8 @ 200 mm
Cross-sectionMain Steel
SlabsG.P.C slabsG.Slab (1)500 × 500 × 1005 Ø10/m
G.Slab (2)500 × 500 × 1005 Ø10/m
G.Slab (3)500 × 500 × 1005 Ø10/m
R.C slabsRC.Slab (1)500 × 500 × 1005 Ø10/m
RC.Slab (2)500 × 500 × 1005 Ø10/m
RC.Slab (3)500 × 500 × 1005 Ø10/m
DiameterDepthStirrupsMain Steel
COLUMNSG.P.C columnG. col. (1)350 mm700 mmØ8@200 mm9Ø12
G. col. (2)350 mm700 mmØ8@200 mm9Ø12
G. col. (3)350 mm700 mmØ8@200 mm9Ø12
RC. columnRC.col. (1)350 mm700 mmØ8@200 mm9Ø12
RC.col. (2)350 mm700 mmØ8@200 mm9Ø12
RC.col. (3)350 mm700 mmØ8@200 mm9Ø12
Table 5. Mechanical properties.
GroupName MixtureFLY ASH ContentLSS/
NaoH
Flexural Strength (MPa)Compressive Strength (MPa)
7 Days
Compressive Strength (MPa)
28 Days
Tensile Strength (MPa)
Group (1)R0.5F2502500.54.0518.026.02.47
R1F2502501.04.3619.528.02.56
R1.5F2502501.54.1220.526.02.31
R2F2502502.04.2925.027.52.61
R2.5F2502502.55.1323.032.03.04
Group (2)R0.5F3003000.54.6221.030.02.85
R1F3003001.05.8320.532.03.13
R1.5F3003001.56.4724.035.03.32
R2F3003002.05.5223.530.02.85
R2.5F3003002.56.3920.034.03.27
Group (3)R0.5F3503500.56.7624.036.03.44
R1F3503501.06.2022.533.03.14
R1.5F3503501.56.3922.534.03.21
R2F3503502.06.0125.035.03.30
R2.5F3503502.57.0326.037.03.63
P.C --8.4922.034.54.32
Table 6. Ultimate, crack loads and failure mode.
GroupName SPCrack Load
KN
Ultimate Load
KN
Ultimate ElongationType Failure
Group AR.C B (1)45630.0036Flexural failure
R.C B (2)43560.0029Flexural failure
R.C B (3)47610.0032Flexural failure
GPC B (1)37540.0026Flexural failure
GPC B (2)32530.0023Flexural failure
GPC B (3)33580.0027Flexural failure
Group BRC.B (1)47660.0033Shear failure
RC.B (2)51680.0034Shear failure
RC.B (3)49630.0026Shear failure
GPC B (1)36480.0024Shear failure
GPC B (2)37430.0019Shear failure
GPC B (3)40530.0027Shear failure
Publisher’s Note: MDPI stays neutral with regard to jurisdictional claims in published maps and institutional affiliations.

