Article

Physical Model of Shallow Foundation under Dynamic Loads on Sands

by
Diego F. Gil
1,
Cristhian C. Mendoza
1,*,
Luis R. Vásquez-Varela
1 and
Santiago Cano
2
1
Department of Civil Engineering, Universidad Nacional de Colombia Sede Manizales, Manizales 170004, Colombia
2
Department of Geology Science, Universidad de Caldas, Manizales 170004, Colombia
*
Author to whom correspondence should be addressed.
Infrastructures 2022, 7(11), 147; https://doi.org/10.3390/infrastructures7110147
Submission received: 10 September 2022 / Revised: 30 September 2022 / Accepted: 4 October 2022 / Published: 25 October 2022
(This article belongs to the Special Issue Artificial Intelligence in Infrastructure Geotechnics)

Abstract

:
Structures built on sands worldwide, with shallow foundations, have experienced damage and collapse during and after earthquakes. Two phenomena triggered the collapse: the liquefaction phenomenon and the P-Δ effects. However, current research and practice do not fully understand granular soil behavior during liquefaction and P-Δ effects, as proven by the sum of investigations on physical models, constitutive models, and laboratory testing proposals about these topics. A question appears at this point: what is the relationship between excitation frequency, displacement amplitude, and the triggering of overturning? To cope with this issue, the authors propose to create a physical 1-g model composed of a single-degree-of-freedom oscillator (SDOFO) capable of transmitting cyclic loadings to the soil in rocking vibration mode. The measurement methodology was based on computer vision using OpenCV by Python, which allowed the “free movement” of the SDOFO. The authors use computer vision as a suitable way to obtain displacements and times without sensors placed directly in the physical model. According to the results, it was possible to define an inversely non-linear relationship between frequency, displacement amplitude, and the total cycles required to reach overturning for different effective grain-size (D10).

1. Introduction

A substantial number of seismic events have occurred worldwide, which have triggered considerable structural damage in civil works [1]. Liquefaction is a natural process where the soil exhibits fluid-like characteristics caused by an ongoing increase in pore water pressure and reduced effective stress [2]. Several quantitative and qualitative methodologies assess soil behavior under dynamic loads [3,4,5,6]. On the contrary, the P-Δ effects, also called second-order effects, which cause overturning in slender structures with rigid shallow foundations, have been studied to understand damages and collapse in structures. The P-Δ effects happen when gravity forces act through lateral displacements generated by external lateral forces (e.g., earthquakes), leading to the collapse by overcoming the critical angle (rotation angle at the state of imminent downfall, also called critical overturning rotation). Following the previous concepts, ref. [7] defined “rocking isolation” as a new paradigm for performance-based seismic design of soil-foundation-structure systems. Rocking isolation considers the benefits of the energy dissipation of the soil throughout residual settlement and rotation instead of “plastic hinging” in first-floor columns developed under seismic loading. The author also argued, based on evidence, that “soil-foundation plastic yielding under seismic excitation is unavoidable, and even in times desirable”. Other authors proposed alternative analyses to understand the soil behavior whenever dynamic loads are applied using SDOF systems with rocking vibration mode [7,8,9,10,11,12,13]. This paper considers the same scope and tries to give more insights into the overturning process triggered by earthquakes and unbalanced rotating and reciprocating parts of machines, which produce transient and steady-state dynamic loads.
This work presents a novel small-scaled physical model, which can induce cyclical loads on saturated granular soil to evaluate its behavior at overturning based on excitation frequency and soil displacement. The research involves a series of cyclic excitation tests with variable frequency and amplitude of the oscillatory movement. Cyclic excitation was applied through harmonic loads servo-controlled using an Arduino Uno plate, and recording and data processing were achieved by computer vision using Python codes. All the tests yielded overturning, i.e., the state when the soil fails because of overcoming ultimate-bearing-capacity slippage, and the P-Δ effects had increased at the point where the downfall was inevitable. As far as possible, the soil properties were homogeneous during all tests, especially the density and saturation. The paper describes the data recording, processing, assessment, and analysis.

2. Materials and Methods

2.1. Background on SDOF Models

Earthquake engineering has used SDOF models to simulate the behavior of complex structural systems [14]. A block foundation (shallow foundation) on soil medium undergoes six degrees of freedom [15]. However, the primary vibration mode of a shallow foundation during a seismic event is rocking mode, as proved by the number of papers on physical models in earthquake engineering that studied this vibration mode using an SDOF model [7,11]. The use of SDOF models to study soil behavior includes different approaches: Ref. [8] studied small-strain foundation response based on a series of centrifuge model tests; an SDOF model with a rocking mode of vibration was used to develop the investigation studying the seismic performance of shallow and embedded foundations on leveled and inclined soil.
This study aimed to verify the analytical formulations related to the shear modulus distribution with depth in sand. Other researchers studied the rocking movement. Ref. [9] investigated the experimental verification of soil-structure interaction (SSI) effects through centrifuge tests using an SDOF model with rocking vibration mode. Ref. [10] analyzed the impact of the fixed-end and flexible boundary conditions on the seismic response of shallow foundations on saturated sand in a 1-g shaking table test, including an SDOF model. Ref. [11] conducted a series of reduced-scale monotonic and slow-cyclic pushover tests on SDOF systems lying on a square surface foundation to demonstrate the effectiveness of shallow soil improvement to various depths below the foundation. Ref. [7] mentioned the benefits of “rocking isolation” as a new paradigm in the performance-based seismic design of soil-foundation-structure systems. According to this author, “Instead of imposing strict safety limits on forces and moments transmitted from the foundation onto the soil (aiming at avoiding pseudo-static failure), the new dynamic approach “invites” the creation of two simultaneous “failure” mechanisms: substantial foundation uplifting and ultimate-bearing-capacity slippage, while ensuring that peak and residual deformations are acceptable”.

2.2. Scaling Laws from Model to Prototype

The physical model development in this paper followed SDOFO principles [16] and corresponded to one of the categories summarized in [9], specifically “small and very small-scale laboratory experiments, usually conducted on soil placed in a strongbox, with the footing undergoing steady-state or transient vibrations”.
Dynamic model tests encompass two groups: tests performed under 1-g and n-g gravitational fields [17]. The proposed physical model is a small-scale one, so it allows complete control over the model’s details [18]. However, the extrapolation from model to prototype must respect several rules named scaling laws, which provide the reliability to understand the behavior of prototypes using small-scale models. Ref. [19] researched the similitude for shaking table tests on the soil-structure-fluid model in a 1-g gravitational field to interpret dynamic model tests and presented two tables that show geotechnical items and their scaling factors (prototype/model). Additionally, Ref. [19] presented two scale factors, λ, and λt, as the geometrical and time scales. Ref. [20] proposed an approach to the geometric scale factor λ as the ratio E/ρ of the scale model to prototype. This scaled factor is known as the “Cauchy condition” [21]. Based on the research above, Ref. [10] developed the scaled factors required to develop this work, summarized in Table 1. The scaling factor adopted in this work was N = 25, computed as the ratio between the length of the square foundation in the prototype and the model according to the laboratory set-up available (see Equation (1)):
N = Bp/Bm = 1000 mm/40 mm = 25
where Bm is the length of the base of the square footing in the model, and Bp is the scaled length in the prototype.
The authors used Equation (2) to compute the model’s void ratio and the prototype’s scale based on the scaling laws exposed by [10] after [19]. This equation is appropriate if the dilatancy of the sand is kept constant in the model and prototype.
em/ep = 1 + (0.052/ep) × log10(N)
where em is the void ratio of the soil in the model, and ep is the scaled void ratio in the prototype.
Ref. [18] stated that a ratio of structure dimension to particle size would be of the order of ten to assure continuity of mechanical behavior; however, such a ratio “might be too small to guarantee the correct response of the physical model”. The authors assumed the continuity of mechanical behavior, considering that the intrinsic properties of the soil are homogeneous, and the relative density and saturation conditions were constant.

2.3. Test Equipment and Set-Up

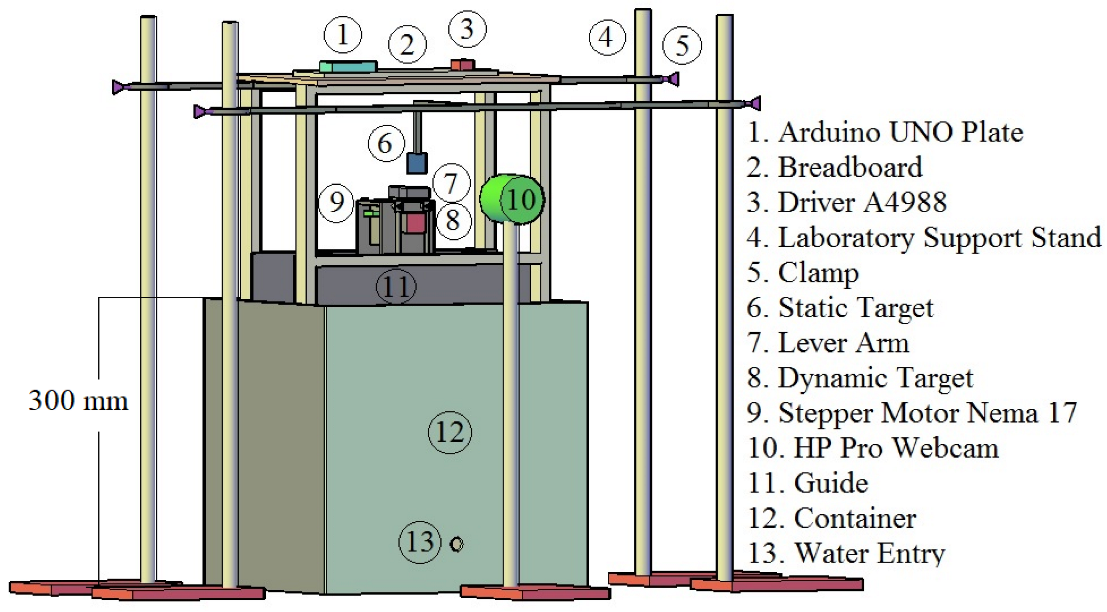
The physical model consists of three parts: (1) the electromechanical oscillator, (2) the experimental set-up around the tests, and (3) the machine vision system. Figure 1 shows the proposed physical model, and Table 4 summarizes the dimensions of the strongbox.
The electromechanical oscillator was the primary device with mechanical and electronic components. The mechanical component was comprised of a dynamic red target of 20 by 20 mm, bearings, column, lever arm, square footing (shallow foundation), and sandpaper. The electronic component controlled the oscillatory movement of the actuator, and they were a stepper Nema 17 bipolar 0.4 amperes motor, an Arduino UNO plate (microcontroller board), an A4988 driver (micro-stepping motor driver), and a breadboard. Figure 2 exposes the parts of the electromechanical oscillator.
Although shallow foundations are usually built with reinforced concrete, in physical model experiments, they are usually made with higher-density materials, such as steel, to provide the required contact pressure representing an actual building on the prototype scale, following the similitude laws by [10]. The authors built the shallow foundation and column with steel to satisfy this requirement. The bottom face of the shallow foundation, which was in direct contact with soil, was roughened with a glued sandpaper sheet to provide friction between the soil and the footing; thus, there was no sliding, as proposed by [10]. Table 2 summarizes the actuator’s parameters.
The experimental set-up of the test refers to the coupled equipment that supports and hosts the electromechanical oscillator. These are the strongbox employed to store the sand, the box used to store water, a hose to link both boxes, valves to regular water entry, levels, clamps, the laboratory supports stand, guides to lead the oscillatory movement, and a blue static target of 20 mm × 20 mm as a reference to the actuator’s displacement.
The dry air pluviation proposed by [22] in [23], i.e., soil deposition at constant fall height using a funnel, was used for sample preparation, ensuring reasonably homogeneous specimens with uniform density. The container filling was performed by rotating and lifting the funnel with dry soil; the fall height was kept constant and minimum as well as possible. This process allowed the uniform depositing of the sand to guarantee that density was constant throughout the strongbox.
The saturation process for the tests was developed using deaerated water obtained by boiling tap water and storing it in a sealed container [24]. Deaerated water was flushed slowly upward through the sand layer and filled the voids of the soil deposit from the base up to 20 mm above the surface of the sand particles. The total height pressure was approximately 250 mm, guaranteeing a slow flush through the sand. After around 24 h, the surplus water on the soil surface was removed using a sponge. The volume of flushed water into the container up to the sand surface was measured and divided by the required water needed for total saturation. The degree of saturation was calculated according to Equation (3):
S = ω / ωmax
where ω is water content and ωmax is the maximum water content for the void ratio and the specific gravity of the soil sample.
According to [10], the threshold of the degree of saturation required to continue with a test is 90%. Figure 3 shows the saturation process.
The authors used three types of sands in this study, Ottawa sand, Guamo sand, and Tumaco sand (these two last from Colombia, South America). Table 3 and Table 6 summarize the parameters of the tested sands. Ref. [25] concluded that Guamo sand achieved liquefaction flow with Dr < 25%, and in this state, this soil showed a small contractive behavior. The authors assumed a contractive behavior for the sands due to the low relative density values (less than 0.33).
The acrylic strongbox is classified as a rigid box with fixed-end boundary conditions. The dimensions of the strongbox followed the guidance proposed by [27] in [9,10]. They stated that the free field soil might be realized in a rigid container fulfilling the recommendations summarized in Table 4.
The electromechanical oscillator was located at the geometrical center of the soil surface with a 40 mm embedment depth, following Terzaghi’s description: “A foundation is considered shallow if its depth is less than or equal to its width” [28]. Then, the device was installed within the guides so that the bearings slightly touched the guide walls leading the movement. The guides constrained three of the six degrees of freedom experienced by a shallow foundation on a soil medium [15]; the remaining degrees were lateral, vertical, and rocking motion. In consequence, this small-scale model was a simplified planar problem. Only the rocking motion was analyzed as this was the primary tendency due to the device features considering the actuator as an inverted pendulum with forces applied on top of the structure. The roughness of the bottom of the shallow foundation limited lateral motion by friction with the soil, and the vertical motion was presumed insignificant because the settlement on sand was instantaneous in drained conditions [29].
Table 4. Recommendations for experimental tests of shallow foundations in rigid containers.
ParameterRule (*)Reference
Rigid container length8 × B[9]
Minimal height from the bottom of the rigid container to the bottom of the shallow foundation1.4 × B[9]
Minimal width of the sample to minimize boundary effects10 × Dnom[30]
Grain-size effects on soil-structure interaction. Bearing capacity of shallow footings (strip footing)B/D50 > 35[31]
(*) B is the base of the shallow foundation, Dnom is the nominal diameter of the maximum soil particles, and D50 is the mean grain size of the soil particles.
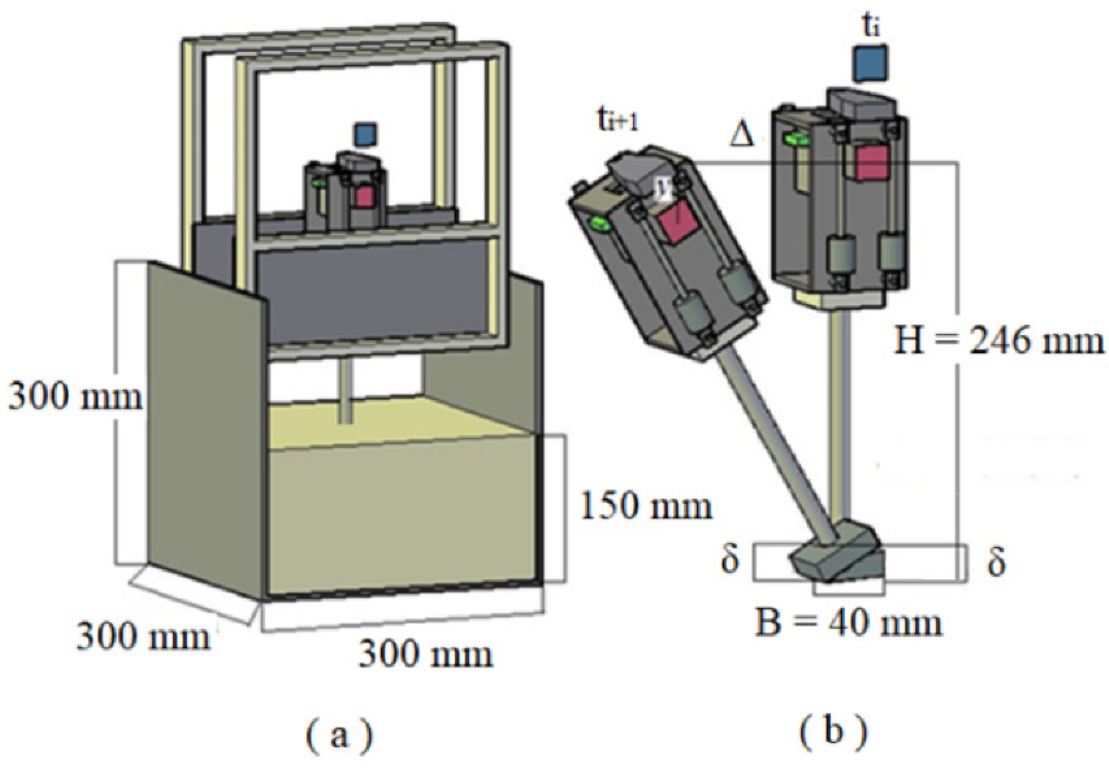
Following Table 2, the dimensions of the strongbox were 300 mm × 300 mm × 300 mm (length × width × height), and the sand deposit height reached 150 mm. Figure 4 shows the dimensions and location of the electromechanical oscillator and its rocking motion between ti and ti+1 times, including the operation of the guides.
A geometric formulation allowed obtaining the vertical displacement in one of the edges of the SDOFO, which should be the same vertical displacement of the soil per cycle of loading beneath that edge because every cycle of loading pushed the soil deposit under the footing. A conversion factor was necessary to compute the vertical displacement on the edge of the footing by converting the position of the dynamic target centroid related to the static target centroid for every recorded displacement. Based on the similarity of the isosceles triangles, Equation (4) yields:
δ = Δx{(B/2)/H}
where δ is the vertical displacement in one of the edges of the footing; Δ is the horizontal movement of the mobile target related to the static target; B = width of square footing; H = effective height of the equivalent SDOF model.
The machine vision system registered the movement between the dynamic target centroid related to the static target centroid. This system allowed indirect measuring of displacements instead of using LVDT sensors, which have a different rigidity than the soil and may affect the test results [32]. Thus, data recording using images provided a “free movement” of the electromechanical oscillator without sensors directly installed in the device and the soil sample. This “free movement” can reliably represent the behavior of actual structures undergoing cyclical load, as evidenced in numerous seismic events (e.g., San Francisco 1906; Niigata 1964; Turkey 1999; Christchurch 2011, Japan 2011).
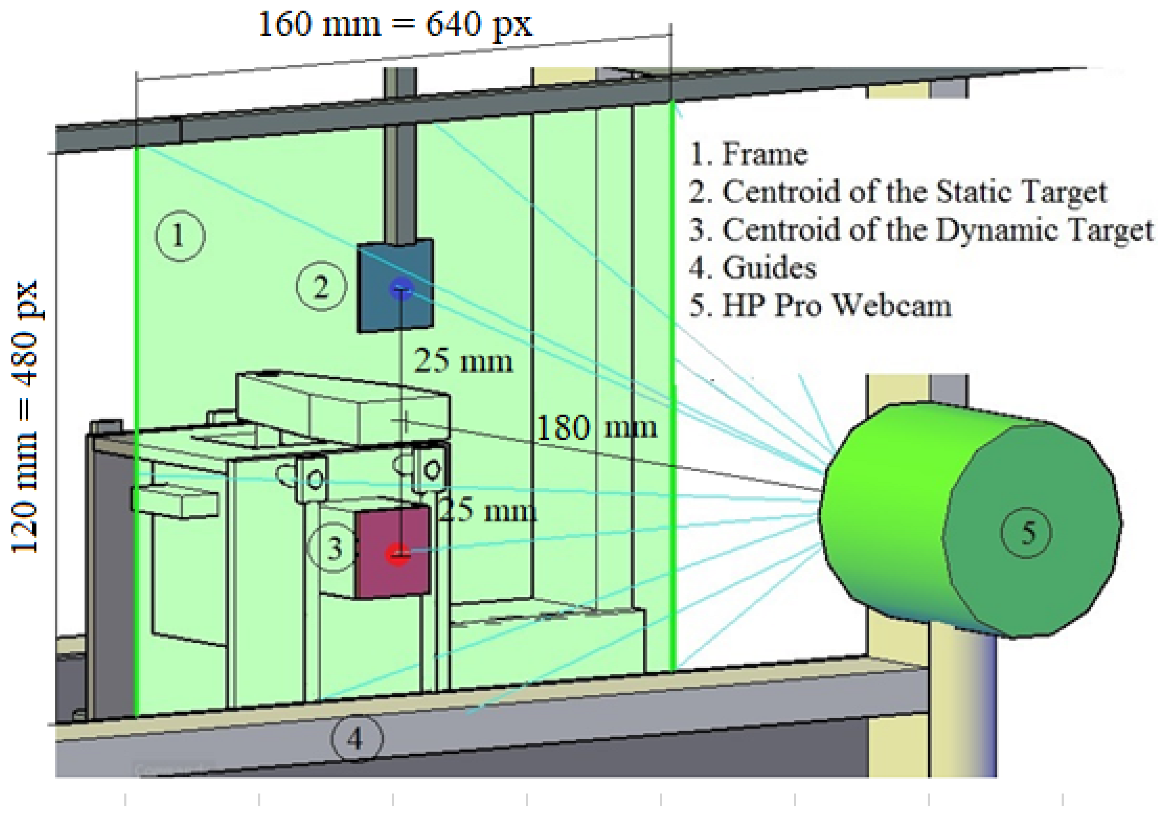
The computer vision method applied in this research was morphology, which employs morphological operators to define the shapes of features in an image using non-linear mathematical operators [33]. Algorithms encoded in Python interpreted the displacement information recorded by the machine vision. Data recording used the OpenCV, NumPy, and Time libraries developed for Python. OpenCV is a well-known Python library for processing images and detecting and rebuilding objects [34]. Figure 5 shows how the machine vision system works. The camera used to capture the movement was an HP Pro Webcam with a video resolution of 640 × 480 4:3 at up to 30 frames per second and a power line frequency anti-flicker of 60 Hz. During testing, the lighting conditions remained constant in a lighted room.
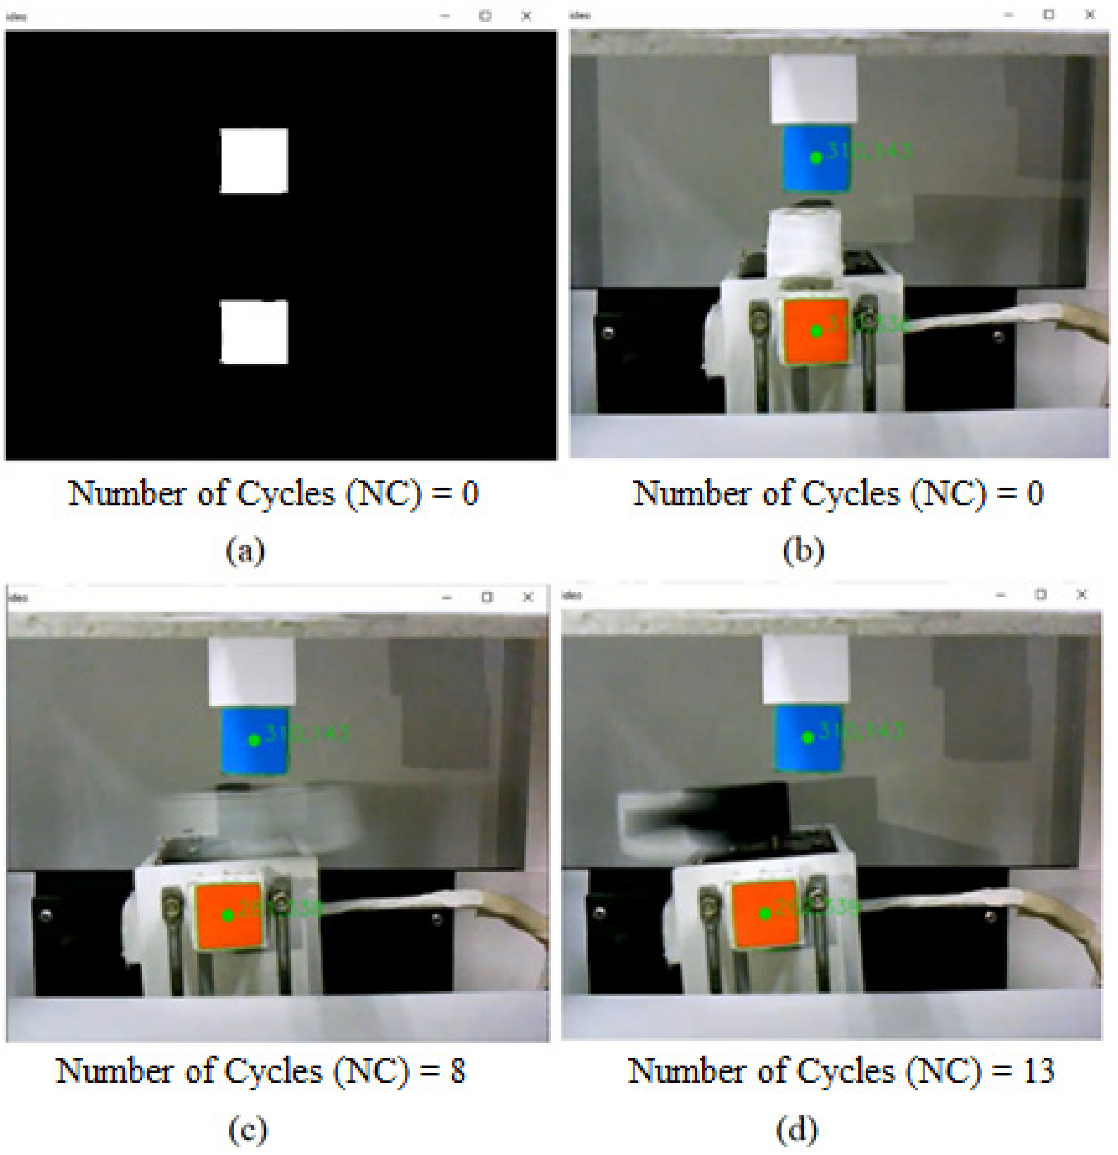
The range of frequencies was from 2.92 Hz to 6.05 Hz. Therefore, as the video camera captured thirty frames per second (30 fps), there were between five to ten recorded images per load cycle, enough to capture the features of the loading process. Targets were set up on the same vertical plane but vertically displaced relative to one another; this was accomplished by carefully moving both edges of the static target and aligning them with the respective edges of the dynamic target. Then, the computer vision checked the equality of the X coordinate (Figure 6b).
The lever arm on the top of the electromechanical oscillator spins counterclockwise. Once the rotation begins, the electromechanical oscillator loses the static equilibrium showing a brief incline, which increases with every cycle until the device’s downfall. Figure 6 shows the behavior of the actuator and the operativity of artificial vision.
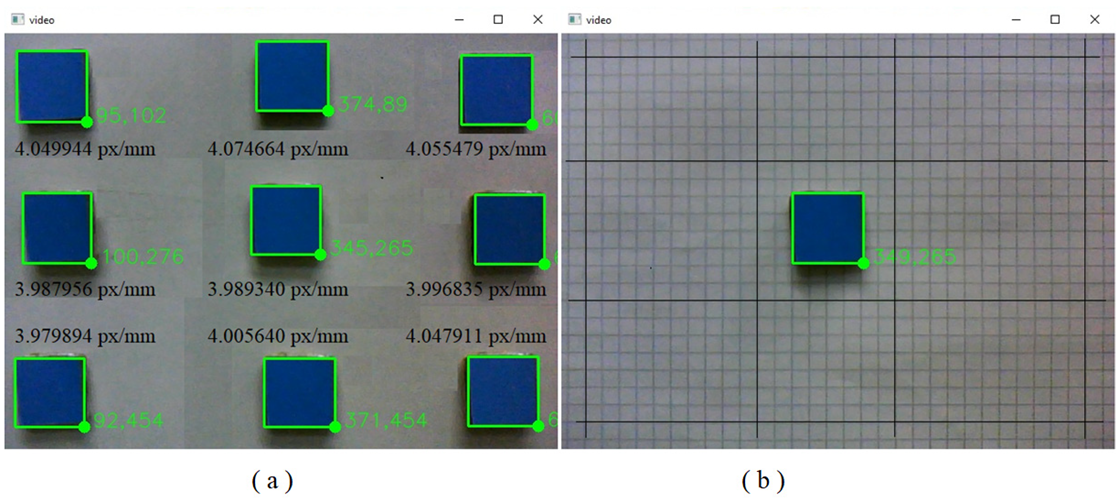
The optical distortion was analyzed by locating the static target in the corners, middle boundaries, and the video frame’s center. Then, the pixel density for every location was determined using the calibration code, as shown in Figure 7. Additionally, on the right side of this figure, it is possible to observe that straight lines stay parallel to each other in the video frame; therefore, this has no significant optical distortions (barrel, pincushion, and wavy distortion).
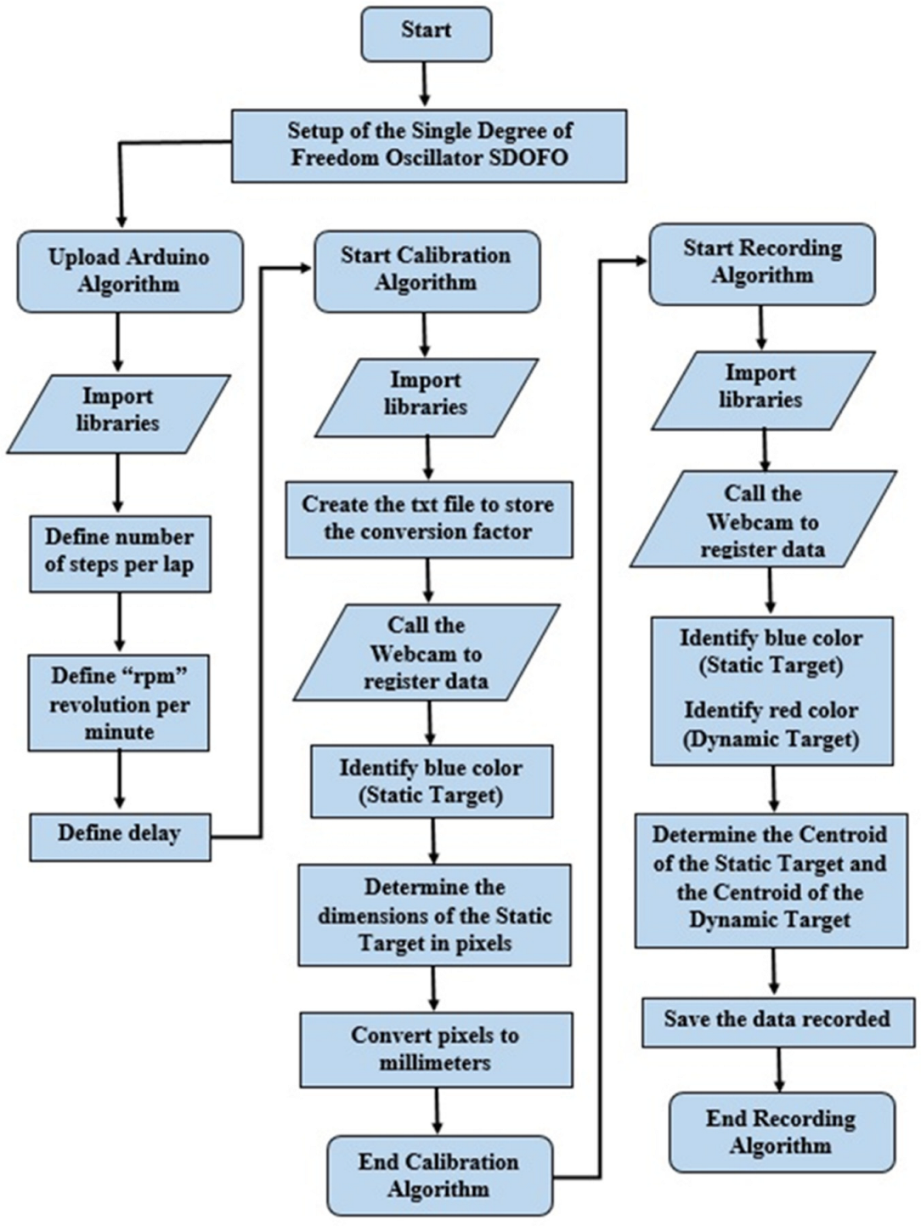
The flow diagrams in Figure 8 describe the procedures required to obtain displacements and times in each video frame. The first procedure controls the oscillatory movement using an Arduino UNO plate indicating the excitation frequency. The second procedure is a calibration process that creates an adequate factor to convert pixels to millimeters by measuring the static target dimensions; the conversion factor to obtain the pixel density does not change during a particular test.
However, every test has a different conversion factor and, consequently, a distinct pixel density due to the distinct positions of the machine vision system and the SDOFO, i.e., the distance from the focal point to the dynamic target had slight variations. Nevertheless, for every test, this distance was close to 180 mm. Table 5 summarizes the conversion factors and pixel density variations for the three tests on 23 samples developed for this work (eight tests on Ottawa sand, seven tests on Guamo sand, and nine tests on Tumaco sand).
The third procedure reads and stores data about the position of the dynamic target and static target centroids for each video frame. In this code, the primary functions are “cv2.morphologyEx” to purge every video frame, “cv2.moments” to find targets centroids, and “cv2.convexhull” to assure that the shapes selected were convex. Supplementary Materials contains the calibration and recording algorithms.
2.4. Equivalent SDOFO Model

A straightforward way to study the vibration of a structure on a rigid base uses single-degree-of-freedom oscillator (SDOFO) models based on the following assumptions [16]: (a) the first and only mode of vibration should be the most significant; (b) the soil-foundation interaction effect is not considered and is not significant; (c) horizontal and vertical ground motions are analyzed separately; and (d) only a lumped mass can oscillate in one mode only. Following the previous assumptions, this work only considered the SDOFO rocking mode, assuming its behavior as an inverted pendulum with both the applied forces and the mass lumped (inertial forces) on the top of the structure (the half-mass of the column was added to this mass).
The overturning moments increased since the structure modeled was slender, and the forces were applied on top, which makes the shallow foundation experience uplifting [7] and sinking alternatively on both edges of the footing. Therefore, the underlying soil suffers a differential pressure distribution. Figure 9 shows a topologic scheme, how it works per cycle, and the forces involved in the SDOFO model.

2.5. Soil Characterization

The samples used for this study were Guamo sand, Tumaco sand, and Ottawa sand. Guamo sand deposit is at geographic coordinates 4°02′00.0″ N 74°57′24.0″ W, in an Andean valley, and Tumaco sand deposit is at 1°49′46.0″ N 78°44′16.0″ W, on the Pacific shoreline. Ottawa sand is a US Silica conforming to ASTM C87, C109, C348, C359, C593, and C778 standards. Table 6 summarizes the properties of these materials.
Equation (5) provided the natural frequencies for the soil samples inside the container (fn). The natural frequencies were more significant than the excitation frequency (f), avoiding resonance.
fn = Vs/4Hc
where Vs is the shear wave velocity of the soil sample, and Hc is the sand deposit height inside the container.
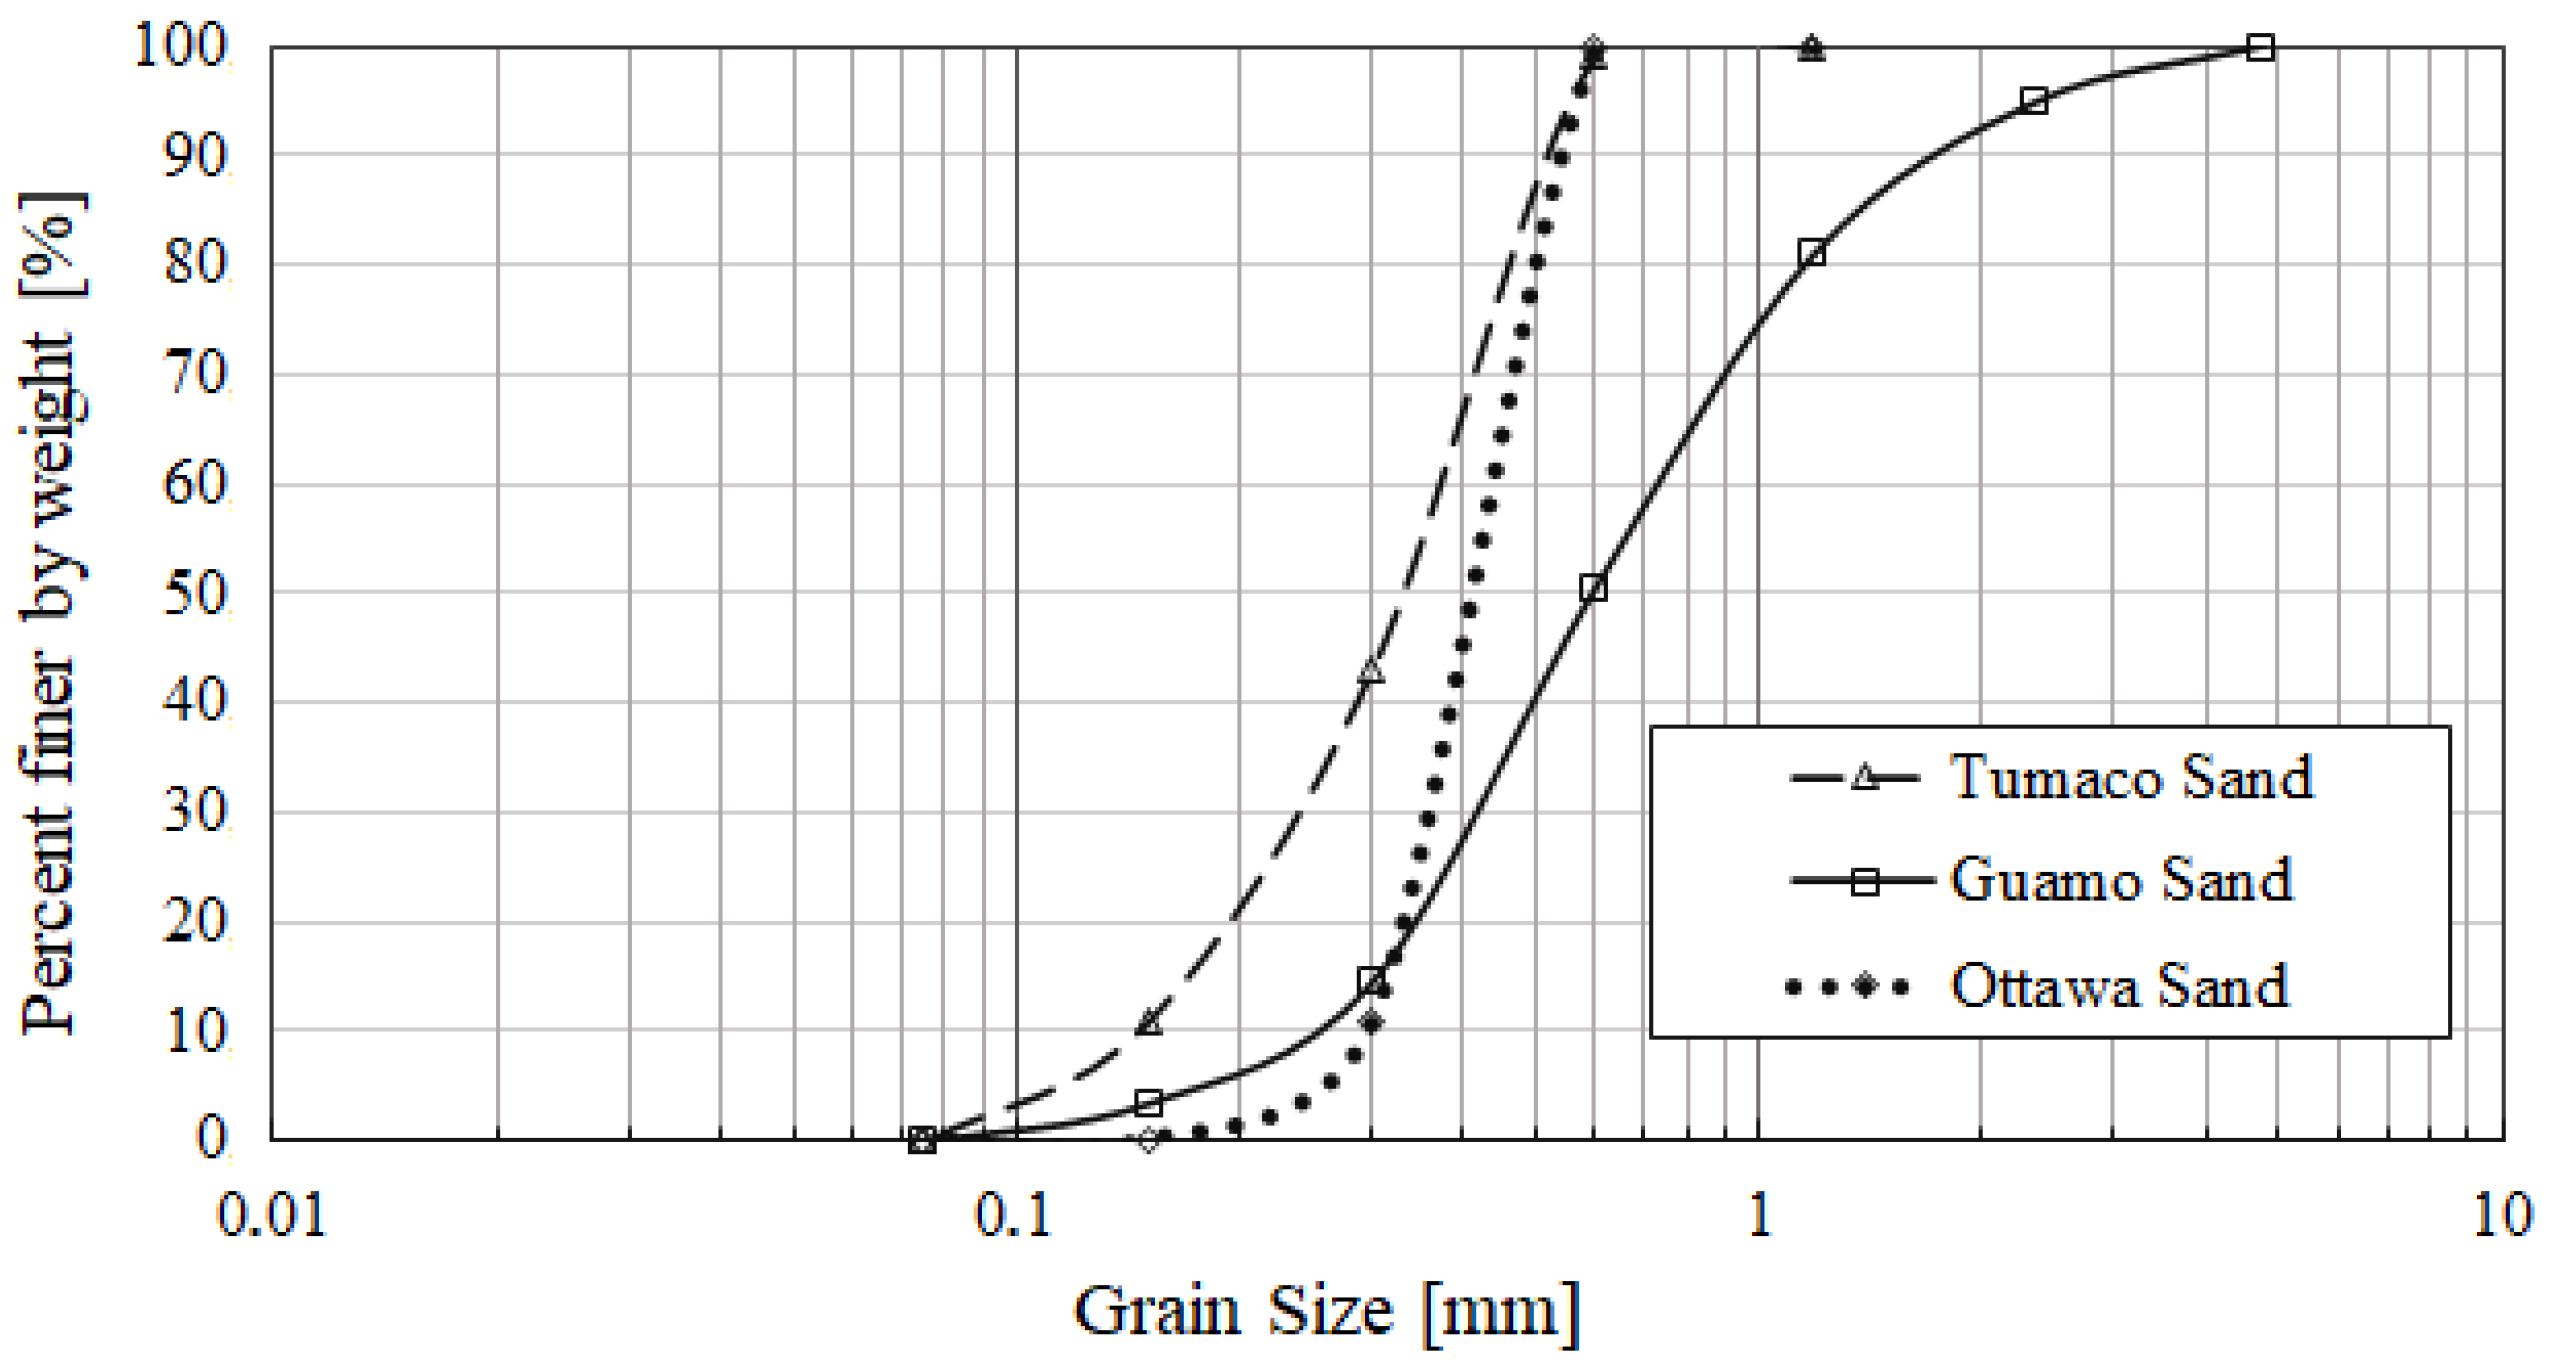
The mineralogy of Guamo sand is composed of pyroclastic fragments and quartz; other components are sedimentary and plutonic fragments, feldspar, and hornblende. Tumaco sand contains principally epidote, hornblende, and quartz, followed by plagioclase, magnetite, and fragments of microfossils [26]. Ottawa sand is clean quartz sand. Figure 10 shows the grain size distribution curve, between 4.75 mm and 75 μm, for the three soils without silt or clay fines, i.e., as clean sands.

3. Results

This section analyzes the behavior of the vertical displacement in one of the edges of the shallow foundation, the excitation frequency applied by the electromechanical oscillator, and their relationship with the model’s number of cycles at overturning.

3.1. Vertical Displacement

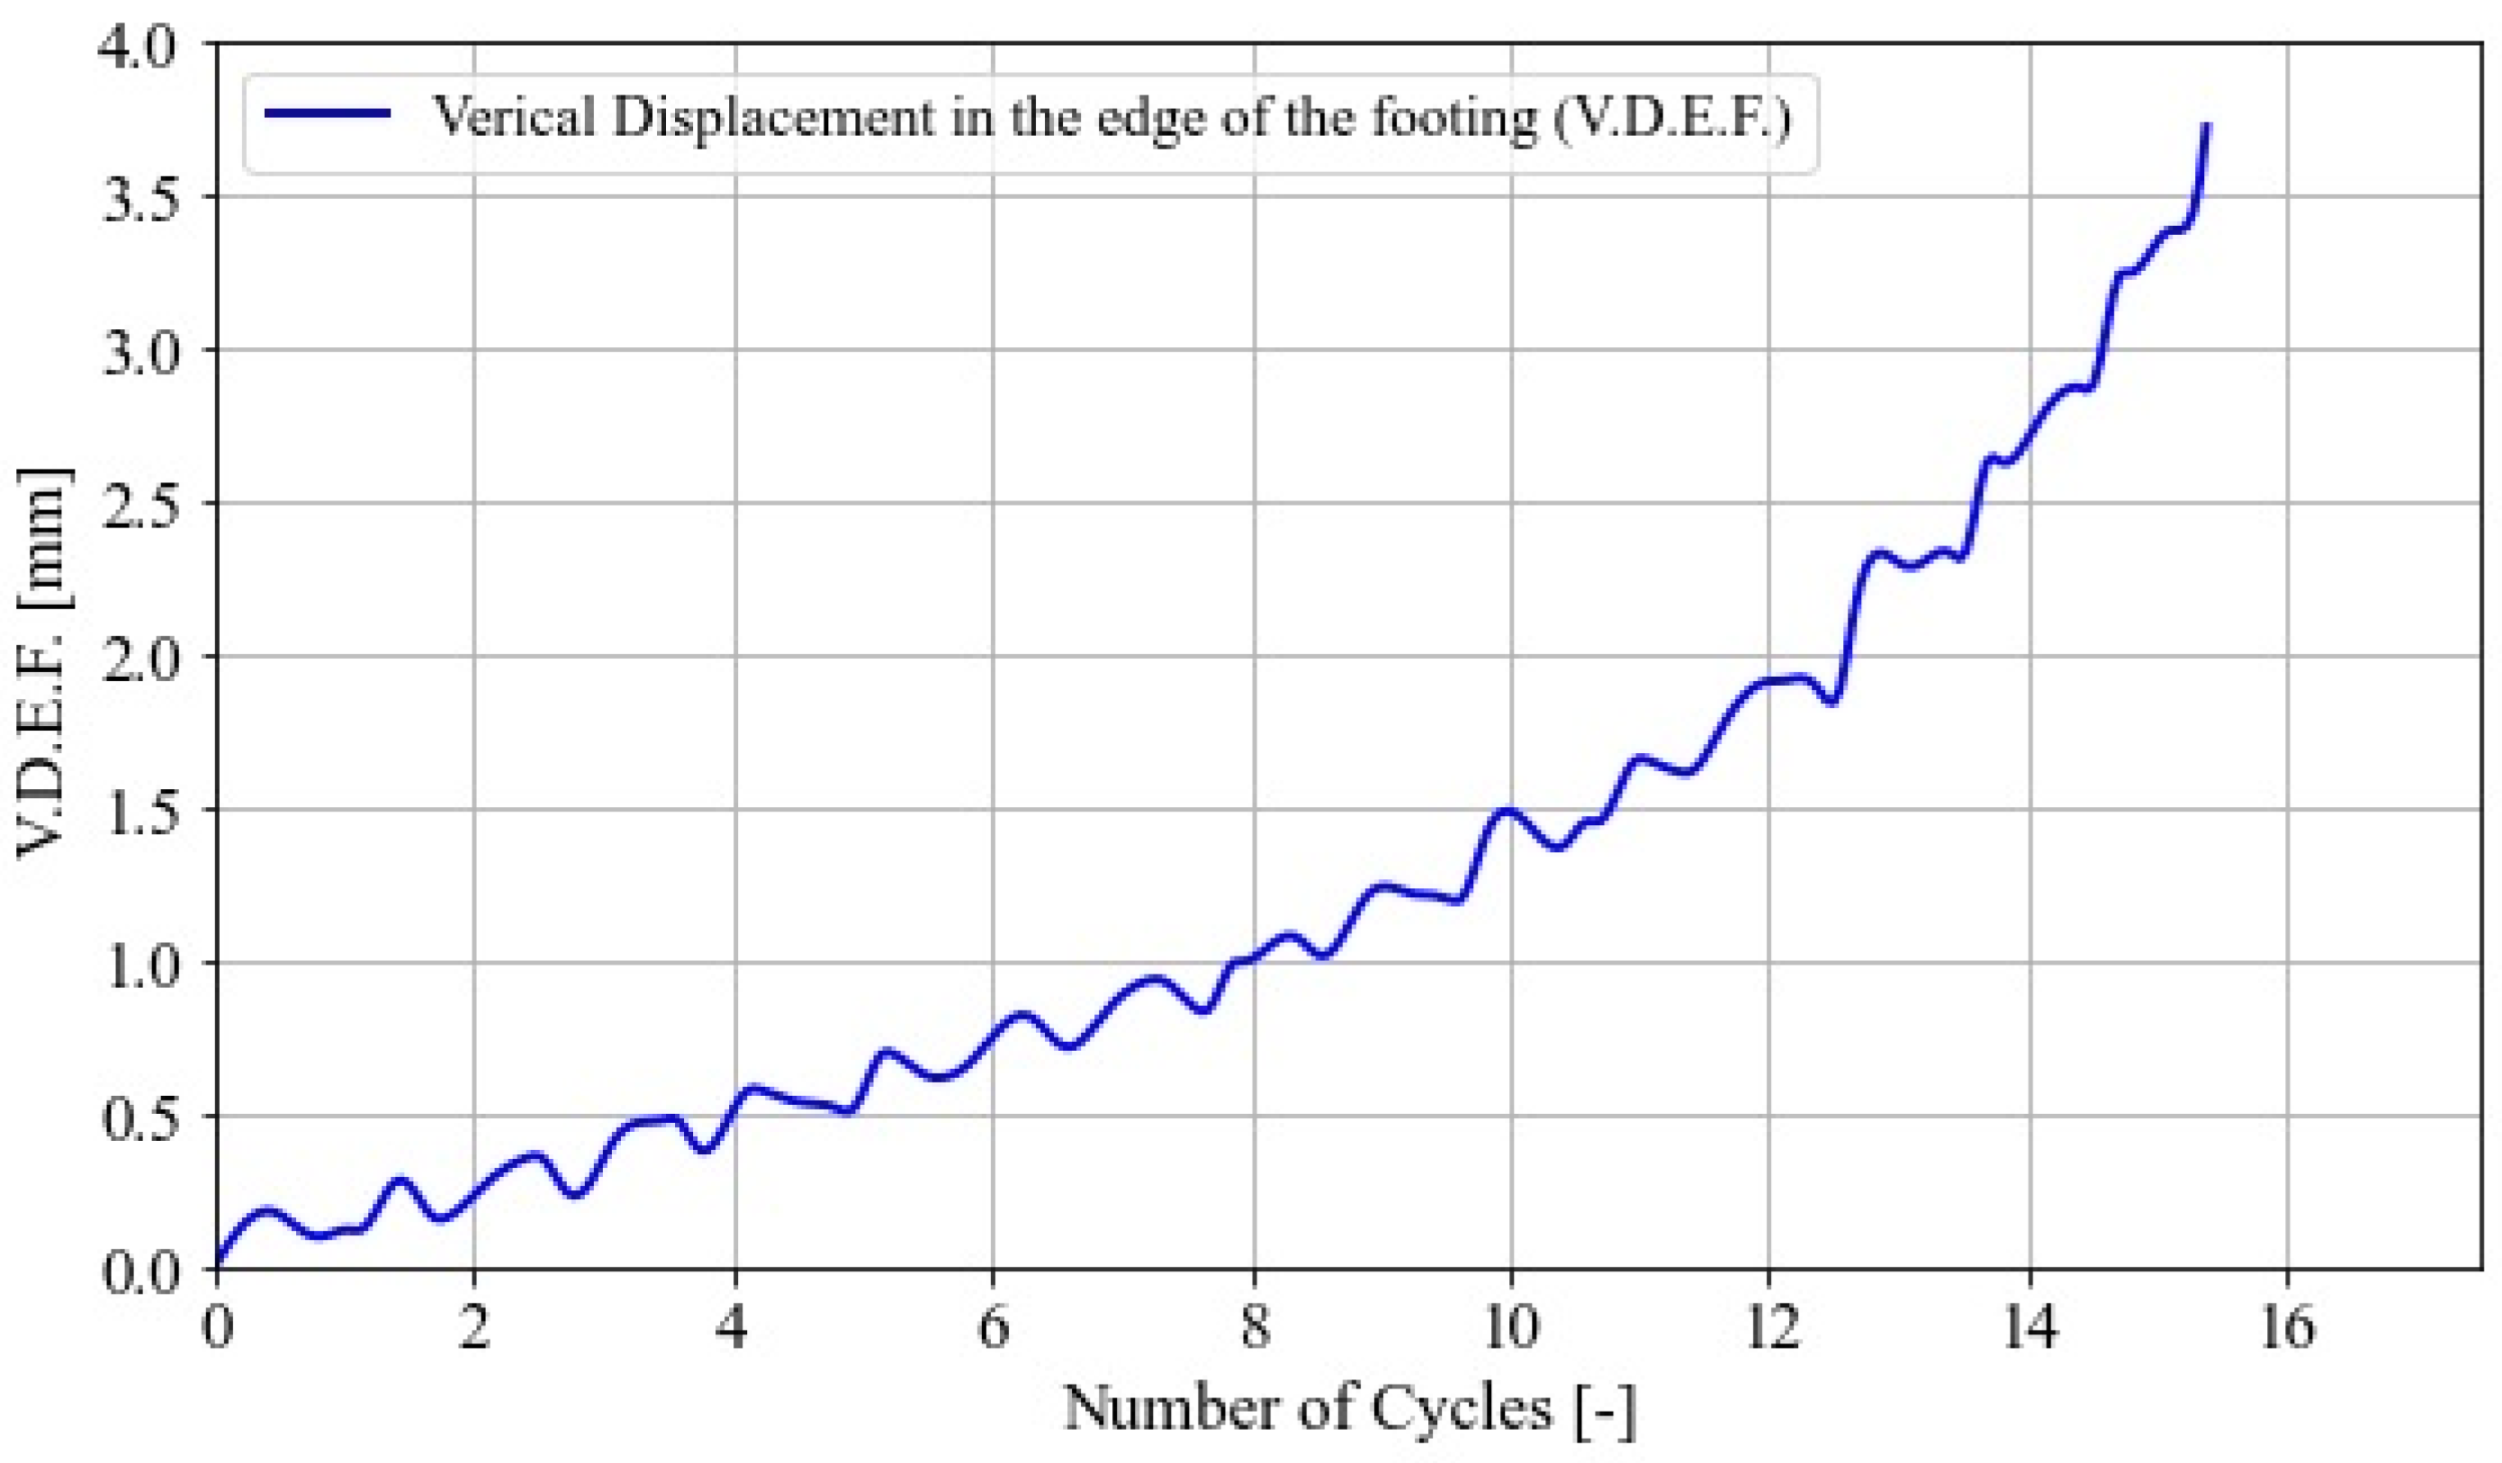
Figure 11 shows the oscillatory movement applied by the actuator, including the minimum and maximum vertical displacements on the edge of the footing with the number of cycles. The maximum displacement per cycle represents the accumulated displacement due to the direct contact of the edge of the footing with the underlying soil for every loading cycle. There is an initial linear trend in the graph. Ref. [36] explains it as “the progressive squeezing of the sand underneath the plate toward the sides during the sinking of the foundation”. After the linear trend, a non-linear tendency occurs, which means that the vertical displacement in the edge of the footing (VDEF) rapidly increases with the number of cycles. “The inflection point” is called the critical overturning rotation and is described below. P-Δ effects explain this behavior. P-Δ effects increase according to horizontal displacement at the top of the SDOFO (which in turn increases with the number of cycles), which causes an overturning moment (see Figure 9) and, therefore, an increase in the VDEF (sinking).
Overturning happens when the angle of rotation of the footing is greater than the critical angle, also called critical overturning rotation; this angle expresses the rotation at the state of imminent downfall for a rigid structure on a rigid base [7]. Equation (6) defines the critical angle formulation and its value for the developed physical model.
θc = atan((B/2)/H) = atan((40 mm/2)/246 mm) = 0.081122 radian
The instant at overturning was computed for all the tests. Figure 12 shows the number of cycles at overturning for an Ottawa sand sample at 5.86 Hz and an amplitude of 0.2 mm, for the oscillatory movement on the edge of the footing.

3.2. Frequency

The nature of cyclic loading applied to a soil deposit is highly dependent on the loading source; this means single frequencies can be associated with a vibrating machine, and random frequencies can be associated with earthquakes [37]. The study of the effect of the loading frequency on the liquefaction resistance of sands uses frequencies from 0.05 to 12 Hz. Nonetheless, this effect has not been understood, and the results have been contradictory [38]. Additionally, some dynamic parameters do not significantly influence the loading frequency variation; for example, torsional shear and resonant column tests show a low influence from the loading frequency and the shear modulus [39].
Therefore, excitation frequency (f) is another leading parameter necessary to comprehend the liquefaction and the overturning phenomena. Consequently, a saturated granular soil could liquefy faster or slower by keeping the amplitude (As) constant. The frequency range can be related to the loading frequencies performed by earthquakes and rail transit [37].
Figure 13 shows the relationship between excitation frequency, the vertical displacement amplitude on the edge of the footing, and the number of cycles at overturning for the Ottawa sand, Tumaco sand, and Guamo sand. Test excitation frequencies ranged from 2.5 Hz to 6.5 Hz; amplitude ranged from 0.02 mm to 0.25 mm for the vertical displacement on the edge of the footing (As). It is possible to observe that both excitation frequency and amplitude of the vertical displacement on the edge of the footing are inversely proportional to the number of cycles at overturning. Table 7 summarizes the details and final results.
Figure 14 shows the relationship between the cycle number at overturning (NCO), the effective grain size (D10) for excitation frequencies between 2.5 Hz and 6.5 Hz, and vertical displacement amplitudes between 0.1 mm and 0.2 mm. These values were obtained from the trending lines in Figure 13. It is possible to note that D10 influenced the NCO to low excitation frequencies, and their relationship was inversely proportional because D10 regulates the flow of water through soils and can control the mechanical behavior of soils since the coarser fractions may not be ineffective in contact with each other; that is, they float in a matrix of finer particles [40].

4. Discussion

Numerous studies employ SDOF systems to simulate slender structures with shallow foundations undergoing dynamic loads and subjected to rocking vibration.
Researchers have recently developed a new concept for shallow foundation design, namely “rocking isolation” due to strong seismic motion [7]. In that design approach, soil failure is used as a “fuse” to prevent plastic-hinging in the superstructure. Researchers build physical models of rocking vibration mode to study this behavior. The authors designed and built an SDOF model for this work.
The physical models of SDOF systems are commonly excited by shaking tables or actuators, fixed or hinged, to the model [8,9,10,11,12,17]. The actuator applies impact, harmonic, or random dynamic loads. Additionally, some SDOF systems are self-propelled, hence known as SDOFO. [41] presented an SDOFO for vertical translation vibration mode. As an improvement, the authors developed an SDOFO for the rocking vibration mode in this work.
Ref. [12] performed a series of cyclical tests employing an SDOF model on saturated loose sand and found that the cyclic foundation settlement followed a linear trend with the number of loading cycles until a failure threshold. In this work, the authors found a similar linear response between the vertical displacement in the edge of the model’s footing (VDEF) and the number of loading cycles before overturning (see Figure 11).
Ref. [11] developed another SDOF model and found that the settlement in the sand increases proportionally to the amplitude of the oscillatory movement and the cumulative number of loading cycles. The authors of this work found a similar behavior, as shown in Figure 11 and Figure 13, where the VDEF increases with the number of loading cycles, and overturning occurs earlier under larger amplitudes.
Ref. [13] summarized a series of SDOF models on shaking table and centrifuge tests. The SDOF models were mainly “rectangular footings” after averaging different length/width ratios toward one. The footing used in this work has a length/width ratio equal to one.
Previous research used multiple displacement measurement systems for the SDOF models, as follows: miniature uniaxial accelerometers [9], potentiometers [10,12], vibration meters [41], wire and laser transducers [11], particle image velocimetry—PIV [17], high-speed cameras [8], and image processing [10]. The authors of this work developed a procedure to measure displacements based on computer vision algorithms, following the trend shown in the latest research. Computer vision does not require any hardware device installed on the SDOF. In contrast, a physical sensor may interfere with the SDOF free movement or affect the soil response under cyclic loading due to the rigidity contrast between the soil and the device. Additionally, the coding uses the well-known algorithms developed for the OpenCV library for the Python programming language.

5. Conclusions

The excitation frequency and the vertical displacement amplitude on the edge of the footing both inversely influence the number of cycles at overturning.
The tests with a constant excitation frequency, but different vertical displacement amplitudes on the edge of the footing, show that a greater vertical displacement amplitude on the edge of the footing induces a faster overturning. Similarly, the tests with the same vertical displacement amplitude on the edge of the footing, but different excitation frequencies, show that a greater excitation frequency induces a faster overturning.
Ottawa sand exhibits fewer cycles for overturning than Guamo and Tumaco sands. The overturning susceptibility is greater in Ottawa sand, followed by Guamo and Tumaco sands. The effective grain size D10 may explain this behavior as the Ottawa sand has a larger effective grain size than Guamo and Tumaco sands (in this order).
Computer vision allowed indirect measurements of physical phenomena of engineering interest. In this work, computer vision allowed the authors to take indirect measures instead of using LVDT sensors. Thus, computer vision permitted a “free movement” of the actuator, which reliably represents the behavior of actual structures undergoing cyclical load; therefore, computer vision in geotechnical experimentation could become a powerful tool to understand the soil behavior subject to both static and dynamic loads.

Supplementary Materials

The following supporting information can be downloaded at: https://www.mdpi.com/article/10.3390/infrastructures7110147/s1. The authors may provide Python codes for calibration and data recording from computer vision upon peer reviewers’ request.

Author Contributions

Conceptualization and original idea, C.C.M.; draft preparation, S.C.; experimental set-up and testing D.F.G.; writing—review and editing L.R.V.-V. All authors have read and agreed to the published version of the manuscript.

Funding

This research was funded by “Convocatoria para el Fortalecimiento de la Investigación, Creación e Innovación Articulado con la Formación en la Universidad Nacional De Colombia 2020–2021”, Project “Modelo Físico de Licuación en Suelos Granulares”, HERMES Code 51135.

Data Availability Statement

The original contributions presented in this research are included in the article. Further inquiries can be directed to the corresponding author.

Acknowledgments

The authors thank the “Julio Robledo Isaza” Laboratory of Materials at Universidad Nacional de Colombia Sede Manizales for their support, especially to José O. Jaramillo, D. Herrera, and O. Villegas.

Conflicts of Interest

The authors declare no conflict of interest.

References

  1. Bao, X.; Jin, Z.; Cui, H.; Chen, X.; Xie, X. Soil liquefaction mitigation in geotechnical engineering: An overview of recently developed methods. Soil Dyn. Earthq. Eng. 2019, 120, 273–291. [Google Scholar] [CrossRef]
  2. Marcuson, W.F. Definition of terms related to liquefaction. J. Geotech. Eng. Div. ASCE 1978, 104, 565–588. [Google Scholar]
  3. Youd, T.L.; Perkins, D.M. Mapping Liquefaction-Induced Ground Failure Potential. J. Geotech. Eng. Div. 1978, 104, 433–446. [Google Scholar] [CrossRef]
  4. Verdugo, R.; González, J. Liquefaction-Induced ground damages during the 2010 Chile Earthquake. Soil Dyn. Earthq. Eng. 2015, 79, 280–295. [Google Scholar] [CrossRef]
  5. Ishihara, K. Liquefaction and flow failure during earthquakes. Géotechnique 1993, 43, 351–451. [Google Scholar] [CrossRef]
  6. Wu, J.; Kammerer, A.M.; Riemer, M.F.; Seed, R.B.; Pestana, J.M. Laboratory Study of Liquefaction Triggering Criteria. In Proceedings of the 13th World Conference on Earthquake Engineering, Vancouver, BC, Canada, 1–6 August 2004. [Google Scholar]
  7. Gazetas, G. 4th Ishihara lecture: Soil-foundation-structure systems beyond conventional seismic failure thresholds. Soil Dyn. Earthq. Eng. 2015, 68, 23–39. [Google Scholar] [CrossRef]
  8. Taeseri, D.; Laue, J.; Martakis, P.; Chatzi, P.; Anastasopoulos, I. Static and dynamic rocking stiffness of shallow footings on sand: Centrifuge modelling. Int. J. Phys. Model. Geotech. 2018, 18, 315–339. [Google Scholar] [CrossRef] [Green Version]
  9. Martakis, P.; Taeseri, D.; Chatzi, E.; Laue, J. A centrifuge-based experimental verification of Soil-Structure Interaction effects. Soil Dyn. Earthq. Eng. 2017, 103, 1–14. [Google Scholar] [CrossRef]
  10. Jafarian, Y.; Esmaeilpour, P.; Shojaeemehr, S.; Taghavizade, H.; Rouhi, S.; McCartney, J.S. Impacts of Fixed-End and Flexible Boundary Conditions on Seismic Response of Shallow Foundations on Saturated Sand 1-g Shaking Table Test. Geotech. Test. J. 2021, 44, 637–664. [Google Scholar] [CrossRef]
  11. Anastosopoulos, I.; Kourkoulis, R.; Gelagoti, F.; Papadopoulos, E. Rocking response of SDOF systems on shallow improved sand: An experimental study. Soil Dyn. Earthq. Eng. 2012, 40, 15–33. [Google Scholar] [CrossRef]
  12. Anastosopoulos, I.; Gelagoti, F.; Kourkoulis, R.; Gazetas, G. Simplified Constitutive Model for Simulation of Cyclic Response of Shallow Foundations: Validation against Laboratory Tests. J. Geotech. Geoenviron. Eng. ASCE 2011, 37, 1154–1168. [Google Scholar] [CrossRef]
  13. Gavras, A.G.; Kutter, B.L.; Hakhamaneshi, M.; Gajan, S.; Tsatsis, A.; Sharma, K.; Kohno, T.; Deng, L.; Anastosopoulos, I.; Gazetas, G. Database of rocking shallow foundation performance: Dynamic shaking. Earthq. Spectra. 2020, 36, 960–982. [Google Scholar] [CrossRef]
  14. Baltzopoulos, G.; Baraschino, R.; Iervolino, I.; Vamvatsikos, D. Dynamic analysis of single-degree-of-freedom systems (DYANAS): A graphical user interface for OpenSees. Eng. Struct. 2018, 177, 395–408. [Google Scholar] [CrossRef]
  15. Kamesware, R.N. Foundation Design: Theory and Practice; John Wiley & Sons: New York, NY, USA, 2011. [Google Scholar]
  16. Srbulov, M. Geotechnical Earthquake Engineering Simplified Analyses with Case Studies and Examples; Springer: Berlin/Heidelberg, Germany, 2008. [Google Scholar]
  17. Zhao, D.; Liu, J. Seismic Response of a Two-Story Three-Span Subway Structural Model under High-Accelerated Geotechnical Centrifuge Shaking Table Test. J. Infrastruct. 2022, 7, 110. [Google Scholar] [CrossRef]
  18. Muir, W.D. Geotechnical Modelling; Taylor & Francis Group: London, UK, 2004. [Google Scholar]
  19. Iai, S. Similitude for Shaking Table Test on Soil-Structure-Fluid Model in 1g Gravitational Field. Soils Found. 1989, 29, 105–118. [Google Scholar] [CrossRef] [Green Version]
  20. Moncarz, P.; Krawinkler, H. Theory and Application of Experimental Model Analysis in Earthquake Engineering; Stanford University: Stanford, CA, USA, 1981. [Google Scholar]
  21. Sadq, Q. Response of Soil-Foundation-Structure Interaction of Tall Building (Frame-Wall) Structural System under Seismic Effect. Ph.D. Thesis, The University of Salford, Great Manchester, UK, 2019. [Google Scholar]
  22. Yamashita, S.; Kawaguchi, T.; Nakata, Y.; Mikamt, T.; Fujiwara, T.; Shibuya, S. Interpretation of international parallel test on the measurement of G max using bender elements. Soils Found. 2009, 49, 631–650. [Google Scholar] [CrossRef] [Green Version]
  23. Molina-Gómez, F.; Viana da Fonseca, A. Key geomechanical properties of the historically liquefiable TP-Lisbon sand. Soils Found. 2021, 61, 836–856. [Google Scholar] [CrossRef]
  24. Ruelke, T. Is Water More than Just H2O? AASHTO Resource, Florida Department of Transportation 2010. Available online: http://www.aashtoresource.org/university/newsletters/newsletters/2016/08/02/is-water-more-than-just-h2o (accessed on 3 October 2022).
  25. Lizcano, P.A.; Jimenez, O.J. Liquefaction flow behavior of Guamo sand. Fundam. Appl. Geotech. 2015, 3, 470–477. [Google Scholar]
  26. García, J.R. Análisis Comparativo del Fenómeno de Licuación en Arenas. Aplicación a Tumaco (Colombia). Ph.D. Thesis, Universitat Politècnica de Catalunya, Barcelona, Spain, 2007. [Google Scholar]
  27. Fishman, K.L.; Mander, J.B.; Richards, R., Jr. Laboratory Study of Seismic Free-Field Response of Sand. Soil Dyn. Earthq. Eng. 1995, 14, 33–43. [Google Scholar] [CrossRef]
  28. Das, B.M. Principles of Foundation Engineering, 7th ed.; Cengage Learning: Boston, MA, USA, 2011. [Google Scholar]
  29. Hammam, A.H.; Abulied, A.F. Settlement of Shallow Foundations on San Overlaying Compressible Clay, Part 1. In Proceedings of the 2011 Pan-Am CGS Geotechnical Conference, Toronto, ON, Canada, 1–7 October 2011. [Google Scholar]
  30. Ashmawy, A.K.; Sukumaran, B.; Hoang, V.V. Evaluating the Influence of Particle Shape on Liquefaction Behavior Using Discrete Element Modelling. In Proceedings of the Thirteenth International Offshore and Polar Engineering Conference OnePetro, Honolulu, HI, USA, 25–30 May 2003. [Google Scholar]
  31. Garnier, J.; Gaudin, C.; Springman, S.M.; Culligan, P.J.; Goodings, D.; Koning, D.; Kutter, B.; Philips, R.; Randolph, M.F.; Thorel, L. Catalogue of scaling laws and similitude questions in geotechnical centrifuge modelling. Int. J. Phys. Model. Geotech. 2007, 7, 1–23. [Google Scholar] [CrossRef]
  32. Zhao, H.-h.; Liu, C.; Tang, X.-w.; Wei, H.-w.; Zhu, F. Study of Visualization measurement system of spatial deformation based on transparent soil and three-dimensional reconstruction technology. Rock Soil Mech. 2020, 41, 3170–3180. [Google Scholar]
  33. Moradi, S.; Zayed, T.; Golkhoo, F. Review on Computer Aided Sewer Pipeline Defect Detection and Condition Assessment. J. Infrastruct. 2019, 4, 10. [Google Scholar] [CrossRef] [Green Version]
  34. Bradski, G. The Open CV-Library. Dr. Dobb’s J. Softw. Tools 2000, 25, 120–125. [Google Scholar]
  35. Cunning, J.C.; Robertson, P.K.; Sego, D.C. Shear wave velocity to evaluate in situ state of cohesionless soils. Can. Geotech. J. 1995, 32, 848–858. [Google Scholar] [CrossRef]
  36. Faccioli, E.; Paolucci, R.; Vivero, G. Investigation on seismic soil-footing interaction by large scale cyclic tests and analytical models. In Proceedings of the 4th International Conference on Recent Advances in Geotechnical Earthquake Engineering and Soil Dynamics, San Diego, CA, USA, 26–31 March 2022; Prakash, S., Ed.; Missouri University of Science and Technology: Rolla, MO, USA, 2022. [Google Scholar]
  37. Rees, S. GDS Instruments. Available online: https://www.gdsinstruments.com/ (accessed on 29 September 2020).
  38. Nong, Z.; Park, S.-S.; Jeong, S.-W.; Lee, D.-E. Effect of Cyclic Loading Frequency on Liquefaction Prediction of Sand. Appl. Sci. 2020, 10, 4502. [Google Scholar] [CrossRef]
  39. Stokoe, K.H. Attachment A-7, Results of Resonant Column/Cyclic Torsional Shear Testing; United States Nuclear Regulatory Commission Site Safety Analysis Report; Exelon Generation Company, LLC: Austin, TX, USA, 2002. [Google Scholar]
  40. Budhu, M. Soil Mechanics Fundamentals, 1st ed.; Wiley: Hoboken, NJ, USA, 2015. [Google Scholar]
  41. Al-Wakel, S.F.A.; Fattah, M.Y.; Karim, H.H.; Chan, A.H.C. Experimental and Numerical Modeling of Machine Foundations on a Saturated Soil. In Proceedings of the Numerical Methods in Geotechnical Engineering—The 8th European Conference on Numerical Methods in Geotechnical Engineering, Delf, The Netherlands, 18–20 June 2014. [Google Scholar]
Figure 1. Schematic drawing of the experimental set-up.
Infrastructures 07 00147 g001
Figure 2. General sketch of the device. Nomenclature based on Table 2.
Infrastructures 07 00147 g002
Figure 3. Saturation process: (a) bottom-up water filling and location of the electromechanical oscillator at the center of the sand surface; (b) water level 20 mm above the sand surface to guarantee saturation after 20 h; and (c) complete set-up and equipment ready to test.
Infrastructures 07 00147 g003
Figure 4. (a) Strongbox and sand deposit with measurements, electromechanical oscillator inside the guide; (b) rocking motion of the electromechanical oscillator, dimensions needed to convert horizontal displacement Δ into vertical displacement at the edge of the square footing δ.
Infrastructures 07 00147 g004
Figure 5. Elements of the machine vision system in a frame. Dimensions of frames in pixels and millimeters also are shown. The video frame and the line of sight of the camera lens were perpendicular.
Infrastructures 07 00147 g005
Figure 6. Operativity of the artificial vision identifying colors and shapes. The algorithm marked the contour and the centroid in pixels of the static and dynamic targets. The coordinates increased from the upper-left corner of each video frame: (a) Morphologic identification; (b) before the test; (c) test after eight cycles; and (d) test after 13 cycles. Ottawa sand sample (testing performed under 5.86 Hz and 0.2 mm).
Infrastructures 07 00147 g006
Figure 7. (a) Pixel density in separate locations of the video frame, μ = 4.020851, σ = 0.035767, COV = 0.008895. (b) Using a sheet grid to visualize optical distortions (barrel, pincushion, and wavy distortion). The green coordinates refer to the pixels (x, y) in the right-low corner of the target. The coordinates increased from the upper-left corner of the video frame. μ is the arithmetic media, σ is the standard deviation, and COV is the coefficient of variation.
Infrastructures 07 00147 g007
Figure 8. Required Arduino codification to guarantee and record an oscillatory movement. The calibration algorithm generates the conversion factor between pixels and millimeters, and the recording algorithm registers the required data to find the displacements and times in each video frame.
Infrastructures 07 00147 g008
Figure 9. (a) Equivalent SDOFO model at t = 0, (b) displacements, angles of rotation of the SDOFO, and forces acting on the SDOFO at t ≠ 0. Where m is the equivalent SDOFO mass, H is the effective height of the equivalent SDOF model, B is the width of the square footing, θ is the angle of foundation rotation, P is the total weight of the actuator, F is the lateral force, Δ is the horizontal displacement of the centroid of the dynamic target related to the centroid of the static target, and δ is the vertical displacement in one of the edges of the footing.
Infrastructures 07 00147 g009
Figure 10. Grain size distribution curve for Tumaco, Guamo, and Ottawa sands.
Infrastructures 07 00147 g010
Figure 11. Vertical displacement on the edge of the footing versus the number of cycles. The sample shows the number of cycles at overturning for Ottawa sand at 5.86 Hz and an amplitude of 0.2 mm on the edge of the footing.
Infrastructures 07 00147 g011
Figure 12. Maximum angle of the foundation rotation per cycle versus the number of cycles (MAFRC). The sample shows the number of cycles at overturning for Ottawa sand at 5.86 Hz and an amplitude of 0.2 mm for the oscillatory movement on the edge of the footing. The number of cycles at overturning was 11.
Infrastructures 07 00147 g012
Figure 13. Cycles number at overturning according to frequency and amplitude of movement on the edge of the footing in oscillatory movement. The annotations in the markers refer to the amplitude on the edge of the footing. The sizes of the markers were proportional to the value of the amplitude on the edge of the footing: (a) Ottawa sand, (b) Tumaco sand, (c) Guamo sand, and (d) all samples’ overturning trends.
Infrastructures 07 00147 g013
Figure 14. Number of cycles at overturning (NCO) versus effective grain size D10. It is possible to observe the influence of D10 on the behavior of the sand samples subjected to specific excitation frequencies and vertical displacement amplitudes on the edge of the footing. For low excitation frequencies, the SDOFO did not experience overturning even after 10,000 cycles when testing Tumaco sand.
Infrastructures 07 00147 g014
Table 1. Scaling laws and values from model to prototype.
ParameterScaling Factor [10,19] ModelPrototype
Length HN246 mm6150 mm
Length BN40 mm1000 mm
Length tN12 mm300 mm
Guamo sand wet density119.4 kN/m319.4 kN/m3
Tumaco sand wet density118.1 kN/m318.1 kN/m3
Ottawa sand wet density119.5 kN/m319.5 kN/m3
Mass of actuatorN30.80847 kg12,632.3 kg
Minimum amplitude performed of the vertical displacement at the edge of the footing δminN1.50.02 mm2.5 mm
Maximum amplitude performed of the vertical displacement at the edge of the footing δmaxN1.50.25 mm31.3 mm
Minimum amplitude performed of the horizontal displacement at the top of the equivalent SDOFO ΔminN1.50.246 mm30.8 mm
Maximum amplitude performed of the horizontal displacement at the top of the equivalent SDOFO ΔmaxN1.53.075 mm384.4 mm
Table 2. Electromechanical oscillator parameters and their measures.
ParameterSymbolValueUnits
Width of the square footingB40mm
Foundation half-widthb20mm
Square footing thicknesst12mm
Height of the columnh178mm
Cylindrical column radius r c 4.7625mm
Bending stiffness of the columnk430MPaxm
Gyration radius of the column r g 2.3812mm
Slenderness ratio of the column h / r g 74.75-
SDOFO column natural frequency f 0 3669 *Hz
Effective height of the equivalent SDOF modelH246mm
Height from base to lever armHl275mm
Actuator total massP808.47g
Structure slendernessHl/B7-
The critical angle for a rigid structure on a rigid base θ c 0.081122rad
* The natural frequency of the SDOFO was computed using the Rayleigh period equation, which is a function of its rigidity and mass; the result was 3669 Hz. Therefore, the excitation frequencies do not generate resonance in the column.
Table 3. Common initial conditions of the samples for all tests.
ParameterSymbolUnitsGuamo SandTumaco SandOttawa Sand
Dry unit weightγdkN/m316.113.715.6
Void ratio in the modelem-0.5560.8550.683
Void ratio in the prototypeep-0.4830.782 *0.618
Relative densityDr%152015
Water contentω%213225
Maximum water content ω m a x %223326
SaturationS%959898
* In-situ Tumaco sand void ratio ranges between 0.65 to 0.90 [26].
Table 5. Statistic parameters for the 23 tests reported.
Statistic ParameterFactor of Conversion [mm/px]Pixel Density [px/mm]
μ0.2413794.144592
σ0.0050250.086901
COV0.0208200.020967
μ is the arithmetic media, σ is the standard deviation, and COV is the coefficient of variation.
Table 6. Characterization of Guamo, Tumaco, and Ottawa sands used in the study.
PropertiesSymbolTest MethodGuamo SandTumaco SandOttawa Sand
Uniformity Coefficient [-]CuASTM D136:20053.282.721.57
Coefficient of Curvature [-]CcASTM D136:20050.991.020.96
Mean grain size [mm]D50ASTM D136:20050.600.390.43
Effective grain sizeD10ASTM D136:20050.250.150.30
Fines Content [%]FCASTM D136:2005000
Specific Gravity [-]GsASTM D854-102.552.592.67 *
Permeability coefficient [cm/s]kASTM D2434-68 (2006)0.00260.01560.0409
Minimum void ratio [-]emaxUNE 103-106-930.590.930.72
Maximum void ratio [-]eminUNE 103-105-930.360.550.48
Void ratio [-]e-0.5560.8550.683
Shear wave velocity [m/s]Vs--190 **175 *
Soil natural frequency [Hz] f n --317292
Effective soil friction angle [°] φ ASTM D3080/D3080M (2011)35.3534.2630.41
Effective soil cohesion [kPa] c ASTM D3080/D3080M (2011)000
Soil classification AASHTOA-1-bA-3A-3
Soil classification SUCS ASTMSPSPSP
* Value obtained from [35]. ** Data from [26].
Table 7. Test features and final results.
SandFrequency f [Hz]Amplitude δ [mm]Amplitude Δ [mm]Images Per Cycle [-]Number of Cycles at Overturning [-]
Ottawa2.920.020.24611624
Ottawa3.730.020.2469318
Ottawa4.220.070.861848
Ottawa5.250.182.214617
Ottawa5.280.131.599622
Ottawa5.450.131.599619
Ottawa5.860.131.599615
Ottawa5.860.22.337611
Guamo2.930.020.24611626
Guamo3.730.020.2469318
Guamo5.320.131.599639
Guamo5.390.212.583622
Guamo5.50.253.07569
Guamo5.940.141.722619
Guamo6.050.212.583513
Tumaco3.740.030.36992822
Tumaco4.540.050.6157202
Tumaco4.580.182.214725
Tumaco4.60.121.476762
Tumaco5.380.151.845625
Tumaco5.410.232.829615
Tumaco5.960.182.214617
Tumaco6.030.141.722519
Publisher’s Note: MDPI stays neutral with regard to jurisdictional claims in published maps and institutional affiliations.