Abstract
The present study focused on the development and application of two computer numerical models, namely, a seepage model developed using SEEP/W software and a groundwater model developed using Visual MODFLOW software. The seepage model was applied to a 38 km length of the tail reach of the Trimmu–Sidhnai (T-S) link canal passing through a severely waterlogged area of 32,000 ha, with a water table within 0–1.5 m from the ground surface; this was to quantify the canal seepage under the present condition (without any intervention) and with the interventions of a concrete lining of the complete prism of the T-S link canal and concrete side protection of the T-S link canal, with the canal bed unlined. The groundwater model evaluated the effectiveness of three waterlogging management interventions, which included: (i) the rehabilitation of the 43 existing drainage tube wells, (ii) the rehabilitation of the existing surface drains, and (iii) a combination of the rehabilitation of the 43 existing drainage tube wells and the rehabilitation of the existing surface drains. The seepage modeling revealed that the concrete lining intervention can reduce 50% of the seepage of the T-S link canal, whereas the concrete side protection intervention can reduce only 21% of the canal seepage. The groundwater modeling revealed that the waterlogging management intervention of the rehabilitation of the 43 drainage tube wells and surface drains can lower the groundwater level from 139.2 to 138.3 m (0.9 m drop), resulting in the mitigation of waterlogging in 45% (14,400 ha) of the severely waterlogged area. The present study recommends that complete concrete lining of the T-S link canal has a huge potential to reduce seepage from the canal, and the combination of the rehabilitation of the 43 drainage tube wells and surface drains also offers a great potential for controlling waterlogging. This intervention can also be considered to mitigate waterlogging from the severely waterlogged area. Cost-effectiveness analysis of the concrete lining of the T-S link canal, the rehabilitation of the 43 existing drainage tube wells, and the rehabilitation of the existing surface drains need to be performed for decision-making and selection of the most cost-effective intervention for implementation. A study needs to be conducted for the development and evaluation of economical and socio-technically feasible and acceptable preventive waterlogging management interventions, including the improved management of irrigation systems, improved irrigation management practices at the farm, improved conjunctive management of surface and groundwater, and improved management of drainage systems at the primary, secondary, and tertiary canal command levels.
1. Introduction
Land becomes waterlogged when the groundwater table rises to such a level that the soil pores become saturated with water by displacing the air. When water accumulates in a specific area, the dissolved salts move to the upper horizon and form a white salty layer, leading to soil salinity. The rise in the water table occurs due to improper irrigation practices, a lack of adequate drainage, and seepage from the rivers and irrigation channels. In many irrigated areas around the globe, rising water tables have led to waterlogging and salinity problems. These problems devour the productive capacity of agricultural land, causing huge economic losses.
The traditional methods used for the monitoring and evaluation of waterlogging and salinity problems include soil surveys, questionnaires, and laboratory analyses. Currently, numerical modeling is widely used for assessing and managing waterlogging problems. Ref. [1] Conducted a modeling study for mapping soil salinity and sodicity using remote sensing and geographic information systems (GIS) in Egypt. They also provided salinity management techniques to ameliorate soil. The study revealed a high correlation between the soil salinity and remote-sensing spectral indices SIA, SI3, VSSI, and SI9 (R2 = 0.90, 0.89, 0.87, and 0.83), respectively. They found that salt-affected soils in the study area cover about 56% of cultivated land. Reference [2] applied the SEEP/W model to compare seepage flow through homogeneous and non-homogeneous earthen dams. They concluded that (i) SEEP/W could quantify the seepage under both the pervious and impervious conditions through the homogenous and non-homogeneous earthen dams, and (ii) the seepage characteristics were different in the homogeneous and non-homogeneous earthen dams under the pervious and impervious conditions. Ref. [3] also used the SEEP/W model for the investigation and management of seepage through earthen dams and canals. Ref. [4] Investigated the spatial relationship of low-quality irrigation water and waterlogging in arid and semiarid environments. The multi-decadal (1990–2020) time series Landsat images and hadrochemical water analysis were employed within geographical information system mapping (GIS) to understand the relationship between irrigation water, soil salinity, and waterlogging in the western Nile Delta, Egypt. The study revealed a strong spatial relationship between waterlogging and salinity of irrigation groundwater. Long-term irrigation with high salinity groundwater led to increased soil salinity, low soil permeability, and waterlogging. The study offered a time- and cost-efficient geospatial method for regional monitoring of surface waterlogging and mitigation strategies for cropland degradation and agricultural drainage water recycling that would benefit stakeholders and decision-makers. Refs. [5,6] have used the MODFLOW model to investigate seepage, groundwater table behavior, and management. Ref. [7] Conducted numerical modelling study using MODFLOW and MODPATH models to determine the causes and management of waterlogging problem in El-Salhiya canal and surrounding El-Heseneya canal, East Delta, Egypt. They found that leakage of surface water from canals (irrigation network) and drainage systems along with excess irrigation water is a main reason for development of waterlogging problem in the study area. MODFLOW results revealed that 2.5 m deep drains are the most effective intervention for mitigation of waterlogging problem. Refs. [8,9] used the MODFLOW model to investigate seepage, groundwater table behavior, and management.
Ref. [10] Investigated the development of waterlogging in the cultivated and arable areas in the Farafra and Baharia Oases closed drainage basins of Egypt using the remote sensing and GIS techniques. The study revealed that the downward percolation of excess irrigation water is limited by the development of subsurface hardpan saturating the upper layer of soil with water. The seepage from the newly cultivated areas revealed the pattern of buried alluvial channels, which are waterlogged. A large water pond has submerged the surrounding fields. The study suggested that the geomorphology of closed drainage basins needs to be considered when planning for a new cultivation in dryland catchments to better control waterlogging hazards. The drainage and seepage water can be conveyed through the inactive alluvial channels into certain abandoned playas for evaporation. Ref. [11] used the MODFLOW model to investigate seepage, groundwater table behavior, and management. Ref. [12] conducted a drainage study in seven pilot areas of India under the Indo-Dutch Network Project on “Research on the control of Waterlogging and Salinization in Irrigated Agricultural Lands”. Key findings of this research included that (i) horizontal subsurface drainage by pipe or open drains was proven to be a socio-technically feasible, acceptable, and cost-effective technology to reclaim waterlogged and salinized lands, (ii) surface drainage is essential to remove excess water from the land surface in the monsoon season, (iii) integration of surface drainage with subsurface drainage is essential, and (iv) restoration of the natural drainage capacity considerably reduces the need for or intensity of subsurface drainage. Refs. [13,14] used the SEEP/W model for the investigation and management of seepage through earthen dams and canals. Ref. [15] simulated the impact of groundwater pumping on the Chenab River’s well field by applying the groundwater model that includes Groundwater Vista with MODFLOW. They predicted future urban water supply conditions considering six scenarios based on the groundwater pumping system’s existing capacity for 2030.
Ref. [16] developed and applied an integrated approach to address the waterlogging and salinity issues in the semi-arid regions of India, particularly the Haryana State of India. The approach included both preventive and curative measures. The preventive measures included the lining of the irrigation water conveyance system and its regular maintenance; efficient on-farm management practices (high-efficiency irrigation methods, including sprinkler, drip, and furrow); a reduction in canal water allowance during periods of high supply, and the conjunctive use of canal and groundwater. The curative measures included surface drainage, subsurface drainage (tubewell and horizontal tile drainage), and bio-drainage. Refs. [17,18,19] mapped waterlogged and salinized areas in India by employing LISS-III satellite imagery of pre-monsoon and post-monsoon seasons. They found seasonally waterlogged areas of 454.96 ha (2.37%) and perennial waterlogged areas of 535.54 ha (2.79%) of the total command area. The study revealed only 0.46% of the command area as saline land and the remaining 99.54% area as non-saline [20]. Refs. [21,22,23,24] have used the SEEP/W model for the investigation and management of seepage through earthen dams and canals.
Ref. [25] used the MODFLOW model to investigate seepage, groundwater table behavior, and management. Ref. [26] conducted a numerical modeling study using the MODFLOW and MT3D models to investigate the groundwater levels and quality in the command area of the Lower Chenab Canal, Pakistan. They found that almost half of the aquifers of the study area had a marginal to harmful quality of groundwater. Ref. [27] conducted a numerical groundwater modeling study using the Visual MODFLOW model to quantify the seepage along the Haveli and Trimmu–Sidhnai link canals. He found that the seepage rates in the successive Kharif and Rabi seasons were about 5 Mm3 and 10 Mm3 more than the previous Kharif and Rabi seasons in the Haveli and T-S link canals, respectively. Refs. [28,29] used the SEEP/W model for the investigation and management of seepage through earthen dams and canals.
Ref. [30] Investigated the groundwater table rise and its related problems at the Abu Mena archaeological and cultural site and explored the reasons of water table rise. The study revealed that groundwater table has risen considerably and reached the ground surface causing the waterlogging problem. Waterlogging development occurred due to inadequate sewerage, excessive irrigation and poor drainage systems. It was recommended that waterlogging can be prevented, or at least mitigated, through improved management of irrigation, drainage and sewage systems.
Present study aimed at performing numerical modelling for seepage and groundwater investigation using SEEP/W and MODFLOW models. SEEP/W model was used to quantify the seepage from the T-S link canal under the existing condition (without any intervention) and under the interventions of concrete lining of complete prism of T-S link canal and concrete side protection of T-S link canal keeping the canal bed unlined and. MODFLOW was used to simulate the groundwater behavior in the area around the T-S link canal under the interventions of rehabilitation of: existing 43 drainage tube wells, existing surface drains and combination of existing 43 drainage tube wells and existing surface drains.
2. Materials and Methods
2.1. Research Area Description
The present study was conducted for the area along the Trimmu-Sidhnai (T-S) link canal (Figure 1). The study area located in Punjab, Pakistan is triangular in shape with Trimmu barrage at the top, Chenab river in the west, Ravi river in the south and a narrow belt of land along link canal, about 1.61 km wide in the east. The T-S link canal links river Chenab with river Ravi with a design discharge capacity of 354 m3/s. The area along T-S link canal is an irrigated agriculture land. The climate of the study area is hot and dry. During summer, minimum and maximum temperature is 21 °C and 42.3 °C, respectively, and in winter, minimum and maximum temperature is 4.5 °C and 28.7 °C, respectively. The average annual rainfall is about 190 mm. The nearest Meteorological station is Multan.
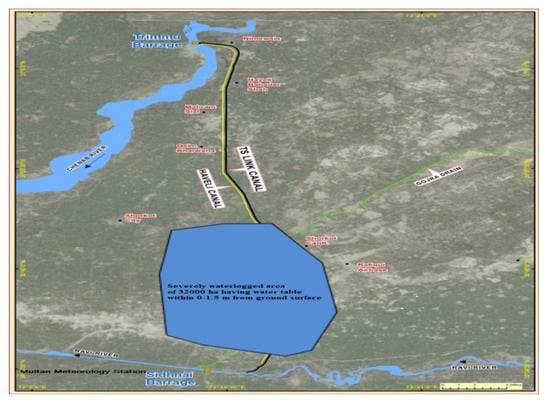
Figure 1.
Location Map of Trimmu-Sidhnai Link Canal and Waterlogged Area (Shaded Blue).
The seepage from unlined T-S link and damaged brick lining of Haveli canals, distributaries and minors, watercourses, deep percolation from irrigated agriculture fields, rainfall recharge and lateral groundwater inflow have caused waterlog in the study area. The situation further deteriorated, when 43 Salinity Control & Reclamation Project (SCARP) tube wells installed on the left bank of T-S link canal and right bank of Haveli main canal became inoperative along with poorly maintained surface drainage network. An area of 32,000 ha located along the tail reach of the T-S link canal (shaded blue in Figure 1) is severely waterlogged having groundwater table within 0–1.5 m from the ground surface [19].
2.2. Data Collection
Data required for the present study was collected from the Punjab Irrigation Department, Punjab Directorate of Land Reclamation and National Engineering Services Pakistan (NESPAK). The collected data included: discharges of Rivers Chenab and Ravi, discharges of T-S link canal and Haveli canal, discharges and commands of distributaries, discharges of surface drains, discharges of public and private tube wells, groundwater table depths, groundwater recharge and discharge, groundwater aquifer physical and hydraulic data including aquifer thickness, horizontal hydraulic conductivity, vertical hydraulic conductivity, anisotropy ratio and specific yield. Data of 24 observation wells/piezometers installed along the T-S link canal was collected from the International Waterlogging and Salinity Research Institute (IWASRI) of Water and Power Development Authority (WAPDA) for the six-year period (2011 to 2017).
2.3. Seepage Model Development
The seepage model was developed using the finite element SEEP/W software (developed in 2012 by GEOSLOPE International Ltd., Calgary, AB, Canada) to quantify the seepage flux from the T-S link canal considering the steady state conditions. Seepage model development consisted of setting the canal geometry, assigning the material properties; and boundary conditions.
2.4. Canal Geometry
Canal geometry included: bed width, top width, bed level, depth of flow and full supply level (FSL). In the present study, for T-S link canal, bed width of 76.2 m, top width of 134.1 m, bed level of 141 m, FS flow depth of 3.8 m and FS level of 144.8 m [31] were input in the SEEP/W model.
2.5. Material Properties
The main material properties included saturated hydraulic conductivity and anisotropy ratio. In the present study, saturated hydraulic conductivity (Kx) of 0.000049 m/s and saturated hydraulic conductivity (Ky) of 0.000012 m/s and anisotropic ratio of 0.25 were used in the SEEP/W model [19].
2.6. Boundary Conditions
Canal head of 144.8 m and groundwater table depth of 1.5 m were assigned to the model as boundary conditions. In order to carry out steady state analysis; canal head and groundwater table depth were kept constant.
2.7. Seepage Model Application
The seepage model (SEEP/W) was applied to the T-S link canal to simulate seepage fluxes under the existing condition (without any seepage control intervention) and under the different seepage control interventions. Model evaluated the effectiveness of the interventions of concrete lining of complete prism of T-S link canal and concrete side protection keeping the bed of T-S link canal unlined, in controlling seepage from T-S link canal thereby managing waterlogging in the area surrounding the T-S link canal.
2.8. Groundwater Model Development
The groundwater model for T-S link canal area was developed by using the modular three-dimensional finite difference groundwater flow simulation software developed by the United States Geological Survey. Development of groundwater model requires that the model area be divided into sub-areas called cells. Each cell requires hydrogeological data (aquifer thickness, hydraulic conductivity, specific yield, etc.) and hydrological data (recharge from irrigation applications, seepage from canals, rivers, groundwater pumpage and water table levels).
2.9. Model Domain and Grid Layout
In the present study, model grid covers an area of 0.27 million ha having 71,619 m length and 38,285 m width. Using uniform spacing of 200 m (uniform cell size of 200 m × 200 m), model grid contained 358 rows and 192 columns. Model domain had 68,736 cells out of which 59,197 cells were active and 9539 were non-active. Figure 2 presents the model grid layout of the area modeled in the present study.
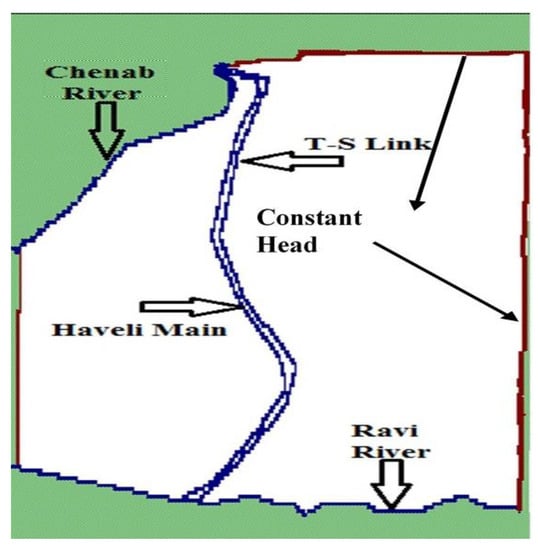
Figure 2.
Model Grid Layout.
2.10. Aquifer Thickness and Layering
Considering the aquifer thickness of 300 m and aquifer lithology, three-layer model was developed with the bottom of aquifer at 300 m depth. First layer (layer 1) was 7 m thick (from 0–7 m) containing minimum elevation of 135.5 m and maximum elevation of 147.5 m. Second layer (layer 2) was 23 m thick (from 7 to 30 m). Third layer (layer 3) was 270 m thick (from 30 to 300 m) as depicted in Figure 3.
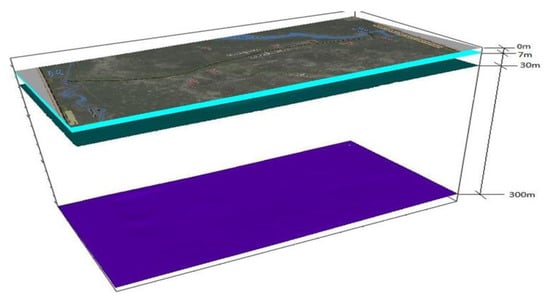
Figure 3.
Three-Dimensional Pictorial View of Model Layers.
2.11. Aquifer Hydrogeological Parameters
Horizontal hydraulic conductivity, vertical hydraulic conductivity, specific yield and specific storage used for layer1 included 35 m/day, 1.6 m/day, 12%, and 0.50 × 10⁻³ m−1, respectively. Horizontal hydraulic conductivity, vertical hydraulic conductivity, specific yield and specific storage used for layer 2 were 86 m/day, 3.7 m/day, 20%, and 0.20 × 10⁻³ m−1, respectively. Horizontal hydraulic conductivity, vertical hydraulic conductivity, specific yield and specific storage used for layer 3 were 98 m/day, 3.7 m/day, 20%, and 0.20 × 10⁻³ m−1, respectively [27].
2.12. Boundary Conditions
Constant head boundary (CHB) and general head boundary (GHB) packages were assigned to the model domain. River package was assigned to both canals (T-S link and Haveli canals) and rivers (Chenab and Ravi Rivers). Drain package was assigned to the drainage network. Active and inactive cells were specified to the model. Ravi and Chenab Rivers were taken as general head boundaries (GHB) of the model. The boundary conditions of the model are shown in Figure 2. In the Northwest part of the model domain, cells are marked as River Chenab in blue color. In the South part of the model domain, cells are marked as River Ravi in blue color. The remaining West, East and North right corners are marked as constant head boundary (CHB). In addition, Haveli main canal and T-S link canal were given River package in the model domain. All the non-active cells are marked with green color in the model domain. River packages are marked with blue color in the model domain. Recharge package and evapotranspiration package were also incorporated in the model boundary condition. Total evapotranspiration was taken as 1000 mm/year [19]. Total groundwater recharge is given in Table 1. Total recharge was calculated as the sum of average weighted seepage from Haveli main canal and T-S link canal, recharge from distributaries, water courses and irrigated fields, recharge from the precipitation and groundwater inflow outflow [19].

Table 1.
Recharge Flux to Groundwater Aquifer (Source: [19]).
2.13. Model Simulation Period/Stress Periods
Model simulations were made for six- year period covering from April, 2011 to March, 2017. Total simulation period was divided into 12 stress periods to represent Kharif (summer) season and Rabi (winter) season. The stress period of Kharif season consisted of 182 days covering months from April to September. The stress period of Rabi season consisted of 183 days covering months from October to March.
2.14. Model Calibration
Out of 24 observation wells installed in the study area, data of 6 observations wells were used to calibrate the model for the first six stress periods (April 2011 to March 2014). In the calibration process, simulated groundwater levels (heads) were compared with the observed groundwater levels (heads) by adjusting the hydrogeological parameters (Kh, Kv, Sy and Ss) to the extent at which there was a close agreement between the simulated and observed groundwater levels (heads). Model calibration curves are depicted in Figure 4.
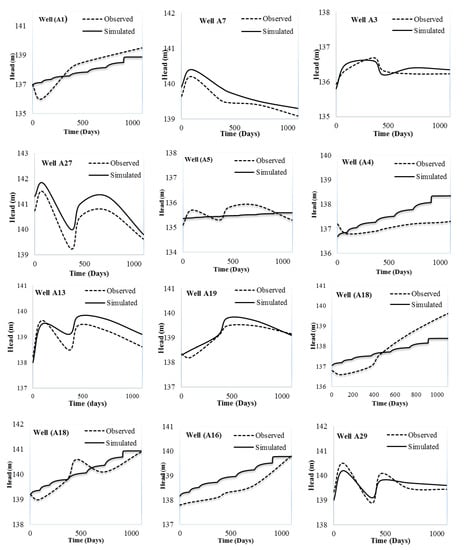
Figure 4.
Model Calibration Curves.
After model calibration, an error analysis was performed and values of statistical parameters including Root Mean Square Error (RMSE), Coefficient of Determination (R2) and Nash-Sutcliff Efficiency (NSE) were determined. RMSE gives the standard deviation of the residuals. RMSE tells how concentrated data is around the best fit line. RMSE was determined by using the following equation:
where
X = Simulated Values
Y = Observed Values
The bar above the squared differences indicates the mean of the squared differences [8].
The Nash-Sutcliffe Efficiency (NSE) indicates how well the plot of observed versus simulated data fits the line [18]. NSE was determined by using the following equation:
The value of RMSE found after calibration was 0.499 which falls in the RMSE acceptable range of 0–0.7 [12]. Therefore, this value of RMSE showed a close agreement between the simulated and observed groundwater levels. The value of R2 found after calibration was 0.87 which falls in the R2 acceptable range of, 0.7–1 [28] reflecting a good agreement between the simulated and observed groundwater levels. The value of NSE found after calibration was 0.65 which falls in the NSE acceptable range of 0.5–1 [17] reflecting a good agreement between the simulated and observed groundwater levels The values of RMSE, R2 and NSE of 0.499, 0.87 and 0.65, respectively, falling in their acceptable ranges indicated that the model was calibrated reasonably well). Figure 5 shows the graph of simulated and observed groundwater levels at the end of 6th stress period (March 2014). The solid dark lines show the limit of ± 0.5–2 m (Source: Manual of MODFLOW PRO, US Geological Survey (USGS), Denver, CO, USA), dotted line represents the best fit line and points show observed and simulated groundwater levels. Figure 6 reveals that observed and simulated groundwater levels fall within the limit of ±0.5–2 m reflecting that model has been calibrated reasonably well.
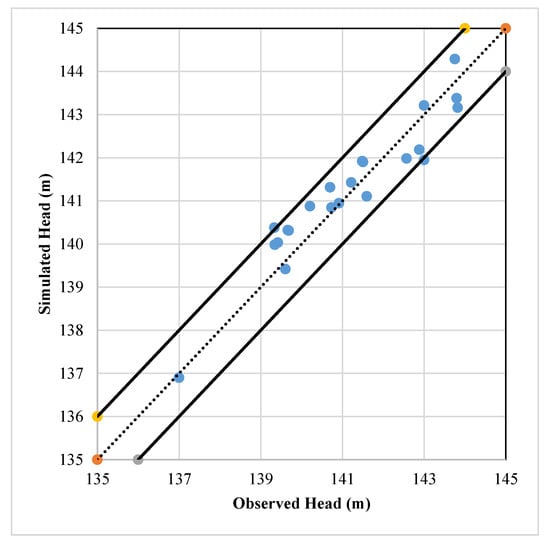
Figure 5.
Model Calibration Graph.
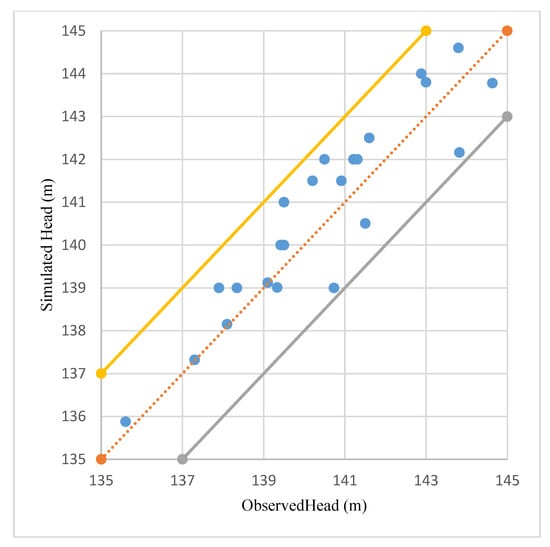
Figure 6.
Model Validation Graph.
2.15. Model Validation
Model was validated for last six stress periods (April 2014 to March 2017) using the data of 6 observations wells. The values of Root Mean Square Error (RMSE), Coefficient of Determination (R2) and Nash Sutcliff Efficiency (NSE) was determined and checked against their acceptable ranges. The value of RMSE was found 0.554, whereas acceptable range for RMSE is 0–0.7 [12]. The value of R2 was found 0.844, whereas acceptable range for R2 is 0.7–1 [12]. The value of NSE was found 0.56 whereas acceptable range for NSE is 0.5–1 [18]. The value of RMSE, R2 and NSE were found 0.554, 0.844 and 0.56, respectively, which evidenced the validation of the model. Figure 6 shows the graph of simulated and observed groundwater levels at the end of 6th stress period (March 2017). The solid yellow and gray lines show the limit of ± 0.5–2 m, dotted line represents the best fit line and points show observed and simulated groundwater levels. Figure 6 reveals that observed and simulated groundwater levels fall within the limit of ± 0.5–2 m reflecting that model has been validated.
2.16. Groundwater Model Application
The calibrated and validated groundwater model was applied to the study area to simulate the groundwater levels under the interventions of (i) rehabilitation of existing 43 drainage tube wells, (ii) rehabilitation of existing surface drains, and (iii) combination of rehabilitation of existing 43 drainage tube wells and existing surface drains thereby evaluated the effectiveness of these interventions in controlling the waterlogging problem in the study area. Rehabilitation of existing 43 drainage tube wells and existing surface drains as per their design features (making them to work at 100% efficiency) was input in the model and groundwater level behavior was simulated considering these interventions individually.
3. Results and Discussion
3.1. Simulation of Existing Canal Seepage without Any Intervention
The seepage model quantified the existing seepage flux of 0.0113 m3/s/100 m of T-S link canal under the water flow depth (full supply flow depth) of 3.8 m with groundwater table depth of 1.5 m, the existing seepage flux of 0.0128 cumec/100 m of T-S link canal under the water flow depth of 3.8 m with groundwater table depth of 2.3 m and the existing seepage flux of 0.0053 m3/s/100 m of T-S link canal under the water flow depth of 2.4 m with groundwater table depth of 1.5 m. Clearly, the higher water flow depth of 3.8 m with greater groundwater table depth of 2.3 m resulted in the highest canal seepage flux of 0.0128 m3/s/100 m and the lower water flow depth of 2.4 m with lower groundwater table depth of 1.5 m resulted in the lowest canal seepage flux of 0.0053 m3/s/100 m.
3.2. Evaluation of Concrete Lining Intervention
In the present study, 10 cm thick concrete lining of 38 km long tail reach of T-S link canal was considered for evaluation of effectiveness in waterlogging control by seepage model. Bed width of the canal was reduced from 76.2 m to 61.0 m keeping the existing values of canal discharge and full supply flow depth of 311.4 cumec and 3.8 m, respectively. The 38 km long tail reach of T-S link canal was considered for lining because the severely waterlogged area of 32,000 ha is located along this reach which needs waterlogging management.
The seepage model evaluation of intervention of concrete lining of T-S link canal resulted in canal seepage flux of 0.0057 cumec/100 m compared to existing (without concrete lining) seepage flux of 0.0113 cumec/100 m under the water flow depth of 3.8 m with groundwater table depth of 1.5 m reflecting 50% reduction in seepage flux with concrete lining of the T-S link canal. The canal seepage flux of 0.0071 cumec/100 m was obtained under the water flow depth of 3.8 m with groundwater table depth of 2.3 m. The comparison of 0.0071 cumec/100 m seepage flux with existing seepage flux of 0.0128 cumec/100 m reflects 45% reduction in seepage flux with concrete lining of the T-S link canal. The seepage flux of 0.0032 cumec/100 m was obtained under the water flow depth of 2.4 m with groundwater table depth of 1.5 m. The comparison of 0.0032 cumec/100 m seepage flux with existing seepage flux of 0.0053 cumec/100 m reflects 40% reduction in seepage flux with concrete lining of the T-S link canal. On overall basis, concrete lining intervention resulted in 40 to 50% reduction in seepage of the T-S link canal. Maximum seepage reduction of 50% was obtained under the water flow depth of 3.8 m with groundwater table depth of 1.5 m which is the prevalent scenario in the T-S link canal adjacent area.
3.3. Evaluation of Concrete Side Protection Intervention
Under the intervention of concrete side protection with brick toe wall, 10 cm thick lining was considered for side protection to be rested on brick toe wall and canal bed was considered unlined for the 38 km long tail reach of the T-S link canal. The seepage flux of 0.0089 cumec/100 m (with concrete side protection) compared to existing (without concrete side protection) seepage flux of 0.0113 cumec/100 m under the water flow depth of 3.8 m with groundwater table depth of 1.5 m reflected 21% reduction in seepage flux with concrete side protection of the T-S link canal. The canal seepage flux of 0.0104 cumec/100 m was obtained under the water flow depth of 3.8 m with groundwater table depth of 2.3 m. The comparison of 0.0104 cumec/100 m seepage flux (with concrete side protection) with existing seepage flux of 0.0128 cumec/100 m reflected 19% reduction in seepage flux with concrete side protection of the T-S link canal. The seepage flux of 0.0047 cumec/100 m was obtained under the water flow depth of 2.4 m with groundwater table depth of 1.5 m. The comparison of 0.0047 cumec/100 m seepage flux with existing (without concrete lining) seepage flux of 0.0053 cumec/100 m reflects 11% reduction in seepage flux with concrete side protection of the T-S link canal. On overall basis, concrete side protection intervention resulted in 11 to 21% reduction in seepage of the T-S link canal. Maximum seepage reduction of 21% was obtained under the water flow depth of 3.8 m with groundwater table depth of 1.5 m which is the prevalent scenario in the T-S link canal and its adjacent command area.
The comparison of maximum seepage reduction of 50% by concrete lining intervention with maximum seepage reduction of 21% by concrete side protection intervention under the full supply flow depth of 3.8 m with groundwater table depth of 1.5 m revealed that concrete lining intervention is more effective in reducing canal seepage compared to concrete side protection intervention. It implies that intervention of concrete lining of T-S link canal could be considered for implementation for controlling canal seepage thereby for managing waterlogging in the area adjacent to the T-S link canal.
3.4. Depth to Water Table (DTW)
As shown in Figure 7, simulated DTW varied form 0–20 m in the vicinty of the T-S link canal command. On the right side of the T-S link canal, DTW varied from 0 to 4 m. On the left side of the canal DTW varied from 4 to 20 m. Clearly, severely waterlogged area (having DTW in the range of 0–1 m) shown by dark blue color in Figure 7 was found in the right-side command of lower reach of T-S link canal. The simulated DTW values in the range of 4–20 m did not reveal the waterlogged area on the left side of T-S link canal command.
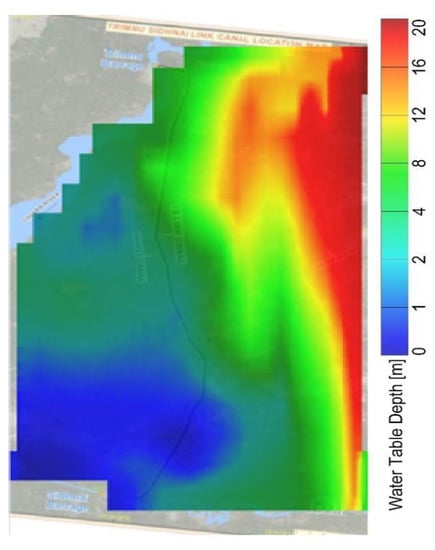
Figure 7.
Simulated Depth to Water Table in the Study Area.
3.5. Evaluation of Waterlogging Management Intervention 1: Rehabilitation of Existing 43 Drainage Tubewells
Rehabilitation of Existing 43 Drainage Tubewells (working with full efficiency) was considered as the first intervention for mitigation of waterlogging from the study area. Table 2 depicts detailed information (data) about the 43 drainage tubewells.

Table 2.
Data on 43 Drainage Tubewells (Source: [27]).
Figure 8 reveals the model results on evaluation of rehabilitation of 43 drainage tubewells working with full efficiency. The comparison of model simulated results with actual waterlogged area depicted a reduction of 0.2 m in the groundwater level providing a relief of about 9% to the waterlogged area (2880 ha of 32,000 ha).
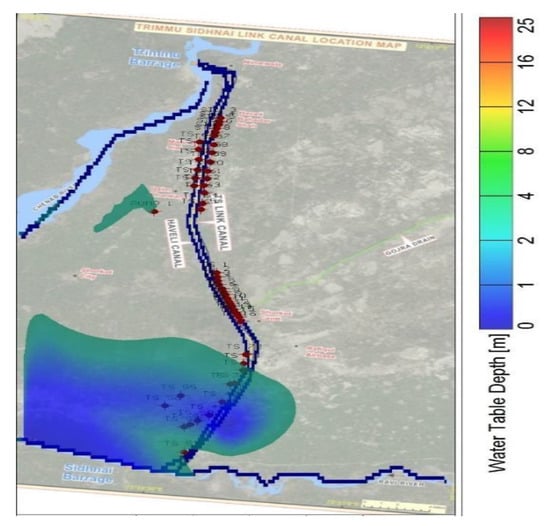
Figure 8.
Simulated Depth to Water Table under Intervention 1.
3.6. Evaluation of Waterlogging Management Intervention 2: Rehabilitation of Existing Surface Drains
Rehabilitation of Existing Surface Drainage Network (working with full efficiency) was considered as the second intervention for mitigation of waterlogging from the study area. Table 3 depicts detailed data about the surface drainage network rehabilitated to restore as per design for working with full efficiency. Figure 9 shows the surface drainage network of the study area.

Table 3.
Data on Rehabilitated Surface Drains (Source: [30]).
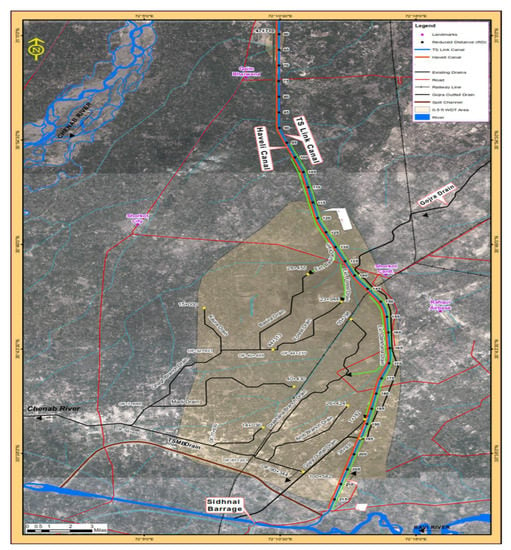
Figure 9.
Surface Drainage Network of the Study Area (Source: [30]).
Figure 10 shows the results of model for rehabilitated existing drainage network working with full efficiency. The comparison of model results with actual waterlogged area revealed a reduction of about 0.45 m in water level providing a relief of about 19% to the waterlogged area (6080 ha of 32,000 ha).
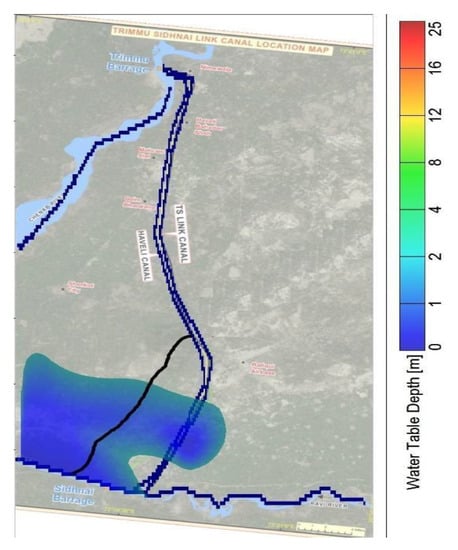
Figure 10.
Simulated Depth to Water Table Depth under Intervention 2.
3.7. Evaluation of Waterlogging Management Intervention 3: Combination of Rehabilitation of Existing 43 Drainage Tube Wells and Rehabilitation of Existing Surface Drains
Combination of Rehabilitation of Existing 43 Drainage Tube wells (working with full efficiency) andRehabilitation of Existing Surface Drainage Network (working with full efficiency) was considered as the third intervention for waterlogging management. Figure 11 reveals the results of model for rehabilitation of 43 drainage tube wells and existing surface drainage network working with full efficiency. When the results were compared with actual waterlogged area it was observed there was reduction of about 0.9 m in water level providing a relief of about 45% to the waterlogged area (14,400 ha of 32,000 ha).
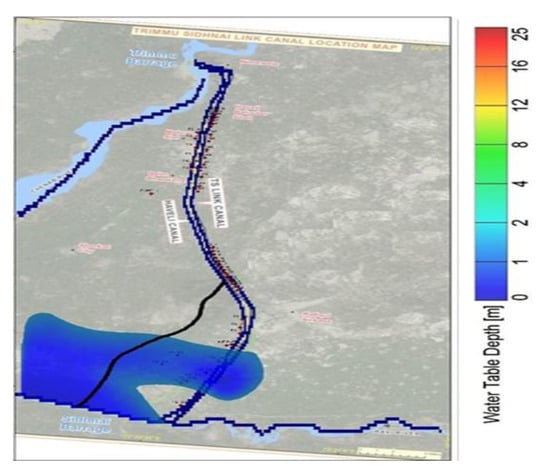
Figure 11.
Simulated Water Table Depth under Intervention 3.
3.8. Comparison of Effectiveness of Waterlogging Management Interventions
The average groundwater level in the study area without any intervention is about 139.2 m which is causing waterlogging problem. Model evaluation revealed water level lowering of 0.20 (from 139.2 to 139 m), 0.45 (from 139.2 to 138.75 m) and 0.90 m (from 139.2 to 138.3 m) under the intervention 1: Rehabilitation of Existing 43 Drainage Tube wells, intervention 2: Rehabilitation of Existing Surface Drainage Network and intervention 3: Combination of Rehabilitation of Existing 43 Drainage Tube wells and Rehabilitation of Existing Surface Drainage Network, respectively (Figure 12). Clearly, intervention 3 (Combination of Rehabilitation of Existing 43 Drainage Tube wells and Rehabilitation of Existing Surface Drainage Network) looks more effective in controlling waterlogging because it could lower groundwater level by 0.90 m which would result in waterlogging reduction in 45% area of severely waterlogged area.
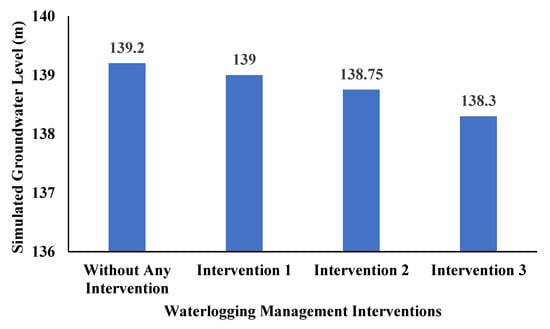
Figure 12.
Simulated Groundwater Levels with and without Waterlogging Management Interventions.
4. Conclusions and Recommendations
4.1. Conclusions
The main conclusions derived from the present study include:
- The seepage modeling using SEEP/W model revealed that waterlogging management intervention of complete concrete lining of T-S link canal can reduce 50% of the seepage (0.0113 cumec per 100 m) from the T-S link canal when flowing at its full supply flow depth of 3.8 m.
- The seepage modelling using SEEP/W model revealed that waterlogging management intervention of concrete side protection of T-S link canal can reduce 21% of the seepage (0.0113 cumec per 100 m) from the T-S link canal when flowing at its full supply flow depth of 3.8 m.
- Considering the effectiveness of the concrete lining and concrete side protection of T-S link canal, comparison of these interventions revealed that concrete lining intervention can reduce 50% of total seepage of the T-S link canal. The effectiveness of this intervention in controlling seepage seems reasonably good (50% reduction in seepage). The concrete side protection intervention does not seem very effective in controlling seepage (only 21% reduction in seepage). Though concrete lining of T-S link canal could be considered for implementation, cost-effectiveness analysis of this intervention needs to be performed prior to its implementation.
- The groundwater numerical modeling using MODFLOW model revealed that the rehabilitated 43 drainage tube wells working with full efficiency could lower groundwater level by about 0.2 m resulting in waterlogging mitigation from about 9% (2880 ha) of the waterlogged area (32,000 ha).
- The groundwater modeling revealed that waterlogging management intervention of rehabilitation of existing surface drains can lower the groundwater table by 0.45 m. This intervention can mitigate waterlogging from about 19% (6080 ha) of the severely waterlogged area.
- The groundwater modeling revealed that rehabilitated 43 drainage tube wells and surface drains working with full efficiency can lower the groundwater table by 0.9 m. This intervention can mitigate waterlogging from about 45% (14,400 ha) of the severely waterlogged area.
- The comparison of the effectiveness of the interventions of rehabilitation of 43 drainage tube wells, rehabilitation of surface drains and combination of rehabilitation of 43 drainage tube wells and surface drains revealed that combination of rehabilitation of 43 drainage tube wells and surface drains intervention can reduce waterlogging in the 45% area of the severely waterlogged area. The effectiveness of this intervention in controlling waterlogging seems reasonably good.
4.2. Recommendations
The main recommendations emerged from the present study include:
- Complete concrete lining of T-S link canal intervention has a huge potential to reduce seepage from the canal. This intervention could be considered for implementation to mitigate waterlogging in the area adjacent to T-S link canal.
- The combination of rehabilitation of 43 drainage tube wells and surface drains intervention also offers a great potential for controlling waterlogging. This intervention can also be considered for implementation to mitigate waterlogging from the severely waterlogged area.
- For effective and sustainable management of waterlogging in the vicinity of T-S link canal, combination of interventions of concrete lining of T-S link canal, rehabilitation of 43 drainage tube wells and rehabilitation of surface drains could be considered for implementation.
- Cost-effectiveness analysis of the concrete lining of T-S link canal intervention, rehabilitation of existing 43 drainage tube wells intervention, and rehabilitation of existing surface drains intervention needs to be performed for decision-making and selection of the most cost-effective intervention for implementation.
4.3. Areas for Future Research
A future line of research as preventive measures to control waterlogging and salinity development in canal command areas may focus on the studies mentioned below.
- A study should be carried out to develop technically and economically effective and sustainable management interventions for improved management of irrigation systems, improved irrigation management practices at the farm, improved conjunctive management of surface and groundwater, and improved management of drainage systems at primary, secondary and tertiary canal command levels.
- A study should be conducted for evaluation of impact of improved management of irrigation systems, improved irrigation management practices at the farm, improved conjunctive management of surface and groundwater and improved management of drainage systems on waterlogging in the canal commands.
Author Contributions
Conceptualization, M.A., M.U.S., A.A. and N.A.; investigation, N.A., K.C. and H.T.; methodology, K.C. and H.T.; validation, P.J. and Q.H.; writing—original draft, M.A., M.U.S., A.A. and N.A.; writing—review and editing, M.A., M.U.S., A.A., N.A. and Q.H. All authors have read and agreed to the published version of the manuscript.
Funding
This research received no external funding.
Institutional Review Board Statement
Not applicable.
Informed Consent Statement
Not applicable.
Data Availability Statement
The study did not report any data.
Conflicts of Interest
The authors declare that there is no conflict of interest.
References
- Aboelsoud, H.M.; AbdelRahman, M.A.E.; Kheir, A.M.S.; Eid, M.S.M.; Ammar, K.A.; Khalifa, T.H.; Scopa, A. Quantitative Estimation of Saline-Soil Amelioration Using Remote-Sensing Indices in Arid Land for Better Management. Land 2022, 11, 1041. [Google Scholar] [CrossRef]
- Alam, S.; Ahmed, M.; Hasan, M. Seepage Characteristics of Homogeneous and Non-homogeneous Earthen Dam by FEM. J. Geotech. 2021, 6, 14–29. [Google Scholar]
- Al-Janabi, A.M.S.; Ghazali, A.H.; Ghazaw, Y.M.; Afan, H.A.; Al-Ansari, N.; Yaseen, Z.M. Experimental and Numerical Analysis for Earth-Fill Dam Seepage. Sustainability 2020, 12, 2490. [Google Scholar] [CrossRef]
- Amer, R. Spatial Relationship between Irrigation Water Salinity, Waterlogging, and Cropland Degradation in the Arid and Semi-Arid Environments. Remote Sens. 2021, 13, 1047. [Google Scholar] [CrossRef]
- Anjum, W.A.; Ahmad, S.R.; Sanaullah, M.; Majid, Z.; Mirza, K. Geographic Information System and Modeling Approach for Groundwater Systems of Rechna Doab, Pakistan. Pak. J. Sci. 2016, 68, 470–476. [Google Scholar]
- Arshad, M.; Ahmad, N.; Usman, M. Simulating Seepage from Branch Canal under Crop, Land and Water Relationships. Int. J. Agric. Biology 2009, 11, 529–534. [Google Scholar]
- Awad, S.R.; El Fakharany, Z.M. Mitigation of Waterlogging Problem in El-Salhiya Area, Egypt. Water Sci. 2020, 34, 1–12. [Google Scholar] [CrossRef]
- Barnston, A.G. Correspondence among the correlation, RMSE, and Meidke Foresast verification measures; Refinement of the Neidke Score. Weather Forecast. 1992, 7, 699–709. [Google Scholar] [CrossRef]
- Basharat, E.M.; Saeed, E.M. Modelling the Seepage from Chashma Jhelum Link Canal and Rehabilitaion of the Waterlogged Areas. J. Hydrol. 2014, 4, 39. [Google Scholar]
- El Bastawesy, M.; Ali, R.R.; Faid, A.; El Osta, M. Assessment of Waterlogging in Agricultural Megaprojects in the Closed Drainage Basins of the Western Desert of Egypt. Hydrol. Earth Syst. Sci. 2013, 17, 1493–1501. [Google Scholar] [CrossRef]
- Hassan, G.Z.; Hassan, F.R.; Rizvi, S.A. Groundwater Management Using MODFLOW-A Case Study of Rechna Doab, Punjab, Pakistan. In Proceedings of the 73rd Annual Session of the Pakistan Engineering Congress, Punjab, Pakistan, 1 January 2014–31 December 2015; Available online: https://pecongress.org.pk/detail.php?cat_id=430&subcat_id=640&maincat_name=Proceedings&cat_name=73rd%20Annual%20Session%202014-2015 (accessed on 19 July 2022).
- Hyndman, R.J.; Koehler, A.B. Another look at measures of forecast accuracy. Int. J. Forecast. 2006, 22, 679–688. [Google Scholar] [CrossRef]
- Indo-Dutch Network Project (IDNP). Recommendations on Waterlogging and Salinity Control Based on Pilot Area Drainage Research; CSSRI, Karnal and Alterra-ILRI: Wageningen, The Netherlands, 2002; p. 100. [Google Scholar]
- Jamel, A.A.J. Analysis and Estimation of Seepage through Homogenous Earth Dam without Filter. Diyala J. Eng. Sci. 2016, 9, 38–49. [Google Scholar] [CrossRef]
- Khaliq, A.; Maqbool, A.; Tansar, H.; Bakhsh, A.; Saeed, M.; Sarwar, M.T.; Hui, W. Groundwater Pumping Modeling for the Sustainable Management of Urban Water Supply in Faisalabad City, Pakistan. Arab. J. Geosci. 2021, 14, 442. [Google Scholar] [CrossRef]
- Kumar, R.; Singh, J. Integrated Approach for the Management of Waterlogging and Salinity Problems in Haryana. In Role of drainage and challenges in 21st century. In Proceedings of the Eighth ICID International Drainage Workshop, New Delhi, India, 31 January–4 February 2000; Volume II, pp. 363–373. [Google Scholar]
- Moriasi, D.N.; Arnold, J.G.; Van Liew, M.W.; Bingner, R.L.; Harmel, R.D.; Veith, T.L. Model evaluation guidelines for systematic quantification of accuracy in watershed simulations. Trans. ASABE 2007, 50, 885–900. [Google Scholar] [CrossRef]
- Nash, J.E.; Sutcliffe, J.V. River flow forecasting through conceptual models part I—A discussion of principles. J. Hydrol. 1970, 10, 282–290. [Google Scholar] [CrossRef]
- NESPAK-AAB-DMC Joint Venture Consultants. Feasibility Study Report on Controlling Seepage Along Trimmu-Sidhnai Link Canal. 2015. Available online: https://www.nespak.com.pk/portfolio.html (accessed on 19 August 2022).
- Prajapati, G.S.; Rai, P.K.; Mishra, V.N.; Singh, P.; Shahi, A.P. Remote Sensing-based Assessment of Waterlogging and Soil Salinity: A Case Study from Kerala, India. Results Geophys. Sci. 2021, 7, 100024. [Google Scholar] [CrossRef]
- Salmasi, F.; Jafari, F. Validity of Schaffernak and Casagrande’s analytical Solutions for Seepage through a Homogeneous Earth Dam. Int. J. Pure Sci. Res. 2013, 1, 5–11. [Google Scholar]
- Sazzad, M.; Rahman, M. Effect of Clay Blanket and Chimney Filter against Seepage failure. Int. J. Adv. Struct. Geotech. Eng. 2017, 6, 77–83. [Google Scholar]
- Sazzad, M.; Islam, M. A Comprehensive Study of Different Types of Seepage Control Measures for Earth Dam Using FEM. J. Civ. Constr. Eng. 2019, 5, 24–37. [Google Scholar] [CrossRef]
- Sazzad, M.; Roy, M.; Rahman, M. FEM Based Seepage Analysis through Earth Dam. Int. J. Adv. Struct. Geotech. Eng. 2015, 4, 158–164. [Google Scholar]
- Shakoor, A.; Arshad, M.; Ahmad, R.; Khan, Z.M.; Qamar, U.; Farid, H.U.; Sultan, M.; Ahmad, F. Development of Groundwater Flow Model (MODFLOW) to Simulate the Escalating Groundwater Pumping in the Punjab, Pakistan. Pak. J. Agri. Sci. 2018, 55, 629–638. [Google Scholar] [CrossRef]
- Shakoor, A.; Khan, Z.M.; Arshad, M.; Farid, H.U.; Sultan, M.; Azmat, M.; Shahid, M.A.; Hussain, Z. Regional Groundwater Quality Management through Hydrogeological Modeling in LCC, West Faisalabad, Pakistan. J. Chem. 2017, 2017, 1–16. [Google Scholar] [CrossRef]
- Shehzad, M.U. Assessment of Canal Seepage by Numerical Simulation at Trimmu Sidhnai Link Canal; The Centre of Excellence in Water Resources Engineering University of Engineering and Technology: Lahore, Pakistan, 2021. [Google Scholar]
- Simon, G.; Moore, D. The Basic Practice of Statistics. Am. Stat. 1996, 50, 277. [Google Scholar] [CrossRef]
- Suleimany, J.M.S.; Mamand, B.S. Estimating Seepage Quantity through Homogenous Earth-Fill Dam with Horizontal Drainage Using Different Methods. ZANCO J. Pure Appl. Sci. 2020, 32, 7–18. [Google Scholar] [CrossRef]
- Tahir, H. Waterlogging Management Modelling—A Case Study of Trimmu-Sidhnai Link Canal of Punjab, Pakistan; The University of Lahore: Lahore, Pakistan, 2019. [Google Scholar]
- Zaghloula, E.A.; Abdeena, M.M.; Elbeiha, S.F.; Solimanb, M.A. Waterlogging Problems in Egypt’s Deserts: Case Study Abu Mena Archaeological Site Using Geospatial Techniques. Egypt. J. Remote Sens. Space Sci. 2020, 23, 387–399. [Google Scholar]
Publisher’s Note: MDPI stays neutral with regard to jurisdictional claims in published maps and institutional affiliations. |
© 2022 by the authors. Licensee MDPI, Basel, Switzerland. This article is an open access article distributed under the terms and conditions of the Creative Commons Attribution (CC BY) license (https://creativecommons.org/licenses/by/4.0/).