


Effect of Traffic Lights Countdown Timer and Motorcycle Lanes as an Approach to the Red Box for Motorcycles in Bali Island

 , , , , , , , , , , and
Abstract
1. Introduction
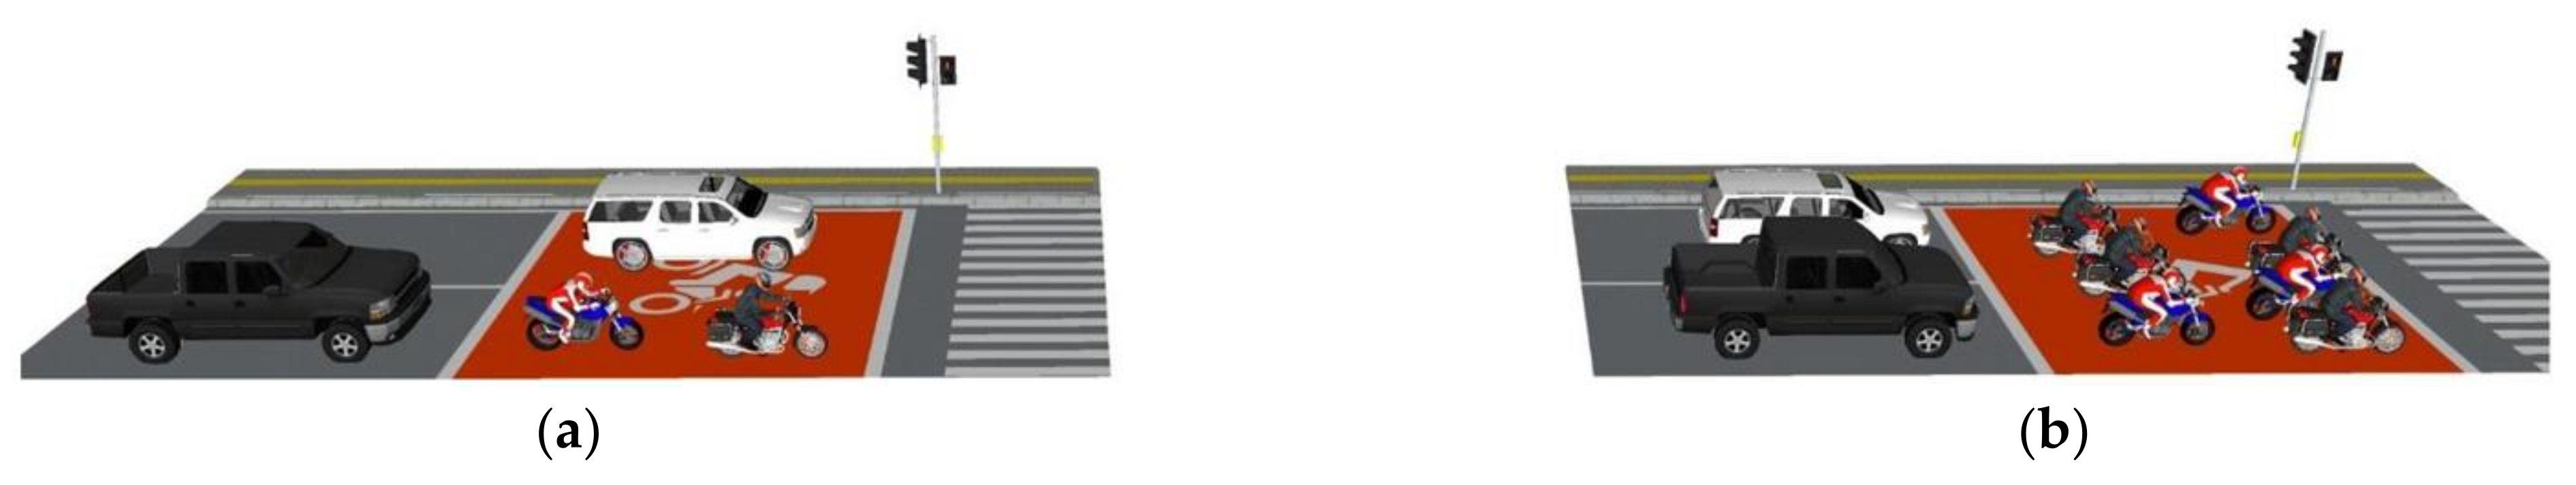
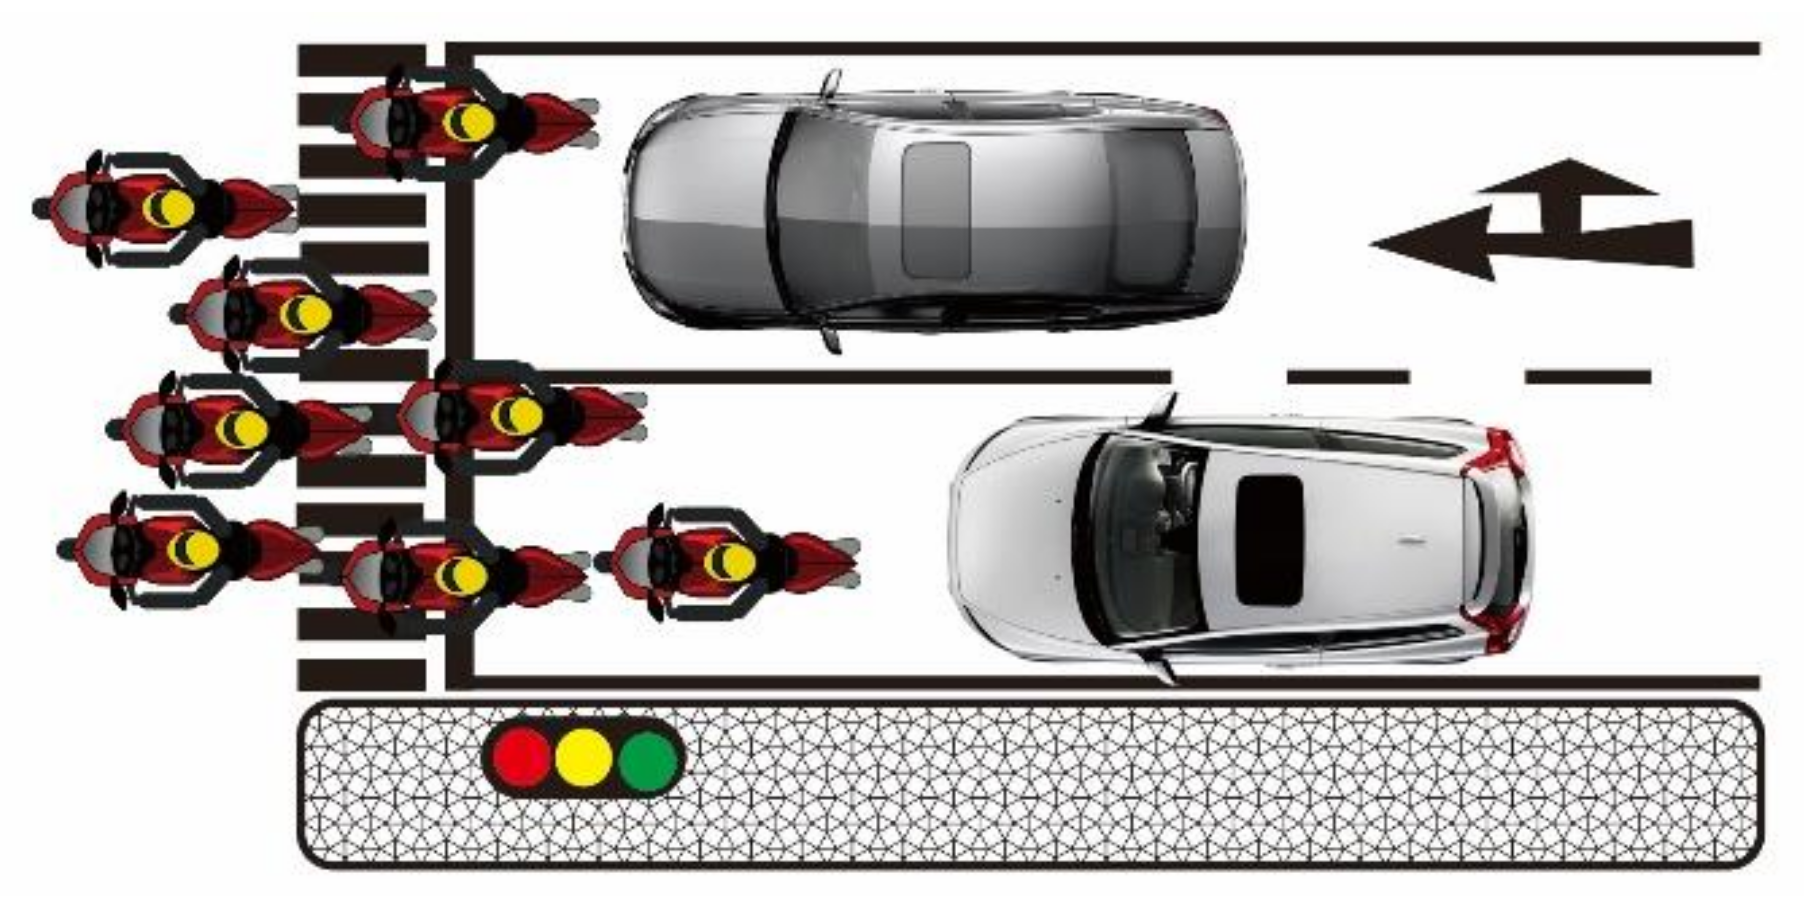
2. Red Box for Motorcycles
3. Methods
3.1. Data Collection Methods
3.2. Traffic Flow Analysis Methods
3.3. Normality Test and Analysis of Correlation Methods
4. Findings
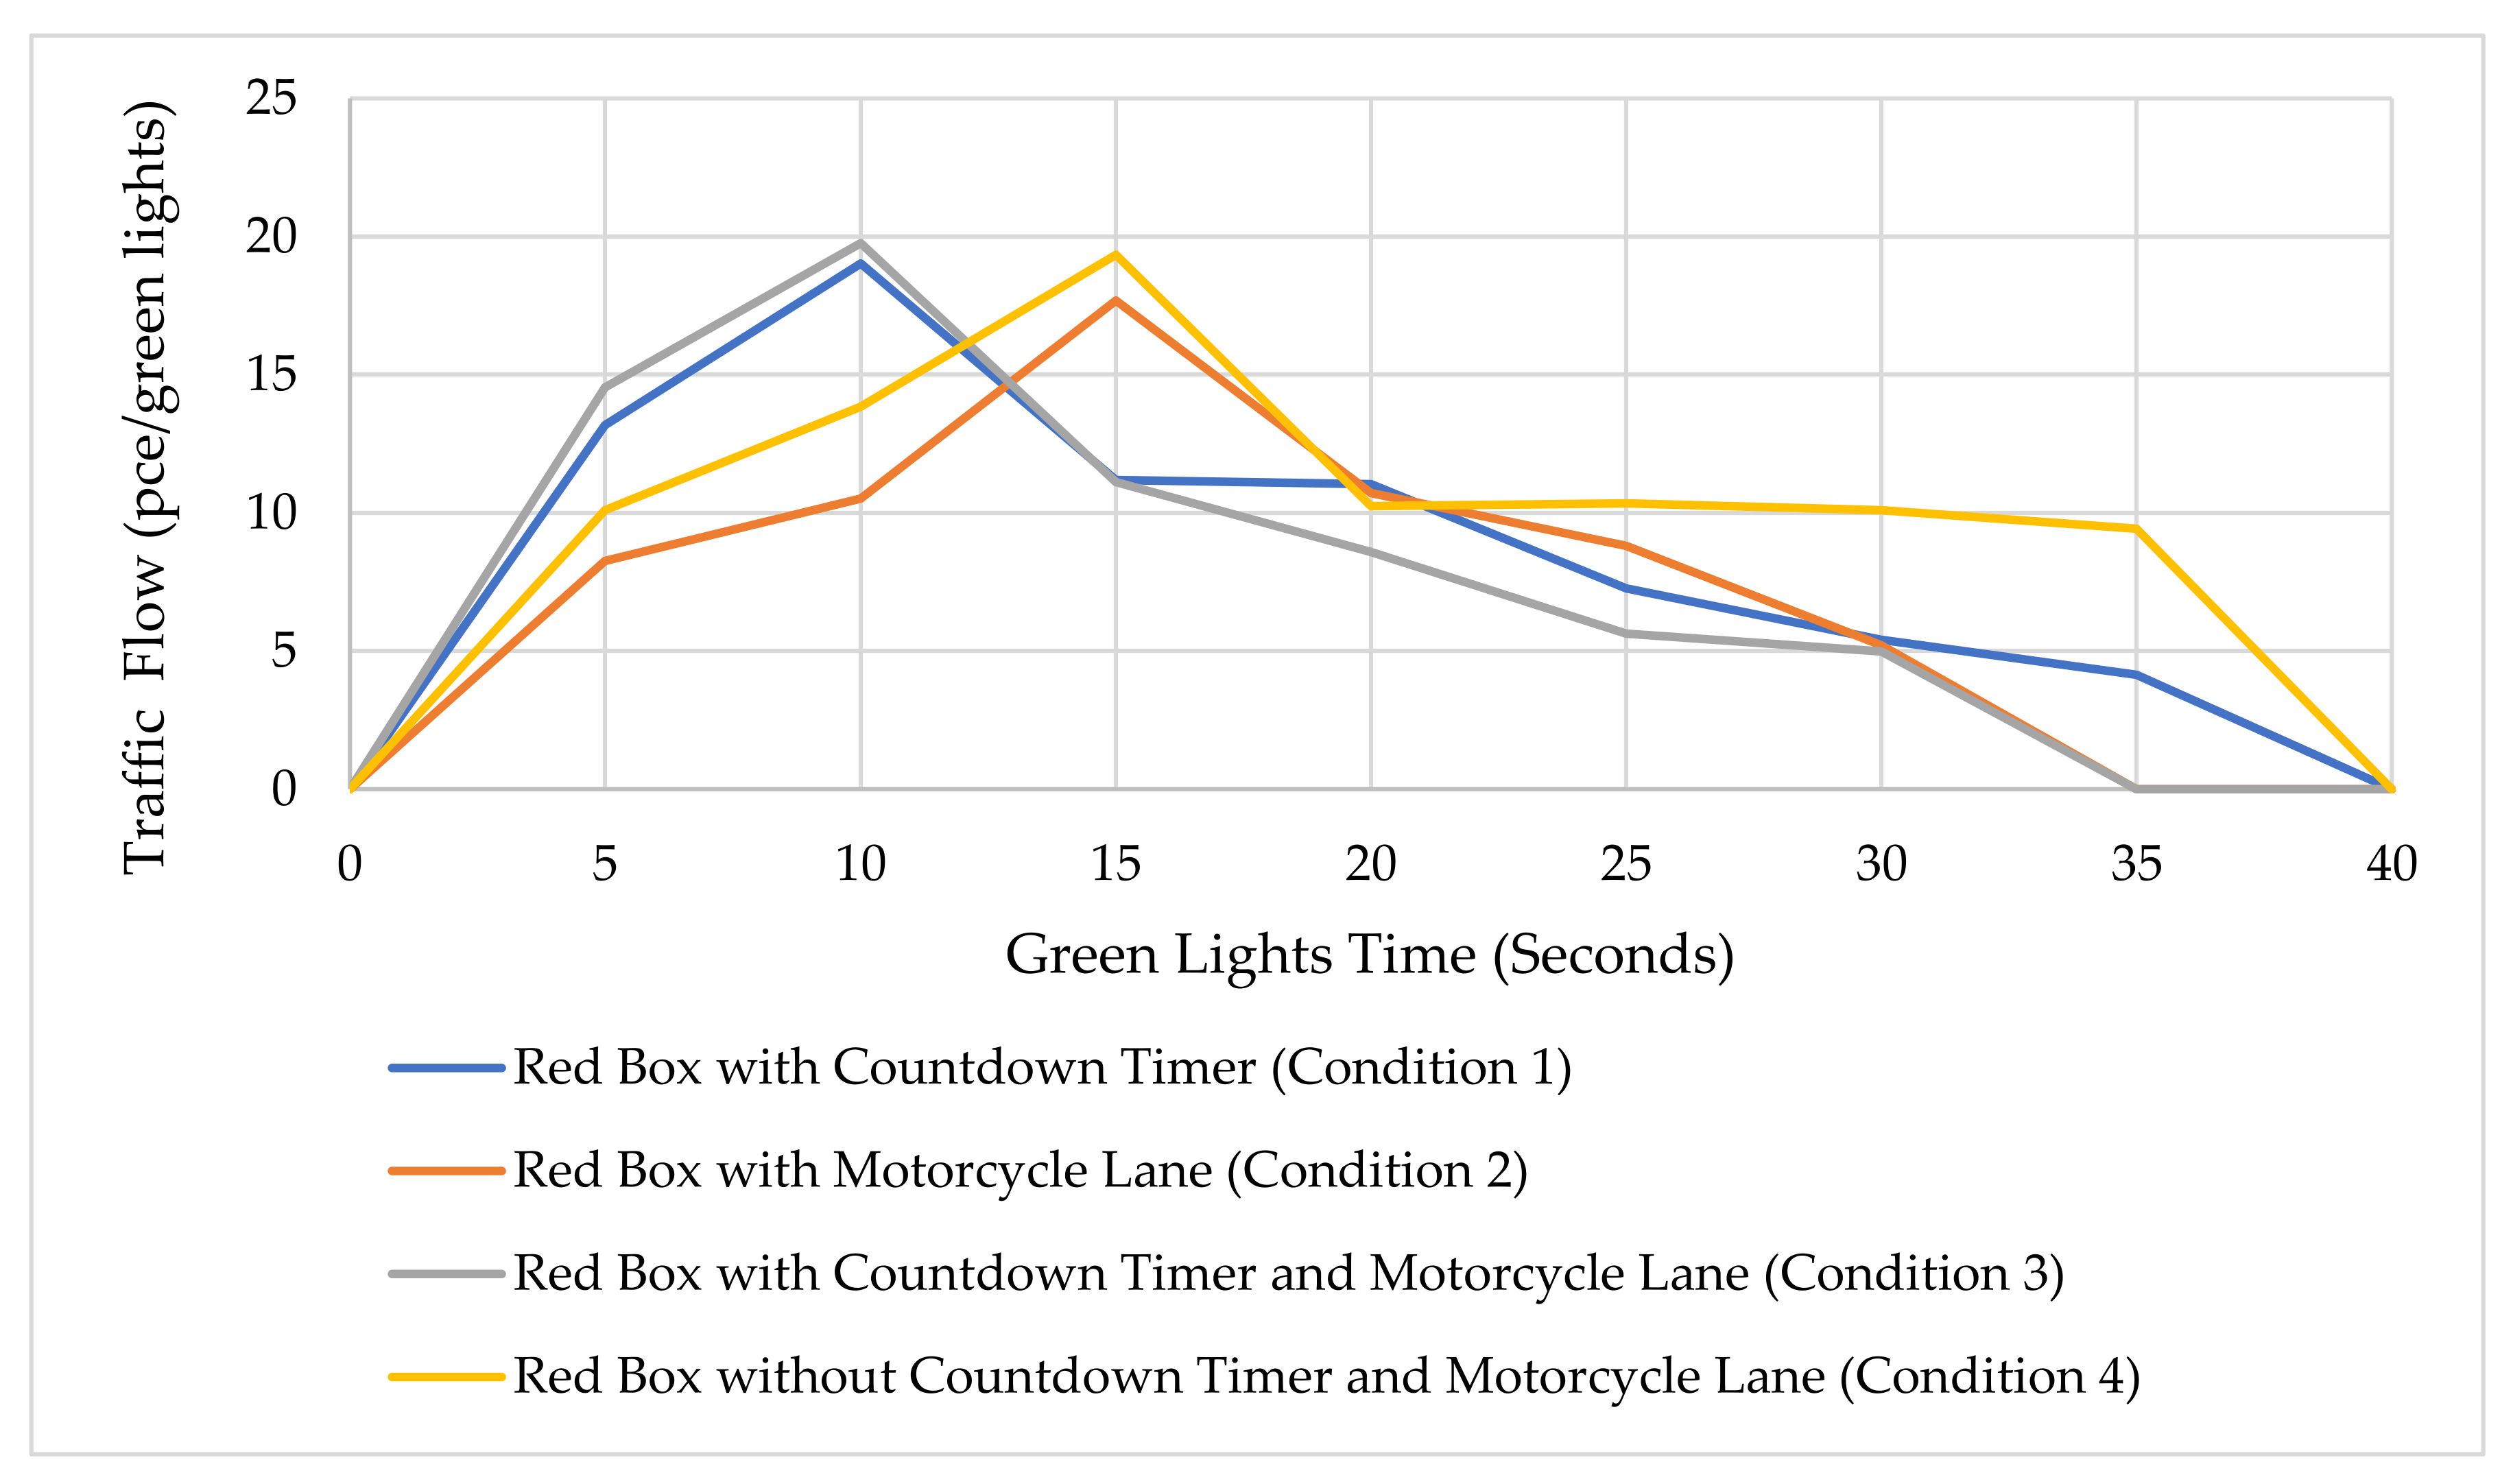
4.1. Traffic Flow
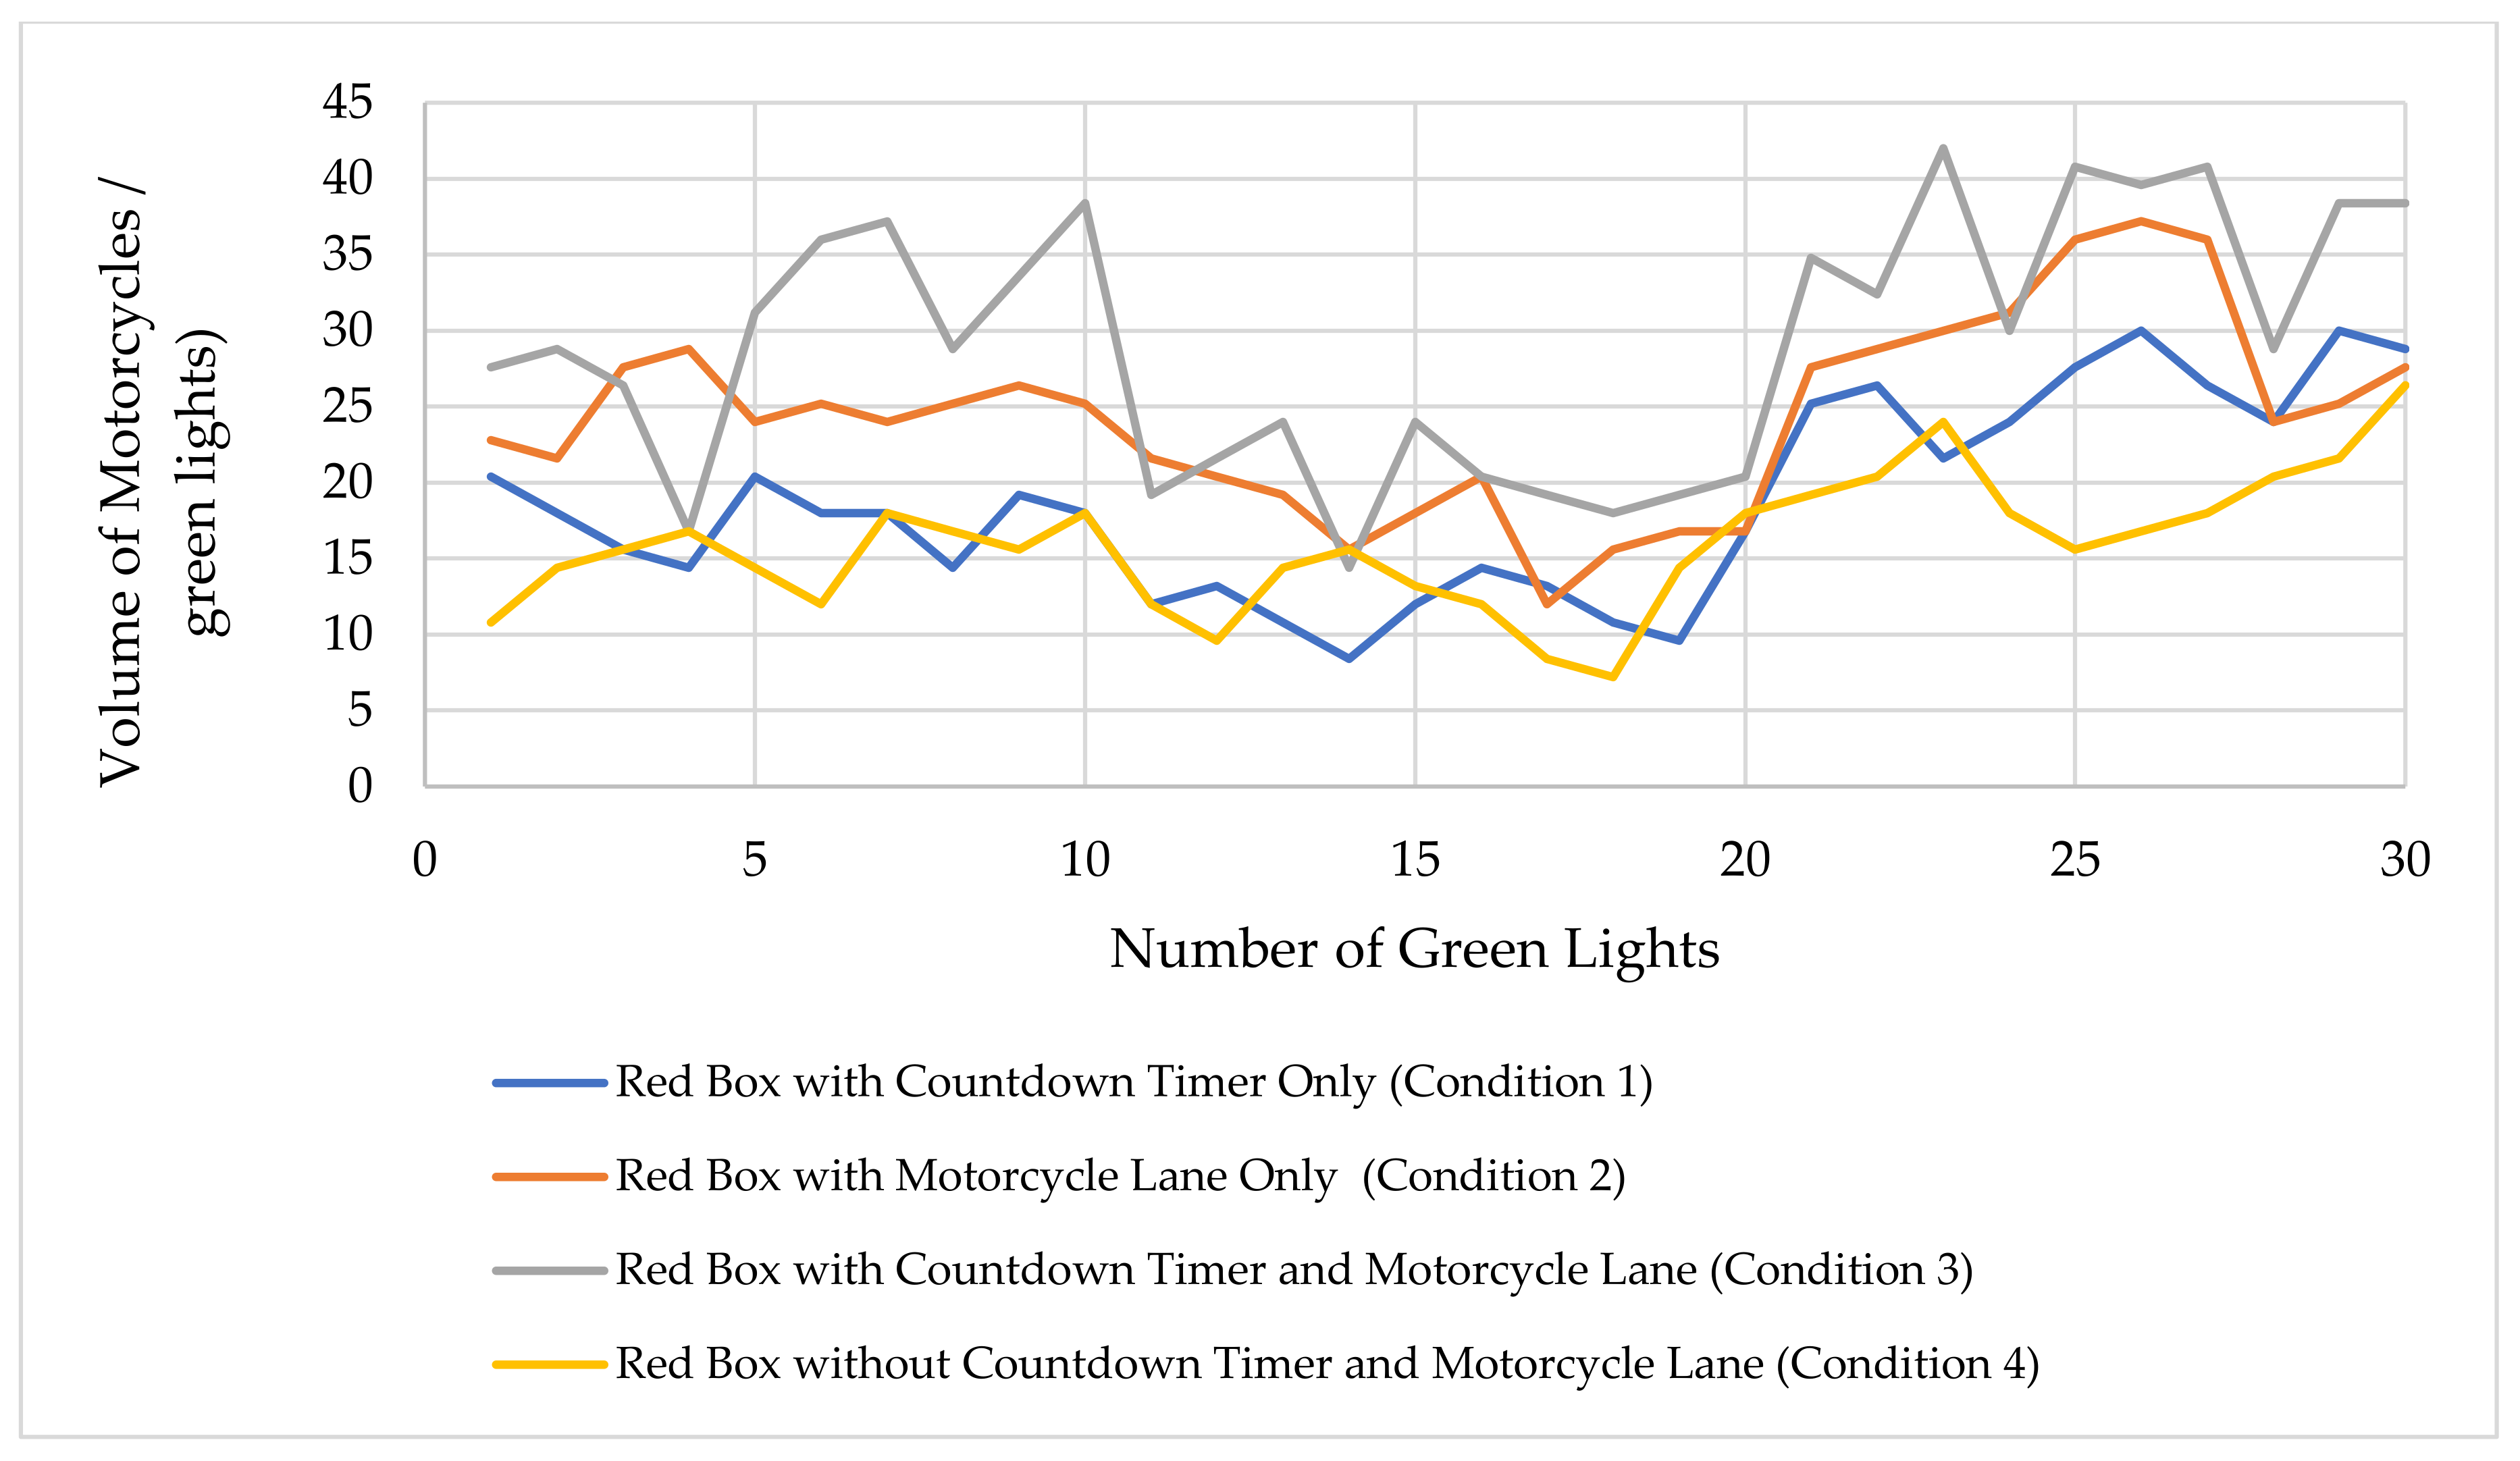
4.2. Occupancy Red Box for Motorcycles to the Capacity
4.3. Occupancy Red Box by Motorcycle and Other Motorized Vehicles
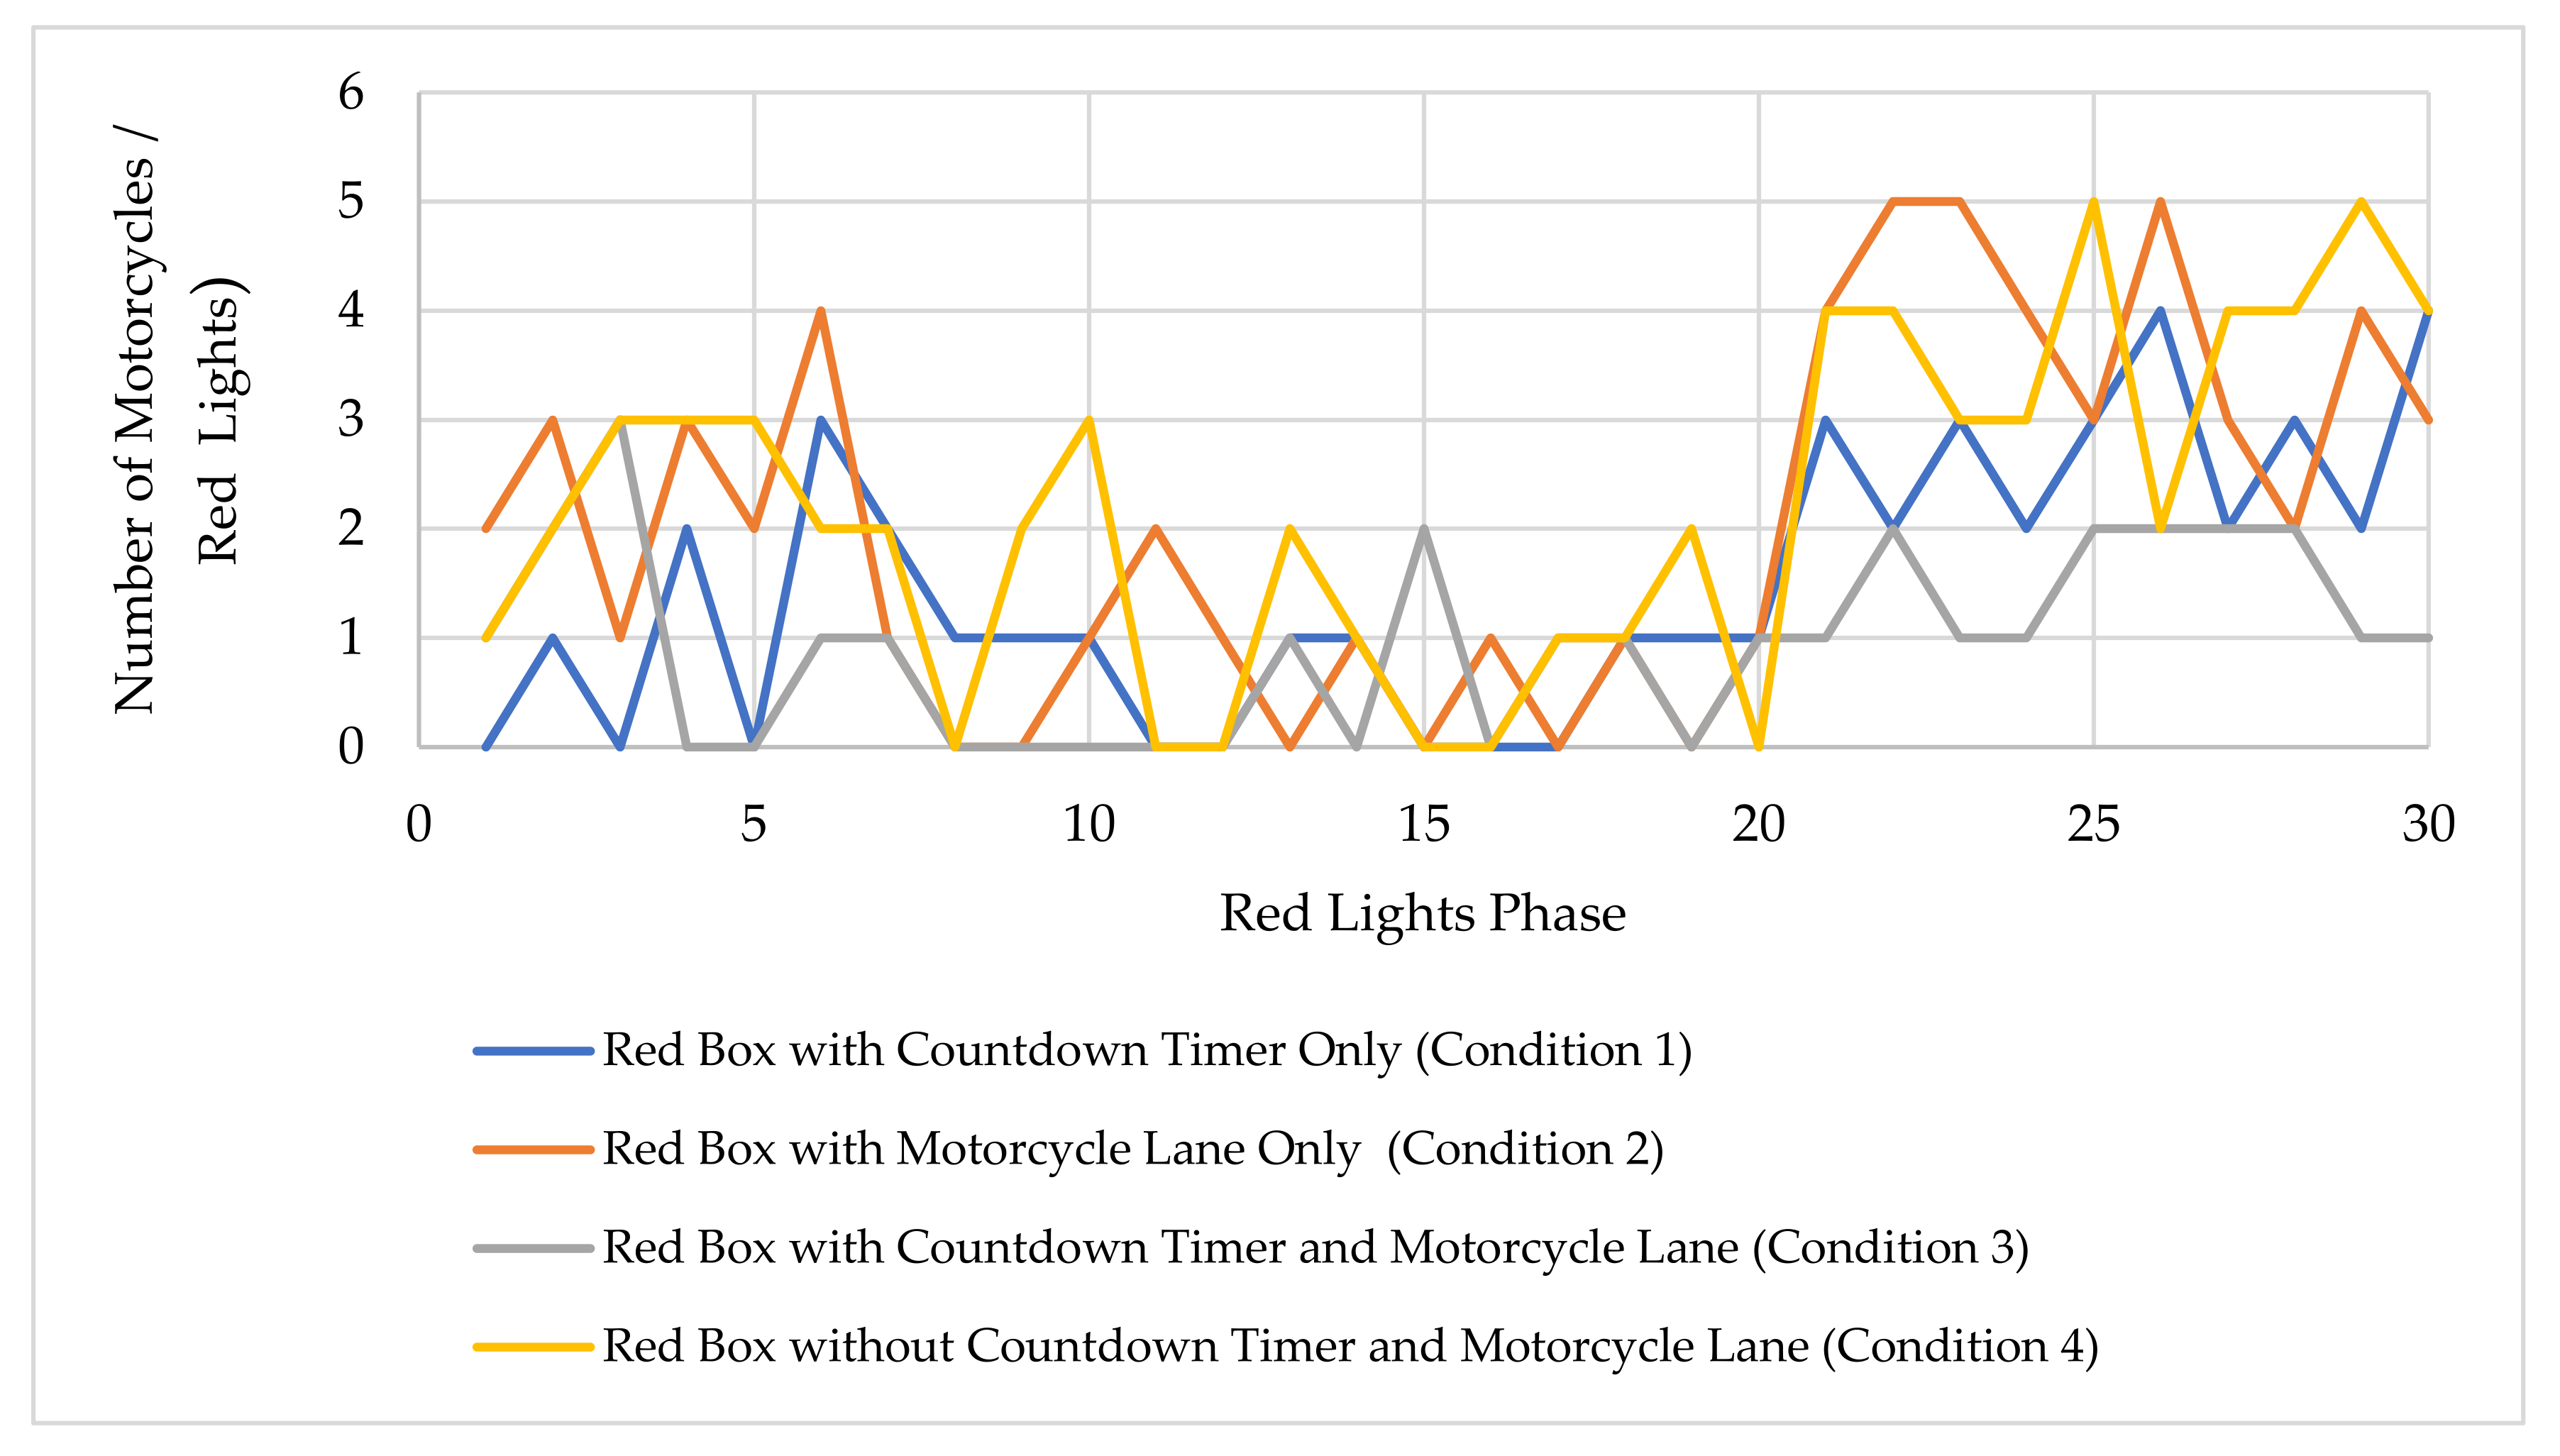
4.4. Stop Line Violation
4.5. Normality Test and Analysis of Correlation Methods
5. Conclusions
Author Contributions
Funding
Data Availability Statement
Acknowledgments
Conflicts of Interest
References
- Gabungan Industri Kendaraan Bermotor Indonesia. Hasil Sensus BPS: Jumlah Kendaraan Bermotor di Indonesia Tembus 133 Juta Unit; GAIKINDO: South Tangerang, Indonesia, 2019. [Google Scholar]
- Badan Pusat Statistik Indonesia. Land Transportation Statistics 2020; Badan Pusat Statistik Indonesia: Jakarta, Indonesia, 2021.
- Amelia, S. Kebijakan Penerapan Ruang Henti Khusus Sepeda Motor. Simp. Nas. Teknol. Terap. 2016, 4, 539–546. [Google Scholar]
- Cervero, R. Linking urban transport and land use in developing countries. J. Transp. Land Use 2013, 6, 7–24. [Google Scholar] [CrossRef]
- Dharmowijoyo, D.B.E.; Susilo, Y.O.; Karlström, A. Day-to-day variability in travellers’ activity-travel patterns in the Jakarta metropolitan area. Transportation 2016, 43, 601–621. [Google Scholar] [CrossRef]
- Irawan, M.Z.; Rizki, M.; Chalermpong, S.; Kato, H. Mapping the motorcycle-based ride-hailing users in Yogyakarta: An analysis of socio-economic factors and preferences. Asian Transp. Stud. 2022, 8, 100073. [Google Scholar] [CrossRef]
- Mazharul Haque, M.; Chin, H.C.; Huang, H. Examining exposure of motorcycles at signalized intersections. Transp. Res. Rec. 2008, 2048, 60–65. [Google Scholar] [CrossRef]
- Minh, C.C.; Sano, K.; Matsumoto, S. Maneuvers of motorcycles in queues at signalized intersections. J. Adv. Transp. 2012, 46, 39–53. [Google Scholar] [CrossRef]
- Hsu, T.P.; Dao, N.X.; Sadullah, A.F.M. A comparative study on motorcycle traffic development of Taiwan, Malaysia and Vietnam. J. East. Asia Soc. Transp. Stud. 2003, 5, 179–193. [Google Scholar]
- National Association of City Transportation Officials (NACTO). Urban Bikeway Design Guide; Island Press: Washington, DC, USA, 2014; ISBN 9781610915823. [Google Scholar]
- Dill, J.; Monsere, C.M.; McNeil, N. Evaluation of bike boxes at signalized intersections. Accid. Anal. Prev. 2012, 44, 126–134. [Google Scholar] [CrossRef]
- Hunter, W.W. Evaluation of innovative bike-box application in Eugene, Oregon. Transp. Res. Rec. 2000, 1705, 99–106. [Google Scholar] [CrossRef]
- Loskorn, J.; Mills, A.F.; Brady, J.F.; Duthie, J.C.; Machemehl, R.B. Effects of bicycle boxes on bicyclist and motorist behavior at intersections in Austin, Texas. J. Transp. Eng. 2013, 139, 1039–1046. [Google Scholar] [CrossRef]
- Retting, R.A.; Van Houten, R. Safety benefits of advance stop lines at signalized intersections: Results of a field evaluation. ITE J. 2000, 70, 47–49+54. [Google Scholar]
- Atkins Services. Advanced Stop Line Variations Research Study; Transport for London, Street Management Division: London, UK, 2005.
- Idris, M. The Effect of Advanced Stop Lines for Motorcycles on traffic Conflict at one Signalized Intersection in Bandung; Institut Teknologi Bandung: Jawa Barat, Indonesia, 2007. [Google Scholar]
- Mulyadi, A.M.; Amelia, S. Influence of Red Motorcycle Box to the Traffic Conflict and Traffic Flow at the Ahmad Yani-Laswi Signalized Intersection. In Proceedings of the Road Safety on Four Continents: 16th International Conference, Beijing, China, 15–17 May 2013. [Google Scholar]
- Purba, A.; Kustiani, I.; Pramita, G. A Study on the Influences of Exclusive Stopping Space on Saturation Flow (Case Study: Bandar Lampung). In Proceedings of the International Conference on Science, Technology & Environment (ICoSTE) 2019, Yogyakarta, Indonesia, 29–30 August 2019. [Google Scholar] [CrossRef]
- Ramli, W.N.S.; Ishak, S.Z.; Nusa, F.N.M.; Ahmad, J. A Study on Advance Stop Line for Motorcyclists at Signalised Intersection in Malaysia. In Proceedings of the 4th Global Research on Sustainable Transport and Logistics (GRoSTLog 2020), Jakarta, Indonesia, 12 August 2020; Volume 2009, pp. 861–868. [Google Scholar]
- Asaithambi, G.; Sivanandan, R. Microscopic Simulation for Modeling Exclusive Stopping Space for Motorcycles under Non-lane Based Mixed Traffic Conditions. Eur. Transp. Eur. 2015, 57, 1–15. [Google Scholar]
- Wang, M. Investigating the Difference in Factors Contributing to the Likelihood of Motorcyclist Fatalities in Single Motorcycle and Multiple Vehicle Crashes. Int. J. Environ. Res. Public Health 2022, 19, 8411. [Google Scholar] [CrossRef]
- Minh, C.C.; Sano, K. Analysis of Motorcycle Effects to Saturation Flow Rate At Signalized Intersection in Developing Countries. J. East. Asia Soc. Transp. Stud. 2003, 5, 1211–1222. [Google Scholar]
- Mardiati, R.; Trilaksono, B.R.; Gondokaryono, Y.S.; Wibowo, S.S. Motorcycle movement model based on markov chain process in mixed traffic. Int. J. Electr. Comput. Eng. 2018, 8, 3149–3157. [Google Scholar] [CrossRef]
- Sunggiardi, R.; Putranto, L.S. Motorcycle Potential Problems in Jakarta. J. Transp. 2009, 9, 117–126. [Google Scholar]
- Abdulwahid, S.N.; Mahmoud, M.A.; Ibrahim, N.; Zaidan, B.B.; Ameen, H.A. Modeling Motorcyclists’ Aggressive Driving Behavior Using Computational and Statistical Analysis of Real-Time Driving Data to Improve Road Safety and Reduce Accidents. Int. J. Environ. Res. Public Health 2022, 19, 7704. [Google Scholar] [CrossRef] [PubMed]
- Lin, H.; Li, J.; Pai, C.; Chien, W.; Huang, W. Environmental Factors Associated with Severe Motorcycle Crash Injury in University Neighborhoods: A Multicenter Study in Taiwan. Int. J. Environ. Res. Public Health 2022, 19, 10274. [Google Scholar] [CrossRef] [PubMed]
- Sumit, K.; Brijs, K.; Ross, V.; Wets, G.; Ruiter, R.A.C. A Focus Group Study to Explore Risky Ridership among Young Motorcyclists in Manipal, India. Safety 2022, 8, 40. [Google Scholar] [CrossRef]
- Rahmawati, N.; Widyanti, A. Comparison between motorcyclist’ violation behavior and accidents in urban and rural area in Indonesia: A comparative study. IOP Conf. Ser. Mater. Sci. Eng. 2017, 277, 012026. [Google Scholar] [CrossRef]
- Puratmaja, Y.; Handayani, L.; Sunardi, K.S. Factors Associated with Motorcycle Risk Behavior among Thai University Students, Khon Kaen. Int. J. Eval. Res. Educ. 2017, 6, 270–276. [Google Scholar] [CrossRef][Green Version]
- Bolbol, S.; Zalat, M. Motorcycle Riders’ Risky Behaviors and Safety Measures: A Hospital-Based Study. Egypt. J. Occup. Med. 2018, 42, 453–468. [Google Scholar] [CrossRef]
- Uttra, S.; Jomnonkwao, S.; Watthanaklang, D.; Ratanavaraha, V. Development of self-assessment indicators for motorcycle riders in Thailand: Application of the otorcycle rider behavior questionnaire (MRBQ). Sustainability 2020, 12, 2785. [Google Scholar] [CrossRef]
- Kronprasert, N.; Sutheerakul, C.; Satiennam, T.; Luathep, P. Intersection safety assessment using video-based traffic conflict analysis: The case study of Thailand. Sustainability 2021, 13, 12722. [Google Scholar] [CrossRef]
- Seedam, A.; Satiennam, T.; Radpukdee, T.; Satiennam, W.; Ratanavaraha, V. Motorcycle on-road driving parameters influencing fuel consumption and emissions on congested signalized urban corridor. J. Adv. Transp. 2017, 2017, 5859789. [Google Scholar] [CrossRef]
- Ivanova, N.; Gugleva, V.; Dobreva, M.; Pehlivanov, I.; Stefanov, S.; Andonova, V. Understanding Urban Mobility and Pedestrian Movement. In Smart Urban Development; IntechOpen: London, UK, 2016; Volume i, p. 13. [Google Scholar]
- Agostoni, S.; Barbera, A.N. Investigation of Structural Motorcycle Vibrations Due to Engine: Experimental and Numerical Methodology to Investigate Structural Motorcycle Vibrations Caused by Engine Unbalances; Omniscriptum Gmbh & Co., Kg.: Saarbrücken, Germany, 2015; ISBN 978-3639659429. [Google Scholar]
- Pedoman Perancangan Ruang Henti Khusus (RHK) Sepeda Motor Pada Simpang Bersinyal di Kawasan Perkotaan; Ministry of Public Works and Housing of Indonesia: Jakarta, Indonesia, 2015.
- Saini, H.K.; Chouhan, S.S.; Kathuria, A. Exclusive motorcycle lanes: A systematic review. IATSS Res. 2022, in press. [Google Scholar] [CrossRef]
- Khaidir, N.; Megat, N. A Safety Review of Exclusive Motorcycle Lane Access. In Proceedings of the ASEAN Road Safety 2015, Kuala Lumpur, Malaysia, 3–6 November 2015; Volume 84, pp. 79–85. [Google Scholar]
- De Borges, F.S.P.; Fonseca, A.P.; Garcia, R.C. Deep reinforcement learning model to mitigate congestion in real-time traffic light networks. Infrastructures 2021, 6, 138. [Google Scholar] [CrossRef]
- Chen, P.L.; Pai, C.W.; Jou, R.C.; Saleh, W.; Kuo, M.S. Exploring motorcycle red-light violation in response to pedestrian green signal countdown device. Accid. Anal. Prev. 2015, 75, 128–136. [Google Scholar] [CrossRef]
- Devalla, J.; Biswas, S.; Ghosh, I. The effect of countdown timer on the approach speed at signalised intersections. Procedia Comput. Sci. 2015, 52, 920–925. [Google Scholar] [CrossRef]
- Fujita, M.; Suzuki, K.; Yilmaz, C. Behavior and Consciousness Analyses on Effect of Traffic Signals Including Countdown Device. J. East. Asia Soc. Transp. Stud. 2007, 7, 2289–2304. [Google Scholar]
- Ibrahim, M.R.; Karim, M.R.; Kidwai, F.A. The effect of digital count-down display on signalized junction performance. Am. J. Appl. Sci. 2008, 5, 479–482. [Google Scholar] [CrossRef]
- Ma, W.; Liu, Y.; Yang, X. Investigating the impacts of green signal countdown devices: Empirical approach case study in China. J. Transp. Eng. 2010, 136, 1049–1055. [Google Scholar] [CrossRef]
- Li, K.; Sun, J.; Dong, S.; Yu, X. Study on the influence of signal countdown device on traffic safety of intersections. In Proceedings of the 2009 International Conference on Measuring Technology and Mechatronics Automation ICMTMA, Zhangjiajie, China, 11–12 April 2009; Volume 3, pp. 602–606. [Google Scholar] [CrossRef]
- Long, K.; Han, L.D.; Yang, Q. Effects of countdown timers on driver behavior after the yellow onset at Chinese intersections. Traffic Inj. Prev. 2011, 12, 538–544. [Google Scholar] [CrossRef] [PubMed]
- Chiou, Y.C.; Chang, C.H. Driver responses to green and red vehicular signal countdown displays: Safety and efficiency aspects. Accid. Anal. Prev. 2010, 42, 1057–1065. [Google Scholar] [CrossRef] [PubMed]
- Limanond, T.; Prabjabok, P.; Tippayawong, K. Exploring impacts of countdown timers on traffic operations and driver behavior at a signalized intersection in Bangkok. Transp. Policy 2010, 17, 420–427. [Google Scholar] [CrossRef]
- Sharma, A.; Vanajakshi, L.; Girish, V.; Harshitha, M.S. Impact of signal timing information on safety and efficiency of signalized intersections. J. Transp. Eng. 2012, 138, 467–478. [Google Scholar] [CrossRef]
- Rijavec, R.; Zakovšek, J.; Maher, T. Acceptability of Countdown Signals at an Urban Signalized Intersection and their Influence on Drivers Behaviour. Promet–Traffic Transp. 1970, 25, 63–71. [Google Scholar] [CrossRef]
- Lum, K.M.; Halim, H. A before-and-after study on green signal countdown device installation. Transp. Res. Part F Traffic Psychol. Behav. 2006, 9, 29–41. [Google Scholar] [CrossRef]
- Shaaban, K.; Alsoub, M. Evaluating the Effect of Dynamic Message Signs and Lane Control Signs on Driver Behavior in a Developing Country. Infrastructures 2022, 7, 105. [Google Scholar] [CrossRef]
- Khaidir, N.M.; Johari, N.M.; Jamaluddin, N.; Roslan, A. The effectiveness of advanced stop line (asl) for motorcycles at signalised intersection in Kuala Lumpur. J. Built Environ. Technol. Eng. 2019, 6, 69–81. [Google Scholar]
- Manual Kapasitas Jalan Indonesia (MKJI); Direktorat Jenderal Bina Marga; Direktorat Bina Jalan Kota: Jakarta, Indonesia, 1997.
- McPherson, C.; Daff, M.; Eady, J.; Wigan, M.R. Road Space Initiatives for Motorcycles; Sinclair Khight Merz Project: Brisbane, Australia, 2010; p. 58. [Google Scholar]
- Minh, C.C.; Matsumoto, S.; Sano, K. the Speed, Flow and Headway Analyses of Motorcycle Traffic. J. East. Asia Soc. Transp. Stud. 2005, 6, 1496–1508. [Google Scholar] [CrossRef]
- Kov, M.; Student, G.; Yai, T. Traffic Characteristics of Motorcycle-dominated Urban Street Considering the Effect of Light Vehicle. J. East. Asia Soc. Transp. Stud. 2009, 8, 1806–1821. [Google Scholar] [CrossRef]
- Bland, J.M.; Altman, D.G. Statistics notes: Correlation in restricted ranges of data. BMJ 2011, 342, d556. [Google Scholar] [CrossRef] [PubMed]


| Number | Condition | Intersection | Approach Road | Red Box Dimension | Capacity of Red Box (Number of Motorcycles) | ||
|---|---|---|---|---|---|---|---|
| Width (m) | Length (m) | Area (m2) | |||||
| 1 | Red box with countdown timer only | Dewi Sartika-Tengku Umar-Diponegoro | Dewi Sartika | 8.08 | 8 | 64.64 | 32 |
| 2 | Red box with motorcycle lane only | Sudirman-Puputan | Sudirman Road (South) | 9.12 | 8 | 72.96 | 36 |
| 3 | Red box with countdown timer and motorcycle lane | Puputan-Kusumaatmadja | Kusumaatmadja | 9.86 | 8 | 78.88 | 39 |
| 4 | Red box without countdown timer and without motorcycle lane | Sudirman-Puputan | Sudirman Road (North) | 9.14 | 8 | 73.12 | 36 |
| Period of Time (s) | Red Box with Countdown Timer Only (Condition 1) | Red Box with Motorcycle Lane Only (Condition 2) | Red Box with Countdown Timer and Motorcycle Lane (Condition 3) | Red Box without Countdown Timer and without Motorcycle Lane (Condition 4) |
|---|---|---|---|---|
| 0 | 0 | 0 | 0 | 0 |
| 5 | 13.18 | 8.26 | 14.53 | 10.09 |
| 10 | 19.02 | 10.53 | 19.76 | 13.84 |
| 15 | 11.19 | 17.68 | 11.11 | 19.34 |
| 20 | 11.04 | 10.71 | 8.59 | 10.25 |
| 25 | 7.27 | 8.81 | 5.62 | 10.34 |
| 30 | 5.42 | 5.20 | 4.97 | 10.09 |
| 35 | 4.13 | 0.00 | 0.00 | 9.42 |
| 40 | 0.00 | 0.00 | 0.00 | 0.00 |
| Parameters | Red Box with Countdown Timer Only (Condition 1) | Red Box with Motorcycle Lane Only (Condition 2) | Red Box with Countdown Timer and Motorcycle Lane (Condition 3) | Red Box without Countdown Timer and without Motorcycle Lane (Condition 4) |
|---|---|---|---|---|
| Red box dimension (m2) | 64.64 | 72.96 | 78.88 | 73.12 |
| Red box capacity (motorcycles) | 32 | 36 | 39 | 36 |
| Volume of motorcycles/30 red light phase | 562 | 731 | 871 | 478 |
| Average red box occupancy (motorcycles) | 18.72 | 24.36 | 29.04 | 15.92 |
| Percentage red box occupancy (%) | 57.92 | 67.67 | 73.63 | 44.22 |
| Parameters | Red Box with Countdown Timer Only (Condition 1) | Red Box with Motorcycle Lane Only (Condition 2) | Red Box with Countdown Timer and Motorcycle Lane (Condition 3) | Red Box without Countdown Timer and without Motorcycle Lane (Condition 4) |
|---|---|---|---|---|
| Number of red light phase occupied only by motorcycles in the red box area | 25 | 23 | 25 | 22 |
| Percentage of red light phase occupied only by motorcycles in the red box (%) | 83.33 | 76.67 | 83.33 | 73.33 |
| Total of non-motorcycles occupied the red box | 5 | 10 | 6 | 10 |
| 1. passenger car | 4 | 10 | 6 | 9 |
| 2. bus | 1 | 0 | 0 | 1 |
| 3. truck | 0 | 0 | 0 | 0 |
| Average number of non-motorcycles/red light phase | 0.17 | 0.33 | 0.20 | 0.33 |
| Parameters | Red Box with Countdown Timer Only (Condition 1) | Red Box with Motorcycle Lane Only (Condition 2) | Red Box with Countdown Timer and Motorcycle Lane (Condition 3) | Red Box without Countdown Timer and without Motorcycle Lane (Condition 4) |
|---|---|---|---|---|
| Number of stop line violation/30 red light phase | 46 | 62 | 29 | 66 |
| Average stop line violation per red light phase | 1.53 | 2.07 | 0.97 | 2.20 |
| Tests of Normality | ||||||
|---|---|---|---|---|---|---|
| Kolmogorov–Smirnov a | Shapiro–Wilk | |||||
| Statistic | Df | Sig. | Statistic | Df | Sig. | |
| O_C1 | 0.132 | 30 | 0.193 | 0.948 | 30 | 0.153 |
| O_C2 | 0.095 | 30 | 0.200 * | 0.974 | 30 | 0.647 |
| O_C3 | 0.123 | 30 | 0.200 * | 0.941 | 30 | 0.098 |
| O_C4 | 0.114 | 30 | 0.200 * | 0.981 | 30 | 0.864 |
| Correlations | |||||
|---|---|---|---|---|---|
| O_C1 | O_C2 | O_C3 | O_C4 | ||
| O_C1 | Pearson Correlation | 1 | 0.776 ** | 0.824 ** | 0.655 ** |
| Sig. (2-tailed) | 0.000 | 0.000 | 0.000 | ||
| N | 30 | 30 | 30 | 30 | |
| O_C2 | Pearson Correlation | 0.776 ** | 1 | 0.760 ** | 0.559 ** |
| Sig. (2-tailed) | 0.000 | 0.000 | 0.001 | ||
| N | 30 | 30 | 30 | 30 | |
| O_C3 | Pearson Correlation | 0.824 ** | 0.760 ** | 1 | 0.598 ** |
| Sig. (2-tailed) | 0.000 | 0.000 | 0.000 | ||
| N | 30 | 30 | 30 | 30 | |
| O_C4 | Pearson Correlation | 0.655 ** | 0.559 ** | 0.598 ** | 1 |
| Sig. (2-tailed) | 0.000 | 0.001 | 0.000 | ||
| N | 30 | 30 | 30 | 30 | |
| Tests of Normality | ||||||
|---|---|---|---|---|---|---|
| Kolmogorov–Smirnov a | Shapiro–Wilk | |||||
| Statistic | Df | Sig. | Statistic | Df | Sig. | |
| SLV_C1 | 0.212 | 30 | 0.150 | 0.889 | 30 | 0.065 |
| SLV_C2 | 0.206 | 30 | 0.081 | 0.901 | 30 | 0.069 |
| SLV_C3 | 0.218 | 30 | 0.072 | 0.847 | 30 | 0.060 |
| SLV_C4 | 0.129 | 30 | 0.200 * | 0.923 | 30 | 0.033 |
| Correlations | |||||
|---|---|---|---|---|---|
| SLV_C1 | SLV_C2 | SLV_C3 | SLV_C4 | ||
| SLV_C1 | Pearson Correlation | 1 | 0.698 ** | 0.307 | 0.638 ** |
| Sig. (2-tailed) | 0.000 | 0.099 | 0.000 | ||
| N | 30 | 30 | 30 | 30 | |
| SLV_C2 | Pearson Correlation | 0.698 ** | 1 | 0.344 | 0.593 ** |
| Sig. (2-tailed) | 0.000 | 0.063 | 0.001 | ||
| N | 30 | 30 | 30 | 30 | |
| SLV_C3 | Pearson Correlation | 0.307 | 0.344 | 1 | 0.395 * |
| Sig. (2-tailed) | 0.099 | 0.063 | 0.031 | ||
| N | 30 | 30 | 30 | 30 | |
| SLV_C4 | Pearson Correlation | 0.638 ** | 0.593 ** | 0.395 * | 1 |
| Sig. (2-tailed) | 0.000 | 0.001 | 0.031 | ||
| N | 30 | 30 | 30 | 30 | |
| Tests of Normality | ||||||
|---|---|---|---|---|---|---|
| Kolmogorov–Smirnov | Shapiro–Wilk | |||||
| Statistic | Df | Sig. | Statistic | Df | Sig. | |
| TF_C1 | 0.167 | 30 | 0.032 | 0.880 | 30 | 0.003 |
| TF_C2 | 0.191 | 30 | 0.007 | 0.901 | 30 | 0.009 |
| TF_C3 | 0.160 | 30 | 0.049 | 0.919 | 30 | 0.026 |
| TF_C4 | 0.400 | 30 | 0.000 | 0.644 | 30 | 0.000 |
| Correlations | ||||
|---|---|---|---|---|
| TF_C1 | TF_C2 | TF_C3 | ||
| TF_C1 | Pearson Correlation | 1 | 0.605 ** | 0.977 ** |
| Sig. (2-tailed) | 0.000 | 0.000 | ||
| N | 30 | 30 | 30 | |
| TF_C2 | Pearson Correlation | 0.605 ** | 1 | 0.634 ** |
| Sig. (2-tailed) | 0.000 | 0.000 | ||
| N | 30 | 30 | 30 | |
| TF_C3 | Pearson Correlation | 0.977 ** | 0.634 ** | 1 |
| Sig. (2-tailed) | 0.000 | 0.000 | ||
| N | 30 | 30 | 30 | |
Publisher’s Note: MDPI stays neutral with regard to jurisdictional claims in published maps and institutional affiliations. |
© 2022 by the authors. Licensee MDPI, Basel, Switzerland. This article is an open access article distributed under the terms and conditions of the Creative Commons Attribution (CC BY) license (https://creativecommons.org/licenses/by/4.0/).
Share and Cite
Mulyadi, A.M.; Sihombing, A.V.R.; Hendrawan, H.; Marpaung, E.; Malisan, J.; Arianto, D.; Mardiana, T.S.; Puriningsih, F.S.; Subaryata; Siregar, N.A.M.; et al. Effect of Traffic Lights Countdown Timer and Motorcycle Lanes as an Approach to the Red Box for Motorcycles in Bali Island. Infrastructures 2022, 7, 127. https://doi.org/10.3390/infrastructures7100127
Mulyadi AM, Sihombing AVR, Hendrawan H, Marpaung E, Malisan J, Arianto D, Mardiana TS, Puriningsih FS, Subaryata, Siregar NAM, et al. Effect of Traffic Lights Countdown Timer and Motorcycle Lanes as an Approach to the Red Box for Motorcycles in Bali Island. Infrastructures. 2022; 7(10):127. https://doi.org/10.3390/infrastructures7100127
Chicago/Turabian StyleMulyadi, Agah Muhammad, Atmy Verani Rouly Sihombing, Hendra Hendrawan, Edward Marpaung, Johny Malisan, Dedy Arianto, Tetty Sulastry Mardiana, Feronika Sekar Puriningsih, Subaryata, Nurul Aldha Mauliddina Siregar, and et al. 2022. "Effect of Traffic Lights Countdown Timer and Motorcycle Lanes as an Approach to the Red Box for Motorcycles in Bali Island" Infrastructures 7, no. 10: 127. https://doi.org/10.3390/infrastructures7100127
APA StyleMulyadi, A. M., Sihombing, A. V. R., Hendrawan, H., Marpaung, E., Malisan, J., Arianto, D., Mardiana, T. S., Puriningsih, F. S., Subaryata, Siregar, N. A. M., Mutharuddin, & Humang, W. P. (2022). Effect of Traffic Lights Countdown Timer and Motorcycle Lanes as an Approach to the Red Box for Motorcycles in Bali Island. Infrastructures, 7(10), 127. https://doi.org/10.3390/infrastructures7100127