1. Introduction
Aircraft pavements are a major investment for airports, with a new runway typically costing between AUD 100 M and AUD 500 M to plan, design and construct, including all the associated infrastructure [
1]. Once constructed, an airport pavement is expected to last 40 or more years and is maintained to provide a safe and efficient platform for aircraft operations throughout its life. Consequently, aircraft pavements are designed to be high quality and low risk structures [
2].
Australia is currently in a period of unprecedented aircraft pavement development, with five new major airport runways expected to be constructed between 2018 and 2025. Second runways are being developed for Brisbane (Queensland) and Perth (Western Australia), an additional runway and existing runway extensions for Melbourne (Victoria), a replacement runway at the Sunshine Coast (Queensland) and a second airport for Sydney (New South Wales). This is in addition to the western Brisbane airport at Wellcamp (2016) and extensions of the existing runways at Mildura (Victoria) and Hobart (Tasmania) in 2017, as well as extensions to various military airfields. All of these aircraft pavement developments include both rigid (concrete) and flexible (asphalt) pavement structures.
The currently high level of investment in airfield pavements results in increased pressure to ensure efficient and cost-effective design, material specification and construction methods are used. One of the key questions for airports investing in aircraft pavements is the relative whole of life cost (WOLC) of rigid and flexible pavements of equivalent structural capacity. Furthermore, an objective basis is desired for the selection of a rigid or flexible pavement structure in different areas of the airfield, including the runway, taxiways and aprons.
This research compared the estimated construction, maintenance and WOLC costs associated with rigid and flexible pavement structures designed to support various commercial aircraft across a range of typical subgrade conditions. Structurally equivalent rigid and flexible pavements were designed for each combination of commercial aircraft and subgrade condition. The WOLC associated with each was estimated and compared, with different analysis periods and modelling assumptions used to determine the effect of these assumptions on the outcome of the comparison. All costs are expressed in Australian dollars.
2. Background
2.1. Aircraft Pavement Design
Aircraft pavements are designed using the same principles as road and other pavements. However, there are a number of differences that reflect the low frequency of high magnitude loads compared to road pavements, as well as the low tolerance of aircraft to uneven pavement surfaces, free standing water on pavement surfaces and pavement-generated loose material that can damage aircraft engines [
1]. Consequently, in modern times, aircraft pavements are usually designed with specific software, most of which are layered elastic in nature, and include [
3]:
Failure criteria that better reflect aircraft loading and pavement performance expectations.
Materials that reflect those commonly specified for aircraft pavement construction.
The ability to model different aircraft separately, without the need to convert different aircraft to an equivalent number of passes of a reference aircraft.
Consideration of 1, 2, 4 and 6 wheeled aircraft landing gear arrangements.
Lateral wandering of aircraft across the width of the pavement.
There are many different software available for the calculation of both rigid and flexible aircraft pavement thickness. The software published by the USA’s Federal Aviation Administration, known as COMFAA [
4] is not specifically intended for aircraft pavement design. Rather, it is the standard tool for expressing the relative damage caused to pavements by different aircraft and is critical to the international aircraft pavement strength rating system [
5]. However, COMFAA contains the failure criteria against which some other design software are calibrated and is convenient for parametric and single-aircraft pavement thickness determination for both rigid and flexible pavement structures.
2.2. Pavement Types and Selection
Similar to road and other pavements, aircraft pavements are generally categorised as rigid, flexible or composite. Rigid pavements are characterised by a thick concrete base that bends or flexes to accommodate stress. A granular or stabilised sub-base is usually provided but does not significantly contribute to the strength of the pavement [
6]. Rather, the sub-base layer is primarily to provide a construction platform over the subgrade and to provide uniform support to the concrete base in order to prevent rocking. In contrast, flexible pavements predominantly comprise granular base and sub-base layers that are designed to vertically deform under load, spreading the load across a greater area until the stress is reduced adequately to allow the subgrade to not rut excessively under repeated loading. The surface is usually bituminous and a thin (<80 mm) or thick (>80 mm) asphalt concrete surface is commonly provided [
7].
Composite pavements are less clearly defined but usually comprise layers commonly associated with flexible pavements, as well as layers commonly associated with rigid pavements [
8]. Examples include asphalt over concrete and thick heavily cement treated base course with an asphalt surface. Composite pavements are less common in Australian airports and are not considered further.
Any airport developing new pavements must decide whether the pavement is to be rigid or flexible. By adjusting the thickness of the various layers, both can be designed and constructed to accommodate any frequency of any aircraft in any subgrade condition. However, each has advantages and disadvantages that affect the pavement type selection for any given development. Some of these advantages and disadvantages are captured by pavement thickness determination and the associated cost estimating process. However, others are more reflective of risks that can impact service life, surface life, maintenance requirements and compliance with international regulations.
2.3. Lifecycle Cost Analysis
Life cycle cost analysis, also referred to as WOLC analysis, uses economic principles to compare the cost or value of competing options based on the long-term, net benefit to a society or asset owner [
9]. The intention is to inform decision making, allow long-term asset planning, increase consistency of cost estimates across options and to increase transparency and accountability [
10]. WOLC cost estimates usually include initial agency costs, discounted future costs and other relevant costs where they are known [
11].
WOLC cost analysis has many and broad applications. It has been used to compare different reinforced concrete marine structure designs [
12], alternate energy storage systems [
13], the benefit of rooftop gardens in urbanised cities [
14] and municipal infrastructure such as bridges and roads [
15]. The same approach has been used to compare road and airport pavement maintenance interventions [
16,
17], as well as comparing rigid and flexible road pavement designs [
11].
When applied to pavement infrastructure, such as roads, estimation of the road user costs, such as maintenance related delays and fuel consumption costs, is challenging [
18]. However, when various pavement structures of comparable functional or user performance are considered, the analysis focuses on the agency or asset owner costs and the analysis is less subjective. In this research, the benefit of the WOLC approach is to allow objective comparison of solutions with high construction cost, long life and low maintenance requirements (rigid pavement) against other structurally equivalent and viable options that are less expensive to initially construct, but have higher maintenance requirements (flexible pavements). Consequently, user costs were omitted from this analysis.
3. Whole of Lifecycle Cost Estimates
3.1. Aircraft
WOLC cost comparisons were prepared for pavements designed for a range of commercial aircraft (
Table 1). The aircraft were selected to span the typical size of aircraft operating into major regional and international airports across Australia. The B737-800 was selected as the dominant aircraft for domestic routes in Australia and the B777-300ER was selected as one of the most demanding of the current aircraft for flexible and rigid pavement thickness design [
19]. The B747-400 was also included as the historically largest aircraft for long-haul international flights.
In all cases, 5000 annual departures at maximum aircraft mass were assumed. Because the analysis focused on comparing the WOLC cost of rigid and flexible pavements, the actual aircraft, actual aircraft mass and actual operating frequency selected were not critical, as long they were consistently applied to both the rigid and flexible pavements.
3.2. Subgrades
Like road and other pavements, flexible aircraft pavement design characterises subgrades via the California Bearing Ratio (CBR) [
2]. Four subgrades were considered, intended to span the range of typical subgrade conditions encountered at Australian airports (
Table 2). For rigid pavement thickness design, the subgrade was converted to an equivalent modulus of subgrade reaction.
3.3. Pavement Designs
For each combination of aircraft and subgrade condition, a rigid and a flexible pavement thickness was calculated. Because each pair of pavement thicknesses were determined to be adequate for the same aircraft and the same subgrade condition, the paired flexible and rigid pavement thicknesses were structurally equivalent.
All pavement thicknesses were calculated using COMFAA 3.0 [
4] in ‘thickness’ mode. For flexible pavements, the standard pavement structure included 75 mm of asphalt (referred to by the FAA as P-401), 150 mm of crushed rock base course (P-209) and the designed thickness of uncrushed gravel sub-base (P-154), which are detailed in
Table 3. Sub-base thicknesses were rounded up to the next 25 mm for convenience and to allow for typical construction tolerance. For rigid pavements, the thickness of Portland cement concrete base course was calculated for a typical 4.5 MPa flexural strength concrete over a 150 mm thick crushed rock sub-base (P-154), as detailed in
Table 4. For each concrete thickness, the subgrade CBR was converted to an equivalent modulus of subgrade reaction (k-value) and adjusted to account for the sub-base course [
20]. Concrete thicknesses were rounded up to the nearest 25 mm for convenience and to allow for typical construction tolerance. These pavement structures are typical of regional airports in Australia, although the differ significantly from airport pavements that are commonly constructed in Europe and the United States [
21].
3.4. Construction Costs
Construction costs were estimated by applying typical supply, construct and finish unit rates to each material. Overheads, mobilisation and other fixed costs were ignored. The rates were extracted from 10 years of pavement construction at a major international airport in Australia (
Table 5). The subsequent construction and WOLC values depend greatly on the relative unit cost rates. Although these rates are typical of the Australian market, other jurisdictions must confirm their own rates. The unit costs were applied over an area 2500 m long and 45 m wide, reflecting a typical major regional runway in Australia, excluding shoulders, taxiways and other non-full strength pavement areas (
Table 6). For example, the cost of the rigid pavement for the B737 aircraft on CBR 3 subgrade is calculated to be AUD 13 (subgrade preparation) + AUD 150 × 0.15 m (crushed rock) + AUD 500 × 0.45 m (concrete) = AUD 260.50/m
2, or AUD 29.306 M over the full runway area.
3.5. Maintenance Costs
Maintenance costs were estimated over analysis periods of 40 years, 60 years, 80 years and 100 years. The standard period of 40 years reflects the design life of a rigid aircraft pavements in Australia. However, it is well established that rigid aircraft pavements are designed conservatively, with replacement usually triggered by non-structural distresses (such as joint spalling) and often last 60 years or more [
22]. Consequently, longer analysis periods were also considered to allow their effect to be evaluated.
Typical unit rates for common maintenance activities were determined from 10 years of maintenance contracts at civil and military airfields in Australia (
Table 7). Quantities of maintenance were estimated as portions of the pavement area, or the length of joints in rigid pavements, or as bulk items where the cost was minor. Expedient works include slab replacement and asphalt resurfacing and the cost rates are higher than for normal day-time construction, reflecting the increased resources, higher waste generation and reduced productivity associated with performing civil construction work in short (often night time) pavement closures and returning the pavement to service between work periods [
23]. Like the construction cost rates, the maintenance cost rates are typical of the Australian airport market but must be verified for other jurisdictions.
All rigid pavements were assumed to require the same level of maintenance over their 40-year design life, regardless of the aircraft or the subgrade condition. Rigid pavement maintenance allowance included:
Spall repairs: 10, 20 and 30 years after construction at a rate of 0.5% of the pavement area.
Joint resealing: 25 years after construction at a rate of 100% of the length of all joints.
Crack route and seal: 12, 24 and 26 years after construction at a rate of 10% of the length of all joints.
Slab replacement: 35 years after construction at a rate of 1% of the pavement area.
Similarly, all flexible pavements were assumed to require the same maintenance, including asphalt resurfacing by asphalt overlay every 10 years. Other flexible pavement maintenance allowance included:
Crack sealing: 4- and 7-years following surfacing and resurfacing.
Surface preservation: 8 years following surfacing and resurfacing, applying to the whole surface.
Asphalt patching: 5- and 9-years following surfacing and resurfacing, at a rate of 1% of the pavement area.
Maintenance costs were applied through the various analysis periods and were discounted to represent the present value at the time of construction. That is, the further into the future the maintenance was required, the lower the present value of the maintenance and the less it added to the WOLC. Although alternate end of life assumptions and associated residual values are discussed below, the total actual (undiscounted) maintenance costs for the various analysis periods are summarised in
Table 8.
3.6. Other Assumptions
Other assumptions made and tested include:
Discount rate. Used to reduce future costs to a present value.
End of life. Different to the design life, the end of life considers the likely actual serviceable life of the various pavements.
Residual value. The value (or cost) of the pavement at the end of the various analysis periods.
Discount rates of 3%, 5% and 7% were considered to evaluate the sensitivity of the WOLC costs to this parameter. Discount rates were only applied to future costs, such as maintenance, resurfacing (flexible pavements) and reconstruction (rigid pavements), so do not affect the construction cost. The discount rates were also applied to the residual value at the end of the analysis period.
Rigid and flexible pavements are generally designed for a 40-year and 15-year structural design life, respectively, in Australia [
2]. In the USA, 20 years is often applied to both pavement types. However, rigid pavements are known to routinely exceed the design life, with many examples of 60 or more years old pavements still in service. Similarly, flexible pavements do not usually fail after 15 years. Rather, they are resurfaced, typically every 10–12 years, resetting the subgrade rutting failure condition, and are effectively perpetual in nature [
1]. The 15-year design life is merely selected to ensure the flexible pavement structure lasts longer than the surface, so that resurfacing is required prior to reaching the terminal subgrade rutting condition. For the calculation of WOLC costs, the flexible pavements were assumed to be resurfaced every 10 years but to never require reconstruction [
7]. However, the rigid pavements were assumed to require reconstruction every 40 years.
To test the sensitivity of the WOLC costs to this assumption, the 40-year analysis period was repeated, assuming the rigid pavement:
3.7. Whole of Life Cost Estimates
The WOLC costs are summarised in
Appendix A. The summary includes the 40, 60, 80 and 100-year analysis periods for 3%, 5% and 7% discount rates. For the 40-year analysis period, the different rigid pavement end of life conditions were also considered via the residual value. These included:
For the reconstruction options, the cost of removing the existing pavement was assumed to be off-set by the value of the crushed concrete for reincorporation to the reconstruction or other project. That is, the cost of demolition and reconstruction was set equal to the cost of construction, either under continuous closure or in an expedient manner. In all cases, the residual value of the flexible pavement was the initial construction value less the cost of resurfacing, reflecting the perpetual nature of the pavement, as long as resurfacing occurs every 10 years [
7].
4. Discussion
4.1. Construction Costs
Rigid airfield pavements are more expensive to construct (
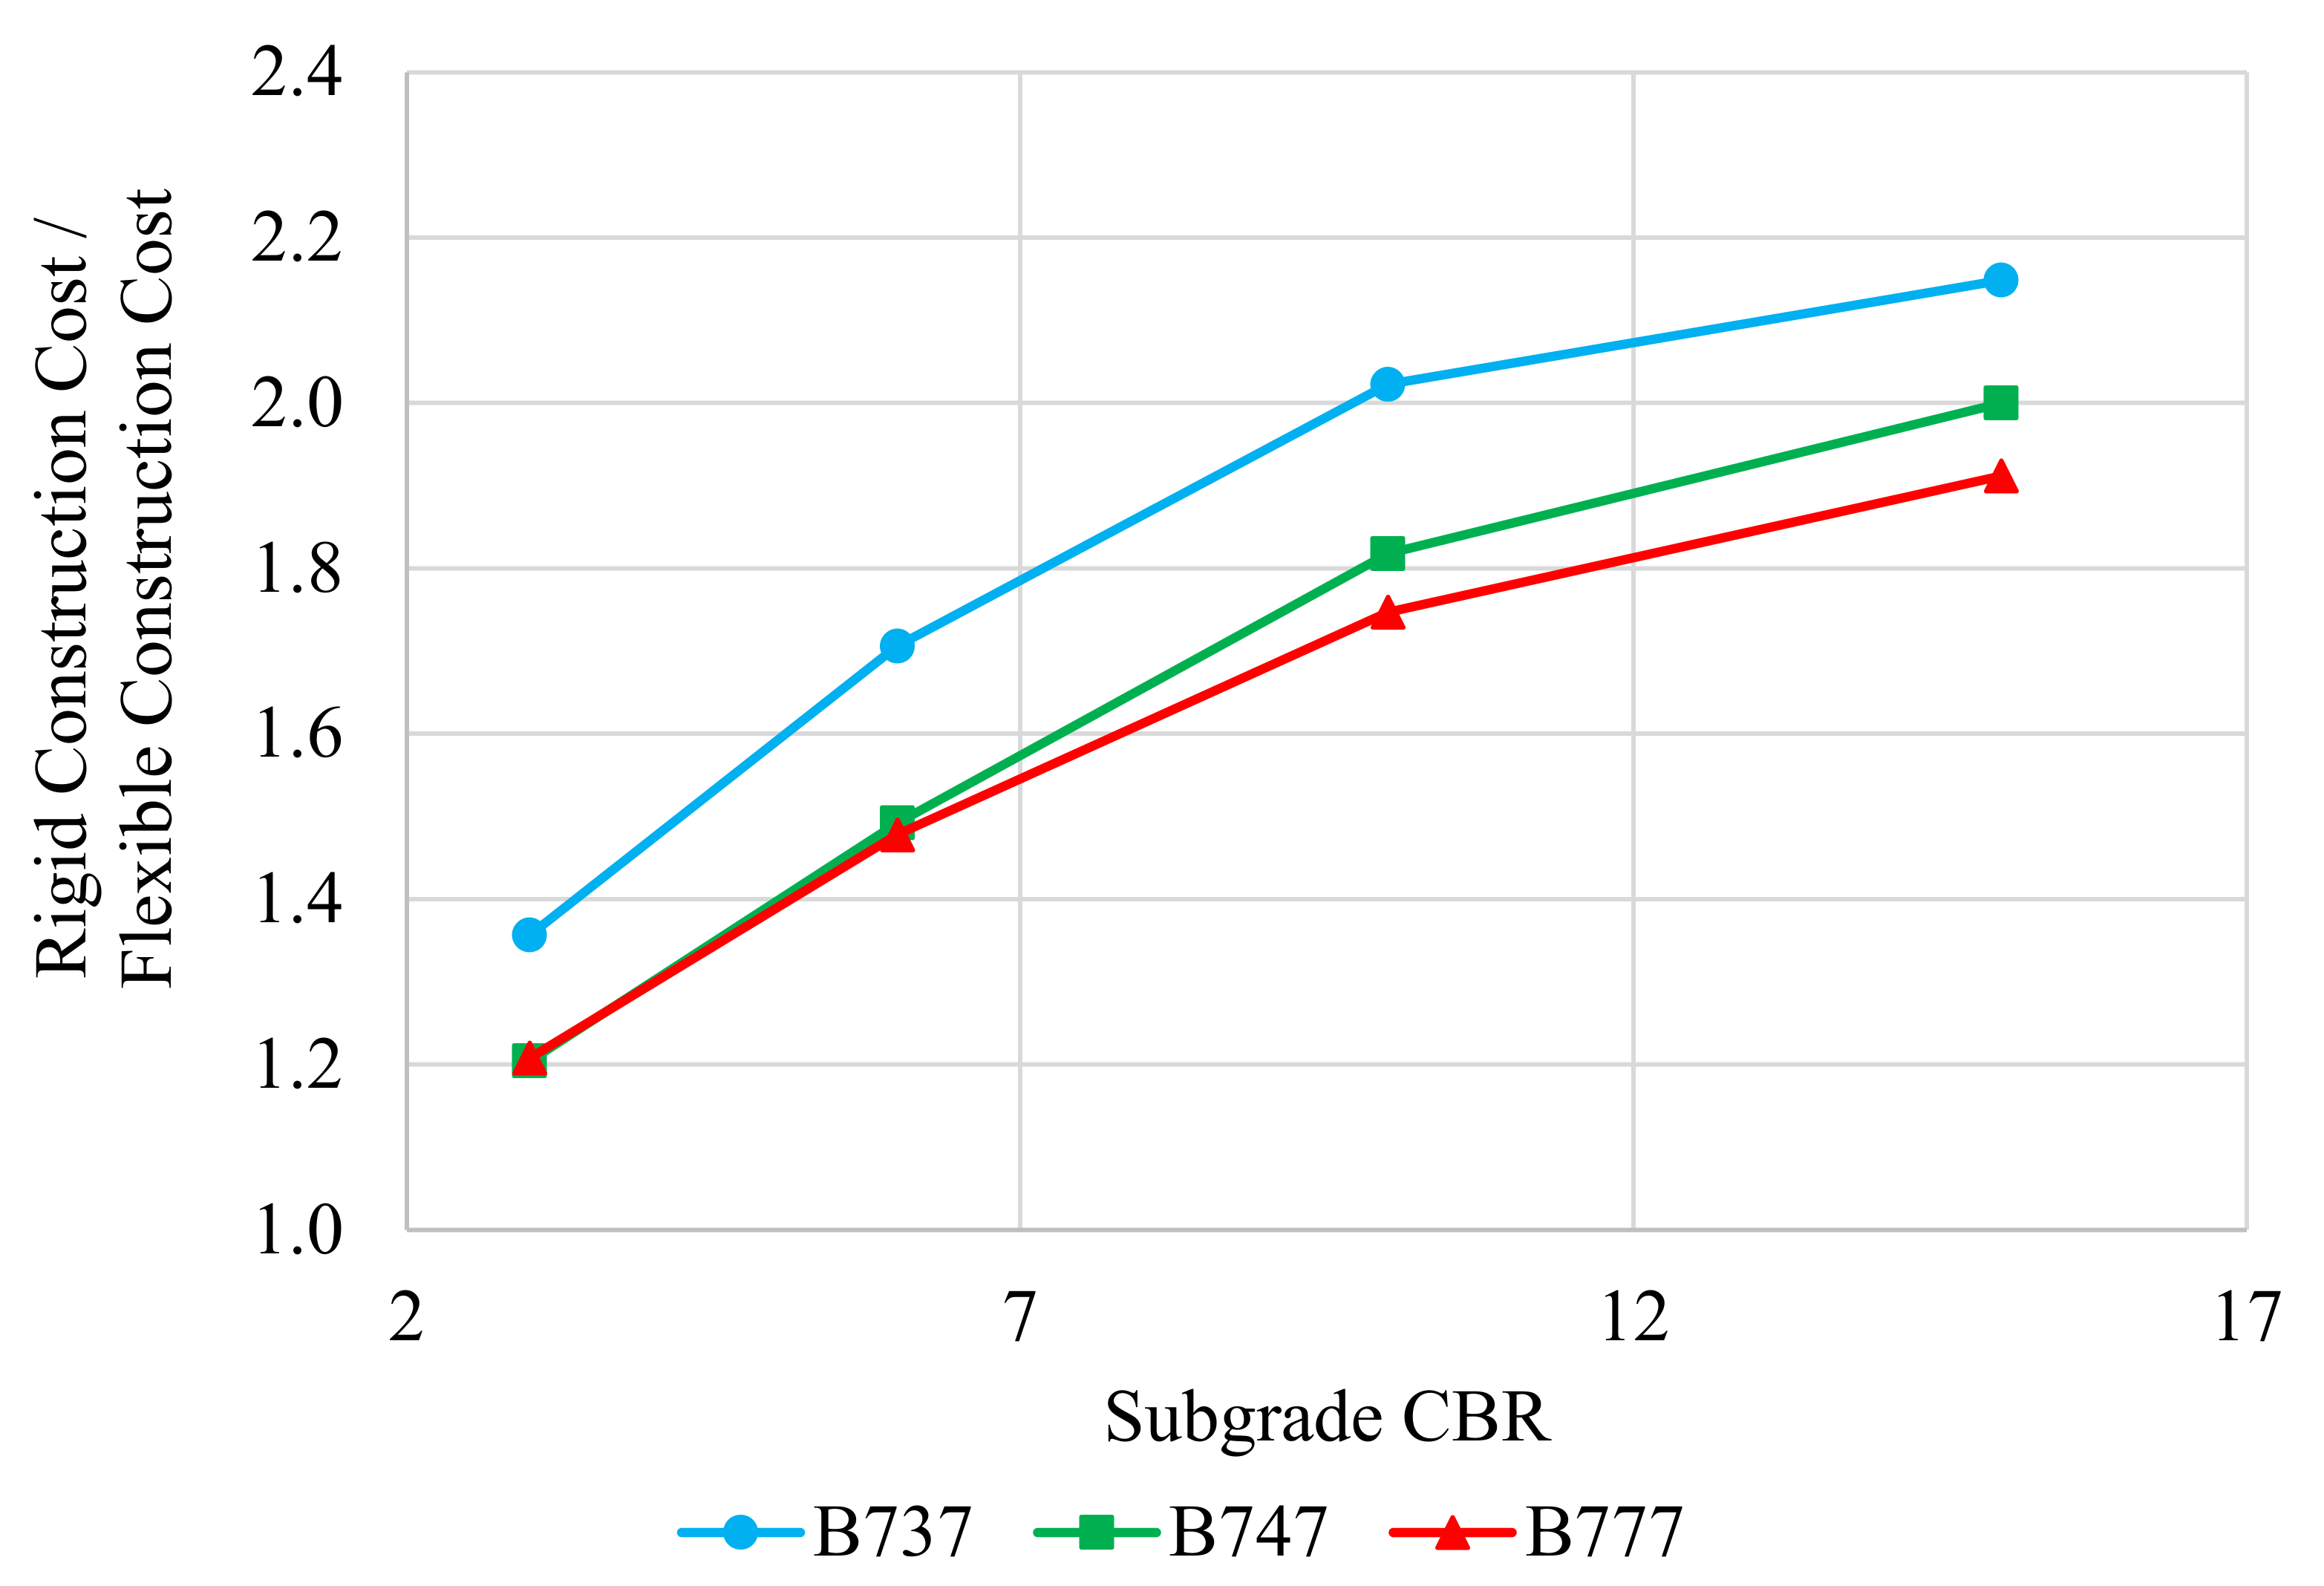
Table 6) with the cost of rigid pavement construction ranging from 20% to more than 110% more than a flexible pavement of equivalent strength (
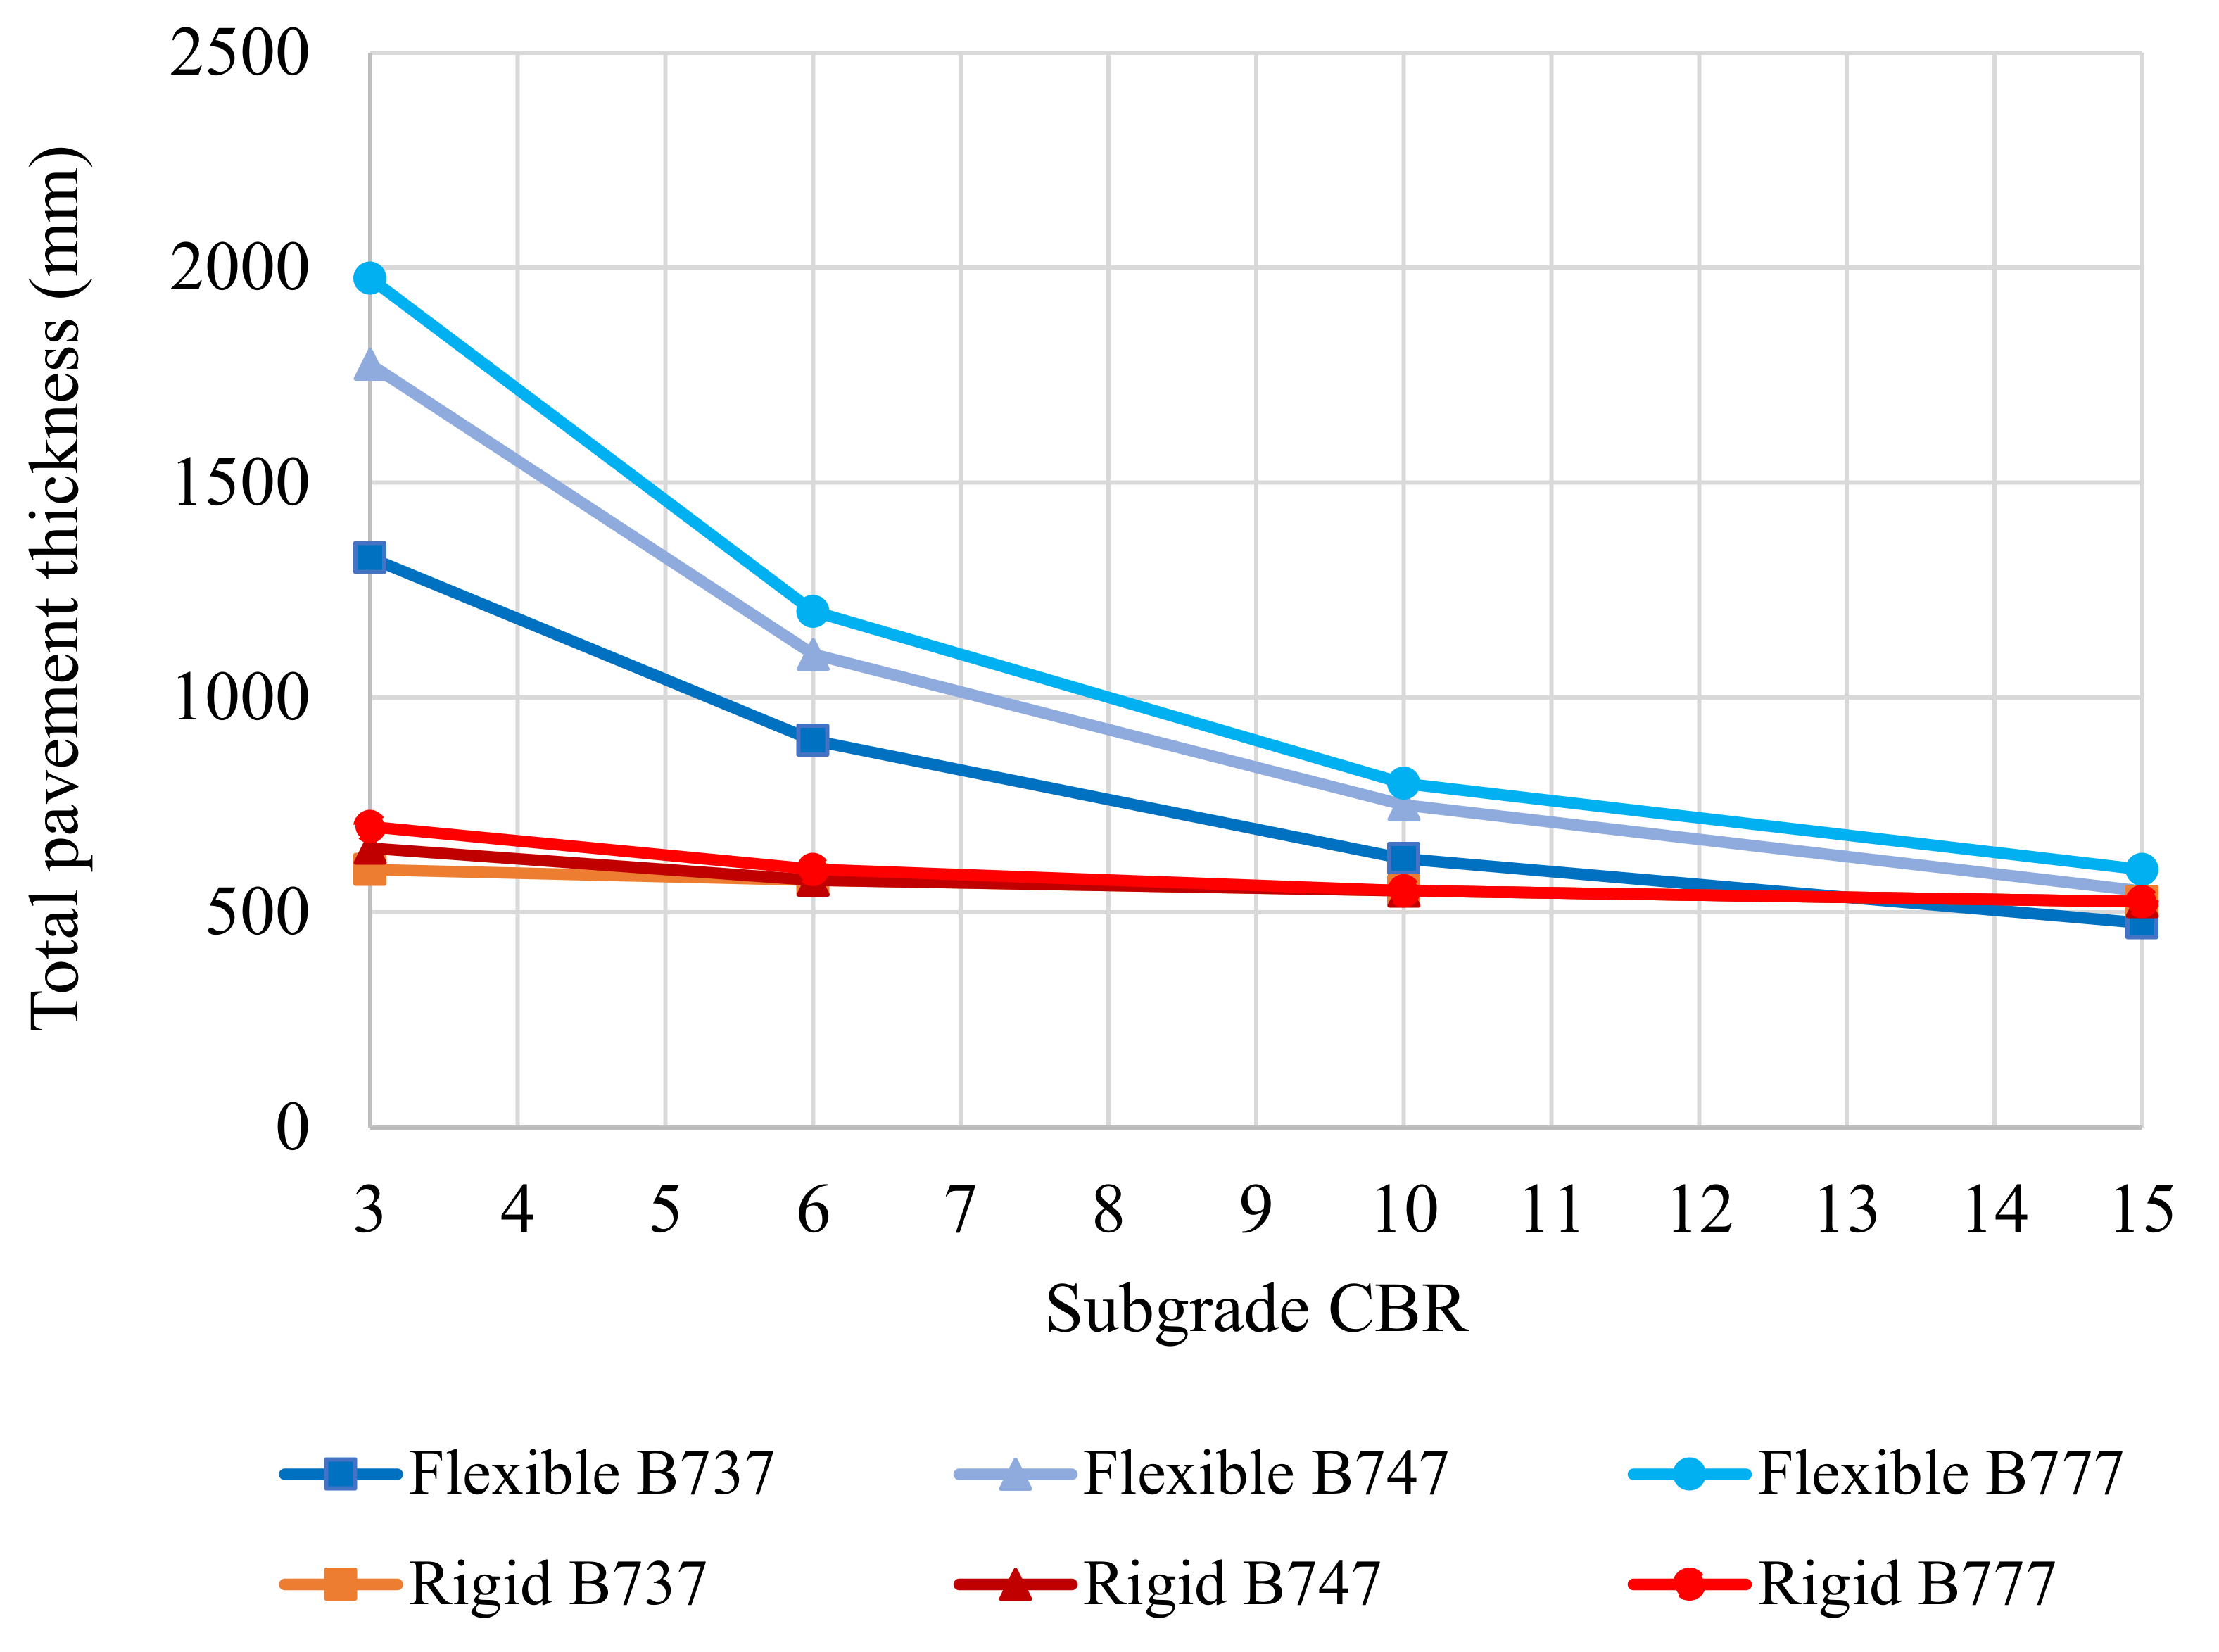
Figure 1). This reflects the high cost of concrete compared to the crushed rock that makes up the majority of the thickness of the flexible pavements. The range of additional cost associated with rigid pavement construction reflects the fact that concrete pavement thickness is less sensitive to subgrade CBR than flexible pavement construction is (
Figure 2). Consequently, at low subgrade CBR values, the flexible pavement is much thicker than the concrete pavement and the additional cost associated with the more expensive concrete is less significant than for higher subgrade CBR values, where the pavements are of comparable total thickness.
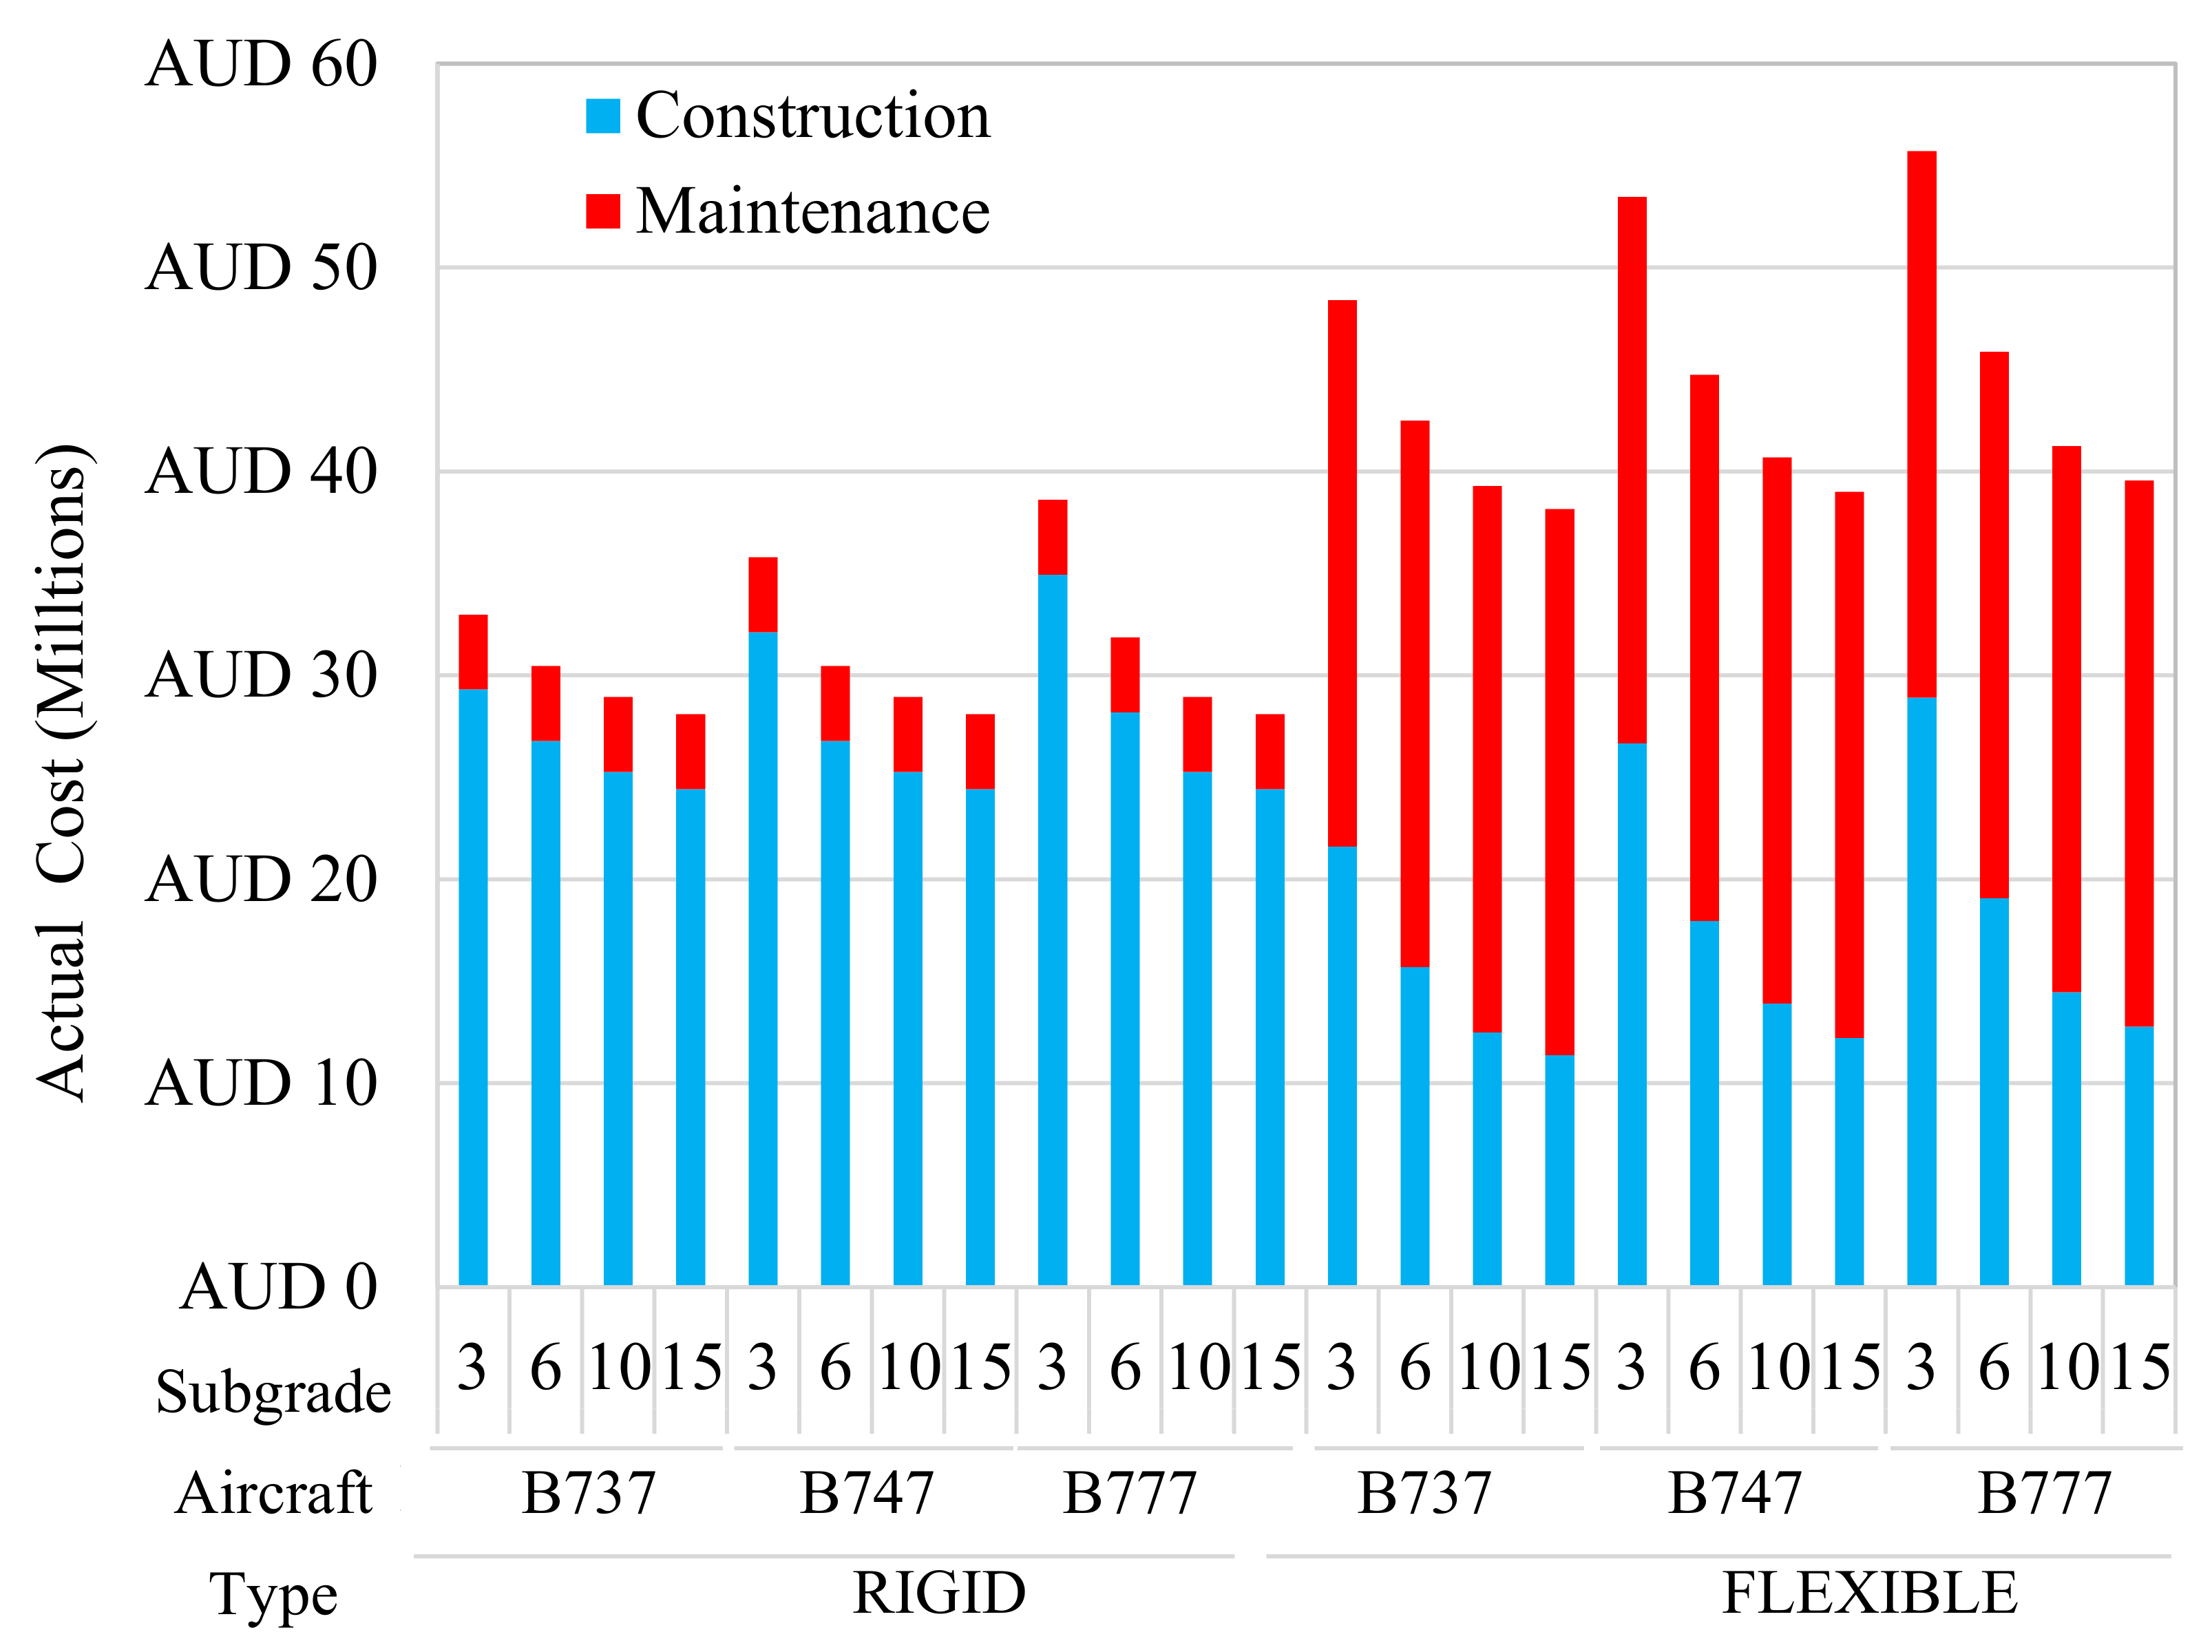
4.2. Maintenance Costs
In contrast to the construction costs, the maintenance costs for the flexible pavement significantly exceed those of the rigid pavements. This reflects the rigid pavements requiring relatively little maintenance during the 40-year design life, compared to the resurfacing of the flexible pavement every 10 years. In actual (undiscounted) cost, the total (construction and maintenance) cost of the flexible pavements exceeds that of the rigid pavements (
Figure 3). Particularly for the smaller aircraft (B737) and stronger subgrade (CBR 15) the flexible pavement maintenance cost significantly exceeds the cost to construct the pavement, in this case by 136%. However, this does not reflect the financial benefit of deferring costs associated with maintenance, nor does it consider the difference in residual value at the end of the 40-year analysis period, which are considered in the WOLC cost.
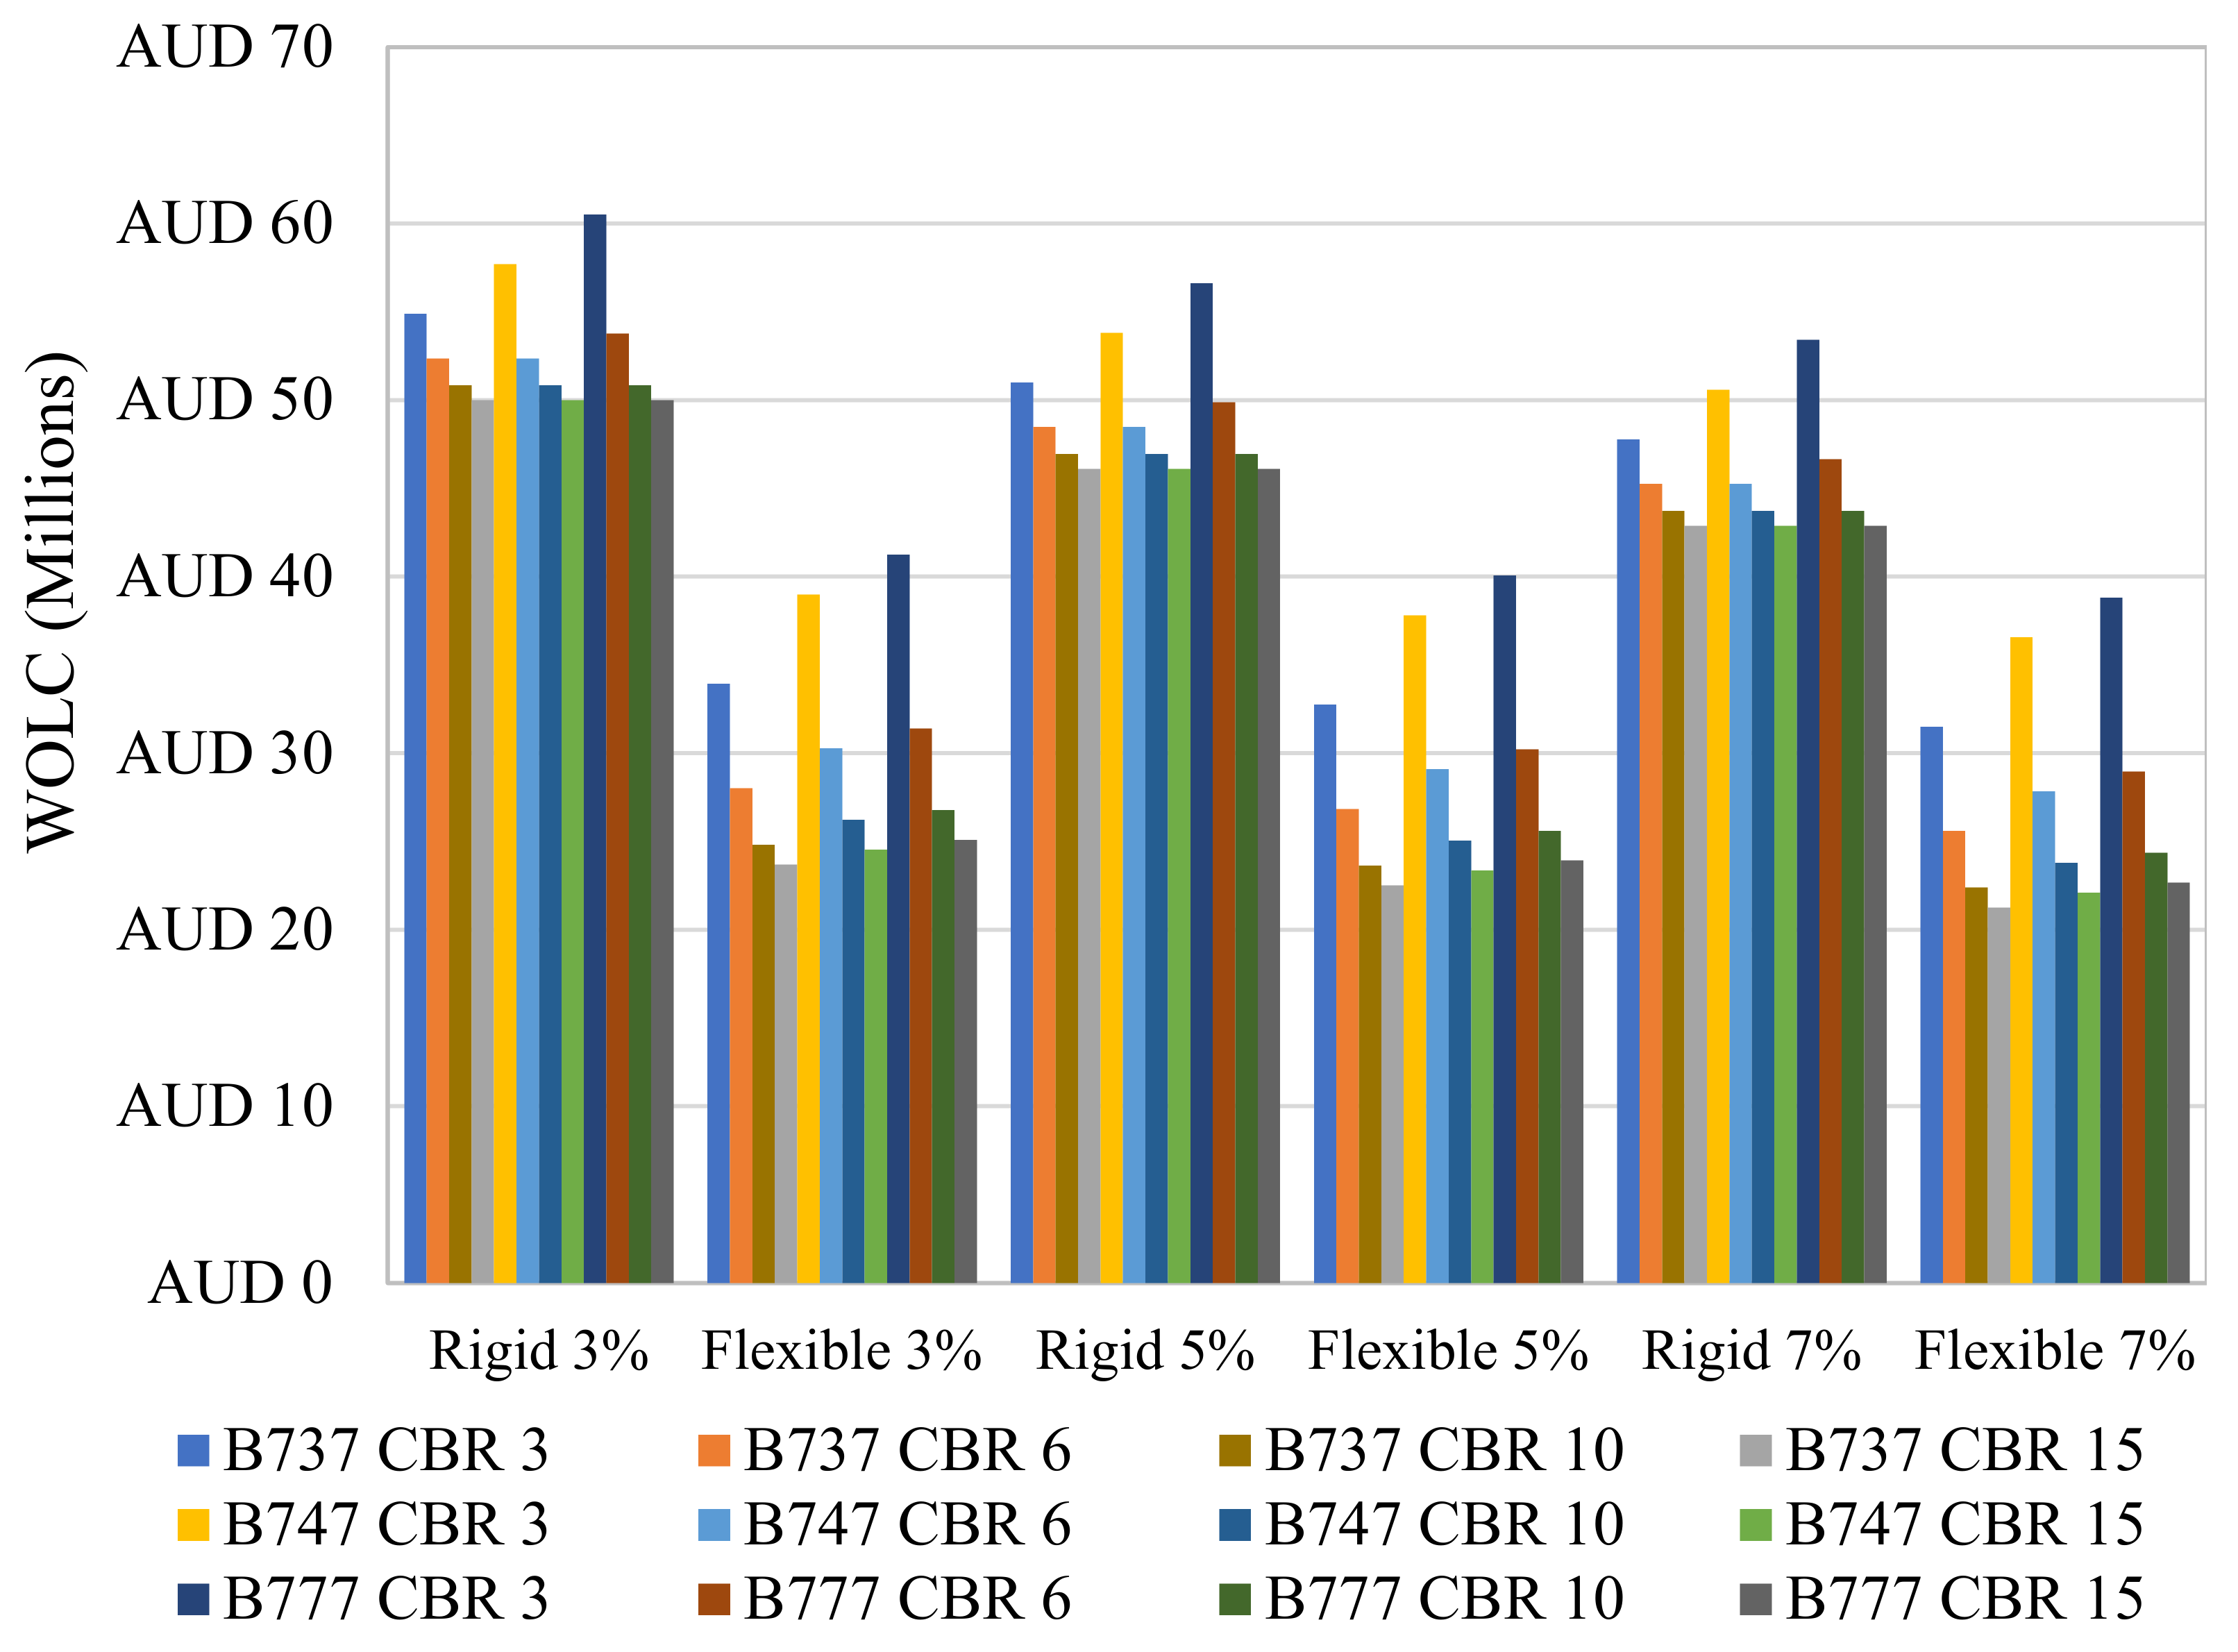
4.3. Whole of Life Cost
When the maintenance costs and residual values were discounted to calculate the WOLC cost, the difference between rigid and flexible pavements becomes more consistent, ranging from 41% to 105% for the 40-year analysis period and 5% discount rate (
Figure 4). This range again reflects the higher sensitivity of flexible pavement thickness to subgrade strength, compared to rigid pavement thickness, although the effect was diluted by the discounted maintenance costs and residual values. Consequently, the relative additional WOLC cost of rigid pavement increased with higher subgrade CBR values. Furthermore, the importance of discounting the maintenance costs and including the residual value is demonstrated by comparing
Figure 3 with
Figure 4. When only the construction costs and the actual (undiscounted) maintenance costs were considered (
Figure 3) the flexible pavements were more expensive. In contrast, the WOLC costs (
Figure 4) take into account the residual value at the end of the analysis period and the discounted maintenance costs, resulting in the rigid pavements being significantly more expensive. The effect of varying the discount rate, as well as the analysis period, is described below.
4.4. Effect of Discount Rate
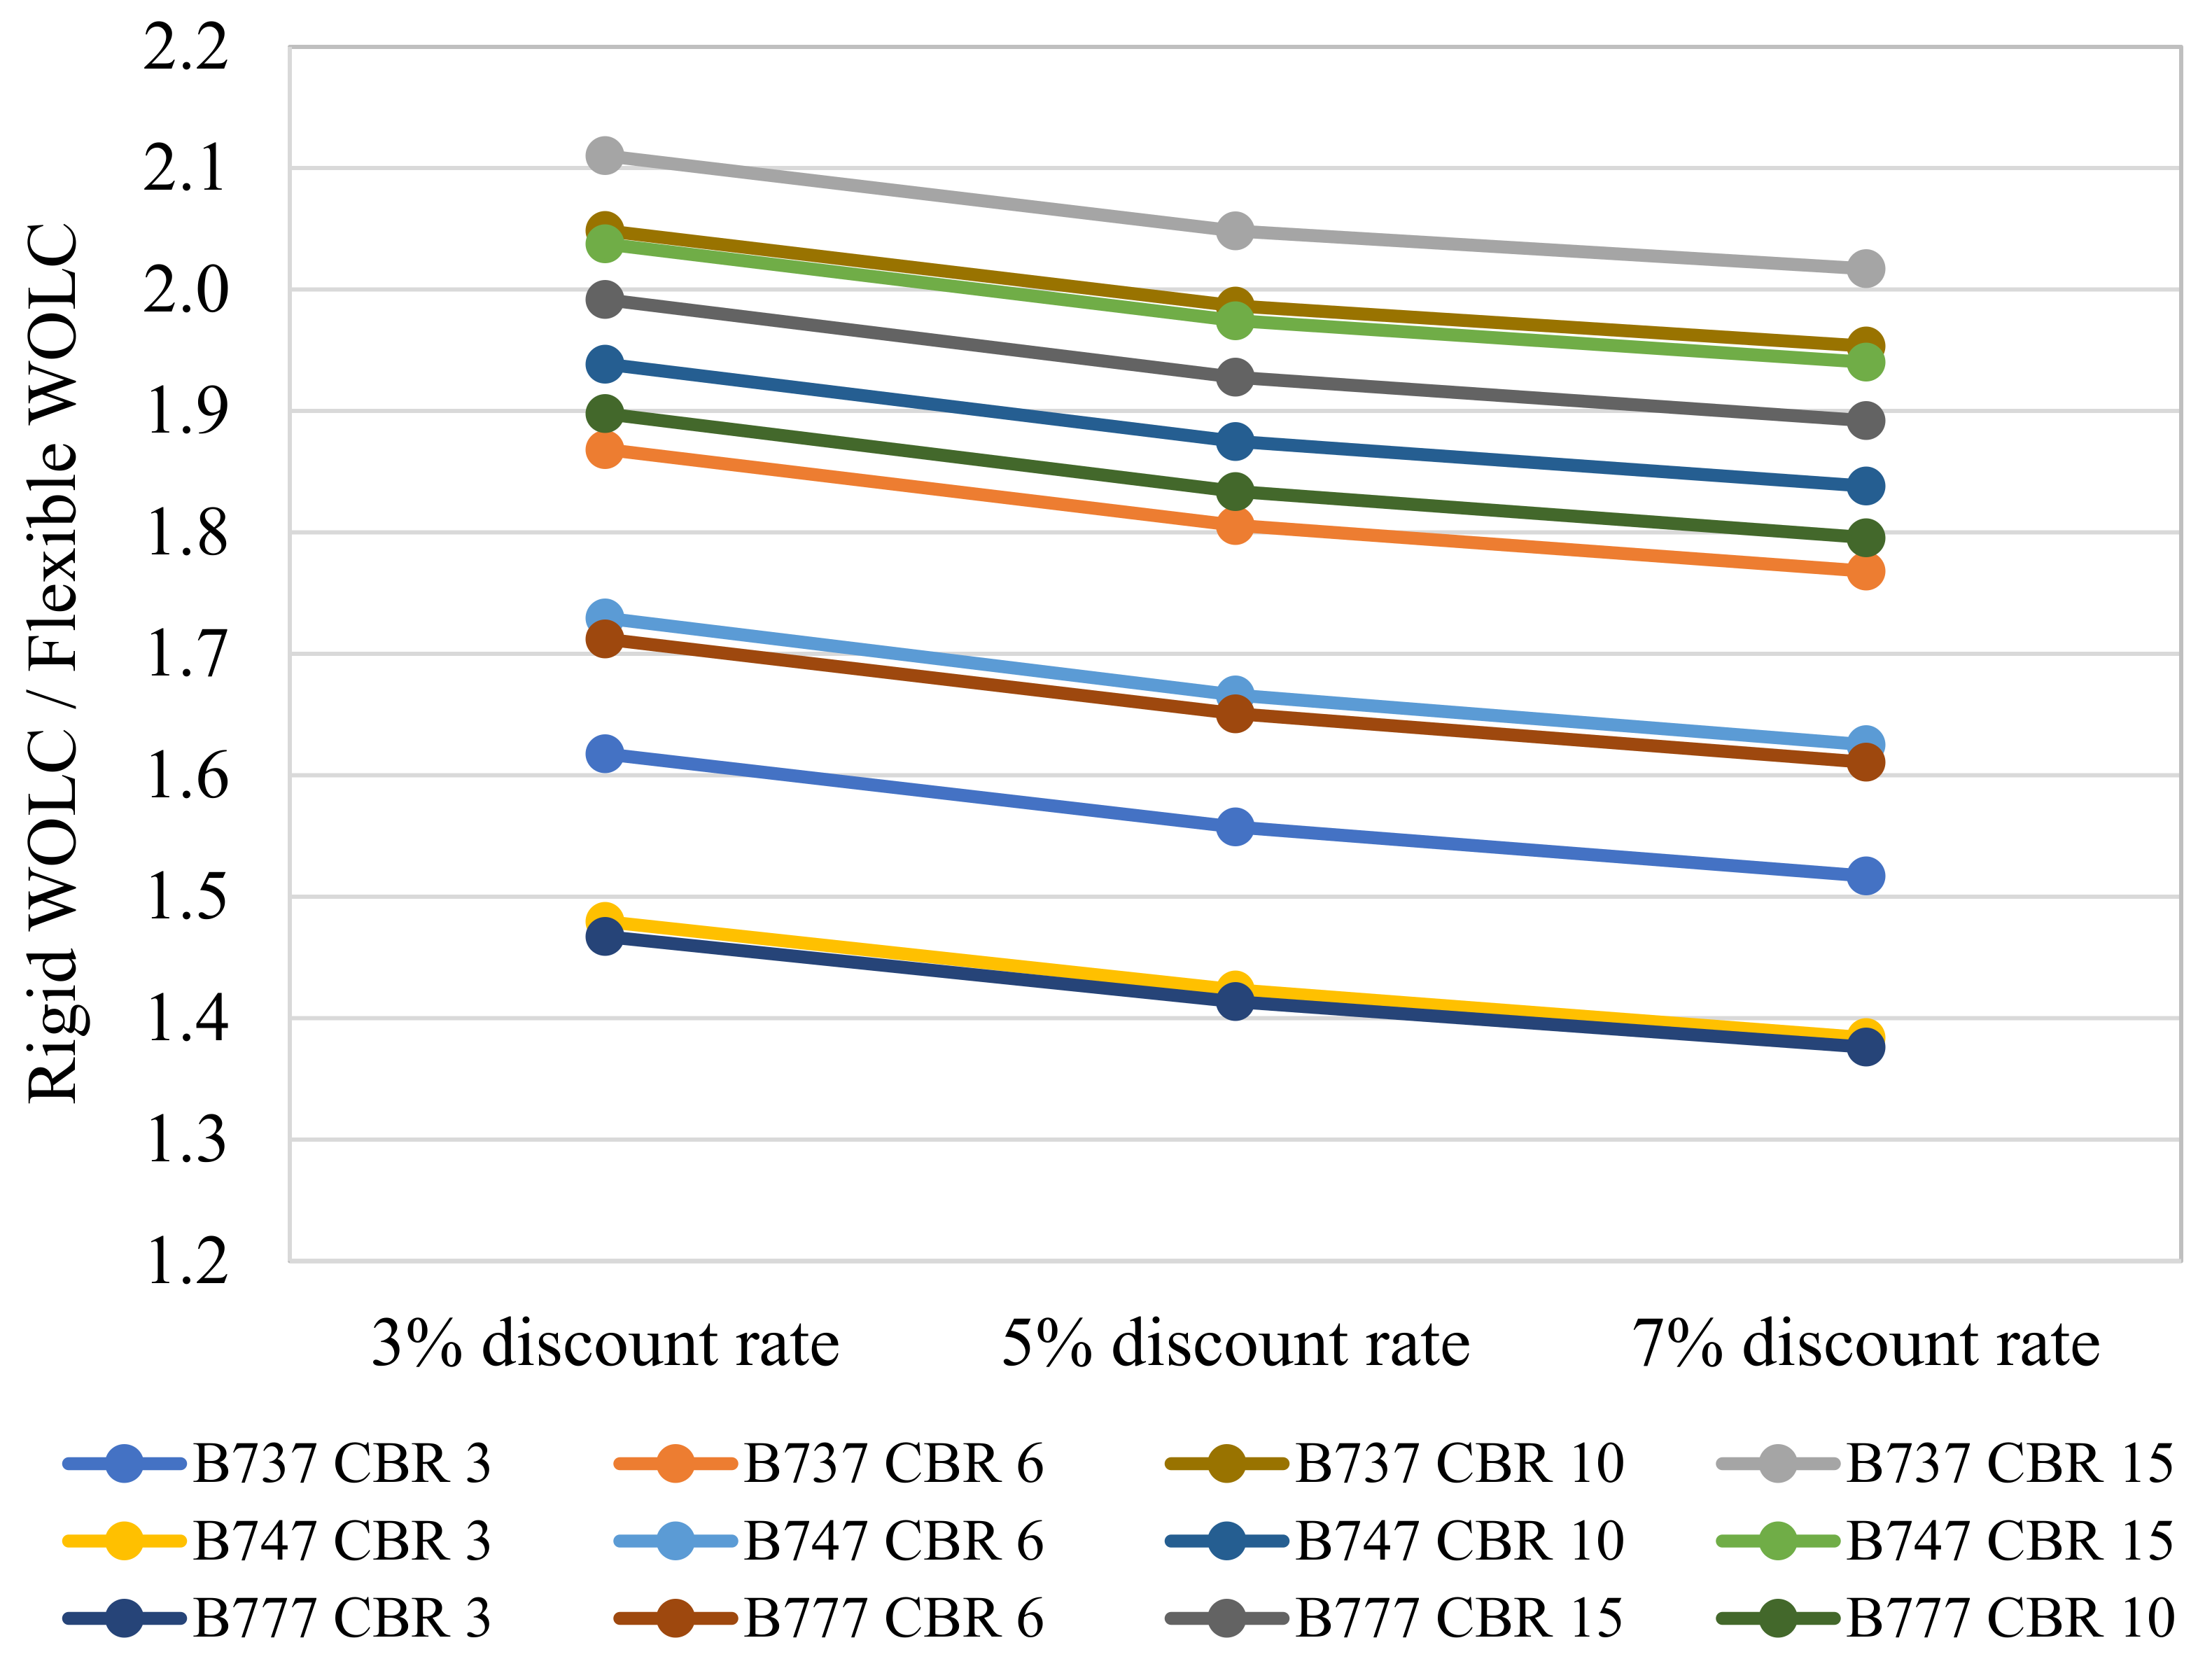
When the WOLC analysis was repeated at different discount rates, the construction cost and actual maintenance costs were the same, as were the actual residual values at the end of the analysis period. As the discount rate increased, the WOLC cost reduced for all aircraft and subgrade conditions (
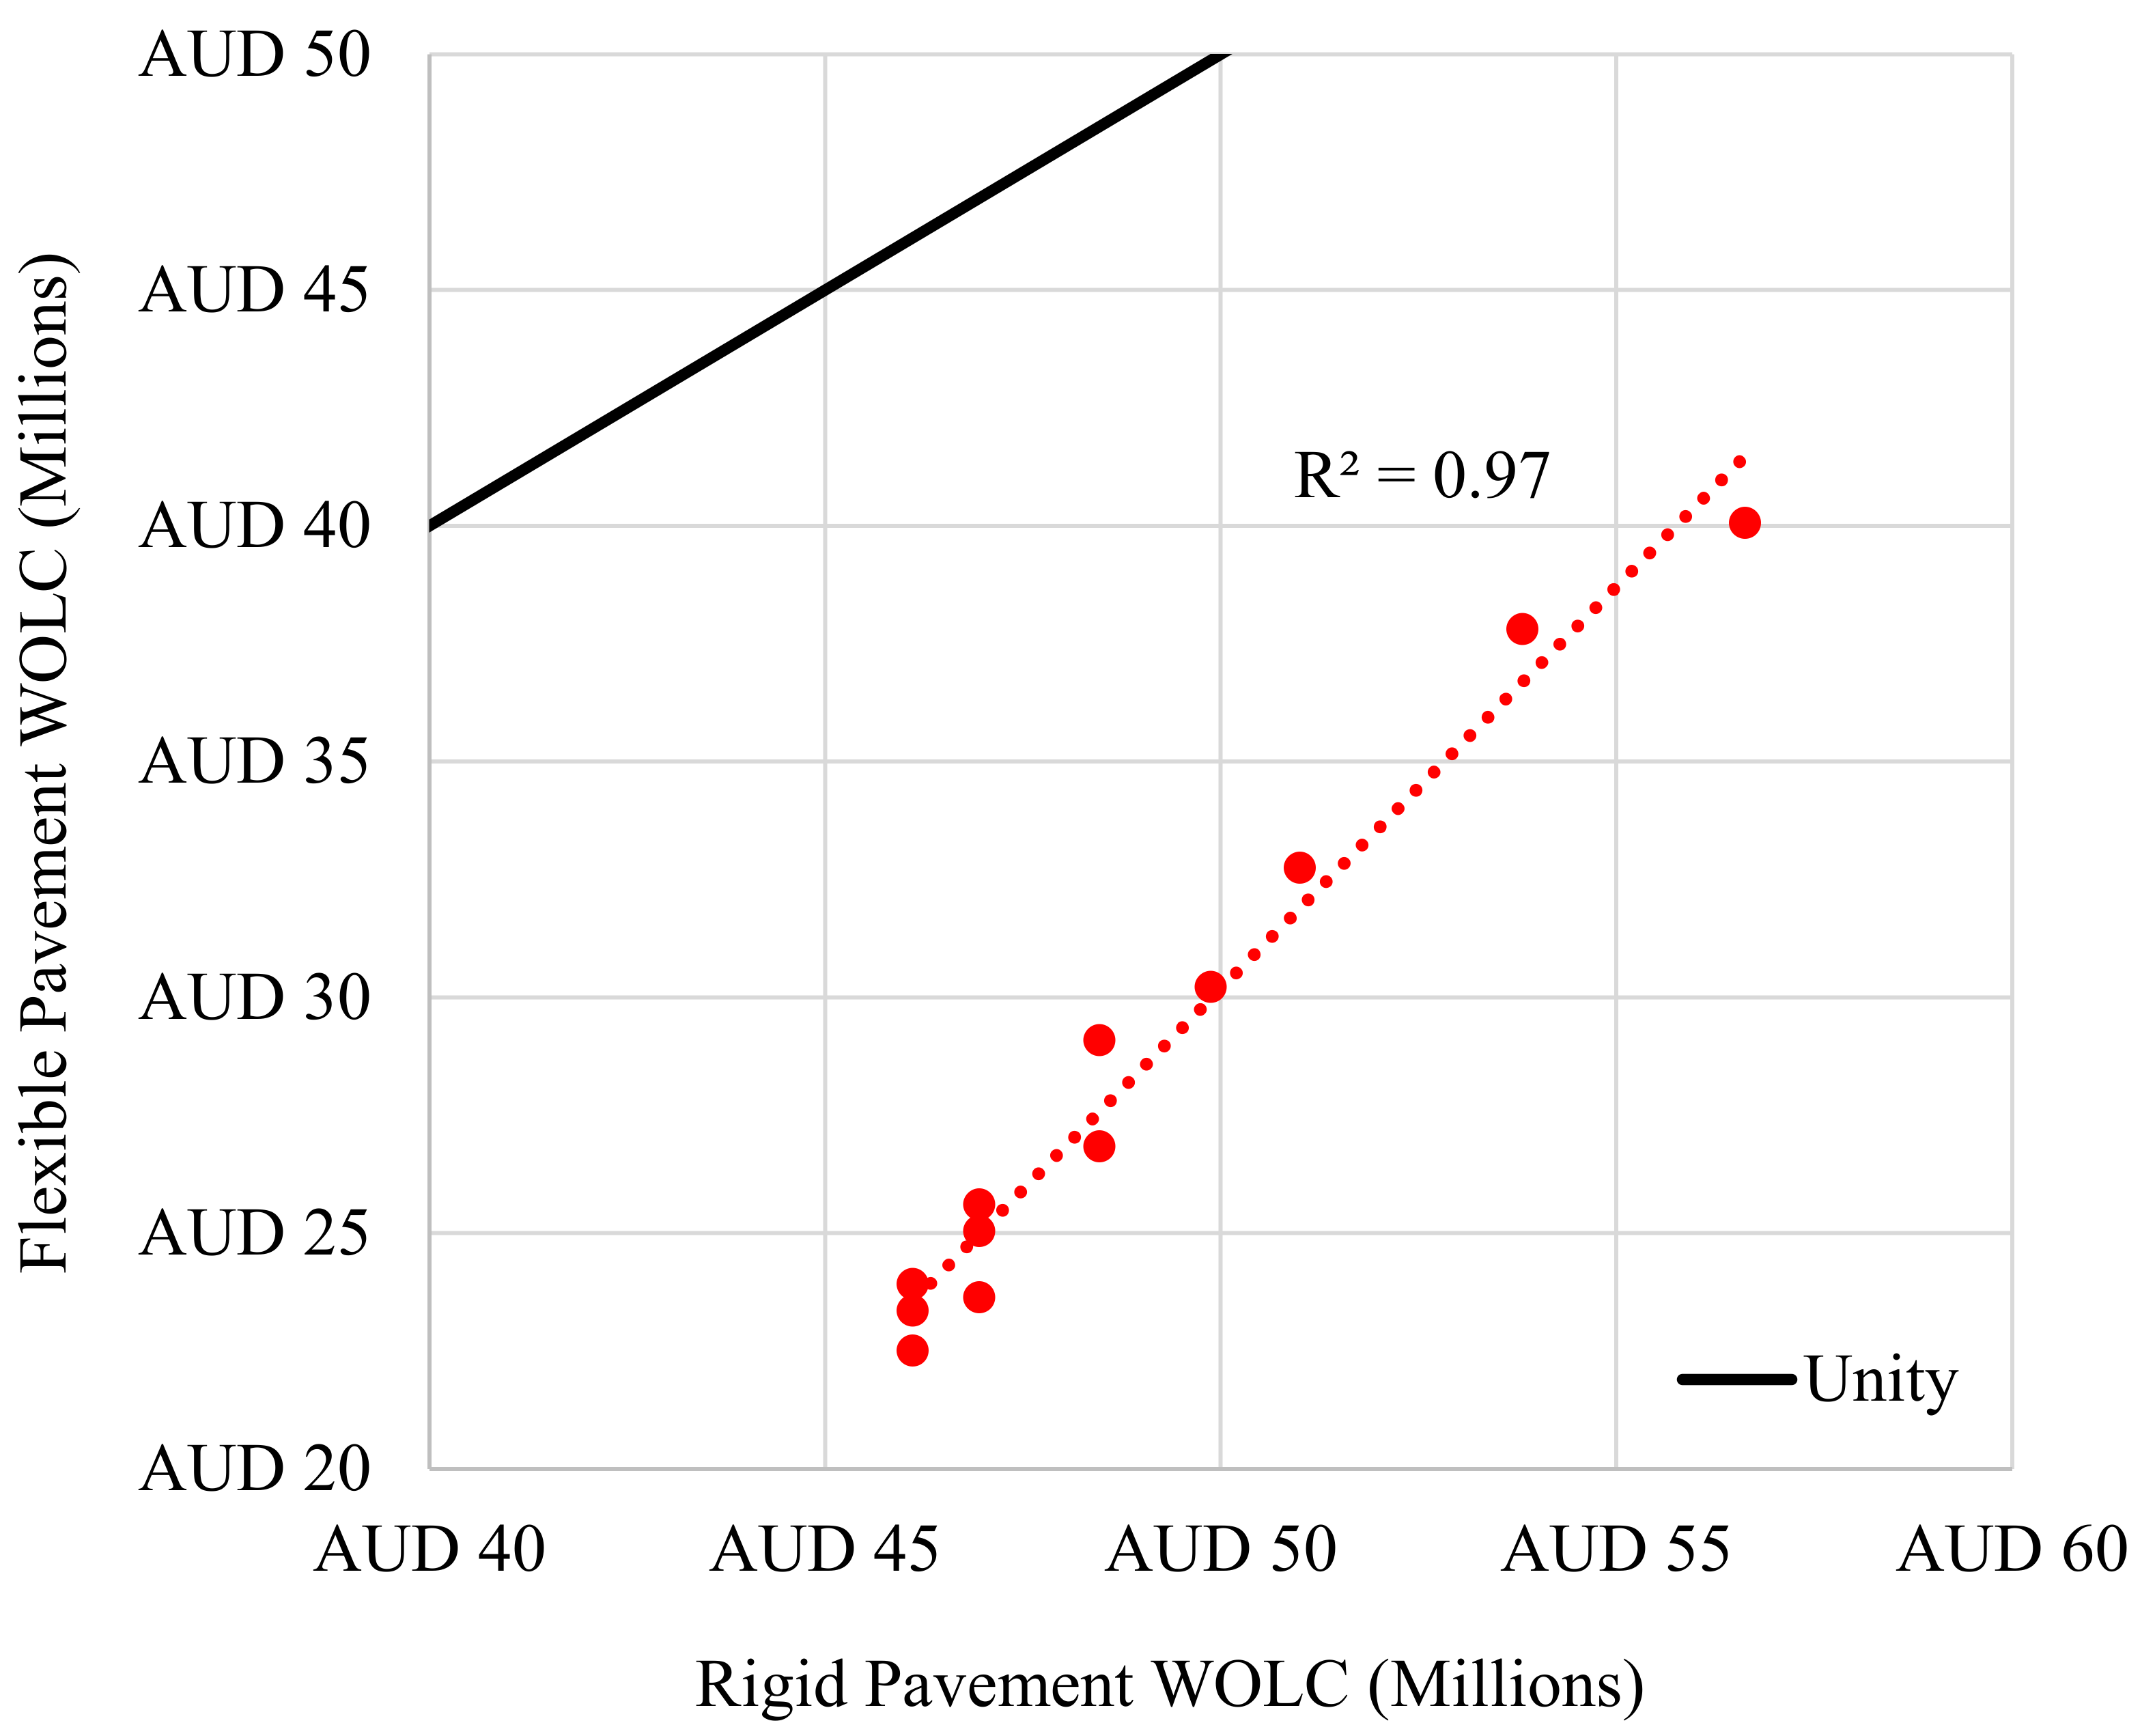
Figure 5) because all maintenance costs were discounted by a greater amount when converted to present value. Furthermore, as the discount rate increased, the ratio between the rigid WOLC and flexible WOLC costs decreased (
Figure 6) reflecting the high influence of the residual cost on the rigid pavement WOLC cost, which is discussed further below.
4.5. Importance of Residual Value and End of Life Condition
The analysis period ended at the end of the rigid pavement design life (40 years). Consequently, the residual value and the end-of-life condition were inherently related for the rigid pavements. For example, if the assumed end of life condition was that the rigid pavement was failed and requires reconstruction, then the residual value was negative and equal to the cost of reconstruction. However, if the end of analysis (or design life) condition was assumed to be that the pavement was in reasonable condition and was expected to remain serviceable for a further 20 years (a total serviceable life of 60 years) then the residual value was positive and was set to 50% of the initial construction cost, which was based on a 40-year design life. In contrast, the perpetual nature of the flexible pavement means the residual value was the initial construction cost less the cost of resurfacing, which was always positive.
Complicating the question of residual value for rigid pavements is whether there is a need to reconstruct rigid pavements in an expedient manner or not. Expedient rigid pavement reconstruction is logistically complex and relatively expensive compared to construction during continuous pavement closures, or normal conditions [
23].
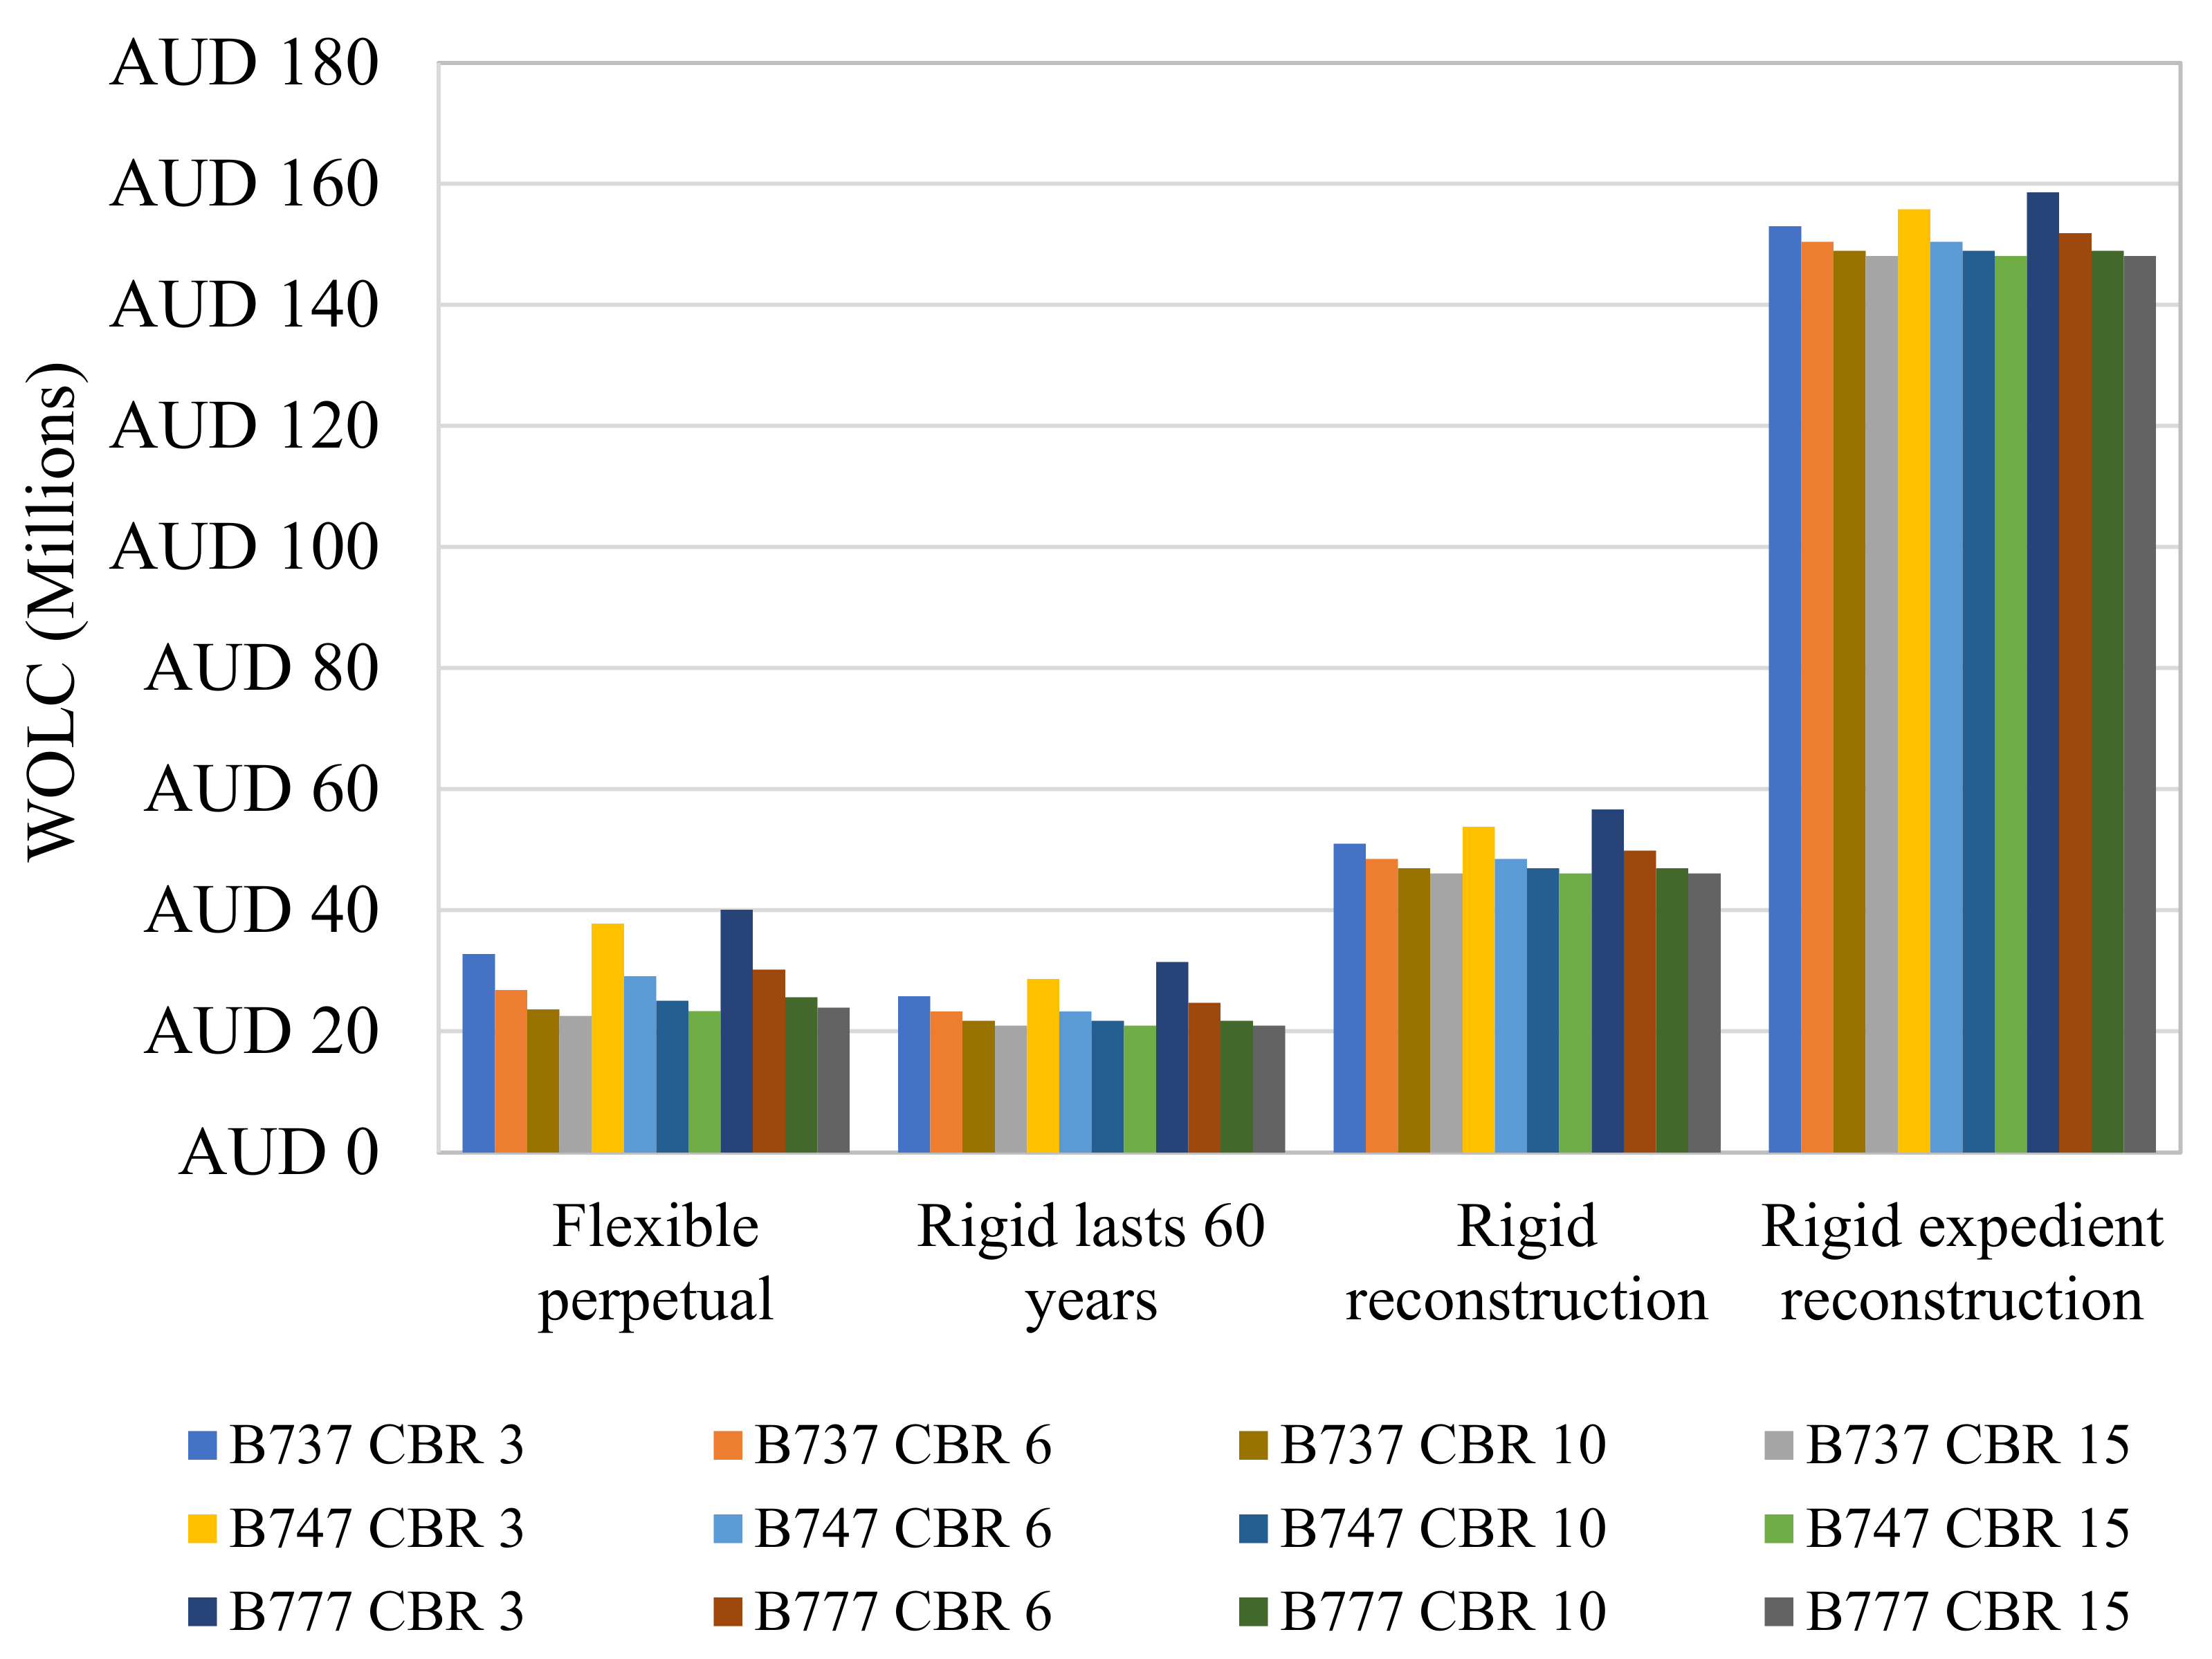
Adopting a 60-year service life reduced the rigid pavement WOLC to below the WOLC cost of the flexible pavement, while adapting expedient pavement reconstruction increased the WOLC cost associated with the rigid pavements by approximately four times (
Figure 7). Because the flexible pavement WOLC cost was unaffected by the rigid pavement end of life condition and residual value, the ratio between the rigid and flexible pavement WOLC cost also varied significantly, depending on the rigid pavement end of life assumption and the associated residual value (
Figure 8). It is clear that the end-of-life assumption, and associated residual value, had a significant impact on the WOLC costs, with resulting conclusions ranging from:
Rigid pavements have a lower WOLC cost, when a further 20 years of serviceability was assumed.
Rigid pavement WOLC cost is 4–7 times that of flexible pavements, when expedient reconstruction was assumed at the end of the design life.
It is also clear that expedient reconstruction of rigid pavements is substantially more expensive than reconstruction during ongoing pavement closure. Consequently, it would be more economical to build a second rigid pavement runway than it would be to expediently reconstruct an existing rigid pavement runway, if the land and airspace were available.
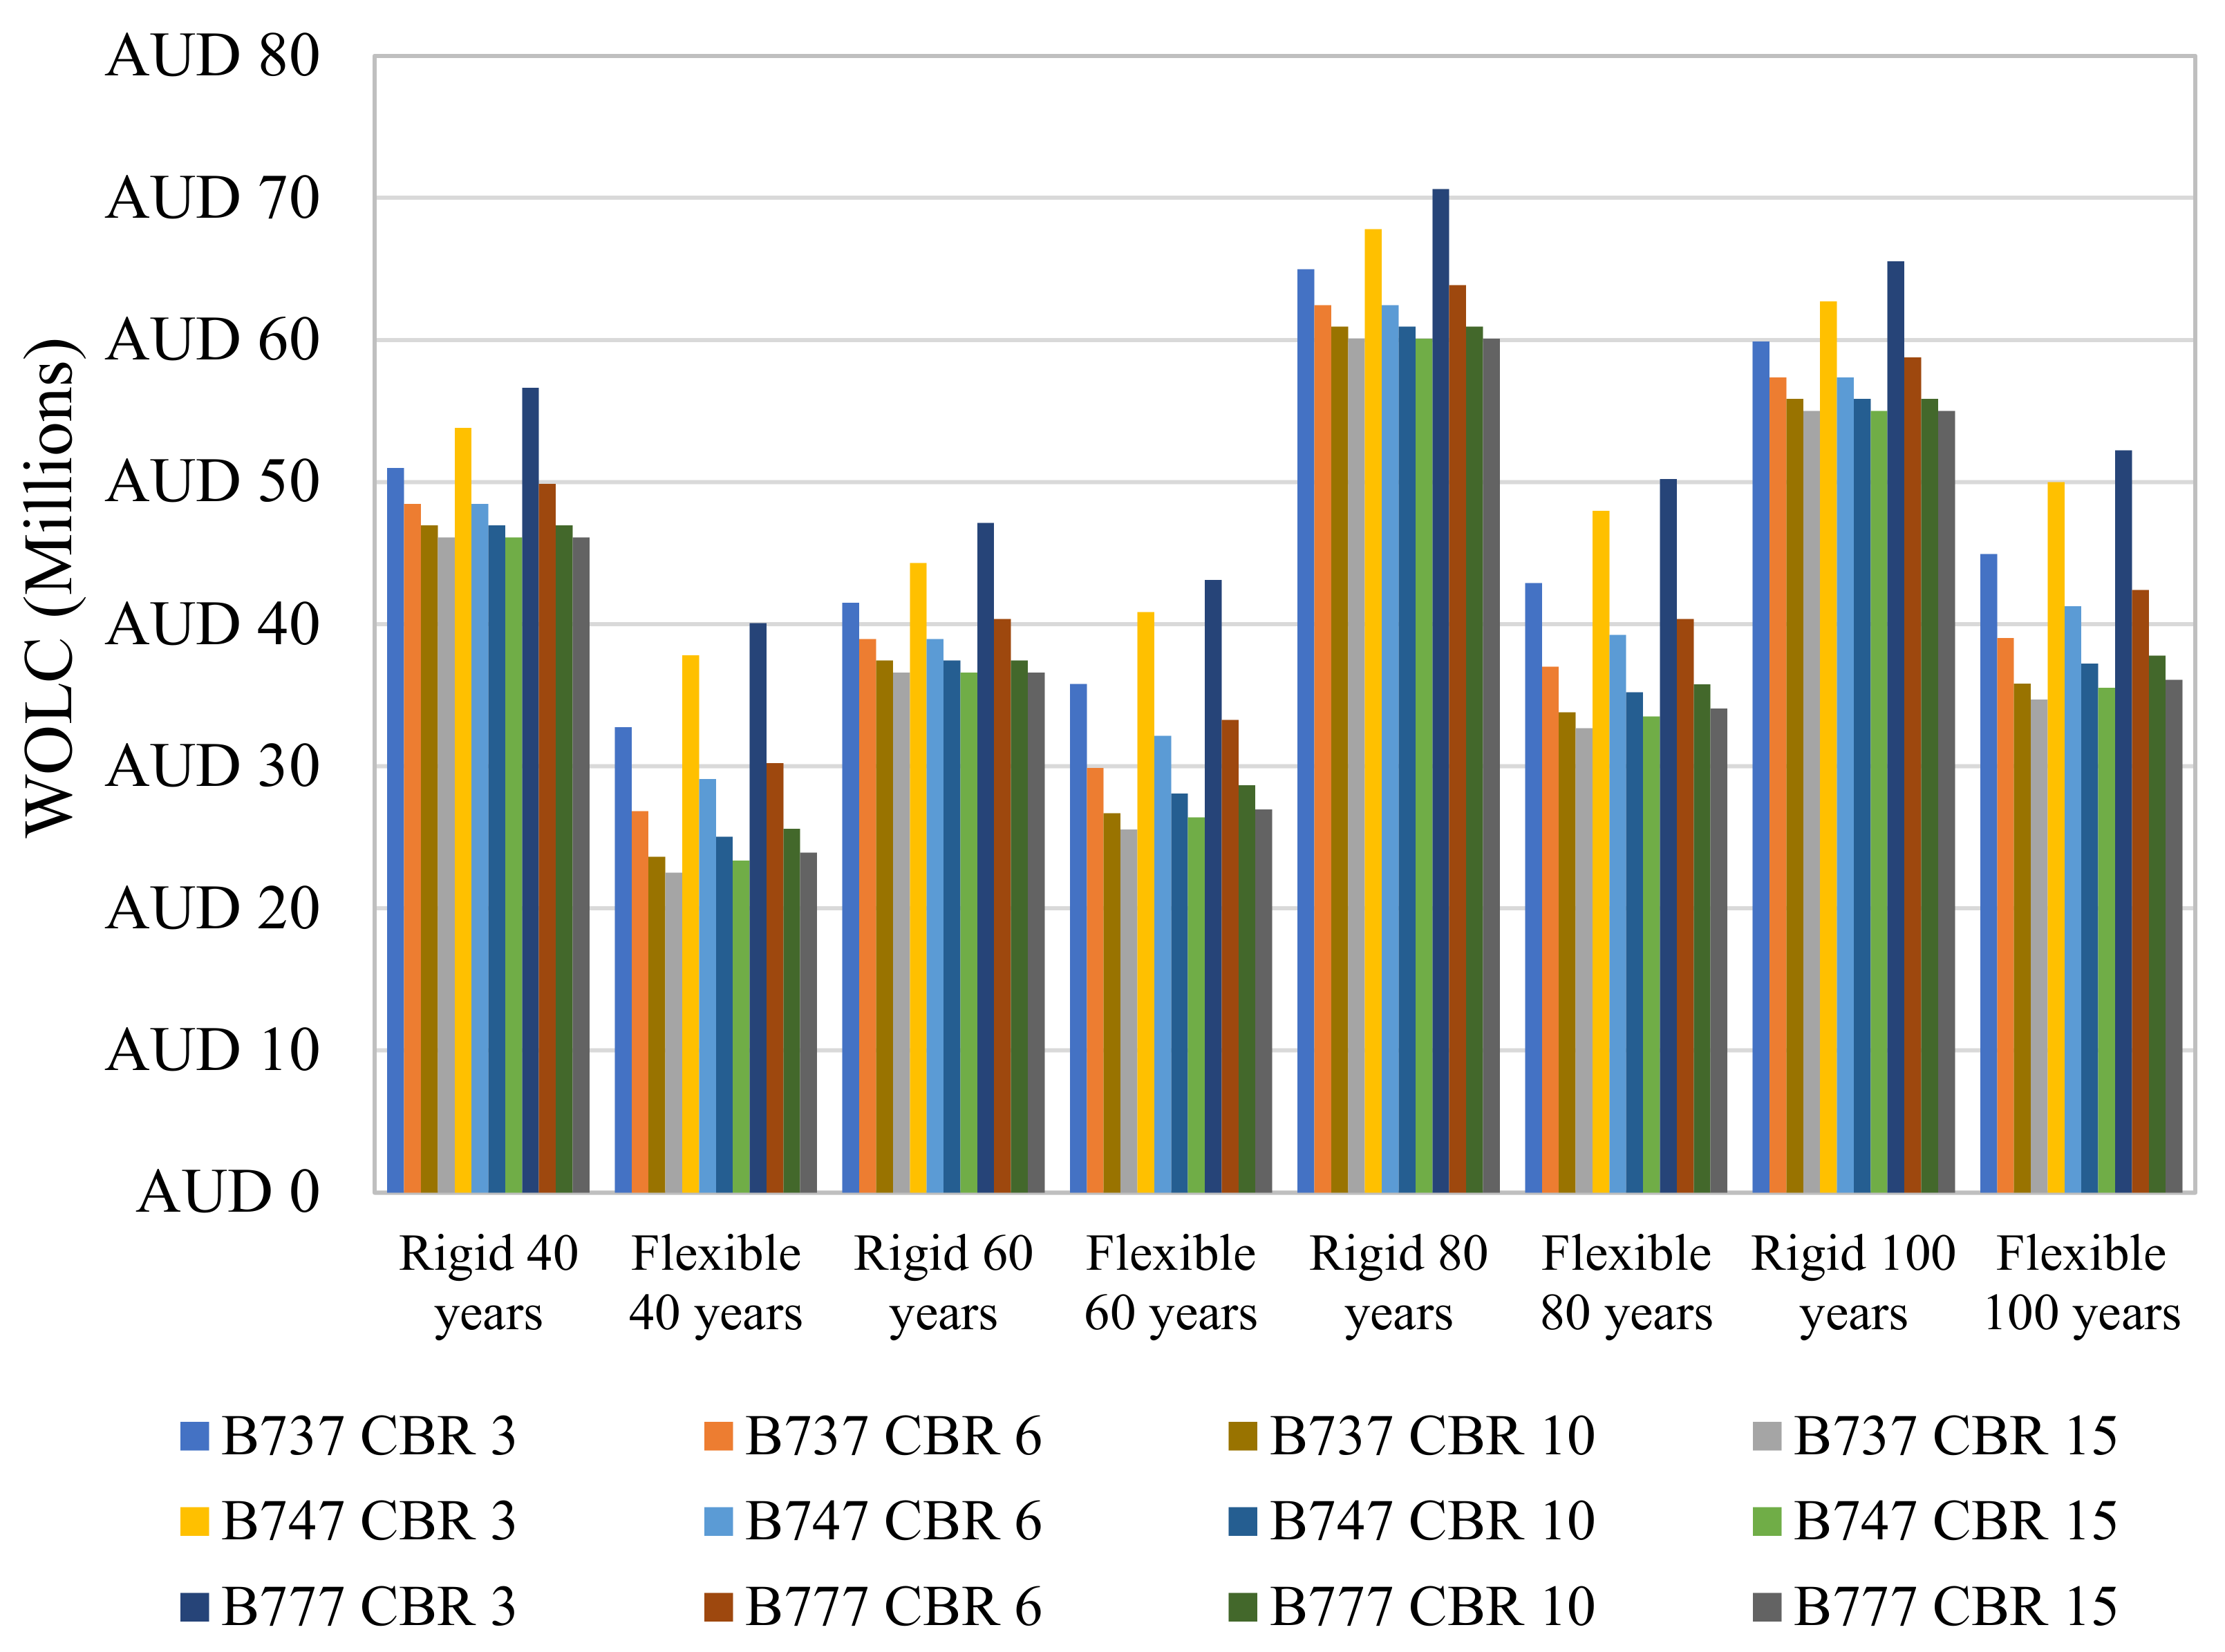
4.6. Effect of Analysis Period
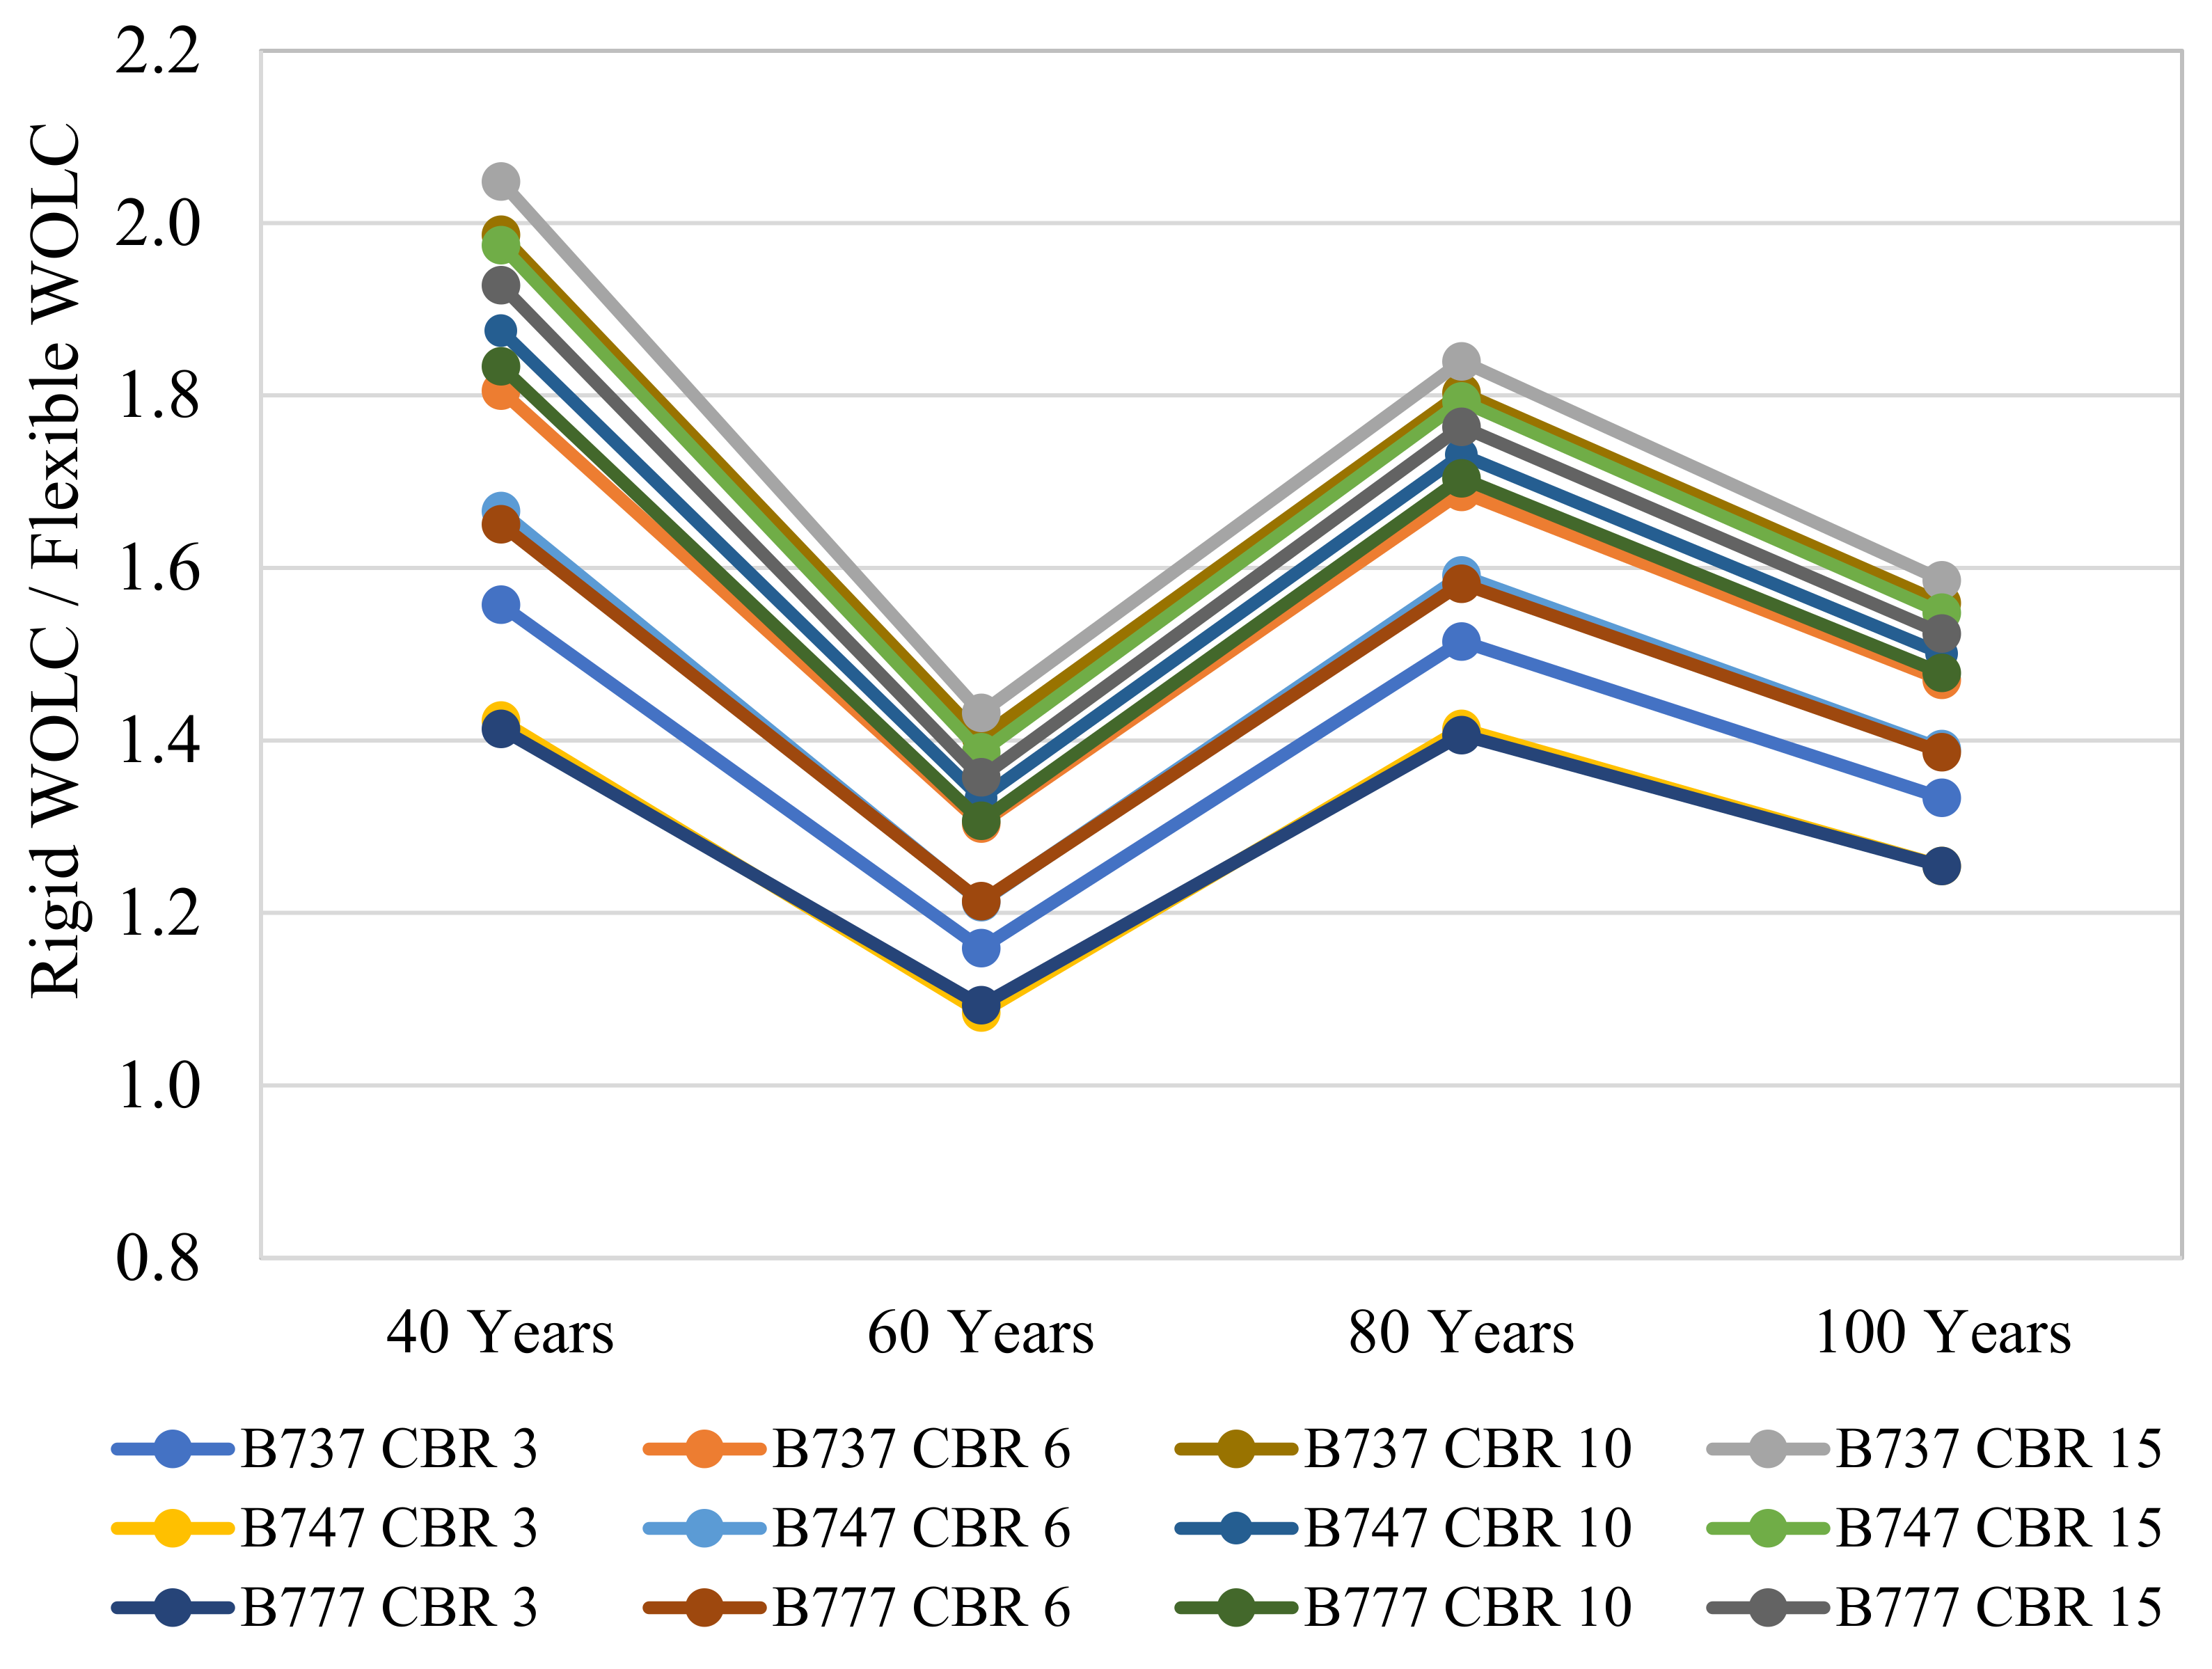
All the above discussion was based on a 40-year analysis period. Other analysis periods where then considered. The 40-year period was selected to be consistent with the design life of the rigid pavement. For the 60-year and 100-year analysis periods (
Figure 9) the rigid pavement residual value was based on an additional 20 years of serviceability, returning a relatively lower WOLC cost compared to the 40-year and 80-year analysis periods, where the rigid pavement was assumed to require reconstruction (
Figure 10). Consequently, the 60-year and 100-year analysis periods were associated with a reduced difference between the rigid and flexible pavement WOLC costs, compared to the 40-year and 80-year analysis periods.
5. Conclusions
WOLC cost analysis provides a useful tool for considering the relative cost of rigid and flexible aircraft pavements, better reflecting the combination of both the construction and maintenance costs of different pavement compositions. It was concluded that while useful and informative, WOLC is only as good as the assumptions and other factors are reliable. Importantly, the aircraft and subgrade conditions had a predictable effect on the relative WOLC cost of rigid and flexible pavement. In contrast, the analysis period and rigid pavement residual value, based on the end-of-life condition, significantly changed the relative WOLC cost associated with rigid pavements, which ranged from less expensive than flexible pavement, to four times more expensive than flexible pavement. Whether or not the rigid pavement needs to be reconstructed expediently was also a significant factor.
Funding
This research received no external funding.
Acknowledgments
The data presented in this paper was generated by Rohan Kitchen, a bachelor of civil engineering student at the University of the Sunshine Coast. The data was generated as part of Rohan’s final year engineering research project, performed under the author’s supervision.
Conflicts of Interest
The author declares no conflict of interest.
Appendix A. Whole of Life Cost Summaries
Table A1.
Whole of Life Costs (millions) for different analysis periods and discount rates.
Table A1.
Whole of Life Costs (millions) for different analysis periods and discount rates.
| Analysis Period | Aircraft | Subgrade | 3% Discount Rate | 5% Discount Rate | 7% Discount Rate |
|---|
| Rigid | Flexible | Rigid | Flexible | Rigid | Flexible |
|---|
| 40 years | B737 | CBR 3 | AUD 54.9 | AUD 33.9 | AUD 51.0 | AUD 32.7 | AUD 47.8 | AUD 31.5 |
| 40 years | B737 | CBR 6 | AUD 52.4 | AUD 28.0 | AUD 48.5 | AUD 26.8 | AUD 45.2 | AUD 25.6 |
| 40 years | B737 | CBR 10 | AUD 50.8 | AUD 24.8 | AUD 47.0 | AUD 23.6 | AUD 43.7 | AUD 22.4 |
| 40 years | B737 | CBR 15 | AUD 50.0 | AUD 23.7 | AUD 46.1 | AUD 22.5 | AUD 42.9 | AUD 21.3 |
| 40 years | B747 | CBR 3 | AUD 57.7 | AUD 39.0 | AUD 53.8 | AUD 37.8 | AUD 50.6 | AUD 36.6 |
| 40 years | B747 | CBR 6 | AUD 52.4 | AUD 30.3 | AUD 48.5 | AUD 29.1 | AUD 45.2 | AUD 27.8 |
| 40 years | B747 | CBR 10 | AUD 50.8 | AUD 26.2 | AUD 47.0 | AUD 25.0 | AUD 43.7 | AUD 23.8 |
| 40 years | B747 | CBR 15 | AUD 50.0 | AUD 24.5 | AUD 46.1 | AUD 23.4 | AUD 42.9 | AUD 22.1 |
| 40 years | B777 | CBR 3 | AUD 60.5 | AUD 41.2 | AUD 56.6 | AUD 40.1 | AUD 53.4 | AUD 38.8 |
| 40 years | B777 | CBR 6 | AUD 53.8 | AUD 31.4 | AUD 49.9 | AUD 30.2 | AUD 46.7 | AUD 29.0 |
| 40 years | B777 | CBR 10 | AUD 50.8 | AUD 26.8 | AUD 47.0 | AUD 25.6 | AUD 43.7 | AUD 24.4 |
| 40 years | B777 | CBR 15 | AUD 50.0 | AUD 25.1 | AUD 46.1 | AUD 23.9 | AUD 42.9 | AUD 22.7 |
| 60 years | B737 | CBR 3 | AUD 44.9 | AUD 43.7 | AUD 41.5 | AUD 35.8 | AUD 41.5 | AUD 35.8 |
| 60 years | B737 | CBR 6 | AUD 42.4 | AUD 37.8 | AUD 39.0 | AUD 29.9 | AUD 39.0 | AUD 29.9 |
| 60 years | B737 | CBR 10 | AUD 40.9 | AUD 34.6 | AUD 37.4 | AUD 26.7 | AUD 37.4 | AUD 26.7 |
| 60 years | B737 | CBR 15 | AUD 40.0 | AUD 33.5 | AUD 36.6 | AUD 25.6 | AUD 36.6 | AUD 25.6 |
| 60 years | B747 | CBR 3 | AUD 47.7 | AUD 48.8 | AUD 44.3 | AUD 40.9 | AUD 44.3 | AUD 40.9 |
| 60 years | B747 | CBR 6 | AUD 42.4 | AUD 40.1 | AUD 39.0 | AUD 32.1 | AUD 39.0 | AUD 32.1 |
| 60 years | B747 | CBR 10 | AUD 40.9 | AUD 36.0 | AUD 37.4 | AUD 28.1 | AUD 37.4 | AUD 28.1 |
| 60 years | B747 | CBR 15 | AUD 40.0 | AUD 34.3 | AUD 36.6 | AUD 26.4 | AUD 36.6 | AUD 26.4 |
| 60 years | B777 | CBR 3 | AUD 50.6 | AUD 51.0 | AUD 47.1 | AUD 43.1 | AUD 47.1 | AUD 43.1 |
| 60 years | B777 | CBR 6 | AUD 43.8 | AUD 41.2 | AUD 40.4 | AUD 33.3 | AUD 40.4 | AUD 33.3 |
| 60 years | B777 | CBR 10 | AUD 40.9 | AUD 36.6 | AUD 37.4 | AUD 28.7 | AUD 37.4 | AUD 28.7 |
| 60 years | B777 | CBR 15 | AUD 40.0 | AUD 34.9 | AUD 36.6 | AUD 27.0 | AUD 36.6 | AUD 27.0 |
| 80 years | B737 | CBR 3 | AUD 74.5 | AUD 50.6 | AUD 65.0 | AUD 42.9 | AUD 57.8 | AUD 37.7 |
| 80 years | B737 | CBR 6 | AUD 72.0 | AUD 44.7 | AUD 62.5 | AUD 37.0 | AUD 55.3 | AUD 31.8 |
| 80 years | B737 | CBR 10 | AUD 70.4 | AUD 41.5 | AUD 60.9 | AUD 33.8 | AUD 53.8 | AUD 28.6 |
| 80 years | B737 | CBR 15 | AUD 69.6 | AUD 40.4 | AUD 60.1 | AUD 32.7 | AUD 52.9 | AUD 27.5 |
| 80 years | B747 | CBR 3 | AUD 77.3 | AUD 55.7 | AUD 67.8 | AUD 48.0 | AUD 60.6 | AUD 42.8 |
| 80 years | B747 | CBR 6 | AUD 72.0 | AUD 47.0 | AUD 62.5 | AUD 39.2 | AUD 55.3 | AUD 34.0 |
| 80 years | B747 | CBR 10 | AUD 70.4 | AUD 42.9 | AUD 60.9 | AUD 35.2 | AUD 53.8 | AUD 30.0 |
| 80 years | B747 | CBR 15 | AUD 69.6 | AUD 41.2 | AUD 60.1 | AUD 33.5 | AUD 52.9 | AUD 28.3 |
| 80 years | B777 | CBR 3 | AUD 80.1 | AUD 57.9 | AUD 70.6 | AUD 50.2 | AUD 63.5 | AUD 45.0 |
| 80 years | B777 | CBR 6 | AUD 73.4 | AUD 48.1 | AUD 63.9 | AUD 40.4 | AUD 56.7 | AUD 35.2 |
| 80 years | B777 | CBR 10 | AUD 70.4 | AUD 43.5 | AUD 60.9 | AUD 35.8 | AUD 53.8 | AUD 30.6 |
| 80 years | B777 | CBR 15 | AUD 69.6 | AUD 41.8 | AUD 60.1 | AUD 34.1 | AUD 52.9 | AUD 28.9 |
| 100 years | B737 | CBR 3 | AUD 66.9 | AUD 55.4 | AUD 59.9 | AUD 44.9 | AUD 54.4 | AUD 38.6 |
| 100 years | B737 | CBR 6 | AUD 64.3 | AUD 49.5 | AUD 57.4 | AUD 39.0 | AUD 51.9 | AUD 32.6 |
| 100 years | B737 | CBR 10 | AUD 62.8 | AUD 46.3 | AUD 55.8 | AUD 35.8 | AUD 50.4 | AUD 29.4 |
| 100 years | B737 | CBR 15 | AUD 62.0 | AUD 45.2 | AUD 55.0 | AUD 34.7 | AUD 49.5 | AUD 28.3 |
| 100 years | B747 | CBR 3 | AUD 69.7 | AUD 60.5 | AUD 62.7 | AUD 50.0 | AUD 57.2 | AUD 43.6 |
| 100 years | B747 | CBR 6 | AUD 64.3 | AUD 51.8 | AUD 57.4 | AUD 41.3 | AUD 51.9 | AUD 34.9 |
| 100 years | B747 | CBR 10 | AUD 62.8 | AUD 47.7 | AUD 55.8 | AUD 37.2 | AUD 50.4 | AUD 30.8 |
| 100 years | B747 | CBR 15 | AUD 62.0 | AUD 46.0 | AUD 55.0 | AUD 35.5 | AUD 49.5 | AUD 29.2 |
| 100 years | B777 | CBR 3 | AUD 72.5 | AUD 62.8 | AUD 65.5 | AUD 52.2 | AUD 60.0 | AUD 45.9 |
| 100 years | B777 | CBR 6 | AUD 65.7 | AUD 52.9 | AUD 58.8 | AUD 42.4 | AUD 53.3 | AUD 36.0 |
| 100 years | B777 | CBR 10 | AUD 62.8 | AUD 48.3 | AUD 55.8 | AUD 37.8 | AUD 50.4 | AUD 31.4 |
| 100 years | B777 | CBR 15 | AUD 62.0 | AUD 46.6 | AUD 55.0 | AUD 36.1 | AUD 49.5 | AUD 29.7 |
Table A2.
Forty-year Whole of Life Costs (millions) for alternate rigid end of life assumptions.
Table A2.
Forty-year Whole of Life Costs (millions) for alternate rigid end of life assumptions.
| End of Life Requirement | Aircraft | Subgrade | 3% Discount Rate | 5% Discount Rate | 7% Discount Rate |
|---|
| Rigid | Flexible | Rigid | Flexible | Rigid | Flexible |
|---|
| Expedient | B737 | CBR 3 | AUD 176.1 | AUD 33.9 | AUD 153.0 | AUD 32.7 | AUD 133.8 | AUD 31.5 |
| Expedient | B737 | CBR 6 | AUD 173.6 | AUD 28.0 | AUD 150.4 | AUD 26.8 | AUD 131.3 | AUD 25.6 |
| Expedient | B737 | CBR 10 | AUD 172.1 | AUD 24.8 | AUD 148.9 | AUD 23.6 | AUD 129.8 | AUD 22.4 |
| Expedient | B737 | CBR 15 | AUD 171.2 | AUD 23.7 | AUD 148.1 | AUD 22.5 | AUD 128.9 | AUD 21.3 |
| Expedient | B747 | CBR 3 | AUD 178.9 | AUD 39.0 | AUD 155.8 | AUD 37.8 | AUD 136.6 | AUD 36.6 |
| Expedient | B747 | CBR 6 | AUD 173.6 | AUD 30.3 | AUD 150.4 | AUD 29.1 | AUD 131.3 | AUD 27.8 |
| Expedient | B747 | CBR 10 | AUD 172.1 | AUD 26.2 | AUD 148.9 | AUD 25.0 | AUD 129.8 | AUD 23.8 |
| Expedient | B747 | CBR 15 | AUD 171.2 | AUD 24.5 | AUD 148.1 | AUD 23.4 | AUD 128.9 | AUD 22.1 |
| Expedient | B777 | CBR 3 | AUD 181.7 | AUD 41.2 | AUD 158.6 | AUD 40.1 | AUD 139.5 | AUD 38.8 |
| Expedient | B777 | CBR 6 | AUD 175.0 | AUD 31.4 | AUD 151.8 | AUD 30.2 | AUD 132.7 | AUD 29.0 |
| Expedient | B777 | CBR 10 | AUD 172.1 | AUD 26.8 | AUD 148.9 | AUD 25.6 | AUD 129.8 | AUD 24.4 |
| Expedient | B777 | CBR 15 | AUD 171.2 | AUD 25.1 | AUD 148.1 | AUD 23.9 | AUD 128.9 | AUD 22.7 |
| 20 years | B737 | CBR 3 | AUD 24.9 | AUD 33.9 | AUD 25.8 | AUD 32.7 | AUD 26.5 | AUD 31.5 |
| 20 years | B737 | CBR 6 | AUD 22.4 | AUD 28.0 | AUD 23.3 | AUD 26.8 | AUD 24.0 | AUD 25.6 |
| 20 years | B737 | CBR 10 | AUD 20.9 | AUD 24.8 | AUD 21.8 | AUD 23.6 | AUD 22.5 | AUD 22.4 |
| 20 years | B737 | CBR 15 | AUD 20.0 | AUD 23.7 | AUD 20.9 | AUD 22.5 | AUD 21.6 | AUD 21.3 |
| 20 years | B747 | CBR 3 | AUD 27.7 | AUD 39.0 | AUD 28.6 | AUD 37.8 | AUD 29.3 | AUD 36.6 |
| 20 years | B747 | CBR 6 | AUD 22.4 | AUD 30.3 | AUD 23.3 | AUD 29.1 | AUD 24.0 | AUD 27.8 |
| 20 years | B747 | CBR 10 | AUD 20.9 | AUD 26.2 | AUD 21.8 | AUD 25.0 | AUD 22.5 | AUD 23.8 |
| 20 years | B747 | CBR 15 | AUD 20.0 | AUD 24.5 | AUD 20.9 | AUD 23.4 | AUD 21.6 | AUD 22.1 |
| 20 years | B777 | CBR 3 | AUD 30.6 | AUD 41.2 | AUD 31.4 | AUD 40.1 | AUD 32.1 | AUD 38.8 |
| 20 years | B777 | CBR 6 | AUD 23.8 | AUD 31.4 | AUD 24.7 | AUD 30.2 | AUD 25.4 | AUD 29.0 |
| 20 years | B777 | CBR 10 | AUD 20.9 | AUD 26.8 | AUD 21.8 | AUD 25.6 | AUD 22.5 | AUD 24.4 |
| 20 years | B777 | CBR 15 | AUD 20.0 | AUD 25.1 | AUD 20.9 | AUD 23.9 | AUD 21.6 | AUD 22.7 |
References
- White, G.; Farelly, J.; Jamieson, S. Estimating the value and cost of Australian aircraft pavement assets. In Proceedings of the International Airfield and Highway Pavement Conference, Online. 8–10 June 2021; Available online: https://collaborate.asce.org/events/event-description?CalendarEventKey=b4a1a0ad-2c7c-4aef-9200-c234db31484a&Home=%2Fevents (accessed on 15 June 2021).
- Airfield Pavement Essentials; Airport Practice Note 12; Australian Airports Association: Canberra, ACT, Australia, 2017. Available online: https://airports.asn.au/airport-practice-notes/ (accessed on 30 November 2017).
- White, G. A sensitivity analysis of APSDS, an Australian mechanistic design tool for flexible aircraft pavement thickness determination. In Proceedings of the First European Aircraft Pavement Workshop, Amsterdam, The Netherlands, 11–12 May 2005. [Google Scholar]
- COMFAA 3.0; Federal Aviation Administration: Washington, DC, USA, 2014. Available online: http://www.airporttech.tc.faa.gov/Download/Airport-Pavement-Papers-Publications-Detail/dt/Detail/ItemID/22/COMFAA-30 (accessed on 17 December 2017).
- Aerodromes—Aerodrome Design and Operations; Annex 14 to the Convention on International Civil Aviation; ICAO: Montreal, QC, Canada, 2013; Volume 1.
- Jamieson, S.; White, G. Defining Australian rigid aircraft pavement design and detailing practice. In Proceedings of the International Airfield and Highway Pavement Conference, online. 8–10 June 2021. [Google Scholar]
- White, G.; Boston, W. Quantifying the cost of different runway overlay designs. In Proceedings of the 18th AAPA International Flexible Pavements Conference, Sydney, NSW, Australia, 19–20 August 2019. [Google Scholar]
- Deilami, S.; White, G. Review of reflective cracking in composite pavements. Int. J. Pavement Res. Technol. 2020, 13, 524–535. [Google Scholar] [CrossRef]
- Walls, J.; Smith, M.R. Life-Cycle Cost Analysis in Pavement Design; Interim Technical Bulletin; Federal Highway Administration: Washington, DC, USA, 1998.
- Whole-of-Life Costing for Australian Government; Resource Management Guide No. 503; Department of Finance: Canberra, ACT, Australia, 2014.
- Rangaraju, P.R.; Amirkhanian, S.; Guven, Z. Life Cycle Cost Analysis of Pavement Type Selection; Report Number FHWA-SC-08-01; Clemson University: Clemson, SC, USA, 2008. [Google Scholar]
- Val, D.V.; Stewart, M.G. Life-cycle cost analysis of reinforced concrete structures in marine environments. Struct. Saf. 2003, 25, 343–362. [Google Scholar] [CrossRef]
- Zakeri, B.; Syri, S. Electrical energy storage systems: A comparative life cycle cost analysis. Renew. Sustain. Energy Rev. 2015, 42, 569–596. [Google Scholar] [CrossRef]
- Nyuk, H.W.; Su, F.; Raymond, W. Life cycle cost analysis of roof-top gardens in Singapore. Build. Environ. 2003, 38, 499–509. [Google Scholar]
- Thoft-Christensen, P. Infrastructures and life-cycle cost-benefit analysis. Struct. Infrastruct. Eng. 2010, 8, 507–516. [Google Scholar] [CrossRef] [Green Version]
- Giustozzi, F.; Crispino, M.; Flintsch, G. Multi-attribute life cycle assessment of preventive maintenance treatments on road pavements for achieving environmental sustainability. Int. J. Life Cycle Assess. 2012, 17, 409–419. [Google Scholar] [CrossRef]
- Gendreau, M.; Soriano, P. Airport pavement management systems: An appraisal of existing methodologies. Transp. Res. Part A Policy Pract. 1998, 32, 3. [Google Scholar] [CrossRef]
- Rister, B.W.; Graves, C. The Cost of Construction Delays and Traffic Control for Life-Cycle Cost Analysis of Pavements; Research Report KTC-02-07/SPR197-99 & SPR218-00-1F; University of Kentucky: Lexington, KY, USA, 2002. [Google Scholar]
- White, G. Challenges for Australian flexible airport pavements. Aust. Geomech. 2016, 51, 39–46. [Google Scholar]
- Airport Pavement Design and Evaluation; Advisory Circular 150/5320/6D; Federal Aviation Administration: Washington, DC, USA, 1995. Available online: https://www.faa.gov/regulations_policies/advisory_circulars/index.cfm/go/document.information/documentID/22105 (accessed on 10 June 2021).
- White, G.; Kelly, G.; Fairweather, H.; Jamshidi, A. Theoretical socio-enviro-financial cost analysis of equivalent flexible aircraft pavement structures. In Proceedings of the 99th Annual Meeting of the Transportation Research Board, Washington, DC, USA, 12–16 January 2020. [Google Scholar]
- White, G. Challenges for rigid airfield pavements in Australia. In Proceedings of the 4th ASCP Concrete Pavements Conference, Kingscliff, NSW, Australia, 16–18 July 2017. [Google Scholar]
- White, G. Expedient runway upgrade technologies. In Proceedings of the Tenth International Conference on the Bearing Capacity of Roads, Railways and Airfields, Athens, Greece, 28–30 June 2017. [Google Scholar]
| Publisher’s Note: MDPI stays neutral with regard to jurisdictional claims in published maps and institutional affiliations. |
© 2021 by the author. Licensee MDPI, Basel, Switzerland. This article is an open access article distributed under the terms and conditions of the Creative Commons Attribution (CC BY) license (https://creativecommons.org/licenses/by/4.0/).


