Article

A Resilience-Based Model for the Seismic Assessment of the Functionality of Road Networks Affected by Bridge Damage and Restoration

1
Department of Civil and Mechanical Engineering, University of Cassino and Southern Lazio, 03043 Cassino, Italy
2
Department of Architecture, Rome Tre University, 00153 Rome, Italy
3
College of Civil Engineering, Fuzhou University, Fuzhou 350108, China
*
Author to whom correspondence should be addressed.
Infrastructures 2021, 6(8), 112; https://doi.org/10.3390/infrastructures6080112
Submission received: 13 July 2021 / Revised: 6 August 2021 / Accepted: 10 August 2021 / Published: 12 August 2021
(This article belongs to the Special Issue Structural Rehabilitation, Retrofitting and Strengthening)

Abstract

:
Road network functionality after an earthquake is a crucial aspect for an already struck community. In particular, bridges are susceptible to earthquake-induced damages and to lengthy restoration works. This may lead to severe and unexpected disruption of traffic. In this paper, a model for the assessment of the seismic resilience of a road network is presented. The proposed model permits us to evaluate the earthquake-induced perturbations to the functionality of a network in terms of transportation capacities, traffic congestion, and travel times due to bridge damages and subsequent restoration interventions. The evolution over time of the functionality of the network is studied by means of a multi-stage approach describing the evolution of the situation in terms of reducing the normal pre-earthquakes transportation capacities. The methodology has been illustrated with reference to a hypothetical case study, a road network composed of 14 nodes and 31 links.

1. Introduction

Recent decades have seen a growth in research activities focused on assessing the impact that adverse events (such as natural catastrophes, human errors, and terroristic attacks) can have on networked based systems. This interest is due to the consciousness that the way of life in which modern communities rely on the correct functioning of interconnected infrastructures such as transportation, electricity, water, and telecommunications. The functioning of those very diverse systems has in common the same basic concept: they operate due to the constant flow of goods (services, resources, information, people, etc.) between nodes that are connected together through links. The combination of nodes and links topologically forms a graph [1,2].
In the case of road networks, bridges are recognized to represent the most vulnerable elements to extreme events, such as earthquakes. The continuation of service of bridges plays a significant role in assuring the functionality of transportation networks, as the damages induced by an earthquake may lead to significant traffic delay and service interruption, resulting in large indirect losses affecting wide portion of the struck territory.
On the topic of bridge seismic safety and maintenance, different state of the art reviews have been attempted, marking the evolution of research sensibilities over three decades [3,4,5].
In studies focusing on the seismic response of a community of people, whose functions are operatively possible due to the presence of the built environment, the concept of resilience, as an indicator able to express the residual functionality of a society in its effort to recover after a seismic event, has emerged [6,7,8,9].
Although the term resilience is quite generic, and subject to broad interpretations, it has been defined as an evolutionary measure of the recovery and, in the specific case of bridges and transportation networks, quantifies the changes of functionality over time [10,11,12,13,14,15,16].
In particular, the functioning of the transportation network after a major event is highly sensitive to a possible damage scenario of bridges and buildings, causing the partial or total closure of roads [17,18,19,20]. The post-earthquake situation may be characterized by the inaccessibility of some destinations, or simply a traffic redistribution over alternative routes constituted by the roads that remain open [21,22]. Furthermore, due to the possible formation of congestions, the traffic assignment is conditioned by the drivers’ choices to select the quickest route to their destination or possibly to cancel, delay or postpone their trip. Finally, the general post-earthquake emergency situation can change at all the population priorities about transportation, due to a series of causes that are highly expected, especially after a very disruptive earthquake, but very difficult to account for, i.e., office and business interruptions cancel commuter travels, communities’ temporary relocation alters the possible destinations, there is an increase in traffic headed to emergency facilities, etc. [23,24].
As the bridges are progressively inspected and rehabilitated [25,26], the pre-earthquake situation can gradually be restored. Obviously, the recovery is a time-dependent function based on many factors, some of them reeling from economic and political decisions that fall well beyond the technical aspects.

2. Objectives and Methods

The main goal of the paper is the study of a road transportation network in order to assess its vulnerability and reliability under seismic action. The scope of this paper is to provide a general methodology to evaluate the probabilistic seismic resilience of a transportation network.
The seismic risk has been traditionally quantified through the convolution of [27,28]:
(i)
the hazard of the area of interest;
(ii)
the seismic fragility of the structures that are susceptible to earthquakes; and
(iii)
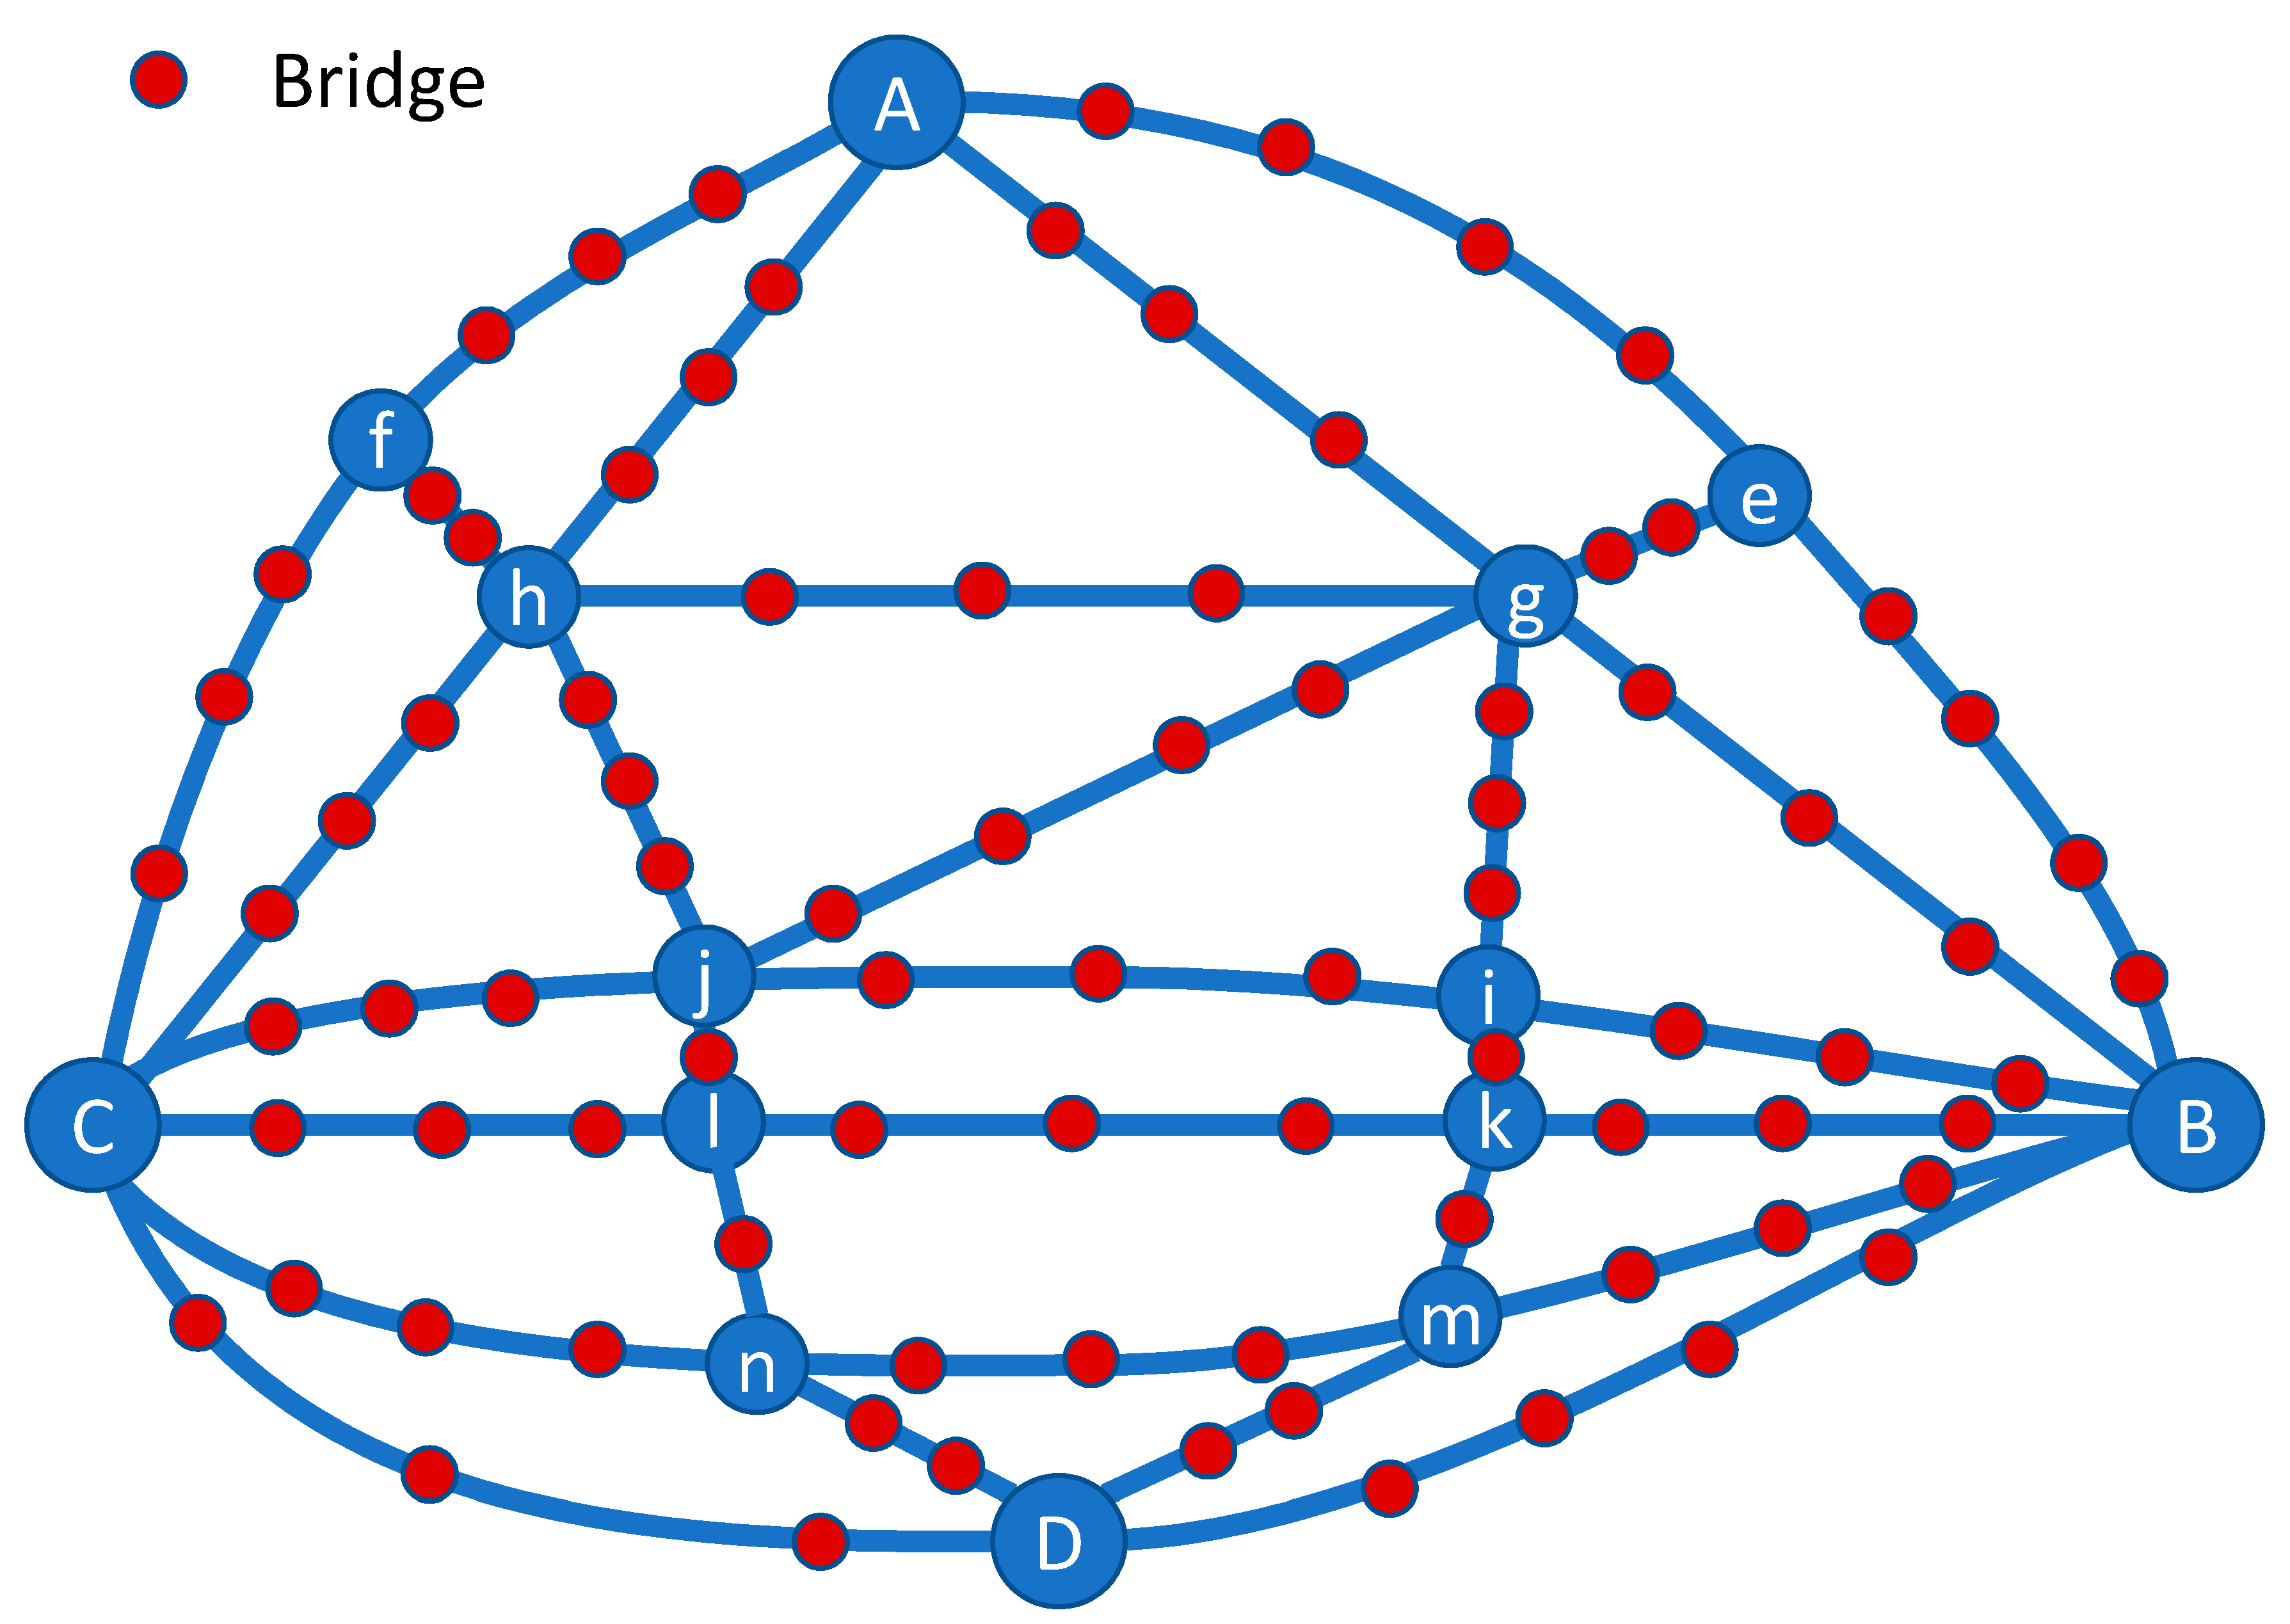
the exposure of the goods that are susceptible to risk.
The model proposed in this study requires the definition of the road network in terms of its topology (the way nodes and links are assembled together), the position of the critical structures (in our case, bridges) and the knowledge of the relevant data required for the transportation analysis.
The seismic input in the area around the network can be expressed through an extension of The main goal of the paper is the study of a road transportation network in order to assess its vulnerability and reliability under seismic action. The scope of this paper is to provide a general methodology to evaluate the probabilistic seismic resilience of a transportation network.the conventional probabilistic seismic hazard analysis, sampling the relevant features that define the occurrence of an earthquake (position, magnitude, fault rupture mechanism, etc.) and propagating the seismic input to the relevant sites belonging to the transportation network, in order to provide a reliable seismic map scenario (eventually to be repeated in order to simulate the whole extent of variables describing an uncertain future earthquake).
Bridge vulnerabilities are represented by fragility functions. Those functions can be either obtained developing a specific probabilistic study for each bridge at risk or, more reasonably, assigning the structures into classes on the basis of common features leading to expected response similarities under seismic action. Seismic maps and bridge fragilities are combined to formulate probabilistic damage distributions, used into a Monte Carlo simulation approach to generate the expected deterministic damage samples over the network links.
On the basis of the link damages and the consequent time-dependent restoration intervention is possible to assign a reduction in capacity of the network links and therefore to simulate the traffic assignment over the network.

3. Proposed Methodology

3.1. Some Concepts of System Reliability

A system, by definition, is the combination of more than one component [29]. The reliability of a system is generally the function of the state of its components, in the sense that each component may contribute to the functioning or to the failure of the system, and the peculiar combination of success or failure at component level determines the success or the failure of the system.
A series system is one where the single components are arranged in such a way that the failure of any component (one or more of them) results in the failure of the entire system. This system has no redundancy and, for this reason, is also named the “weakest link” system.
If Fi denotes the failure of the i-th component, the combined system failure event FS is given by the union “∪” of all single failure events Fi as follows:
F S = i F i
The corresponding probability of system failure can be expressed as:
P ( F S ) = P ( i F i )
Furthermore, if the failure events can be considered as mutually independent, the probability of failure of the system can be computed as follows:
P ( F S ) = 1 i [ 1 P ( F i ) ]
with ∏ the product operator.
A parallel system is one which fails only if all its components fail; that is, failure of one component will not necessarily lead to the failure of the whole system.
Coherently with the above-introduced definitions, the combined system failure event of a parallel system FS of k components, is given by the intersection or mutual occurrence “∩” of all failure events Fi, as follows:
F S = i F i
The corresponding probability of system failure can be written as:
P ( F S ) = P ( i F i )
A general system is one that consists of a combination of series and parallel subsystems. A set of components whose joint failure implies failure of the system is called cut-set. In this case the failure event FS of the general system can be schematized as:
F S = j i F i j
Fij being the i-th component failure in the j-th failure path (i.e., in the j-th parallel subsystem).
The probability of failure of such a system can be thus calculated from:
P ( F S ) = P ( j i F i j )
The analytical calculation of the probability of failure, even if conceptually possible due to the above equations, can become a very complex issue, so that the only tractable way to computationally perform the task is using simulation techniques, such as the Monte Carlo method. This technique permits us to study the performance of the system, reproducing the occurrence of possible realizations of the random variable governing the problem, so that each possible realization becomes a deterministic scenario and the performance of the system can be analyzed. This process is repeated many times in order to give statistical significance to the underlying random variable that are sampled, and the performance of the system is computed deriving the statistics of the outcomes [30].

3.2. Flow Analysis over a Road Network

Given a transportation network and the transportation demand, expressed as couples of travel origins and destinations via the origin destination (OD) matrix, the traffic assignment problem consists of determining the flows on the links of the network. In transportation engineering, distinction is made between stochastic and deterministic problems, on the basis of the ability of the network user to perceive exactly the main variables that control the status of the system and to respond rationally to them.
Traffic assignment over a network can be determined according to Wardrop’s principles [31,32].
The first principle (usually referenced as “user equilibrium” or “UE”) is based on the concept that each user non-cooperatively chooses the route that is optimal in order to minimize the cost of transportation (here represented by the travel duration). Specifically, a user-optimized equilibrium is reached when users may not lower their transportation duration through unilateral action, and therefore the journey times in all routes actually used are equal, and less than those that would be experienced by a single user vehicle if it is shifted on any of the alternative routes.
The second principle (usually referenced as “system optimal” or “SO”) is based on the concept that each user behaves cooperatively in choosing his own route to ensure the most efficient use of the whole system (for example, reducing the compressive duration of travels not only for himself but also for the others).
It is important to note that the “system optimal” equilibrium is associated with an ideal behavior, as individuals may not attempt to cooperate to achieve the system optimal configuration, even if is argued that a similar solution can be achieved if a central authority could control single user choices by spreading information on preferential routes or imposing marginal costs on road fares.
For the above reasons, in this research, the user equilibrium principle has been adopted. The UE principle has been expressed through Beckmann’s transformations [33] as an optimization mathematical problem, as follows:
m i n i m i z e   a 0 x a t a ( x , c a )   d x
with the following constraints:
s u b j e c t   t o :   { k X k p q δ a , k p q = D p q p , q X k p q 0 p , q , k    
In the equations above:
x a is the traffic flow over the link a;
t a is the effective travel time over the link a, as defined through the congestion function. A typical congestion function is given by the following formula [34]:
t a ( x , c a ) = t 0 , a [ 1 + α ( x c a ) β ] = L a v 0 , a [ 1 + α ( x c a ) β ]
with t 0 , a the free flow travel time on the link a (i.e., the time required for a vehicle to drive through link a in absence of traffic, function essentially of link length La and vehicle allowable velocity vo,a), c a is the capacity of link a per unit of time (essentially defined on the basis of link typology or of more elaborated assessments), and x is the flow attempting to use link a. The suggested values for the α and β parameters in Equation (11) are α = 0.15   β = 4.0 .
X k p q is the traffic flow over the path k connecting the OD pair pq;
D p q is the travel demand between the origin destination pair pq;
δ a , k p q is an binary variable defined as 1 if the link a lies on the path k; 0 otherwise.
As the single link a may lie over more than a path, the traffic flow x a is obtained by summation over all the paths k and all the origin destination pairs pq:
x a = p q k X k p q δ a , k p q
An upper bound to the network transportation efficiency is given by the “max-flow min-cut” theorem [35,36]. Given a directed graph with a given maximum capacity over each link and just a pair of nodes serving, respectively as origin and destination, the theorem states that the maximum amount of flow able to circulate from the origin to the destination is equal to the minimum capacity of the links able to disconnect the functioning of the network, i.e., the links which, if removed, would disconnect the origin from the destination.

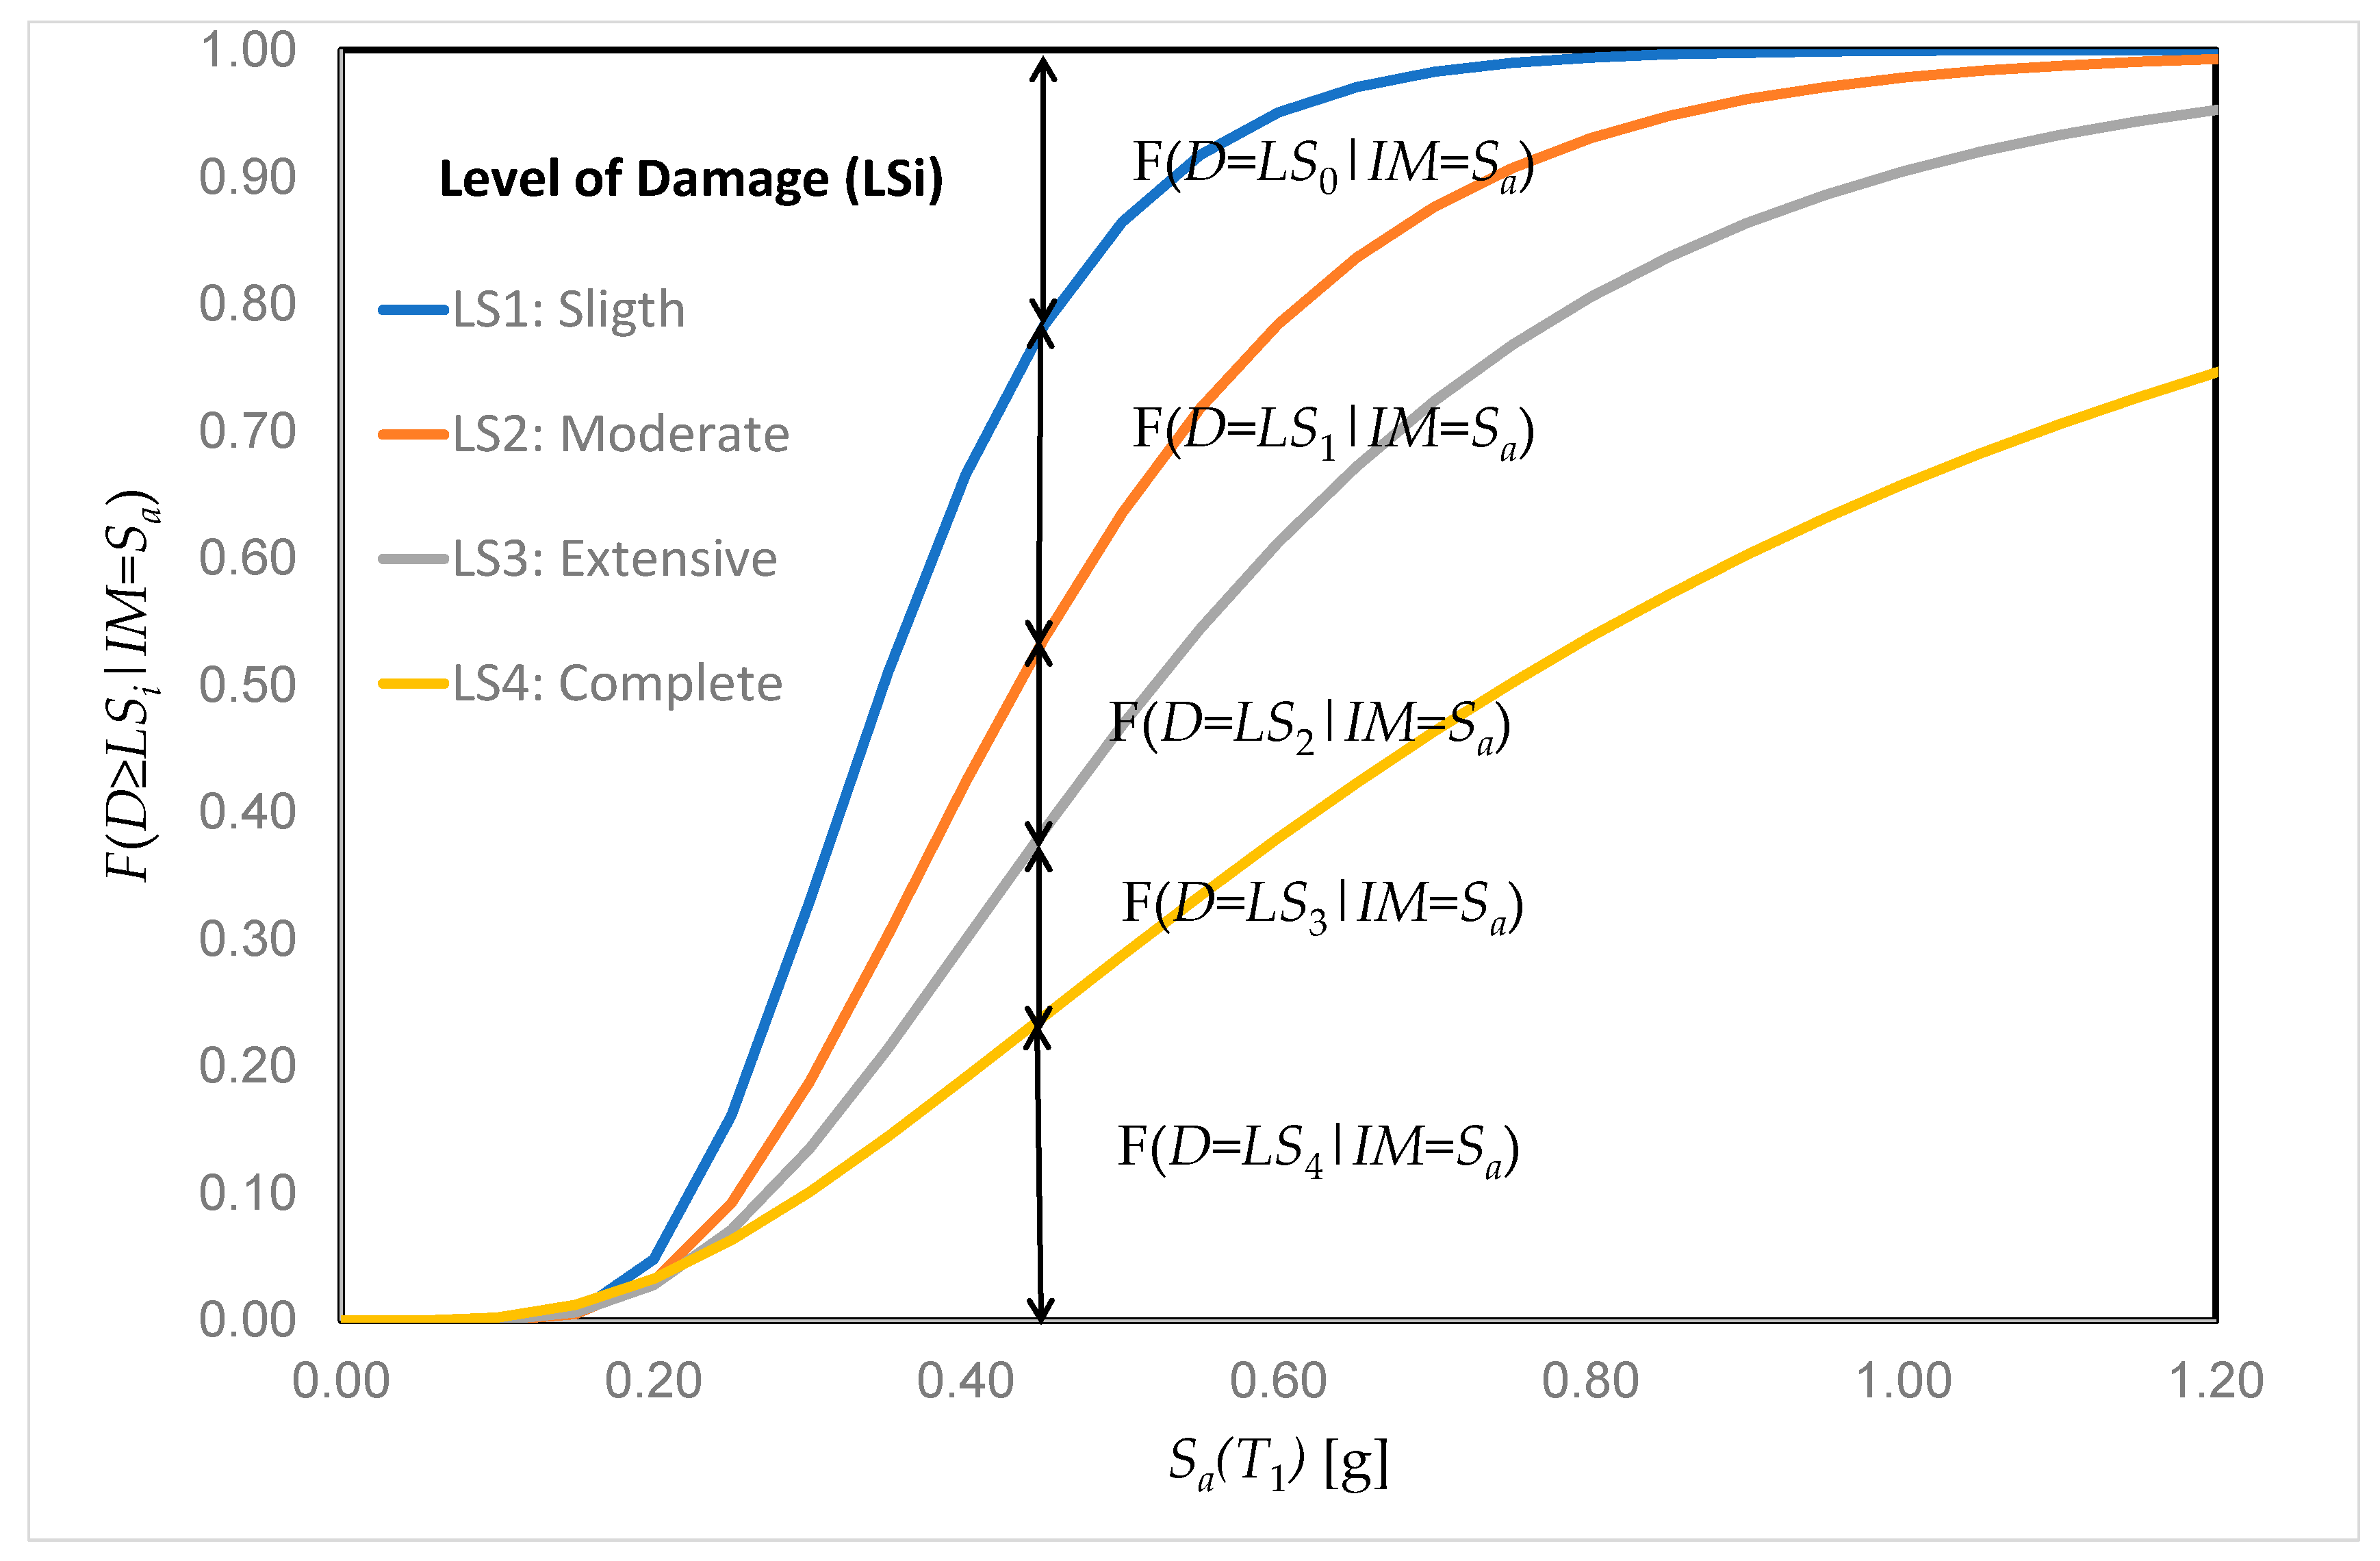
3.3. Bridge Seismic Vulnerability

The seismic vulnerability of bridges is expressed through one or more fragility curves F(·), specifying the probability of exceeding a predefined performance of the bridge in function of the level of earthquake intensity, Im, registered at the site. Typical choices for expressing Im are the peak ground acceleration (pga) or an ordinate of the acceleration spectrum Sa at (or near) the fundamental period of the bridge, T1, Sa(T1).
The bridge performance is generally defined by means of a set of discrete limit states (LSi i = 1, 2, 3 … n) that describe the level of damage D exceeded by the structure (typically expressed in qualitative terms such as: light, moderate, extended, or total).
Therefore, from a mathematical point of view, a fragility curve represents the conditional probability of exceeding a prescribed limit state, given a level of earthquake intensity:
F ( D L S i | I m ) = Φ [ 1 β i l n ( I m μ i ) ]
where Φ(·) is the standard normal cumulative distribution function, ln(·) is the natural logaritm, and μ i and β i are, respectively the median value and the lognormal standard deviation of Im associated with damage state LSi.
The development of fragility curves can be performed through observation of the empirical or damage sustained by homogeneous class of bridges [37] or through analytical methods, for the most part, based on the use of computational tools such as finite elements [38,39,40].
The level of damage in a bridge has a direct impact on its ability to carry vehicle loads, so that it is expected that traffic restrictions may be imposed to satisfy the safety concerns. This decision regards not only the damaged bridge, but the whole road segment interested by the presence of the bridge, in order to consent detours.

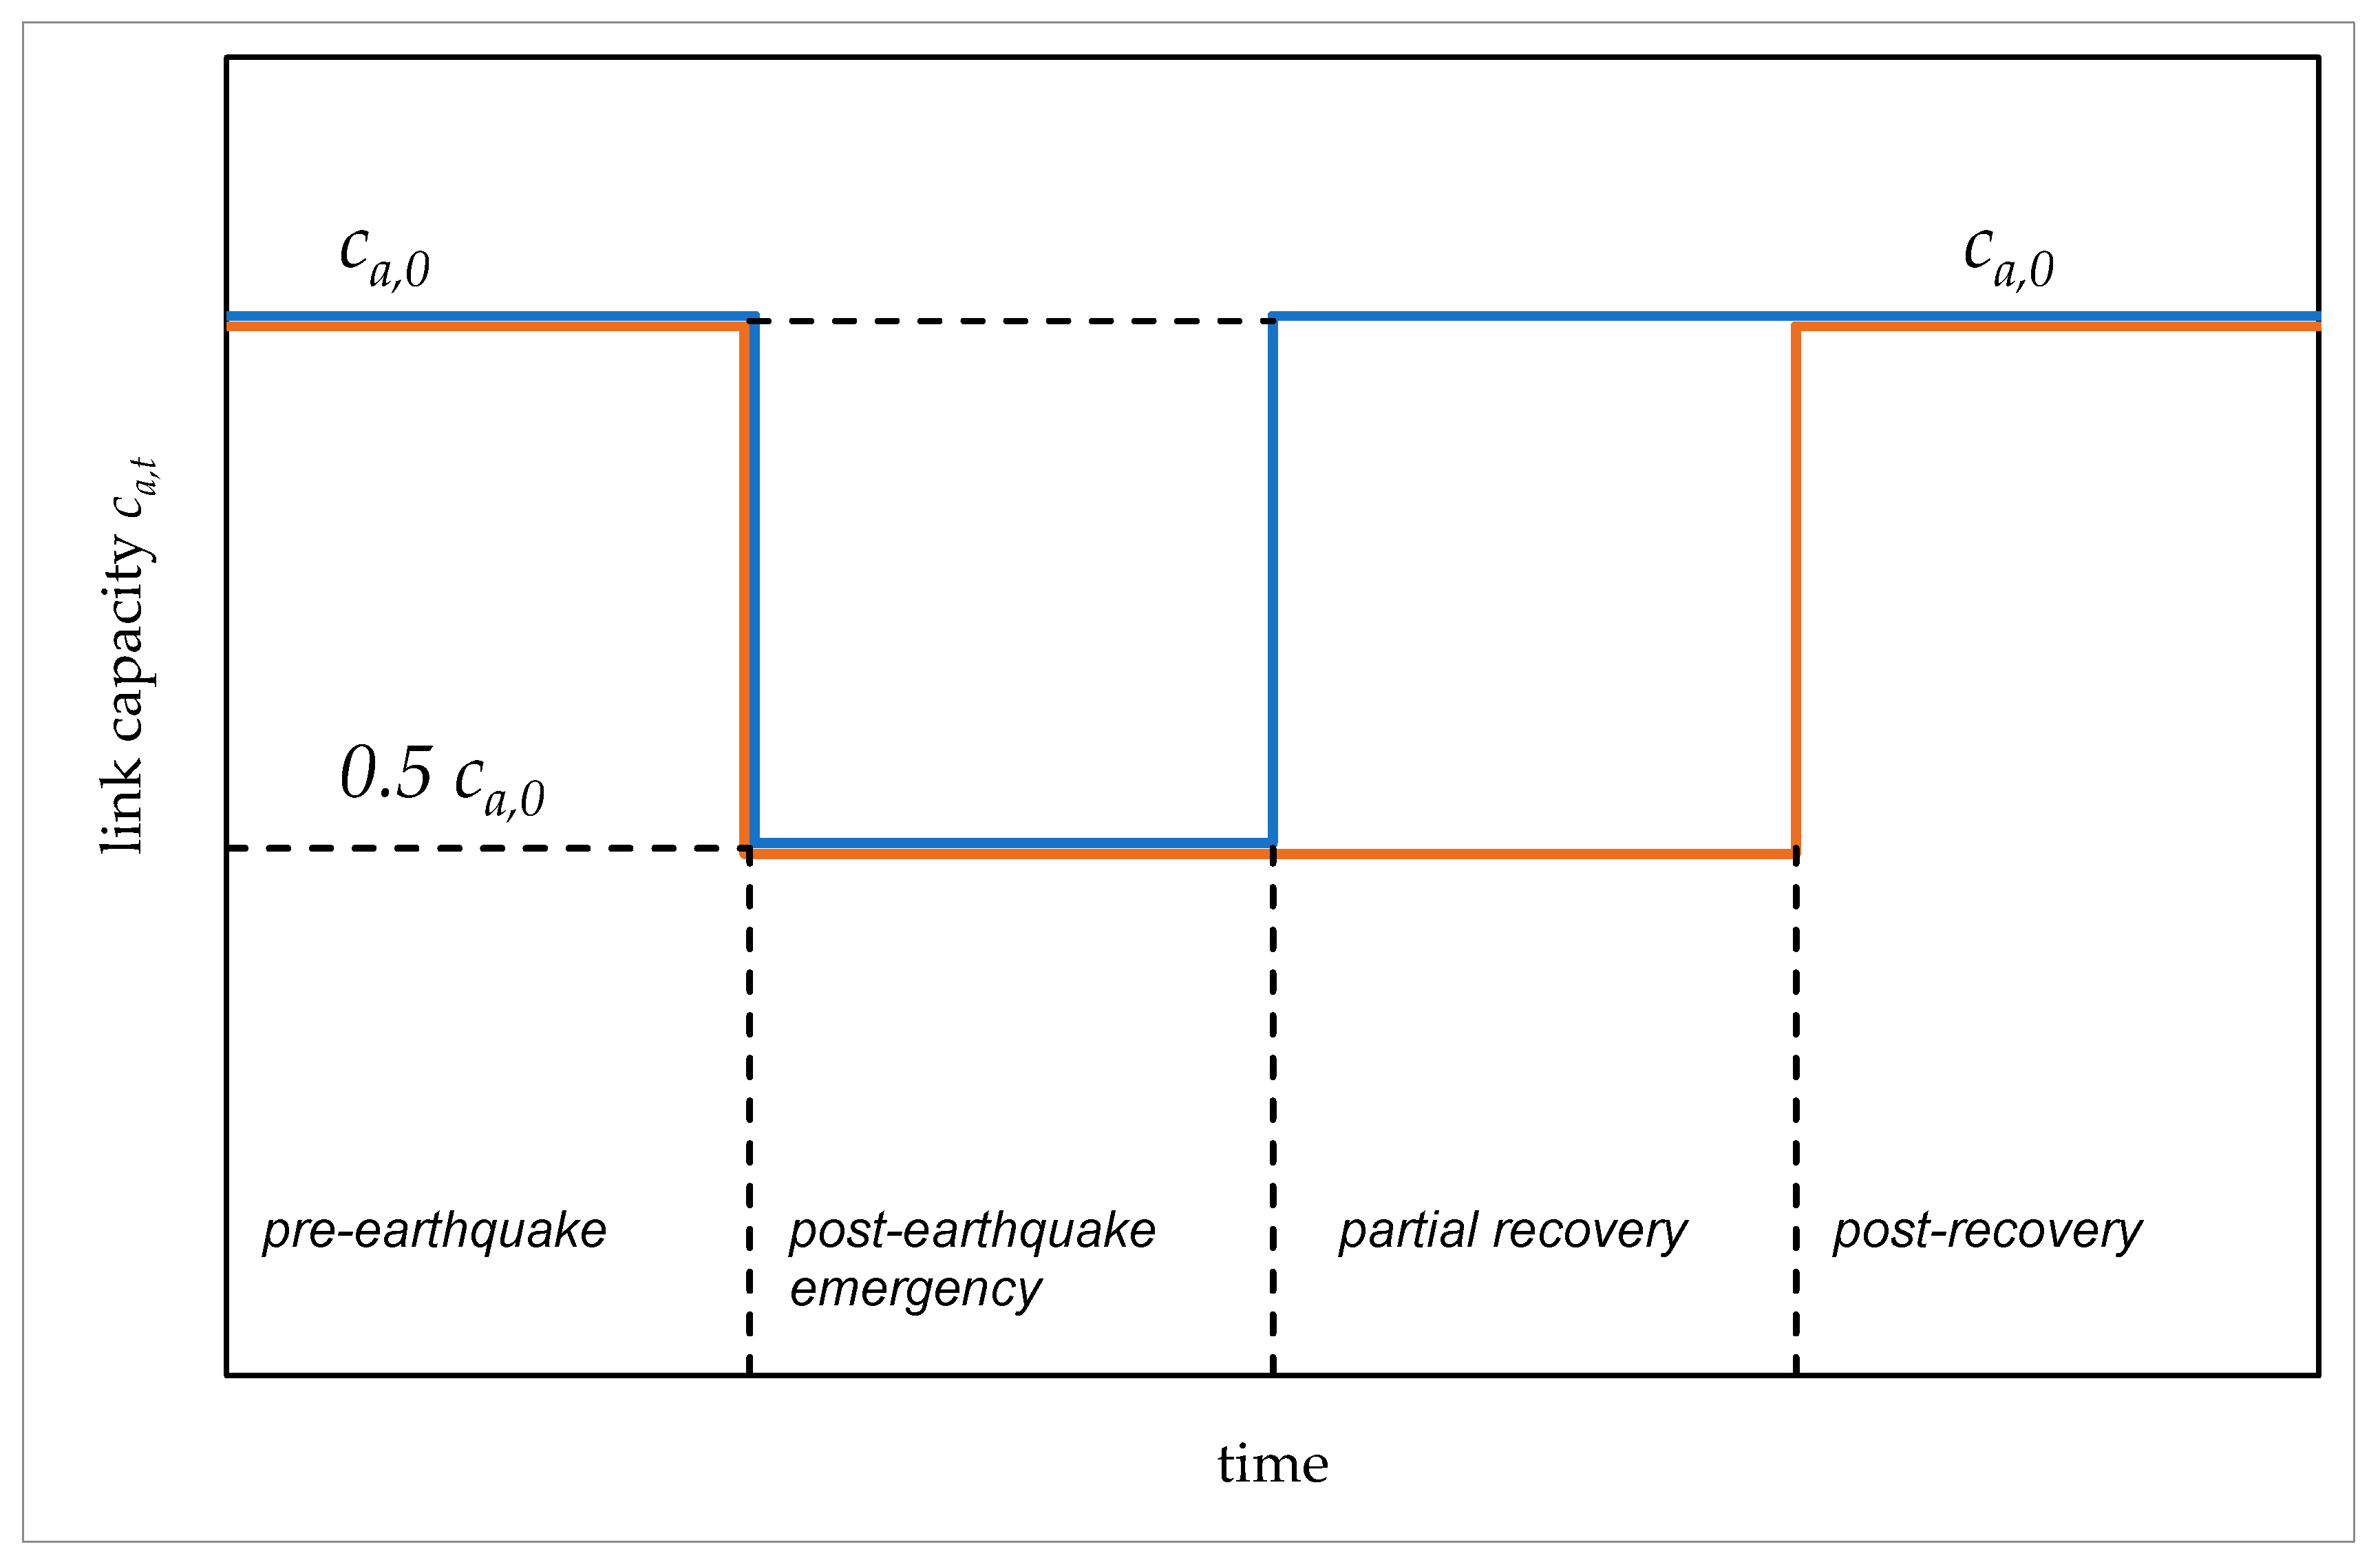
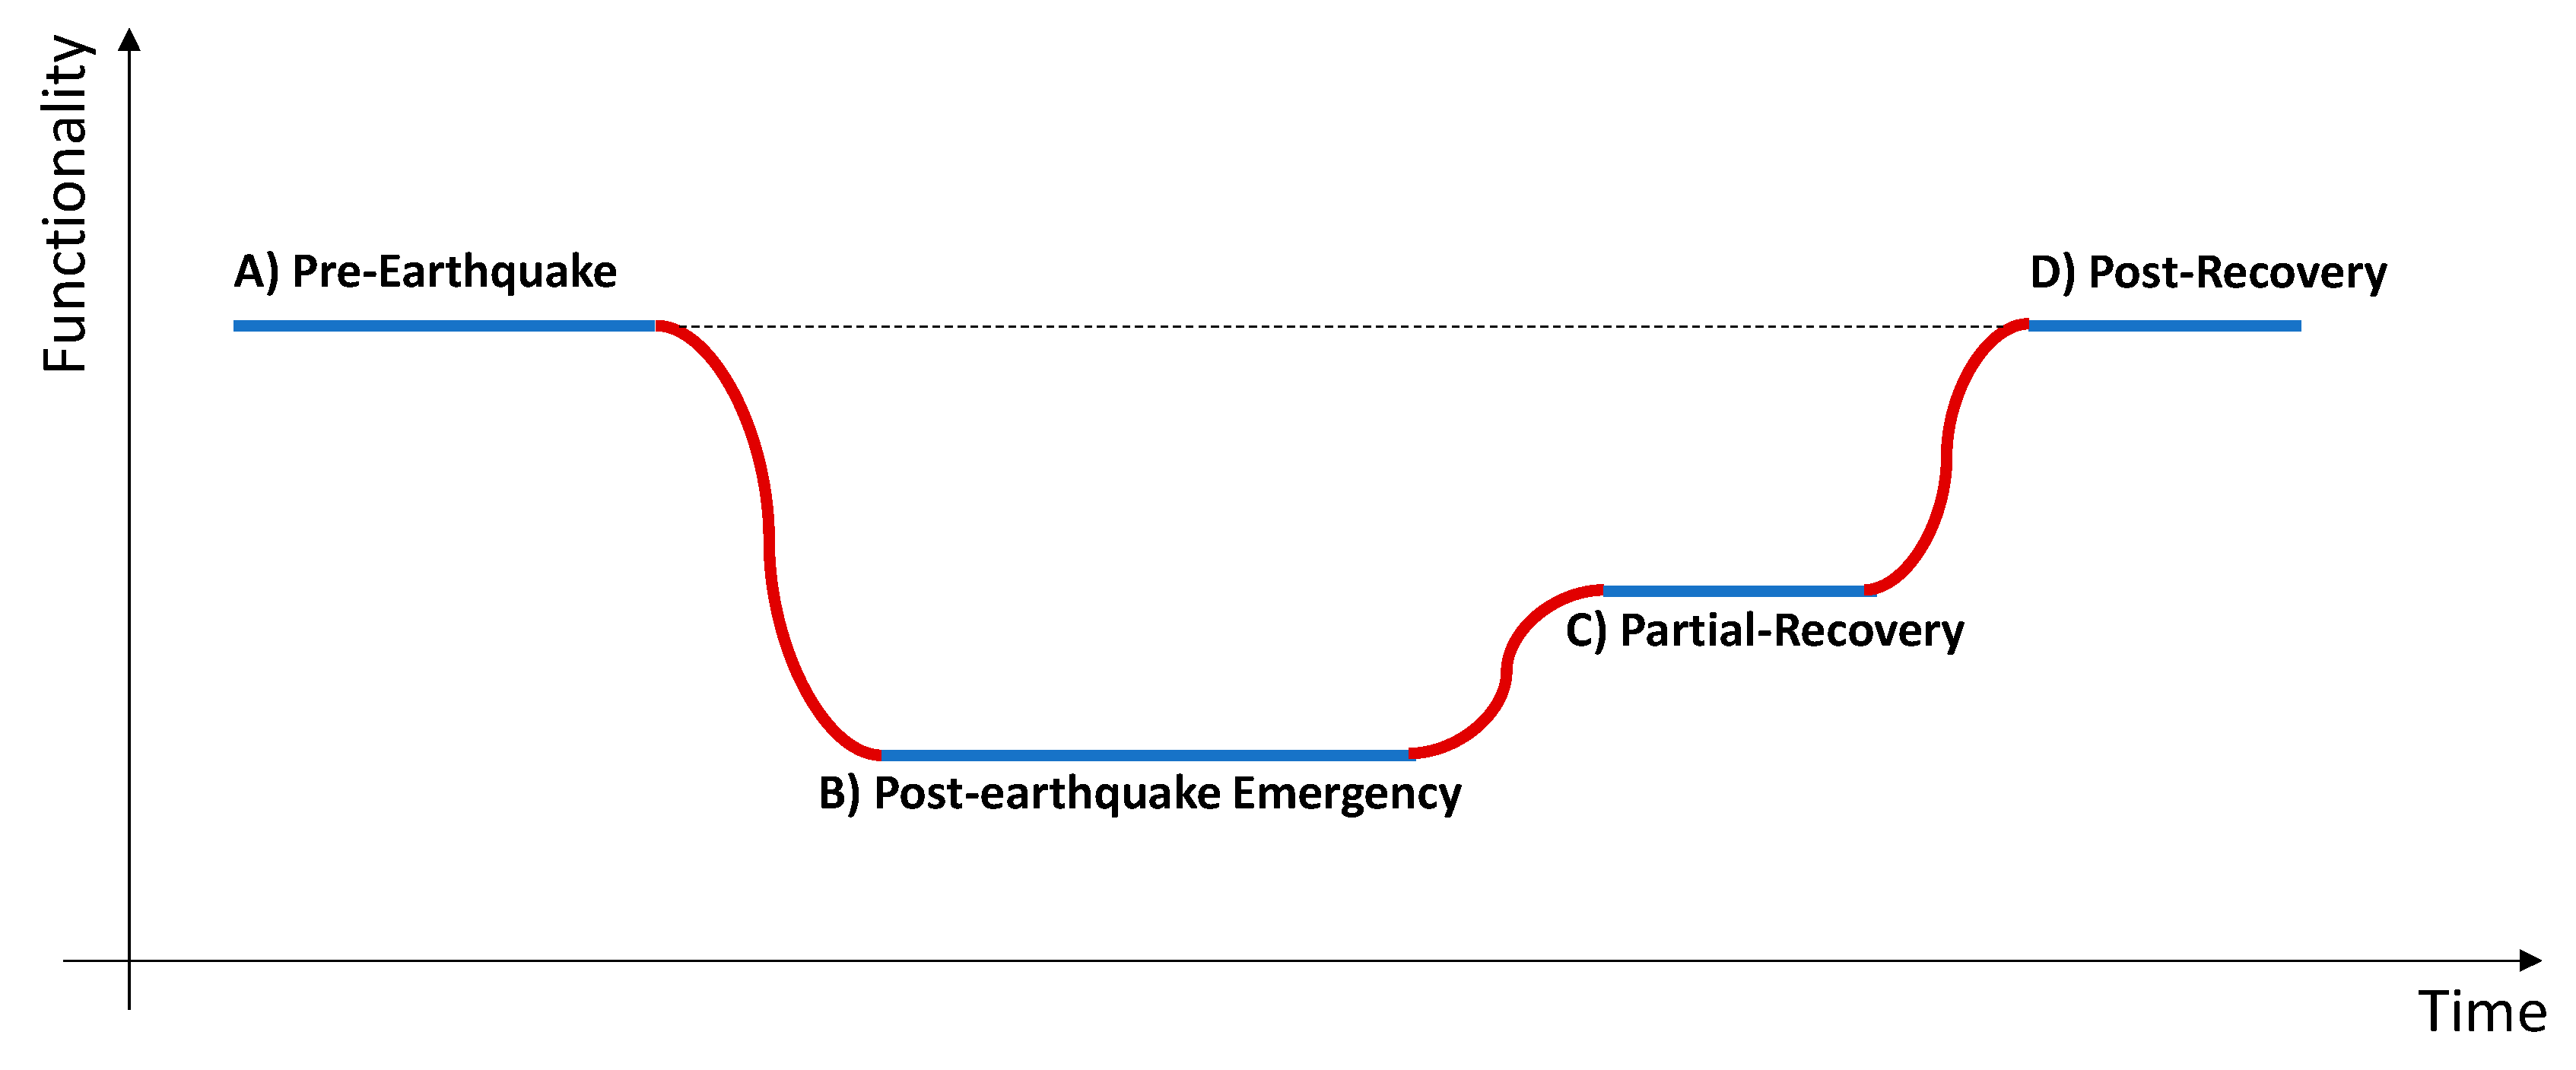
3.4. Post-Earthquake Bridge Functionality

The evolution of bridge functionality over time is conceptually depicted in Figure 1. The state of damage after the seismic event is generally expressed as a reduction in the performance indicators (such as traffic capacity) with respect to those applied before the event.
For simplicity, the relationship has been assumed as a step-wise function, where the single levels can be assumed as a percentage of the pre-earthquake situation.
Four stages have been contemplated:
(A)
Pre-Earthquake: In this stage, each bridge is in full operability, and therefore no traffic restrictions have been enforced;
(B)
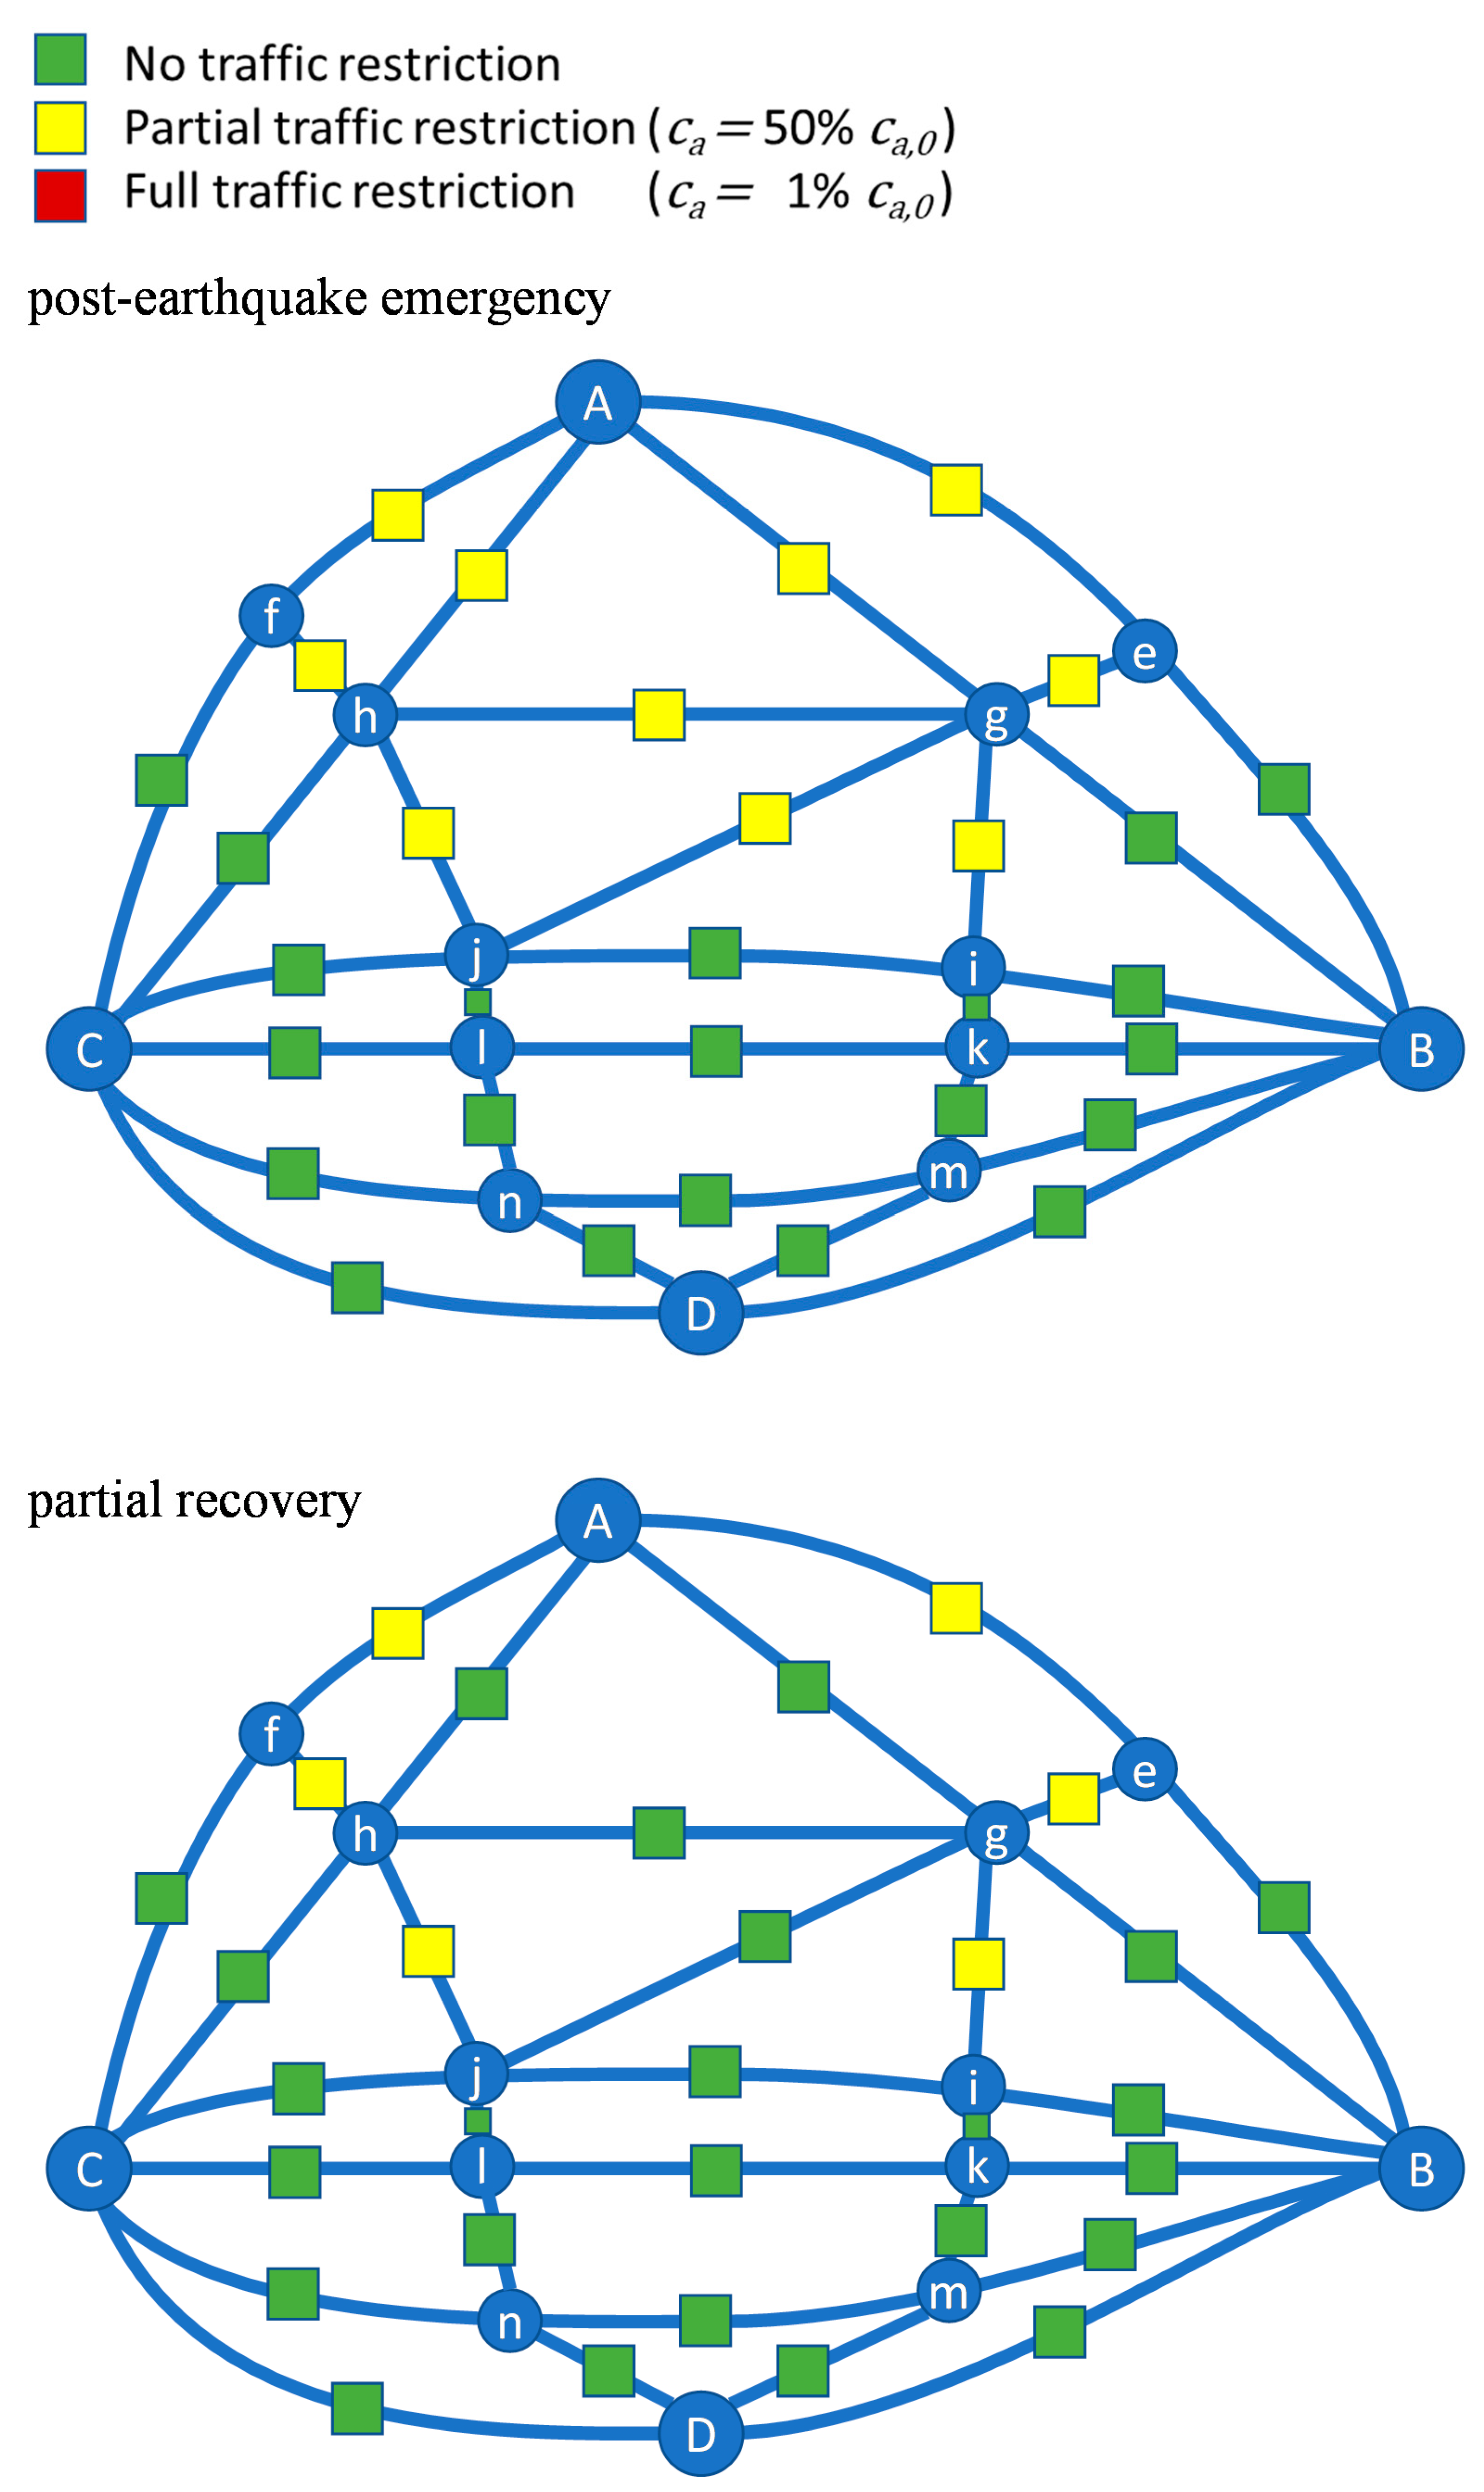
Post-Earthquake emergency: This stage represents the situation right after the seismic event. The authority in this stage may enforce very conservative restrictions on the traffic based on the state of damage of each bridge, such as: bridge closure, lane closure, restrictions to heavy vehicles, speed limitations, etc. Even the apparently undamaged bridge may require in this stage some inspection by road officials, with the presence along the bridge of men at work, equipment, and operating machines, so that some minor restrictions may been imposed such as light signals for lane control.
(C)
Partial Recovery: In this stage, after the completion of the first remedial works, the safety concerns can be relaxed and some of the traffic restriction imposed in the post-earthquake emergency stage can be removed.
(D)
Post-Recovery: In this stage, it has been assumed that bridge functionality has been restored back to the pre-earthquake levels.

4. Case Study

To demonstrate the effectiveness of the proposed approach, the road network shown in Figure 2 has been analyzed.
The road network is completely hypothetical, but has been constructed having in mind the example studied in [41,42], which represents a real medium sized network covering a provincial territory in Central Italy.
The network consists of 14 nodes and 31 bidirectional links, with over 85 major bridges. More details about the network are reported in Table 1. Only the nodes identified by capital letters are origin or destination; the demand of transportation are reported in Table 2.
The analysis has been carried out based on the following assumptions:
(1)
The initial state of damages (corresponding to the post-earthquake emergency) have been simulated imagining the occurrence of a medium size earthquake in the vicinity of the area object of study. The layout, in terms of link capacities, is given in Figure 3;
(2)
Drivers know in advance the status of congestion of the network, so that they can plan accordingly their trips (i.e., select the best path through their destination, selecting the fastest routes);
(3)
The analysis is carried out using the pre-earthquake OD matrix. In other words, the transportation demands are constant during all the post-earthquake phases. In this research, no attempt has been made to develop a dynamic origin-destination matrix describing the evolution with time of the transportation demand.

4.1. Damage and Restoration Analisys
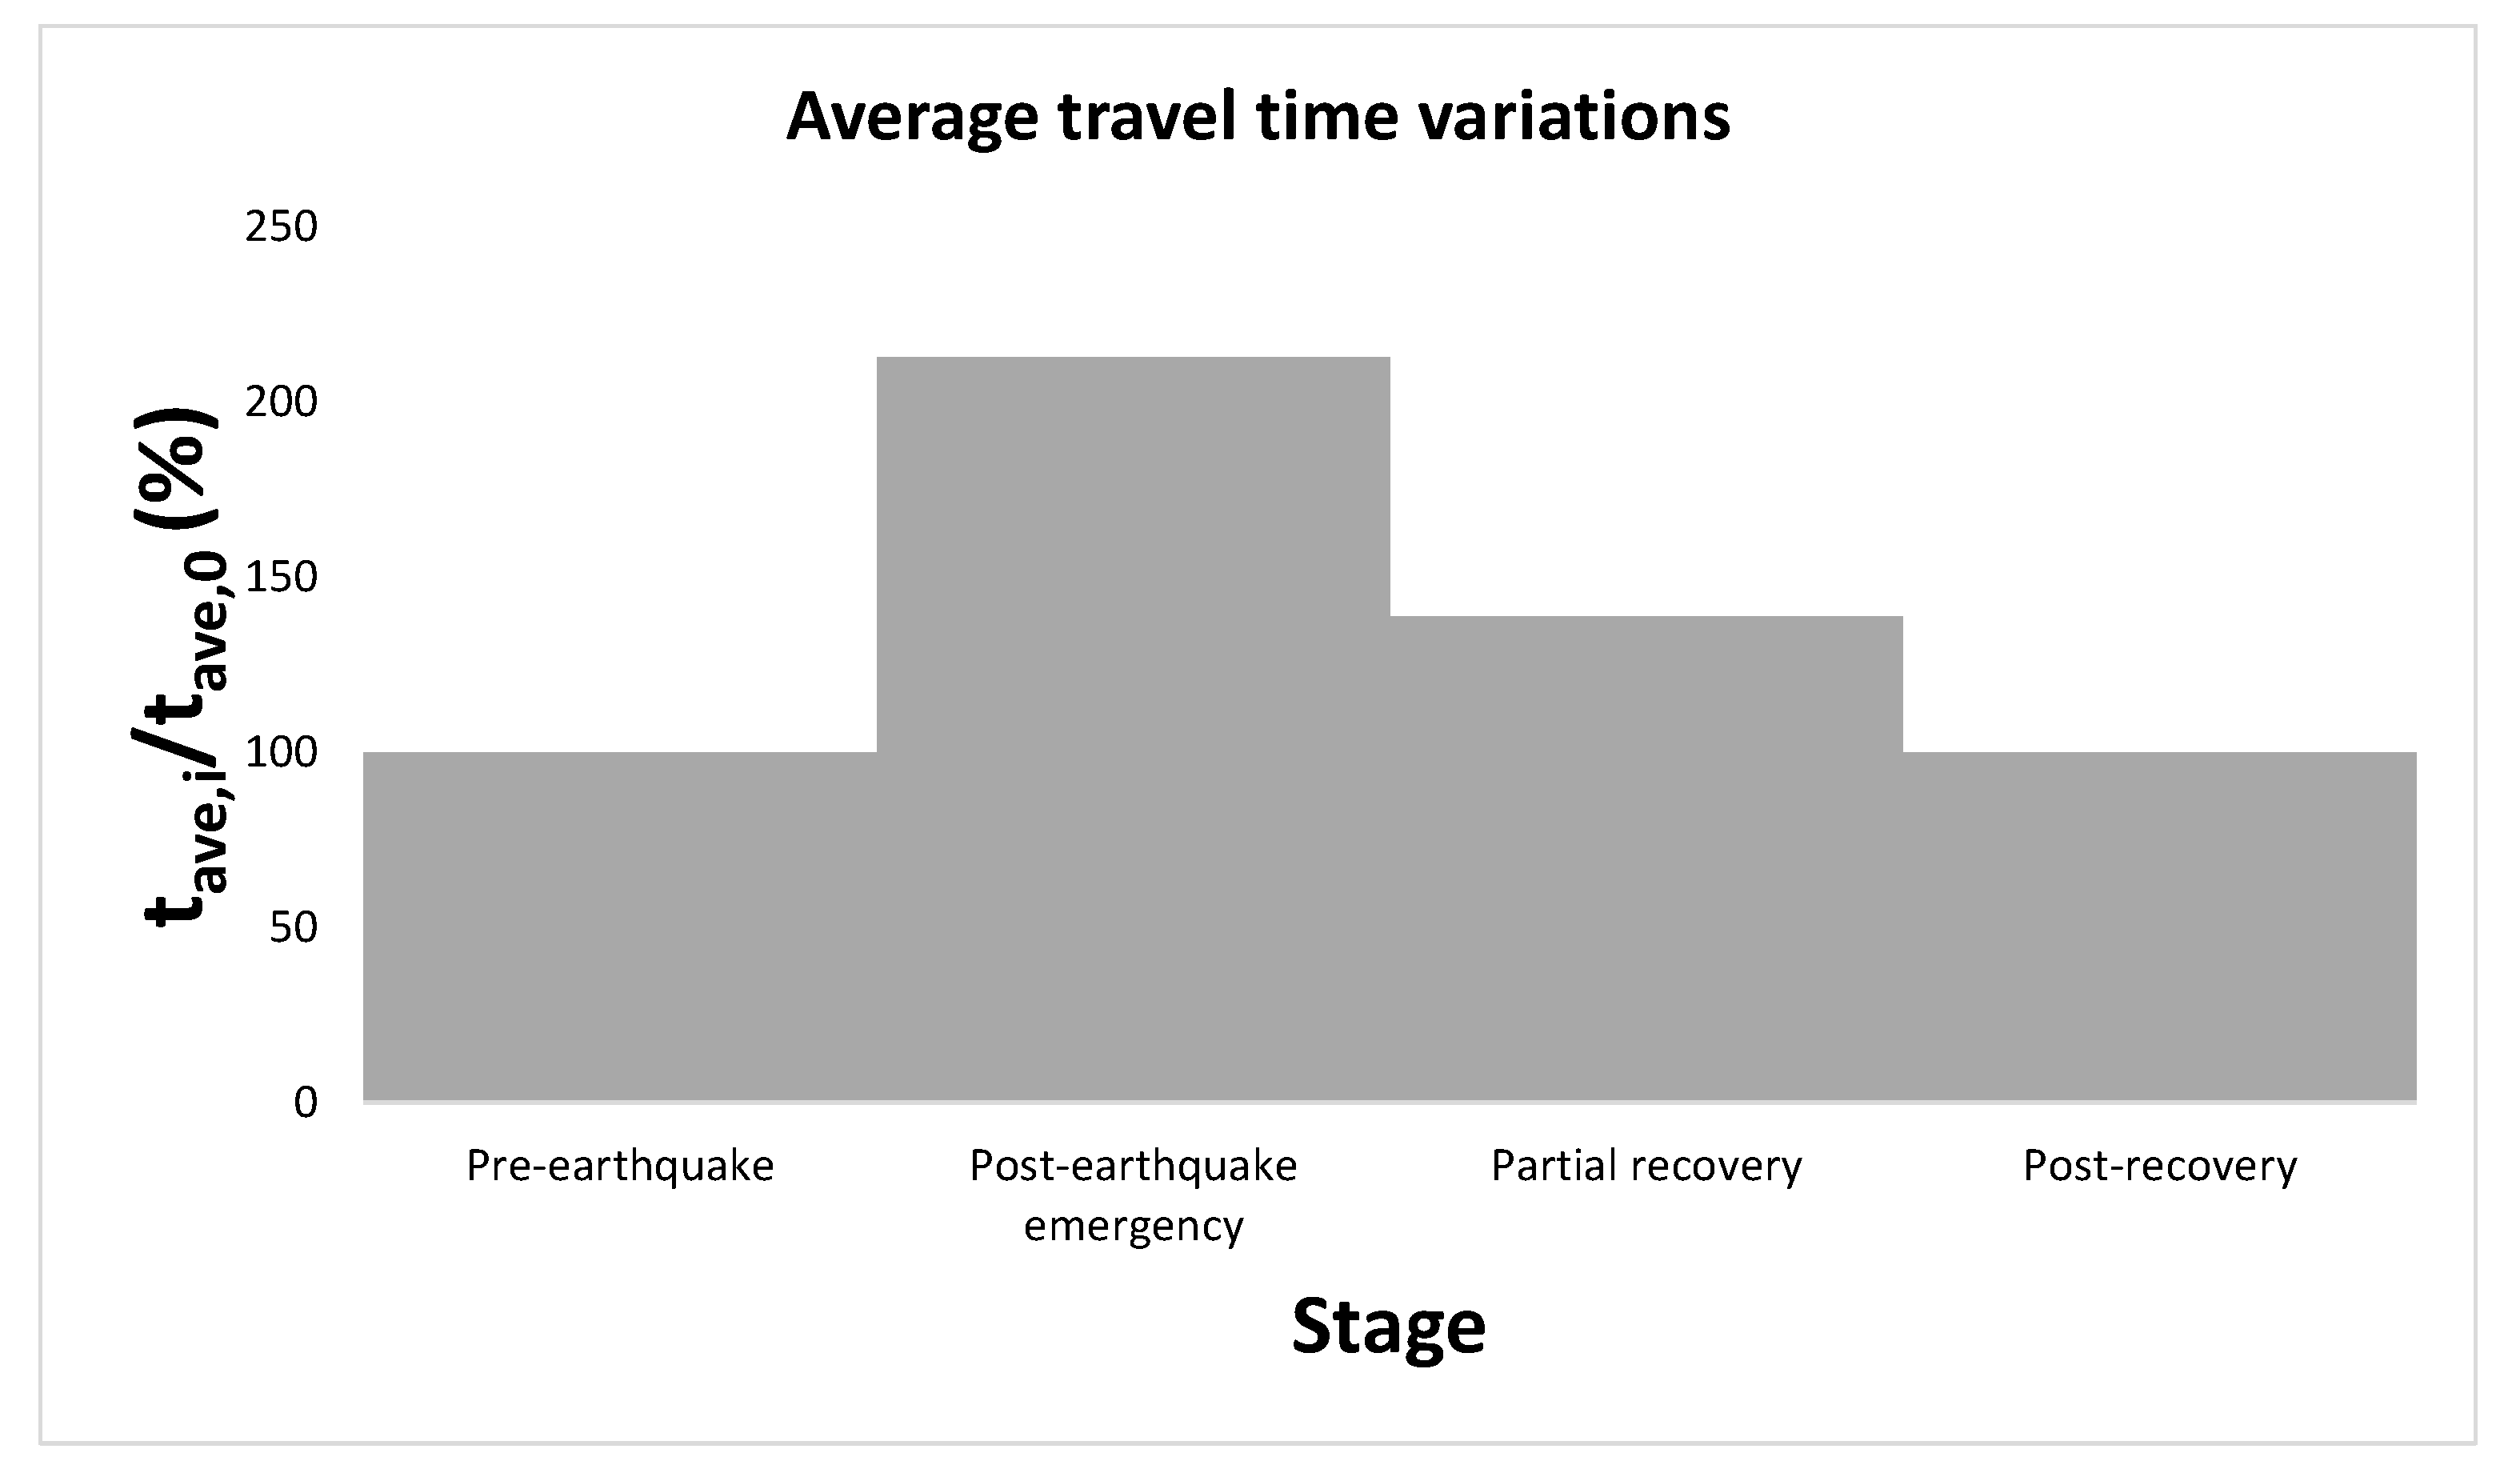
In our study, for simplicity, the seismic hazard has been accounted considering just a seismic scenario, rather than a full probabilistic analysis. We selected the occurrence of the 1349 Apennines earthquake with an estimated magnitude of 6.7, that occurred on September 9, 1349, in the north-west area of the Campania region, southeast of the town of Venafro (Molise). The epicenter has been assumed 50 km north of the point A, resulting the closest of the network. The geographical propagation of the seismic input has been provided by INGV in the form of shakemaps.
In particular, assuming to the occurrence of a seismic event, the damages over the structural components of a road network (bridges) have been simulated by means of a set of fragility curves.
As explained in [42], the structural data collected over the bridge stock have not permitted us to develop a site-specific vulnerability study, therefore the fragility curves derived by [43] have been used.
Those curves, originally developed for studying the bridges with no seismic design serving the Greater Lisbon region, have been judged to represent well the vulnerability of the bridge population actually present in the Central Italy investigated area, on the basis of the similarity of structural typologies present in both areas.
The Seismic Hazard Curve has been evaluated, adopting as main variable the same level of earthquake intensity of the fragility curves, i.e., the spectral acceleration ordinate at natural period of vibration of T1 = 1 s, Sa (T1 = 1 s).
The four curves depicted in Figure 3 identify five state of damage: LS0: no damage, LS1: slight, LS2: moderate, LS3: extensive, and LS4: complete damage. As indicated in Figure 3, the probability that the single bridge will experience an assigned damage has been derived from the probabilities of exceeding a limit state as follows:
F ( D = L S 0 | I m ) = 1     F ( D L S 1 | I m )
F ( D = L S i | I m ) = F ( D L S i | I m )     F ( D L S i + 1 | I m )       i = 1 , 2 , 3
F ( D = L S 4 | I m ) = ( D L S 4 | I m )
Once defined by simulation, the damage state of the single bridges, and therefore by application of Equations (1)–(3), of the whole link the bridges belongs, it is possible to assign a capacity reduction to the link on the basis of post-earthquake physical damages and restoration works required to restore full functionality, as described in Figure 4.
The resulting damage layout is depicted in Figure 5.

4.2. Results

The analysis outcomes have been evaluated mainly in terms of average traffic times along all the origin destinations pairs. The variations in this indicator have been expressed as the ratio between the average travel time in the i-th stage (pre-earthquake; post-earthquake emergency; partial recovery; post-recovery), t a v e , i , and the average travel time in the pre-earthquake stage, t a v e , 0 :
t a v e , i t a v e , 0
Both at pre-earthquake and post-recovery stage, the aforementioned indicator takes a value of unity. The values are reported in Figure 6.
It is noted that the main cause of trip delay is originated along the paths connecting node A with the nodes B and C, as the main post-earthquake perturbations to the link capacities are around the node A, but also in the paths connecting B, C and D it is observed some minor perturbation due to traffic originating from A re-routing in order to avoid congestion along the direct A–B, A–C and A–D paths. The progressive restoration of links improves the network functionality.

5. Conclusions

In this study, a model is developed for the analysis of seismic risk and resilience of road networks in earthquake prone areas. The model is able to evaluate the impact of post-earthquake physical damage to structures such as bridges on the circulation of vehicles across the stuck area.
It is a complex task wherein different sources of uncertainty combine together. The key factors are hazard and vulnerability, which are common ingredients in many seismic risk assessments, but the most arduous one to tackle is the ability to simulate the post-event network response. The latter is especially needed for realistic computations of the consequences of the structural damages on the level of service of the infrastructure, which also depends on the social and behavioral response of the human component, either at community-level, in terms of demand of transportation, or at individual-level, in terms of driver choices. An attempt has been made also to integrate in the analysis the concept of resilience, assessing the variation of the network response as long as the post-earthquake recovery is gradually taking hold in the community. The comprehensive evaluation of consequence to both structure and infrastructure may be a useful evaluation tool to quantify and program the most appropriate mitigation measures. Indeed, the assessment of the seismic reliability of an existing network should provide shareholders a useful indicator in order to adopt the most effective risk management strategies aimed to improve the resilience of the roadway network in case of a future earthquake event.

Author Contributions

All authors substantially contributed to this work. Conceptualization, A.R.; methodology, A.R.; software, A.R. and A.P.; validation, A.R. and A.P.; investigation, A.R. and A.P.; writing—original draft preparation, A.R.; writing—review and editing, A.R.; and supervision, B.B. and C.N. All authors have read and agreed to the published version of the manuscript.

Funding

The authors gratefully acknowledge the funding received by the National Natural Science Foundation of China (grant No. 51778148) and The Laboratories University Network of Seismic Engineering (ReLUIS): research project ReLUIS/DPC 2019–2021 Reinforced Concrete Existing Structures.

Institutional Review Board Statement

Not applicable.

Informed Consent Statement

Not applicable.

Data Availability Statement

Not applicable.

Acknowledgments

The authors wish to express their gratitude to the three anonymous reviewers for the comments and suggestions provided, which have been very helpful in improving the paper.

Conflicts of Interest

The authors declare no conflict of interest.

References

  1. Nuti, C.; Rasulo, A.; Vanzi, I. Seismic safety evaluation of electric power supply at urban level. Earthq. Eng. Struct. Dyn. 2007, 36, 245–263. [Google Scholar] [CrossRef]
  2. Nuti, C.; Rasulo, A.; Vanzi, I. Seismic safety of network structures and infrastructures. Struct. Infrastruct. Eng. Maint. Manag. Life-Cycl 2010, 6, 95–110. [Google Scholar] [CrossRef]
  3. Maffei, J.R. Management and prioritization of bridge seismic evaluations and upgrading. In National Seismic Conference on Bridges and Highways; Progress in Research and Practice: San Diego, CA, USA, 1995. [Google Scholar]
  4. Nuti, C.; Vanzi, I. Screening of bridges for assessment and retrofit. In Seismic Bridge Design and Retrofit Structural Solutions: State-of-the-Art Report, Bulletin 39; Fédération Internationale du Béton: Lausanne, Switzerland, 2007; ISBN 978-2-88394-079-6. [Google Scholar] [CrossRef]
  5. Gidaris, I.; Padgett, J.E.; Barbosa, A.R.; Chen, S.; Cox, D.; Webb, B.; Cerato, A. Multiple-hazard fragility and restoration models of highway bridges for regional risk and resilience assessment in the United States: State-of-the-art review. J. Struct. Eng. 2017, 143, 04016188. [Google Scholar] [CrossRef]
  6. Kodur, V.K.R.; Naser, M.Z. Importance factor for design of bridges against fire hazard. Eng. Struct. 2013, 54, 207–220. [Google Scholar] [CrossRef]
  7. Yuefei, L.; Dagang, L.; Xueping, F. Reliability updating and prediction of bridge structures based on proof loads and monitored data. Constr. Build. Mater. 2014, 66, 795–804. [Google Scholar] [CrossRef]
  8. Zain, M.; Usman, M.; Farooq, S.H.; Mehmood, T. Seismic vulnerability assessment of school buildings in seismic zone 4 of Pakistan. Adv. Civ. Eng. 2019, 2019, 1–14. [Google Scholar] [CrossRef] [Green Version]
  9. Poljansek, K.; Marín Ferrer, M.; De Groeve, T.; Clark, I. Science for Disaster Risk Management 2017: Knowing Better and Losing Less; Publications Office of the European Union: Luxembourg, Belgium, 2017. [Google Scholar]
  10. Bocchini, P.; Frangopol, D.M.; Ummenhofer, T.; Zinke, T. Resilience and sustainability of civil infrastructure: Toward a unified approach. J. Infrastruct. Syst. 2014, 20, 04014004. [Google Scholar] [CrossRef]
  11. Bruneau, M.; Chang, S.E.; Eguchi, R.T.; Lee, G.C.; O’Rourke, T.D.; Reinhorn, A.M.; Shinozuka, M.; Tierney, K.; Wallace, W.A.; von Winterfeldt, D. A framework to quantitatively assess and enhance the seismic resilience of communities. Earthq. Spectra 2003, 19, 733–752. [Google Scholar] [CrossRef] [Green Version]
  12. Bruneau, M.; Reinhorn, A. Exploring the concept of seismic resilience for acute care facilities. Earthq. Spectra 2007, 23, 41–62. [Google Scholar] [CrossRef] [Green Version]
  13. Capacci, L.; Biondini, F.; Titi, A.; Bittencourt, T.N.; Frangopol, D.M.; Beck, A. Seismic resilience of aging bridges and transportation networks. Maint. Monit. Saf. Risk Resil. Bridges Bridge Netw. 2016, 16, 266–286. [Google Scholar]
  14. Cimellaro, G.P.; Domaneschi, M.; Mahin, S.; Scutiero, G. Exploring simulation tools for urban seismic analysis and resilience assessment. In Proceedings of the 6th International Conference on Computational Methods in Structural Dynamics and Earthquake Engineering (COMPDYN2017), Rhodes Island, Greece, 15–17 June 2017; pp. 15–17. [Google Scholar]
  15. Cimellaro, G.P.; Reinhorn, A.M.; Bruneau, M. Framework for analytical quantification of disaster resilience. Eng. Struct. 2010, 32, 3639–3649. [Google Scholar] [CrossRef]
  16. Somy, S.; Shafaei, R.; Ramezanian, R. Resilience-based mathematical model to restore disrupted road-bridge transportation networks. Struct. Infrastruct. Eng. 2020, 1–16. [Google Scholar] [CrossRef]
  17. Argyroudis, S.; Selva, J.; Gehl, P.; Pitilakis, K. Systemic seismic risk assessment of road networks considering interactions with the built environment. Comput. Aided Civ. Infrastruct. Eng. 2015, 30, 524–540. [Google Scholar] [CrossRef]
  18. Hirokawa, N.; Osaragi, T. Earthquake Disaster Simulation System: Integration of Models for Building Collapse, Road Blockage, and Fire Spread. J. Disaster Res. 2015, 11, 2016. [Google Scholar] [CrossRef]
  19. Domaneschi, M.; Paolo, G.; Scutiero, G. A simplified method to assess generation of seismic debris for masonry structures. Eng. Struct. 2019, 186, 306–320. [Google Scholar] [CrossRef]
  20. Sediek, O.A.; El-Tawil, S.; McCormick, J. Seismic Debris Field for Collapsed RC Moment Resisting Frame Buildings. J. Struct. Eng. 2021, 147, 04021045. [Google Scholar] [CrossRef]
  21. Vishnu, N.; Kameshwar, S.; Padgett, J.E. A framework for resilience assessment of highway transportation networks. Paolo Gardoni (Ed.) Routledge Handb. Sustain. Resilient Infrastruct. 2018, 1, 216–238. [Google Scholar]
  22. Feng, K.; Li, Q.; Ellingwood, B.R. Post-earthquake modeling of transportation networks using an agent-based model. Struct. Infrastruct. Eng. 2020, 16, 1578–1592. [Google Scholar] [CrossRef] [Green Version]
  23. Kilanitis, I.; Sextos, A. Impact of earthquake-induced bridge damage and time evolving traffic demand on the road network resilience. J. traffic Transp. Eng. (Engl. Ed.) 2019, 6, 35–48. [Google Scholar] [CrossRef]
  24. Kilanitis, I.; Sextos, A.G. Integrated seismic risk and resilience assessment of roadway networks in earthquake prone areas. Bull. Earthq. Eng. 2019, 17, 181–210. [Google Scholar] [CrossRef] [Green Version]
  25. Padgett, J.E.; DesRoches, R. Bridge functionality relationships for improved seismic risk assessment of transportation networks. Earthq. Spectra 2007, 23, 115–130. [Google Scholar] [CrossRef]
  26. Grande, E.; Imbimbo, M.; Rasulo, A. Experimental Response of RC Beams Strengthened in Shear by FRP Sheets. Open Civ. Eng. J. 2013, 7, 127–135. [Google Scholar] [CrossRef]
  27. Rasulo, A.; Fortuna, M.A.; Borzi, B. A seismic risk model for Italy. Lect. Notes Comput. Sci. 2016, 9788, 198–213. [Google Scholar]
  28. Rasulo, A.; Testa, C.; Borzi, B. Seismic risk analysis at urban scale in Italy. Lect. Notes Comput. Sci. 2015, 9157, 403–414. [Google Scholar]
  29. Melchers, R.E.; Beck, A.T. Structural Reliability Analysis and Prediction; John Wiley & Sons Ltd. Print: Chichester, UK, 2017; ISBN 9781119265993. [Google Scholar] [CrossRef]
  30. Fiore, A.; Sulpizio, C.; Demartino, C.; Vanzi, I.; Biondi, S.; Fabietti, V. Seismic vulnerability assessment of historical centers at urban scale. Int. J. Archit. Herit. 2018, 12, 257–269. [Google Scholar] [CrossRef]
  31. Wardrop, J.G. Some Theoretical Aspects of Road Traffic Research. Proc. Inst. Civ. Eng. [CrossRef]
  32. Wardrop, J.G.; Whitehead, J.I. Correspondence. Some Theoretical Aspects of Road Traffic Research. ICE Proc. Eng. Div. 1952, 1, 767. [Google Scholar] [CrossRef]
  33. Beckmann, M.; McGuire, C.B.; Winsten, C.B. Studies in the Economics of Transportation; Yale University Press: New Haven, CT, USA, 1956; p. 232. [Google Scholar]
  34. U.S. Bureau of Public Roads. Traffic assignment manual for application with a large, high speed computer (Vol. 37); US Department of Commerce, Bureau of Public Roads, Office of Planning, Urban Planning Division: Washington DC, USA, 1964. [Google Scholar]
  35. Dantzig, G.B.; Fulkerson, D.R. On the max flow min cut theorem of networks. Linear Inequalities Relat. Syst. 2003, 38, 225–231. [Google Scholar]
  36. Papadimitriou, C.H.; Steiglitz, K. The Max-Flow, Min-Cut Theorem. In Combinatorial Optimization: Algorithms and Complexity; Dover Publications: Mineola, NY, USA, 1998; pp. 120–128. [Google Scholar]
  37. Rasulo, A.; Goretti, A.; Nuti, C. Performance of lifelines during the 2002 Molise, Italy, earthquake. Earthq. Spectra 2004, 20, 301–314. [Google Scholar] [CrossRef]
  38. Lavorato, D.; Fiorentino, G.; Pelle, A.; Rasulo, A.; Bergami, A.V.; Briseghella, B.; Nuti, C. A Corrosion Model for the Interpretation of Cyclic Behavior of Reinforced Concrete Sec-tions. Struct. Concrete 2019, 21, 1732–1746. [Google Scholar] [CrossRef]
  39. Lavorato, D.; Pelle, A.; Fiorentino, G.; Nuti, C.; Rasulo, A. A nonlinear material model of corroded rebars for seismic response of bridges. In Proceedings of the 7th ECCOMAS Thematic Conference on Computational Methods in Structural Dynamics and Earthquake Engineering (COMPDYN 2019), Crete Island, Greece, 24–26 June 2019; Papadrakakis, M., Fragiadakis, M., Eds.; pp. 24–26. [Google Scholar]
  40. Rasulo, A.; Pelle, A.; Lavorato, D.; Fiorentino, G.; Nuti, C.; Briseghella, B. Finite Element Analysis of Reinforced Concrete Bridge Piers including a Flexure-Shear Interaction Model. Appl. Sci. 2020, 10, 2209. [Google Scholar] [CrossRef] [Green Version]
  41. D’Apuzzo, M.; Evangelisti, A.; Nicolosi, V.; Rasulo, A.; Santilli, D.; Zullo, M. A Simplified Approach for the Prioritization of Bridge Stock Seismic Retrofitting. In 29th European Safety and Reliability Conference; Research Publishing: Singapore, 2019; pp. 3277–3284. [Google Scholar]
  42. D’Apuzzo, M.; Evangelisti, A.; Nicolosi, V.; Rasulo, A. Simplified approach to integrate seismic retrofitting prioritization with social cost evaluation: A case study in central Italy. J. Traffic Transp. Eng. (Engl. Ed.) 2021, in press. Available online: https://kns.cnki.net/kcms/detail/61.1494.U.20210514.1426.002.html (accessed on 13 July 2021).
  43. Azevedo, J.; Guerreiro, L.; Bento, R.; Lopes, M.; Proença, J. Seismic vulnerability of lifelines in the greater Lisbon area. Bull. Earthq. Eng. 2010, 8, 157–180. [Google Scholar] [CrossRef]
Figure 1. Bridge functionality vs. time relationship.
Infrastructures 06 00112 g001
Figure 2. Layout of the highway road network, with indication of bridge positions.
Infrastructures 06 00112 g002
Figure 3. Set of fragility curved used in the present study.
Infrastructures 06 00112 g003
Figure 4. Link capacity vs. time relationship.
Infrastructures 06 00112 g004
Figure 5. Post-Earthquake perturbations to link capacities ca.
Infrastructures 06 00112 g005
Figure 6. Time delay ratios during the different recovery stages.
Infrastructures 06 00112 g006
Table 1. Characteristics of the links. The bidirectional links have been identified by the names of the two nodes connected (i.e.: x–y link connecting node x and y).
LinkLa (km)vo,a (km/h)ca (Veich/Day)
Ae15.0803000
Af15.0803000
Ag15.01104000
Ah15.01104000
BD25.0803000
Be15.0803000
Bg15.01104000
Bi15.0702000
Bk15.01306000
Bm15.0702000
CD25.0803000
Cf15.0501000
Ch15.01104000
Cj15.0702000
Cl15.01306000
Cn15.0702000
Dm10.0702000
Dn10.0702000
eg5.0501000
gh15.0501000
fh5.0501000
gi15.0501000
gj15.0501000
ij15.0702000
hj15.0501000
ik2.0702000
jl2.0702000
kl15.01306000
km2.0702000
ln2.0702000
mn10.0702000
Table 2. Daily traffic demands between the Origin and Destination pairs (veich/day).
Origin/DestinationABCDTot.
A----1500250010005000
B1500----250010005000
C25002500----10006000
D100010001000----3000
Tot.5000500060003000
Publisher’s Note: MDPI stays neutral with regard to jurisdictional claims in published maps and institutional affiliations.

