Article

A Machine-Learning Approach for Extracting Modulus of Compacted Unbound Aggregate Base and Subgrade Materials Using Intelligent Compaction Technology

1
Center for Transportation Infrastructure Systems, The University of Texas at El Paso, 500 W. University Ave., El Paso, TX 79968, USA
2
Department of Civil Engineering, California State University-Los Angeles, 5151 State University Dr., Los Angeles, CA 90032, USA
*
Authors to whom correspondence should be addressed.
Infrastructures 2021, 6(10), 142; https://doi.org/10.3390/infrastructures6100142
Submission received: 1 September 2021 / Revised: 20 September 2021 / Accepted: 28 September 2021 / Published: 8 October 2021
(This article belongs to the Special Issue Artificial Intelligence in Infrastructure Geotechnics)

Abstract

:
This study presents a rigorous approach for the extraction of the modulus of soil and unbound aggregate base materials for quality management using intelligent compaction (IC) technology. The proposed approach makes use of machine-learning methods in tandem with IC technology and modulus-based spot testing as a local calibration process to estimate the mechanical properties of compacted geomaterials. A calibrated three-dimensional finite element (FE) model that simulates the proof-mapping process of compacted geomaterials was used to develop a comprehensive database of responses of a wide range of single and two-layered geosystems. The database was then used to develop different inverse solvers using artificial neural networks for the estimation of the modulus from the characteristics of the roller and information about the geomaterials. Several instrumented test sites were used for the evaluation and validation of the inverse solvers. The proposed approach was found promising for the extraction of the modulus of compacted geomaterials using IC. The accuracy of the inverse solvers is enhanced if a local calibration process is incorporated as part of a quality management program that includes the use of in situ measurements using modulus-based test devices and laboratory resilient modulus testing. Moreover, compaction uniformity plays a key role in the retrieval of the modulus of geomaterials with certainty. The proposed approach fuses artificial intelligence with mechanistic solutions to position IC as a technology that is well suited for the quality management of compacted materials.

1. Introduction

Different research efforts have been undertaken to develop and implement modulus-based quality management procedures to ensure that compacted pavement materials meet the material properties used in mechanistic pavement design practices [1,2,3,4,5,6,7]. These procedures involve the use of in situ modulus/deflection-based nondestructive testing (NDT) devices that estimate the stiffness properties of compacted geomaterials. These efforts have led to new quality management protocols that are implemented by a few state highway agencies.
Intelligent compaction (IC) has been considered as a potential tool for the assessment of the stiffness and uniformity of compacted materials near real time while achieving 100% coverage of the compacted area. IC is a technology that incorporates a vibratory roller with an accelerometer-based measuring system, a high precision global positioning system (GPS), and an onboard data acquisition system (DAQ) with a color-coded display to improve the compaction quality [3,7,8]. The IC measurement values (ICMVs) are used to assess the quality and uniformity of the compacted layer based on different metrics and various levels of correlation to the mechanical and engineering properties of compacted geomaterials [9]. Different studies have directly or indirectly attributed the following benefits to ICMVs: (1) improved compaction/uniformity quality; (2) reduced over/under compaction; (3) reduced compaction time; (4) improved location of less stiff spots; and (5) the feasibility design, construction, and performance integration [3,7,10,11,12,13,14]. Parameters that affect the correlation among the IC roller and other in situ test measurements include the difference in the depth of influence, the state of stress due to the imparted energy, heterogeneity in the underlying materials, moisture content variability, and intrinsic measurement errors associated with the employed devices [15,16,17]. As such, ICMVs are indicators of the composite stiffness of the geomaterials down to an effective depth, which is called depth of influence.
Different ICMVs that are utilized in commercially available IC rollers have been derived from either empirical solutions based on the frequency responses [3] or from simplified mechanistic-based models that involve discrete vibration models or continuum static models [10,18,19,20]. These techniques have been proposed based on the hypothesis that the roller and the pavement form a coupled system, the response of which is influenced by the properties of the layers during vibratory compaction. Sandström and Pettersson [21] pointed out that the amplitude of the force imparted by the drum was proportional to the first harmonic of the vertical acceleration of the drum. Given that the displacement measured by the drum can be calculated by the double integration of the acceleration, Sandström and Pettersson [21] proposed a relationship to obtain a stiffness parameter called the cylinder deformation modulus, Ec, which is expressed as the ratio of the force and the corresponding displacement.
Several recent studies have attempted to obtain the modulus of compacted geomaterials using both IC measurements and modulus-based spot testing. Mooney and Facas [22] proposed a forward modeling and real-time inverse analysis using FE and boundary element (BE) analyses to extract the layer elastic modulus from IC data. White et al. [23,24] compared ICMV measurements from a roller instrumented with a proprietary intelligent compaction system with an in situ composite resilient modulus (Mr-comp) obtained with an automated plate load testing (APLT) device. The authors showed that their proposed ICMV correlated well with both Mr-comp and the modulus of subgrade reaction. They further generated geo-referenced spatial modulus maps from IC measurements. Barman et al. [15] evaluated the Intelligent Compaction Analyzer (ICA), an IC tool developed by the University of Oklahoma, to continuously estimate the dry density and modulus during subgrade compaction. They trained an artificial neural network (ANN) to convert their IC measurements to density or modulus values. A coefficient of determination (R2) of 0.63 was obtained between the estimated field and the measured laboratory-resilient moduli.

2. Objectives

The objective of this study was to use artificial intelligence techniques to expedite the extraction of the modulus of compacted geomaterials utilizing intelligent compaction (IC) technology. To develop such an approach, it was necessary to assemble a comprehensive database of material responses from a wide range of geosystems, geomaterials, and roller operating conditions. A 3-D FE model was used as a forward model to simulate geomaterial responses under the drum simulation of one- (subgrade only) and two-layered (subgrade and base) structures with a wide range of geomaterials during proof-rolling. Proof-rolling (or proof-mapping) is a process that can be used to identify the uniformity and consistency of a compacted layer by covering the area of interest with an IC roller [25]. Typically, proof-mapping is conducted at specific and consistent operating conditions by setting the drum vibration to low-amplitude and low-frequency operating conditions. The input parameters along with the geomaterial responses from the forward model are incorporated into a comprehensive database that can be utilized to develop and evaluate different inverse solvers for the extraction of the modulus of the compacted geomaterials.
The veracity of different inverse solvers was evaluated in several test sections. The process followed in this study and the approach developed to extract the modulus of compacted materials are summarized in Figure 1. Aside from the ICMV measurements, the LWD and the corresponding moisture content of the compacted geomaterials were determined at more than three dozen locations. Laboratory index, moisture density, and resilient modulus tests were also conducted on the representative geomaterials sampled at each site. The following sections summarize the strategies undertaken and the findings of this study.

3. Finite Element Modeling

A compacted geomaterial proof-mapping simulation was conducted using a 3-D FE model that had been developed using the commercially available multi-purpose software package LS-DYNA®. The details of each modeling scenario are provided in Nazarian et al. [7]. The model consisted of a drum imparting energy to a layered geosystem at typical proof-mapping operating conditions. Different levels of sophistication for the FE model were considered, including the linear vs. load-induced nonlinear behaviors of the geomaterials, the static vs. vibratory operating conditions of the drum, and the stationery vs. moving roller operations. Though the use of nonlinear material models may yield more accurate responses than those obtained under linear elastic models, their use requires iterative procedures to update the state of stress during the simulation, leading to longer execution times. Moreover, dynamic analyses lend to even longer executions, as the time history responses of the roller’s vibratory motion must be obtained. First, about 600 scenarios were evaluated using a baseline drum model to document the differences among the geomaterial responses simulated under different levels of sophistication. As documented in Nazarian et al. [7], the responses from the different sophistication levels are strongly correlated. The stationary static nonlinear FE model was selected as the best compromise between the execution time and the accuracy of populating a comprehensive database. The more sophisticated models with longer execution times did not warrant more realistic responses.
Figure 2 illustrates a 3D view of the simulated pavement structure and the drum of the roller. The drum was simulated as a rigid body using shell elements with a 2 m drum width and a 1.5 m diameter, dimensions that are typical of commercially available IC rollers. A total of 75,000 elements were used to simulate the drum to better accommodate the curvature of the drum surface. A 4 m × 4 m pavement structure with a 2.5 m depth and non-reflective boundaries to minimize the impact of the boundaries on the pavement responses was simulated and meshed using brick elements to accommodate one- and two-layered systems. The mesh of the pavement structure was comprised of approximately 64,000 elements, with the smaller cubic elements near the surface having side dimensions of 50 mm. The refined meshed extended to 0.5 m in depth from the surface and covered an area of 0.6 m longitudinally and 1.2 m transversally from the center of the drum. To better simulate the interaction between the drum and the soil system, an automatic single surface contact type was considered to allow the decoupling of the drum from the soil surface, similar to what has been observed in the field.
The following material model proposed by Ooi et al. [26] was considered to account for the load-induced nonlinear behaviors of different geomaterials:
M R = k 1 P a ( θ P a + 1 ) k 2 ( τ o c t P a + 1 ) k 3 ,
where MR is the resilient modulus, Pa is the atmospheric pressure of 100 kPa, θ is bulk stress, τoct is the octahedral shear stress, and k1, k2, and k3 are the model parameters (determined from fitting the laboratory data to the model). The feasible ranges of the nonlinear k′ parameters proposed by Velasquez et al. [27] for the fine- and coarse-grained geomaterials used in this study are reported in Table 1.
The operating settings used for the simulated drums are shown in Table 2. The imparted load by the roller drum is generated by the rotation of the eccentric masses inside the drum. The induced excitation force, Fe, is defined as
F e ( t ) = m 0 e 0 Ω 2 cos ( Ω t ) ,
where Ω is the rotational frequency, e0 is the eccentricity of the counter-rotating masses m0, and t is time.
Single-layer (subgrade only) and two-layer systems with the top layer (base) having thicknesses ranging from 150 mm to 300 mm with an increment of 25 mm on top of the subgrade were simulated using the FE model. More than 2200 FE cases for single-layer and more than 5500 FE scenarios for two-layer geosystems were initially selected using the randomly generated, uniformly distributed, nonlinear parameters as inputs to the model within the feasible range of values shown in Table 1. In addition, roller dimensions and operating parameters were selected and used as the loading conditions using the parameters within the feasible ranges shown in Table 2. The surface displacements on top of the subgrade and base obtained from the simulated mapping process, and the representative modulus of each layer was used to build the inverse solvers.
Due to the nonlinear behavior of unbound geomaterials, the modulus of a layer varies spatially and with the depth. To gauge the quality of the pavement, the use of a representative modulus for the layer is desirable. The modulus at the half-depth of the base and 300 mm into the subgrade were considered as the representative moduli. An example of a modulus profile of a two-layer geosystem comprised of a coarse-grained unbound base material on top of a clayey subgrade under a static stationary roller is shown in Figure 3. In the case shown, the base modulus is at about 250 MPa when close to the surface, but it then decreases with depth to a magnitude of 120 MPa when reaching the bottom of the base layer. The higher modulus near the surface is due to the hardening behavior of the unbound aggregate base material when subjected to the large concentration of stress that occurs near the drum–soil interface. As the stress dissipates with depth, the modulus decreases with depth as well. Similar behavior is seen within the top 200 mm of the subgrade, where the modulus also decreases significantly with depth. Then, afterward, the modulus stabilizes at a magnitude of about 35 MPa and remains nearly constant at deeper depths.
For this study, the surface displacements on top of the subgrade (simulating the pre-mapping process conducted before placing the base layer) and on top of the base materials (simulating the mapping process after completion of compaction) accompanied by the representative moduli of single- and two-layer geosystems were extracted for all of the analyzed FE scenarios. This database was then used along with the nonlinear material properties for the construction of various inverse solvers, as discussed in the following sections.

4. Development and Evaluation of Inverse Solver

To develop inverse models for the backcalculation of the moduli of the subgrade and base layers, a set of machine learning techniques (including genetic programming, random forests, artificial neural networks, etc.) were implemented. The evaluation of the alternative algorithms is reported in Nazarian et al. [7]. Since the artificial neural network (ANN) was found to be the most optimized algorithm, only the process that was followed to develop the ANN inverse solvers is discussed here. A multi-layer perceptron (MLP) feed-forward neural network model with the Levenberg–Marquardt algorithm [28,29,30] was deployed. To arrive at the optimal predictive inverse solver using an ANN, the nonlinear k parameters of the subgrade kis, and the surface displacement, d1, measured on top of the subgrade were considered as input parameters. In addition to those parameters, the base nonlinear parameters kib and layer thickness, h, and the surface displacements, d2, recorded on top of the base layer were used. The general form of the predictive functions considered for the moduli of the subgrade and base, respectively, are in the following form:
E S U B G = f ( k i s , d 1 ) ,   and
E B A S E = f ( k i s , k i b , h , d 1 , d 2 ) ,
where ESUBG and EBASE are representative of the subgrade and base moduli, respectively.
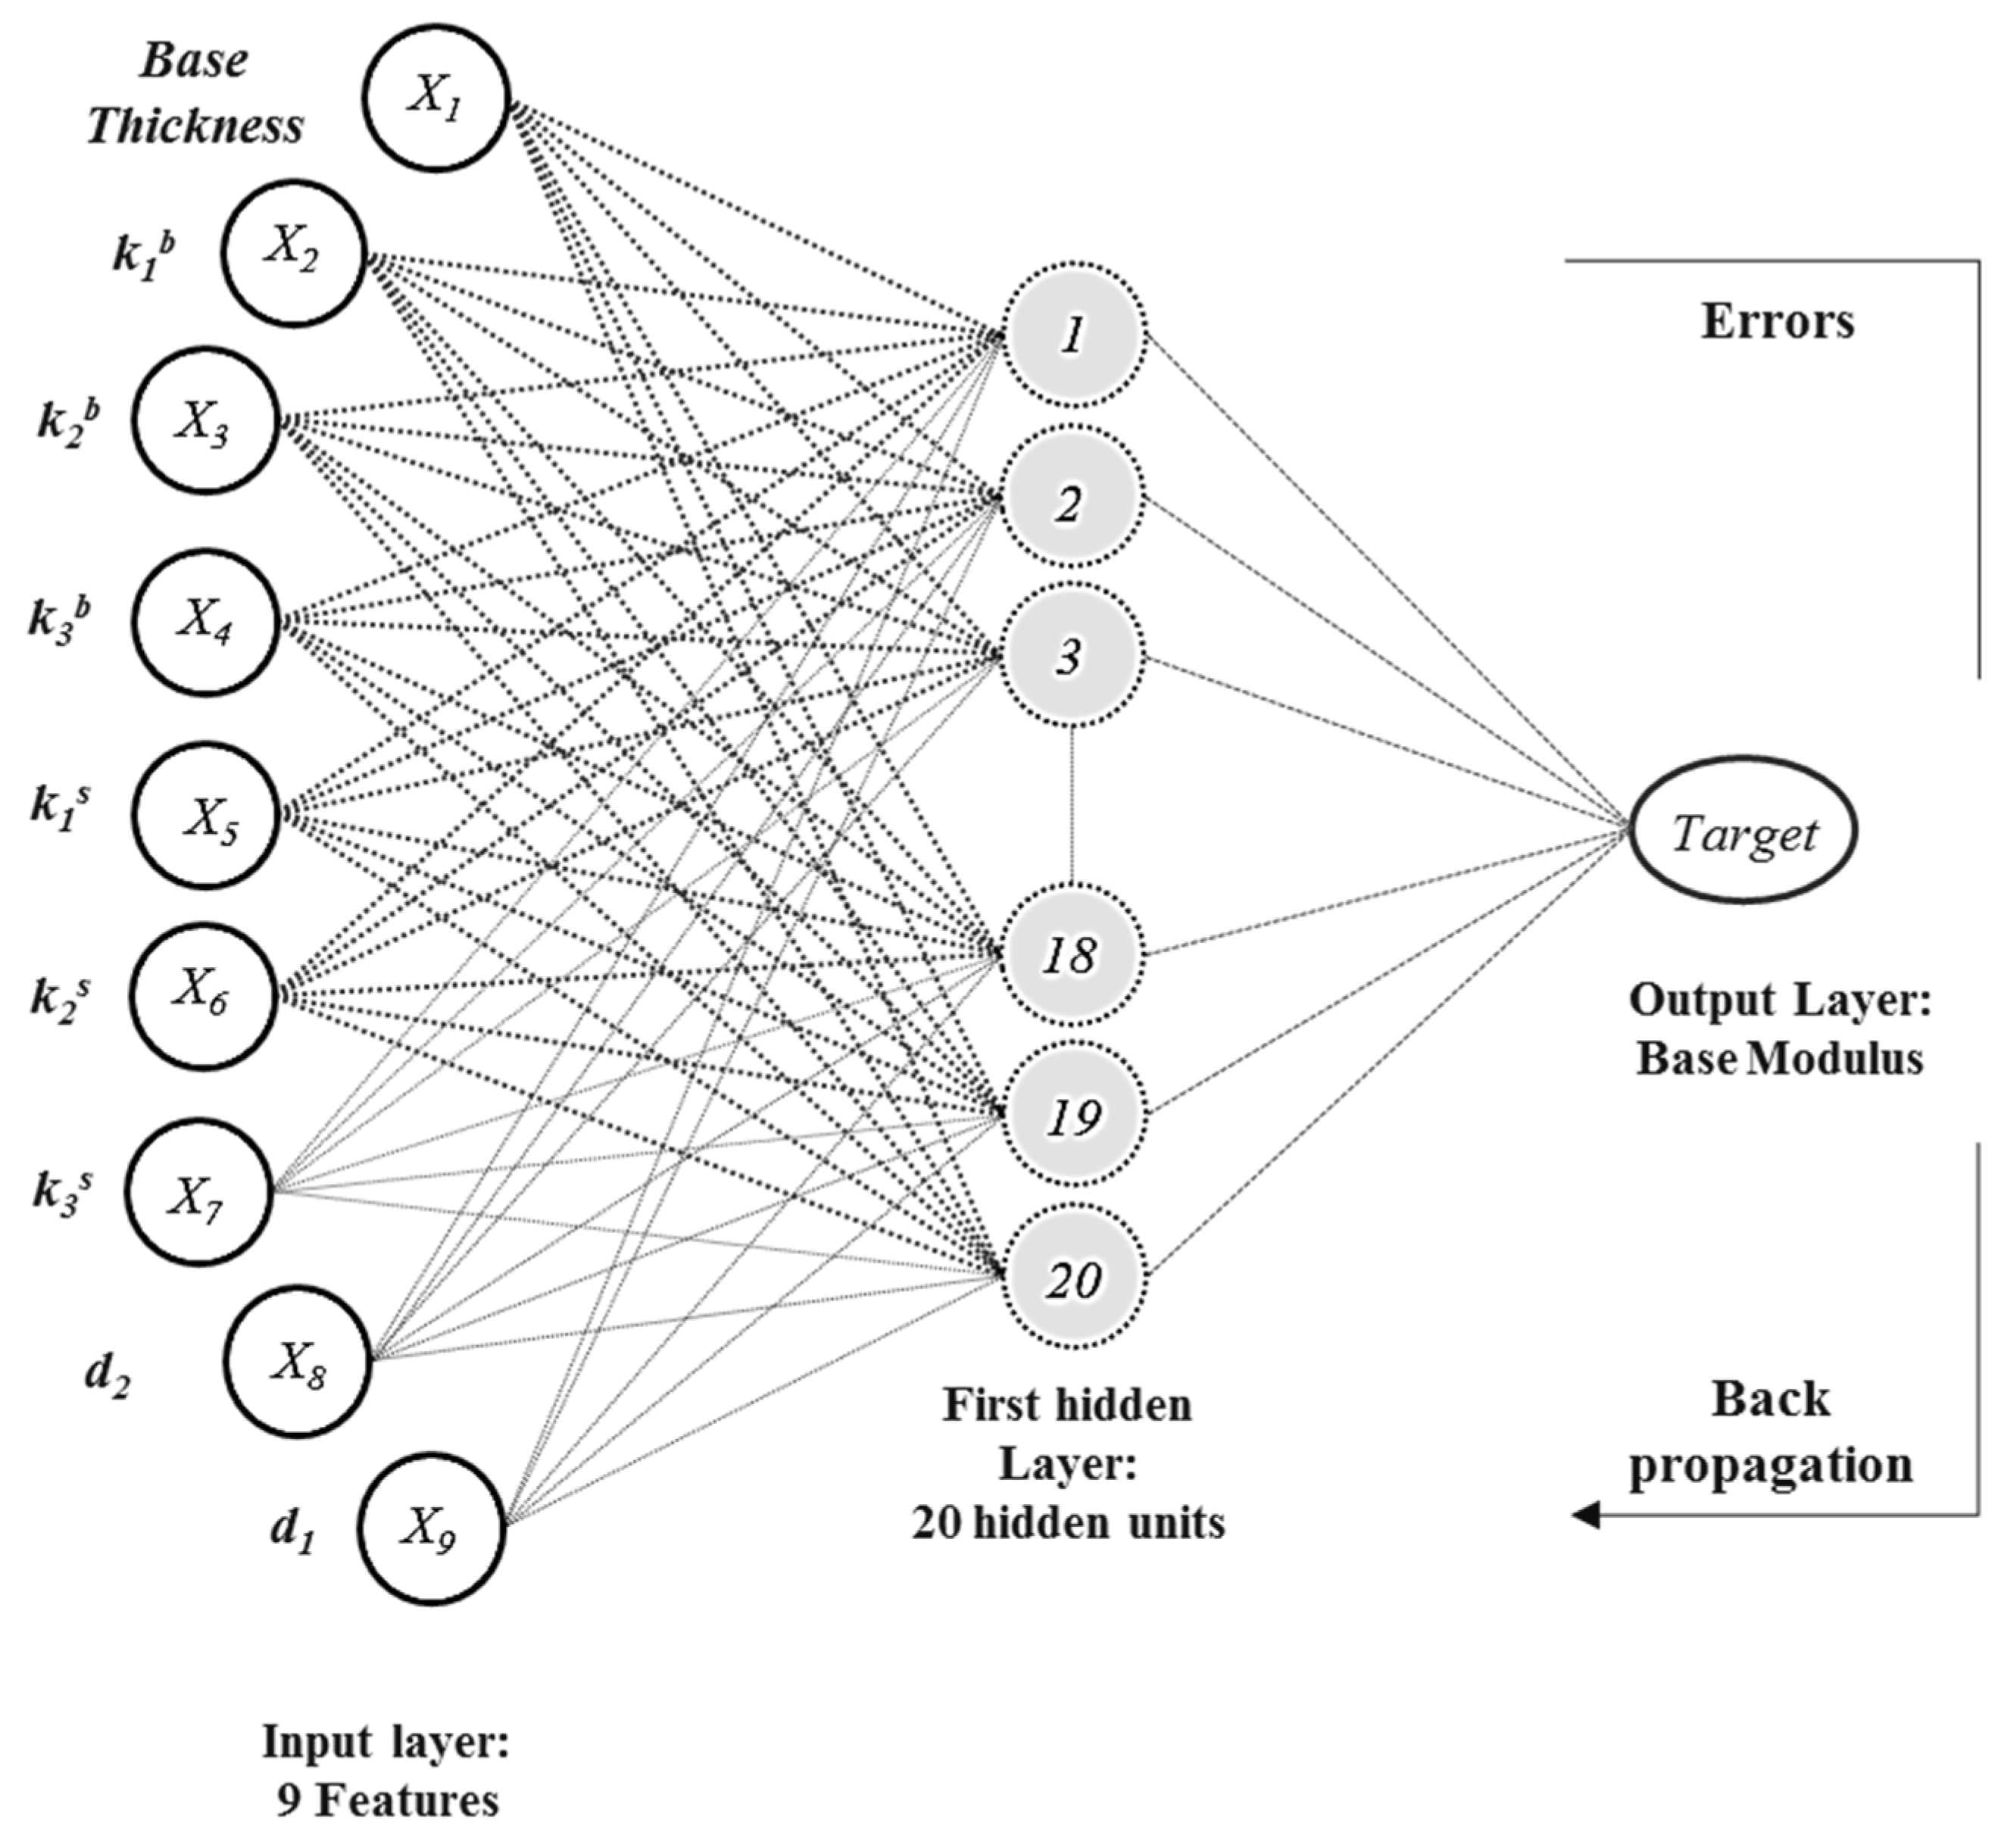
An example of the ANN architecture constructed at the most complex level, i.e., the nonlinear k′ parameters of the base and subgrade, base thickness h, and surface displacements d1 and d2 corresponding to the top of subgrade and base layer, respectively, is shown in Figure 4. The architecture of the constructed ANN inverse solvers comprised of three layers including (1) an input layer containing predictor variables, (2) an intermediate hidden layer containing neurons—computational units that are interconnected with several weighted links, and (3) an output layer containing the representative modulus of compacted layered soil systems as a target.
The contents of the database were divided into two groups, where 80% of the database was used for training the algorithm. The remaining 20% of the randomly chosen population was used to evaluate the predictive accuracy of the fitted model. Specific processes such as forward feeding the initial solutions, backpropagating the errors throughout the entire network, and adjusting the connection weights can assist the network in finding the best solution. The standard error of estimate (SEE) was used to evaluate the evolution of the network toward the best solution using the following equation:
S E E = i = 1 n ( Y i Y i ) 2 n ,
where Yi is the estimated modulus of the layered soil obtained from the predictive function of the fitted trend, and Yi is the actual values for the modulus of the compacted layered material from the FE simulation. Parameter n is the total number of points.
As shown in Table 3, several scenarios with different complexity levels were considered for training the inverse solvers. As seen in Table 3, the more sophisticated inverse solvers would require additional laboratory efforts. For instance, Scenario 4 would require the modulus of subgrade ESUBG to be known, while Scenario 5 would require the modulus of the subgrade to be obtained, which would be calculated using the representative state of stress recommended by NCHRP Project 1-28A (i.e., θ = 85.5 kPa and τoct = 20.9 kPa) and the nonlinear k parameters as determined from the resilient modulus test as per AASHTO T-307.
Based on the available input parameters from IC field operations and laboratory test results, two backcalculation scenarios for predicting ESUBG and five scenarios for EBASE were proposed.
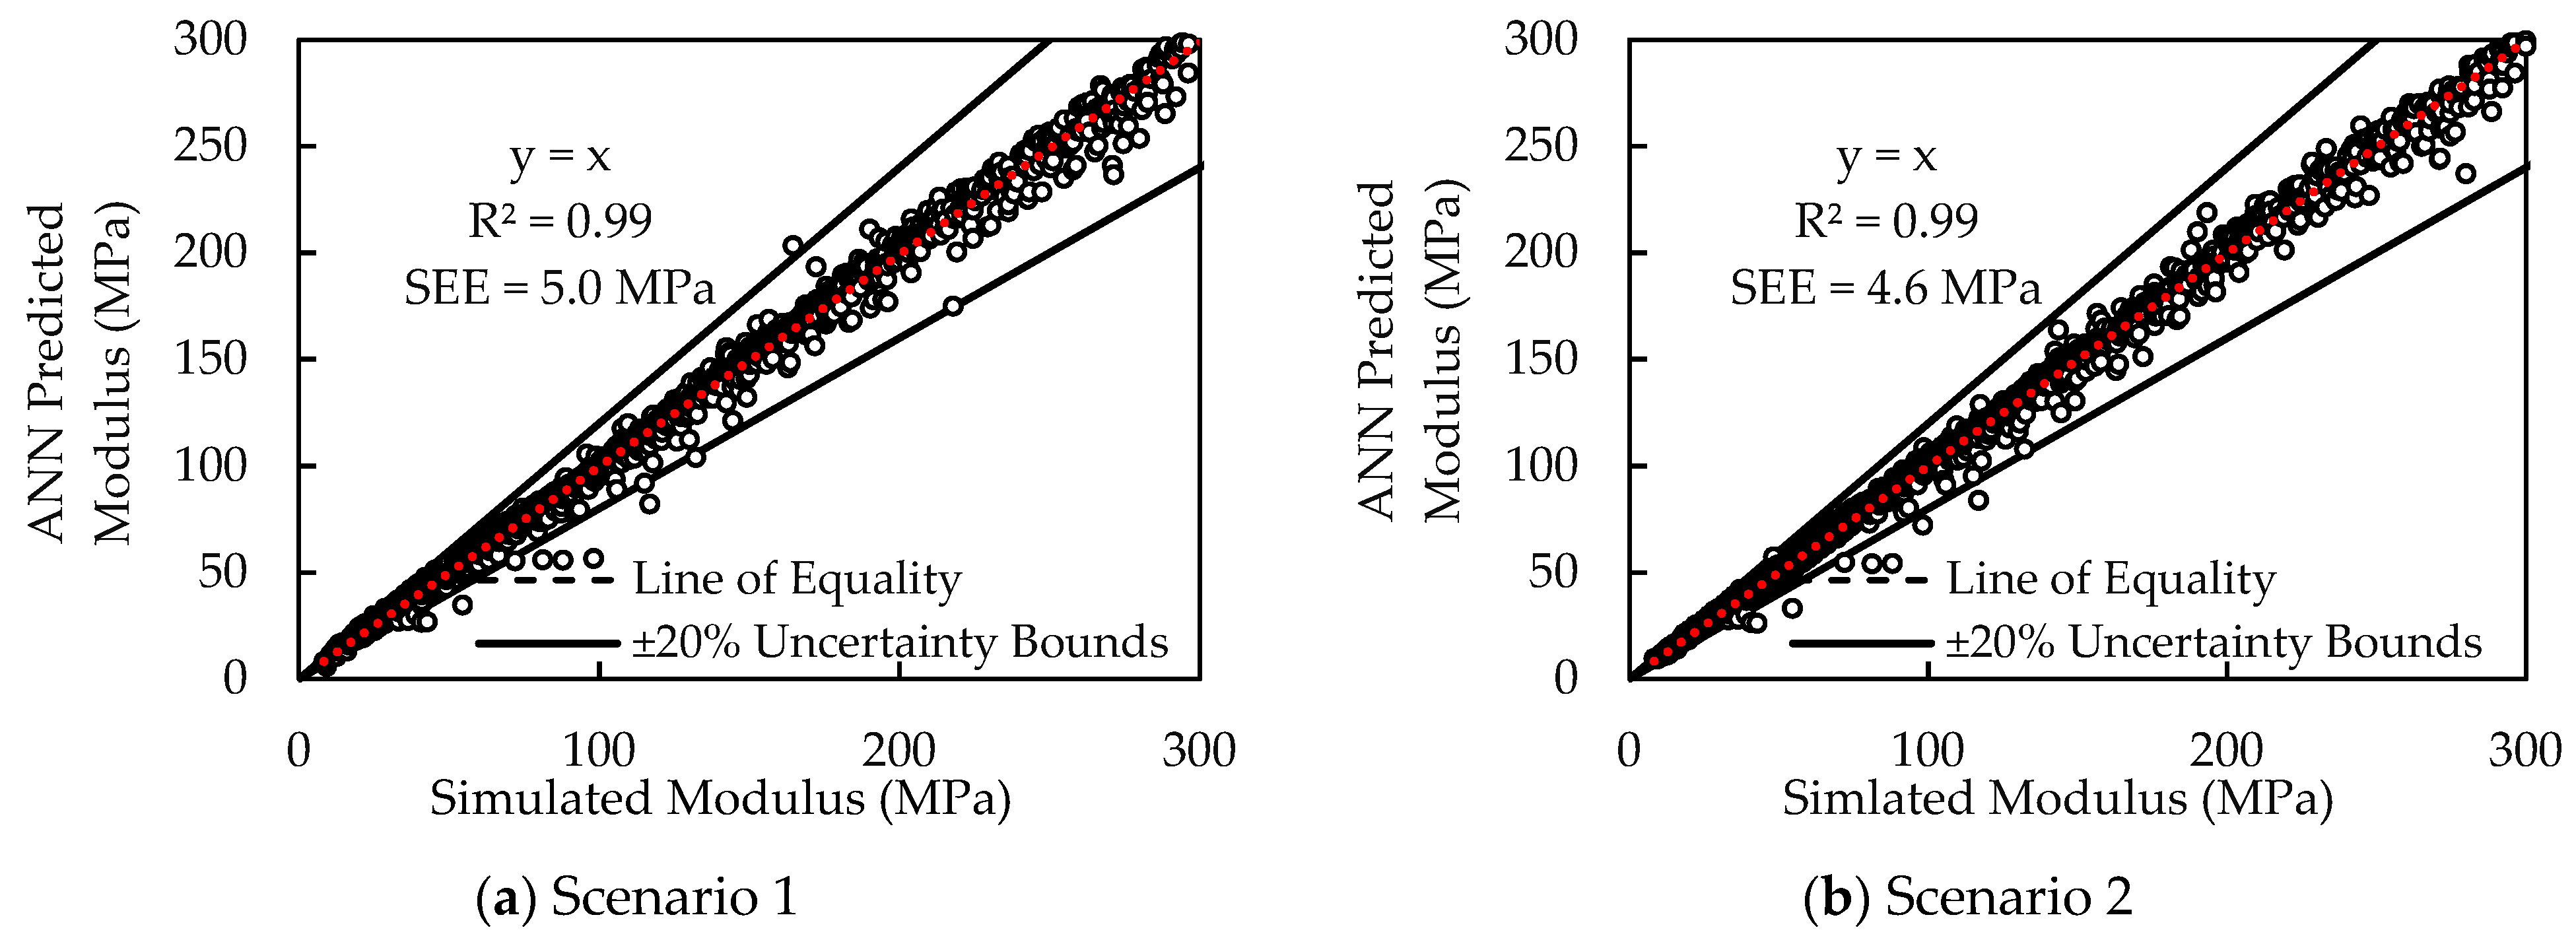
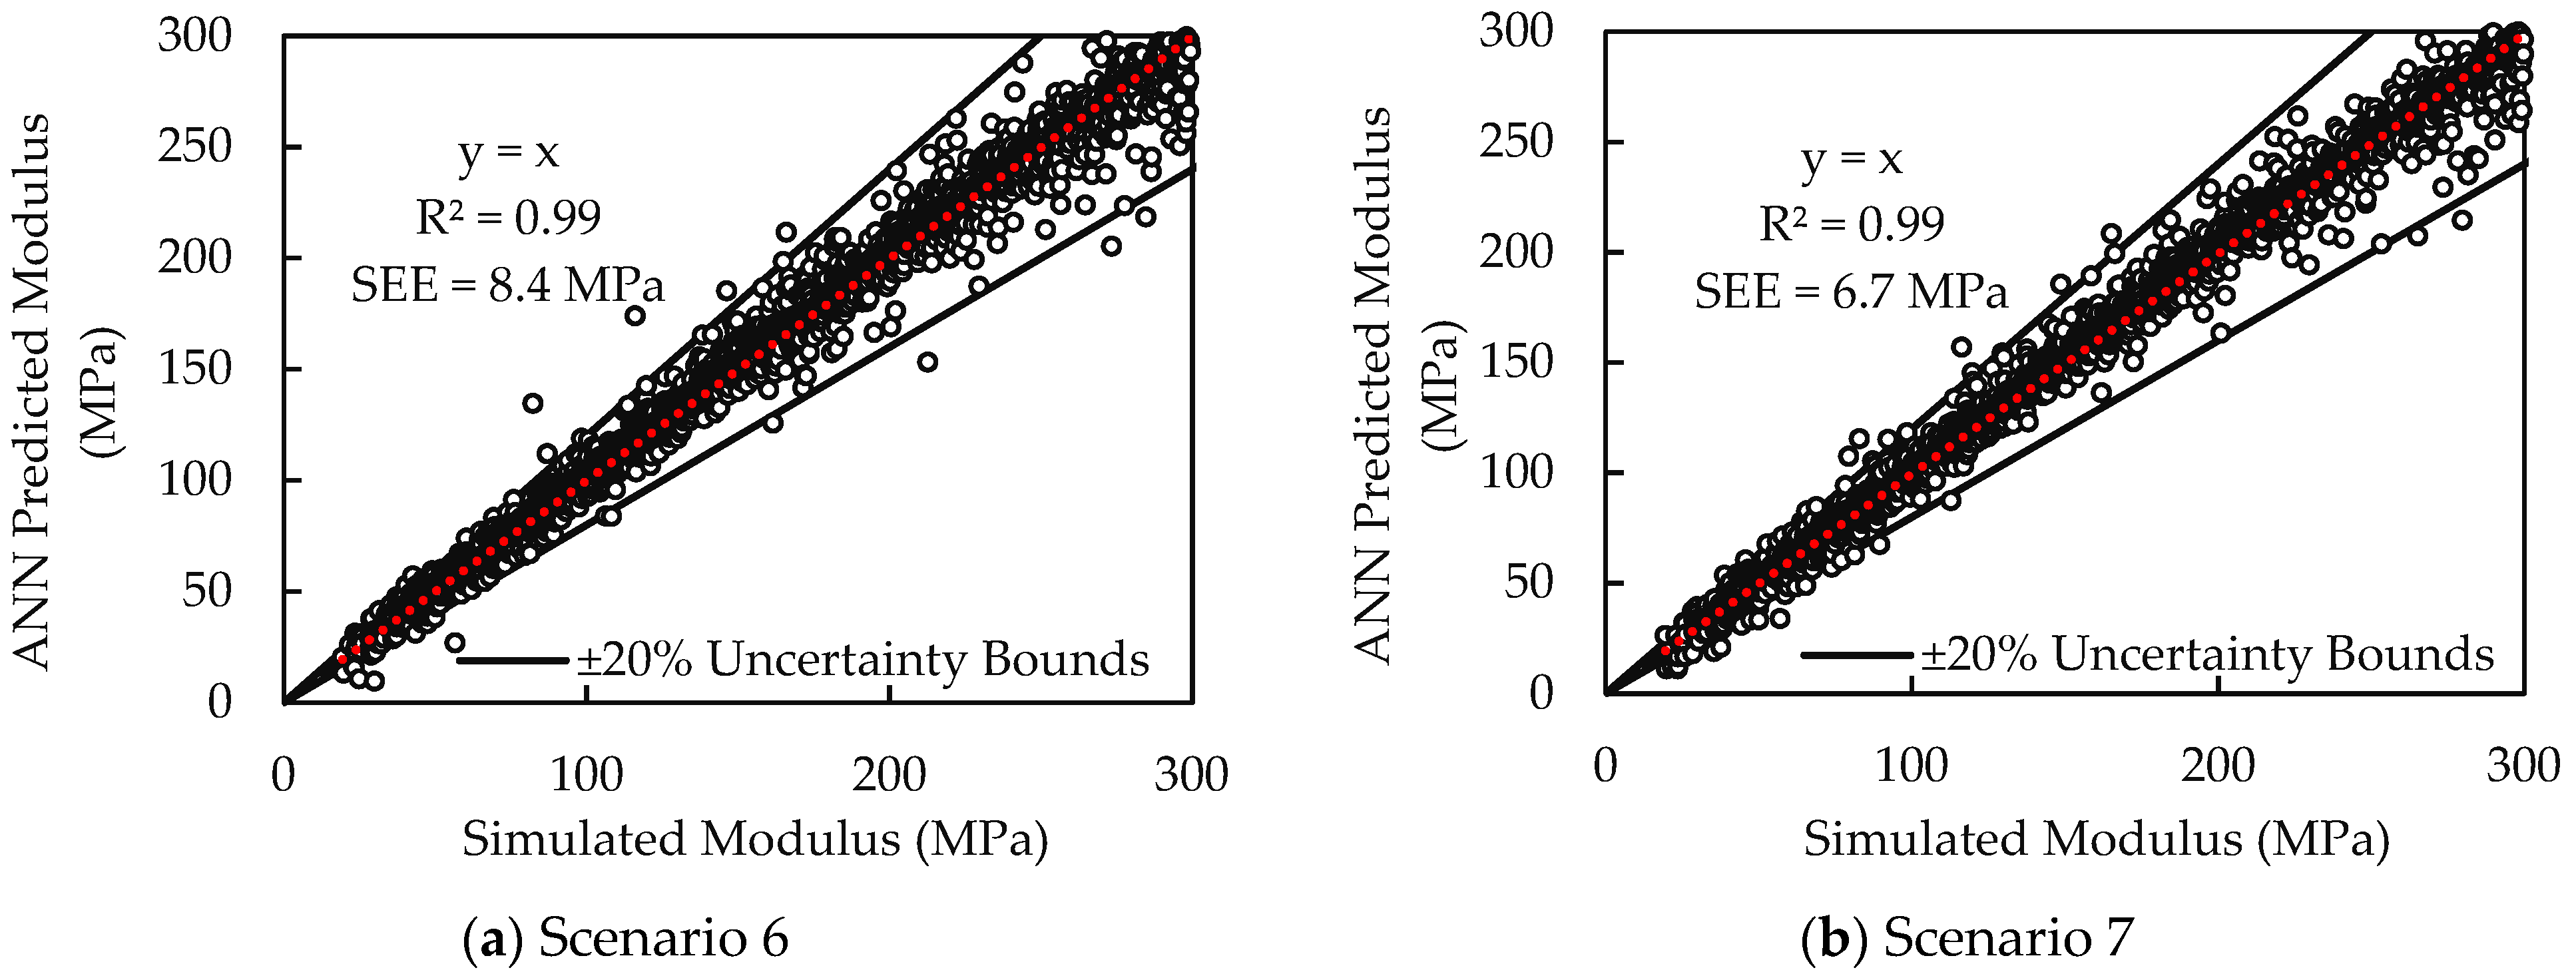
Figure 5 shows the results obtained from the ANN trained to backcalculate the subgrade modulus for the proposed Scenarios 1 and 2 in Table 3. Both scenarios can predict the subgrade modulus quite accurately. In this case, Scenario 1 is recommended because of its simplicity. In contrast to the single-layer systems, the backcalculation of the modulus of the base layer requires additional input parameters. The ANN models trained for Scenarios 3 through 5 for the two-layer systems were not as promising as Scenarios 6 and 7 were. The predictive powers of Scenarios 6 and 7 are shown in Figure 6. For the two-layer geosystems, Scenario 6 is preferred again because of its simplicity and the less laboratory effort.

5. Evaluation of Developed Models

Fathi et al. [31] proposed different strategies to calibrate numerical models simulating the proof-mapping process by developing adjustment factors to accommodate the differences between the field measurements and the numerical responses obtained from both linear and nonlinear 3-D finite element (FE) models. They incorporated a site-specific calibration process using LWD spot testing to adjust the stiffness conditions of the materials that were evaluated. The process that was followed to adapt the calibration process for the evaluation of the inverse models is discussed in this section.

5.1. Site Instrumentation and Data Collection

Four nominally 70-m long test sections constructed at the Minnesota Road Research Facility (MnROAD) were instrumented with embedded geophones, mapped using an IC roller, and evaluated using additional modulus and density-based testing. The material characteristics and properties of the layers at each test section are presented in Table 4. The test sections consisted of different subgrade and unbound aggregate base materials. Data collection for a single layer was conducted on top of the subgrade. Once the base was constructed on top of the subgrade, data were collected in order to consider the two-layered systems.
An IC roller with the operational characteristics shown in Table 5 was retrofitted with a data acquisition (DAQ) system to directly acquire the acceleration of the drum during the mapping of the compacted soil (see Figure 7). The DAQ system also incorporated a high-precision GPS unit and antenna to monitor the position of the roller’s accelerometers as the roller mapped the test section. LWD testing was conducted as per ASTM E2583 with a plate with a diameter of 200 mm in equally spaced spots along the length and width of the test section soon after the final coverage. In-place density and moisture content at each test point were also measured using a nuclear density gauge (NDG) as per ASTM D6938. The geomaterial sampled at each test point was tested as per ASTM D2216 to verify the moisture content obtained with the NDG.
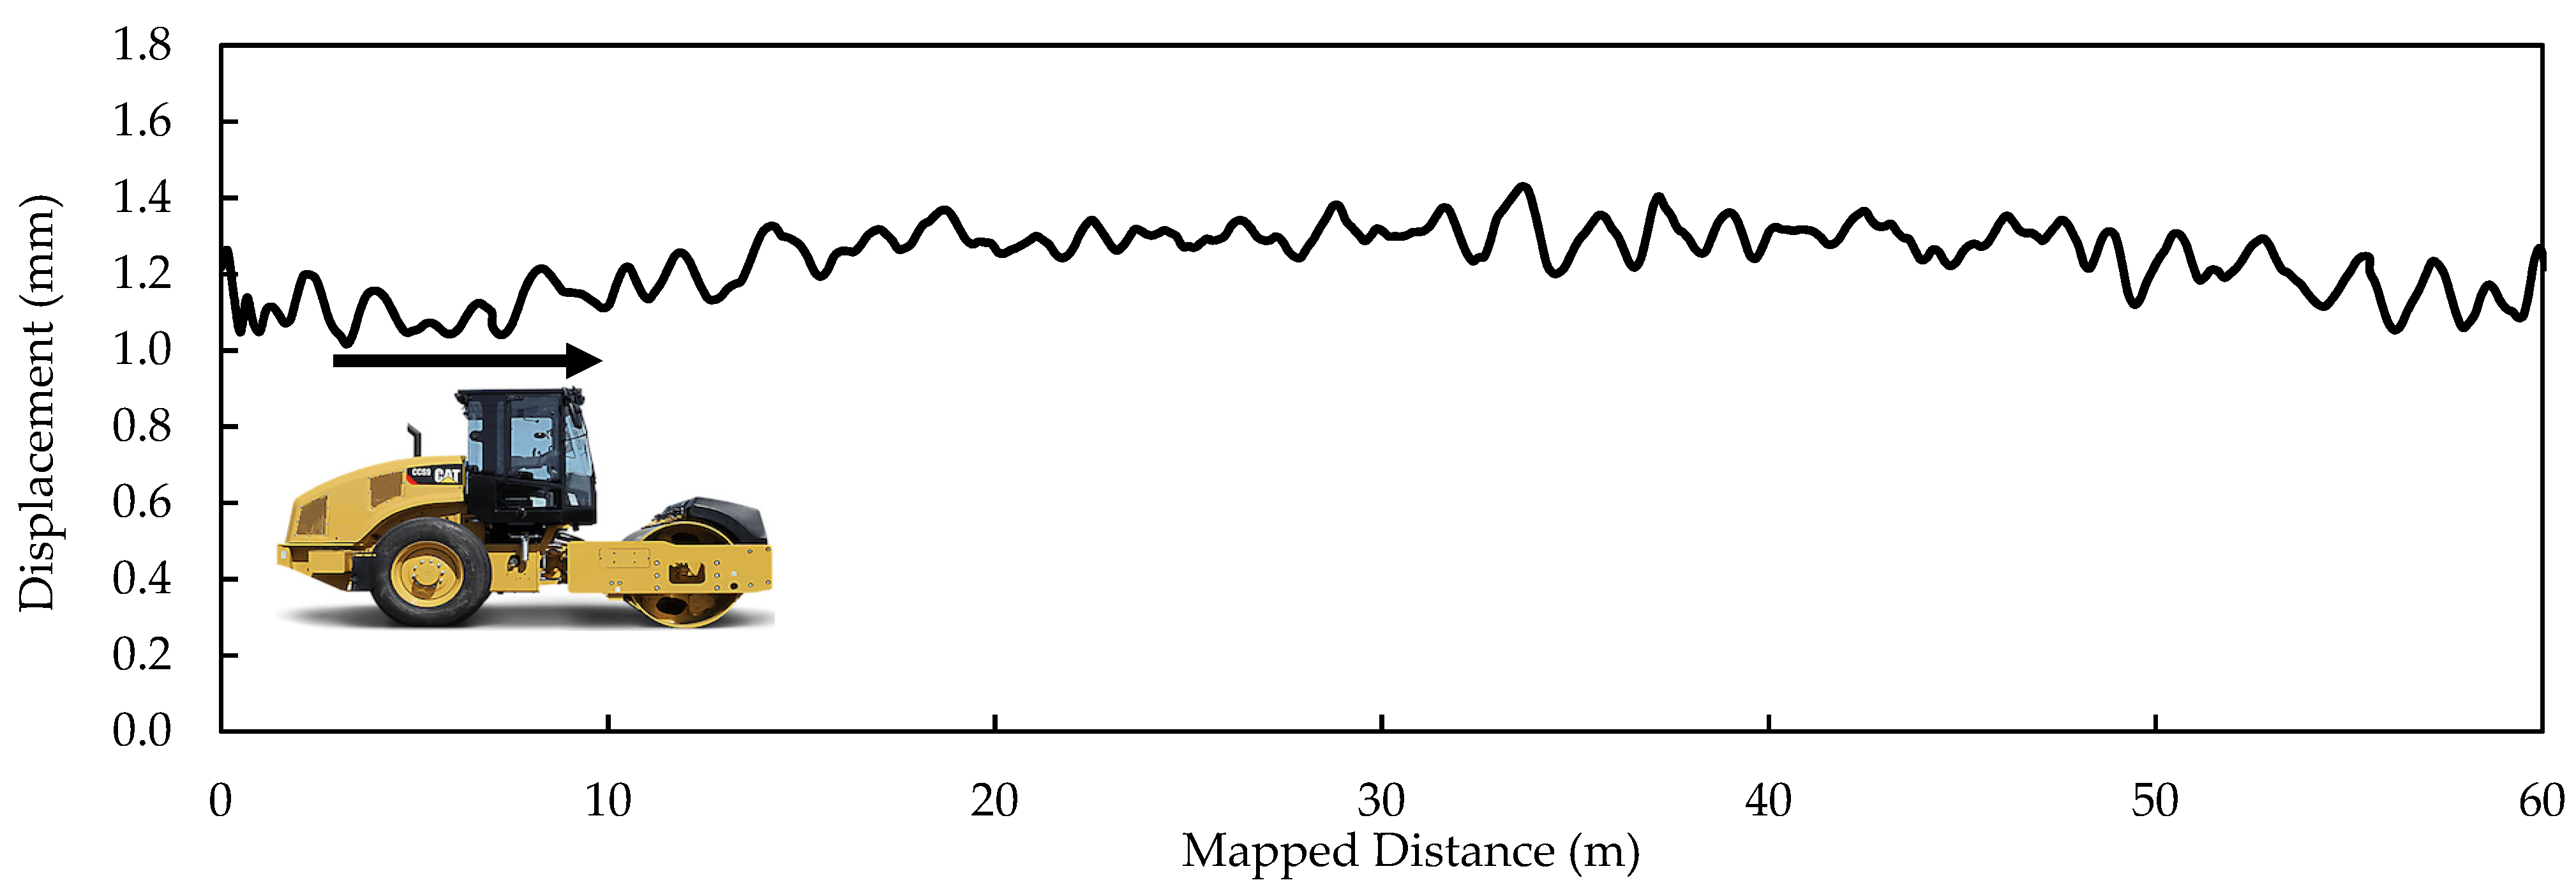
Figure 8 shows the displacement along a line roller pass as obtained during the proof-mapping of sand subgrade material at one of the test sections. The omega arithmetic (OA) method [32] was implemented to obtain the roller-induced displacements from the accelerometer-based measurements. This method requires the transformation of the time-based accelerometer measurements, x ¨ ( t ) , into the frequency domain using a fast Fourier transform (FFT) algorithm. Using the OA method, the displacement in the frequency domain can be found using:
X ( f ) = X ¨ ( f ) ( j ω ) 2 = X ¨ ( f ) ω 2 ,
where X ¨ ( f ) is the acceleration signal in the frequency domain, j = 1 , and ω is the angular frequency in rad/s. The displacement time signal, x(t), was obtained by using an inverse Fourier transform.
The measured ICMV data were then apportioned into virtual sublots with a width equal to the width of the roller and with a length equal to 7.5 m, as schematically depicted in Figure 7a. This approach can accommodate the inherent uncertainties related to the accuracy of the GPS devices and the precise position of the moving roller straightforwardly and transparently.
Table 6 contains the average in situ LWD modulus of each test section. As it is the state of the practice, the effective LWD modulus, ELWD, was obtained from the following equation, which is based on Boussinesq’s solution for a static load applied through a rigid circular plate on an elastic half-space:
E L W D = ( 1 υ 2 ) a σ 0 d · f ,
where ν = Poisson’s ratio, a = the radius of the plate, σ0 = the applied stress under the plate (210 kPa), the shape factor is f = π/2 for rigid plates, and d is the maximum displacement. The modulus of the unbound aggregate base layer was backcalculated through an iterative process. For that purpose, the LWD measurements on top of the base were conducted at precisely the same locations where the LWD measurements were conducted on top of the subgrade. The two LWD measurements along with the base layer thickness were used as inputs in the backcalculation algorithm.
Table 6 also contains the resilient modulus test results of the sampled material collected at the construction sites, which were performed as per AASHTO T307, at five moisture contents, including the optimum moisture content (OMC), OMC ± 1%, and OMC ± 2%, using a servo-dynamic MTS® load unit system.

5.2. Evaluation of Inverse Solvers

In addition to the average drum displacements from the mapping of the subgrade, d1, and base, d2, the inputs to the inverse solvers were the information from the resilient modulus tests and base layer thicknesses (as shown in Table 3). Figure 9 illustrates the variations in the nonlinear parameters k2 and k3 with the moisture content for the clayey subgrade at Section 3 and Section 4 along with the measured and the estimated values for each sublot. The last parameter to be incorporated into the inverse model was the nonlinear parameter k1 (associated with stiffness). Mazari et al. [33] showed that although the nonlinear parameters k2 and k3 can be deployed in a numerical simulation to appropriately quantify the load-induced stress hardening and strain-softening behaviors of the geomaterials, parameter k1 must be adjusted to accommodate the differences between the laboratory and field conditions. In this study the adjusted k1, k1-adj, was obtained using the following equation, which is a rearrangement of Equation (1):
k 1 a d j = E L W D P a   ( θ P a + 1 ) k 2 ( τ o c t P a + 1 ) k 3 ,
The k1-adj parameter not only incorporates the state of compaction corresponding to the field conditions, it also, to some extent incorporates, the impact of the variation in moisture content observed in the field into the analysis.
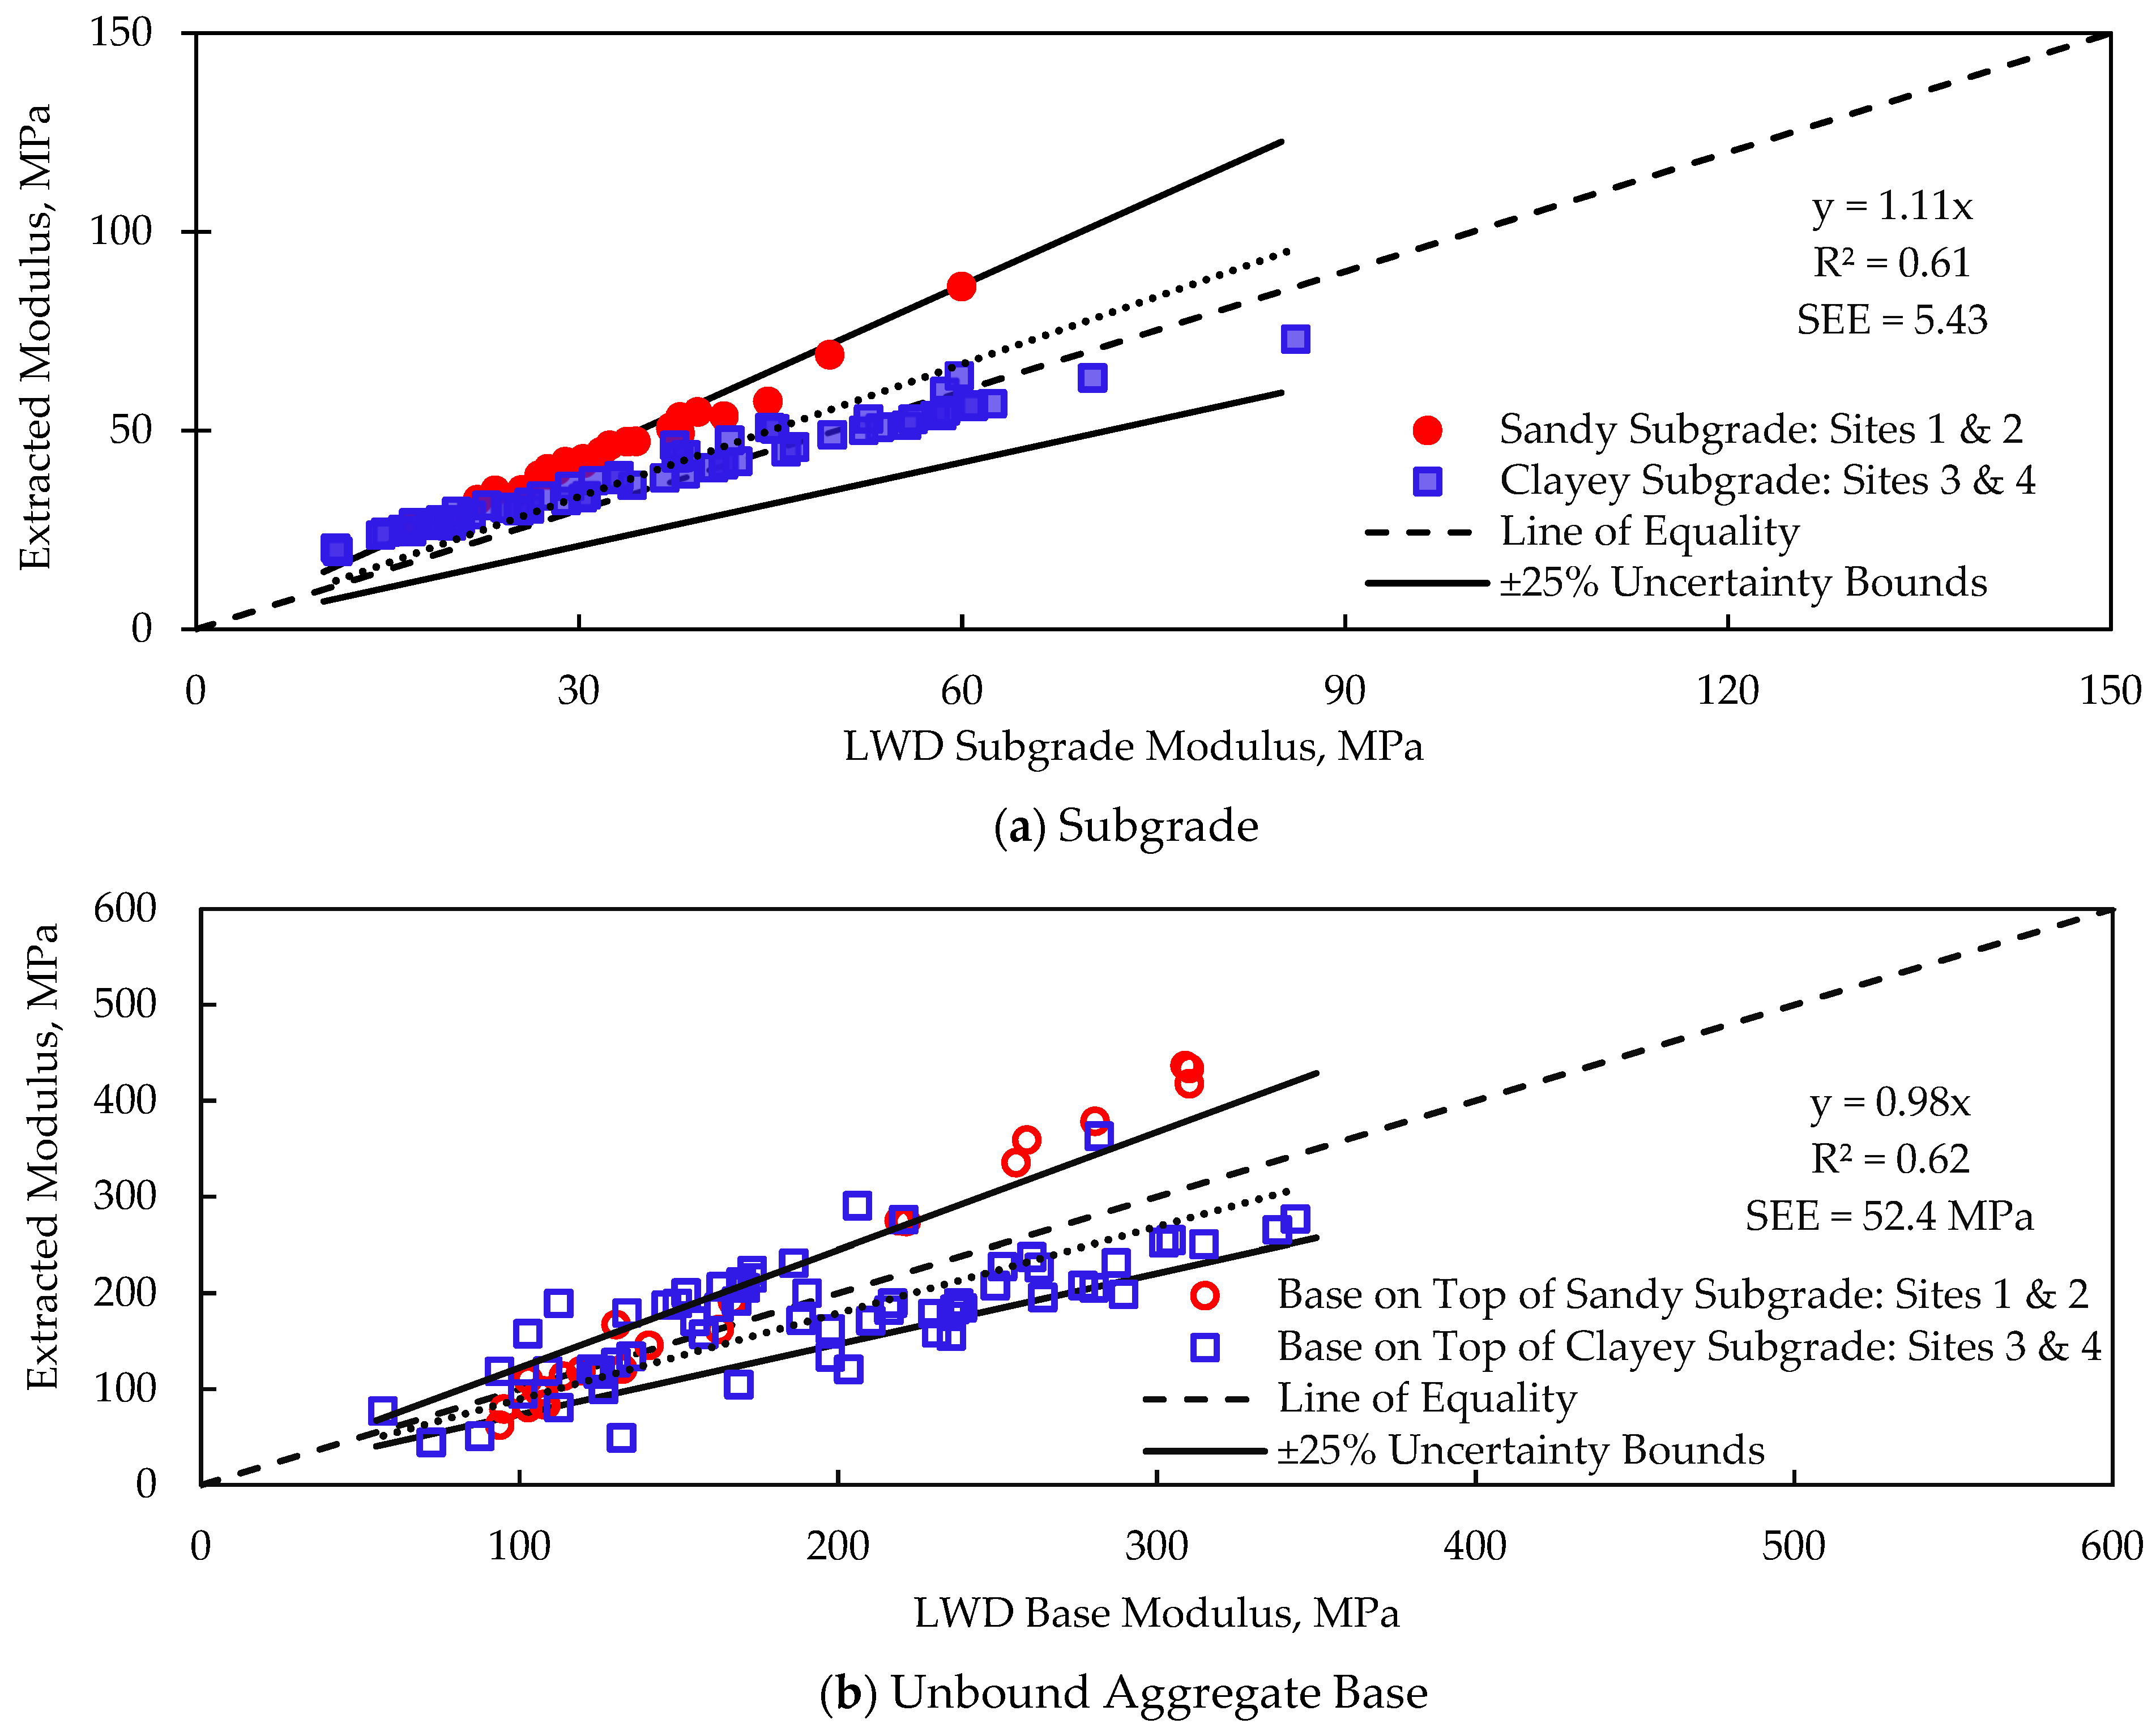
The modulus for each sublot as obtained from the inverse solver is compared with their corresponding sublot’s LWD modulus, ELWD, in Figure 10 for Sections 1 through 4. Figure 10a shows the results corresponding to the sandy and clayey subgrade. The inverse solver can predict the modulus of the subgrade with reasonable accuracy. Similar to the subgrade, the nonlinear parameters in conjunction with the roller surface displacements on top of the subgrade and base layers were used as inputs to the inverse solver to extract the base modulus. The extracted base moduli compared well with the corresponding LWD base moduli, as shown in Figure 10b, as judged by the number of cases that fall within the ±25% uncertainty bounds.

6. Validation of Developed Models

Four additional construction sites were visited to collect field and laboratory data to validate the practicality of the developed inverse algorithms. The characteristics of the test sites, the material properties of the layers, and the type of roller that was used are shown in Table 7. The operating settings of the rollers used in this phase are shown in Table 8. The results from the evaluation of the two ANN inverse solvers that were considered optimal (i.e., from Scenario 1 for subgrade materials and Scenario 6 for two-layer geosystems) are presented here. At each construction site, a strip about 70 m in length and that was 8 m wide was reserved as a test section where the compacted geomaterials were proof-mapped using instrumented IC rollers. The LWD tests were conducted along the test section after proof-mapping following the approach described in the previous section. At each sublot, the geomaterial was sampled to measure the in situ moisture content through oven-drying in the laboratory.
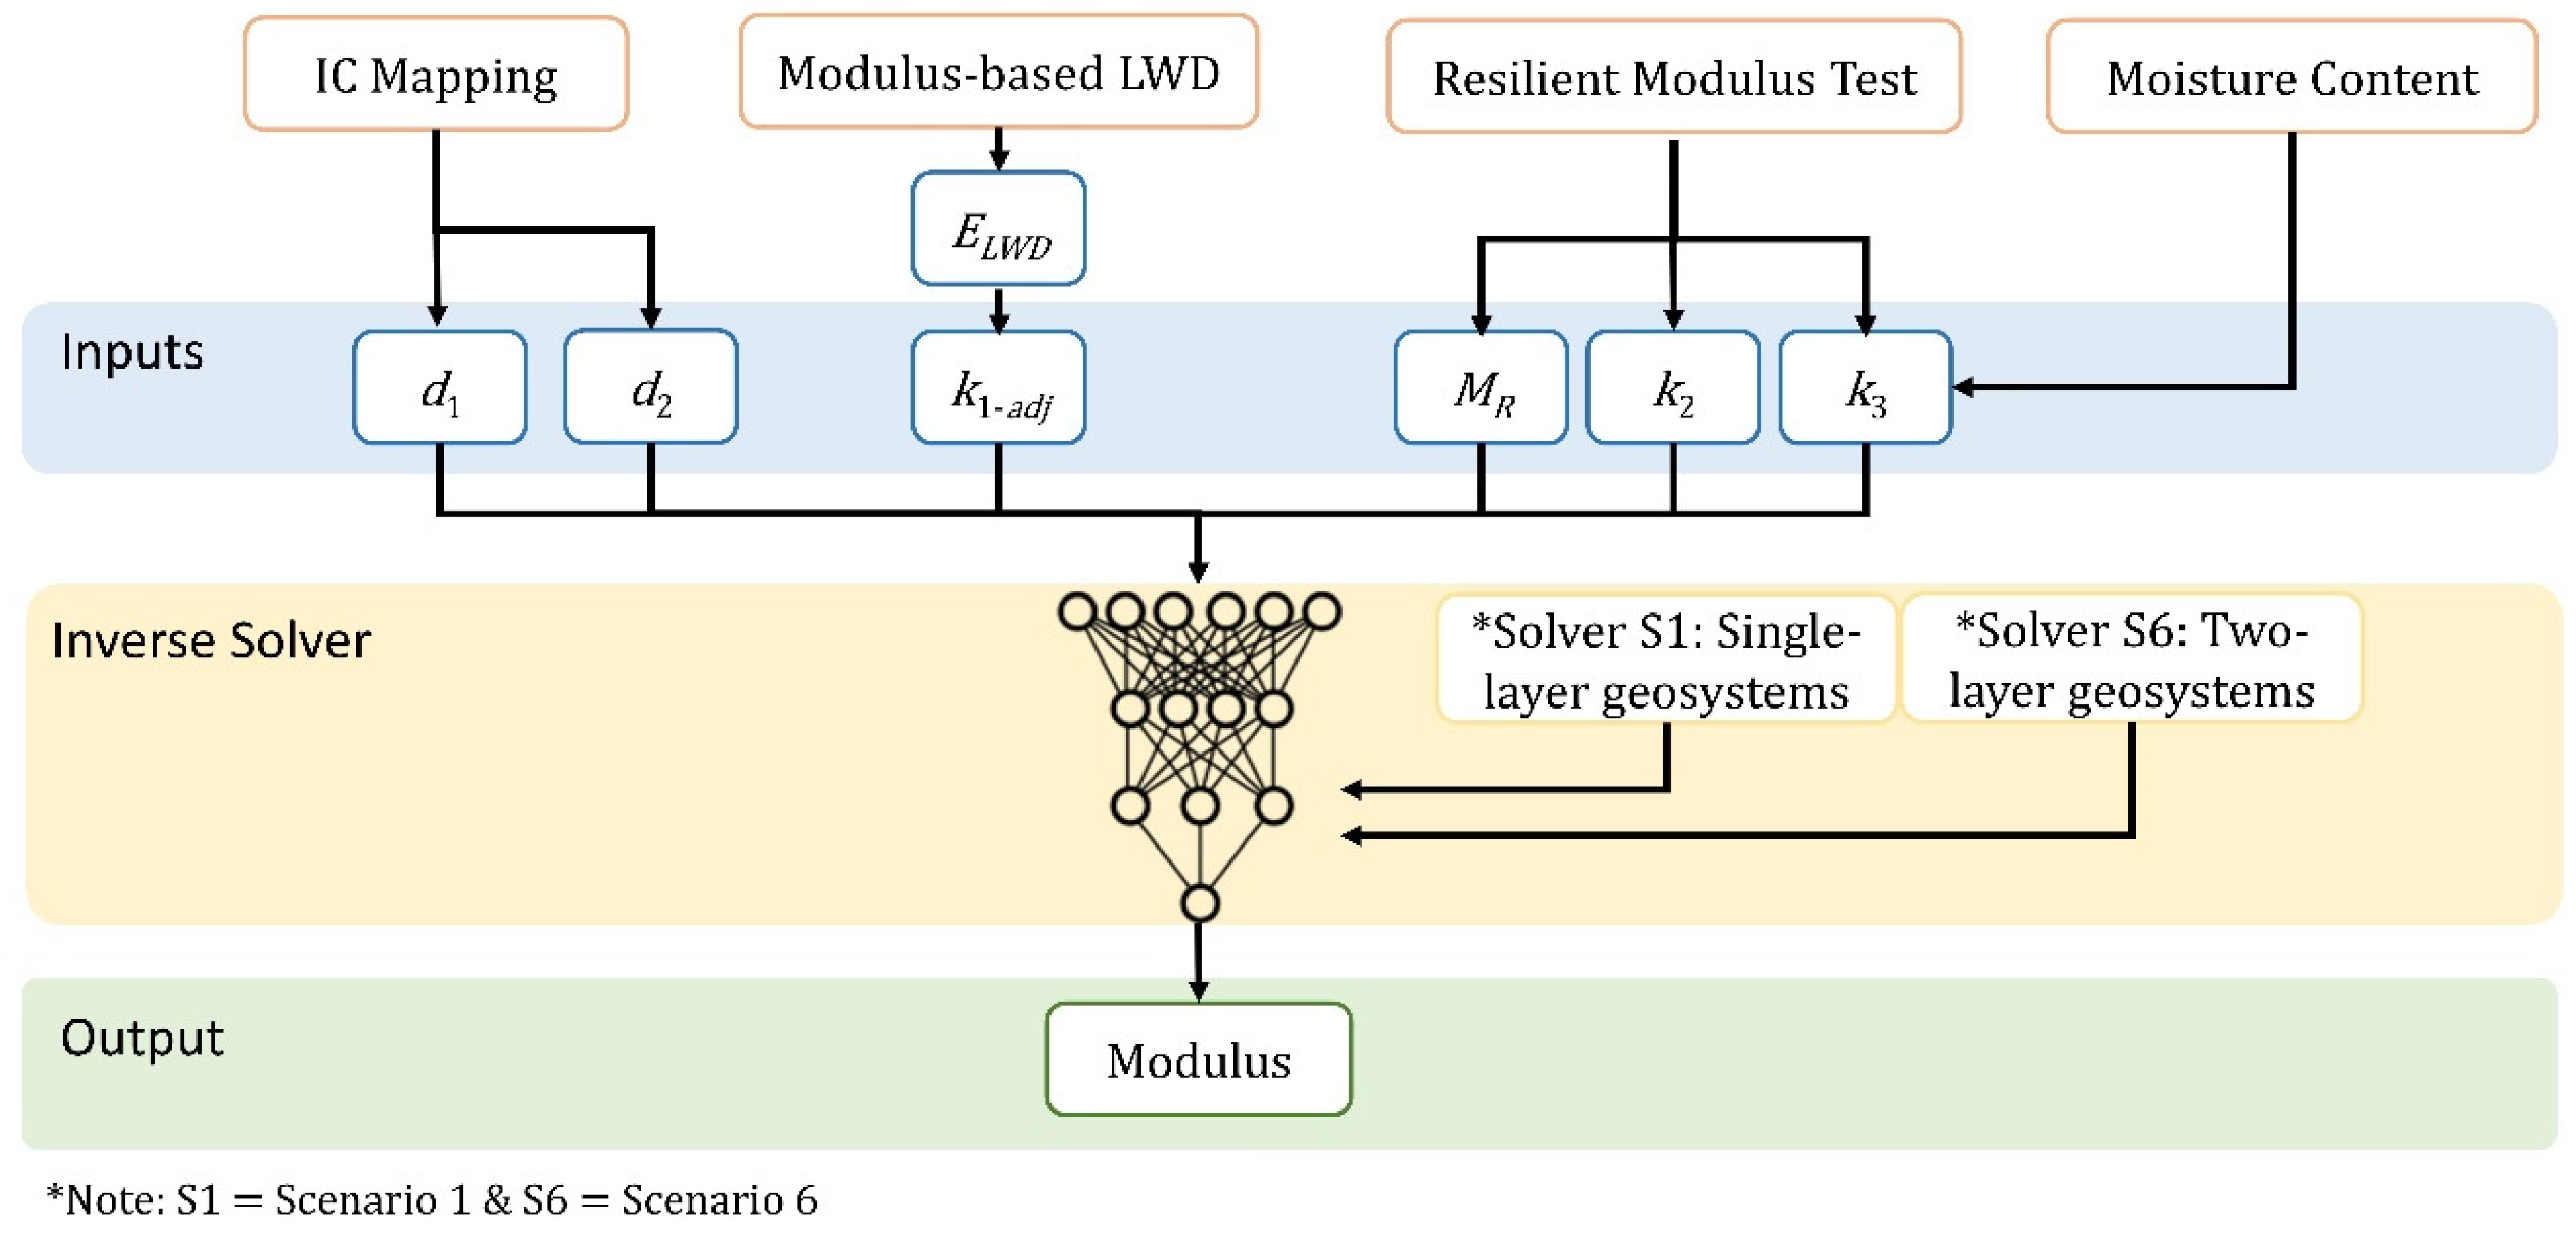
Similar to the testing plan conducted at the MnROAD facility to calibrate the models, virtual sublots with widths equal to the width of the roller and lengths of 7 m, which are schematically depicted in Figure 7a, were allocated along the test section. Inputs to the inverse solvers and their output are schematically represented in Figure 11. The inputs consisted of the nonlinear parameters obtained from the resilient modulus test, the surface deflection measurements of the drum for each sublot obtained during the mapping process, the top layer thickness (for Scenario 6 in two-layered systems), and the adjusted k1-adj using the LWD modulus.
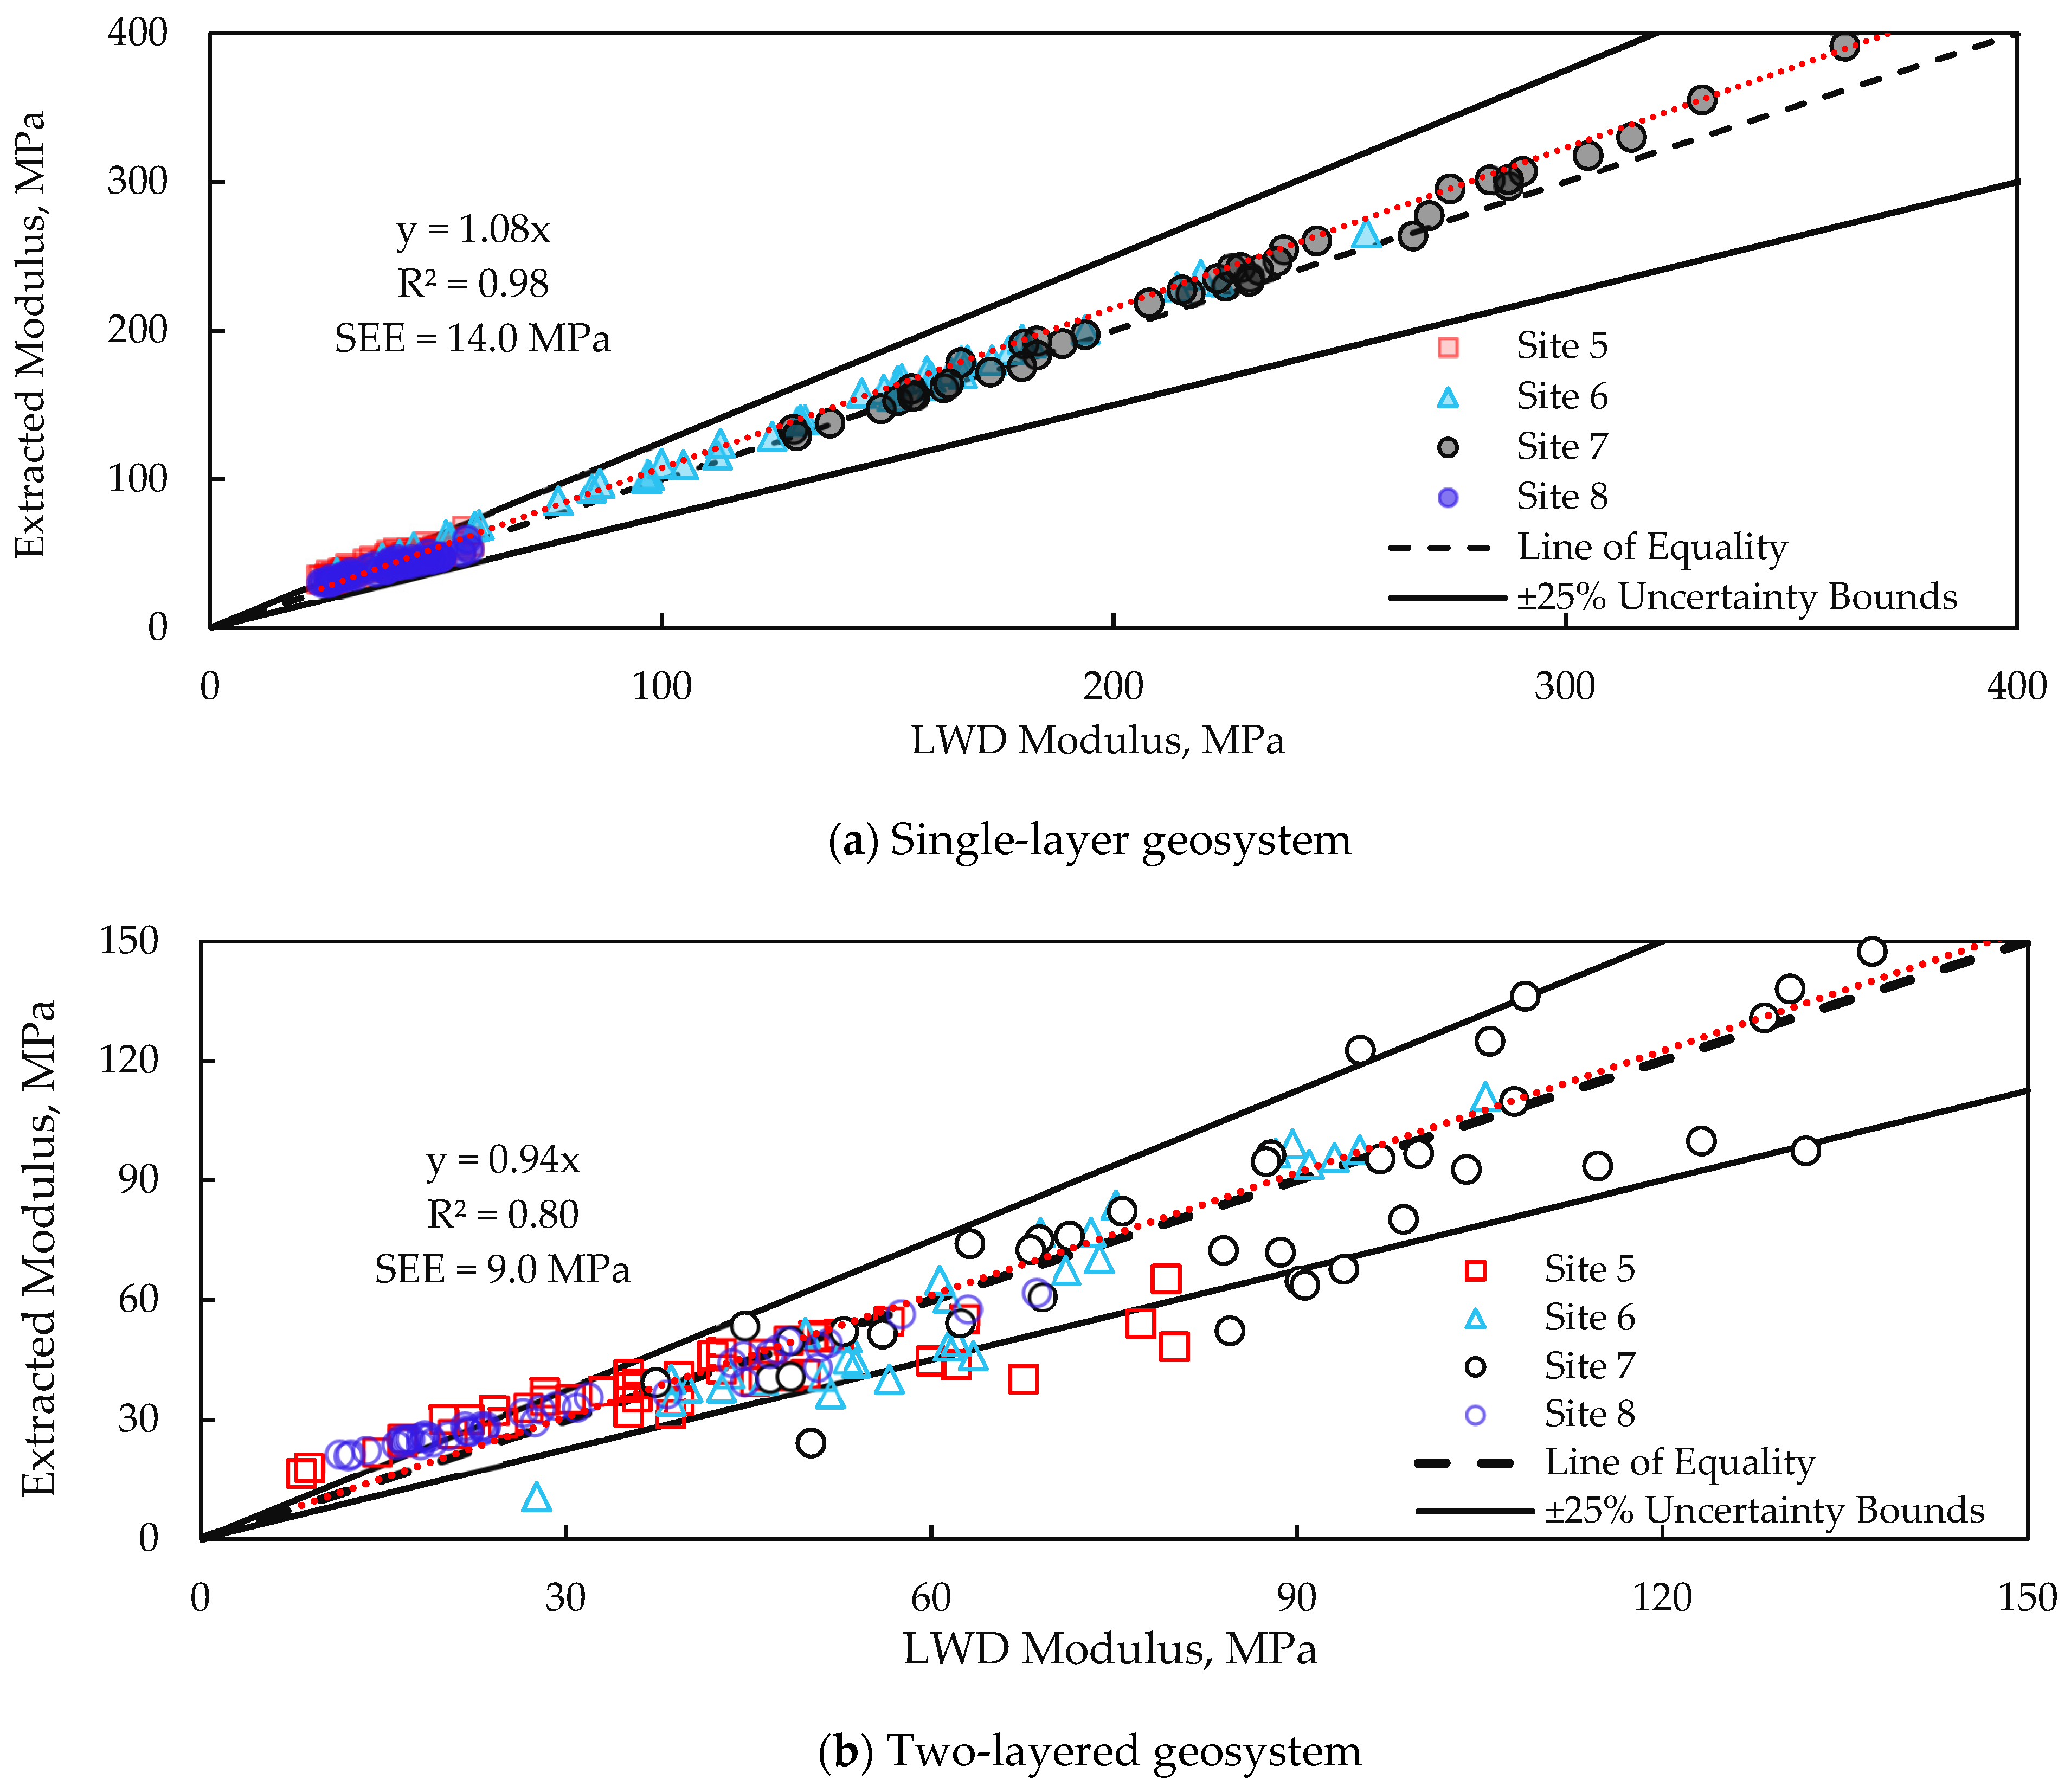
Table 9 contains the average LWD modulus and surface displacements for each test section. The information extracted from the resilient modulus tests at OMC for each geomaterial retrieved from each test section is also summarized in Table 9. The comparison of the moduli measured and estimated from the ANN inverse solver for each sublot obtained on top of the subgrade for test sections 5 through 8 is shown in Figure 12a. The inverse solver was able to estimate the modulus of the single-layered geosystems within a margin of error of 25% or less, a level deemed acceptable given the variability in the properties and compaction of earthwork in each sublot. Figure 12b compares the LWD moduli of the top layers with those estimated from the ANN solver. In this case, in addition to the nonlinear parameters obtained from the resilient modulus tests conducted in the laboratory, the surface displacements measured on top of both the single- and two-layer systems of each sublot were used as inputs. The inverse model was able to extract the modulus with less accuracy than the single-layer inverse model, but most values still fell within the ±25% error bands. At some of the test sections, the bottom layers were stiffer than the top layers, as suggested by the resilient modulus and backcalculated LWD tests, which may contribute to the additional variability in the outcome of the model. Nevertheless, the results prove that the proposed approach and inverse models can achieve modulus prediction using IC in combination with the resilient modulus and in situ modulus-based testing.

7. Implementation of Models

Since an extensive testing program is impractical in day-to-day operations, the minimum number of spot tests that can be completed with LWD and its impact on the outcome of the model were also assessed by considering the inevitable inherent variability of the compacted geomaterial.
Based on substantial field data from several construction projects, Tirado et al. [6] concluded that a 25% COV in the properties of the compacted geomaterials should be anticipated even under the best practices followed by construction crews. As such, they indicated that the sublots with COV of ICMVs of up to 35% might be anticipated under the state of the practice. However, the sublots with high COVs should be reprocessed for a more uniform foundation layer. Based on that observation, they proposed a process for quality management that not only considers the average ICMV of each sublot but also its coefficient of variation (COV).
Figure 13a shows a color-coded map of the average ICMV of each sublot obtained after proof rolling the subgrade of Section 5. This study made use of CMV, a common ICMV defined as [21]:
C M V = 300 A 2 Ω A Ω ,
where A is the second harmonic of the vertical drum acceleration amplitude, and AΩ is the operating frequency of the vertical drum acceleration amplitude. A three-color scheme was used to represent the results, where red corresponds to the sublots with less stiff properties (signified by average CMVs that are less than 75% of the average CMV of the entire lot). It is important to note that less stiff does not mean that a layer is unacceptably weak/loose, rather it means that those sublots exhibit lower CMV than the others. In addition to the CMV map, as depicted in Figure 13b, the degree of compaction uniformity in each sublot is also assessed by developing a color-coded companion map of COV of the ICMVs within each sublot. Sublots with a COV of CMV exceeding 35% (shown in red) signify a less uniform final product. Based on the laws of statistics, one may need to conduct a large number of LWD tests to obtain the representative moduli of the sublots with high nonuniformity (COV) or to conduct local calibration on a limited number of sublots that are more uniform.
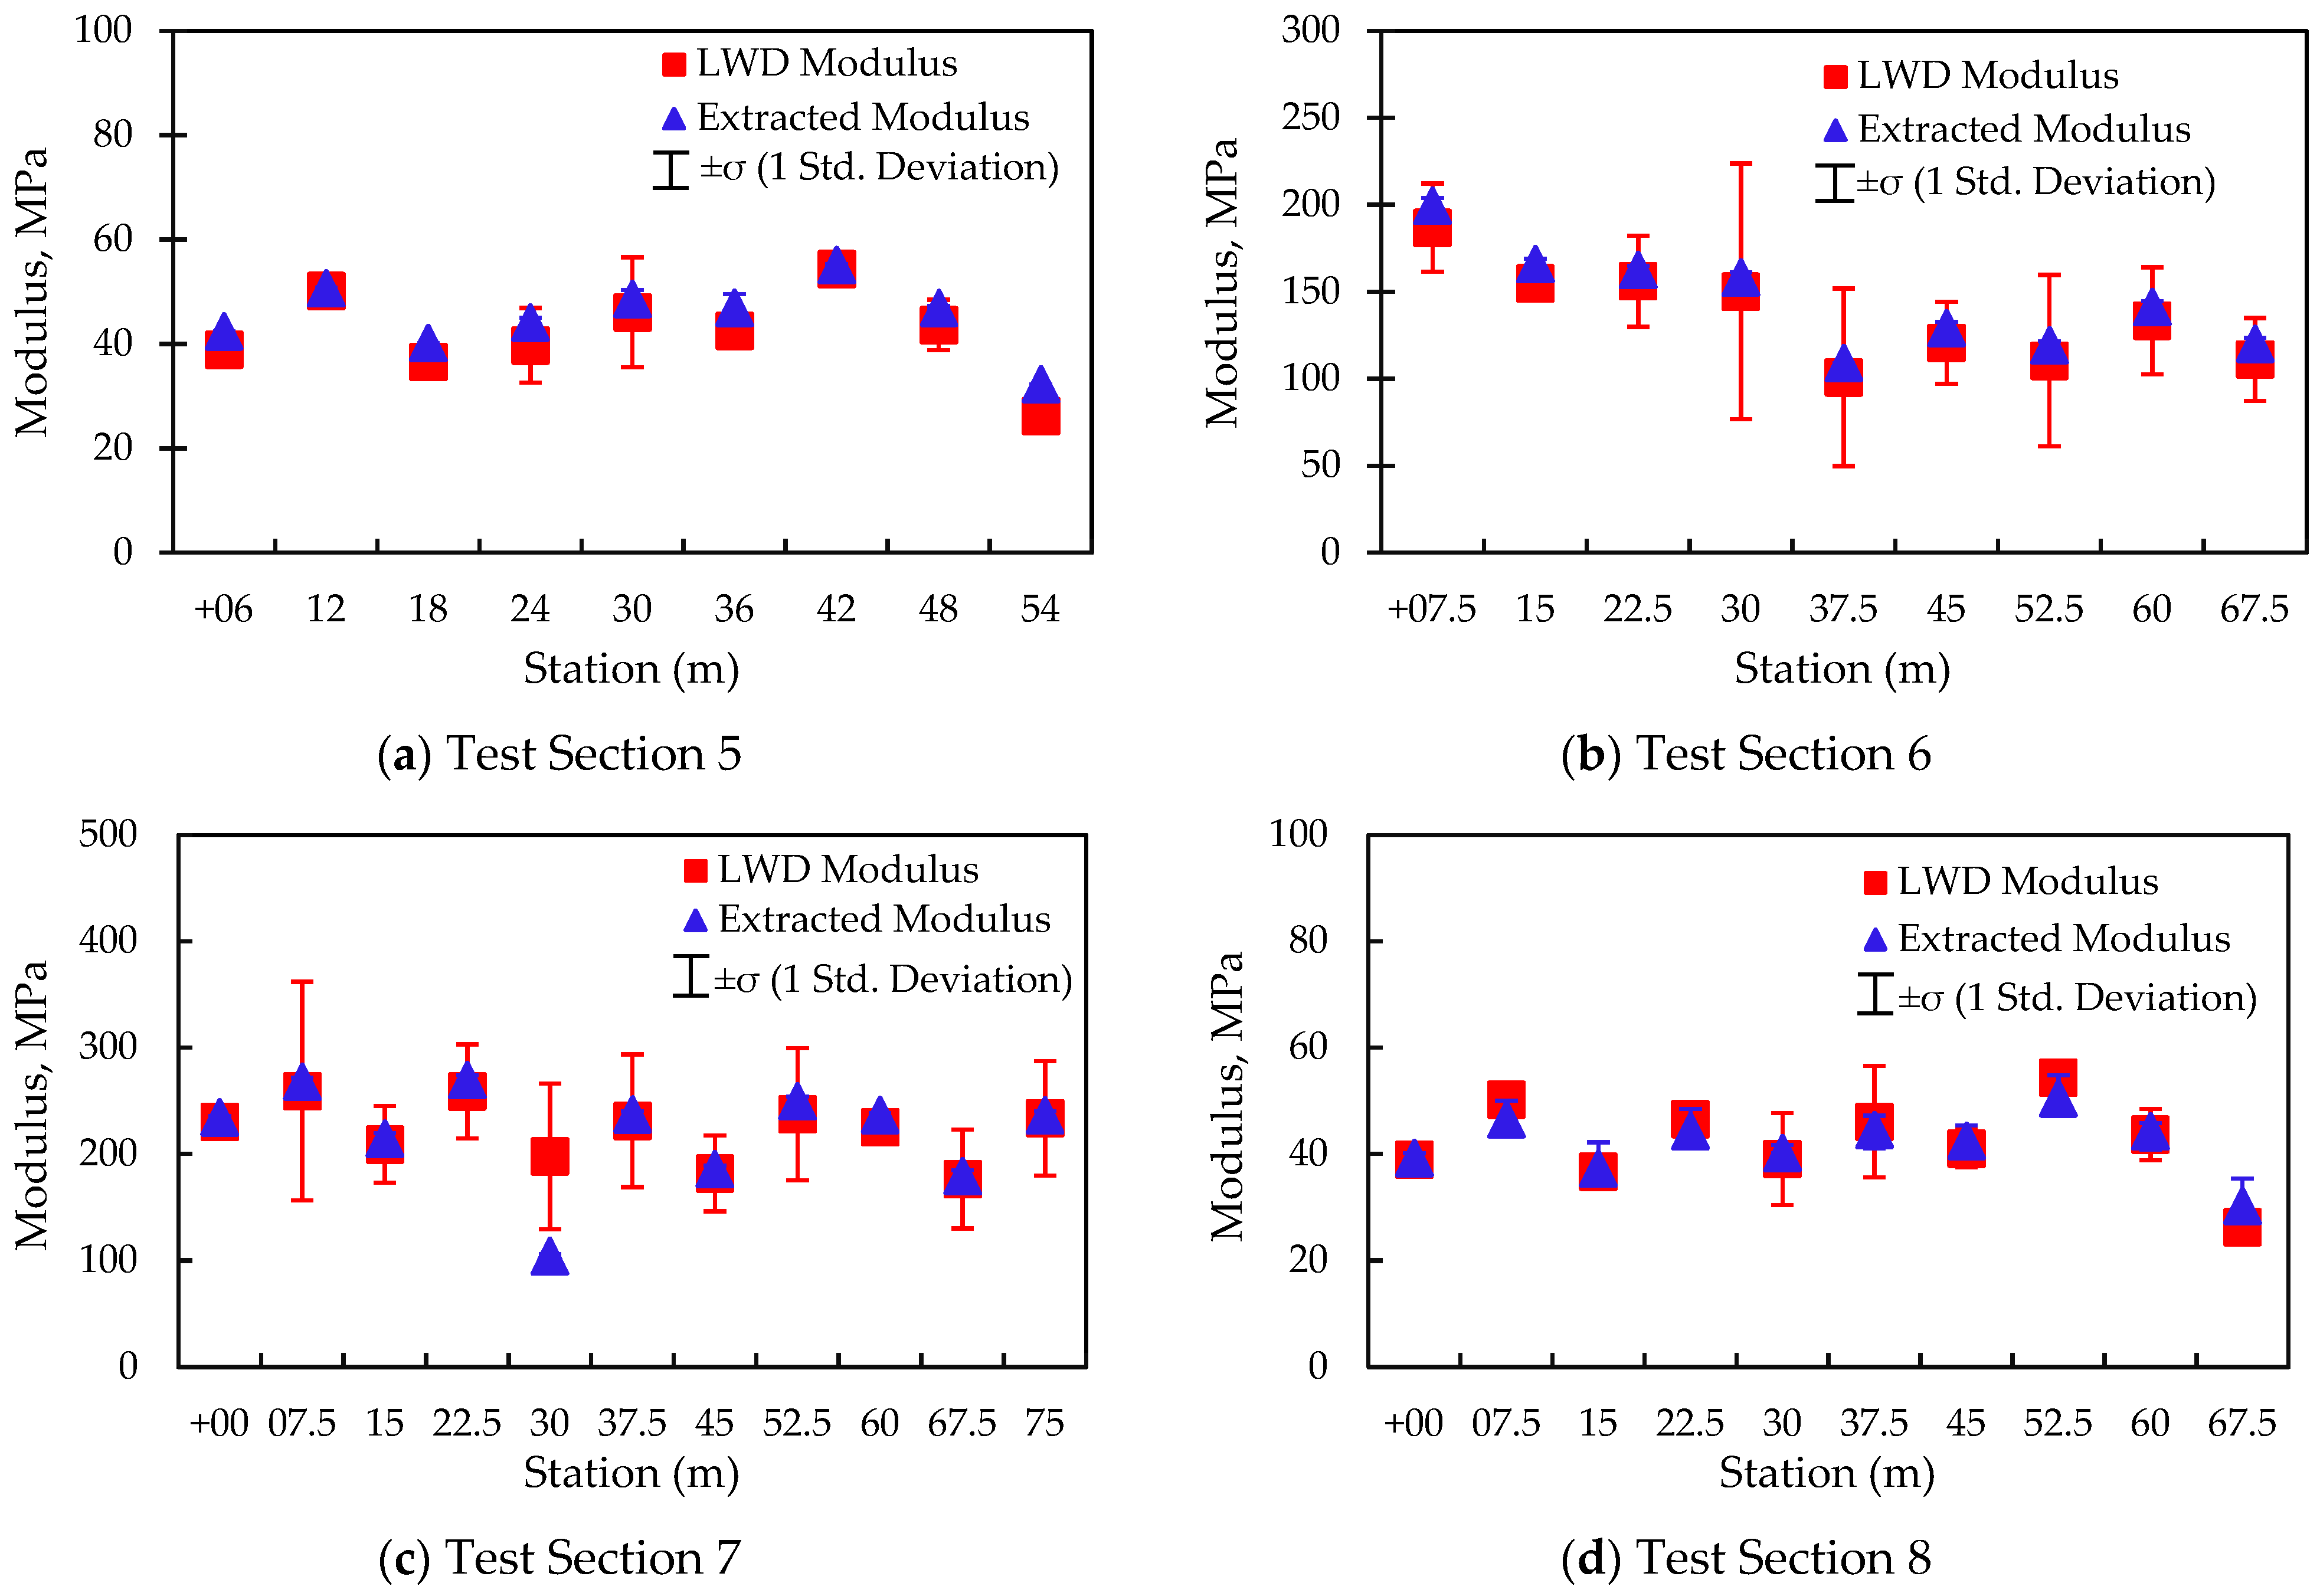
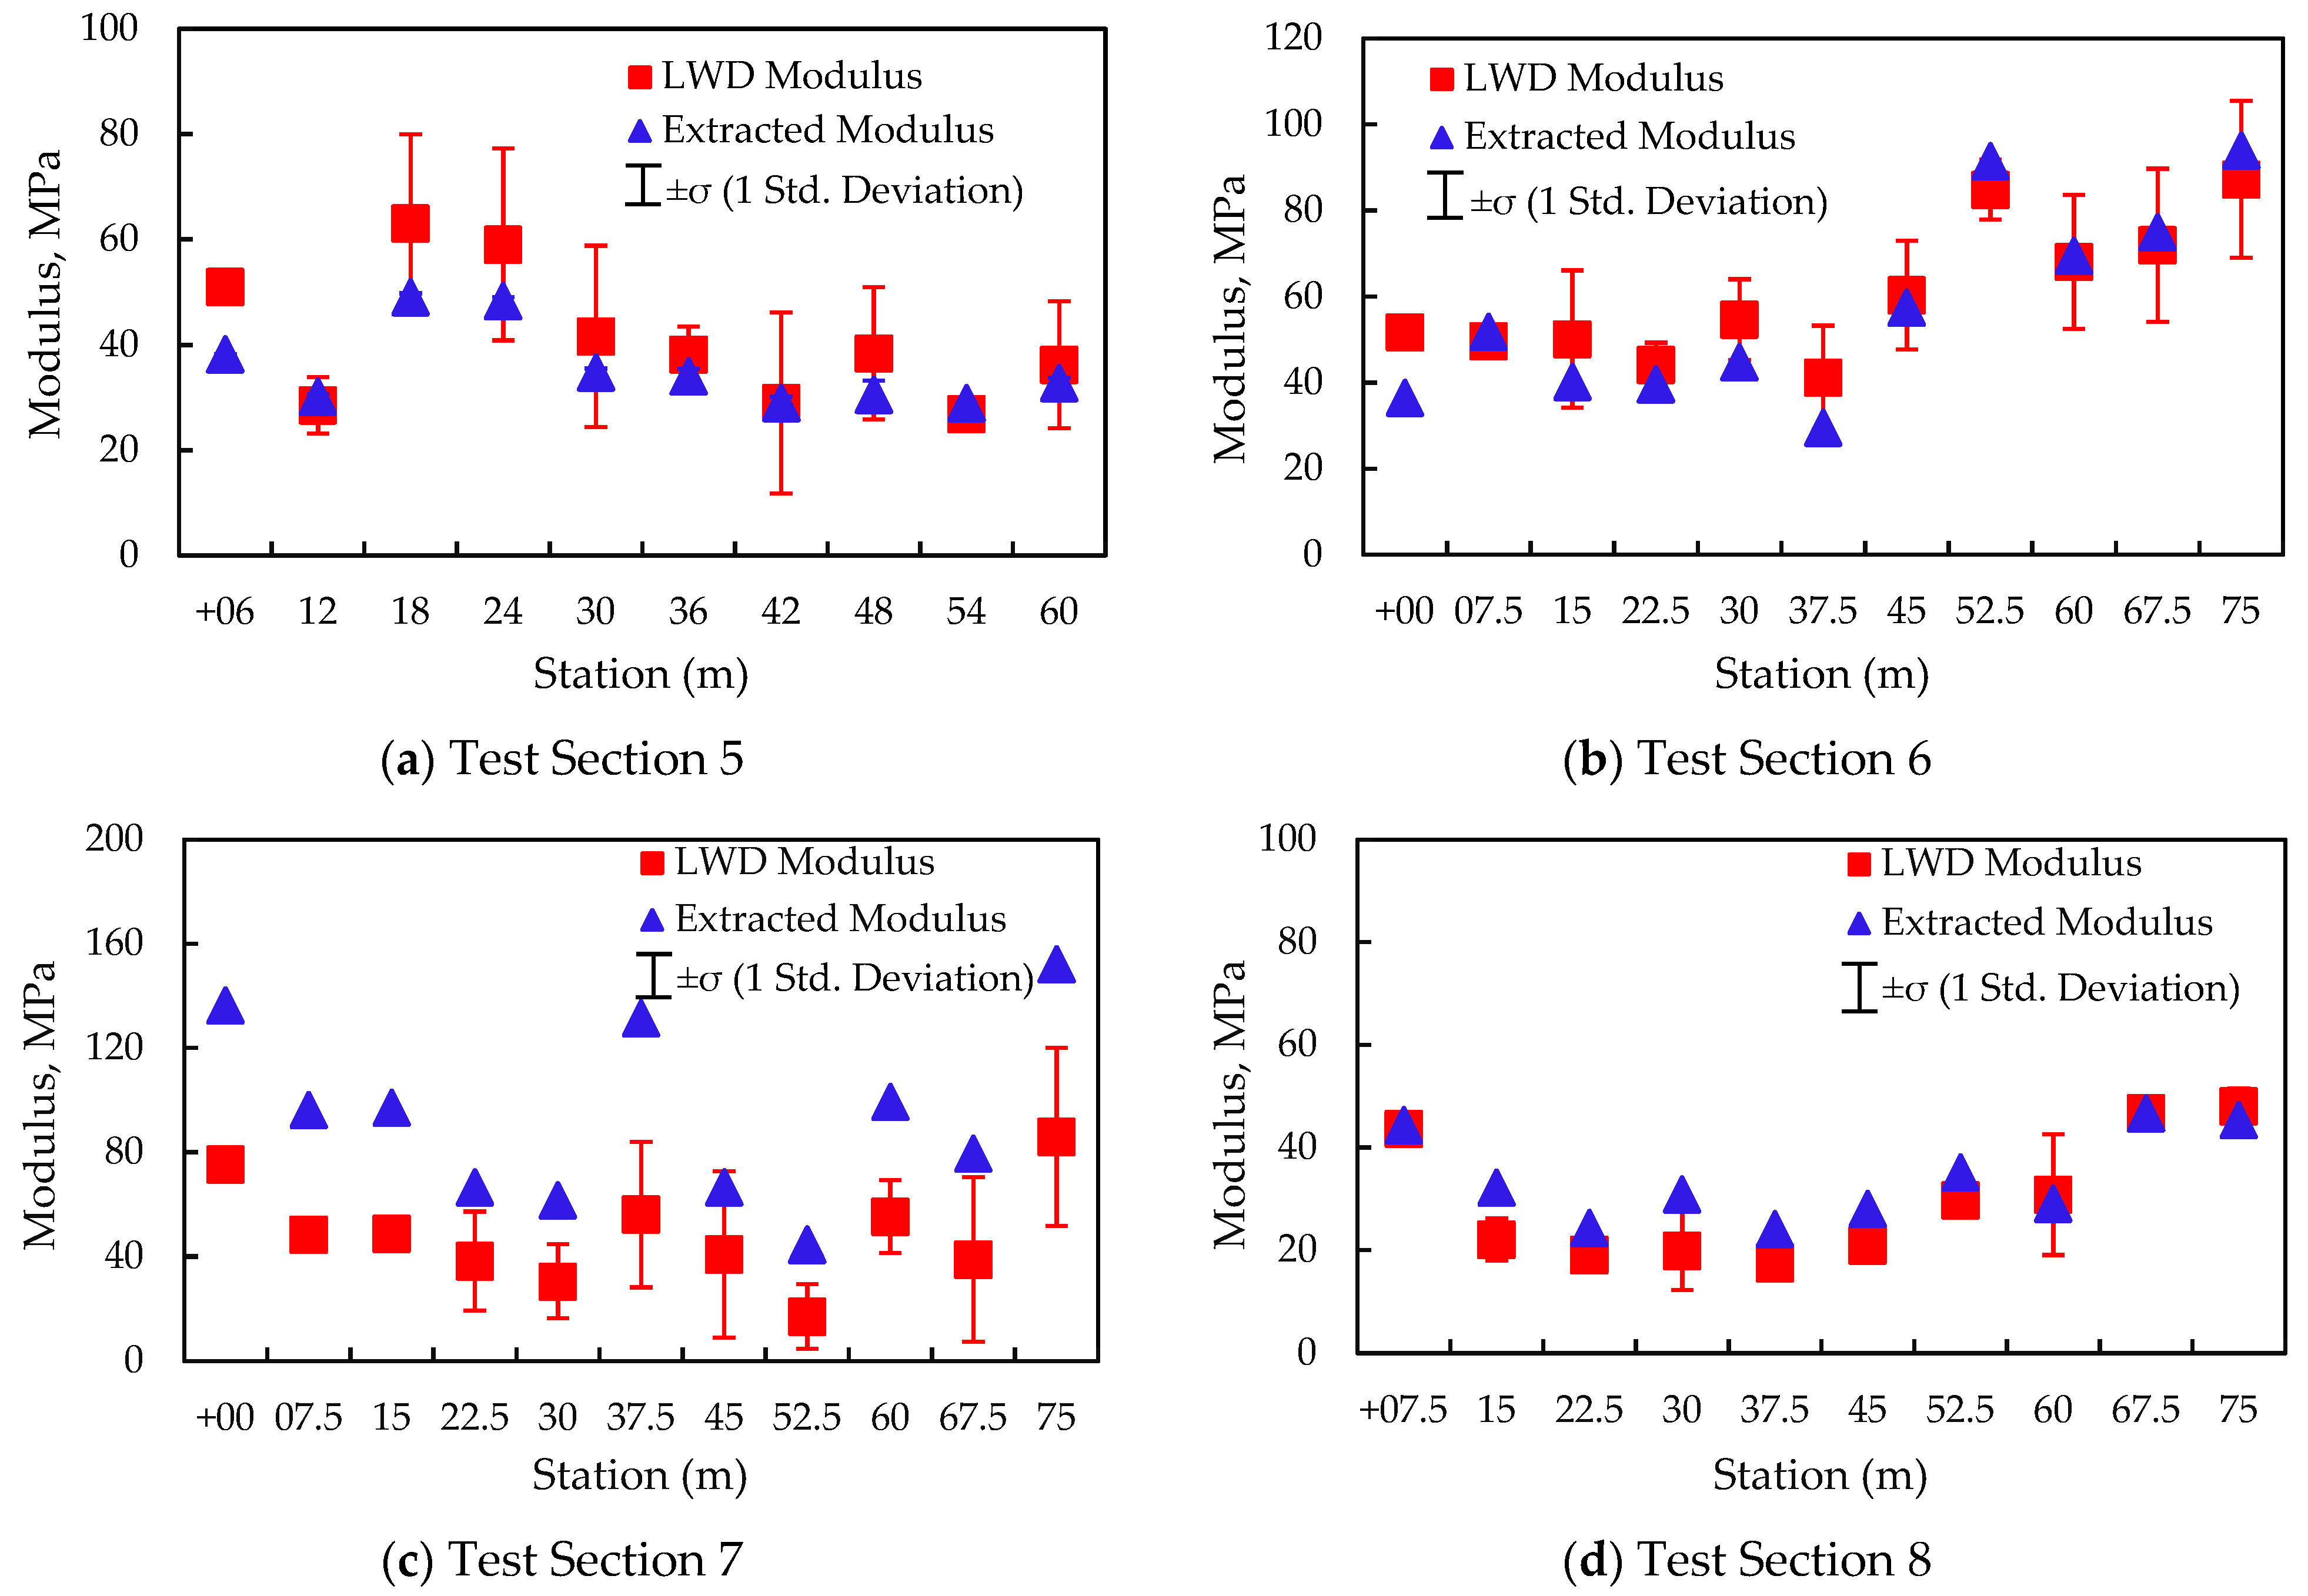
Figure 14 compares the subgrade moduli that were estimated by the solver to their corresponding LWD moduli per sublot for Sections 5 through 8 when 25% of the sublots (11 sublots) are used for the local calibration of the IC data. The markers in the figure indicating the LWD modulus per station represent the averaged LWD modulus of the four sublots across the station, and the error bars represent their ±1 standard deviation. Similarly, the averaged estimated moduli across each station are shown with their corresponding ±1 standard deviation. The figure shows that the averaged LWD modulus and estimated moduli exhibit similar trends along the length of the test lot for all four sites.
From the figure, it can also be discerned that the estimated moduli across the four sublots have less variability than the LWD moduli because each modulus along each station was estimated using an average surface displacement of the sublot as the solver’s input d1. The average displacement d1 is determined from the surface displacement measurements collected within the sublot (i.e., about 50 points when the roller moves at a speed of 5 km/h). Moreover, a single adjusted k1-adj is assigned to be representative of all of the sublots across each station and is used as an input to the solver. Because only 11 sublots were selected for the local calibration, the adjusted k1-adj was calculated using the LWD modulus, ELWD, at the selected representative sublot. These sublots were randomly chosen at each station among those having acceptable uniformity (i.e., COV of CMVs ≤ 35%). The representative k1-adj is used as an input for the representative sublot and the adjacent neighboring sublots along each station using Equation (8). Using this approach, the solver accurately estimated moduli, with a performance that was comparable to the LWD moduli measured in the field. However, the consequence of not excluding and selecting sublots with high nonuniformity as representative sublots for local calibration led to low-accuracy results.
Similarly, for the two-layered systems, the backcalculated LWD moduli, and the modulus estimated by the solver of the top layer using the inverse solver exhibited similar trends for all sites, as shown in Figure 15. However, for the particular case of the lot in Site 7 (Figure 15c), a greater difference in magnitude between the LWD moduli and the solver-estimated moduli is observed. Though the trend appears to be similar, the estimated moduli were not accurate. This can be attributed to an atypical combination of layer stiffnesses present in this site: a much stiffer cement-treated subgrade (as denoted by LWD moduli in Figure 14c) lies underneath a less stiff base course (as evidenced by the backcalculated base moduli in Figure 15c).
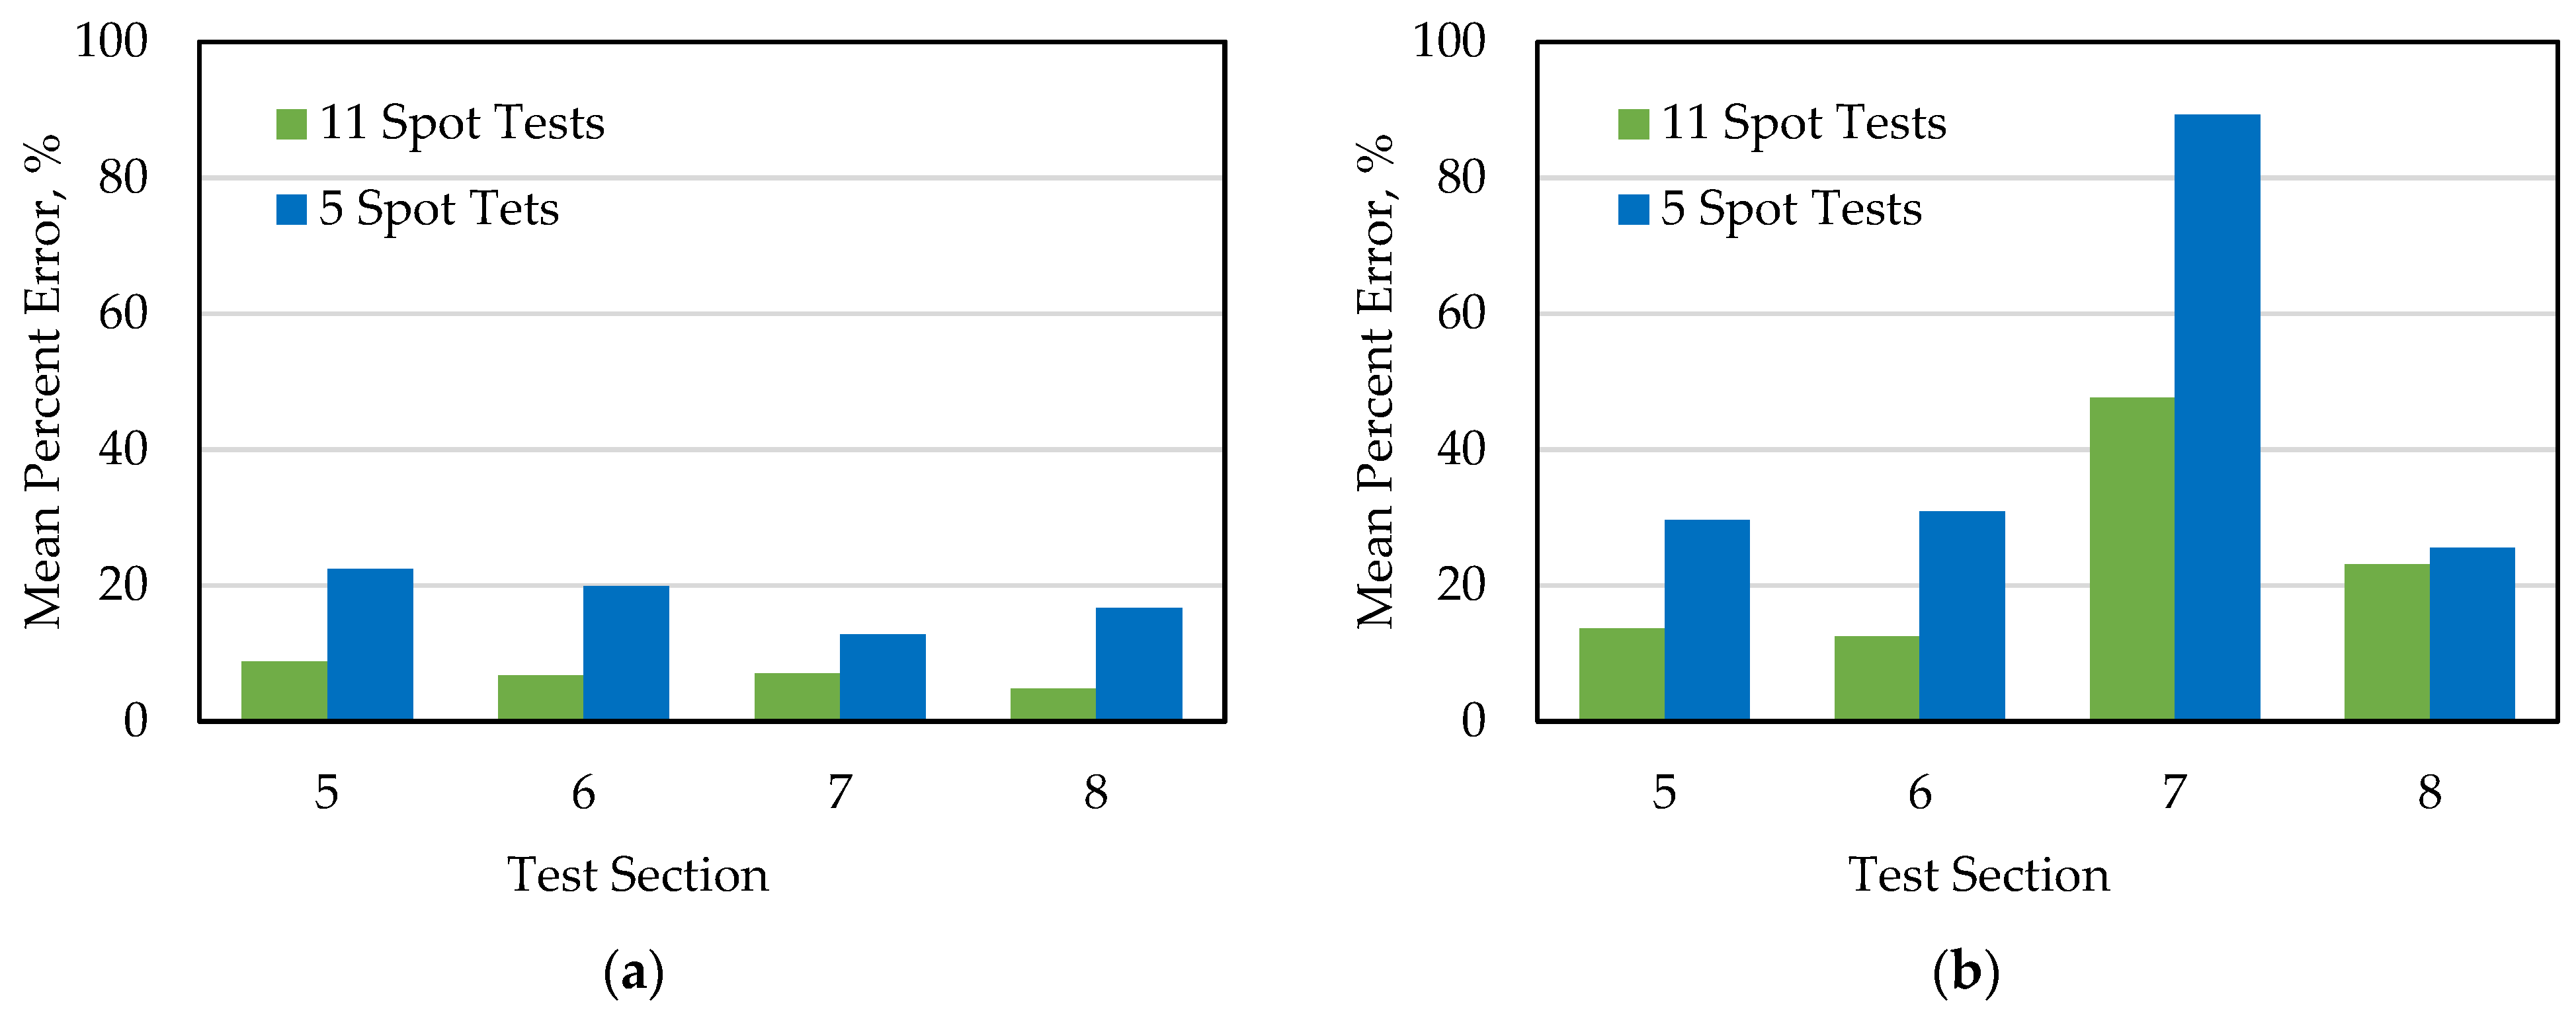
To assess the impact of the number of spot tests using the LWD modulus to adjust the k1 parameters to obtain k1-adj on the outcome of the inverse model, two levels of the testing program were evaluated based on the number of spot test measurements. A scenario using 25% of the sublots (11 sublots) was compared to a scenario using 10% of sublots (5 sublots). Once again, randomly selected sublots with a COV of CMV ≤ 35% were taken as representative sublots for the local calibration of the IC data.
Figure 16 shows the percent difference between the solver estimated base layer moduli and the backcalculated LWD moduli per site. A mean percent error (MPE) of 10% exists between the LWD moduli and the estimated moduli when conducting LWD testing on 25% of the sublots. Reducing the number of LWD tests to 10% of the sublots resulted in an increase in the MPE to 23%. Thus, using five spot tests still allows the solver to estimate the moduli with 25% accuracy, which is still within the inherent soil variability. The error increased considerably for Site 7 where, as mentioned before, the condition of a much stiffer subgrade than the base course needed to be accounted for.
The proposed approach can be utilized for earthwork quality management and to serve as the basis of a modulus-based specification. For its implementation, highway agencies should be prepared to conduct laboratory testing upfront and to institute more rigorous process control during the compaction process. The proposed approach requires the lot to be partitioned into virtual sublots, each of them with dimensions equal to the width of the roller and the length equal to the minimum length of the compacted section that is practical to rework, as set at the discretion of the engineer. The mapping of the compacted layer is performed using an IC roller. The vibration parameters, in terms of frequency, amplitude, roller speed, and roller direction should be identified for the mapping process. A color-coded map of ICMV variability is then generated to identify compaction uniformity within sublots. This approach is proposed to accommodate the inherent uncertainties related to the accuracy of the GPS devices and the precise position of the moving roller. This approach facilitates the identification of areas that lack uniformity. At the discretion of the engineer, these areas should be reworked or be excluded from the procedure to estimate modulus using the inverse solver.
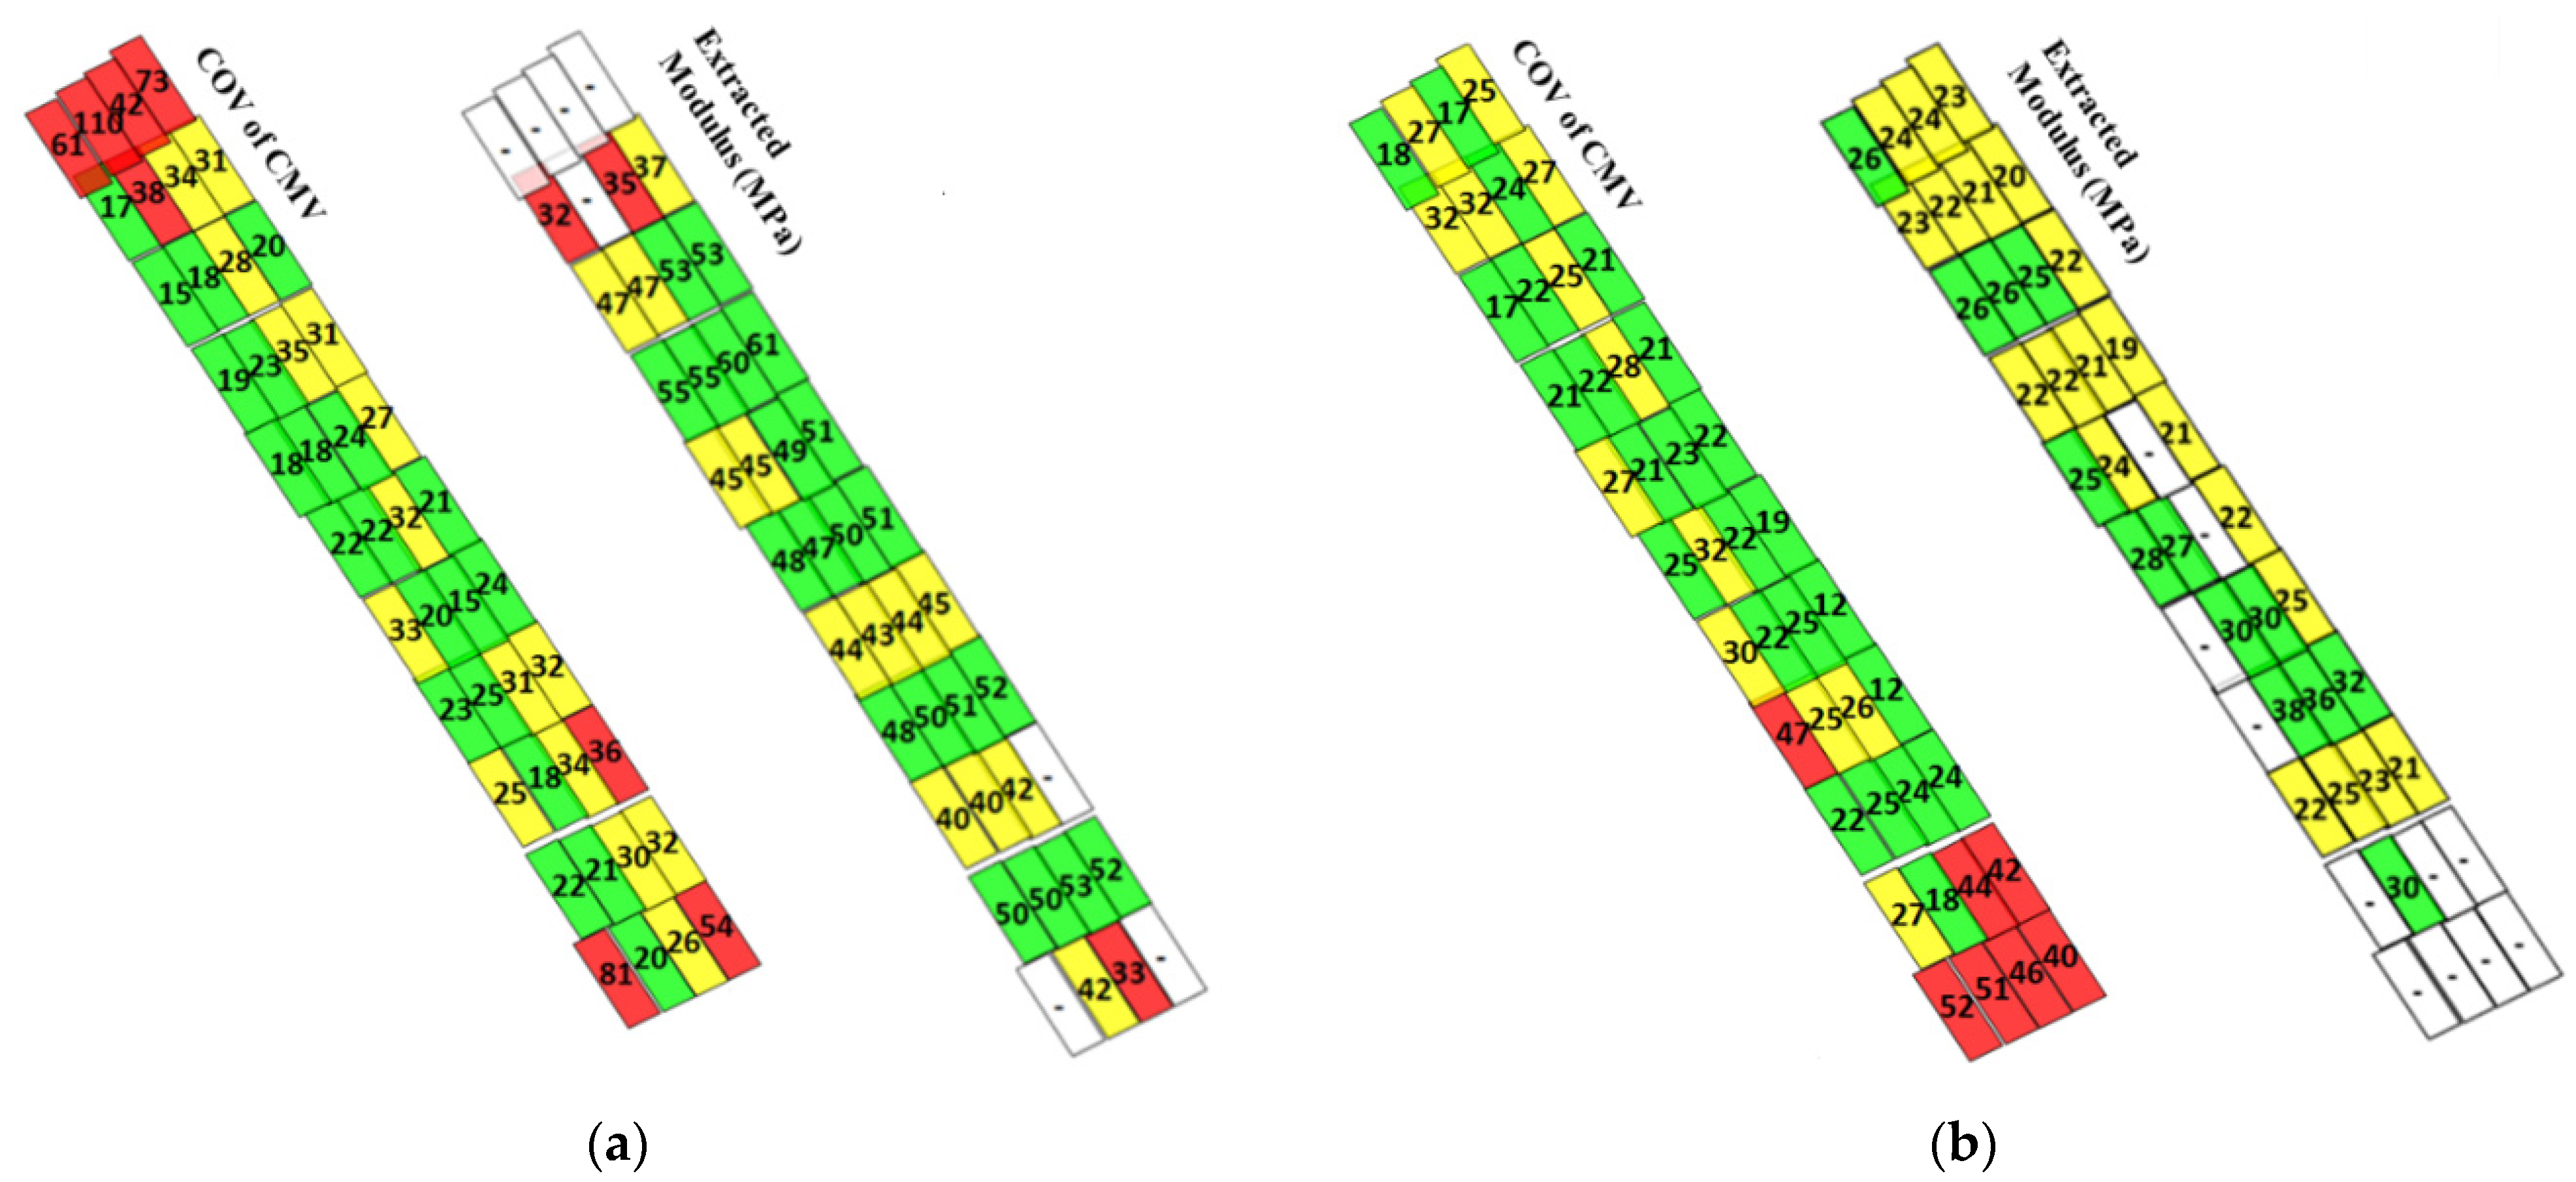
To make use of the inverse solver, more uniform sublots in terms of the COV of ICMV were identified to conduct additional LWD testing. Testing 10% of the sublots would yield moduli estimated by the solver within a 25% error, an acceptable value in practice; however, a more rigorous testing program would yield more accurate estimates. LWD measurements at the selected sublots were then used to calculate k1-adj, and these values were then used as the representative adjustment factor to be used as input to the inverse solver to locally calibrate the IC measurements. A new color-coded map was then generated using the estimated moduli provided by the inverse solver models 1 and 6 for the subgrade and base layer, respectively. Figure 17a compares the mapping between a single layer system obtained from the described approach. Sublots with a COV of ICMV greater than 35% have been excluded and are shown in white in the map showing the inverse solver-estimated moduli.
In two-layered systems, one should be able to extract the layer-specific backcalculated LWD modulus of the last layer using an iterative process using a multi-layer program. Moreover, for the implementation of an inverse solver for two layers (i.e., solver model 6), the roller displacement measurements obtained from pre-mapping (mapping of the previous layer) and mapping of the last layer are necessary as the inputs d1 and d2, respectively. Figure 17b is obtained after following the same approach to obtain a color-coded map with the estimated moduli of the base layer. Once again, sublots with a COV of ICMV greater than 35% were excluded.
The inputs used to feed the models strongly affect the level of accuracy of the selected inverse models. The use of more robust inverse algorithms to extract the layer properties would require additional modulus/stiffness-based nondestructive spot tests. The models evaluated in this study provide a compromise between a reasonable effort of conducting additional modulus-based nondestructive testing to provide an estimation of the moduli that is satisfactorily accurate. The proposed approach can improve our ability to construct roadways that are more reliable, resilient, and that have longer lifespans.

8. Summary and Conclusions

This study presented a methodology for the quality management of compacted earthwork by making use of intelligent compaction technology in conjunction with artificial intelligence. The effectiveness of the proposed approach was studied using different steps and strategies that were undertaken as follows:
  • Three-dimensional FE models simulating the proof-mapping process of an IC-roller on compacted materials were developed and utilized to develop a database with a wide range of pavement materials and structures. The FE models incorporated a nonlinear constitutive model to simulate the behavior of geomaterials under the imposed drum loads and a contact model to simulate the drum decoupling from the soil surface, which is similar to what is observed in the field.
  • A comprehensive database of pavement responses under the imposed drum loads for one- and two-layered systems was assembled and used to develop various inverse solvers using artificial neural networks for the prediction of the moduli of the subgrade and the base layered materials.
  • In addition to the developed forward and inverse models, eight test sites, including single- (subgrade only) and two-layer (subgrade and base course layer) geosystems, were instrumented using in-ground sensors to measure the ground vibrations induced by the roller during the mapping process. Four test sites were used for the calibration of the forward models and inverse solvers. The other four construction sites were utilized for the further evaluation and validation of the proposed approach.
  • Rollers were instrumented using drum-mounted accelerometers to measure the pavement response, and omega arithmetic was employed to measure displacement during mapping, which was used as one of the inputs to the inverse models.
  • Along with an IC testing program at the constructed sites, modulus-based testing with LWD and the measurement of the moisture at the time of compaction with NDG and oven testing were implemented on the compacted geomaterials.
  • Laboratory tests including index tests as well as resilient modulus tests were also conducted on sampled materials collected from the test sites to ensure that comprehensive information existed for the development and assessment of the proposed approach.
The following observations were made on the developed quality management approach based on the field measurements and numerical analyses:
  • The constructed inverse solvers were capable of extracting moduli in single- and two-layered systems. For t two-layer systems in particular, the modulus of the top layer can be extracted when the layer underneath, is pre-mapped and when the thickness information for the top layer is available.
  • More accurate moduli are obtained from the inverse solvers when modulus-based field measurements using LWD and resilient modulus testing are incorporated as part of the quality management program.
  • The proposed approach was found to be favorable for the estimation of the moduli of compacted soils when modulus-based testing was conducted in sublots exhibiting moderate nonuniformity, i.e., COV of ICMV ≤ 35%. The compaction uniformity plays a key role in the retrieval of the moduli of geomaterials with certainty.
  • When compaction uniformity is not achieved, an LWD spot test cannot appropriately represent the compaction quality for a sublot with an approximate size of 45 m2. The impact of not excluding sublots with high non-uniformity leads the solver to estimate the moduli with poor accuracy.
  • The selection of 10% of the available sublots can yield modulus estimations within a 25% error, a value that is still within the variability of the properties of compacted geomaterials observed under the best construction practices.
  • Modulus-based maps can be generated utilizing the proposed approach, and the accelerometer-based measurements collected during the mapping of the lot using various line passes to cover 100% of the lot.
In summary, this study proves that intelligent compaction technology can be used at another level for the robust quality management of compacted earthworks to estimate the modulus of compacted materials by taking advantage of artificial intelligence and by incorporating locally calibrated material properties as inputs. The proposed approach can help state highway agencies and contractors construct long-lasting roadways.

Author Contributions

Conceptualization, S.N.; methodology, S.N., C.T., A.F., and M.M.; software, C.T. and S.R.; validation, A.F., C.T., and S.N.; formal analysis, A.F. and C.T.; investigation, C.T. and A.F.; resources, S.N. and S.R.; data curation, A.F., S.R., and C.T.; writing—original draft preparation, C.T. and A.F.; writing—review and editing, A.F., C.T., and S.N.; visualization, C.T. and A.F.; supervision, S.N.; project administration, S.N.; funding acquisition, S.N. All authors have read and agreed to the published version of the manuscript.

Funding

This research was funded by National Cooperative Highway Research Program (NCHRP), grant number NCHRP 24-45.

Institutional Review Board Statement

Not applicable.

Informed Consent Statement

Not applicable.

Data Availability Statement

The data presented in this study are available upon request from the corresponding author.

Acknowledgments

The authors would like to thank the National Cooperative Highway Research Program (NCHRP) for funding this study under the NCHRP 24-45 Research Project. The contents of this paper reflect the authors’ opinions, not necessarily the policies and findings of NCHRP. The authors are grateful for the assistance and cooperation of the state departments of transportation/highway authorities and project contractors at the field sites where testing was conducted: John Siekmeier of the Minnesota Department of Transportation (Mn/DOT); Jim Lathrop, Ames Construction, Inc.; Stephen Slomski, Michelle Porr, Philip Painter, Andrew M. Jalbrzikowski, and Jordan Binkley of the Ohio Department of Transportation (ODOT); Josh Nichols of the John R. Jurgensen Company; and Adrian Gonzalez, Tim Leafe, Chris Phelps, and Francisco Ruiz of Jordan Foster Construction.

Conflicts of Interest

The authors declare no conflict of interest. The funders had no role in the design of the study; in the collection, analyses, or interpretation of data; in the writing of the manuscript; or in the decision to publish the results.

References

  1. Siekmeier, J.; Pinta, C.; Merth, S.; Jensen, J.; Davich, P.; Camargo, F.F.; Beyer, M. Using the Dynamic Cone Penetrometer and Light Weight Deflectometer for Construction Quality Assurance; Report No. MN/RC 2009-12; Office of Materials and Road Research, Minnesota Department of Transportation: St. Paul, MN, USA, 2009. [Google Scholar]
  2. Vennapusa, P.K.; White, D.J. Comparison of Light Weight Deflectometer Measurements for Pavement Foundation Materials. Geotech. Test. J. 2009, 32, 1–13. [Google Scholar] [CrossRef]
  3. Mooney, M.A.; Rinehart, R.V.; Facas, N.W.; Musimbi, O.M.; White, D.J.; Vennapusa, P.K.R. NCHRP Research Report 676: Intelligent Soil Compaction Systems; Transportation Research Board of the National Academies: Washington, DC, USA, 2010. [Google Scholar] [CrossRef]
  4. Nazarian, S.; Mazari, M.; Abdallah, I.N.; Puppala, A.J.; Mohammad, L.N.; Abu-Farsakh, M.Y. Modulus-Based Construction Specification for Compaction of Earthwork and Unbound Aggregate; Transportation Research Board, The National Academies Press: Washington, DC, USA, 2010. [Google Scholar] [CrossRef]
  5. Ganju, E.; Kim, H.; Prezzi, M.; Salgado, R.; Siddiki, N.Z. Quality Assurance and Quality Control of Subgrade Compaction Using the Dynamic Cone Penetrometer. Int. J. Pavement Eng. 2018, 19, 966–975. [Google Scholar] [CrossRef]
  6. Tirado, C.; Rocha, S.; Fathi, A.; Mazari, M.; Nazarian, S. Deflection-Based Field Testing for Quality Management of Earthwork; Report No. FHWA/TX-19/0-6903-1; Center for Transportation Infrastructure System, The University of Texas at El Paso: El Paso, TX, USA, 2019. [Google Scholar]
  7. Nazarian, S.; Fathi, A.; Tirado, C.; Kreinovich, V.; Rocha, S.; Mazari, M. NCHRP Research Report 933: Evaluating Mechanical Properties of Earth Material during Intelligent Compaction; National Academies of Sciences, Engineering, and Medicine, The National Academies Press: Washington, DC, USA, 2020. [Google Scholar] [CrossRef]
  8. Nieves Torres, A.; Arasteh, M. Intelligent Compaction Measurement Values (ICMV)—A Road Map; Technical Brief, FHWA-HIF-17-046; Federal Highway Administration: Washington, DC, USA, 2017. [Google Scholar]
  9. Tirado, C.; Fathi, A.; Rocha, S.; Mazari, M.; Nazarian, S. Integrating Intelligent Compaction Technology and Modulus-Based Testing for Design Verification. Proc. Inst. Civ. Eng. Geotech. Eng. 2020, 173, 327–338. [Google Scholar] [CrossRef]
  10. Anderegg, R.; Kaufmann, K. Intelligent Compaction with Vibratory Rollers: Feedback Control Systems in Automatic Compaction and Compaction Control. Transp. Res. Rec. J. Transp. Res. Board 2004, 1868, 124–134. [Google Scholar] [CrossRef]
  11. White, D.J.; Thompson, M.J. Relationships between in Situ and Roller-Integrated Compaction Measurements for Granular Soils. J. Geotech. Geoenviron. Eng. 2008, 134, 1763–1770. [Google Scholar] [CrossRef]
  12. Gallivan, V.L.; Chang, G.K.; Horan, D.R. Intelligent Compaction for Improving Roadway Construction. In Emerging Technologies for Material, Design, Rehabilitation, and Inspection of Roadway Pavements 2011, Proceeding of the GeoHunan International Conference 2011, Hunan, China, 9–11 June 2011; ASCE: Hunan, China, 2011; pp. 117–124. [Google Scholar] [CrossRef]
  13. Meehan, C.L.; Tehrani, F.S.; Vahedifard, F. A Comparison of Density-based and Modulus-Based in Situ Test Measurements for Compaction Control. Geotech. Test. J. 2012, 35, 387–399. [Google Scholar] [CrossRef] [Green Version]
  14. Fathi, A.; Tirado, C.; Mazari, M.; Rocha, S.; Nazarian, S. Correlating Continuous Compaction Control Measurements to In Situ Modulus-Based Testing for Quality Assessment of Compacted Geomaterials. In Proceedings of the International Conference on Information Technology in Geo-Engineering 2019, Guimarães, Portugal, 29 September–2 October 2019; Correia, A., Tinoco, J., Cortez, P., Lamas, L., Eds.; Springer: Cham, Switzerland, 2020; pp. 585–595. [Google Scholar] [CrossRef]
  15. Barman, M.; Nazari, M.; Imran, S.A.; Commuri, S.; Zaman, M.; Beainy, F.; Singh, D. Quality Control of Subgrade Soil using Intelligent Compaction. Innov. Infrastruct. Solut. 2016, 1, 23. [Google Scholar] [CrossRef] [Green Version]
  16. Lemus, L.; Fathi, A.; Beltran, J.; Gholami, A.; Tirado, C.; Mazari, M.; Nazarian, S. Geospatial Relationship of Intelligent Compaction Measurement Values with In Situ Testing for Quality Assessment of Geomaterials. In Airfield and Highway Pavements, Proceedings of the International Conference on Transportation and Development 2018, Pittsburgh, PA, USA, 15–18 July 2018; ASCE: Reston, VA, USA, 2018; pp. 293–301. [Google Scholar] [CrossRef]
  17. Baker, W.J., III; Meehan, C.L. Continuous Compaction Control Measurements for Quality Assurance in Conjunction with Light Weight Deflectometer Target Modulus Values. In Proceedings of the Geo-Congress 2020: Modeling, Geomaterials, and Site Characterization, Minneapolis, MN, USA, 25–28 February 2020; ASCE: Reston, VA, USA, 2020; pp. 368–376. [Google Scholar] [CrossRef]
  18. Lundberg, V.G. Elastische berührung zweier halbräume. Forschung auf dem Gebiet des Ingenieurwesens A 1939, 10, 201–211. [Google Scholar] [CrossRef]
  19. Kröber, W. Untersuchung der Dynamischen Vorgänge bei der Vibrationsverdichtung von Böden. Ph.D. Thesis, Technische Universität München (TUM), Munich, Germany, 1998. [Google Scholar]
  20. Floss, R.; Kröber, W.; Wallrath, W. Dynamische Bodensteifigkeit als Qualitätskriterium für die Bodenverdichtung (Dynamic Soil Stiffness as a Quality Criterion for Soil Compaction). In Proceedings of the 4. Internationales Symposium Technik und Technologie des Verkehrswegebaus (4th International Symposium and Technology Series of Transportation Infrastructures), Munich, Germany, 4–6 April 2001; BAUMA: Munich, Germany, 2001. [Google Scholar]
  21. Sandström, A.J.; Pettersson, C.B. Intelligent Systems for QA/QC in Soil Compaction. In Proceedings of the 83rd Annual Transportation Research Board Meeting, Washington, DC, USA, 11–15 January 2004; Transportation Research Board: Washington, DC, USA, 2004; pp. 11–14. [Google Scholar]
  22. Mooney, M.A.; Facas, N.W. NCHRP IDEA Project 145: Extraction of Layer Properties from Intelligent Compaction Data; Transportation Research Board: Washington, DC, USA, 2013. [Google Scholar]
  23. White, D.J.; Vennapusa, P.; Tutumluer, E.; Moaveni, M. Mechanistic Assessment of Layered Pavement Foundation System Using Validated Intelligent Compaction Measurements. In Proceedings of the 8th International Conference on Case Histories in Geotechnical Engineering (Geo-Congress 2019), Philadelphia, PA, USA, 24–27 March 2019; ASCE: Reston, VA, USA, 2019; pp. 421–429. [Google Scholar] [CrossRef]
  24. White, D.J.; Vennapusa, P.; Roesler, J.R.; Vavrik, W. Plate Load Testing on Layered Pavement Foundation System to Characterize Mechanistic Parameters. In Proceedings of the 8th International Conference on Case Histories in Geotechnical Engineering (Geo-Congress 2019), Philadelphia, PA, USA, 24–27 March 2019; ASCE: Reston, VA, USA, 2019; pp. 214–226. [Google Scholar] [CrossRef]
  25. Rahman, F.; Hossain, M.; Hunt, M.M.; Romanoschi, S.A. Soil Stiffness Evaluation for Compaction Control of Cohesionless Embankments. Geotech. Test. J. 2018, 31, 442–451. [Google Scholar] [CrossRef]
  26. Ooi, P.S.; Archilla, A.R.; Sandefur, K.G. Resilient Modulus Models for Compacted Cohesive Soils. Transp. Res. Rec. J. Transp. Res. Board 2004, 1874, 115–124. [Google Scholar] [CrossRef]
  27. Velasquez, R.; Hoegh, K.; Yut, I.; Funk, N.; Cochran, G.; Marasteanu, M.; Khazanovich, L. Implementation of the MEPDG for New and Rehabilitated Pavement Structures for Design of Concrete and Asphalt Pavements in Minnesota; Report No. MN/RC 2009-06; University of Minnesota: Minneapolis, MN, USA.
  28. Werbos, P. Beyond Regression: New Tools for Prediction and Analysis in the Behavioral Sciences. Ph.D. Thesis, Harvard University, Cambridge, MA, USA, 1974. [Google Scholar]
  29. Ilonen, J.; Kamarainen, J.K.; Lampinen, J. Differential Evolution Training Algorithm for Feed-forward Neural Networks. Neural Process. Lett. 2003, 17, 93–105. [Google Scholar] [CrossRef]
  30. Hastie, T.; Tibshirani, R.; Friedman, J. The Elements of Statistical Learning: Data Mining, Inference, and Prediction; Springer Science & Business Media: New York, NY, USA, 2009. [Google Scholar] [CrossRef]
  31. Fathi, A.; Tirado, C.; Rocha, S.; Mazari, M.; Nazarian, S. Incorporating Calibrated Numerical Models in Estimating Moduli of Compacted Geomaterials from Integrated Intelligent Compaction Measurements and Laboratory Testing. Transp. Res. Rec. J. Transp. Res. Board 2020, 2674, 75–88. [Google Scholar] [CrossRef]
  32. Mercer, C. Acceleration, Velocity and Displacement Spectra-Omega Arithmetic. Prosig Signal Process. Tutor. 2006, 1, 1–8. [Google Scholar]
  33. Mazari, M.; Navarro, E.; Abdallah, I.; Nazarian, S. Comparison of Numerical and Experimental Responses of Pavement Systems using Various Resilient Modulus Models. Soils Found. 2014, 54, 36–44. [Google Scholar] [CrossRef] [Green Version]
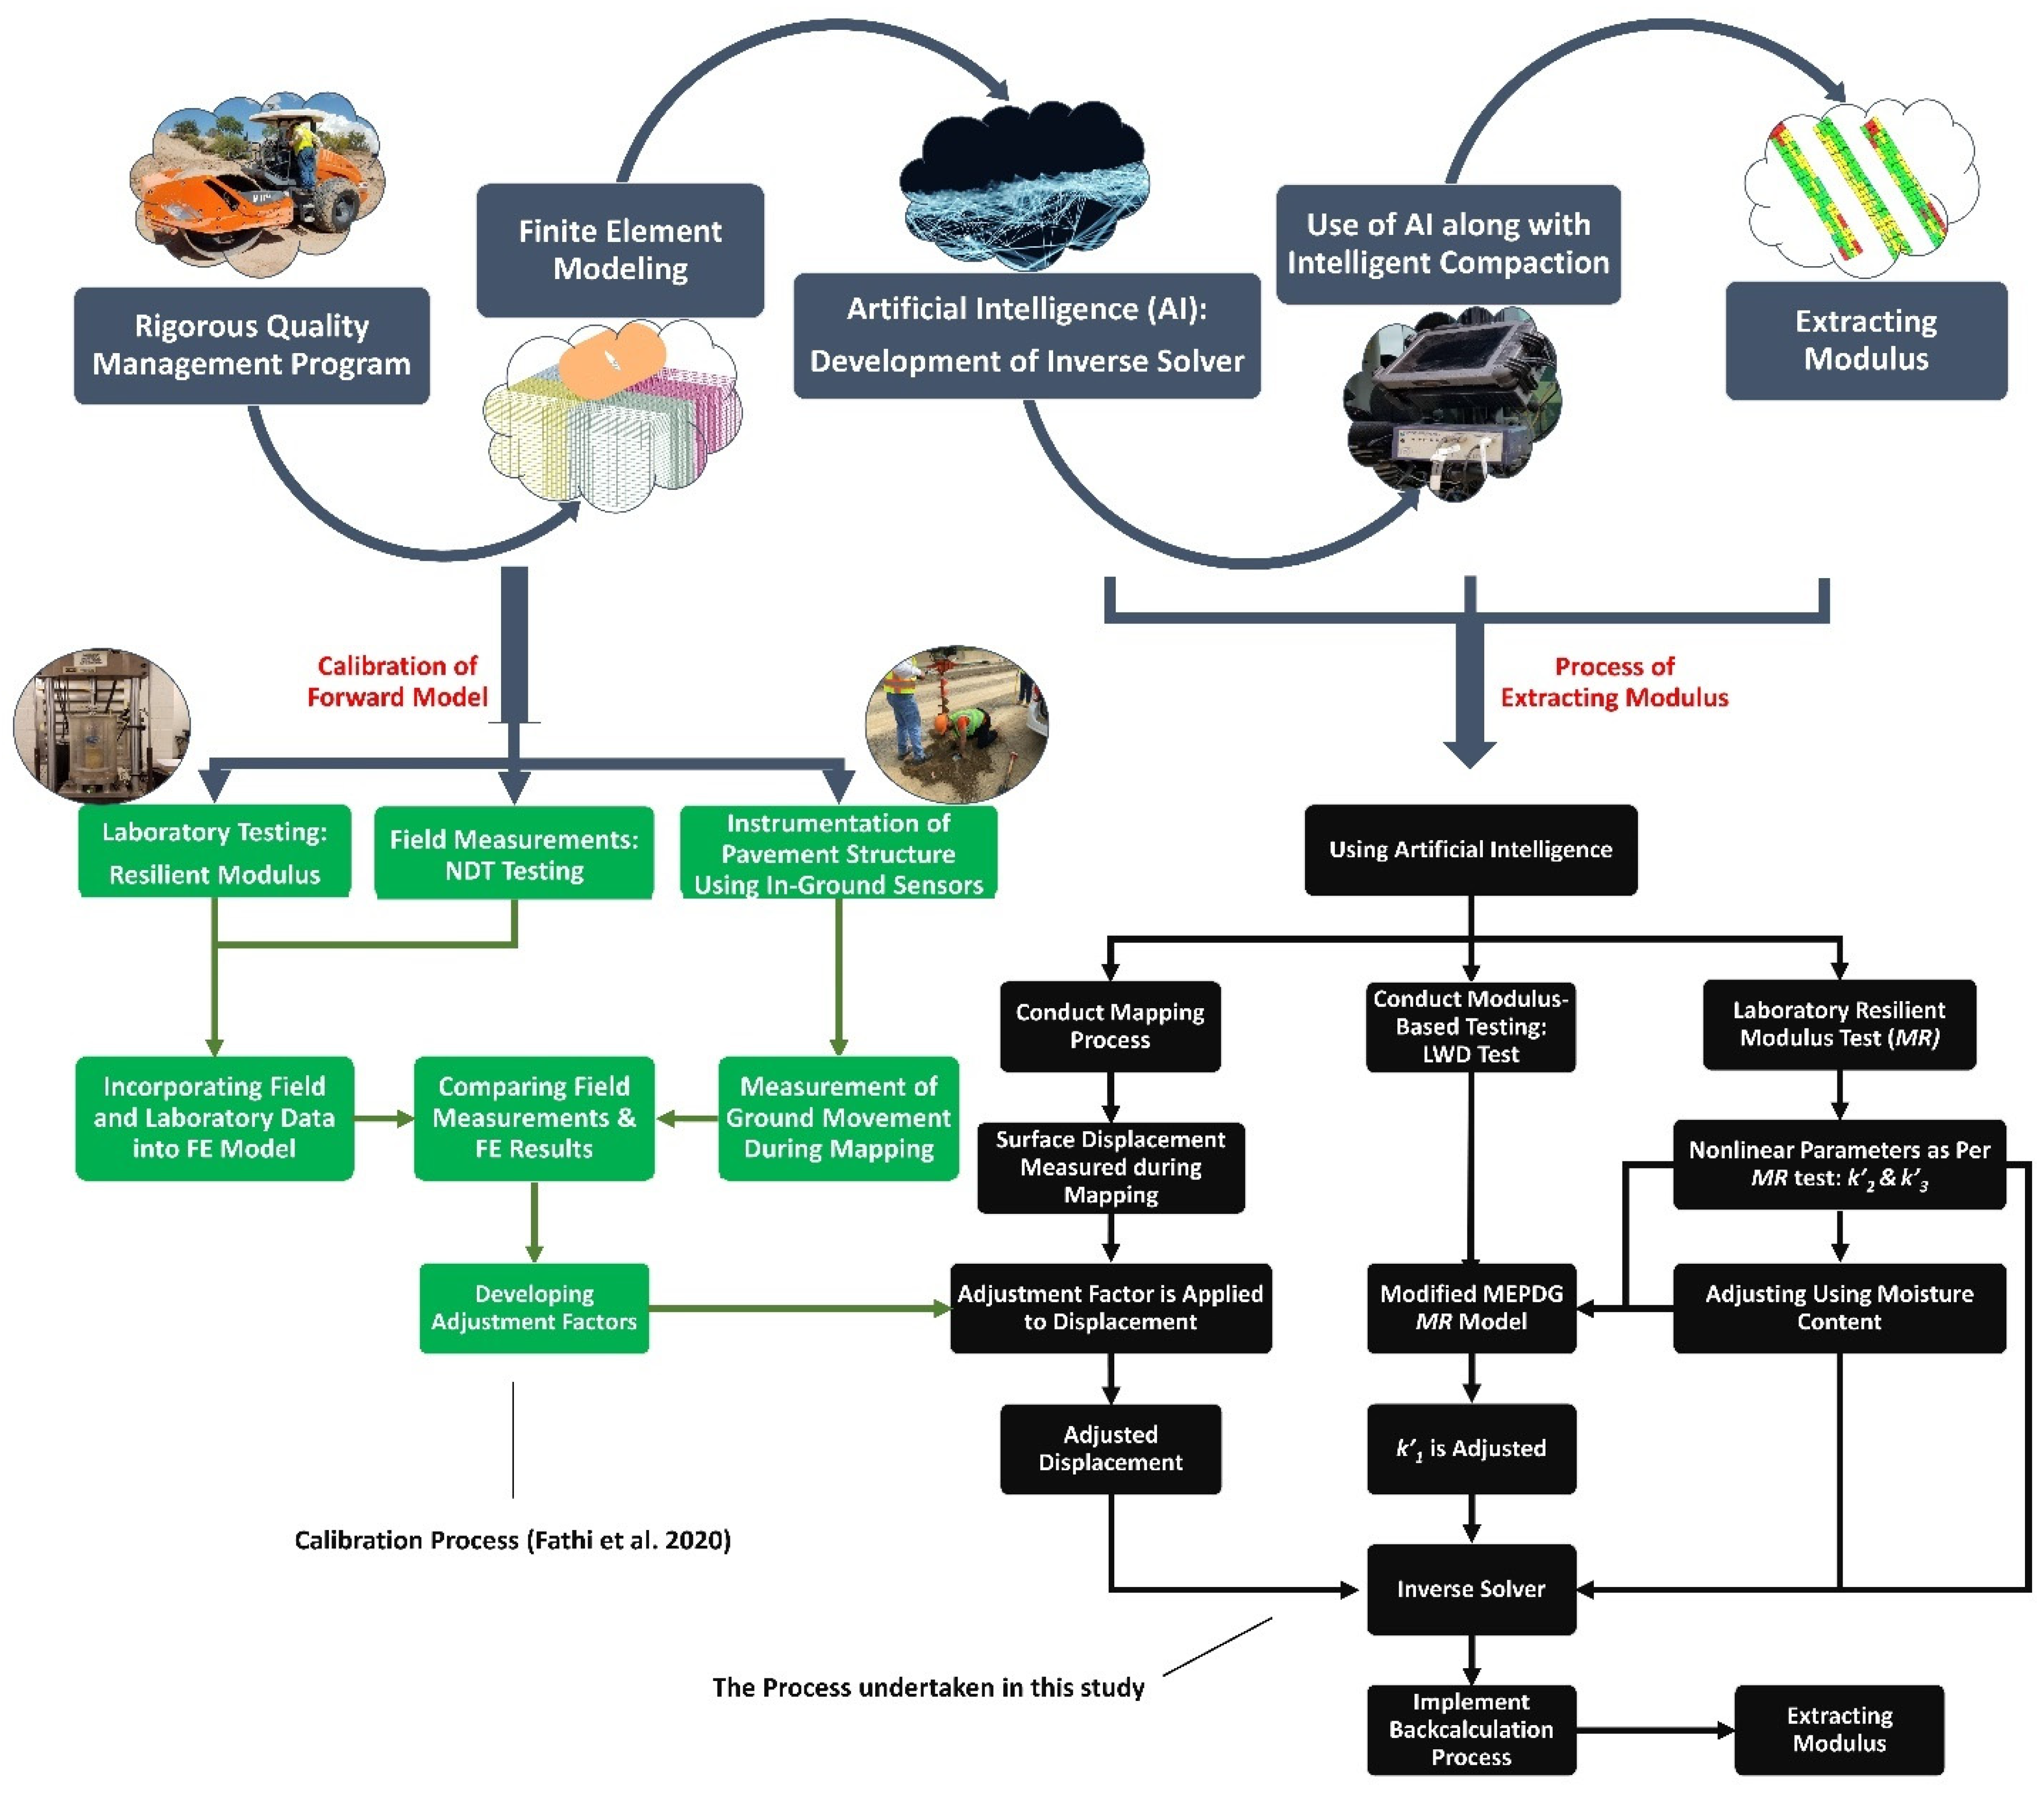
Figure 1. Flowchart describing process for developing an approach for modulus extraction using AI during intelligent compaction proof-mapping.
Infrastructures 06 00142 g001
Figure 2. Schematic representation of drum–soil system: (a) IC-equipped roller, (b) FE model of soil and drum, (c) soil–drum interaction, and (d) contact model interaction.
Infrastructures 06 00142 g002
Figure 3. Computation of representative moduli of subgrade and base layers using finite element simulation.
Infrastructures 06 00142 g003
Figure 4. Architecture of a multi-layer perceptron ANN model used for backcalculation of base modulus.
Infrastructures 06 00142 g004
Figure 5. ANN predicted vs. FE simulated subgrade modulus using ANN with different input scenarios.
Infrastructures 06 00142 g005
Figure 6. ANN predicted vs. FE simulated base modulus using ANN with different input scenarios.
Infrastructures 06 00142 g006
Figure 7. Field testing: (a) test layout schematic, (b) sublots and spots in test section, (c) mounted accelerometers, (d) vibratory IC roller, (e) data acquisition system, (f) LWD testing, and (g) NDG testing.
Infrastructures 06 00142 g007
Figure 8. Displacement under drum measured during proof-mapping of sandy subgrade.
Infrastructures 06 00142 g008
Figure 9. Adjustment of parameters k2 and k3 using moisture correction for clay subgrade.
Infrastructures 06 00142 g009
Figure 10. Comparison of extracted moduli obtained from inverse solver with corresponding measured LWD moduli.
Infrastructures 06 00142 g010
Figure 11. Flowchart for the extracting modulus of unbound materials using inverse solvers.
Infrastructures 06 00142 g011
Figure 12. Comparison of LWD and extracted moduli for test sections 5–8 for (a) single- and (b) two-layered geosystem.
Infrastructures 06 00142 g012
Figure 13. Color-coded maps indicating (a) the relative stiffness and (b) uniformity of the compaction as obtained on top of the subgrade from test Section 5.
Infrastructures 06 00142 g013
Figure 14. Relationship between LWD-measured and -extracted moduli per station for single-layer systems in sites 5–8.
Infrastructures 06 00142 g014
Figure 15. Relationship between averaged rectangular buffered areas of measured and extracted moduli for the top layer in two-layered systems in Sites 5–8.
Infrastructures 06 00142 g015
Figure 16. Comparison of variability of inverse solver-extracted modulus with respect to LWD modulus for all sites and (a) single- and (b) two-layer systems.
Infrastructures 06 00142 g016
Figure 17. Comparison of mapping of (a) coefficient of variation of CMV and extracted modulus for (a) single layer and (b) top layer of two-layered system.
Infrastructures 06 00142 g017
Table 1. Feasible range of layer properties [27].
Pavement PropertiesRange of Values
k1100–3000
k20–3.0
k3−4.0–0
Poisson’s Ratio, ν0.35
Table 2. Specifications for simulated drums.
Operating ParameterSymbolRange of ValuesBaseline Roller Values
Width of drumL1.0–2.0 m 2.0 m
Diameter of drumd0.5 m–1.5 m1.5 m
Mass of drummd750–9000 kg6000 kg
Weight of drummdg7500–88,000 N58,840 N
Mass-eccentricitym0e01.0–5.6 kg·m5.36 kg·m
Centrifugal forceFev15–170 kN170 kN
Frequencyf20–60 Hz28 Hz
Rotational FrequencyΩ125–380 rad/s176 rad/s
Operating speedv0.9 m/s0.9 m/s
Table 3. Feasible backcalculation scenarios based on available IC field/lab data.
GeosystemScenarioInput ParametersCoefficient of Determination, R2Standard Error of the Estimate, SEE (ksi)Recommendation for Implementation 1Target
One layer1h, k1s, k2s, k3s, d10.995.0HighSubgrade Modulus, ESUBG
2h, k1s, k2s, k3s, d1, MRSUBG-Rep0.994.6Moderate
Two-layer3h, k2b, k3b, d2, d10.7729.4LowBase Modulus, EBASE
4h, k2b, k3b, d2, ESUBG0.7031.6Low
5h, k2b, k3b, d2, MRSUBG-Rep0.7629.5Low
6h, k1b, k2b, k3b, d2, d10.998.4High
7h, k1s, k2s, k3s, k1b, k2b, k3b, d2, d10.996.7Moderate
1 Recommendation based on the level of laboratory efforts as well as their prediction power.
Table 4. Pavement structure and material properties of test sections.
Test SectionLayerUSCS ClassificationOptimum Moisture Content, OMC 1 (%)Maximum Dry Density (MDD) (kg/m3)Resilient Modulus at OMC (MPa)
1Sand subgrade (existing)SP-SM6.5134277.9
300 mm coarse Class 5Q aggregate base coarse recycled concreteGW10.51962128.7
2Sand subgrade (existing)SP-SM6.5134277.9
300 mm fine Class 5 aggregate base fine recycled concreteSP10.91922126.2
3Clay loam (A-6) prepared subgradeCL14.4189759.3
300 mm Class 6 aggregate base limestoneGW6.6228497.9
4Clay loam (A-6) prepared subgradeCL14.4189759.3
300 mm Class 6 aggregate base recycled concrete and asphaltGP10.51969117.2
1 Optimum moisture contents and maximum dry unit weights obtained as per standard Proctor tests (AASHTO T99) for the subgrade and as per modified Proctor tests (AASHTO T180) for unbound aggregate base materials. Resilient moduli were obtained as per AASHTO T 307.
Table 5. Operating features and settings of IC roller used in field experiments.
Vendor/ManufacturerModelDrum Mass (kg)Operating Amplitude (mm)Operating Frequency (Hz)Centrifugal Force (kN)
CaterpillarCS74B51530.9928.3160
Table 6. Information extracted from resilient modulus tests and in situ LWD tests.
Test SectionLayerResilient Modulus at OMC 1 (MPa)Extracted Nonlinear Parameters from Resilient Modulus TestsAverage LWD Modulus, ELWD 2 (MPa)
k1k2k3
1Sand subgrade (existing)77.93351.6−0.629
300 mm coarse Class 5Q aggregate base coarse recycled concrete128.75120.8−0.1117
2Sand subgrade (existing)77.93351.6−0.636
300 mm fine Class 5 aggregate base fine recycled concrete126.24840.9−0.1193
3Clay loam (A-6) prepared subgrade59.36490.6−2.643
300 mm Class 6 aggregate base limestone97.95000.6−0.1138
4Clay loam (A-6) prepared subgrade59.36490.6−2.626.3
300 mm Class 6 aggregate base recycled concrete and asphalt117.24080.9−0.1134
1 Resilient modulus obtained as per AASHTO T 307; 2 Base modulus backcalculated using LWD moduli measured on top of base layer and subgrade surface.
Table 7. Construction sites and roller characteristics.
SiteLength
(m)
LayerUSCS
Classification
Optimum Moisture Content 1 (%)Maximum Dry Density, (kg/m3)Roller Vendor/Model
566EmbankmentCL13.81853Hamm H11ix
300 mm subgradeCL17.11802
675SubgradeSP7.12142Caterpillar CS74B
300 mm subbaseSP7.12142
775Cement-treated subgrade (4% cement)---Caterpillar CS74B
150 mm unbound aggregate base courseGW6.52289
866EmbankmentCL13.81899Volvo SD75
300 mm subgradeCL13.81899
1 Optimum moisture contents and maximum dry unit weights obtained as per standard Proctor tests (AASHTO T99) for the subgrade and as per modified Proctor tests (AASHTO T180) for unbound aggregate base materials.
Table 8. Specifications of IC rollers utilized for validation phase.
Vendor/ManufacturerCaterpillarHamm/WirtgenVolvo
Model Infrastructures 06 00142 i001
CS74B
Infrastructures 06 00142 i002
H11 ix
Infrastructures 06 00142 i003
SD75
Drum Width (m)2.12.11.7
Drum Mass (kg)515358903610
Operating Amplitude (mm)0.990.841.20
Operating Frequency (Hz)28.33030
Centrifugal Force (kN)160136121
Table 9. Geomaterial properties of test sections used for validation of inverse models.
Test SectionResilient Modulus at OMC 1 (MPa)Nonlinear Parameters from Resilient Modulus Model 2Average in situ LWD Modulus, ELWD (MPa)Adjusted Nonlinear Parameter k1-adj 3Surface Displacement (mm)
k2k3Layer 1 d1Layer 2 d2
Single Layer Systems
5401.57−2.04392171.07-
61151.69−2.161305981.26-
72300.61−0.0523115811.08-
8371.76−2.60402131.07-
Two-Layer Systems
5391.24−3.00403131.071.11
6511.69−2.16582671.261.52
71030.57−0.05913291.081.05
8371.76−2.60292141.071.11
1 Resilient modulus obtained as per AASHTO T 307; 2 Nonlinear parameters as per Ooi et al. (2004) model; 3 k1-adj calculated as per Equation (8).
Publisher’s Note: MDPI stays neutral with regard to jurisdictional claims in published maps and institutional affiliations.