Article

Experimental Study on Cast-In-Situ Masonry Cavity Walls Subjected to In-Plane Cyclic Loading

1
Department of Civil and Environmental Engineering, Western University, London, ON N6A 5B9, Canada
2
School of Civil Engineering, Shenyang Jianzhu University, Shenyang 110168, China
*
Author to whom correspondence should be addressed.
Infrastructures 2020, 5(1), 8; https://doi.org/10.3390/infrastructures5010008
Submission received: 1 December 2019 / Revised: 11 January 2020 / Accepted: 12 January 2020 / Published: 15 January 2020
(This article belongs to the Section Infrastructures and Structural Engineering)

Abstract

:
This study investigates the behavior of cast-in-situ masonry cavity walls subjected to in-plane quasi-static loading. Thirteen cast-in-situ masonry cavity walls and one solid wall were tested under combined axial and quasi-static lateral loads. Test parameters included the tie shape, tie layout, thickness of the insulating layer, and the level of axial compression. The problems related to shear capacity and failure mechanisms of cast-in-situ masonry cavity walls were analyzed. Experimental results indicate that failure of most wall specimens occurred via crushing at corners, accompanied by flexural and diagonal cracks in the inner leaves. The shape and layout of the ties had a limited effect on the shear strength of cast-in-situ masonry cavity walls, while axial compression had a positive influence on shear strength. The relative displacement between the inner and outer leaves was nearly zero before walls cracked and reached less than 2 mm at the ultimate load. The shape and layout of the ties had a slight influence on the coordination of inner and outer leaves, while the insulating layer thickness and axial compression had a negative effect. Hysteretic loops under quasi-static loading were spindle-like, and wall specimens exhibited large nonlinear deformation capacity, indicating adequate aseismic capability. A new formula for calculating the shear capacity of the cast-in-situ cavity masonry walls was proposed and was demonstrated to be accurate.

Graphical Abstract

1. Introduction

Clay brick masonry cavity-walls were first implemented in construction back in the 19th century. Nicholson [1] defined it as a hollow wall built in two thicknesses, having an inner cavity, either to save the number of materials used or to preserve the more uniform temperature in buildings. Load-bearing clay brick cavity-wall construction became commonly used in Europe, North America, Australia, and New Zealand since the second half of the 19th century [2]. Cavity walls can either be infilled in structural frames or act as stand-alone bearing walls in commercial building construction owing to its thermal performance and resistance to fire, moisture penetration, and sound insulation. Such walls consist of two ‘skins’, commonly made of brick or concrete block masonry separated by a hollow cavity. A cavity wall combines three lines of defense: run-off along the exterior surface, absorption by the veneer wall, and run-off at the cavity side, with the cavity acting as a capillary break [3]. There is a distinction between walls that are bridged by brickwork at frequent intervals, and what may be regarded as true cavity wall, with only iron ties, patent or other bricks, bridging it at spare intervals [4,5,6].
The cavity is either left empty or filled with insulation using various methods. However, to increase energy efficiency, cavity filling gradually became normal practice [7]. For cavity wall technology, higher thermal performance is achieved via placing insulation into increased cavity width. Generally, 40 mm of insulation is perceived as sufficient, resulting in an 80- or 100-mm cavity [8]. The insulation can closely agglutinate the inner and outer leaf in the cavity without gap, cracks or insulation weak points, ensuring superior performance. Available techniques for insulating existing cavity walls generally involve injecting or blowing insulating material into the cavity. Three generic types of cavity wall insulation are commonly used, including mineral wool, beads/granules, and foamed insulation [9,10]. Polystyrene board is the most common thermal insulation in masonry cavity wall construction, with three other methods including the inner leaf, outer leaf, and tie. Several problems have hindered wider use of masonry cavity wall construction including: (1) the gap between polystyrene boards is too large, (2) polystyrene boards, inner and outer leaf cannot be closely integrated with each other, (3) and beam, window and balcony are weak links for energy-saving and thermal insulation in the building.
Observation of damage caused by major earthquake events over the past decades has shown that structural collapse of unreinforced masonry (URM) buildings is common [11]. In-situ testing of URM walls was conducted to explore the effects of as-built wall boundary conditions on its out-of-plane strength [12]. In-plane behavior of cavity masonry infills and strengthening with textile reinforced mortar was studied by Akhoundi [13]. Salmanpour et al. [14] carried out a state-of-the-art review of experimental and analytical studies on the deformation capacity of unreinforced masonry walls subjected to in-plane loading. The ultimate deformation capacity was identified as the most important parameter in seismic design and assessment, yet our current state of knowledge on the deformation capacity of structural masonry is limited. It was also argued that the available experimental data display substantial scatter and do not allow establishing a rational value of the deformation capacity of masonry structures based on such experimental data alone. Moreover, reliable and practical analytical models for the force-deformation relationship of structural masonry are yet to be established. Not only are existing finite element models too complex for engineering practice, they also suffer from numerical instabilities in the post-peak regime. It was concluded that we need more experimental tests and robust mechanical models that can capture the load-deformation behavior of structural masonry.
Clearly, there is still a dearth of information in the open literature on how the shape and layout of the ties, the thickness of the insulating layer, and axial compression stress influence the aseismic capability of cavity masonry walls. Moreover, whether the inner and outer leaves of cast-in-situ masonry cavity walls can work in coordination has not been duly investigated. Despite that the in-plane seismic behavior of cast-in-situ masonry cavity walls is of paramount importance, it still needs to be explored and quantified.
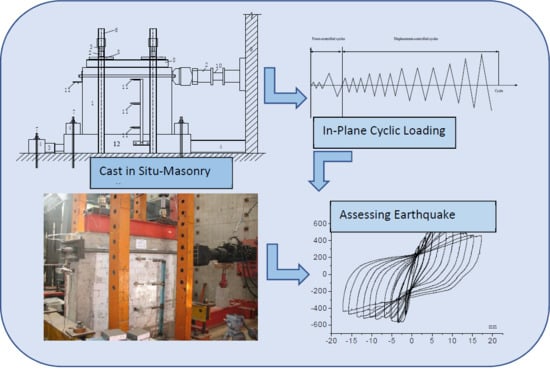
The present study aims at acquiring an insight into the cyclic behavior of cast-in-situ masonry cavity walls using quasi-static loading. Thirteen cast-in-situ masonry cavity walls and one solid wall were subjected to combined axial and quasi-static horizontal loads. The failure modes and lateral displacement hysteretic diagrams are presented and discussed. The possibility of using simplified models to estimate the ultimate load capacity of cast-in-situ masonry cavity walls was explored, and comparison with experimental results was carried out. Finally, the seismic performance of cavity walls was assessed, and a parametric study on the effects of the tie shape, tie layout, thickness of the insulating layer, and axial compression was performed. Some problems of the shear capacity and failure mechanisms of cast-in-situ masonry cavity walls were also analyzed, and a formula to calculate the shear capacity was deduced.

2. Experimental Program

2.1. Test Specimens

A total of thirteen cast-in-situ masonry cavity walls and one solid wall were tested. The wall construction process is illustrated in Figure 1 and a description of the test specimens is outlined in Table 1. The specimens are denoted WDSh(or z)Sv-T-P, where D indicates the tie shape, H and Z stand for rectangular and Z-shaped ties, respectively [15]; Sh is the horizontal spacing of ties which was 600 or 800 mm; Sv is the vertical spacing of ties which was 300 or 400 mm; T is the thickness of insulating layer; and P is the applied axial stress. Four levels of axial compression, expressed as σ0 were used, as shown in Figure 2. All walls were 1400 mm high and 1740 mm wide, corresponding to a height to length ratio of 0.8. The thickness of the inner leaf was 240 mm, whereas the thickness of the outer leaf was 120 mm. The thickness of the insulating layer was varied from 80 to 120 mm with 20 mm intervals. The solid wall was 370 mm thick, having the same dimension as the cast-in-situ masonry cavity walls, but without a cavity.
The reinforced concrete-constructional columns were 240 and 180 mm in cross-section, while the beams were 240 by 200 mm in the inner leaves and 120 by 200 mm in the outer leaves, respectively. The coupling beams between the inner and outer leaves were at intervals of 450 mm and with dimensions of 50 and 200 mm. The used brick had dimensions of 240, 115, and 90 mm. The thermal insulating mortar was made of cement, plaster, modified polystyrene particles, and foam material.

2.2. Test Setup, Instrumentation, and Experimental Procedure

The wall specimens were tested under combined in-plane horizontal and vertical loading. The vertical loading simulates the weight of the story levels. During a seismic event, the wall experiences large displacements, and the axial compressive load may change due to the deformation of the bounding frame of the wall. However, since it is very difficult to simulate the actual boundary conditions, the walls were tested under constant vertical load. The test setup, shown in Figure 3 and Figure 4, consists of the test unit, including a foundation beam, load-distributing beam, horizontal actuator, two vertical actuators, and a reaction wall. The bottom reinforced concrete (RC) beam of the wall was clamped to the floor with four fixing beams through six steel rods to avoid uplift and slippage of the base (Figure 3). The axial load was applied using two vertical actuators through a stiff steel beam to achieve uniform distribution of the vertical load. A set of steel rollers were used in-between the actuators and the steel beam to accommodate the potential lateral movement of the wall. A rubber layer was placed between the steel beam and the top of the concrete beam to provide a smooth surface for a better distribution of stress. The horizontal load was applied to the wall using an actuator acting against the reaction wall. Displacements of the wall were measured using LVDTs, as shown in Figure 5. LVDT 1-1 measures horizontal deformation, whereas instrument 1–2 records deformation of the inner leaf. LVDTs 2-1–2-3 capture the horizontal deformation at the center of the inner leaf at a different height. The LVDTs were fixed on the bottom beam to ensure stable reference of measurements while eliminating the influence of any potential movement of the bottom beam. Displacement sensors 2-4–2-6 measure the horizontal relative displacement between the inner and outer leaf at different heights. Strain gauges 3-1–3-8 monitor strains in the ties at various locations shown in Figure 5. The walls were subjected to in-plane cyclic loading, which was applied at the top ring beam on the inner leaves. The cyclic loading sequence consisted of two loading regimes and was adopted for all tests, as shown in Figure 6. Two test regimes were used. The first regime consisted of load-controlled cycles with load magnitudes limited by the wall cracking strength. These force cycles involved two cycles with stresses at 20% of the predicted cracking strength and one cycle at the predicted cracking strength. The predicted cracking strength was 400 kN, which was approximately equal to the sum of the cracking strength of the inner and outer leaf. The second regime was a displacement-controlled cyclic loading, where walls were cycled three times to the displacement of 1∆c (∆c was the displacements at the first wall crack), 2∆c, and 3∆c, respectively. This was done to study the degradation of the stiffness and strength. This was followed by one cycle after the displacement of 3∆c to the prescribed drift target, which was intended to investigate the restoring force model of the walls. Failure was defined as the point on the loading curve where the strength of the wall specimen decreased to 85% of the previously recorded maximum strength.

2.3. Materials Properties

The average compressive strength of concrete was 19.1 MPa, while the mean value of brick compression strength, f’m, for all specimens was 10 MPa. The mortar crushing strength, f’j, values are summarized in Table 2. Since the insulating layer was subjected to the same curing condition of the walls, its crushing, shearing, and bonding strengths were recorded at the same time as the walls. The insulating mortar had average crushing strength of 0.27 MPa, average shearing strength of 0.10 MPa, and an average bonding strength between insulating mortar and brick of 0.04 MPa. The diameter of the ties was 4 mm, while the diameter of the stirrups RC beams and constructional columns was 6 mm. The diameter of the longitudinal reinforcing bars in the RC beams and constructional columns was 12 mm. The average tensile yield strength fy for 4, 6- and 12-mm reinforcing steel rebar was 607.5, 268.3, and 368.5 MPa, respectively.

3. Experimental Results

3.1. Test Observations and Crack Patterns

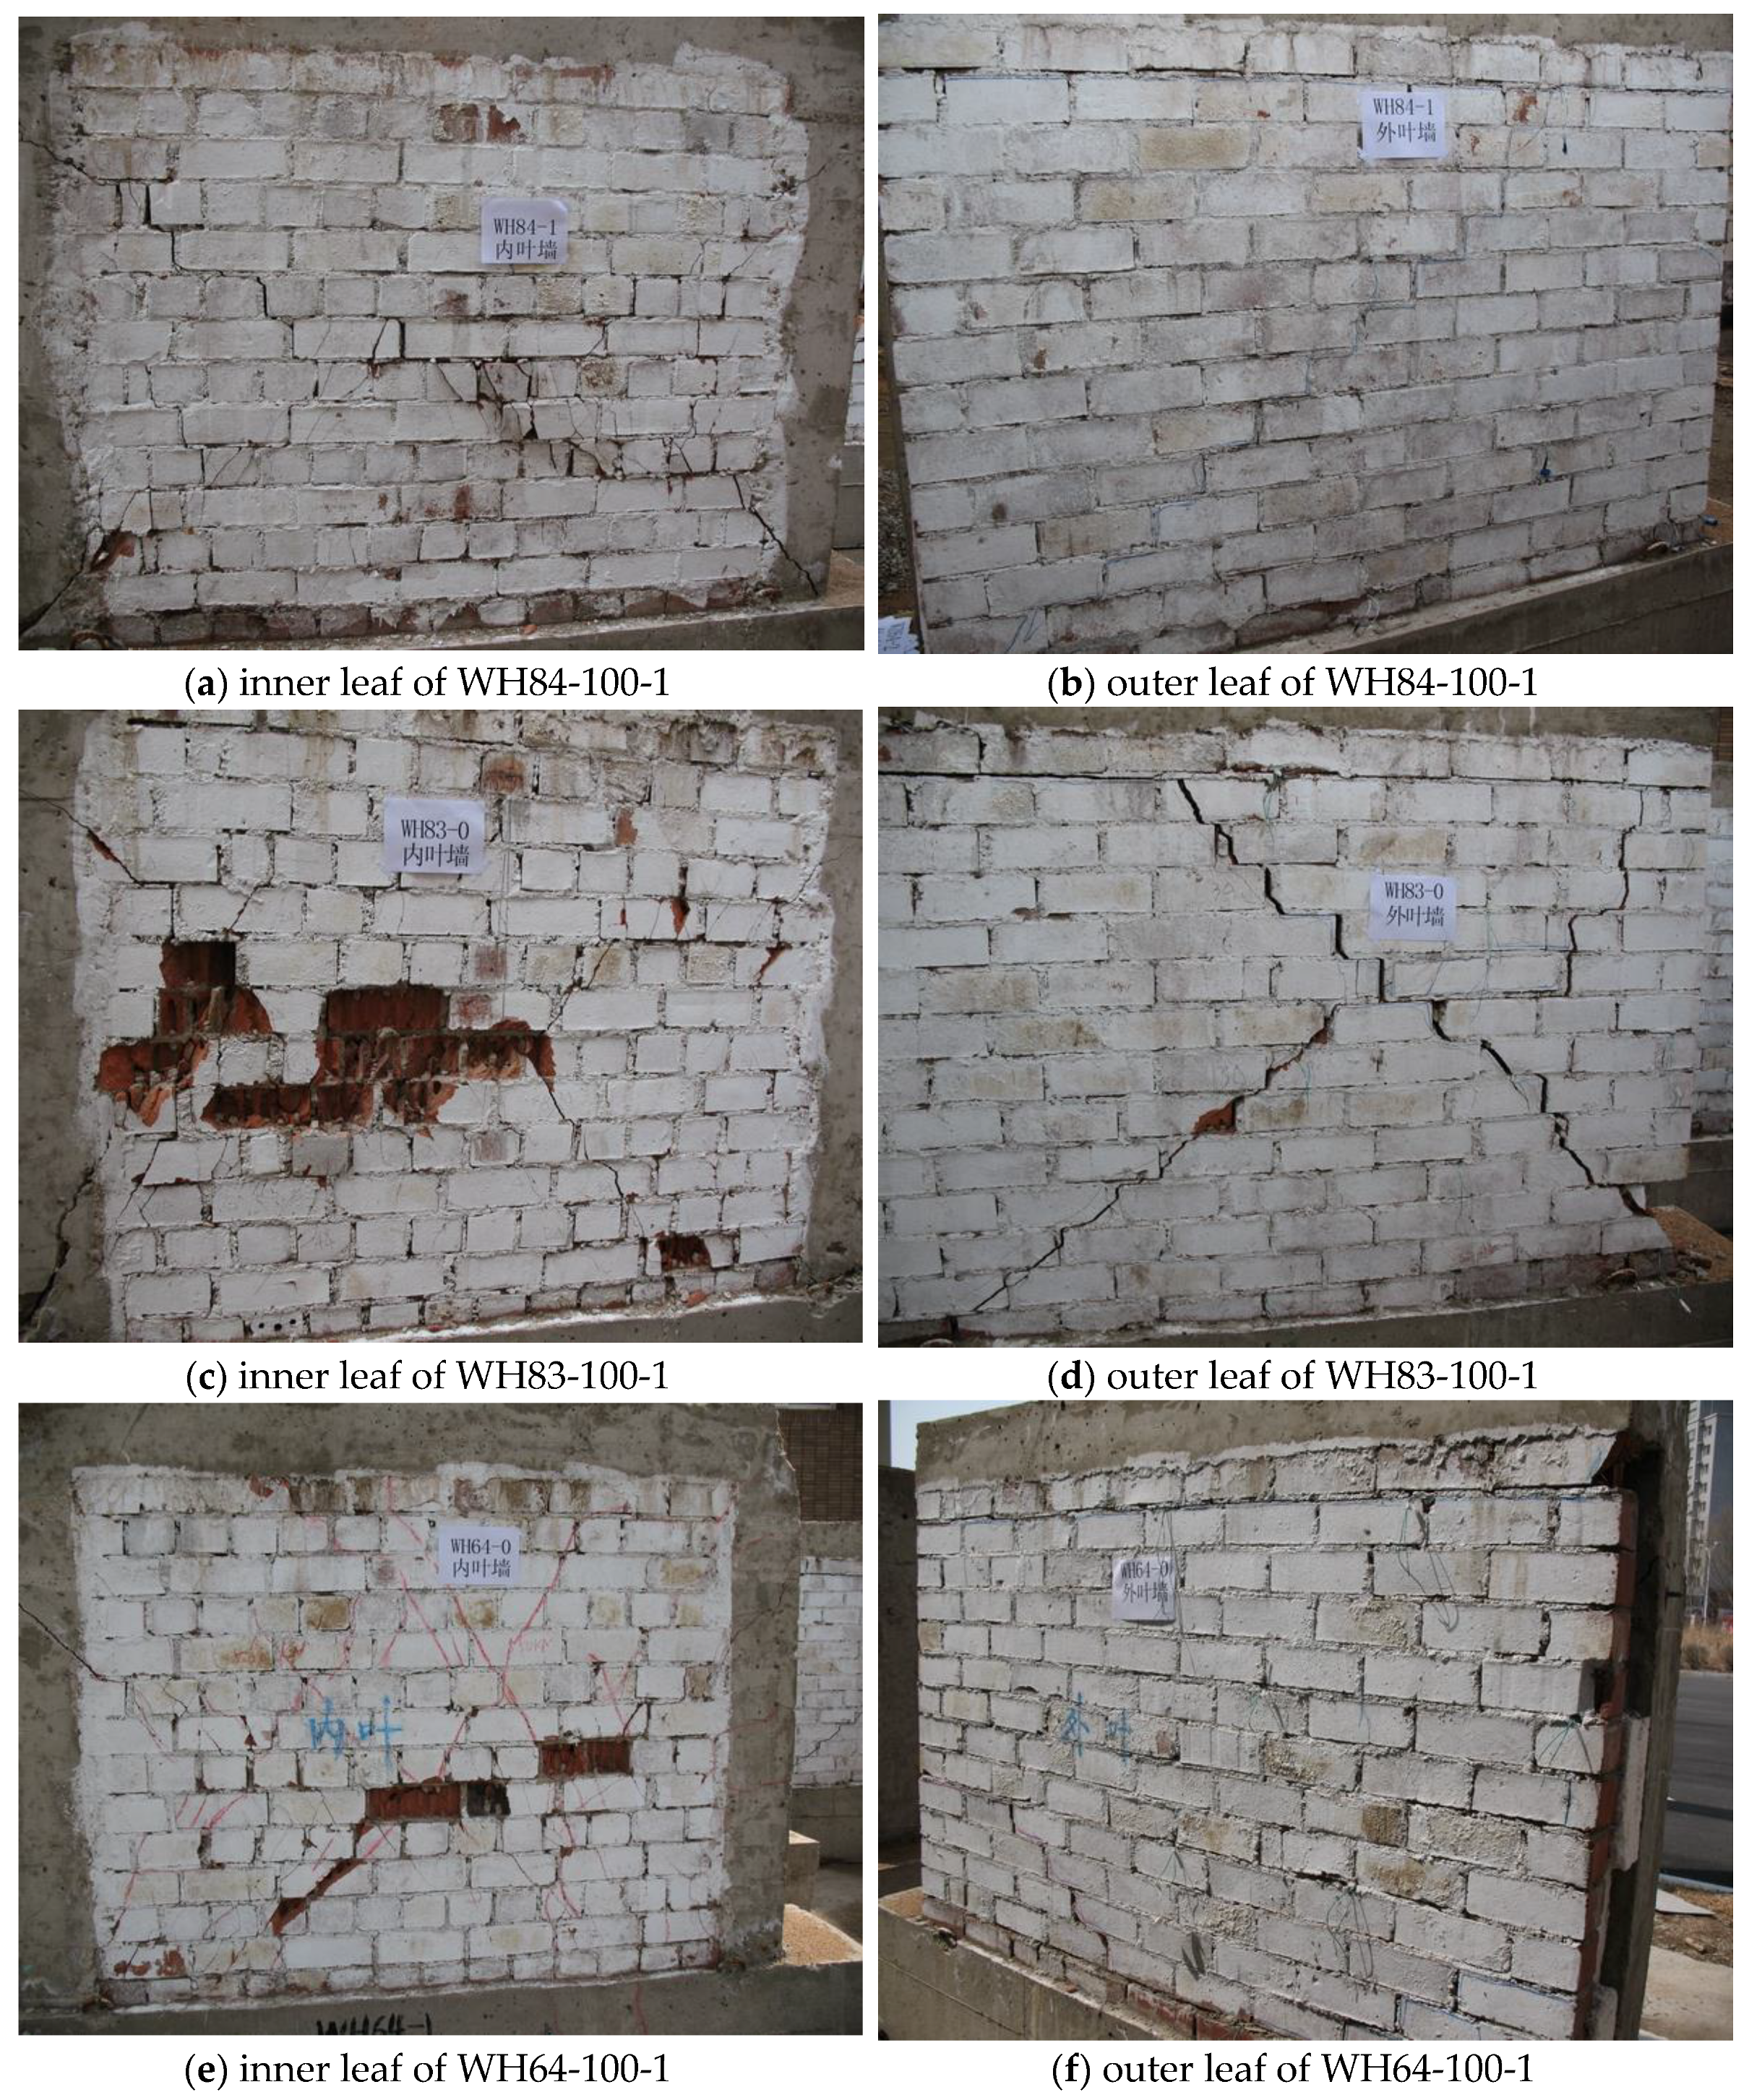
For all tested masonry wall specimens, failure was initiated by horizontal flexural cracks followed by the development of wide, diagonal cracks extending throughout the inner leaves. The behavior of the walls can be characterized by three critical points: formation of flexural crack, the opening of diagonal cracks, and crushing of the bottom corners. Figure 7 illustrates typical wall cracking patterns at the end of testing for three specimens. The walls exhibited shear failure as first fine diagonal cracks appeared in the inner leaves. As lateral displacement increased, the length of the diagonal cracks increased. At this stage, strains of the vertical reinforcement increased significantly, demonstrating its effective role in bearing tensile flexural stresses, avoiding the uplift of the base of the wall. With increasing lateral displacements, easily detectable diagonal cracks developed in mortar joints.
During the displacement-controlled cyclic regime, after three cycles at the displacement of 1∆c (about 1.6 mm), first fine diagonal cracks in the inner leaf could be observed, while the width of diagonal cracks reached about 0.4 mm. During the three subsequent cycles at a displacement of 2∆c, the width of the diagonal crack increased to about 1.3 mm. During the three cycles at a displacement of 3∆c, the diagonal crack widened to about 3 mm, and their length also increased. New irregular cracks were observed as the crack opening increased and extended to the diagonal crack. At this stage, the loading had reached a maximum of about 1.5 times the cracking load. During the cycle at a displacement of 4∆c, the diagonal crack continued to widen to about 5 mm, and diagonal cracks in the inner and outer leaf emerged. After the cycle at a displacement of 5∆c, the load began to decline. Eventually, during the cycle at a displacement of 8∆c, the carrying capacity decreased below 85% of the ultimate load, which was considered a failure.

3.2. Load Versus Displacement Response

The critical loads and corresponding displacements of the specimens are reported in Table 3, where Pc and Pu indicate the cracking load and ultimate load, respectively. ∆c, ∆u, and ∆0.85 indicate displacements corresponding to the cracking load, ultimate load, and displacement when the load decreases to 85% of the ultimate load, respectively.
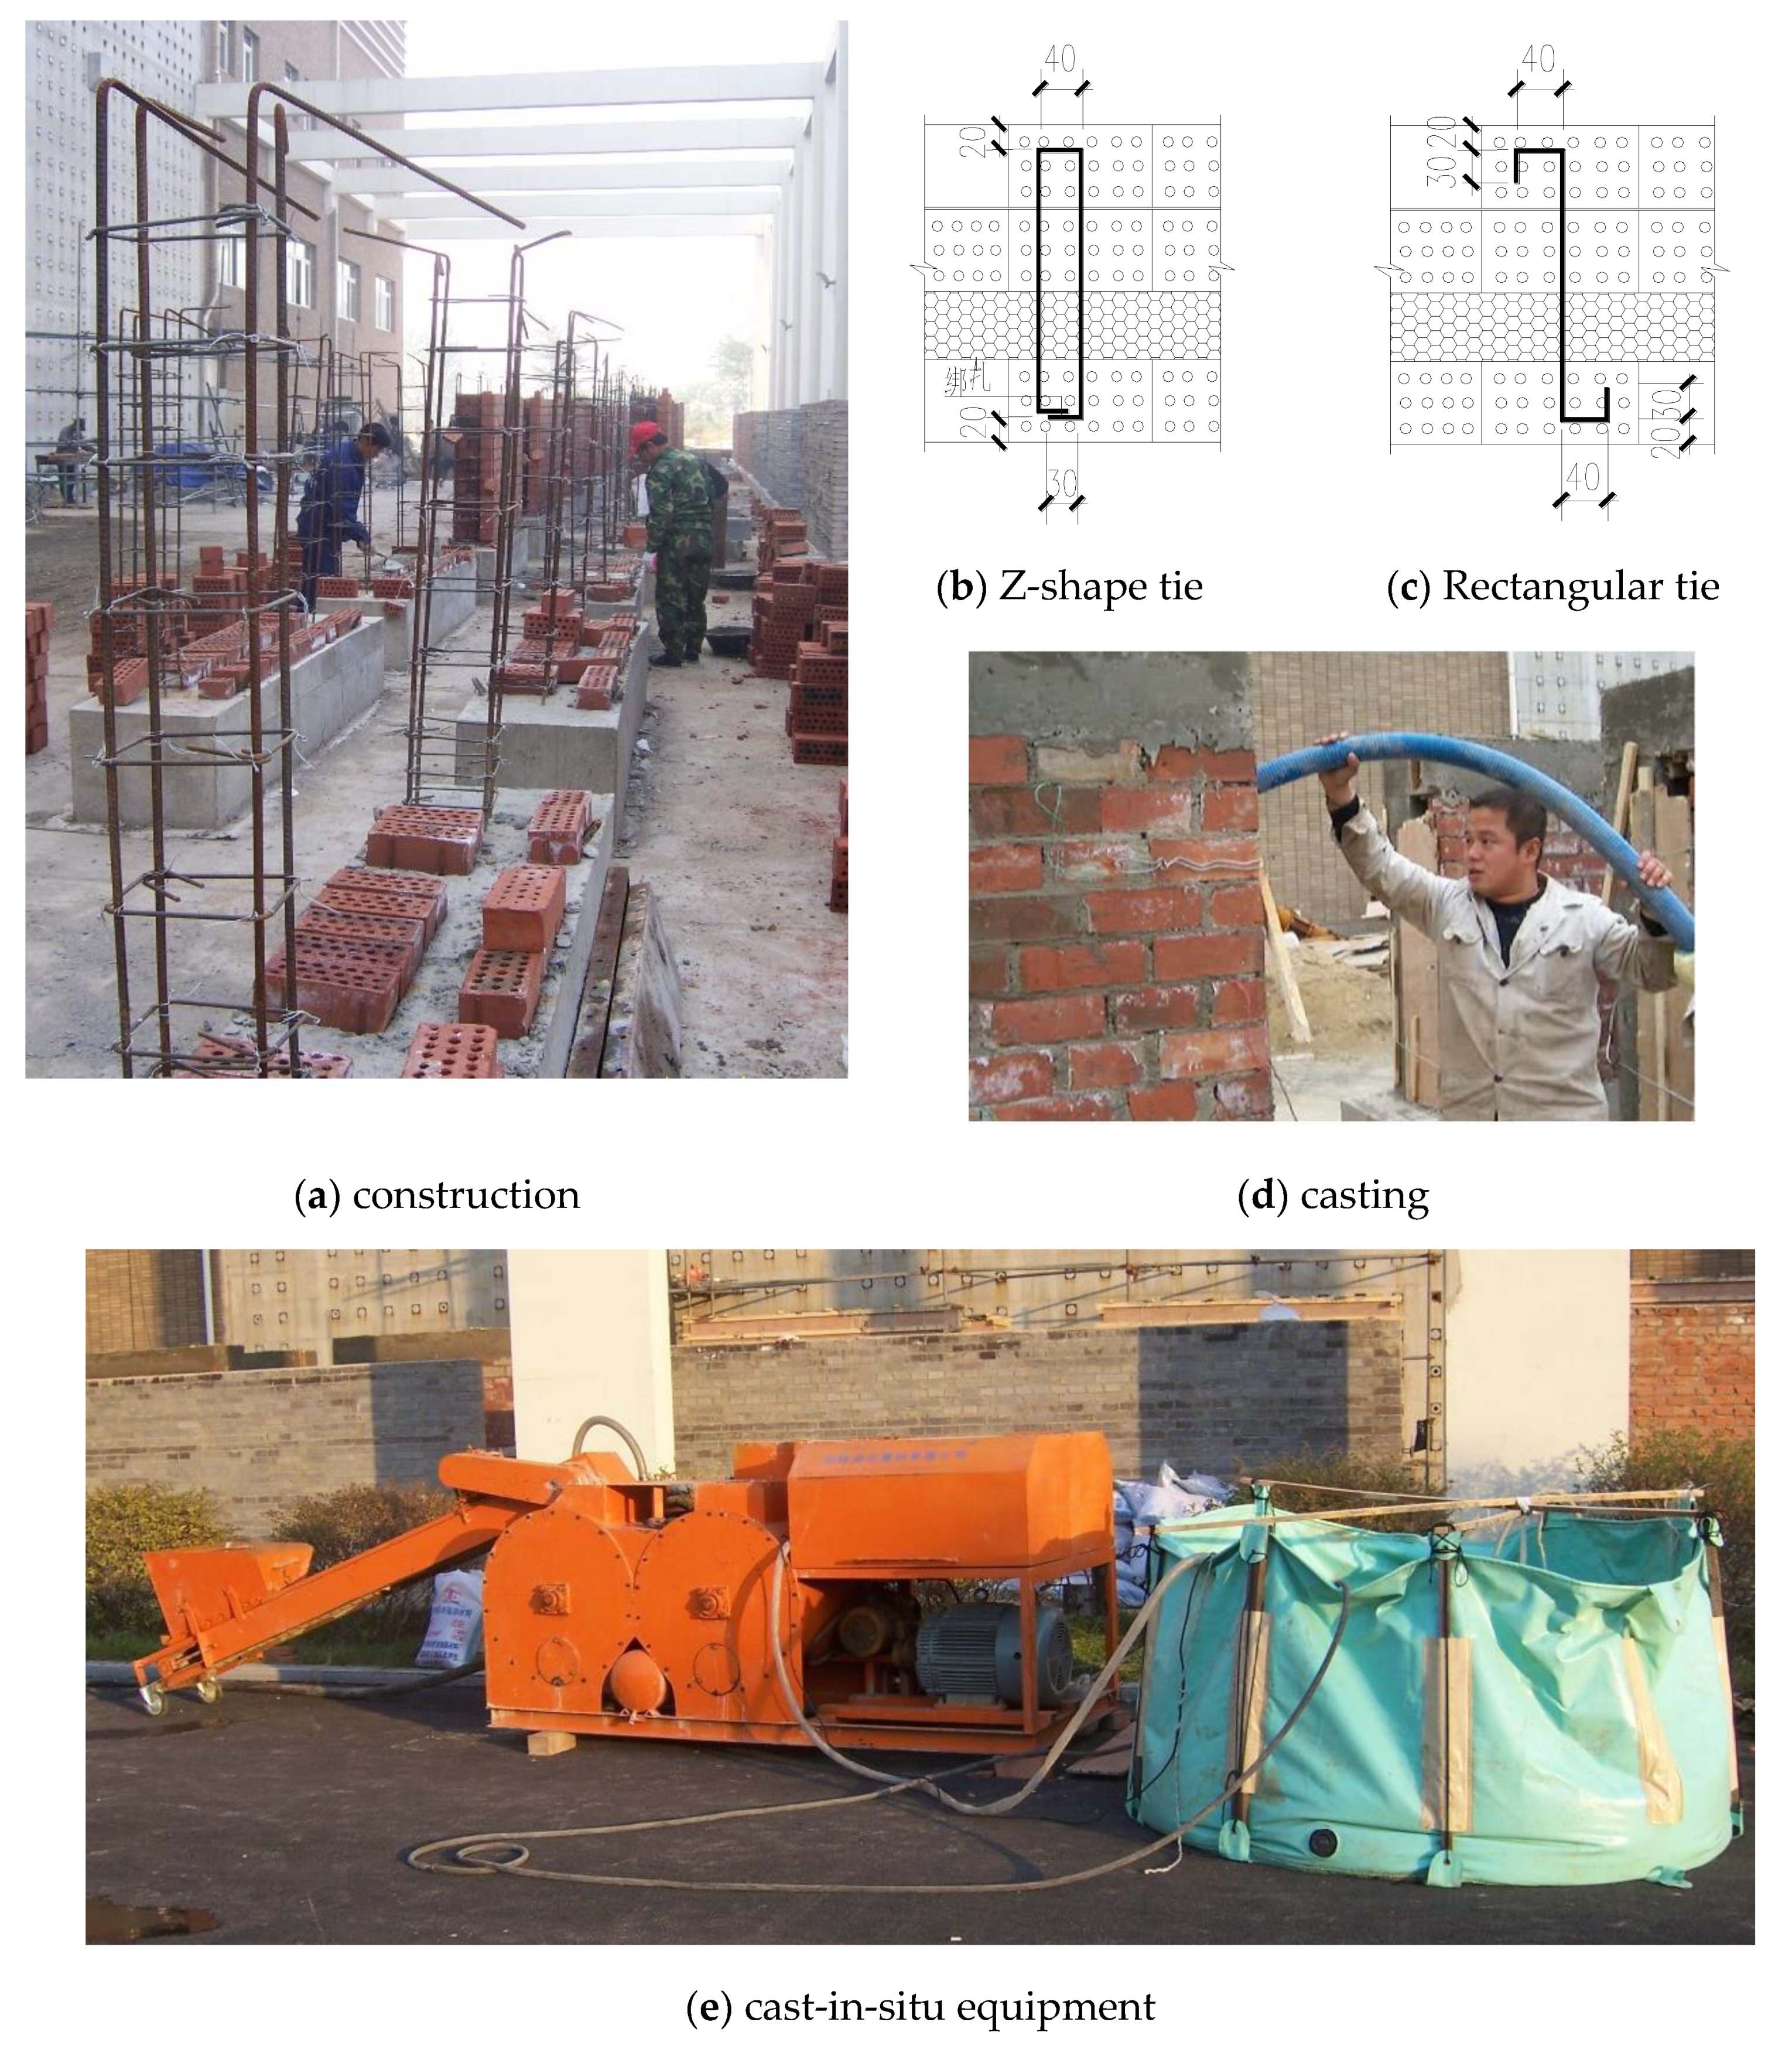
The cracking loads of walls WH83-120-1 and WH64-120-1 were 458 and 454 kN, respectively, while the corresponding ultimate loads were 559 and 540 kN. The rectangular ties were replaced with Z-shaped ties, thus increasing the cracking loads and ultimate loads of wall WZ83-120-1 by 64 and 102 kN, respectively. However, the cracking and ultimate loads of wall WZ64-120-1 decreased by 32 and 37 kN.
The cracking loads of walls WH84-100-1 and WH84-120-1 were 484 and 452 kN, with ultimate loads of 629 and 532 kN, respectively. The vertical spacing of ties was then decreased by 100 mm. Consequently, the cracking and ultimate loads of wall WH83-100-1 increased by 69 and 80 kN, respectively, while that of wall WH83-120-1 increased by 6 and 27 kN, respectively. The horizontal spacing of ties was then decreased by 200 mm. This led to increasing the cracking loads of wall WH64-100-1 by 24 and 80 kN, and an ultimate load decrease of 2 kN. The cracking and ultimate loads of wall WH64-120-1 increased by 2 and 8 kN, respectively.
The shape and layout of ties had a negligible effect on the shear strength of the cast-in-situ masonry cavity walls because the ties behaved as a flexible connection and had limited capacity to coordinate the inner and outer leaves before the failure of the wall specimens. However, the ties could prevent collapsing after the walls had cracked severely.
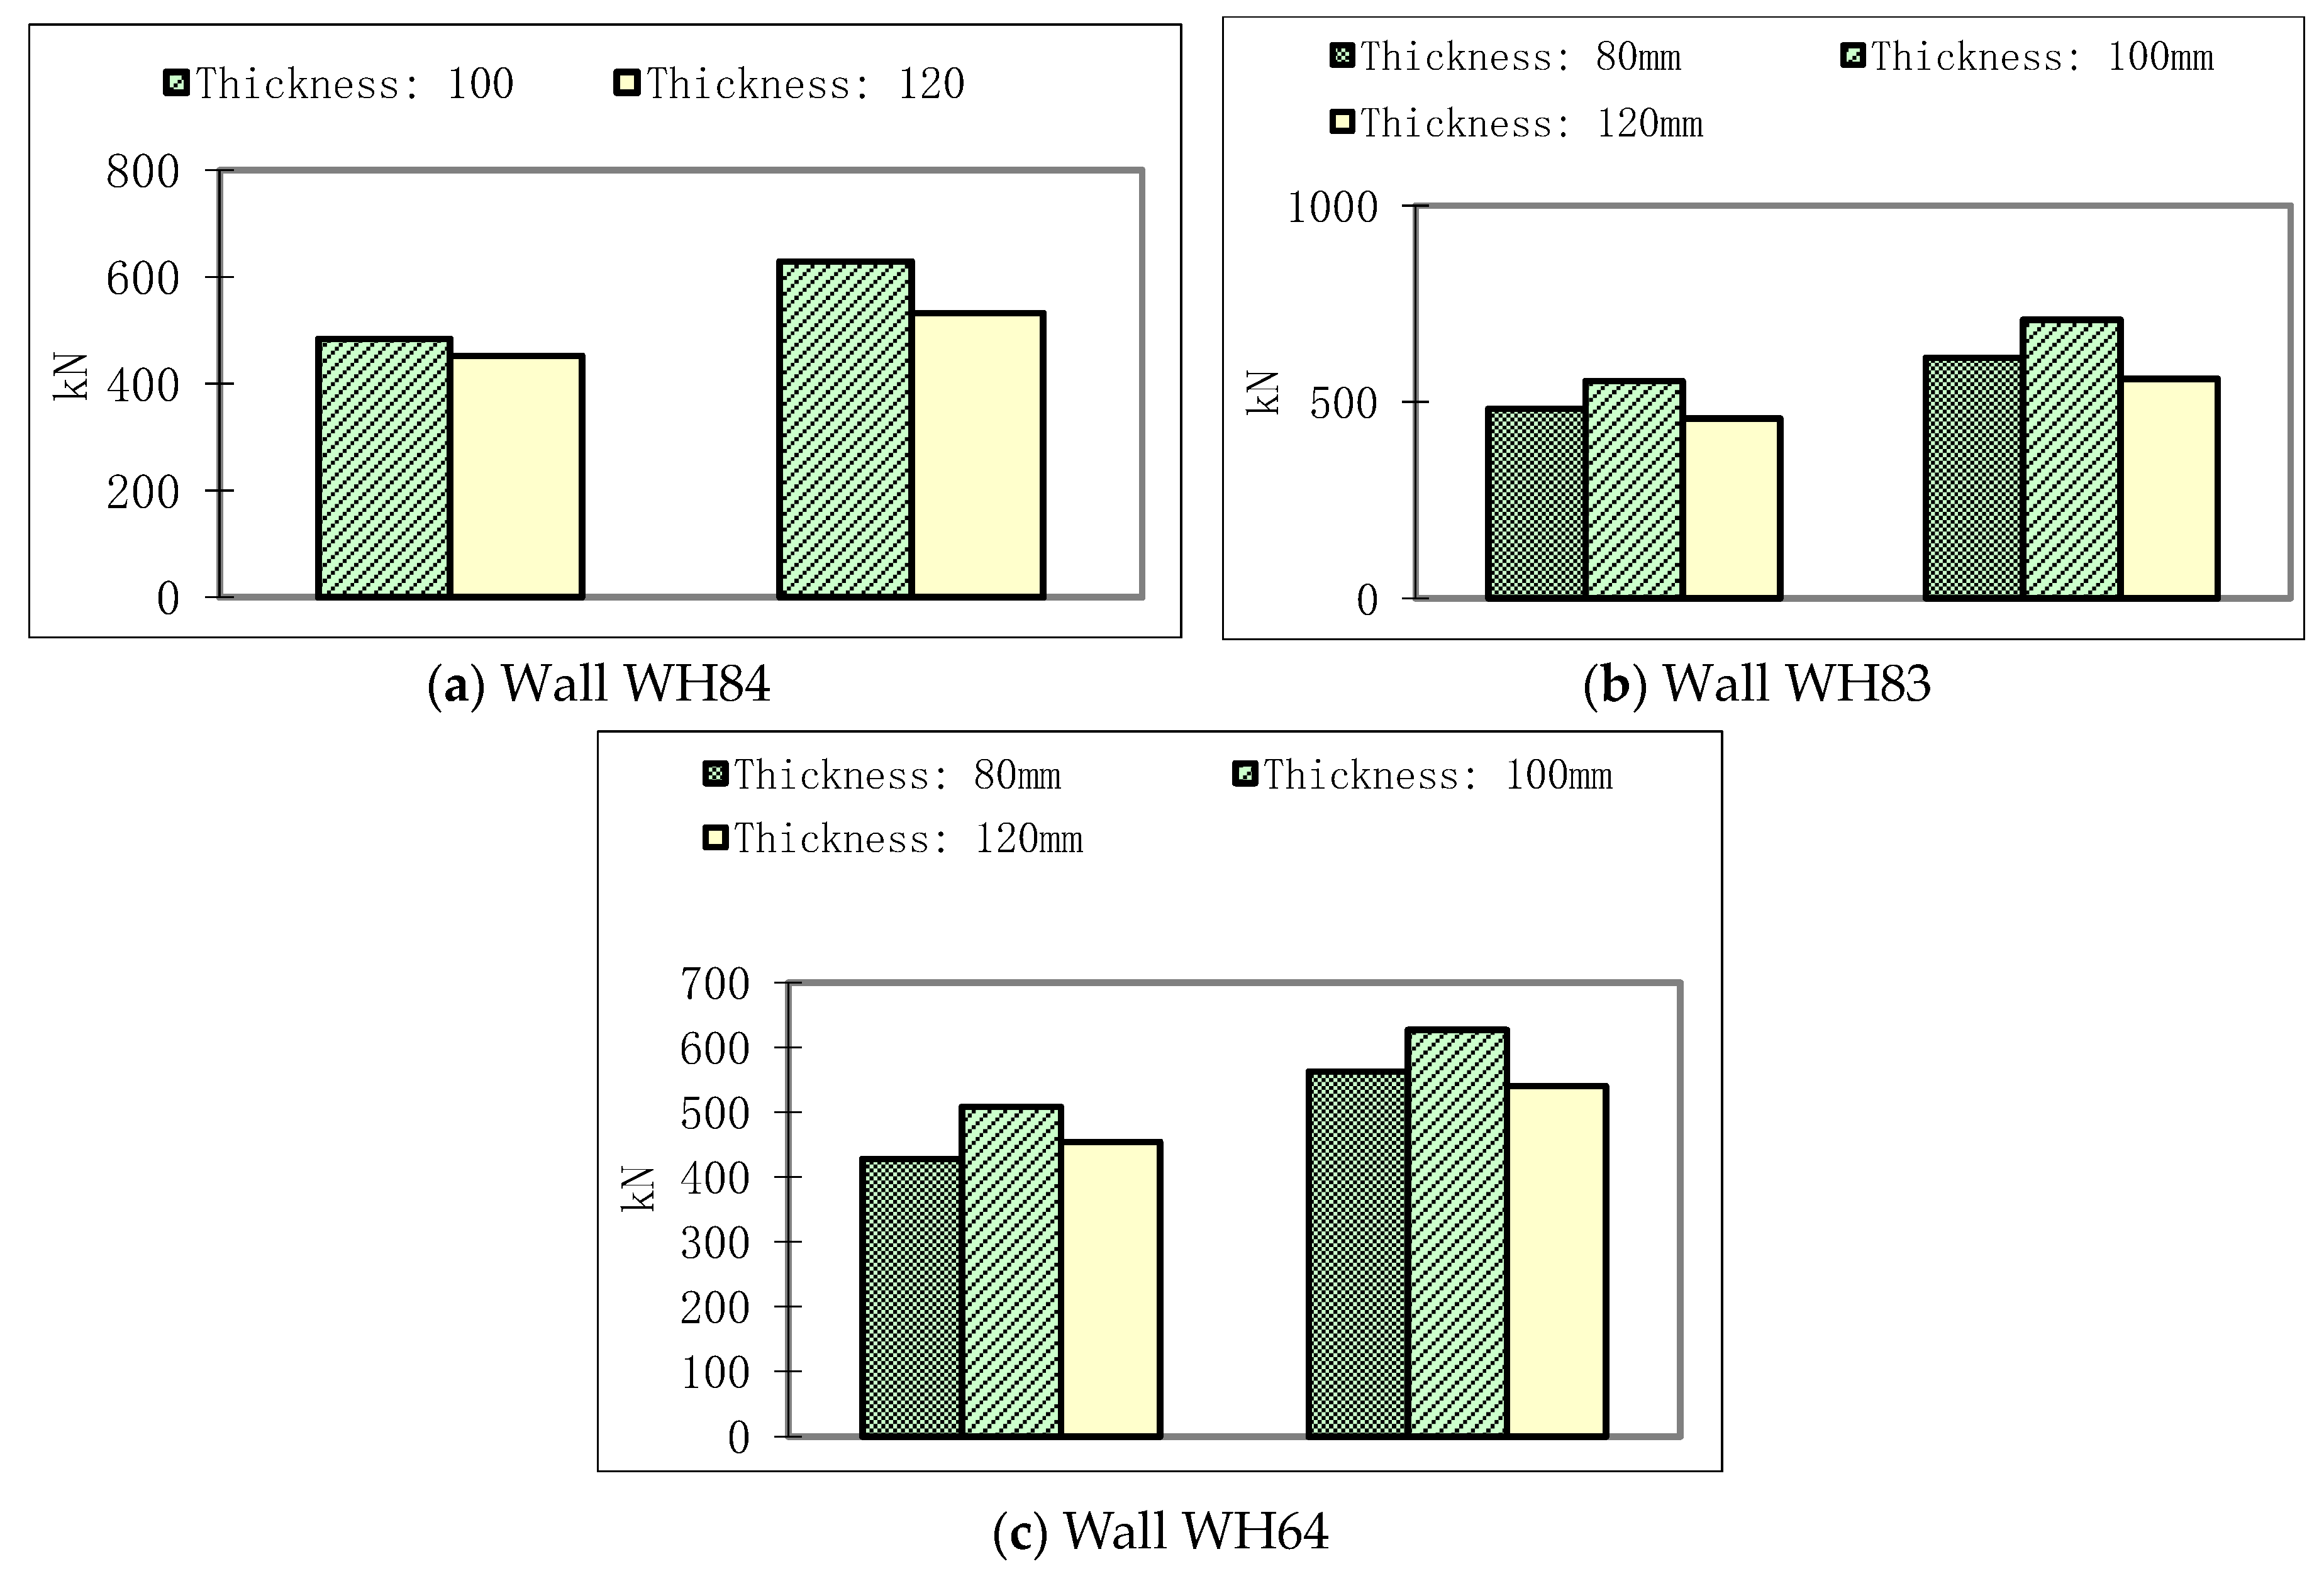
The cracking and ultimate loads of wall WH84-100-1 were 484 and 629 kN, respectively (Figure 8a). The walls had similar dimensions and reinforcement details, but the thickness of the insulating layer was varied. When this thickness increased from 100 mm to 120 mm, the cracking and ultimate loads declined by about 32 and 96 kN, respectively. As shown in Figure 8b, the cracking and ultimate loads of wall WH83-80-1 were 483 and 612 kN, respectively. The cracking and ultimate loads of wall WH83-100-1 increased by 70 and 93 kN, respectively, while that of wall WH83-100-1 decreased by 25 and 53 kN, respectively. The corresponding cracking and ultimate loads of wall WH64-80-1 were 428 and 563 kN, respectively (Figure 8c), while that of wall WH64-100-1 increased by 80 and 64 kN, respectively. The cracking load of wall WH64-120-1 increased by 26 kN, and the ultimate load of wall WH64-120-1 decreased by 23 kN. The thickness of the insulating layer generally had a slightly negative influence on the wall shear strength. This is likely because the linear stiffness of the RC coupling beams connecting the inner and outer leaf decreased, and the coordination performance of inner and outer leaf degraded, imposing a negative effect on shear strength.
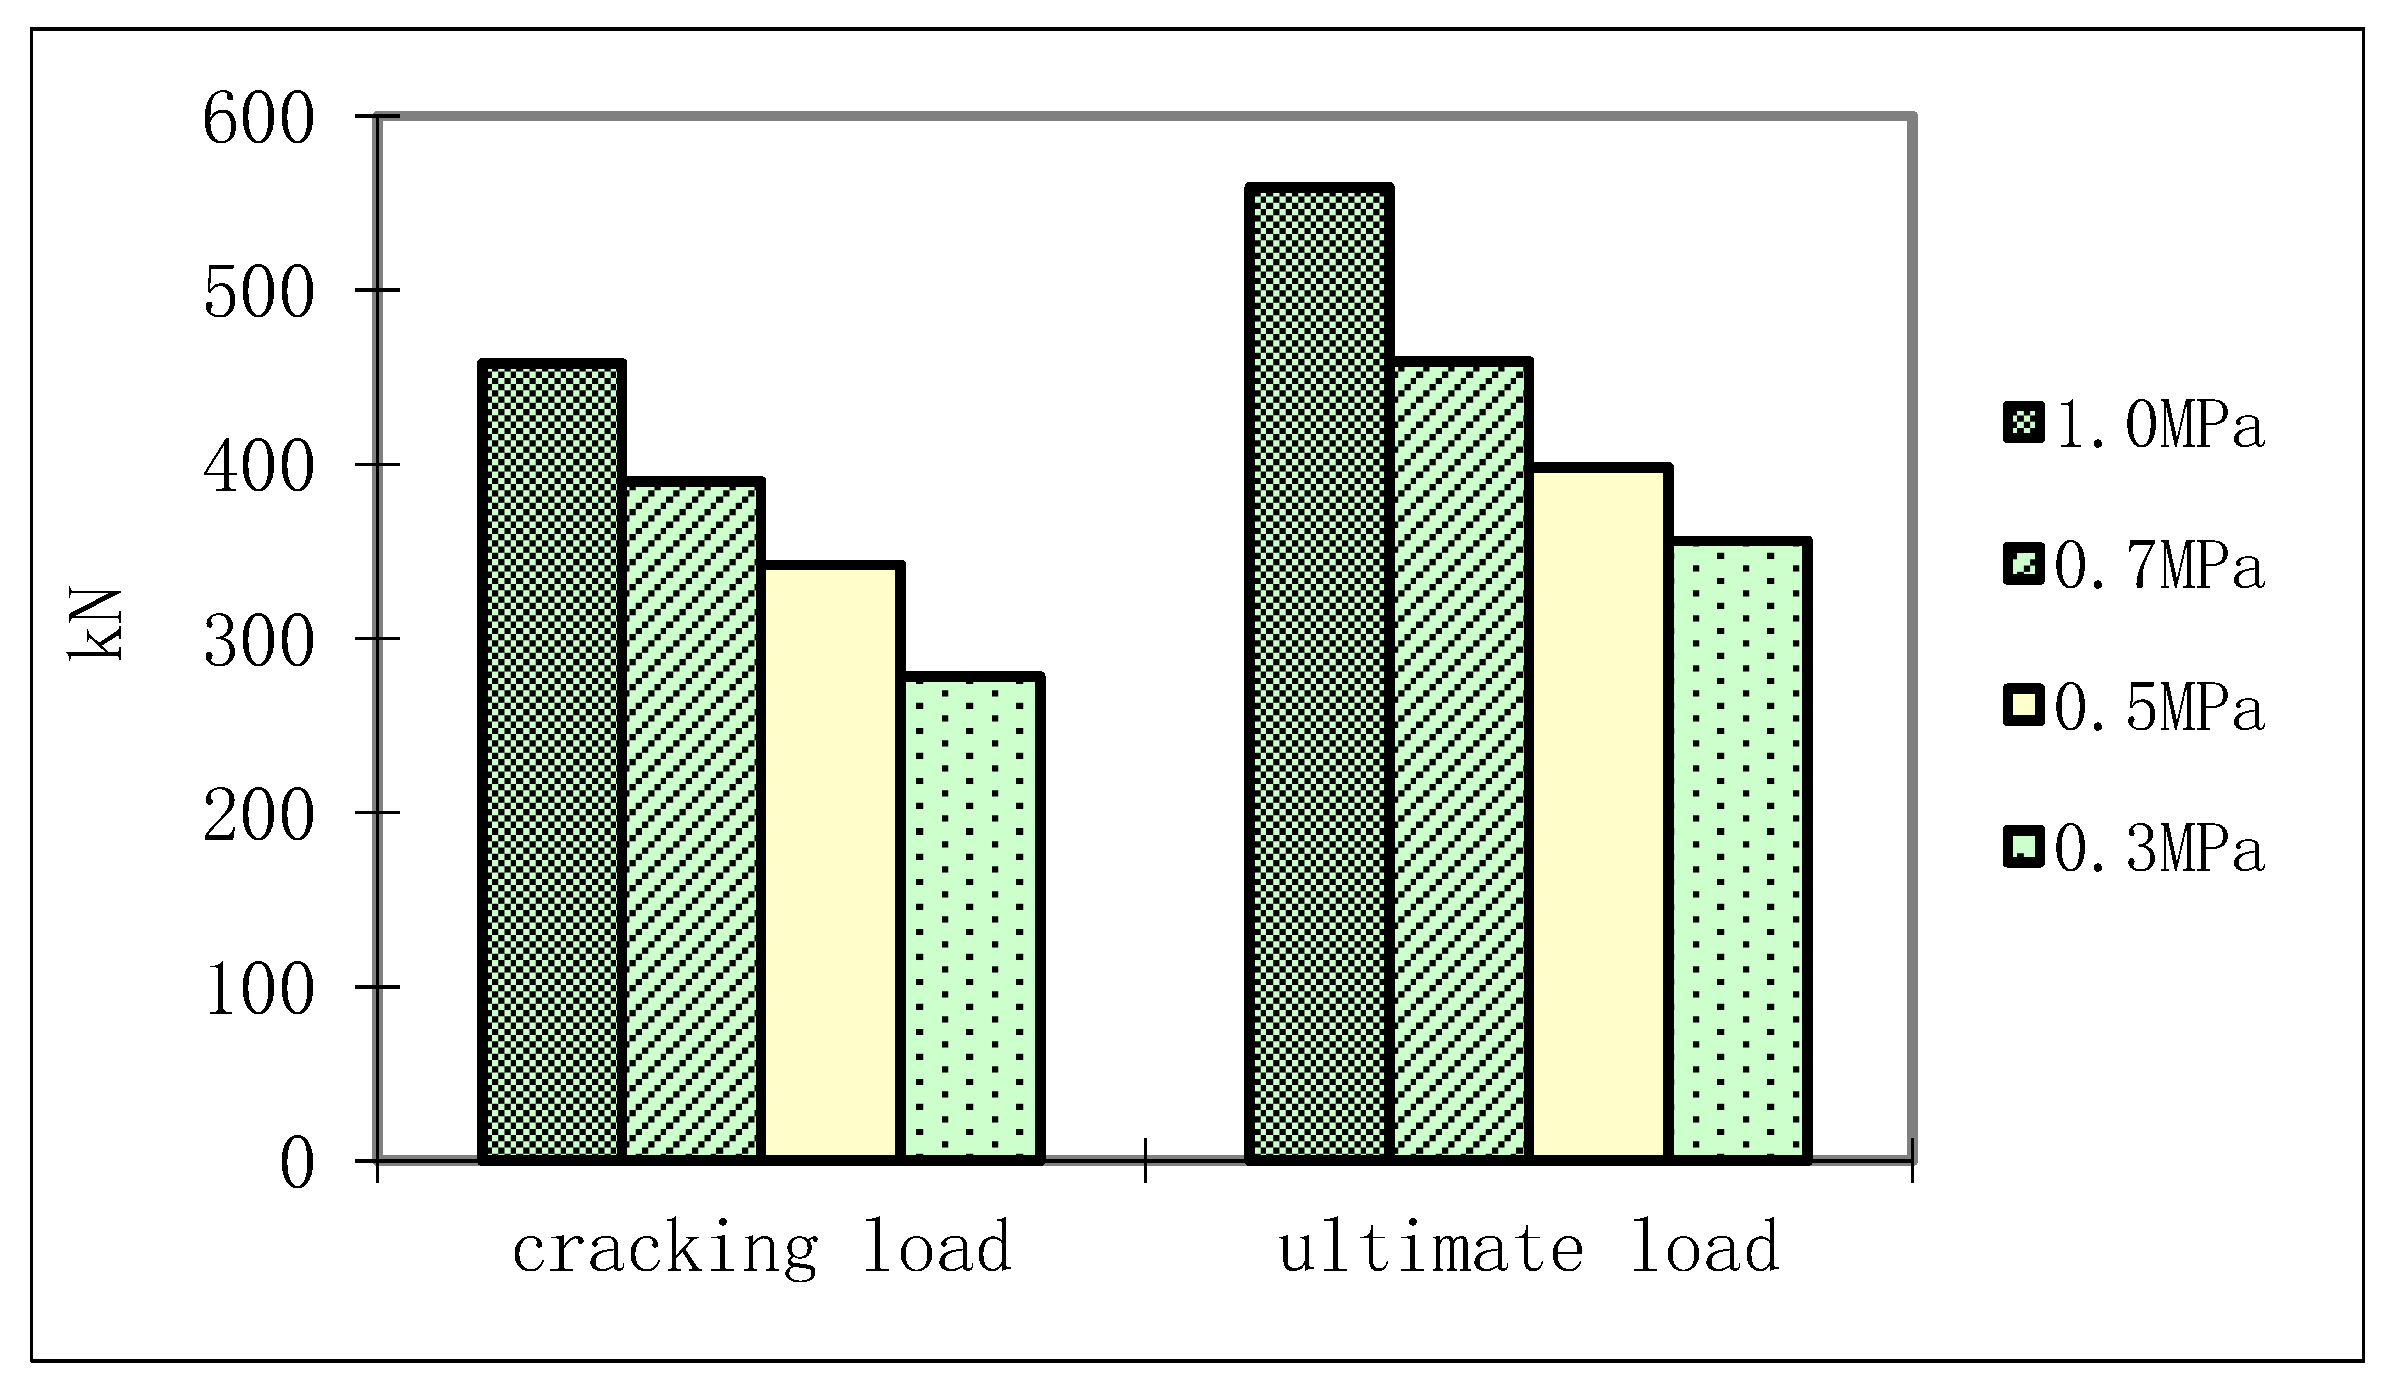
As shown in Figure 9, the axial compression stress had a positive influence on the shear strength. The performance of wall specimens having similar dimensions and reinforcement details under varying levels of axial compression stress was compared. The cracking and ultimate loads of wall WH83-120-0.3 were 278 and 356 kN, respectively. When the axial compression stress was increased from 0.3 MPa to 0.5 MPa, 0.7 MPa, and 1.0 MPa, the cracking load increased by about 23.0%, 40.3%, and 64.7%, respectively, while the ultimate load increased by 11.8%, 28.9%, and 57.0%, respectively. An increase in axial compression stress delayed the initiation of cracks until larger lateral force was applied. A larger lateral force was required to exceed the compressive field resulting from the larger axial load, and the compressive field must first be overcome before cracking can initiate, as explained by principal stresses. However, ductility indicators declined with increased axial compression stress, and the failure mode became more brittle. Therefore, it is recommended that the axial compression stress should not exceed 1.0 MPa.

3.3. Inner and Outer Leaves Coordination Performance

The load-displacement curves between the inner and outer leaves are shown in 
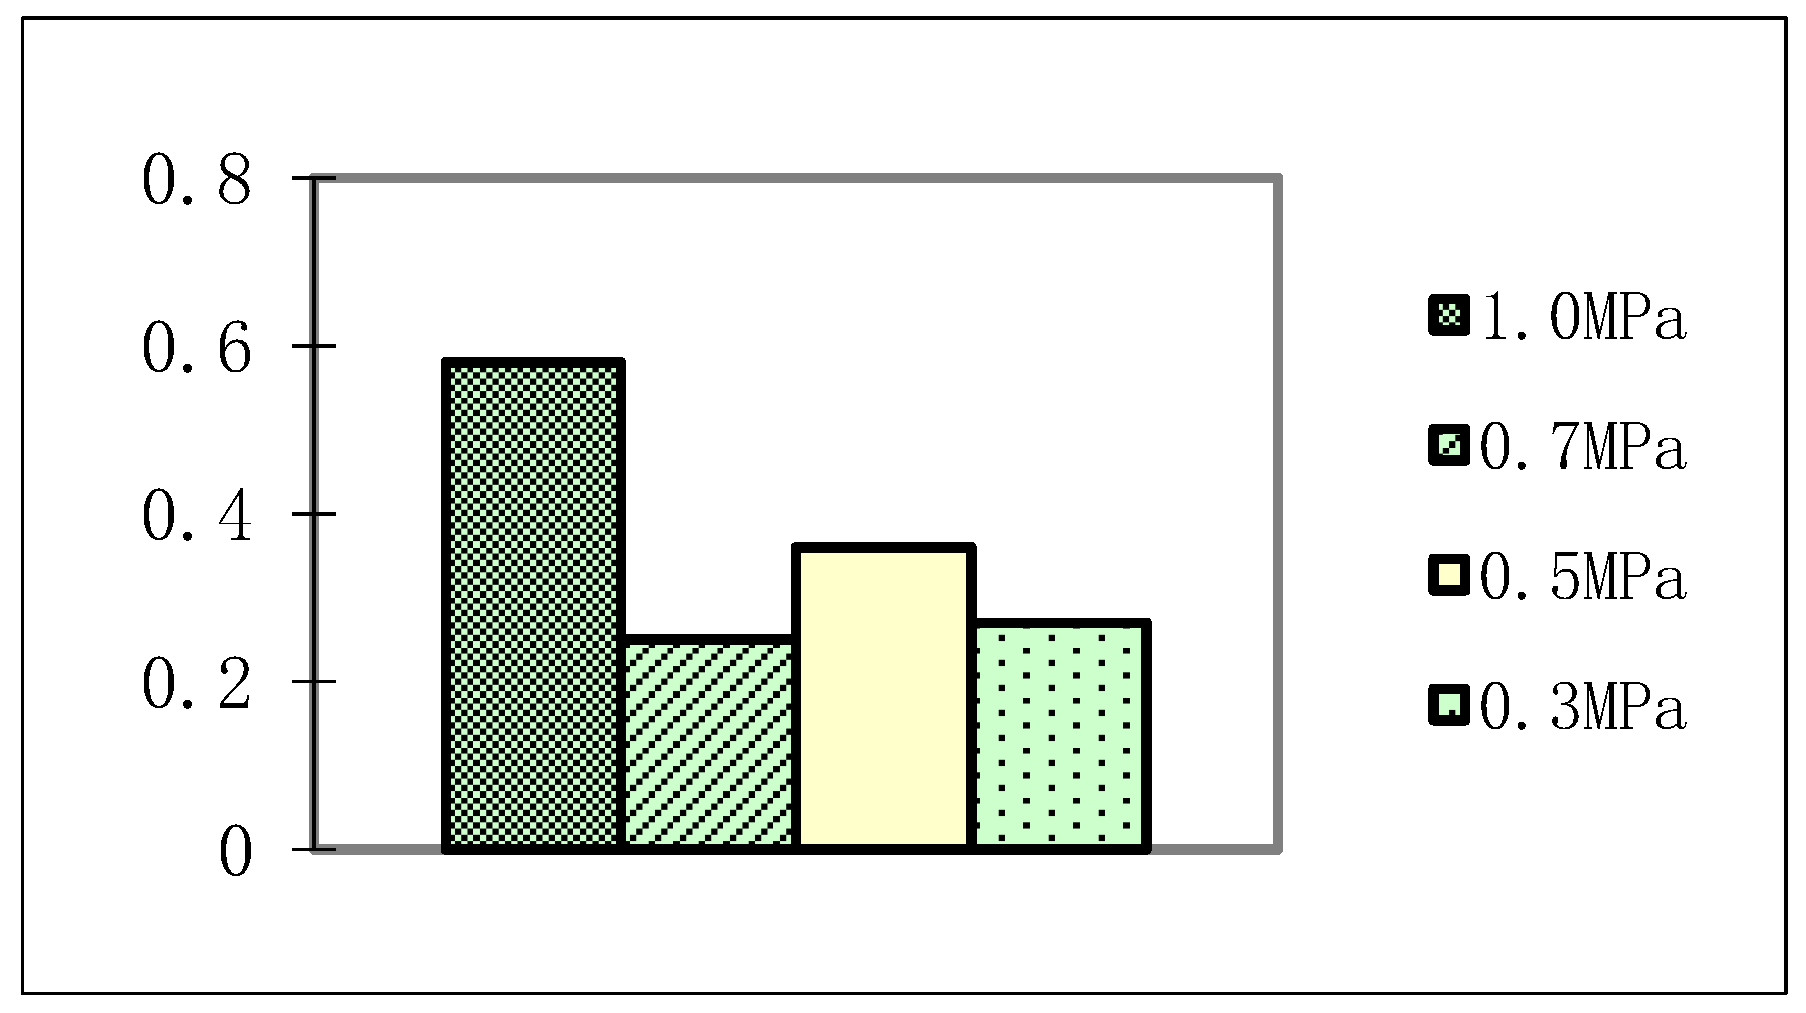
Figure 10. For all specimens, the displacements between the inner and outer leaves were nearly zero before the wall cracked and were less than 2 mm nearing the ultimate load. This indicates that the inner and outer leaves could work in coordination. The relative displacements for the thirteen walls are summarized in Table 4, where δ is the maximum displacement between the inner and outer leaves and ∆ is the maximum displacement of the cast-in-situ masonry cavity wall. The ratio δ/∆ was about 0.25–0.58. The value of δ for walls WH83-120-1 and WH64-120-1 was 8.0 and 7.8 mm, and their δ/∆ was 0.58 and 0.52, respectively.
Rectangular ties were replaced by Z-shape ties. Accordingly, the δ of walls WZ83-120-1 and WZ64-120-1 was 9.0 and 8.0 mm, while their δ/∆ values were 0.56 and 0.55, respectively. Likewise, the δ of walls WH84-100-1 and WH84-120-1 was 6.4 and 7.1 mm, and their δ/∆ was 0.47 and 0.51, respectively. The vertical spacing of ties was subsequently decreased by 100 mm. Hence, δ of walls WH83-100-1 and WH83-120-1 was 6.4 and 8.0 mm, while their calculated δ/∆ values were 0.40 and 0.58, respectively. The horizontal spacing of the ties was later decreased by 200 mm. Thus, the δ of walls WH64-100-1 and WH64-120-1 was 4.9 and 7.8 mm, and their δ/∆ values were 0.33 and 0.52, respectively. Generally, the shape and layout of the ties had a slight influence on the coordination work performance of the inner and outer leaves.
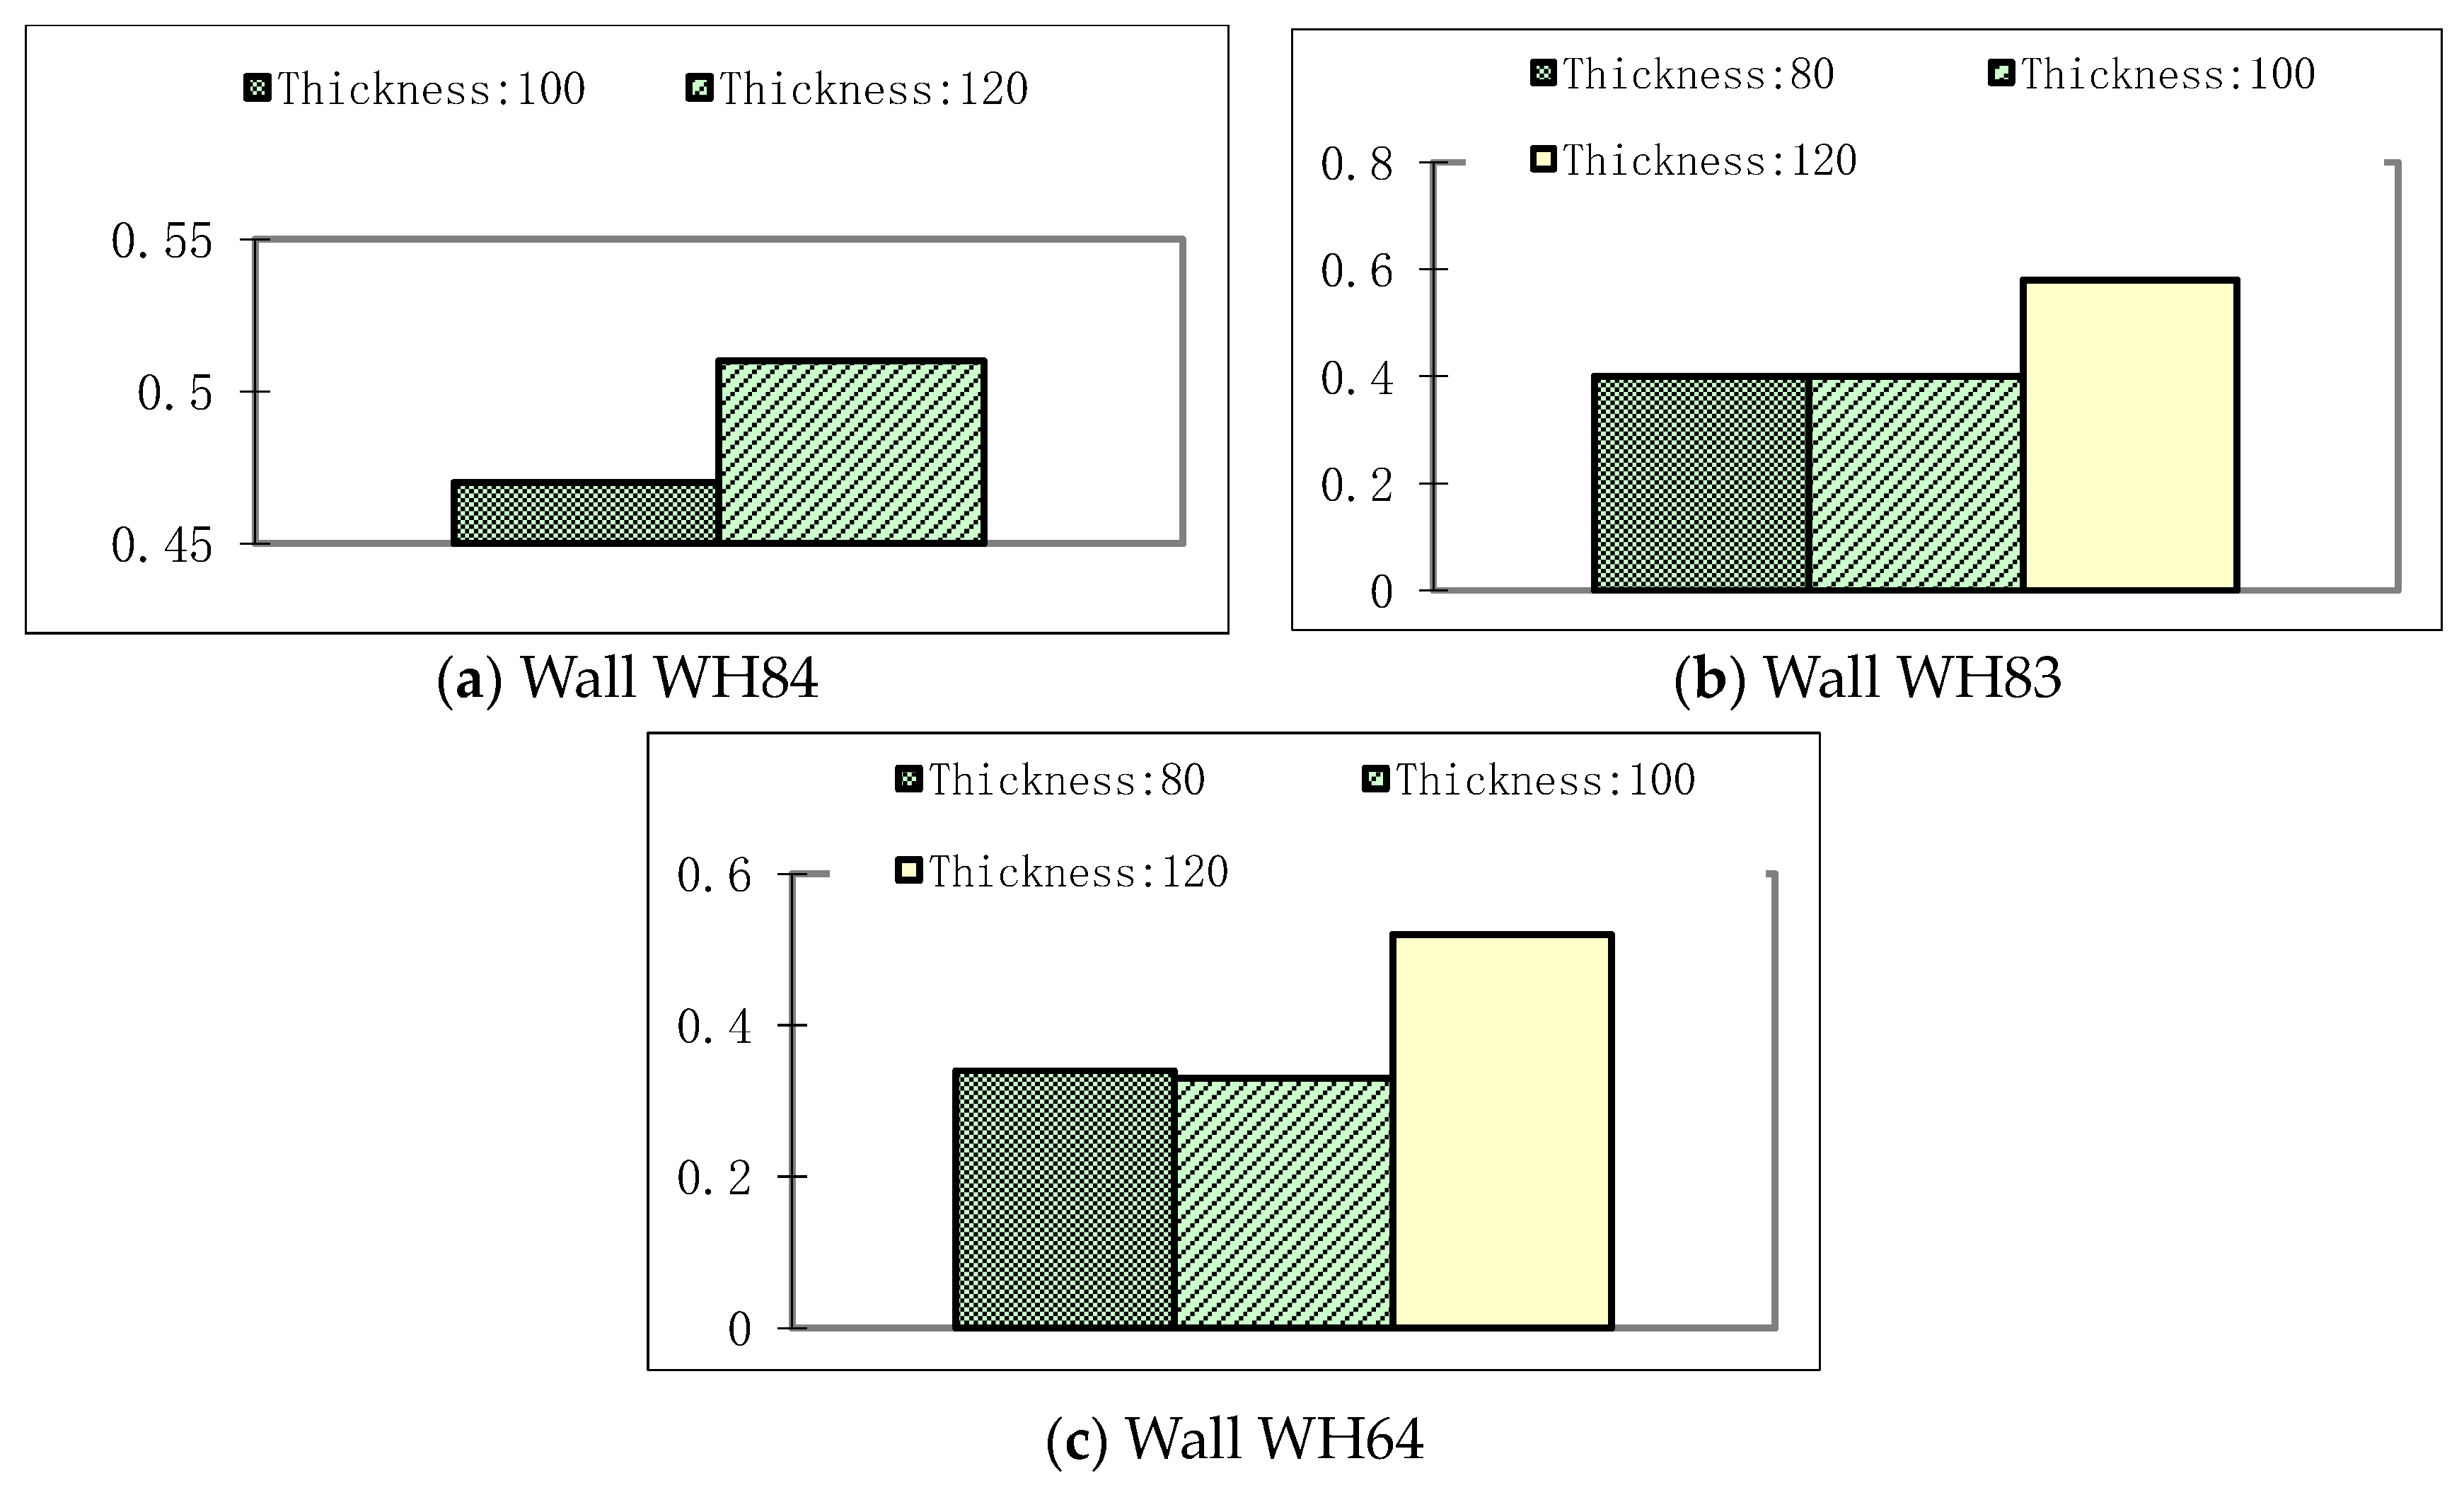
As shown in Figure 11a, the ratio of maximum displacement of the inner to that of the outer leaves over the maximum displacement for the cast-in-situ masonry cavity wall WH84-100-1 was 0.47. The wall specimens had similar dimensions and reinforcement details, but the thickness of insulating layer was increased from 100 mm to 120 mm, making the δ/∆ value increase by 8.5%.
Figure 11b shows that the δ/∆ of wall WH83-80-1 was 0.40. When the thickness of the insulating layer was increased from 80 to 100 and 120 mm, the δ/∆ value increased by 0% and 45%, respectively. Likewise, δ/∆ of wall WH64-80-1 was 0.34 (Figure 11c). When the thickness of the insulating layer was increased from 80 to 100 and 120 mm, δ/∆ increased by 3% and 53%, respectively. It was concluded that δ/∆ increased with increasing thickness of the insulating layer, while coordination work performance of the walls declined.
Figure 12 shows that δ/∆ of wall WH83-120-0.3 was 0.27. The performance of the wall specimens having similar dimensions and reinforcement details subjected to varying levels of axial compression stress were compared. When the axial compression stress was increased from 0.3 MPa to 0.5 MPa, 0.7 MPa, and 1.0 MPa, δ/∆ was 0.36, 0.25, and 0.58, respectively. The δ/∆ decreased as the axial compression stresses decreased, and the coordination work performance of the walls increased. The axial compression stress generally had a negative influence on the cooperation work performance of inner and outer leaves.

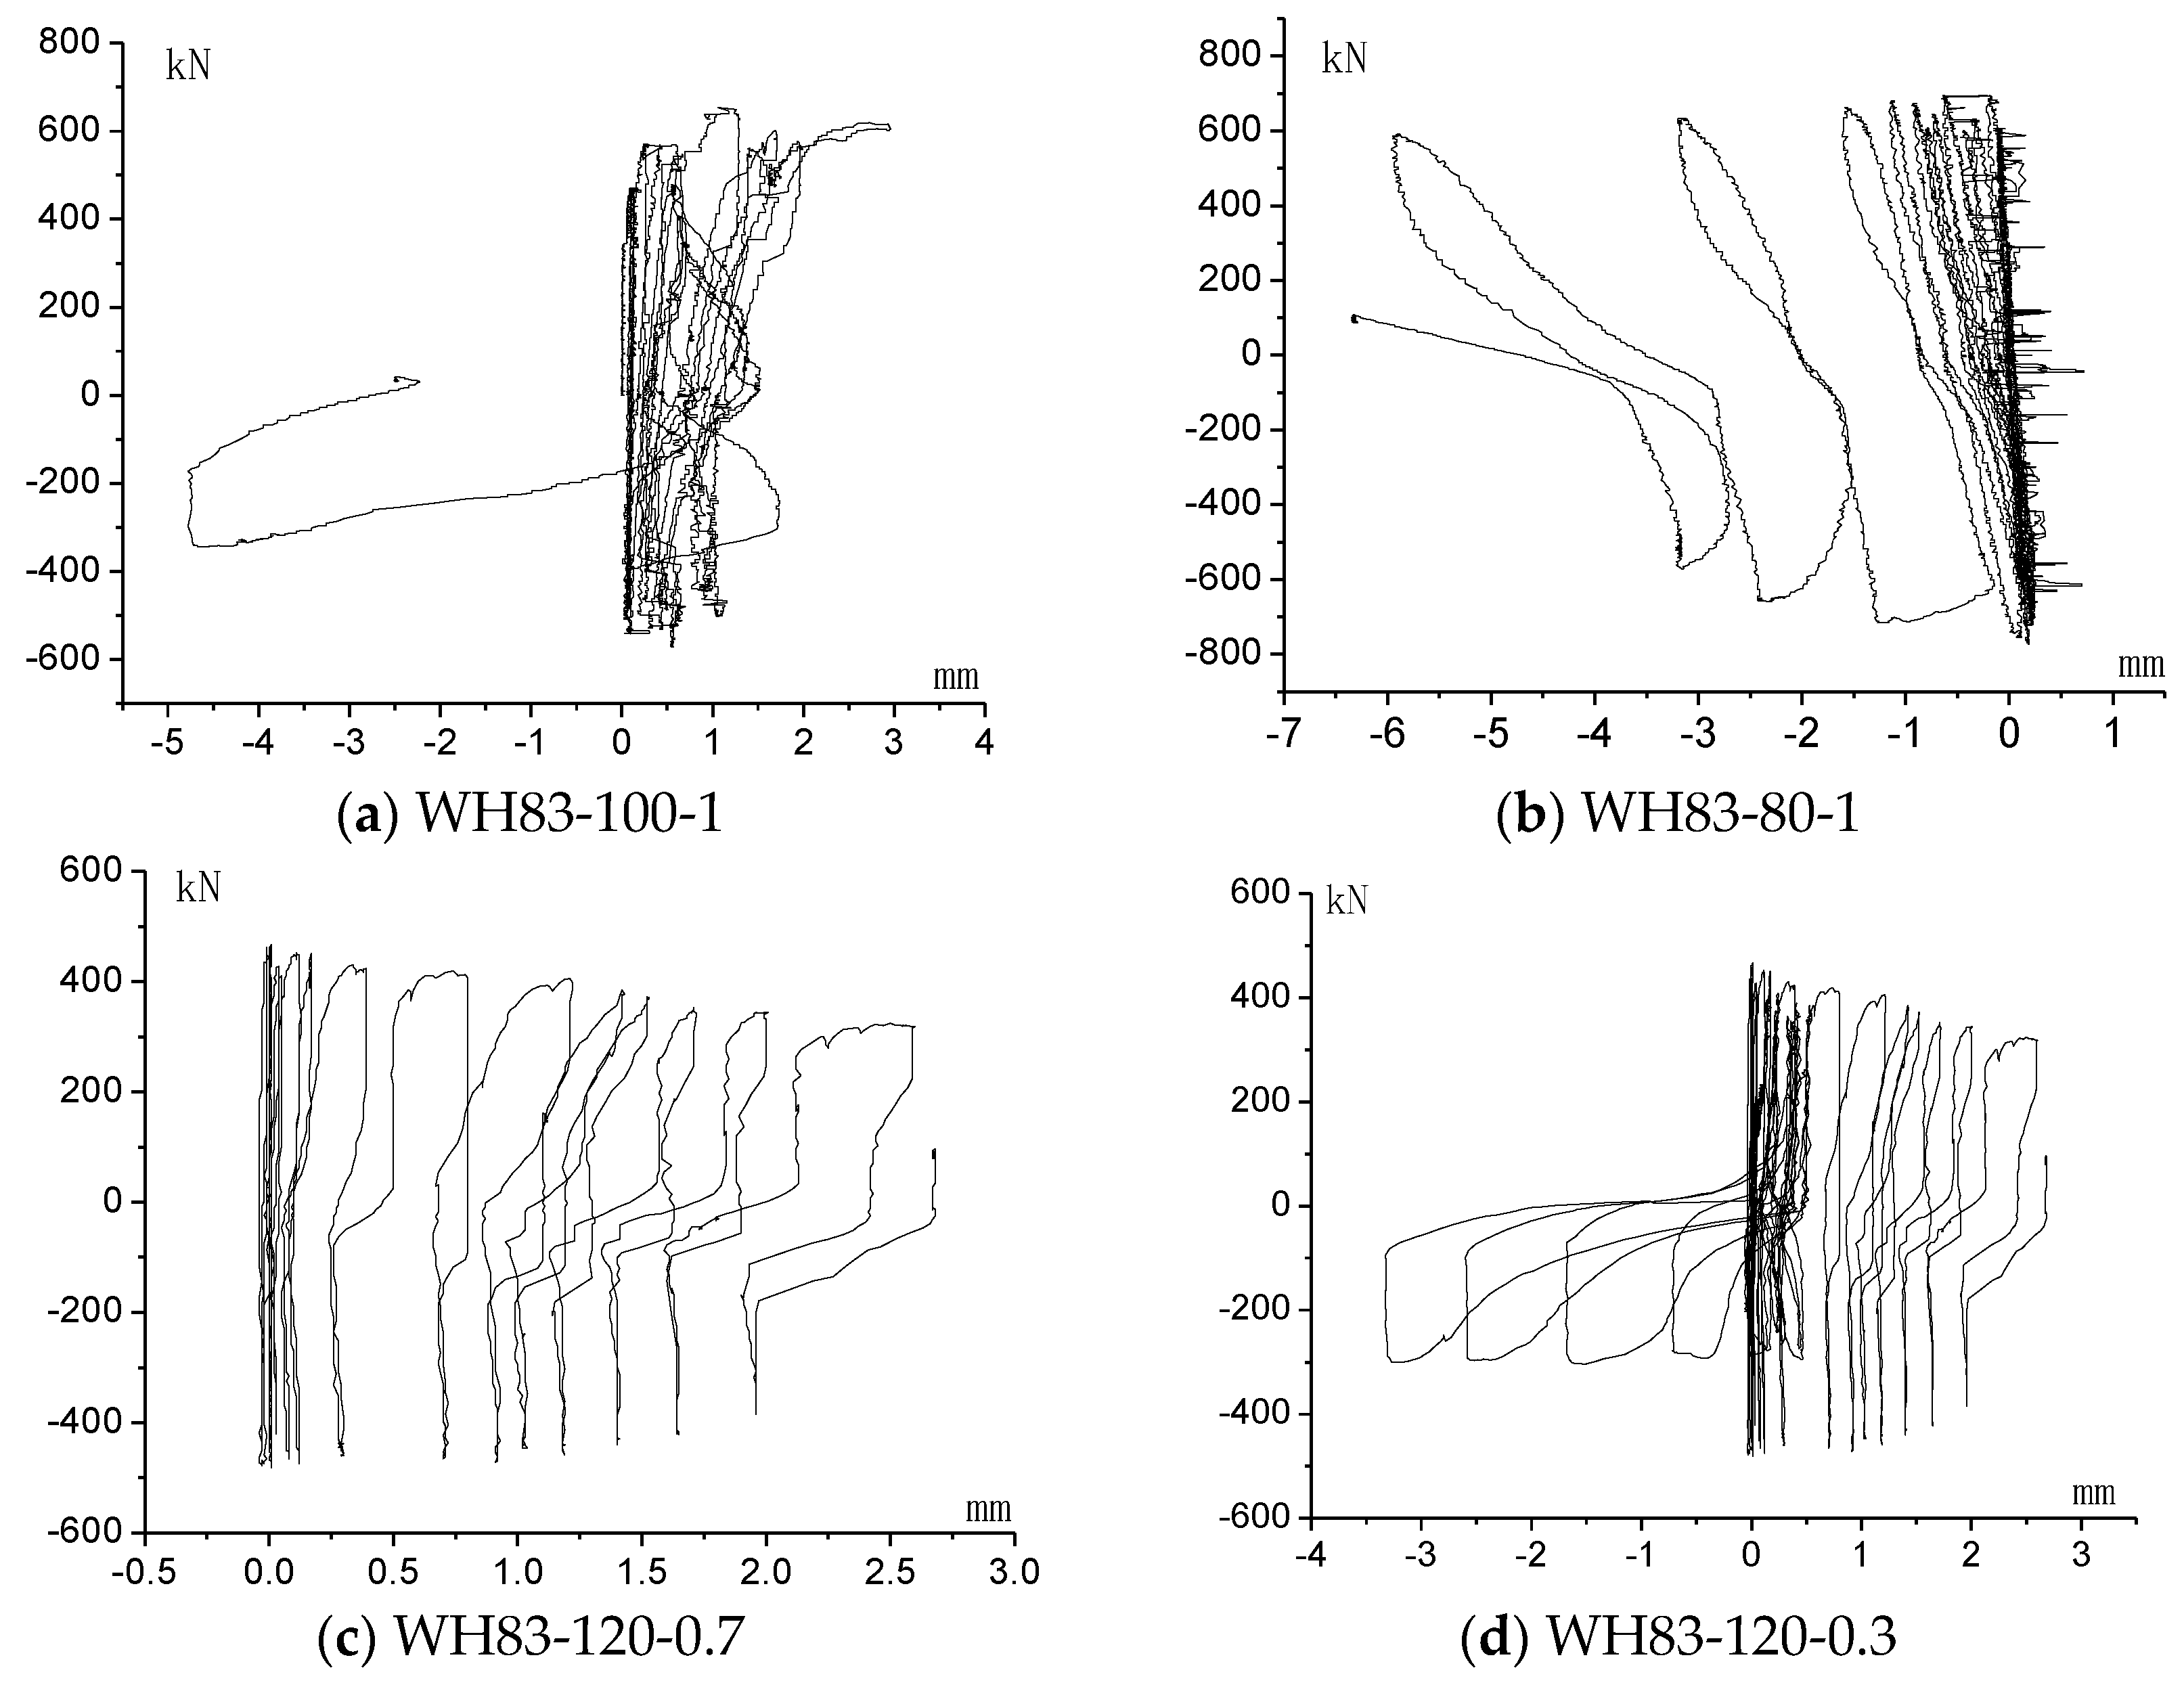
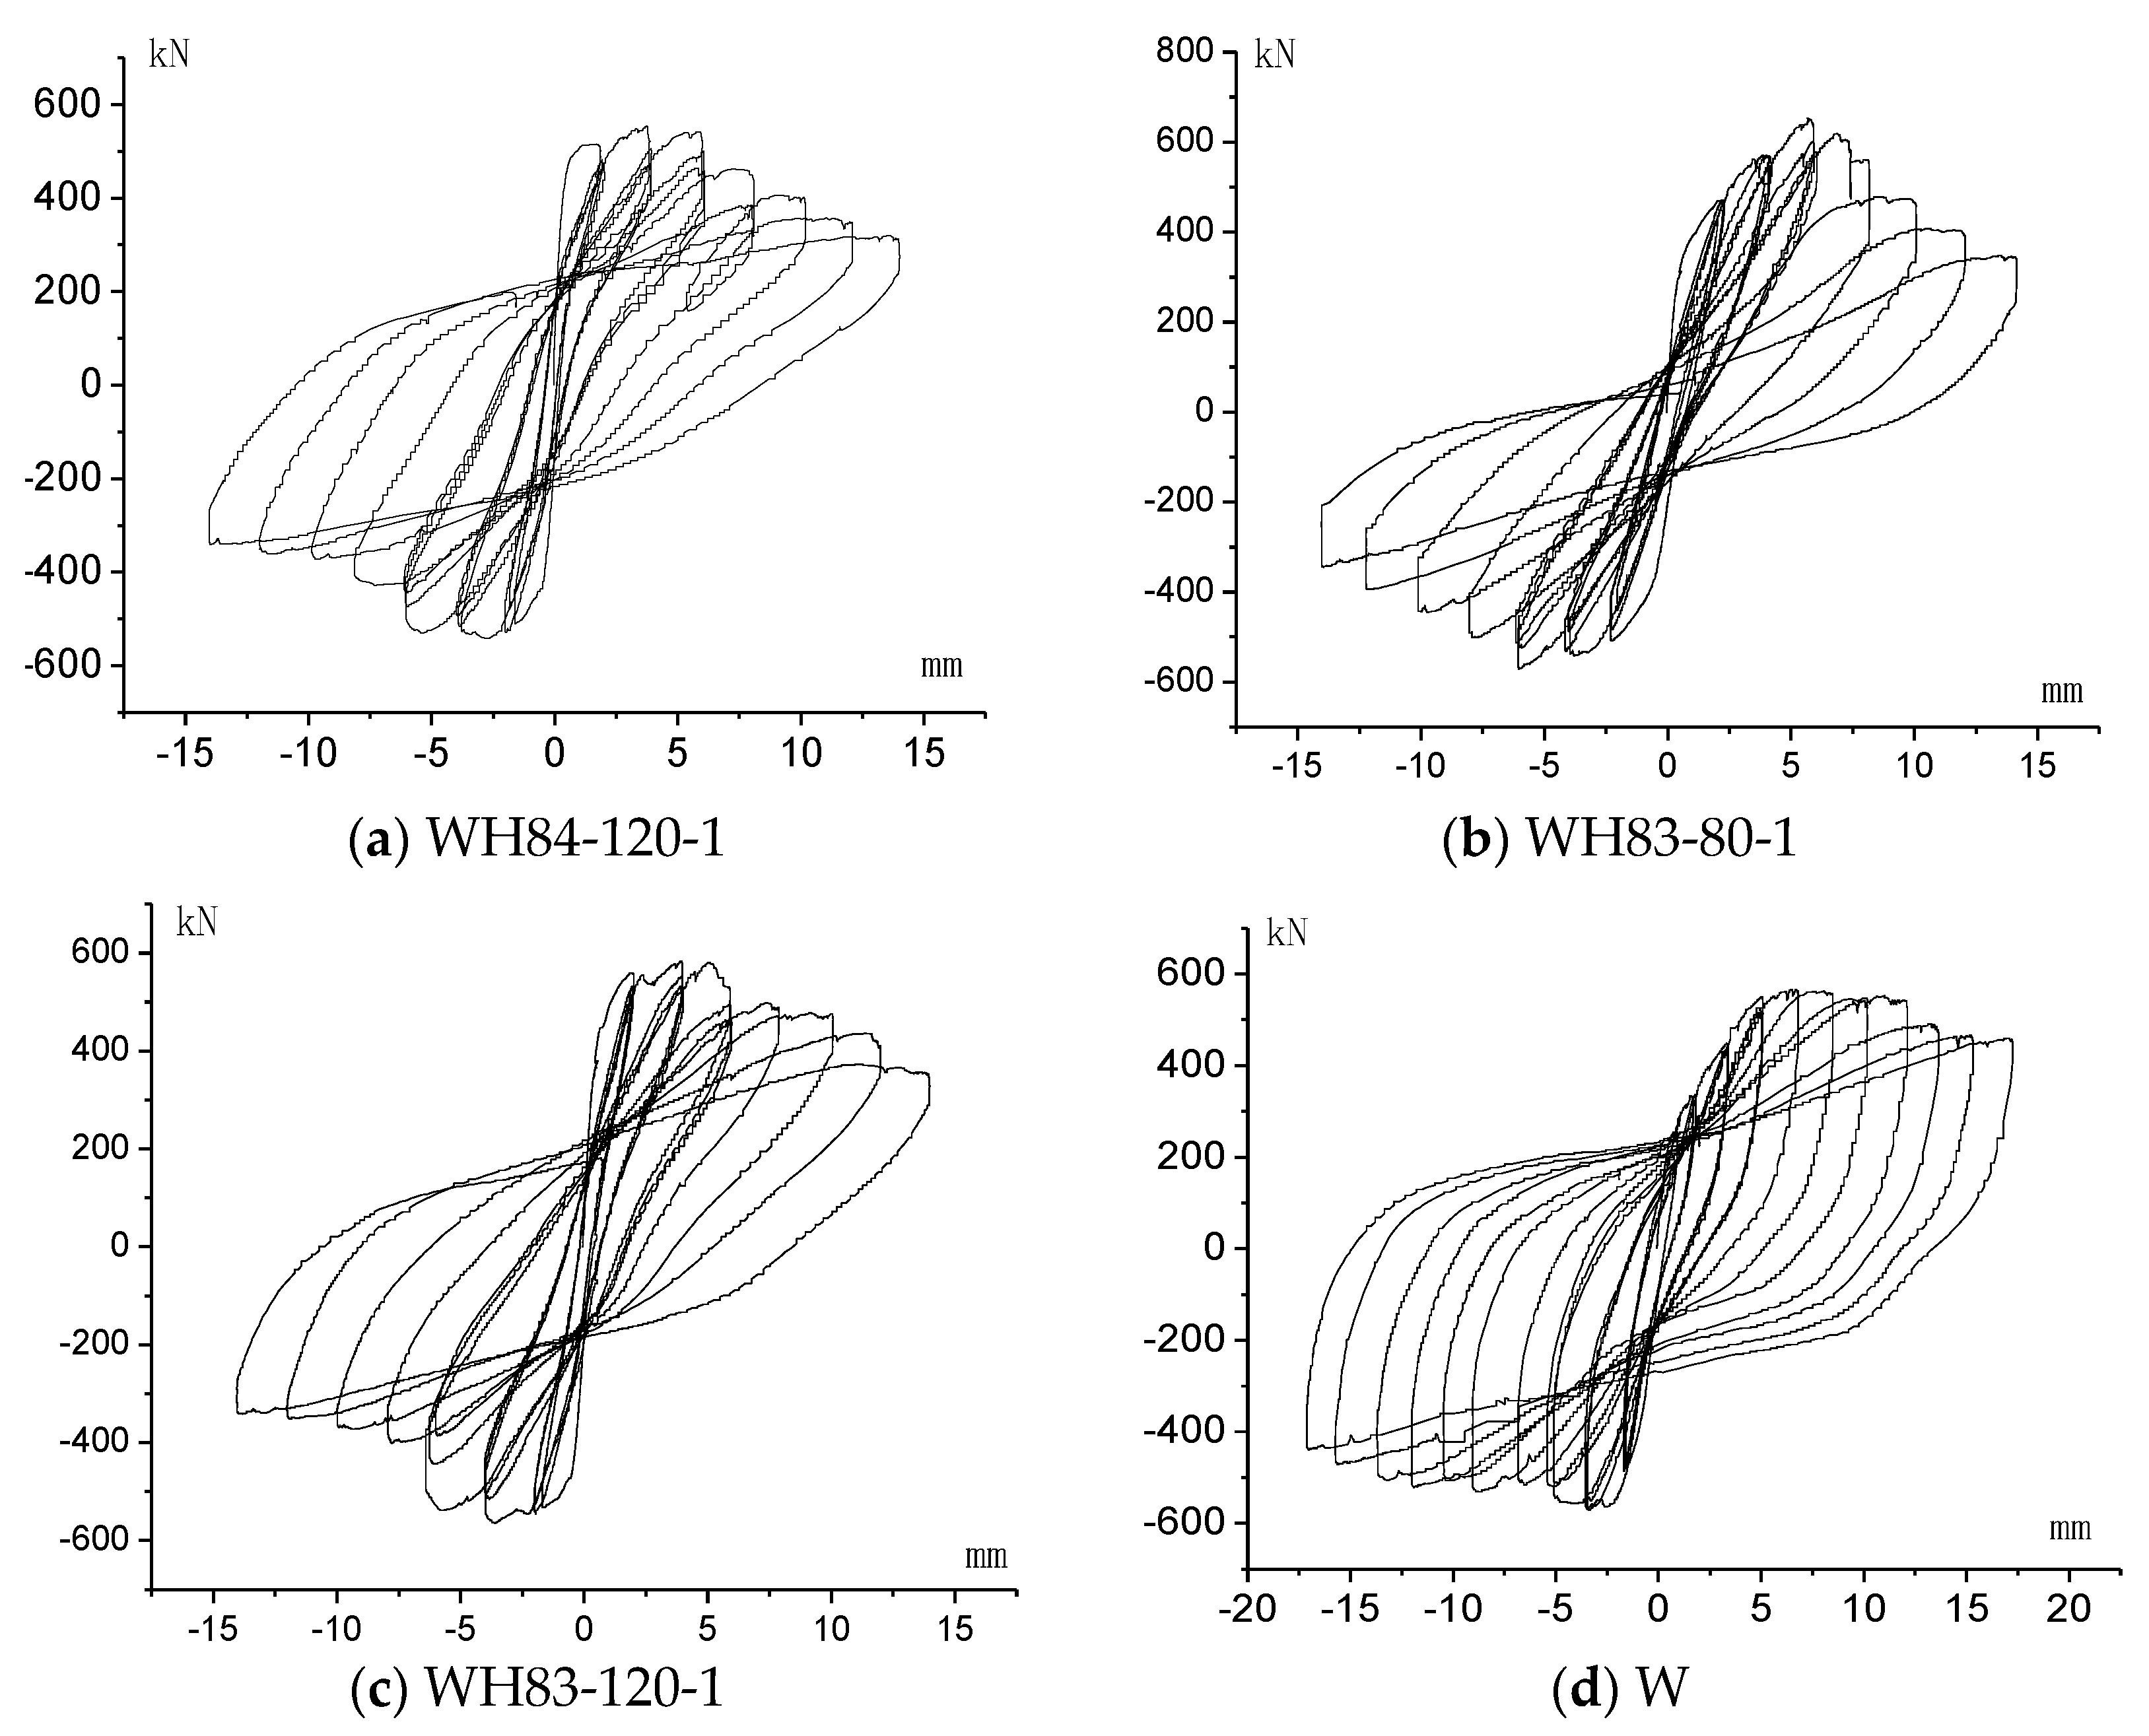
3.4. Hysteretic Loops and Envelope Curves

The hysteretic loops under quasi-static loading were spindle-like. Good aseismic behavior is demonstrated in 
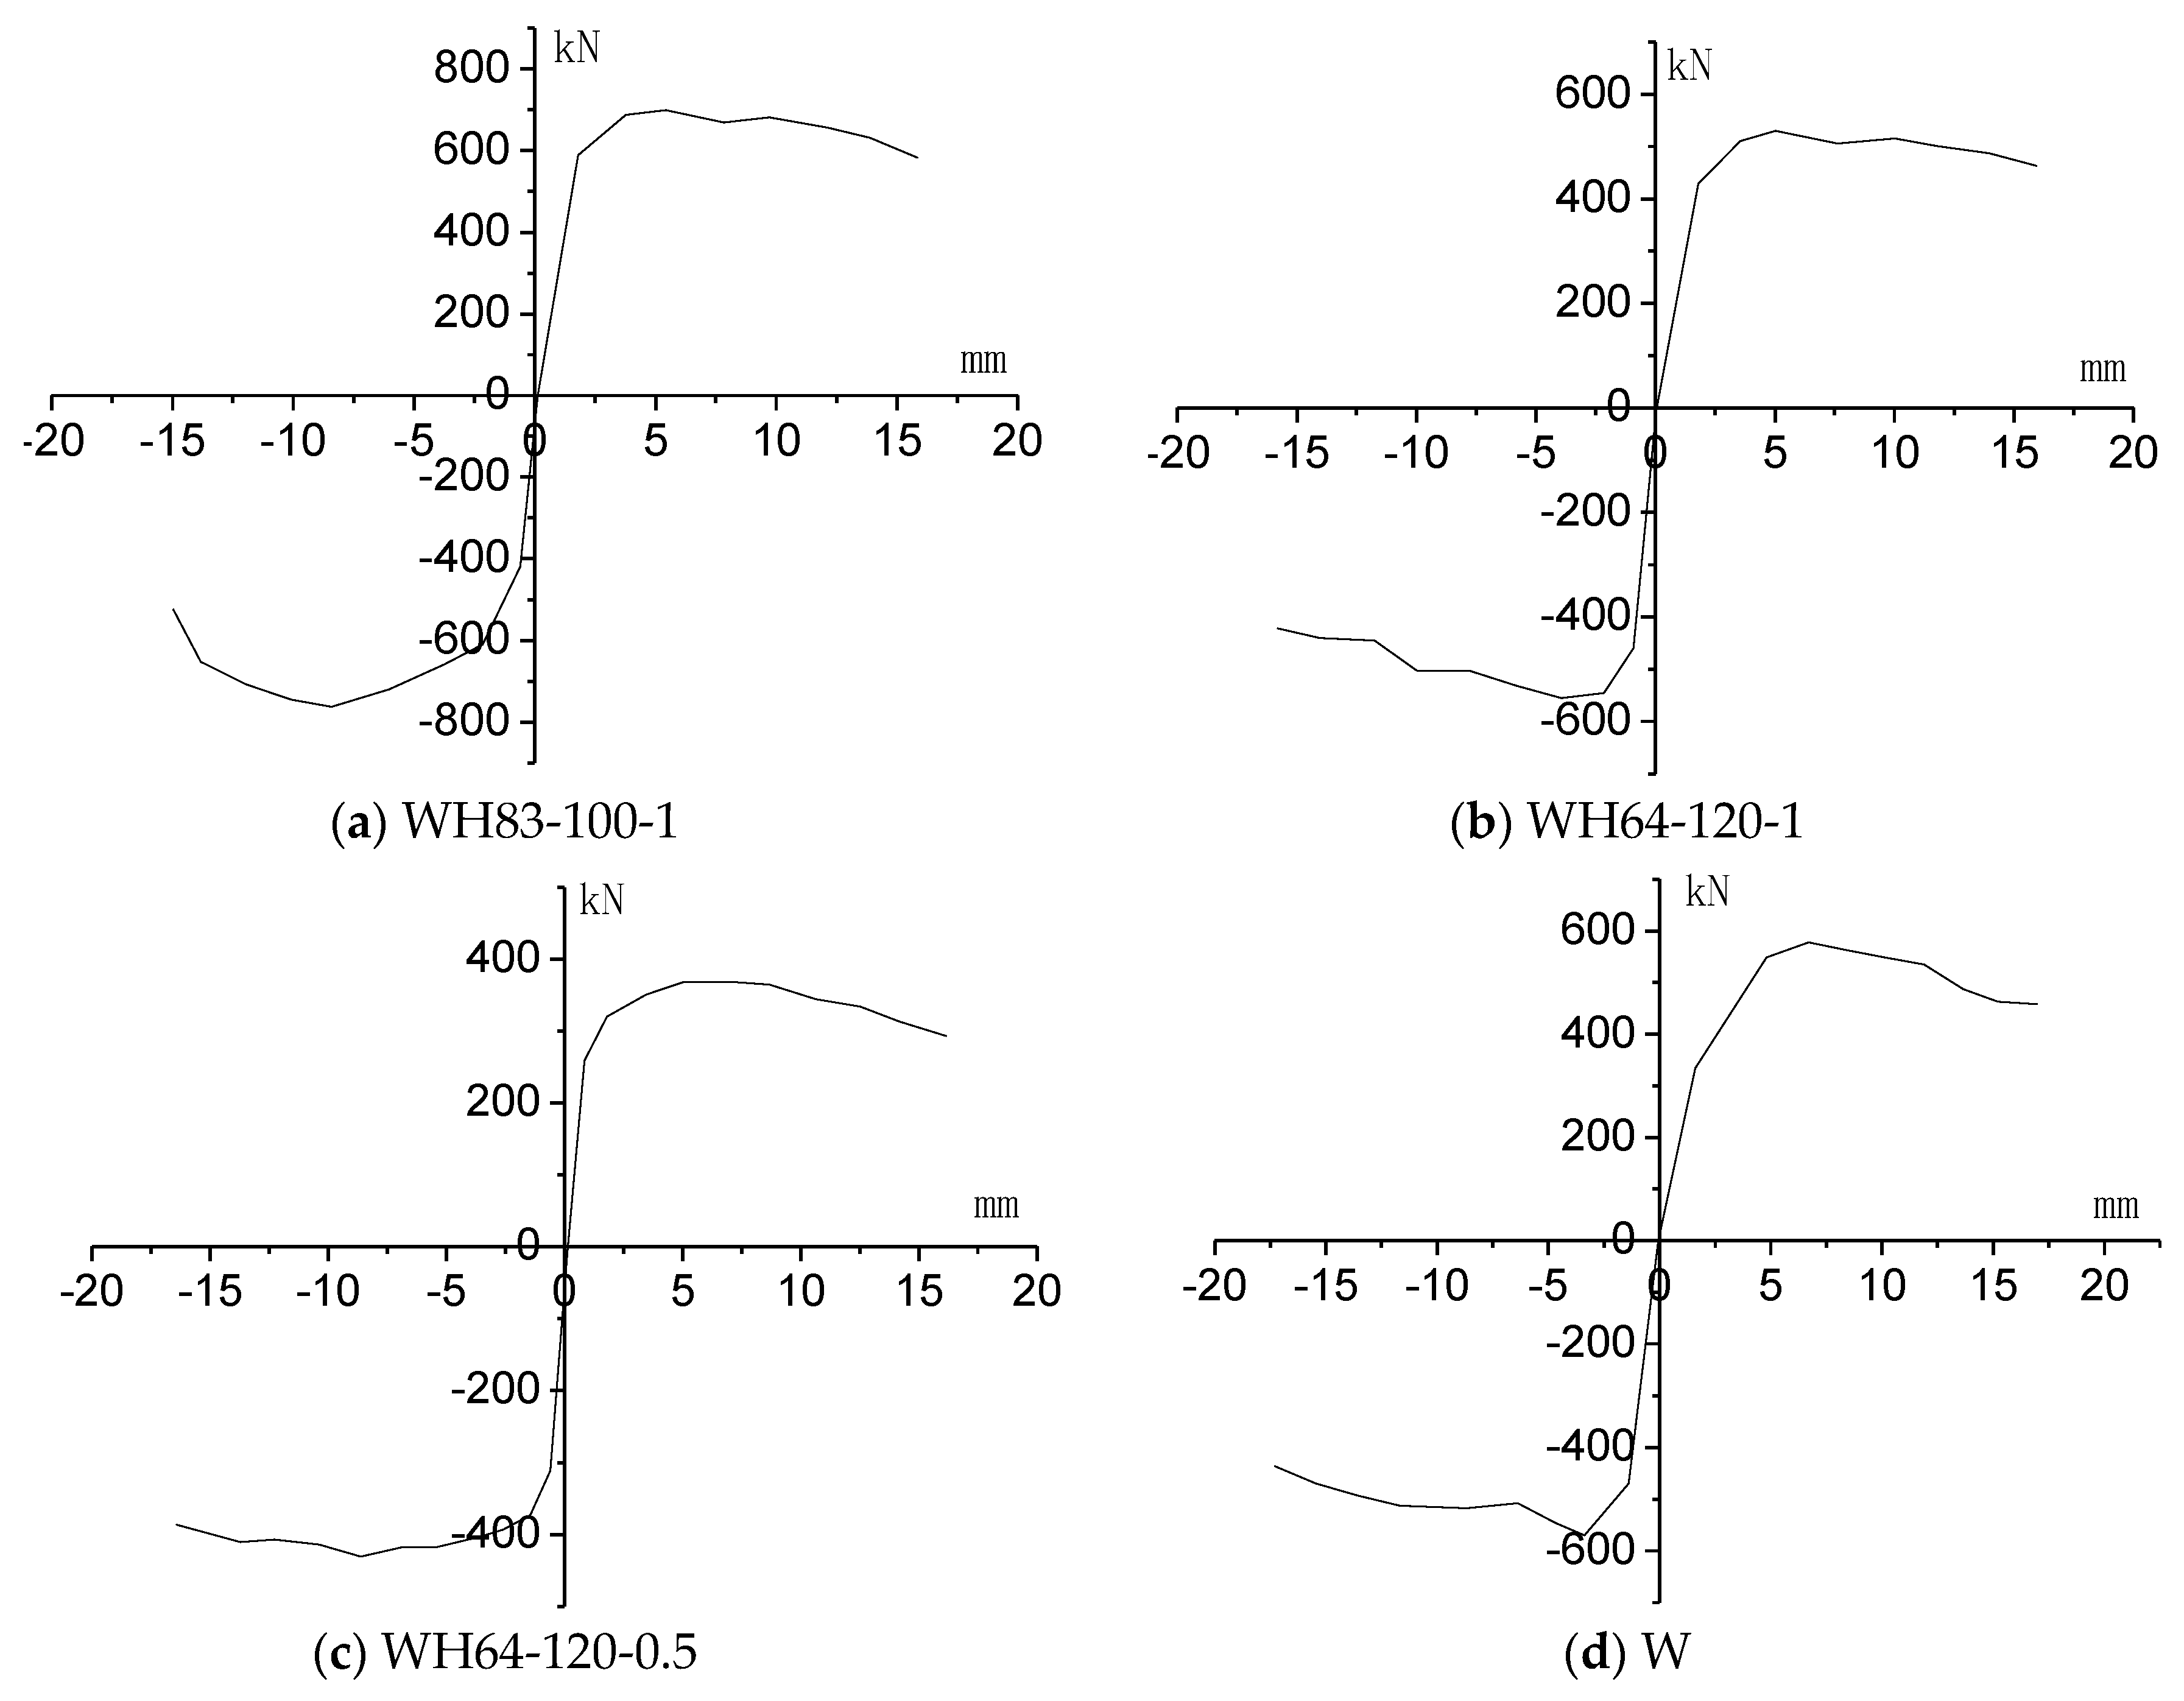
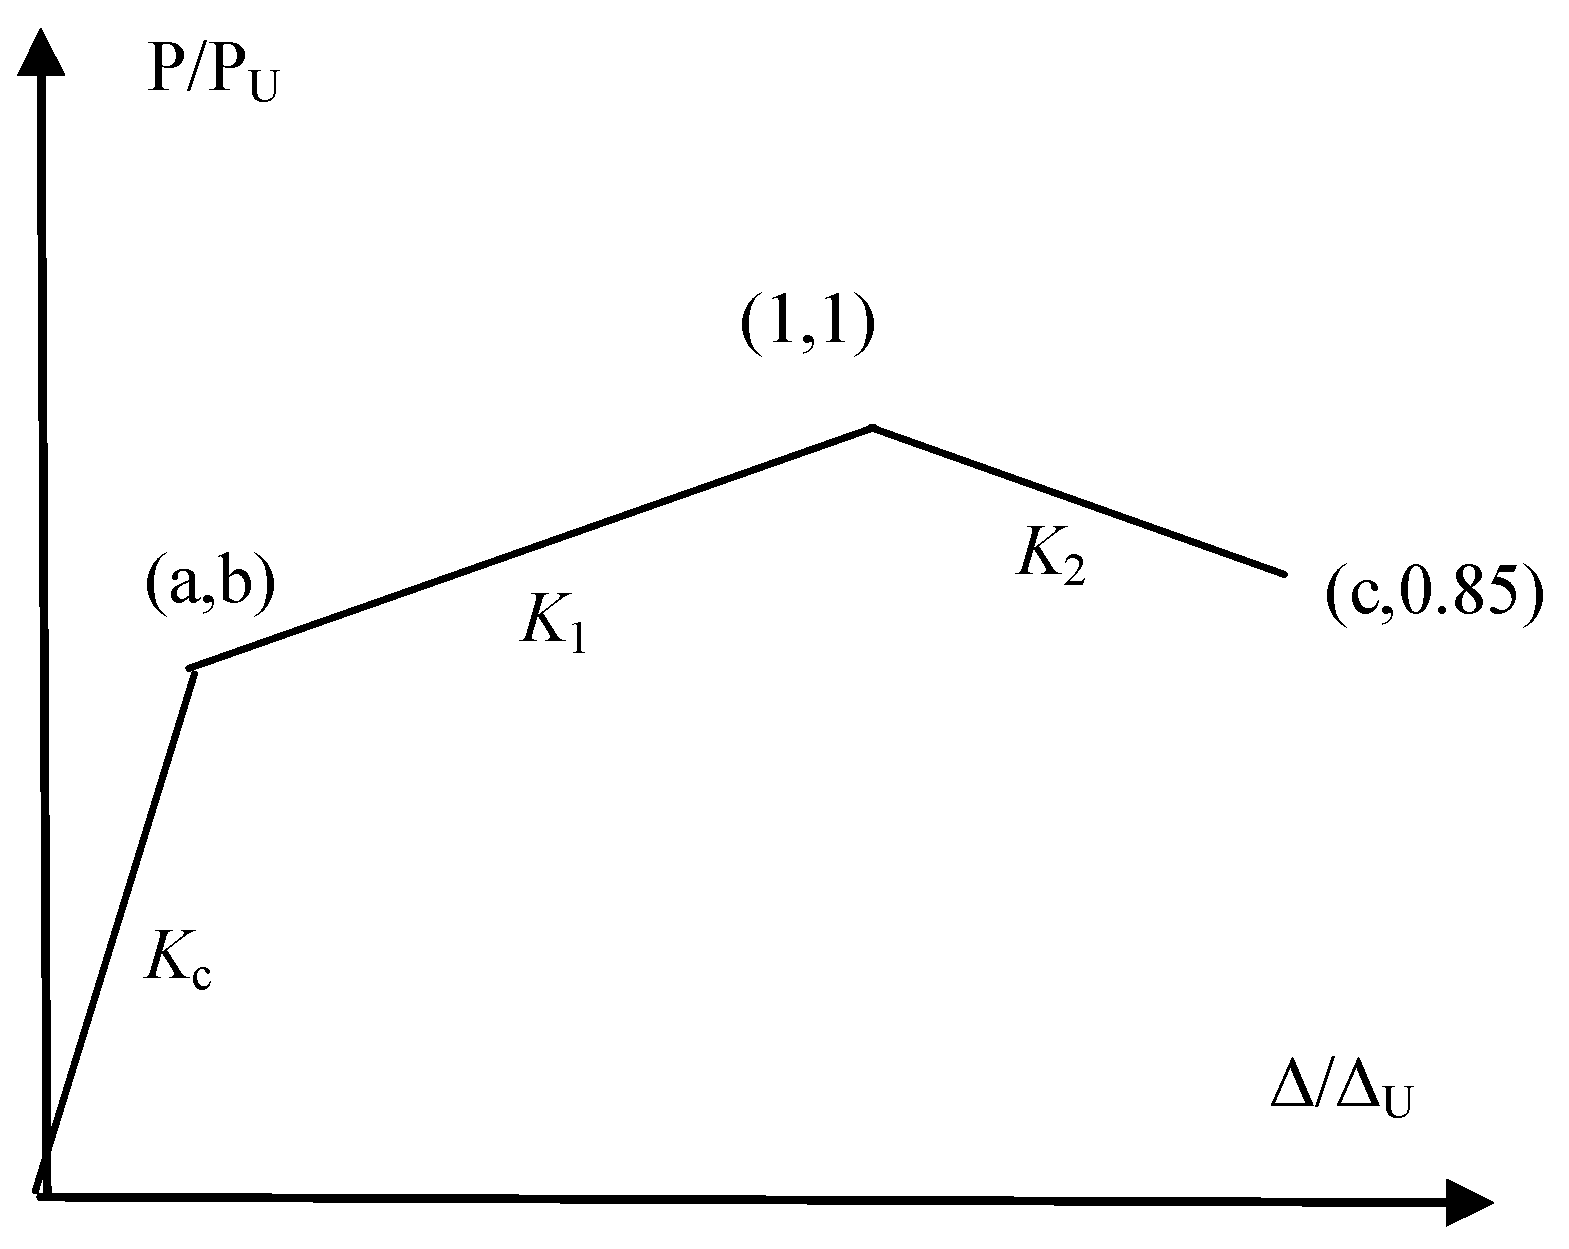
Figure 13. The difference of hysteretic loops of the cast-in-situ masonry cavity walls and that of a solid wall was not significant. The hysteretic loops of all walls, which were shuttle shapes, were full. This indicates that the cast-in-situ insulating layer can improve the collaborative performance of the inner and outer leaves. The cast-in-situ masonry cavity walls have desirable ductility and energy dissipative capacity. The envelope curves of the wall specimens can be divided into three stages: elastic stage, elastic-plastic stage, and failure stage, as displayed in Figure 14. For the convenience of comparative analysis, the envelope curves are simplified as a tri-linear substitute model, as shown in Figure 15. The slope of the line connecting the cracking point to the origin point was Kc, where Kc = b/a; the slope of the line connecting the cracking point to the ultimate load point is K1, where K1 = (1 − b)/(1 − a); the slope of the line connecting the ultimate load point to the failure point is K2, where K2 = (1 − 0.85)/(c − 1). Kc, K1, and K2 of the walls are summarized in Table 5. Kc of the cast-in-situ masonry cavity walls was about 2.03–3.75, and the ratio of Kc of the cast-in-situ masonry cavity walls to that of the solid wall was in the range of 0.86 to 1.8. Compared with the solid wall, the initial stiffness of cast-in-situ masonry cavity walls did not decrease significantly, and the degenerative process of the stiffness of the cast-in-situ masonry cavity walls was delayed to some degree. This indicates that the cast-in-situ insulating layers contributed to resisting stiffness degradation.

3.5. Ductility Factors and Energy Dissipation

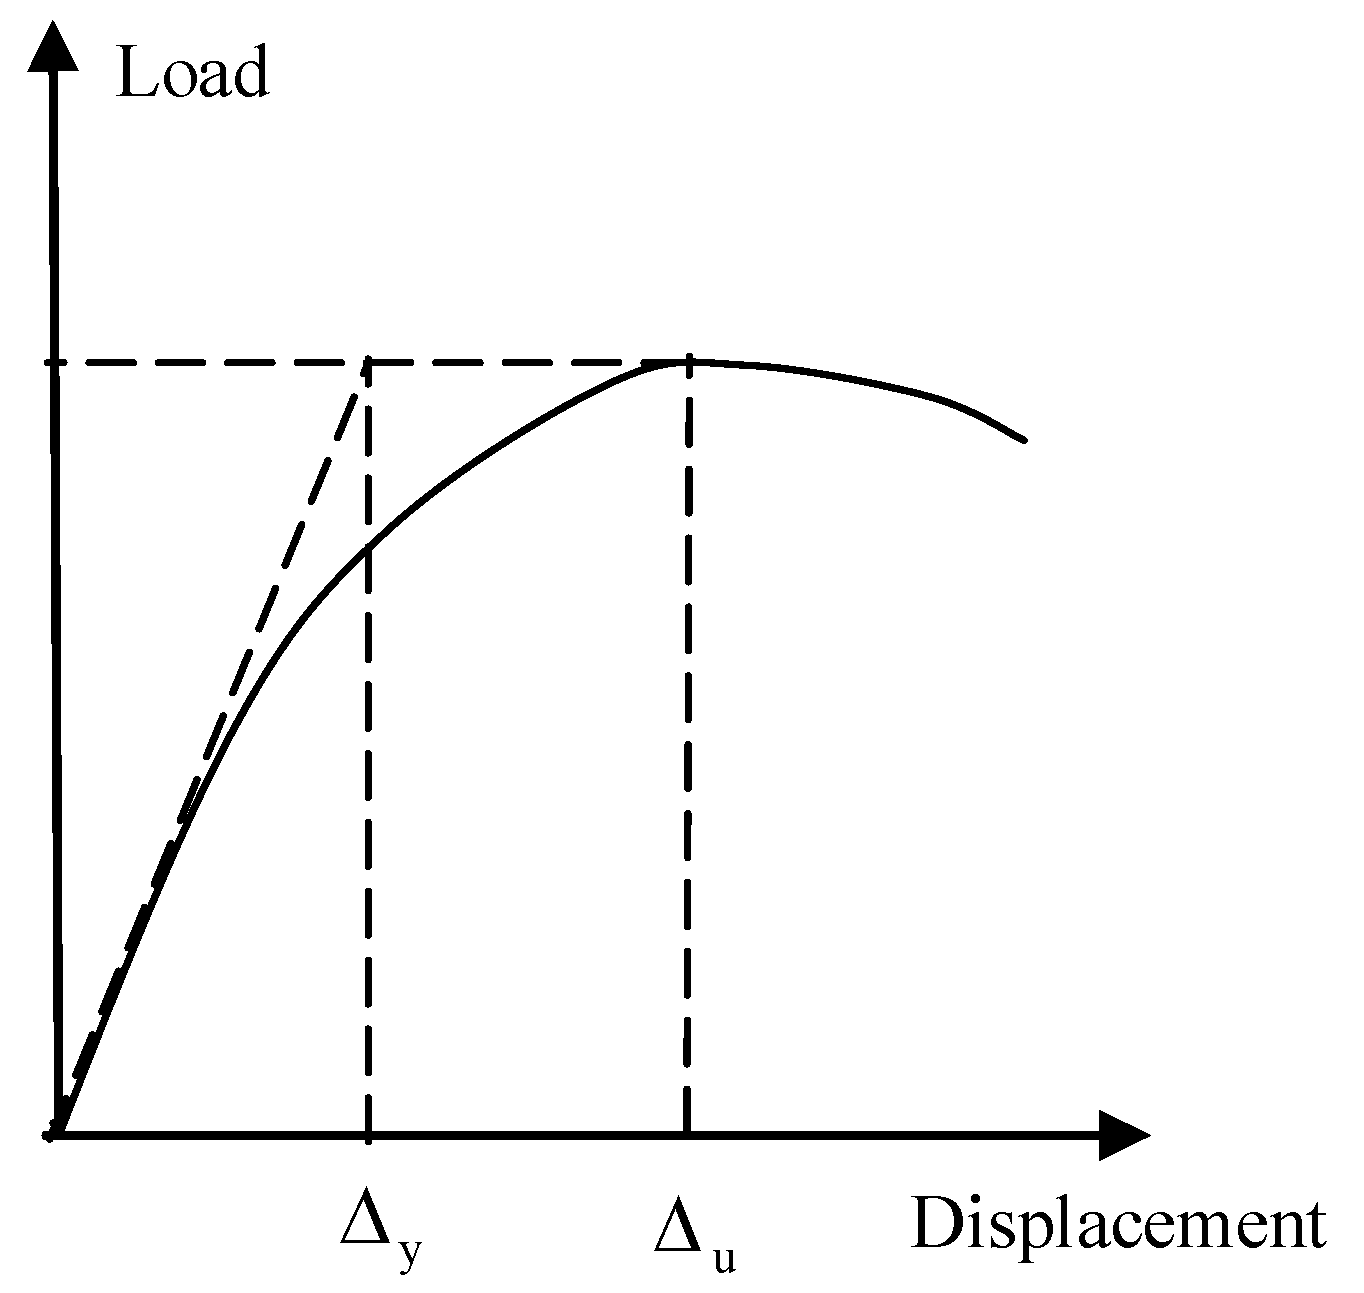
Figure 16 outlines the method of determining the ductility factor, μ y , which is the ratio of the displacement corresponding to the ultimate load (∆u) and the equivalent yield displacement (∆y).
μ = Δ u Δ y
The values of the ductility factor for cast-in-situ masonry cavity walls are summarized in Table 6 and were in the range of 2.86–4.17, with an average value of 3.4. The ductility factor of the solid wall was 3.38, which is comparable to the average ductility factor for cast-in-situ masonry cavity walls. The shape and layout of ties, the thickness of insulating layers, and axial compression stress had a slight influence on the ductility factor.
Energy dissipation is an important parameter in modeling the cyclic response of the cast-in-situ masonry cavity walls and for the evaluation of its seismic performance. The energy that is dissipated at each loading cycle, Ediss, was obtained by numerically integrating the force-displacement hysteretic loop. To have an objective measure of the dissipated energy due to the influence of lateral strength on calculations, the normalized dissipated energy by the elastic energy absorption of the equivalent elastic-plastic model was adopted. The energy dissipation coefficients of the cast-in-situ masonry cavity walls ranged between 1.07–1.42, with an average value of 1.25, as indicated in Table 7. Compared to that of a solid wall, the energy dissipation coefficients of the cast-in-situ masonry cavity walls did not exhibit significant decay. Hence, the energy dissipation capacity of the cast-in-situ masonry cavity walls could meet the design requirements.

3.6. Shear Capacity and Failure Mechanism

The load-displacement curves were initially linear during the early stage of the load test. The vertical and horizontal mortar seams started cracking at the same time and then cracks developed diagonally with a ladder-like distribution. The principal strain theory, which assumes that failure occurs when the maximum strain becomes equal to the strain at yield point, could explain this phenomenon. However, the cast-in-situ masonry cavity walls had very high shear strength after cracking, and the sheer load-carrying capacity continued to increase. In fact, the cast-in-situ masonry cavity walls were damaged after cracking not because of tension, but due to slippage and movement of the horizontal mortar seams. The principal strain theory failed to explain this phenomenon. The walls were destroyed when the bond strength and friction coefficients of the horizontal mortar seams declined substantially. This can be explained via the shear-friction strength theory. The characteristic shear strength is given by [16]:
f vk = f vko + 0.4 σ d
where f vko is the characteristic initial shear strength under zero compressive stress, σ d is the design compressive stress perpendicular to the shear in the member at the level under consideration, using the appropriate load combination based on the average vertical stress over the compressed part of the wall that is providing shear resistance.
f vd = f vk / γ M
where γ M is the partial factor for masonry. The design value of the shear resistance is given by:
V Rd = V Rd 1 + V Rd 2
where V Rd 1 is the design value of the shear resistance of unreinforced masonry; V Rd 2 is the design value of a constructional column and,
V Rd 1 = f vd t l c
where f vd is the design value of the shear strength of masonry; t is the thickness of the wall resisting the shear; l c is the length of the compressed part of the wall, ignoring any part of the wall that is in tension. V Rd 2 is given by [17]:
V Rd 2 = [ C Rd , c k ( 100 ρ f ck ) 1 / 3 + 0.15 σ cp ] b w d
where C Rd , c is 0.18/ γ c , γ c is the partial factor; k is the adjustment factor; ρ is the ratio of longitudinal reinforcement; f ck is the concrete crushing strength; σ cp is the concrete compressive stress at the centroidal axis due to axial loading; b w is the smallest width of the cross-section in the tensile area; d is the cross-section length.
Experimental testing proved that the outer and inner leaves could work in coordination. Therefore, the beneficial effect of the outer leaf should be considered. The shear strength can be calculated, including the outer and inner leaves by the following expression:
f vd = f vd 1 + η f vd 2
where f vd 1 is the shear strength of inner leaves; η is the reduction coefficient; f vd 2 is the shear strength of outer leaves. According to the test, η = 0.7 .
f vd = f vd 1 + 0.7 f vd 2
A comparison between the calculated and experimental test values is summarized in Table 8. The average ratio of calculated value to the test value was 1.08, while the standard deviation was 0.08, and the coefficient of variation was 0.074. Therefore, the developed expression achieved adequate accuracy for predicting the shear strength of the cast-in-situ cavity masonry walls.

4. Conclusions

An experimental study was conducted on the cast-in-situ masonry cavity walls under combined monotonic vertical load and quasi-static lateral load. The test parameters included the tie shape, tie layout, thickness of the insulating layer, and level of axial compression. Moreover, a predictive equation for calculating the shear capacity of the cast-in-situ masonry cavity walls was proposed. The following conclusions can be drawn from this study:
  • The wall specimens generally exhibited shear failure, and their behavior could be characterized by three critical stages: the opening of flexural cracks, opening of the diagonal cracks, and crushing of the bottom corners. The first fine diagonal cracks appeared in the inner leaves. As the lateral displacement increased, the length of the diagonal cracks tended to increase. With the increase of the imposed lateral displacements, diagonal cracks developed mostly in the mortar joints.
  • The shape and layout of the ties had little effect on the shear strength of the cast-in-situ masonry cavity walls because the ties were flexible connections and had limited capacity to coordinate the inner and outer leaves before failure. However, the ties could keep the tested walls from collapsing even after severe cracking.
  • Compared to traditional sandwich walls, the cast-in-situ insulating layers, which have a certain bonding and compressive strength, can improve the coordinative performance of internal walls and external walls. However, the RC coupling beams connecting the inner beams and outer beams play a leading role in coordinating the loads between internal walls and external walls. The linear stiffness of the RC coupling beams decreased with greater insulating layer thickness, which had a slightly negative influence on the shear strength of the cast-in-situ masonry cavity walls.
  • Increased axial compression stress generally increased the shear strength but made the failure mode more brittle. Increasing the axial compressive stress delayed the initiation of cracking until a larger lateral force was applied. This could be explained by principal stresses: a larger lateral force is required to exceed the compressive field resulting from the larger axial load. This compressive field must first be overcome before cracking could be initiated.
  • Displacements between inner and outer leaves were nearly zero before cracking and reached less than 2 mm at the ultimate load, indicating that the inner and outer leaves could work in coordination. The shape and layout of the ties had slight influence on the coordination of the inner and outer leaves. δ/∆ increased with an increasing thickness of the insulating layer, and the coordination work performance of the walls declined. δ/∆ decreased with decreasing axial compression stress, and the coordination performance of the walls increased. The axial compression stress had a negative influence on the coordination of inner and out leaves.
  • The hysteretic loops under cyclic loading were spindle-like, and good aseismic behavior was demonstrated. The difference in envelope curves between cast-in-situ masonry cavity walls and the solid control wall was not significant. These envelopes could be divided into three stages: elastic stage, elastic-plastic stage, and failure stage. The envelope curves were simplified as a tri-linear substitute model. Kc of cast-in-situ masonry cavity walls was about 2.03–3.75. The ratio of K1 of cast-in-situ masonry cavity walls to that of the solid wall was in the range of 0.86 to 1.8.
  • The ductility factor of the cast-in-situ masonry cavity walls was about 2.86–4.17, with an average value of 3.4, close to that of the solid wall, which was 3.38. The shape and layout of the ties, the thickness of the insulating layer, and axial compression stress had a slight influence on the ductility factor.
  • The energy dissipation coefficient, Ediss, of cast-in-situ masonry cavity walls was between 1.07–1.42, with an average of 1.25. Stiffness of all walls was close to the cracking stiffness, Kc, before the walls cracked. At this stage, the stiffness of the cast-in-situ masonry cavity walls and the solid wall did not display marked differences. Stiffness degradation was noted after cracking of walls and tended to be faster for the cast-in-situ masonry cavity walls than for the control solid wall before failure, likely because deformations of the inner and outer leaves of cast-in-situ masonry cavity walls were increasingly uncoordinated.
  • The load-displacement curves were linear at the early stage of loading. Vertical and horizontal mortar seams cracked at the same time and cracks developed diagonally with the ladder-like distribution. The principal strain theory could explain this phenomenon. However, the cast-in-situ masonry cavity walls had very high shear strength after cracking, and their sheer load-carrying capacity continued to increase. The walls were further damaged not because of tension, but due to slippage and movement of the horizontal mortar seams. The walls could not bear the lateral loads until the bond strength, and the friction coefficients of the horizontal mortar seams declined substantially. The shear-friction strength theory could explain this phenomenon well.
  • The beneficial effect of the outer leaf should be considered. The shear strength of the assembly was calculated, including the outer and inner leaves. The calculated value and test value were compared. The average ratio of calculated value to experimental value was 1.08; with a standard deviation of 0.08 and the coefficient of variation 0.074. The proposed equation for predicting the shear strength is, therefore, reasonably accurate.
  • It should be noted that only one wall panel was tested for each test configuration. Since masonry is highly variable, future test repetitions are recommended tos validate the results fully.

Author Contributions

Conceptualization, Y.Z., M.L.N.; methodology, Y.Z., M.L.N.; validation, Y.Z., M.L.N.; formal analysis; Y.Z., M.L.N.; investigation, Y.Z.; resources, Y.Z., M.L.N.; data curation, Y.Z.; writing original draft, Y.Z.; writing review and editing, M.L.N. All authors have read and agreed to the published version of the manuscript.

Funding

No funding received.

Conflicts of Interest

The authors have no conflict of interest related to this research publication.

References

  1. Giaretton, M.; Dizhur, D.; da Porto, F. Construction Details and Observed Earthquake Performance of Unreinforced Clay Brick Masonry Cavity-walls. Structures 2016, 6, 159–169. [Google Scholar] [CrossRef]
  2. Giaretton, M.; Dizhur, D.; Ingham, J.M. Shaking table testing of as-built and retrofitted clay brick URM cavity-walls. Eng. Struct. 2016, 125, 70–79. [Google Scholar] [CrossRef]
  3. Watts, A. Brick Masonry Cavity Walls: Brick; Springer: Heidelberg, Germany, 2011; pp. 200–209. [Google Scholar]
  4. Subhash, C.A.; Rahman, M.A. Accurate Estimation of Interface Shear Stresses in Composite Masonry Walls. J. Struct. Eng. 1994, 120, 998–1015. [Google Scholar]
  5. Sayed-Ahmed, E.Y.; Shrive, N.G. Nonlinear finite-element model of hollow masonry. J. Struct. Eng. 1996, 122, 683–690. [Google Scholar] [CrossRef]
  6. Lu, M.; Schultz, A.E.; Stolarski, H.K. Influence of cavity dimension on the stability of eccentrically loaded slender unreinforced masonry hollow walls. Constr. Build. Mater. 2011, 25, 4444–4453. [Google Scholar] [CrossRef]
  7. Hens, H.; Janssens, A.; Depraetere, W. Brick Cavity Walls: A Performance Analysis Based on Measurements and Simulations. J. Build. Phys. 2007, 31, 95–124. [Google Scholar] [CrossRef]
  8. Hong, L.; Jing, Z.; Li, L. Experiment and Analysis of Seismic Behavior of Hollow Brick Insulating Cavity Walls. J. Build. Struct. 2001, 22, 73–80. (In Chinese) [Google Scholar]
  9. Found, M.S.; Robinson, A.M.; Carruthers, J.J. The influence of FRP inserts on the energy absorption of a foam-cored sandwich panel. Compos. Struct. 1997, 38, 373–381. [Google Scholar] [CrossRef]
  10. Taher, S.T.; Zahari, R.; Ataollahi, S. A double-cell foam-filled composite block for efficient energy absorption under axial compression. Compos. Struct. 2009, 89, 399–407. [Google Scholar] [CrossRef]
  11. Graziotti, F.; Tomassetti, U.; Penna, A. Out-of-plane shaking table tests on URM single leaf and cavity walls. Eng. Struct. 2016, 125, 455–470. [Google Scholar] [CrossRef]
  12. Derakhshan, H.; Lucas, W.; Visintin, P. Out-of-plane Strength of Existing Two-way Spanning Solid and CavityUnreinforced Masonry Walls. Structures 2018, 13, 88–101. [Google Scholar] [CrossRef] [Green Version]
  13. Akhoundi, F.; Vasconcelos, G.; Lourenço, P. In-plane behavior of cavity masonry infills and strengthening with textile reinforced mortar. Eng. Struct. 2018, 156, 145–160. [Google Scholar] [CrossRef] [Green Version]
  14. Salmanpour, A.H.; Mojsilovic, N.; Schwartz, J. Deformation capacity of unreinforced masonry walls subjected to in-plane loading: A state-of-the-art review. Int. J. Adv. Struct. Eng. 2013, 5, 22. [Google Scholar] [CrossRef] [Green Version]
  15. Zhang, Y.-N.; Li, H.; Liu, M. Experimental study on mechanical property of new corrosion resisting tie for cavity wall. J. Shenyang Univ. Technol. 2010, 32, 28–234. (In Chinese) [Google Scholar]
  16. Design of Masonry Structures—Part 1-1: General Rules for Reinforced and Unreinforced Masonry Structures; EN 1996-1-1 Eurocode 6; EUROPEAN COMMITTEE FOR STANDARDIZATION: Brussels, Belgium, 2009.
  17. Design of Concrete Structures—Part 1-1: General Rules and Rules for Buildings; EN 1992-1-1 Eurocode 2; EUROPEA COMMITIEE FOR STANDARDIZATION: Brussels, Belgium, 2010.
Figure 1. Illustration of masonry cavity wall construction process.
Infrastructures 05 00008 g001
Figure 2. Construction drawing of cast-in-situ masonry cavity wall (WH84-100-1) (1. Test specimen; 2. Load sensor; 3. Vertical actuator; 4. Fixing beam; 5. Steel roller; 6. Reaction frame for vertical loading; 7. Ground anchor; 8. Load-distributing beam; 9. Reaction wall;10. Horizontal actuator; 11. Displacement sensor; 12. Bottom RC beam).
Infrastructures 05 00008 g002
Figure 3. Test setup for in-plane cyclic horizontal load.
Infrastructures 05 00008 g003
Figure 4. Photograph of testing setup.
Infrastructures 05 00008 g004
Figure 5. Load and displacement sensor arrangement (1-1,1-2. Load and displacement sensor; 2-1–2-6. Displacement sensor; 3-1–3-8. Strain gauge).
Infrastructures 05 00008 g005
Figure 6. Loading history.
Infrastructures 05 00008 g006
Figure 7. Damage state of the walls upon loading.
Infrastructures 05 00008 g007
Figure 8. Comparison of the cracking load and ultimate load of walls with different thicknesses of insulating layers.
Infrastructures 05 00008 g008
Figure 9. Comparison of the cracking load and ultimate load of walls with different axial compressive stresses.
Infrastructures 05 00008 g009
Figure 10. Load-displacement curve between inner leaf and outer leaf (LVDTs 2-5).
Infrastructures 05 00008 g010
Figure 11. Comparison of δ/∆ of walls with different thickness of insulating layers.
Infrastructures 05 00008 g011
Figure 12. Comparison of δ/∆ of walls with different axial compressive stresses.
Infrastructures 05 00008 g012
Figure 13. Hysteretic curves of walls.
Infrastructures 05 00008 g013
Figure 14. Envelope curves of walls. Do not divide Figure 14 in 2 pages.
Infrastructures 05 00008 g014
Figure 15. Trilinear substitute model of envelope curves.
Infrastructures 05 00008 g015
Figure 16. Method of determining ductility factor.
Infrastructures 05 00008 g016
Table 1. Details of specimens.
Specimen NumberTie Shape & Spacing/mmThickness of Insulating Layer/mmσ0/MPa
WH84-100-1shape: Rectangle; horizontal spacing: 800; vertical spacing: 4001001.0
WH84-120-11201.0
WH83-80-1shape: Rectangle; horizontal spacing: 800; vertical spacing: 300801.0
WH83-100-11001.0
WH83-120-11201.0
WH83-120-0.71200.7
WH83-120-0.51200.5
WH83-120-0.31200.3
WH64-80-1shape: Rectangle; horizontal spacing: 600; vertical spacing: 400801.0
WH64-100-11001.0
WH64-120-11201.0
WZ83-120-1shape: Z-shape; horizontal spacing: 800; vertical spacing: 3001201.0
WZ64-120-1shape: Z-shape; horizontal spacing: 600; vertical spacing: 4001201.0
Wsolid wall-1.0
Table 2. Materials properties.
Wallfcum [MPa]f’m [MPa]f’j [MPa]
WH84-100-119.1108.2
WH84-120-18.0
WH83-80-17.7
WH83-100-18.5
WH83-120-18.1
WH83-120-0.77.5
WH83-120-0.57.9
WH83-120-0.37.9
WH64-80-18.2
WH64-100-17.8
WH64-120-18.4
WZ83-120-17.7
WZ64-120-17.7
W8.4
Table 3. Critical loads and corresponding displacements.
Specimen NumberPc [kN]Pu [kN]c [mm]u [mm]0.85 [mm]
Positive DirectionNegative DirectionAverage ValuePositive DirectionNegative DirectionAverage Value
WH84-100-14555144846336246291.515.827.79
WH84-120-14254794525425225321.765.837.27
WH83-80-15064604836535706122.035.857.53
WH83-100-15785285536957227091.945.7514.8
WH83-120-14334834585805385591.765.397.60
WH83-120-0.74063743904524654591.044.349.40
WH83-120-0.53203643423714243981.836.5612.5
WH83-120-0.33022532783393733561.997.0511.6
WH64-80-14254314285545725632.177.4013.7
WH64-100-14905265086166386272.107.3714.8
WH64-120-14374704545315485401.885.3715.4
WZ83-120-14965485226576656611.735.9812.9
WZ64-120-14024434234845215031.294.899.28
W4064434255505705601.565.2814.3
Table 4. Relative displacement δ/∆.
Wallδ/mm∆/mmδ/Wall∆ [mm]∆ [mm]δ/
WH84-100-16.413.60.47WH83-120-0.34.516.40.27
WH84-120-17.114.00.51WH64-80-14.112.10.34
WH83-80-15.614.10.40WH64-100-14.914.80.33
WH83-100-16.415.90.40WH64-120-17.815.10.52
WH83-120-18.013.90.58WZ83-120-19.016.00.56
WH83-120-0.73.614.30.25WZ64-120-18.816.00.55
WH83-120-0.55.816.30.36
Table 5. Parameters of envelope curves.
Walla =c/ub = PC/Puc =0.85/uKCK1K2
WH84-100-10.260.851.343.27 0.20−0.44
WH84-120-10.300.931.253.10 0.10−0.60
WH83-80-10.350.711.292.03 0.45−0.52
WH83-100-10.340.852.572.50 0.23−0.10
WH83-120-10.330.971.412.94 0.04−0.37
WH83-120-0.70.240.902.173.75 0.13−0.13
WH83-120-0.50.280.881.913.14 0.17−0.16
WH83-120-0.30.280.601.652.14 0.56−0.23
WH64-80-10.290.711.852.45 0.41−0.18
WH64-100-10.300.812.012.70 0.27−0.15
WH64-120-10.350.892.872.54 0.17−0.08
WZ83-120-10.290.792.162.72 0.30−0.13
WZ64-120-10.260.841.903.23 0.22−0.17
W0.300.712.712.37 0.41−0.09
Table 6. Ductility factors of walls.
Wall μ Wall μ
WH84-100-13.89WH83-120-0.33.54
WH84-120-13.31WH64-80-13.41
WH83-80-12.88WH64-100-12.86
WH83-100-12.96WH64-120-13.19
WH83-120-13.06WZ83-120-13.46
WH83-120-0.74.17WZ64-120-13.79
WH83-120-0.53.58W3.38
Table 7. Energy dissipation coefficient of the wall.
WallEnergy Dissipation Coefficient EdissWallEnergy Dissipation Coefficient Ediss
WH84-100-11.29WH83-120-0.31.32
WH84-120-11.34WH64-80-11.30
WH83-80-11.23WH64-100-11.35
WH83-100-11.07WH64-120-11.22
WH83-120-11.42WZ83-120-11.14
WH83-120-0.71.20WZ64-120-11.13
WH83-120-0.51.25W1.40
Table 8. Comparison between the calculated value and the test value.
WallCracking Load P [kN]Calculated Value P1 [kN]P/P1WallCracking Load P [kN]Calculated Value P1 [kN]P/P1
WH84-100-1484433.351.12WH64-80-1438433.351.01
WH84-120-1452433.351.04WZ83-120-1522433.351.20
WH83-80-1483433.351.11WZ64-120-1435433.351.00
WH83-100-1553433.351.28WZ64-120-0.7390377.261.03
WH83-120-1458433.351.06WH64-120-0.5342339.641.01
WH64-120-1454433.351.05WH64-120-0.3298302.030.99
WH64-100-1508433.351.17

