Carbonation Resistance Performance and Micro-Structure Analysis of Glazed Hollow Bead Insulation Concrete


Abstract
:
1. Introduction
2. Materials and Methods
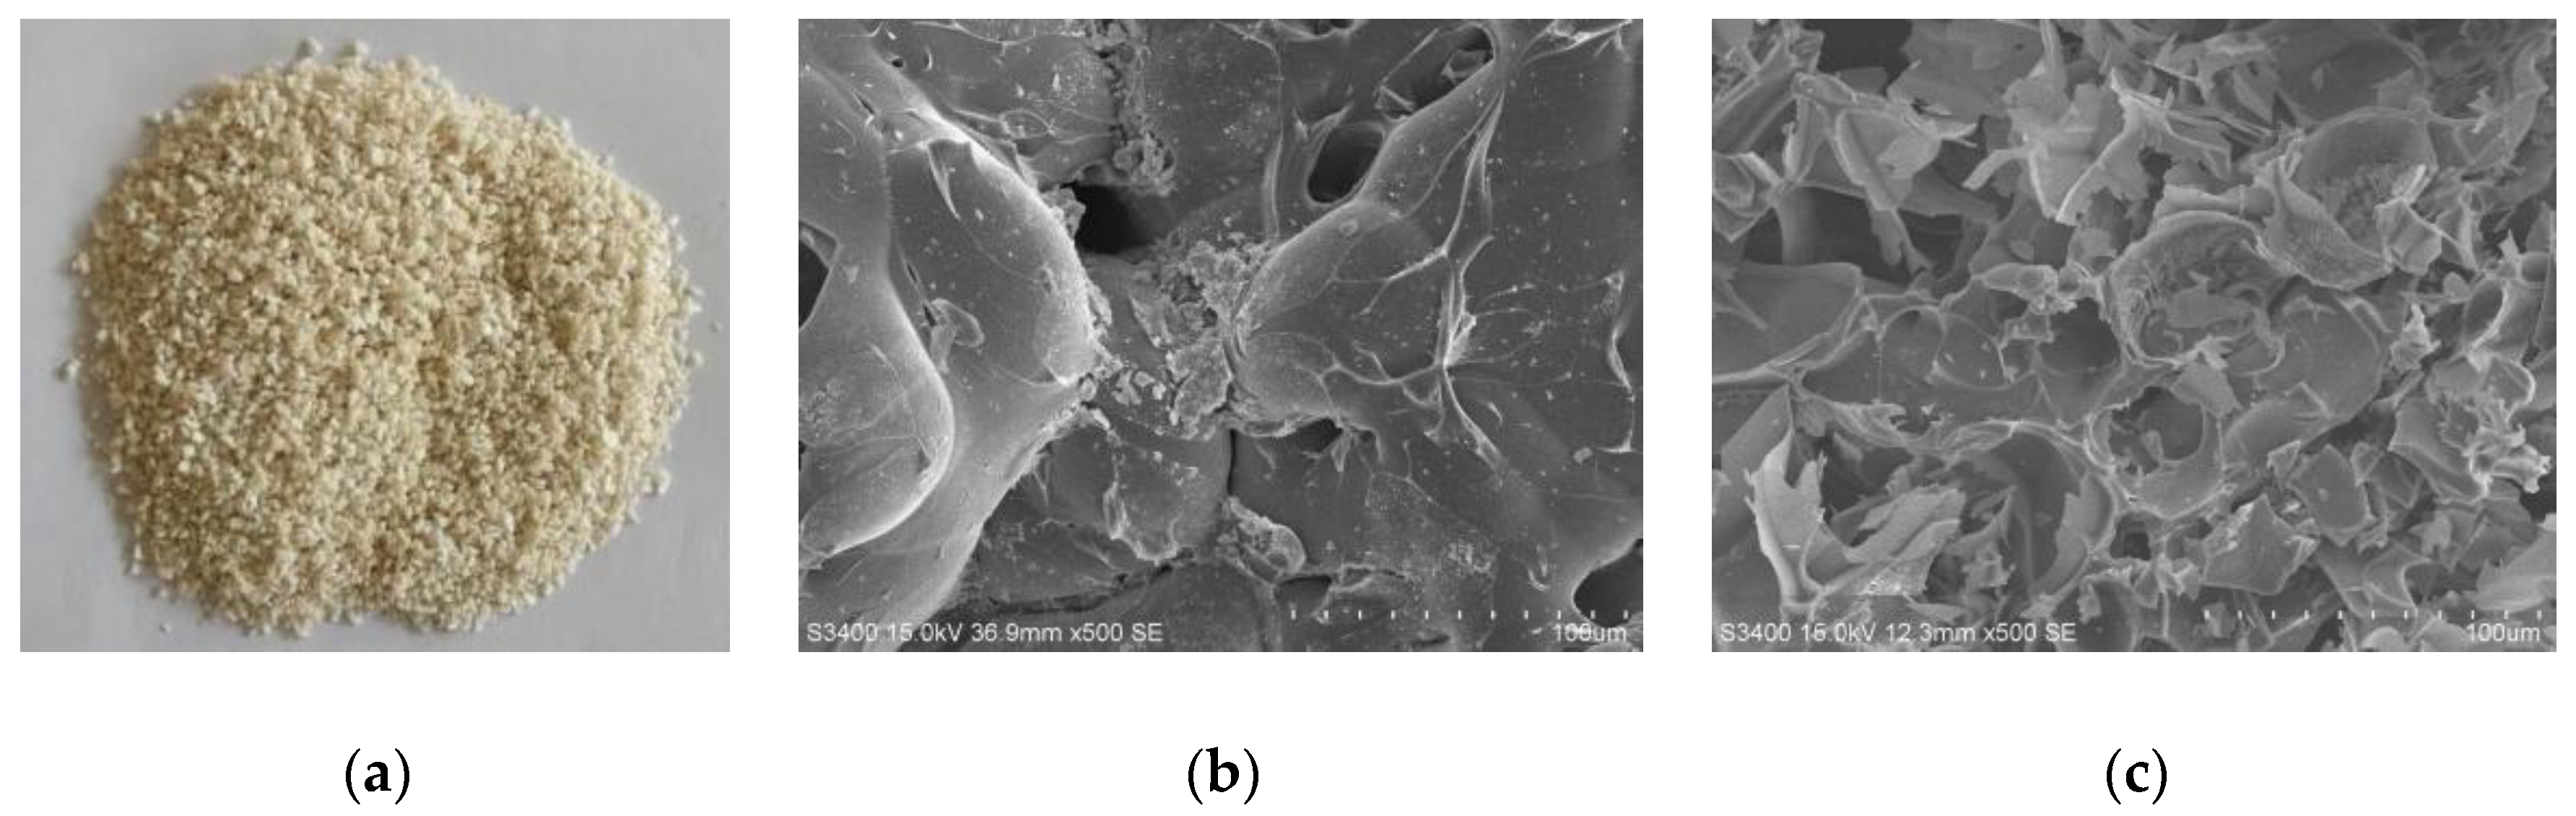
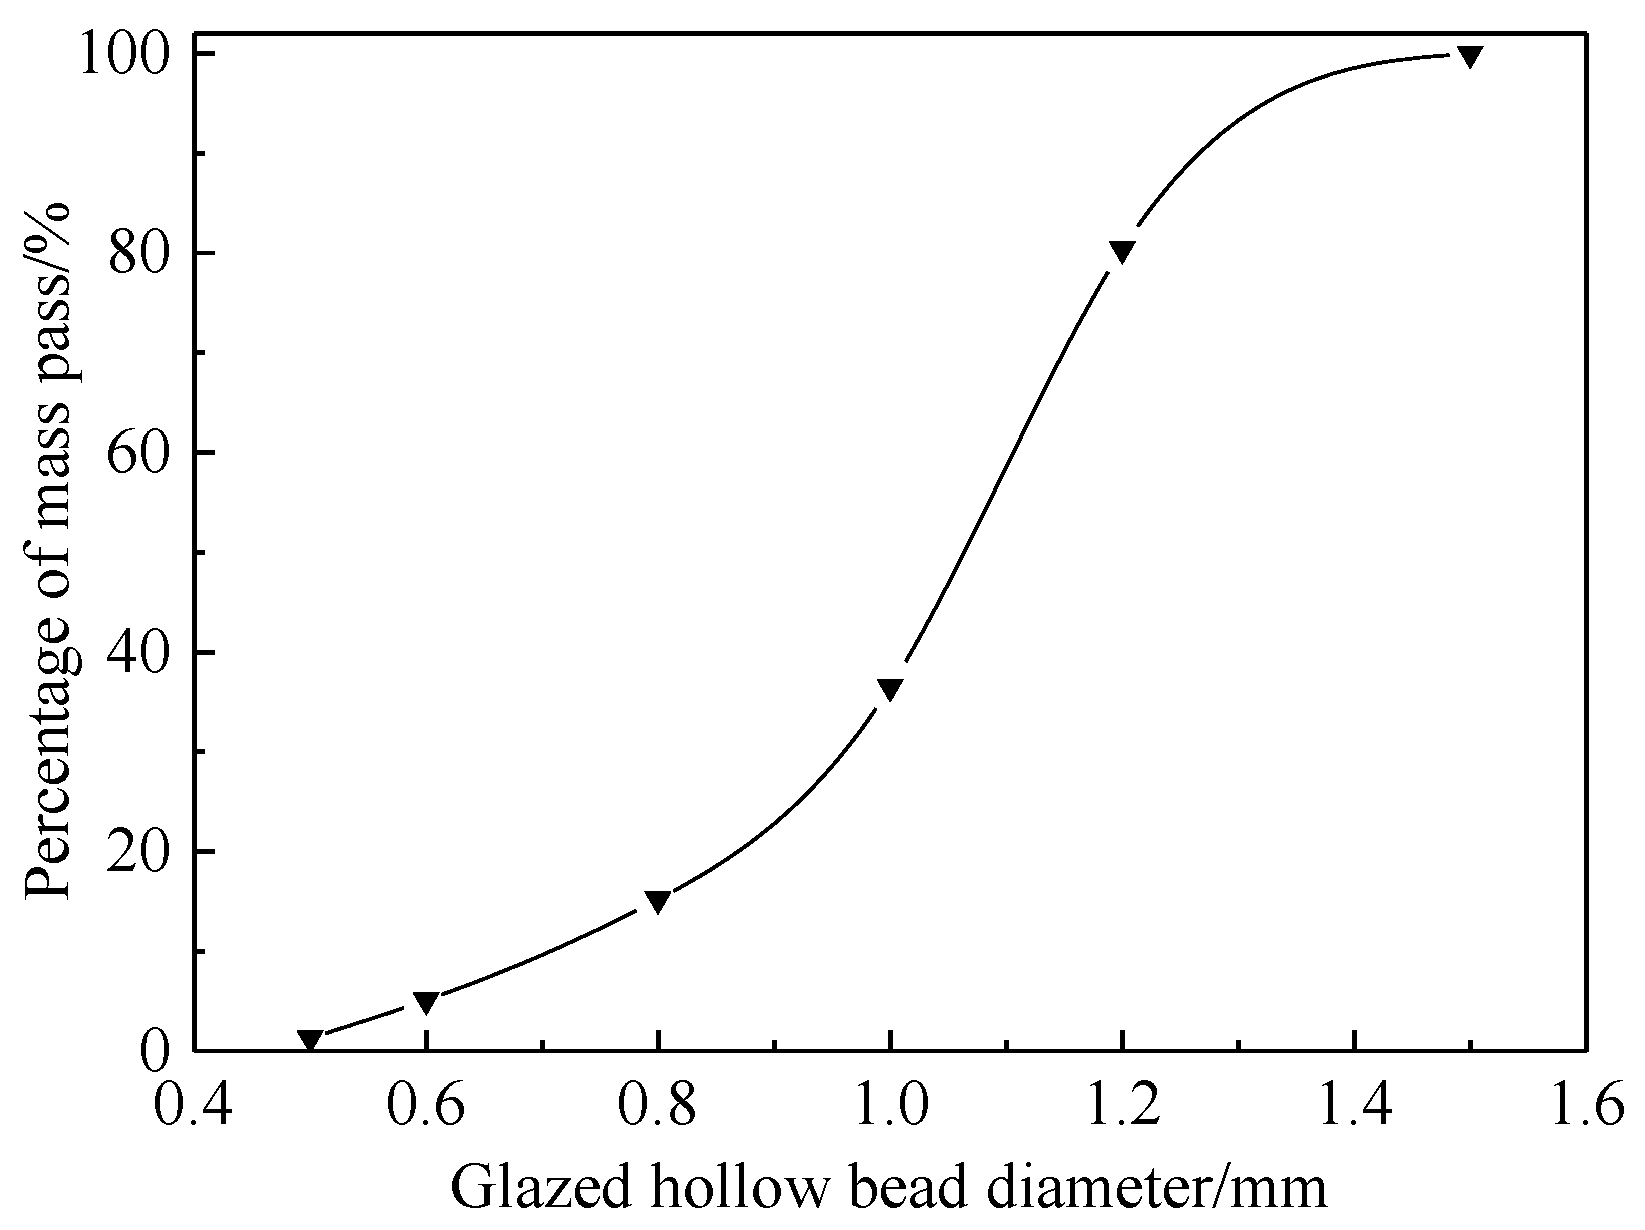
2.1. Raw Materials
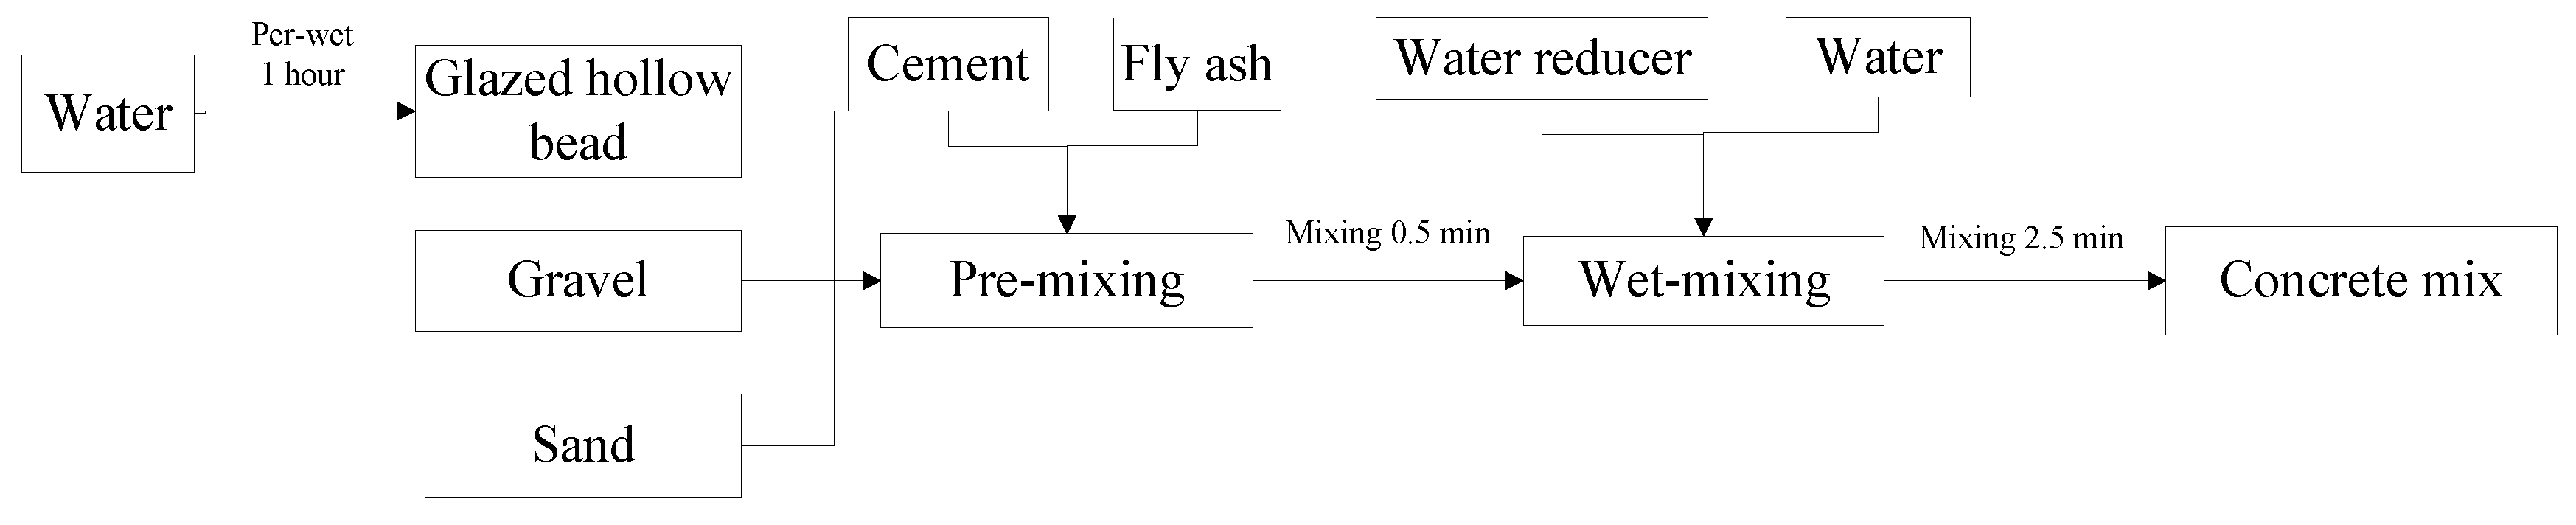
2.2. Mixing Ratio Design of Concrete
2.3. Experimental Method
3. Results and Discussion
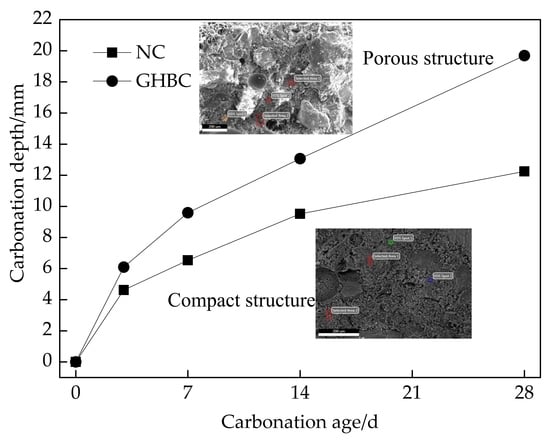
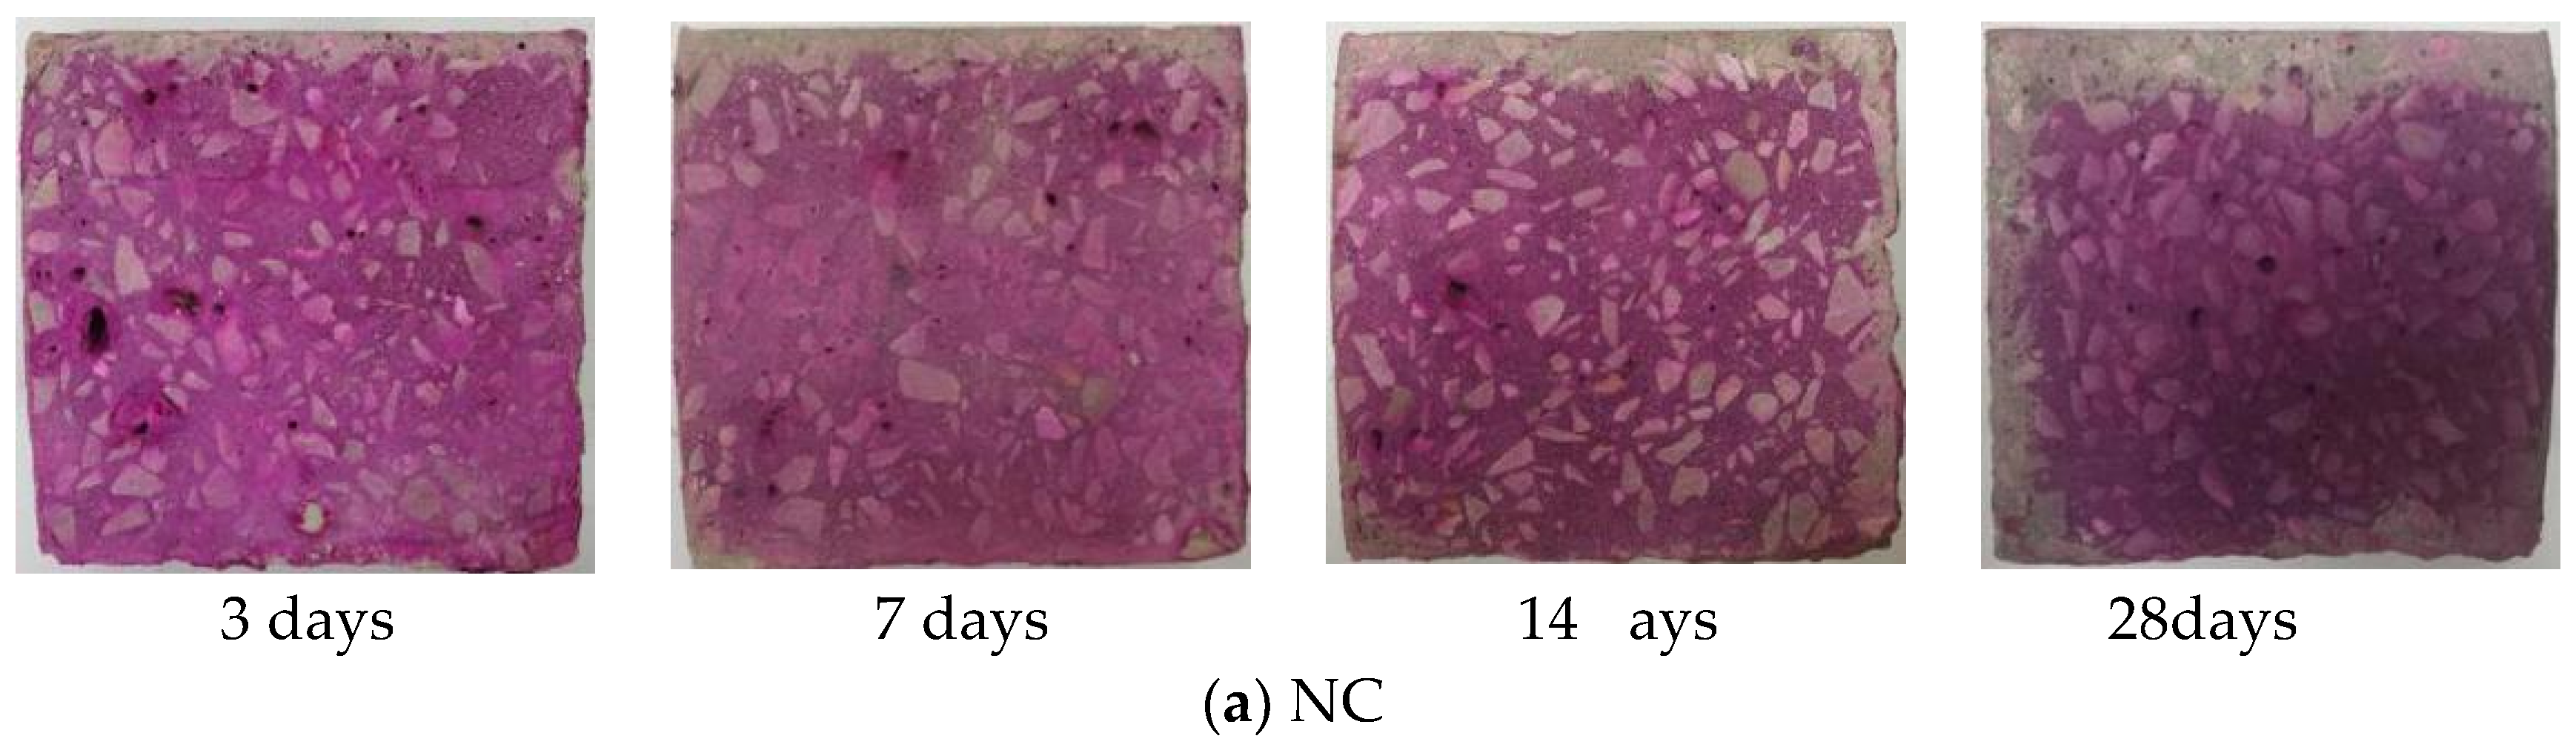
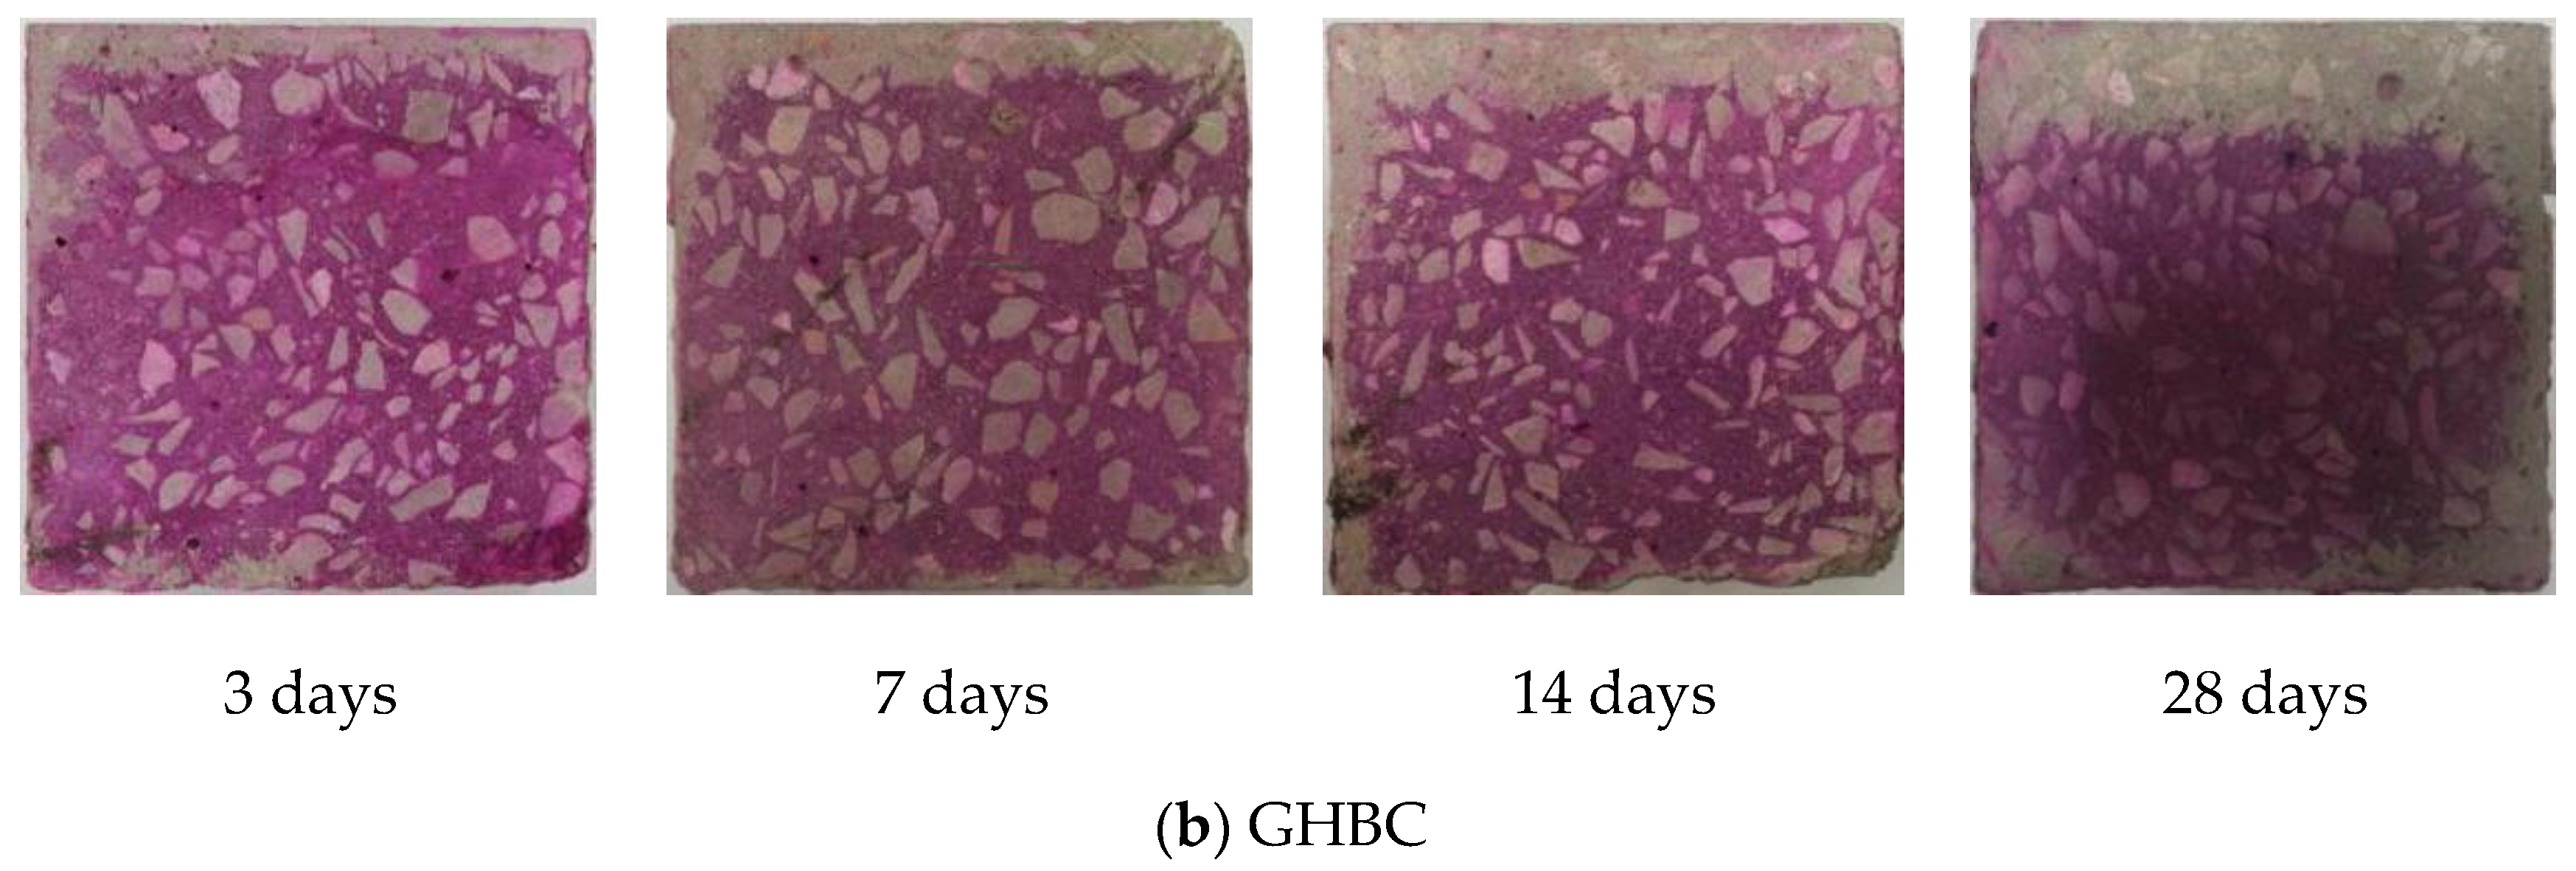
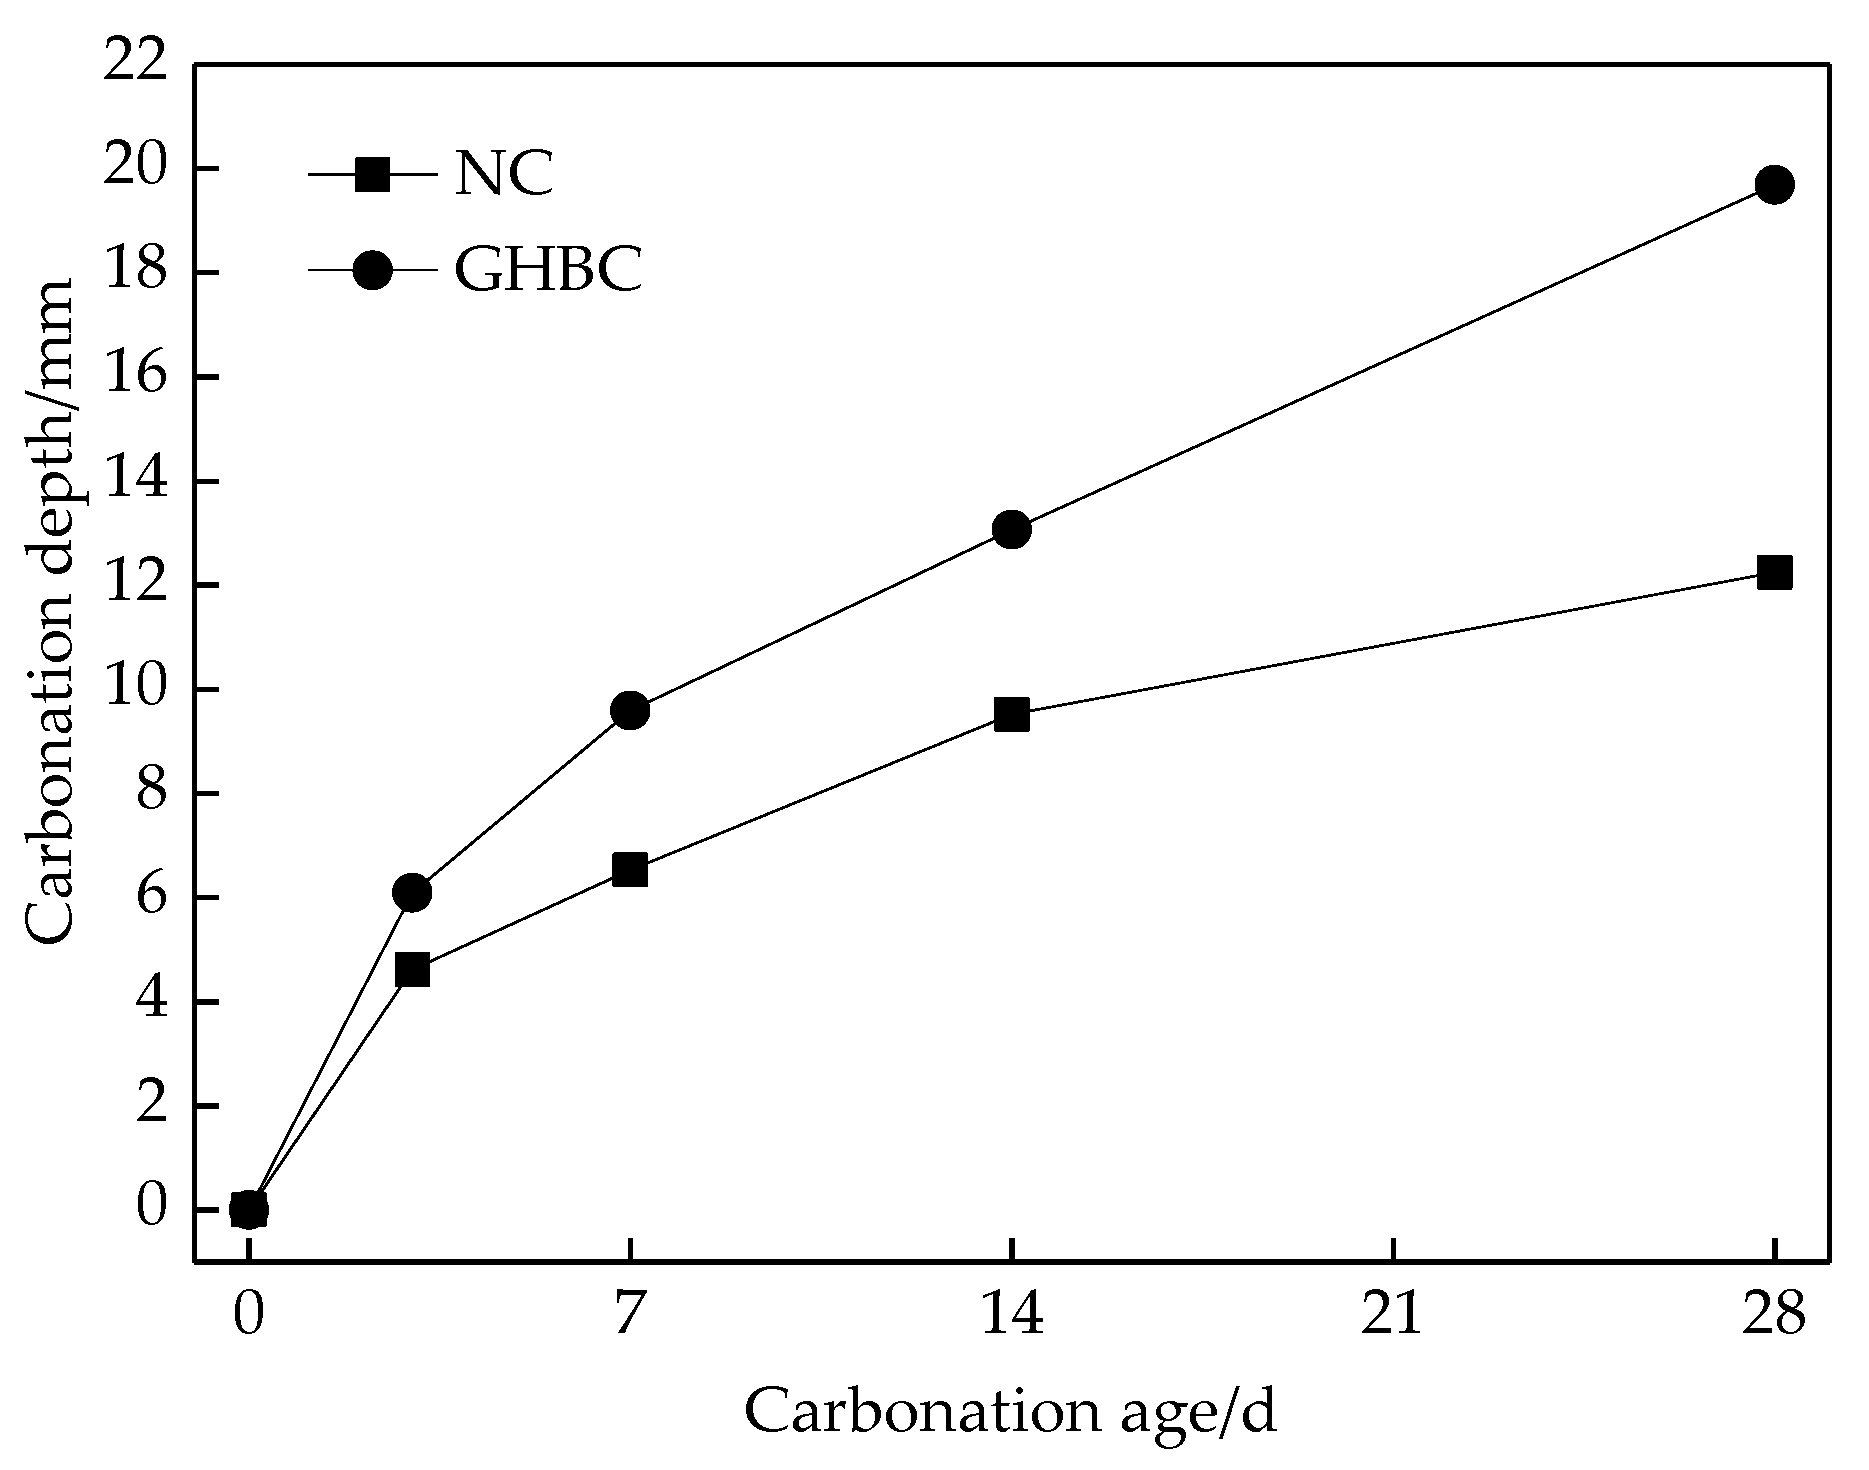
3.1. Carbonation Depth Changes with Ages
- (1)
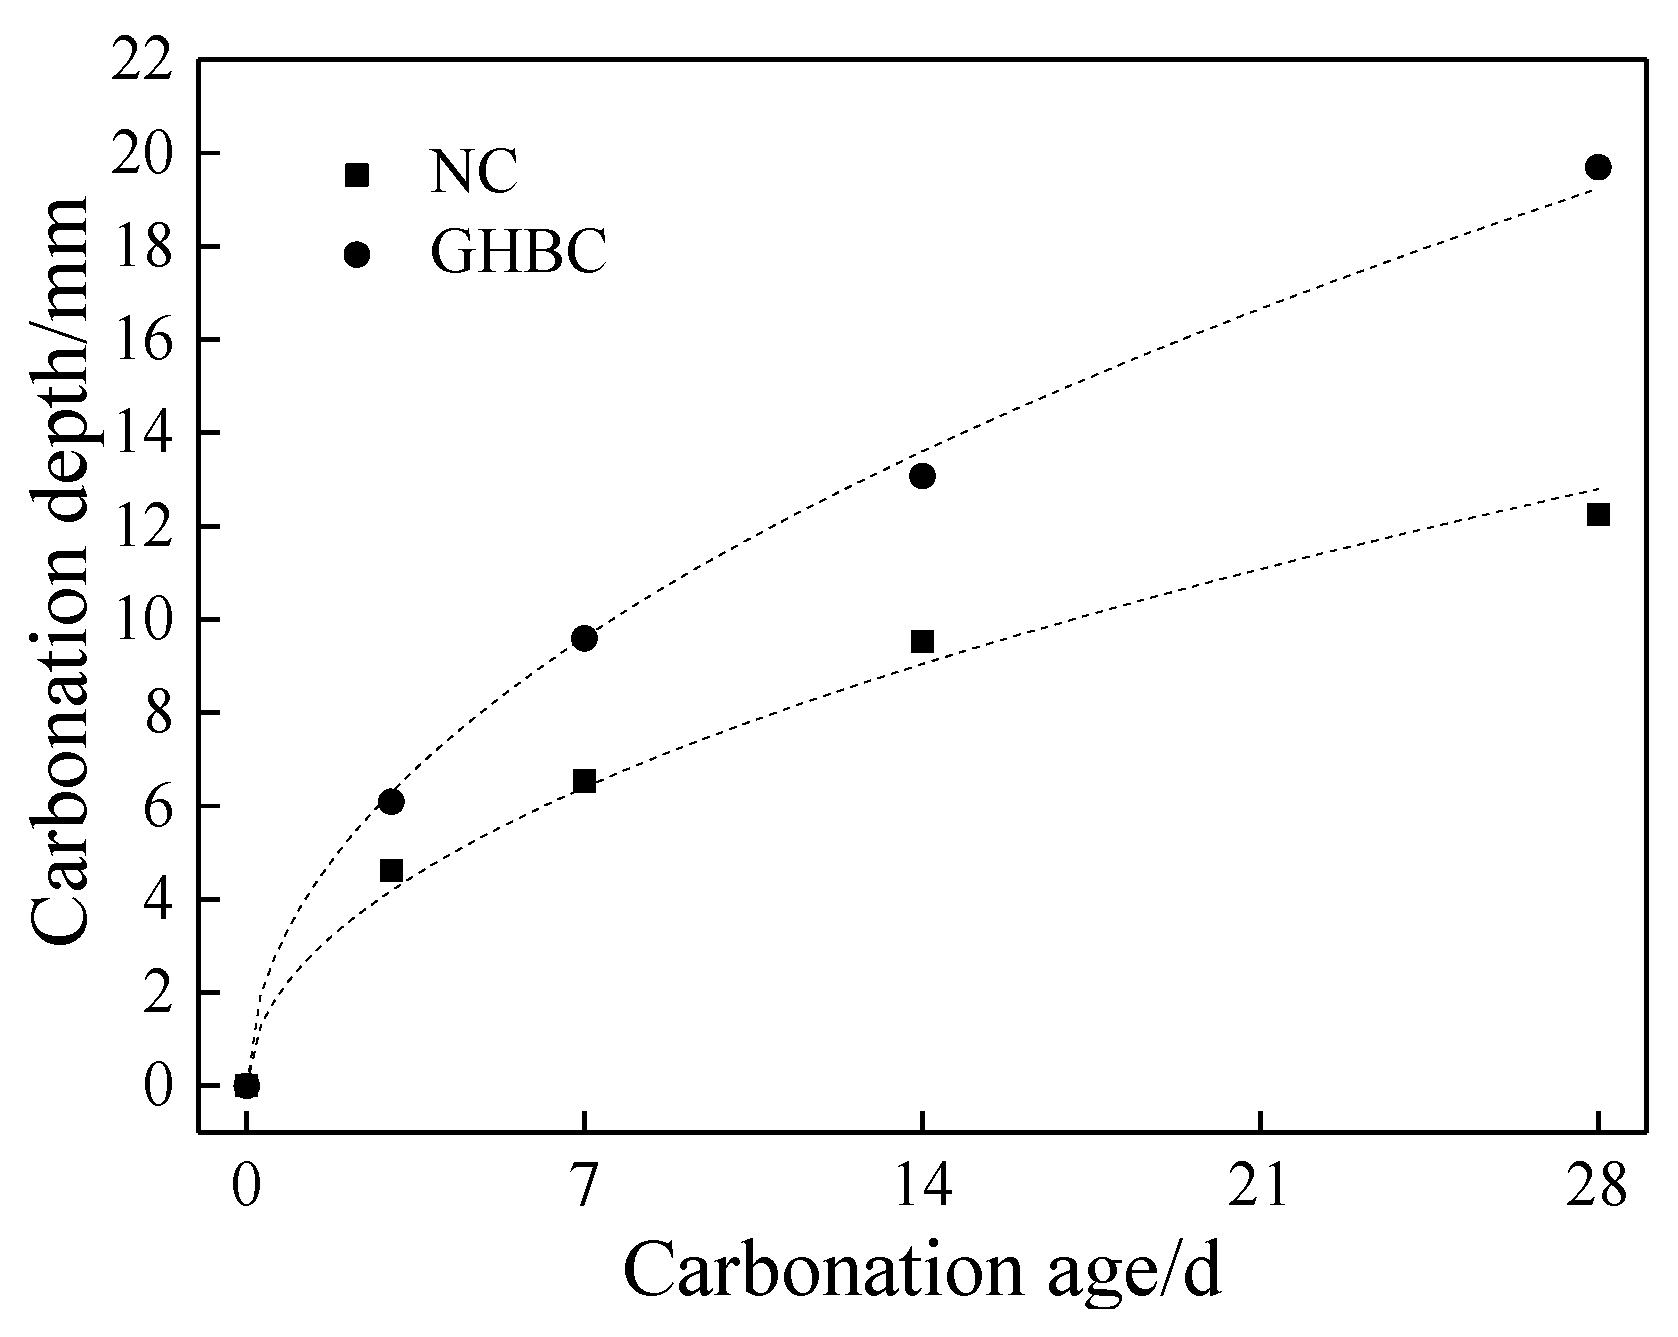
- The changes regularity of the carbonation depth of NC and GHBC is the same. As the carbonation age increased, the carbonation depth gradually increased while the carbonation rate gradually decreased. The carbonation rate was the fastest within 3 days, followed by 3 to 14 days, and became flat after 14 days. This was because CO2 reacts with Ca(OH)2 and hydrated calcium silicate to form CaCO3 in the concrete, which blocks the internal pores of the concrete hence hinders the CO2 diffusion channel and weakens the carbonation reaction.
- (2)
- After 28 days of carbonation, the carbonation depth of NC and GHBC were 12.25 mm and 19.69 mm, respectively. It can be seen that the depth of GHBC was increased by about 60.73% compared with NC, which indicates that the carbonation resistance of concrete was weakened by mixing glazed hollow bead. This is because the glazed hollow bead lightweight aggregate is loose, porous, and the permeability is high. The compactness of the cement stone is reduced by glazed hollow bead replacing some sand fine aggregates. The CO2 invades the interior of the concrete and spreads in the pores of the glazed hollow bead which established a bridge between the concrete surface and the interior making the carbonation resistance of GHBC inferior to that of NC. The related research on ceramist lightweight aggregate concrete shows that the carbonation speed of lightweight aggregate concrete is 0.8–1.0 times faster than that of the normal concrete [25,26].
3.2. Microstructure Analysis
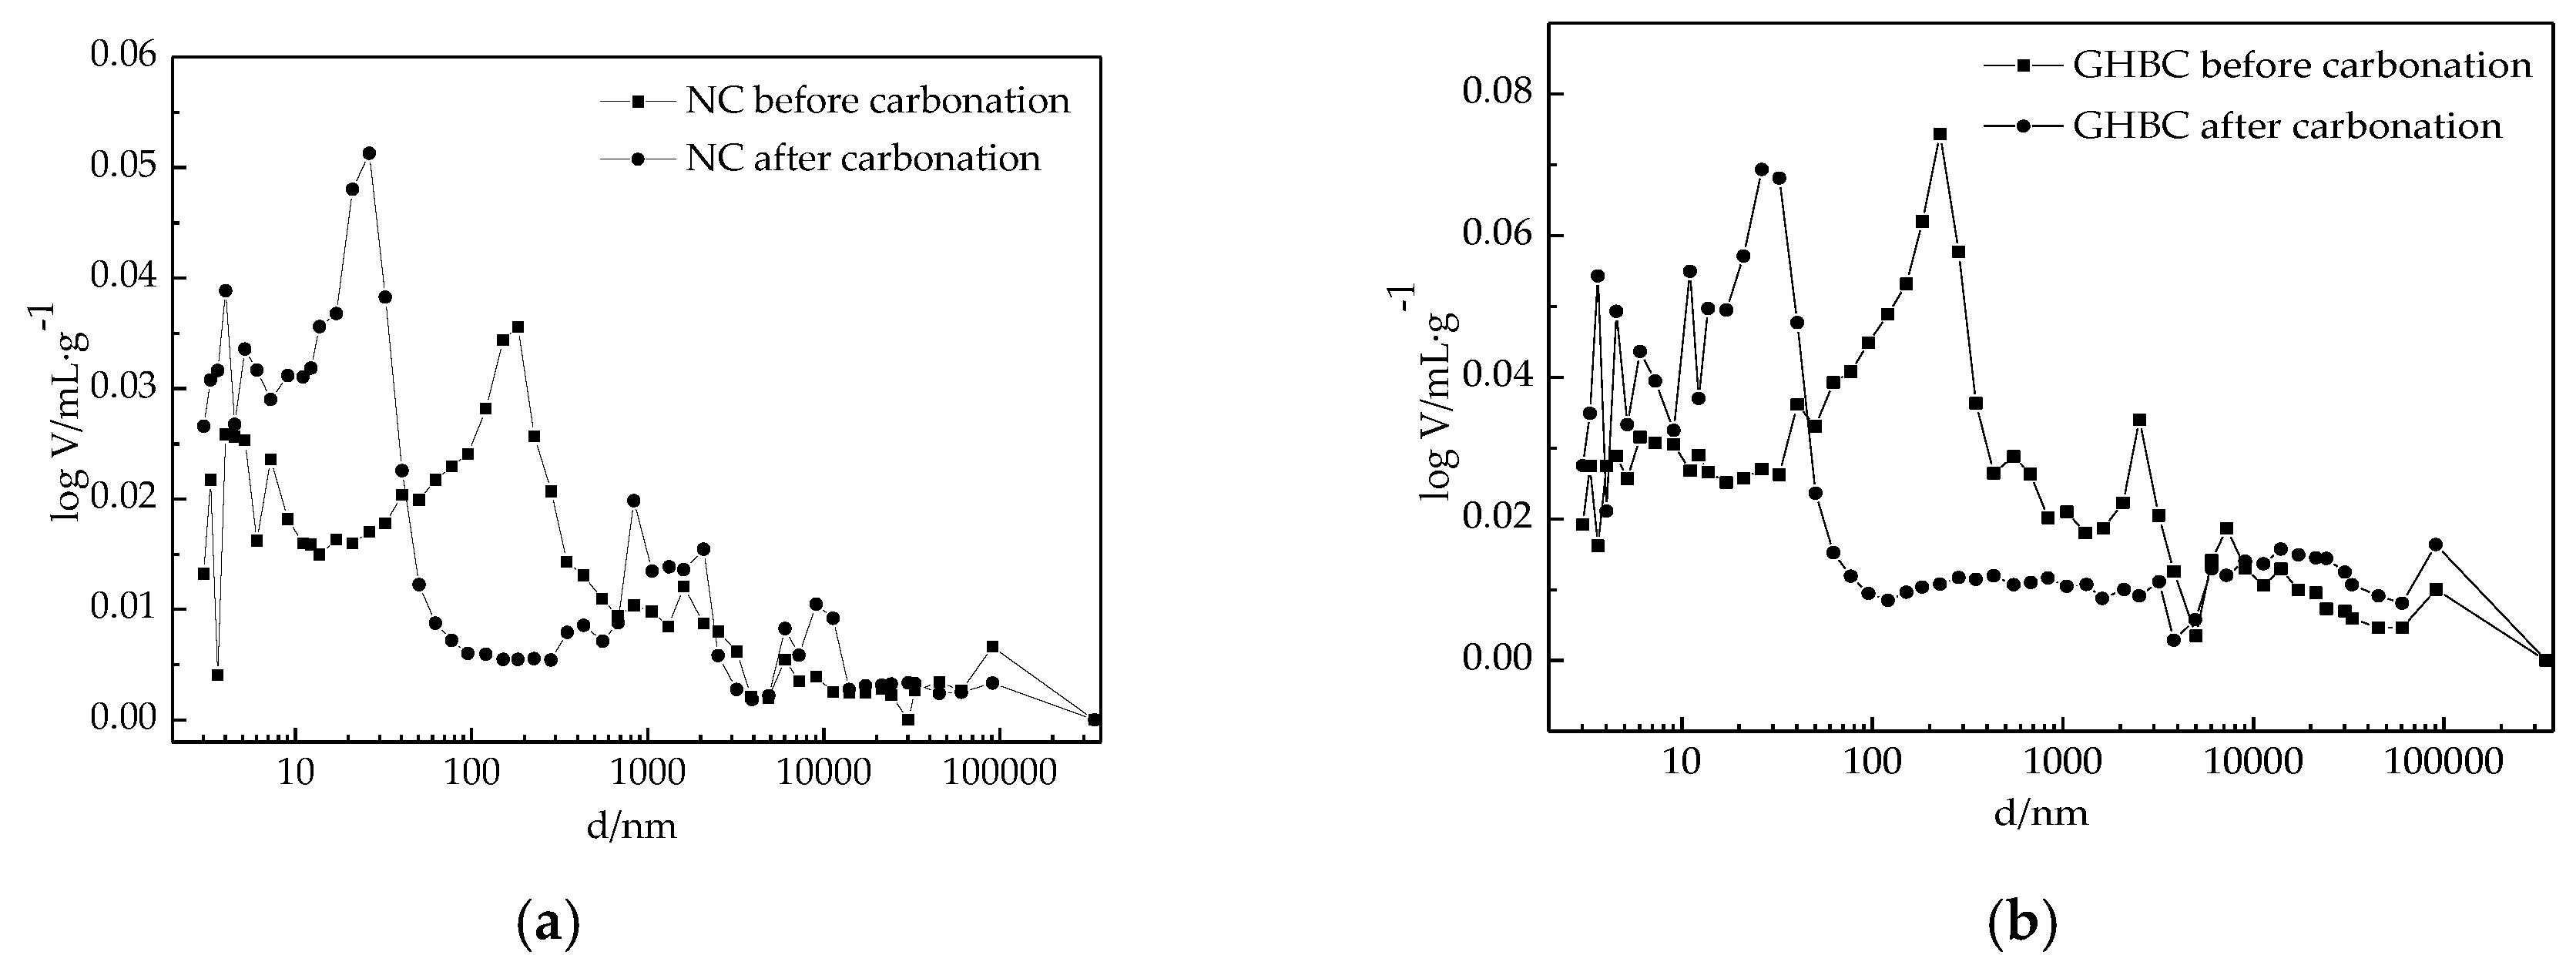
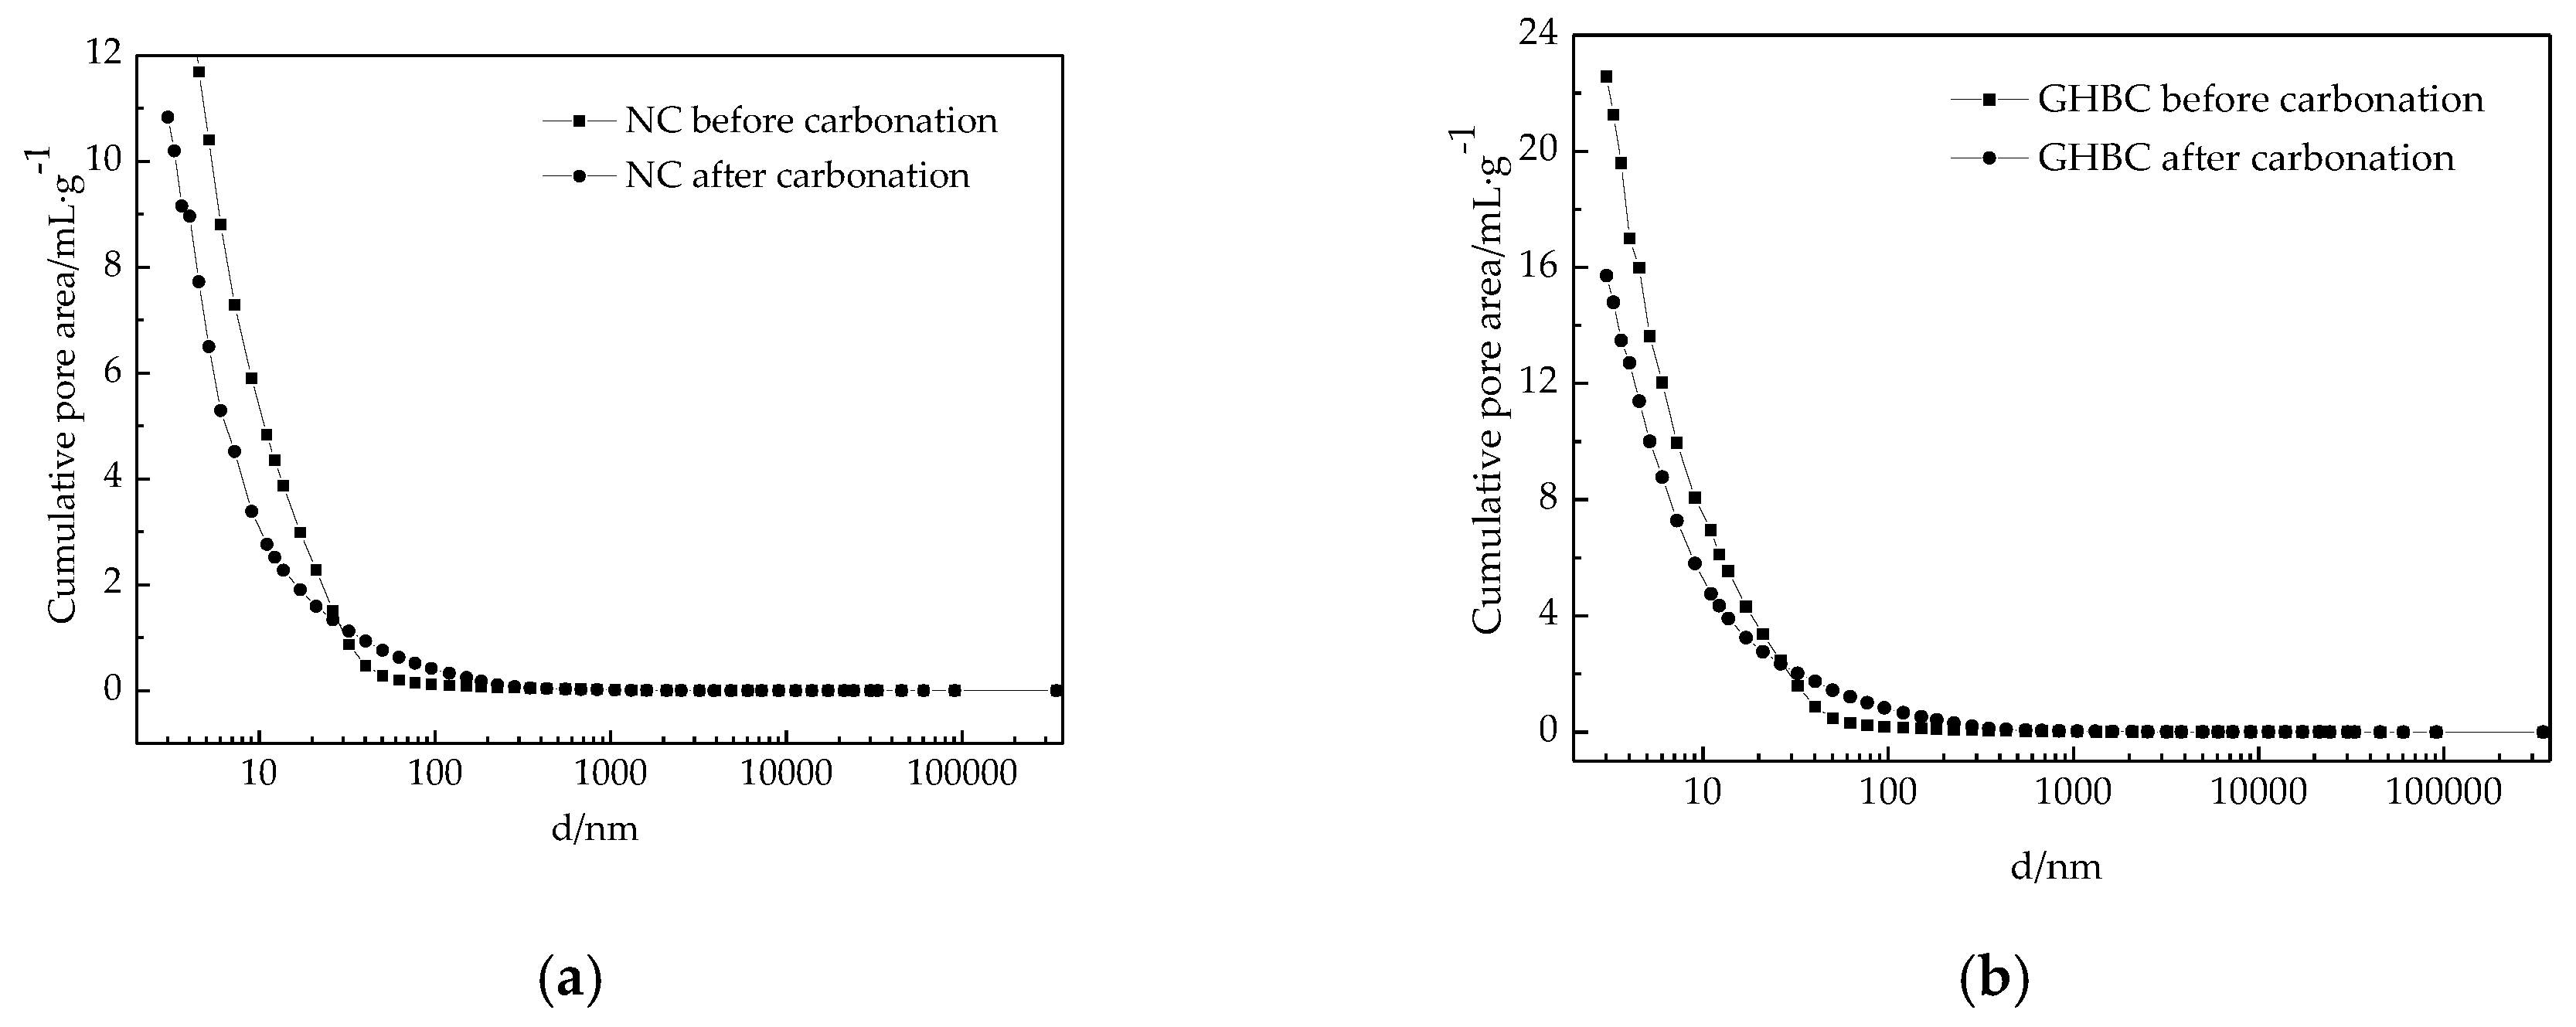
3.2.1. MIP Analysis
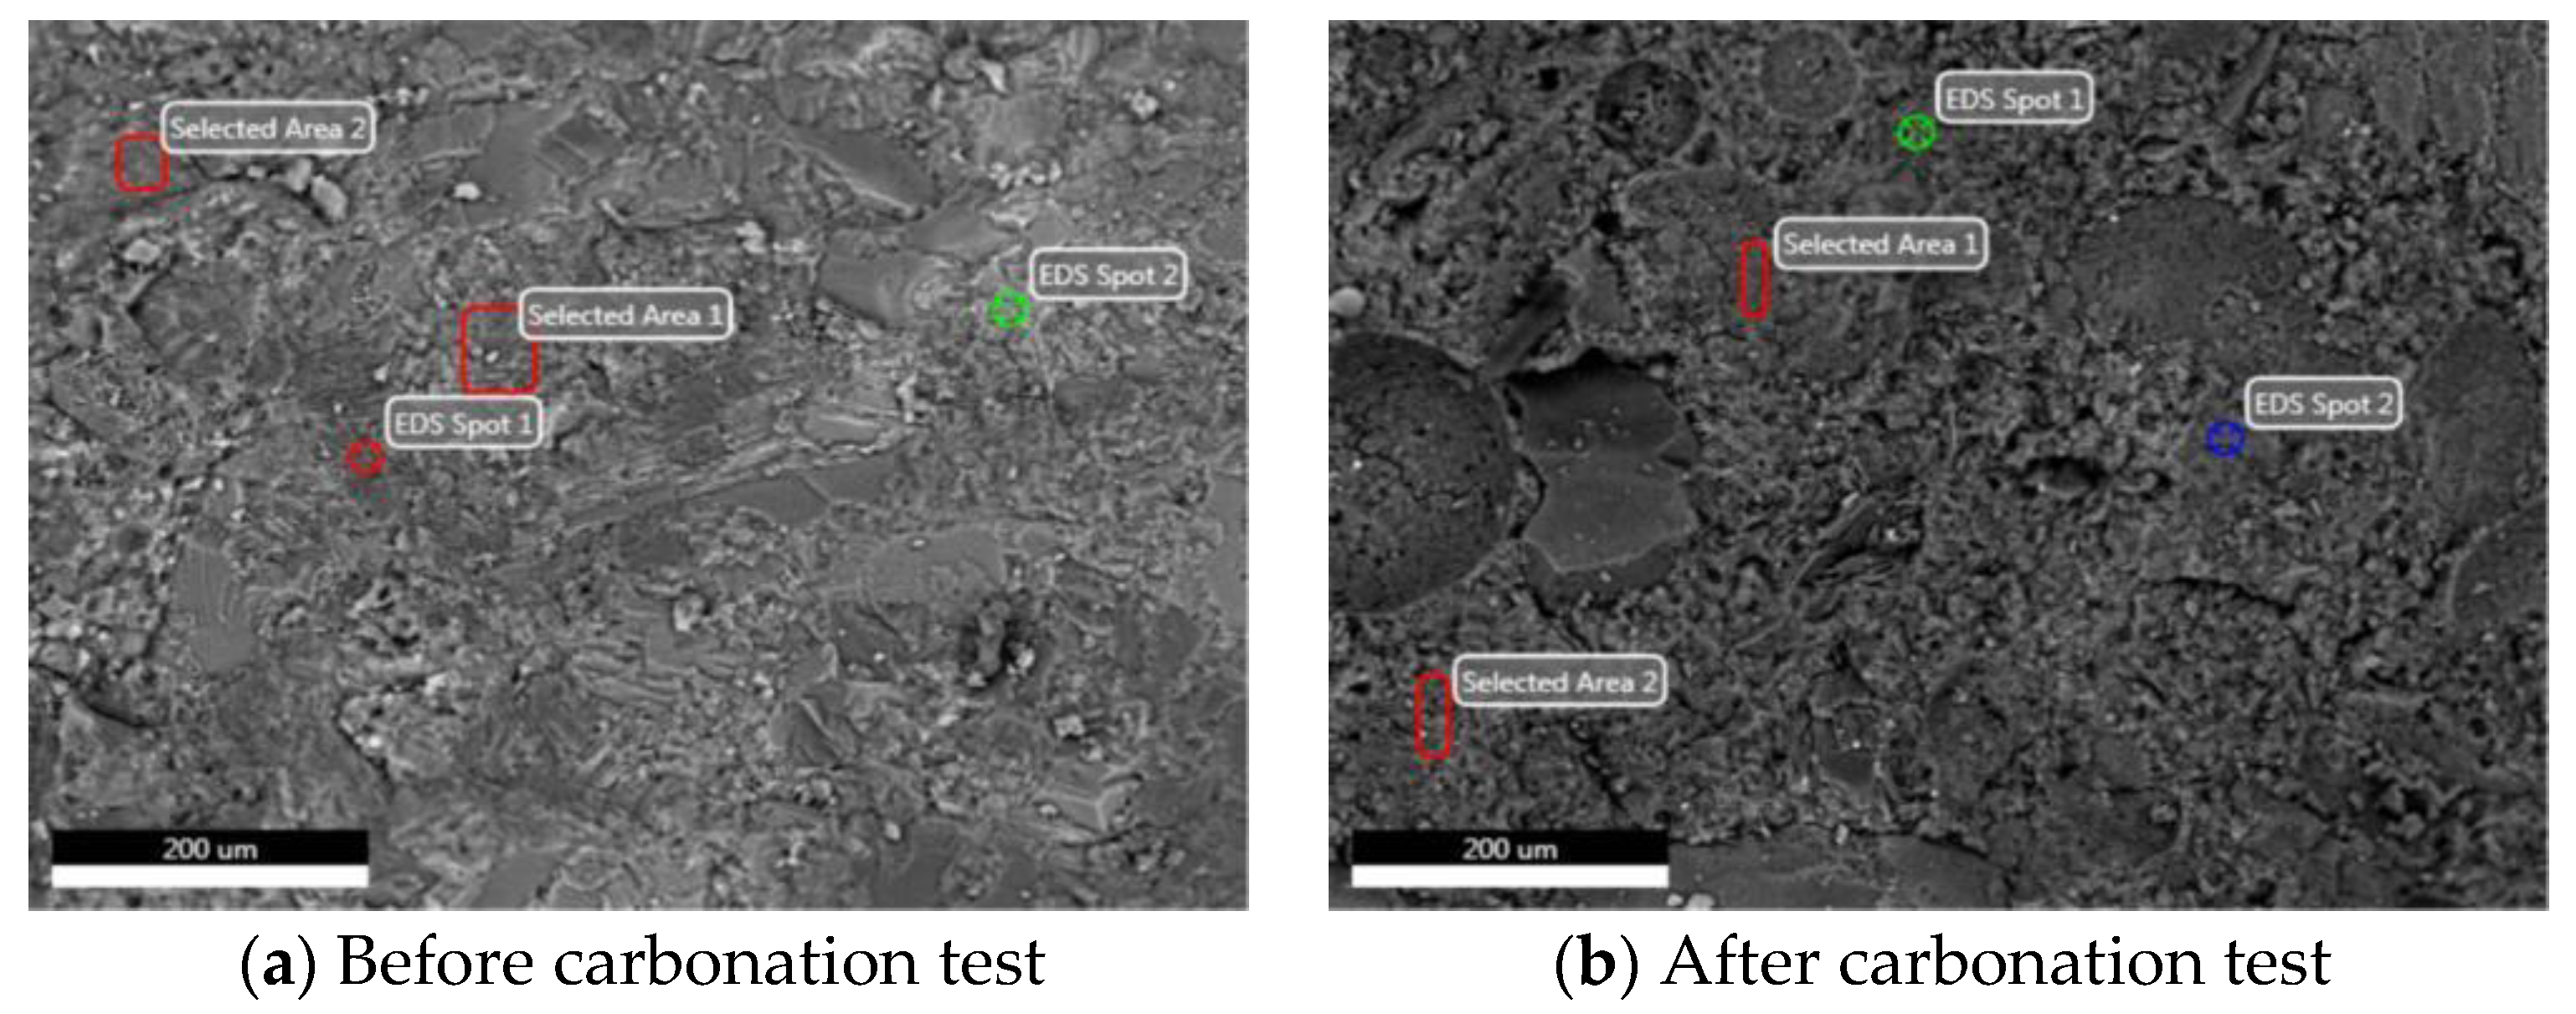
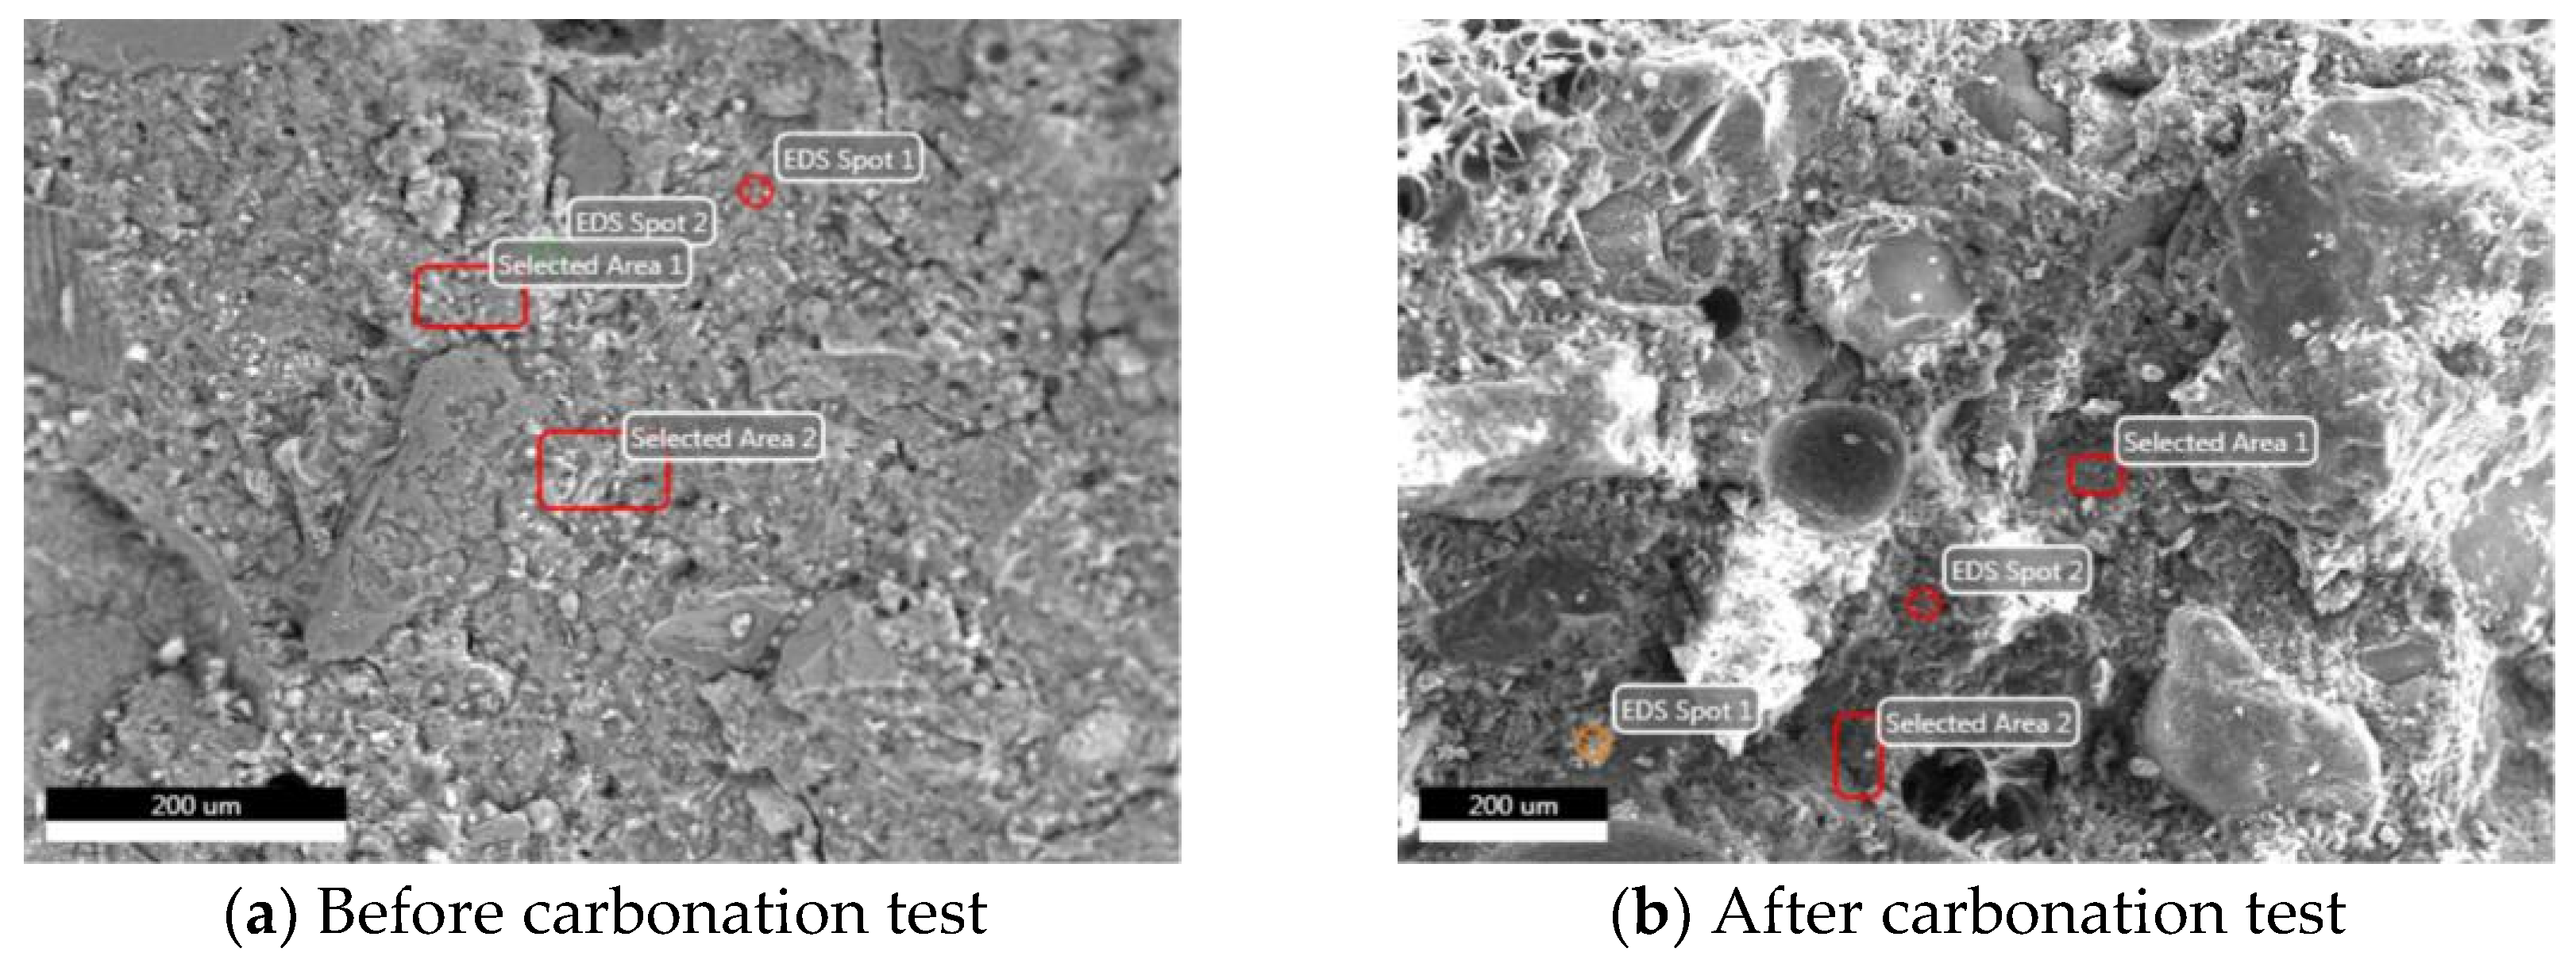
3.2.2. EDS Analysis
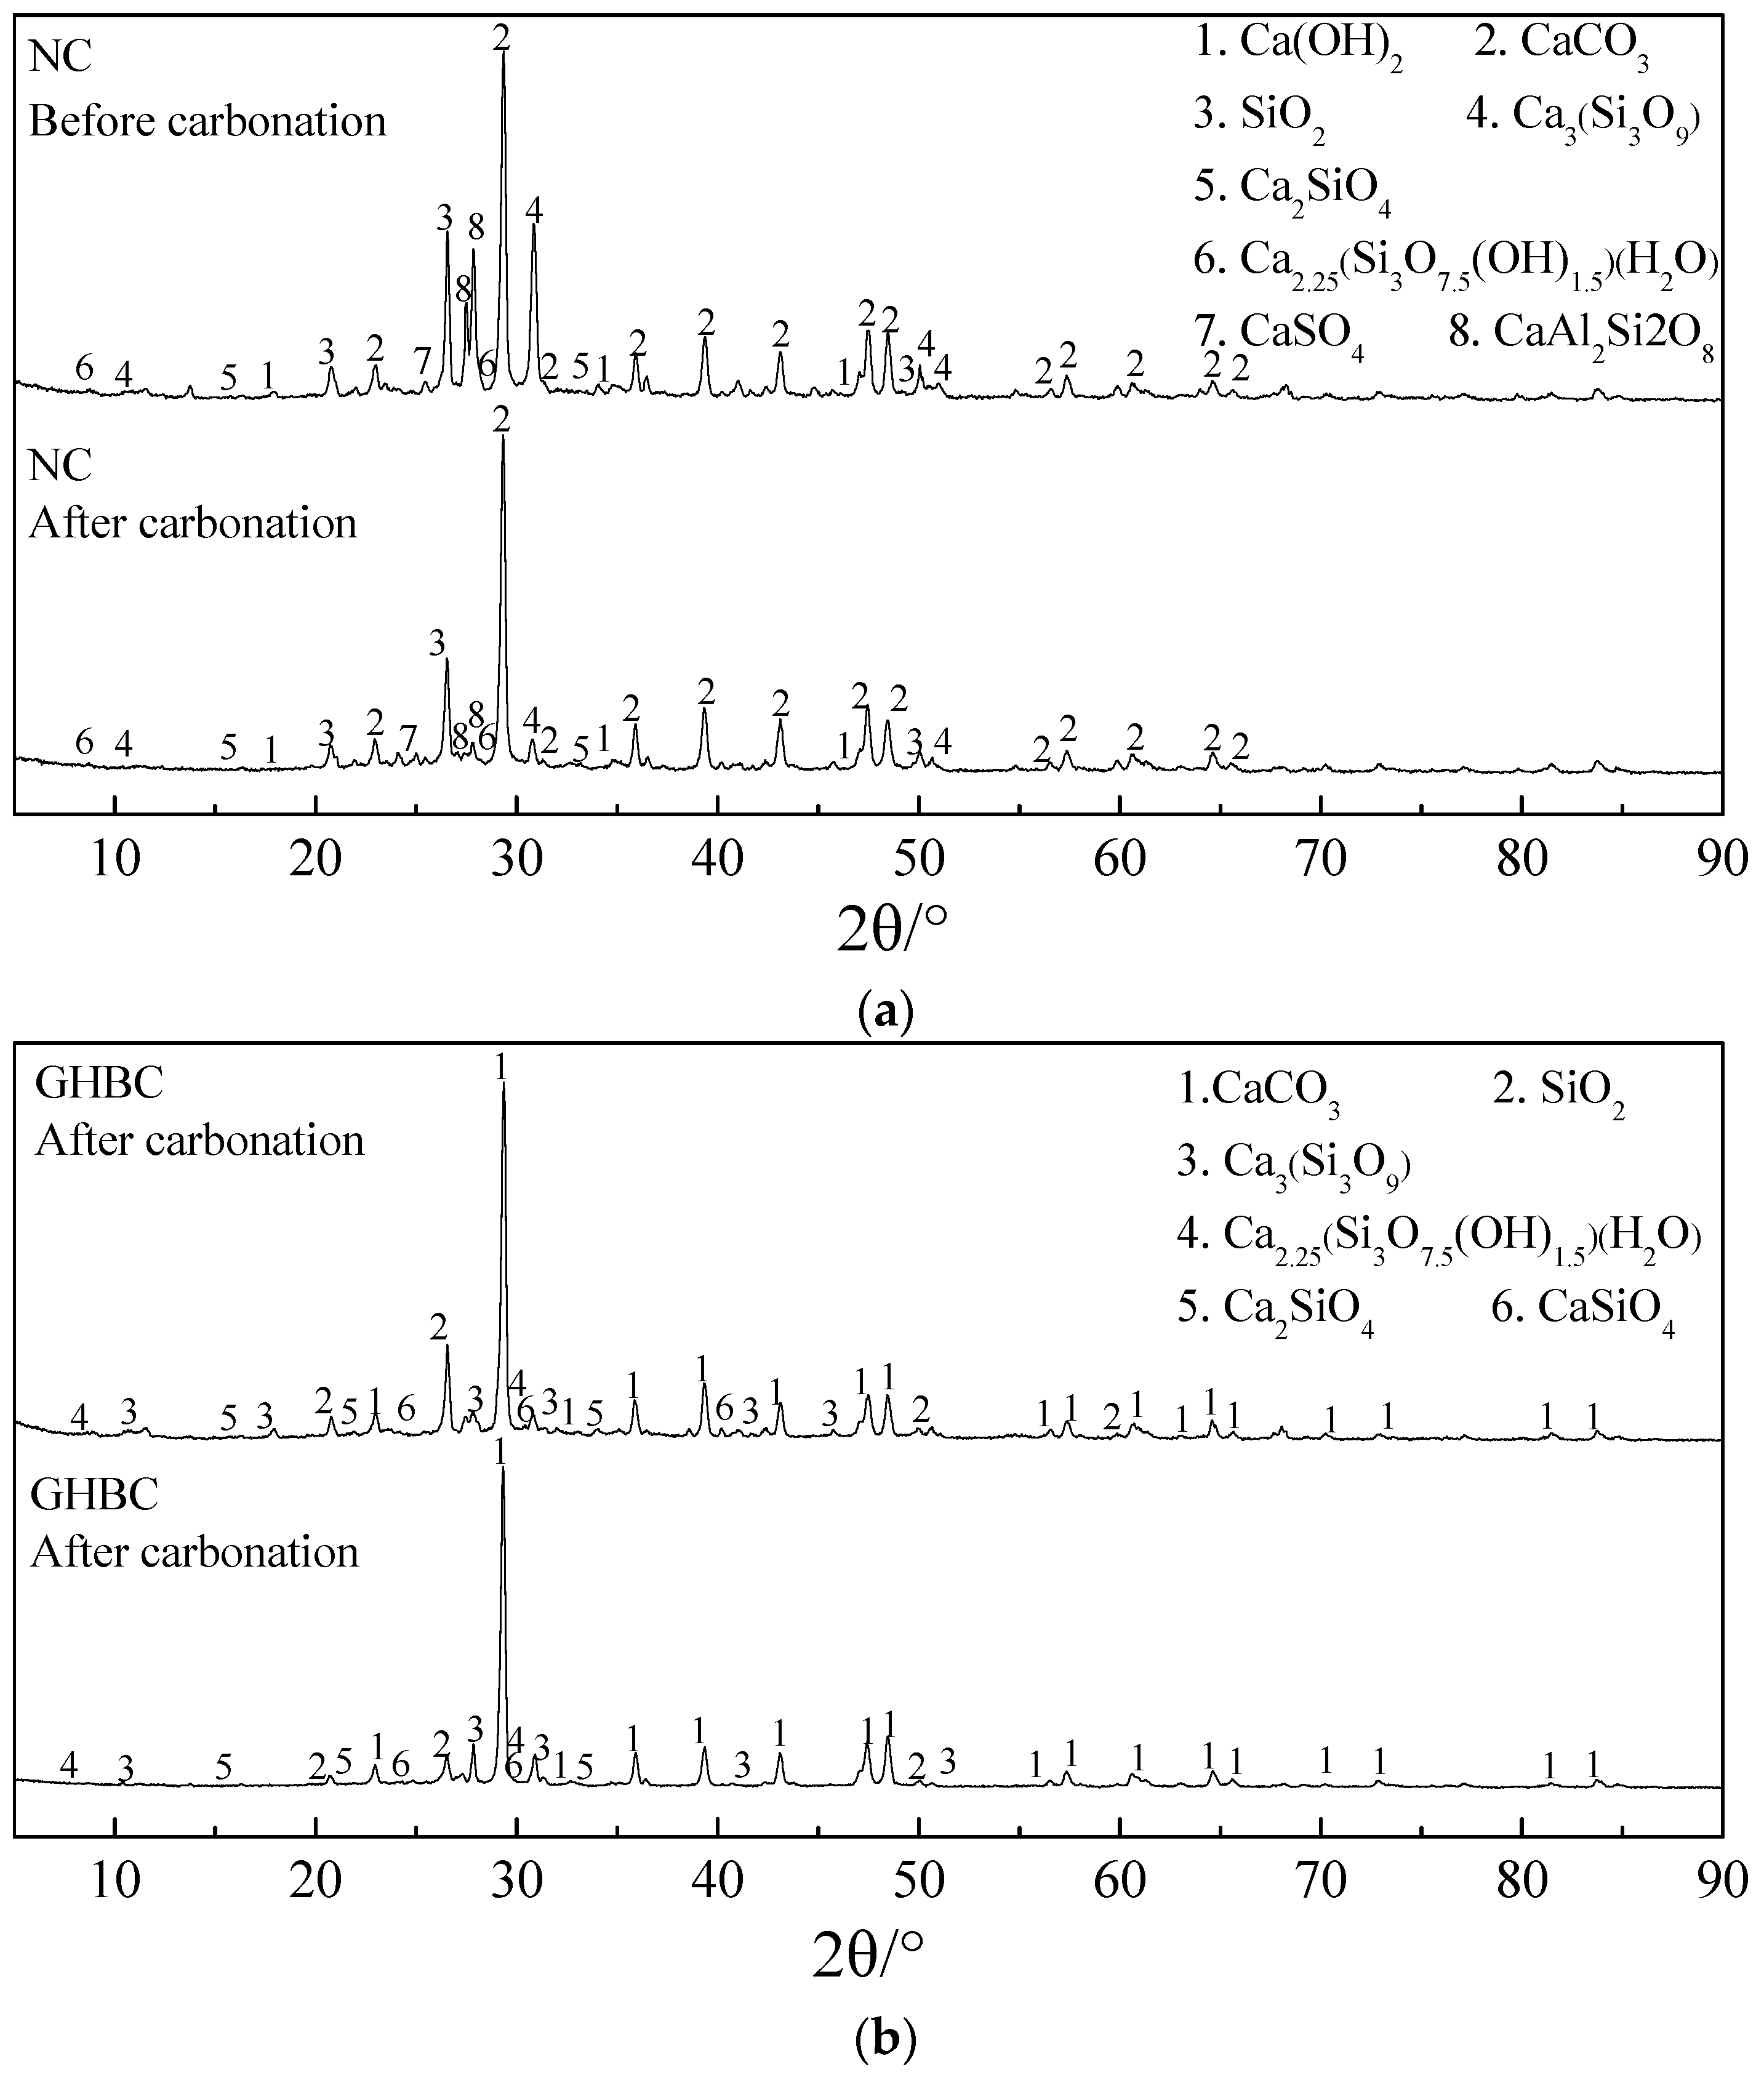
3.2.3. XRD Analysis
3.3. Establishment of Carbonation Model
3.4. Prediction Carbonation Life of Glazed Hollow Bead Concrete
4. Conclusions
- (1)
- The concrete mixed with proper amount of glazed hollow bead can effectively improve the heat insulation capacity and workability while certainly reducing the apparent density and compressive strength. The 28 days compressive strength decreased by about 29%, and the thermal conductivity decreased by about 26%.
- (2)
- Because of the loose porosity of the glazed hollow bead, the compactness of the cement stone is reduced hence facilitates the intrusion of CO2. After 28 days of carbonation test, the carbonation depth of GHBC and NC were 19.69 mm and 12.25 mm that is the GHBC carbonation depth was 1.61 times than that of NC.
- (3)
- The microstructural analysis showed that the porosity of concrete was reduced and the carbon content increased significantly after carbonation. For NC, the porosity decreased from 14.36% to 13.53%, the carbon content increased from 4.42% to 5.94%, the CaCO3 content increased from 18.5% to 56.0%; for GHBC, the porosity decreased from 22.94% to 20.71%, the carbon content increased from 4.97% to 5.31%, the CaCO3 content increased from 70.0% to 82.0%. It showed that carbon intrusion produces a large amount of CaCO3 precipitation, resulting filing and refining large amount of pores causing porosity and pore size reduction hence compactness of cement stone is increased.
- (4)
- The prediction formula of GHBC was established from experimental data and the fitting effects was good. The carbonation life was also predicted.
Author Contributions
Funding
Acknowledgments
Conflicts of Interest
References
- Katpady, D.N.; Hazehara, H.; Soeda, M.; Kubota, T.; Murakami, S. Durability Assessment of Blended Concrete by Air Permeability. Int. J. Concr. Struct. Mater. 2018, 12, 30. [Google Scholar] [CrossRef]
- Ashraf, W. Carbonation of cement-based materials: Challenges and opportunities. Constr. Build. Mater. 2016, 120, 558–570. [Google Scholar] [CrossRef]
- Wu, T. Review on durability of lightweight aggregate concrete in atmospheric environment. J. Archit. Civil Eng. 2017, 34, 154–162. (In Chinese) [Google Scholar]
- Jin, W.L.; Zhao, Y.X. State-of-the-art on durability of concrete structures. J. Zhejiang Univ. Eng. Sci. 2002, 36, 371–380. (In Chinese) [Google Scholar]
- Savija, B.; Lukovic, M. Carbonation of cement paste: Understanding, challenges, and Opportunities. Constr. Build. Mater. 2016, 117, 285–301. [Google Scholar] [CrossRef]
- Tandiroglu, A. Temperature-Dependent Thermal Conductivity of High Strength Lightweight Raw Perlite Aggregate Concrete. Int. J. Thermophys. 2010, 31, 1195–1211. [Google Scholar] [CrossRef]
- Zhang, Z.P. Material and Structural Basic Performance Tests and Theoretical Analysis Research on Glazed Hollow Bead Insulation Concrete. Ph.D. Thesis, Taiyuan University of Technology, Taiyuan, China, 2009. (In Chinese). [Google Scholar]
- Zhang, Y.; Ma, G.; Wang, Z.; Niu, Z.; Liu, Y.; Li, Z. Shear behavior of reinforced glazed hollow bead insulation concrete beams. Constr. Build. Mater. 2018, 174, 81–95. [Google Scholar] [CrossRef]
- Zhang, Y.; Ma, G.; Liu, Y.; Li, Z. Flexural performance of glazed hollow bead reinforced concrete beams. J. Reinf. Plast. Compos. 2015, 34, 1698–1712. [Google Scholar] [CrossRef]
- Xiong, H.; Xu, J.; Liu, Y.; Wang, S. Experimental study on hygrothermal deformation of external thermal insulation cladding systems with glazed hollow bead. Adv. Mater. Sci. Eng. 2016, 2016, 3025213. [Google Scholar] [CrossRef]
- Zhao, L.; Wang, W.; Li, Z.; Chen, Y.F. An experimental study to evaluate the effects of adding glazed hollow beads on the mechanical properties and thermal conductivity of concrete. Mater. Res. Innov. 2015, 19, S5-929–S5-935. [Google Scholar] [CrossRef]
- Ma, G.; Zhang, Y.; Li, Z. Influencing Factors on the Interface Microhardness of Lightweight Aggregate Concrete Consisting of Glazed Hollow Bead. Adv. Mater. Sci. Eng. 2015, 2015, 1–15. [Google Scholar] [CrossRef] [Green Version]
- Chai, L.J.; Li, Z.; Liu, Y.Z.; Wang, W. Effect of cooling mode and temperature on micro-structure of glazed hollow bead thermal insulation concrete. J. Taiyuan Univ. Technol. 2015, 46, 419–423. (In Chinese) [Google Scholar]
- Pan, H.K.; Yang, Z.S.; Xu, F.W. Study on concrete structure’s durability considering the interaction of multi-factors. Constr. Build. Mater. 2016, 118, 256–261. [Google Scholar] [CrossRef]
- Cho, H.-C.; Ju, H.; Oh, J.-Y.; Lee, K.J.; Hahm, K.W.; Kim, K.S. Estimation of Concrete Carbonation Depth Considering Multiple Influencing Factors on the Deterioration of Durability for Reinforced Concrete Structures. Adv. Mater. Sci. Eng. 2016, 2016, 1–18. [Google Scholar] [CrossRef] [Green Version]
- Song, H.; Niu, D.T.; Li, C.H. Carbonation test of concrete containing mineral admixtures. J. Chin. Ceram. Soc. 2009, 37, 2066–2070. (In Chinese) [Google Scholar]
- Yang, L.D.; Pan, H.K.; Zhu, Y.Z.; Wu, Z.Z. Experimental study of concrete’s carbonation resistance under combined action of factors. J. Build. Mater. 2008, 11, 345–348. (In Chinese) [Google Scholar]
- Gong, L.S. Provisions on durability indexes of lightweight aggregate concrete against carbonization. Concrete 1991, 2, 3–8. (In Chinese) [Google Scholar]
- Bogas, J.A.; Real, S.; Ferrer, B. Biphasic carbonation behavior of structural lightweight aggregate concrete produced with different types of binder. Cem. Concr. Compos. 2016, 71, 110–121. [Google Scholar] [CrossRef]
- Ferrer, B.; Bogas, J.A.; Real, S. Service life of structural lightweight aggregate concrete under carbonation-induced corrosion. Constr. Build. Mater. 2016, 120, 161–171. [Google Scholar] [CrossRef]
- Pereira, D.S.D.T.; Da Silva, F.J.; Porto, A.B.R.; Candido, V.S.; Da Silva, A.C.R.; Filho, F.D.C.G.; Monteiro, S.N. Comparative analysis between properties and microstructures of geopolymeric concrete and portland concrete. J. Mater. Res. Technol. 2018, 7, 606–611. [Google Scholar] [CrossRef]
- Xiao, J.; Li, W.; Sun, Z.; Lange, D.A.; Shah, S.P. Properties of interfacial transition zones in recycled aggregate concrete tested by nanoindentation. Cem. Concr. Compos. 2013, 37, 276–292. [Google Scholar] [CrossRef]
- Aguilar, R.A.; Díaz, O.B.; García, J.E. Lightweight concretes of activated metakolin-fly ash binders, with blast furnace slag aggregates. Constr. Build. Mater. 2010, 24, 1166–1175. [Google Scholar] [CrossRef]
- Zhou, S.E.; Lu, Z.Y.; Yan, Y. Study on thermal conductivity model of foamed concrete. Mater. Rev. Res. Paper 2009, 23, 69–73. (In Chinese) [Google Scholar]
- Hu, S.G.; Wang, F.Z. Lightweight Aggregate Concrete; Chemical Industry Press: Beijing, China, 2006. (In Chinese) [Google Scholar]
- Lo, T.; Tang, W.; Nadeem, A. Comparison of carbonation of lightweight concrete with normal weight concrete at similar strength levels. Constr. Build. Mater. 2008, 22, 1648–1655. [Google Scholar] [CrossRef]
- Song, H.-W.; Kwon, S.-J. Permeability characteristics of carbonated concrete considering capillary pore structure. Cem. Concr. Res. 2007, 37, 909–915. [Google Scholar] [CrossRef]
- Hyvert, N.; Sellier, A.; Duprat, F.; Rougeau, P.; Francisco, P. Dependency of C–S–H carbonation rate on CO2 pressure to explain transition from accelerated tests to natural carbonation. Cem. Concr. Res. 2010, 40, 1582–1589. [Google Scholar] [CrossRef]
- Niu, D.T. Durability and Life Forecast of Reinforced Concrete Structure; Science Press: Beijing, China, 2003. (In Chinese) [Google Scholar]
- Zhang, H.Y. The Experimentation Study of Concrete Carbonation Depth and Mathematics Model Founded. Master’s Thesis, Northwest Agriculture and Forestry University, Yangling, China, 2006. (In Chinese). [Google Scholar]
- Zhang, X.; Zhou, X.; Zhou, H.; Gao, K.; Wang, Z. Studies on forecasting of carbonation depth of slag high performance concrete considering gas permeability. Appl. Clay Sci. 2013, 79, 36–40. [Google Scholar] [CrossRef]
- Tu, Y.; Lu, Z. Experiment and research of presteressed concrete structure in carbonation corrosive environments. J. Southeast Univ. Nat. Sci. Ed. 2003, 33, 573–576. (In Chinese) [Google Scholar]


| Material | CaO | SiO2 | Al2O3 | MgO | SO3 | Fe2O3 | Ignition Loss |
|---|---|---|---|---|---|---|---|
| Content | 63.11 | 22.60 | 5.03 | 1.46 | 2.24 | 4.38 | 1.18 |
| Composition | SiO2 | Al2O3 | Fe2O3 | CaO | MgO | Na2O | Ignition Loss |
|---|---|---|---|---|---|---|---|
| Content | 53.26 | 34.72 | 4.07 | 2.47 | 0.39 | 1.90 | 4.07 |
| Particle Size/mm | Bulk Density/kg·m-3 | Apparent Density/kg·m-3 | Cylinder Compressive Strength/MPa | Thermal Conductivity/W·(m·K)−1 | Refractoriness/℃ | Volume Loss Rate of 1 MPa Pressure/% |
|---|---|---|---|---|---|---|
| 0.5~1.5 | 80~120 | 80~130 | ≥150 | 0.032~0.045 | 1280~1360 | 38~46 |
| Number | Cementing Material | Gravel | Fine Aggregate | Water | Water Reducer | Water Cement Ratio | ||
|---|---|---|---|---|---|---|---|---|
| Cement | Fly Ash | Sand | Glazed Hollow Bead | |||||
| NC | 421 | 47 | 856 | 856 | / | 177.84 | 4.68 | 1:0.38 |
| GHBC | 421 | 47 | 856 | 571 | 100 | 168.48 | 4.68 | 1:0.36 |
| Number | Workability | Compressive Strength/MPa | 28 d Apparent Density/kg·m−3 | 28 d Moisture Content/% | 28 d Thermal Conductivity/W·(m·K)−1 | ||
|---|---|---|---|---|---|---|---|
| Slump/mm | Slump Flow/mm | 3 d | 28 d | ||||
| NC | 175 | 350 | 15.61 | 36.80 | 2272 | 1.10 | 1.65 |
| GHBC | 200 | 410 | 8.12 | 26.13 | 2102 | 1.73 | 1.22 |
| Number | Before Carbonation Test | After Carbonation Test | ||||
|---|---|---|---|---|---|---|
| Total Pore Area/mL·g−1 | Average Pore Diameter/mm | Porosity/% | Total Pore Area/mL·g−1 | Average Pore Diameter/mm | Porosity/% | |
| NC | 17.80 | 15.10 | 14.36 | 10.83 | 13.10 | 13.53 |
| GHBC | 20.71 | 30.70 | 22.94 | 10.58 | 18.30 | 20.71 |
| Sample | Element Weight Ratio/% | ||||||
|---|---|---|---|---|---|---|---|
| C | O | Al | Si | S | Ca | Fe | |
| Before carbonation test of NC | 4.42 | 53.03 | 6.41 | 16.73 | 0.59 | 17.04 | 1.80 |
| After carbonation test of NC | 5.94 | 50.06 | 7.31 | 19.36 | 0.65 | 13.89 | 2.78 |
| Before carbonation test of GHBC | 4.97 | 47.65 | 5.89 | 11.17 | 1.00 | 27.56 | 1.77 |
| After carbonation test of GHBC | 5.31 | 47.73 | 4.63 | 11.48 | 2.38 | 26.75 | 1.75 |
| Sample | Chemical Components Weight Ratio/% | |||||||
|---|---|---|---|---|---|---|---|---|
| CaCO3 | Ca(OH)2 | 3CaO·SiO2 | 2CaO·SiO2 | C-S-H | SiO2 | CaSO4 | CaAl2Si2O8 | |
| Before carbonation test of NC | 18.50 | 0.40 | 55.50 | 0.25 | 0.13 | 8.90 | 0.56 | 15.9 |
| After carbonation test of NC | 56.00 | 1.55 | 3.70 | 0.70 | 0.24 | 19.00 | 3.90 | 15.40 |
| Before carbonation test of GHBC | 70.00 | / | 4.90 | 0.60 | 0.40 | 20.40 | 4.11 | / |
| After carbonation test of GHBC | 82.00 | / | 3.10 | 0.06 | 2.30 | 11.80 | 1.10 | / |
| Number | Fitting Formula | R2 |
|---|---|---|
| NC | 0.99 | |
| GHBC | 0.99 |
© 2019 by the authors. Licensee MDPI, Basel, Switzerland. This article is an open access article distributed under the terms and conditions of the Creative Commons Attribution (CC BY) license (http://creativecommons.org/licenses/by/4.0/).
Share and Cite
Huang, X.; Yao, W.; Pang, J. Carbonation Resistance Performance and Micro-Structure Analysis of Glazed Hollow Bead Insulation Concrete. Infrastructures 2019, 4, 63. https://doi.org/10.3390/infrastructures4040063
Huang X, Yao W, Pang J. Carbonation Resistance Performance and Micro-Structure Analysis of Glazed Hollow Bead Insulation Concrete. Infrastructures. 2019; 4(4):63. https://doi.org/10.3390/infrastructures4040063
Chicago/Turabian StyleHuang, Xin, Weijing Yao, and Jianyong Pang. 2019. "Carbonation Resistance Performance and Micro-Structure Analysis of Glazed Hollow Bead Insulation Concrete" Infrastructures 4, no. 4: 63. https://doi.org/10.3390/infrastructures4040063