Abstract
Transportation agencies are currently challenged to keep up with culvert infrastructure that is rapidly deteriorating due to lack of adequate maintenance and capital improvement. It is imperative for the transportation agencies to identify and rehabilitate deteriorated culverts prior to their failures. Among several concerns, lack of rational rehabilitation prioritization tools is foremost. Complicating this need further, current practices vary widely across the state departments of transportation (DOTs) which makes it difficult to develop a universal approach for prioritizing failing culverts. This paper presents and demonstrates a failure risk-based culvert prioritization approach that is compliant with the inspection procedures of the South Carolina DOT. The approach presented in this paper is specifically developed for reinforced concrete pipe (RCP) and corrugated metal pipe (CMP) materials because of their wide popularity. Outcomes from a survey of state DOTs informed the development of parametric weightings using the principles of analytical hierarchy process (AHP). Weightings developed for several critical inspection parameters are combined with the corresponding condition assessment scores to determine the failure criticality of culverts, which are subsequently combined with estimated failure consequences to determine failure risk estimates. The prioritization approach is demonstrated using the condition assessment scores of over 5200 culvert structures in South Carolina.
1. Introduction
Culvert structures are crucial transportation assets that facilitate the passage of natural water flow across roadways from beneath. Bridges and pavements often get higher priority than culverts in terms of maintenance and capital improvement resources of transportation agencies. This seeming disregard for culvert infrastructure is often attributed to its invisibility from the surface, unlike the very visible bridge and pavement issues. Many culverts in the U.S. have deteriorated beyond their useful service life [1] resulting in failures that expose motorists to a variety of safety hazards [2]. Based on the survey of several transportation agencies, a National Cooperative Highway Research Program (NCHRP) report states that corrosion, joint failure, deflection, and cracking were the major defects of interest in culvert health assessment [3].
Figure 1 depicts some of the most common defects observed in culverts. Figure 2 depicts a few consequences of culvert failures, which can range from being benign to catastrophic depending on the size, failure type, roadway type, and surrounding environment of the buried culvert. Furthermore, emergency repair costs and the resulting inconvenience due to traffic congestion and detours often tend to be prohibitively expensive, especially in high traffic zones. It is therefore imperative for transportation agencies to take cognizance of the state of their culvert infrastructure and pro-actively rehabilitate deteriorated critical culverts before their imminent failure. Unfortunately, many transportation agencies are too constrained by financial and human resources to be able to revamp the entire critical culvert infrastructure in a timely manner, and, therefore, it is important to prioritize and possibly rank the culvert structures in the decreasing order of their failure risk using a rational approach. One such failure risk-based prioritization approach, developed as part of a research study [4] sponsored by the South Carolina Department of Transportation (SCDOT), is presented in this paper. The risk-based prioritization approach is primarily developed for reinforced concrete pipe (RCP) and corrugated metal pipe (CMP) culverts, which are the two most popular culvert materials in use currently. The proposed prioritization approach is also demonstrated in this paper using the inspection data of more than 5200 culverts, available in the SCDOT’s culvert inventory database.
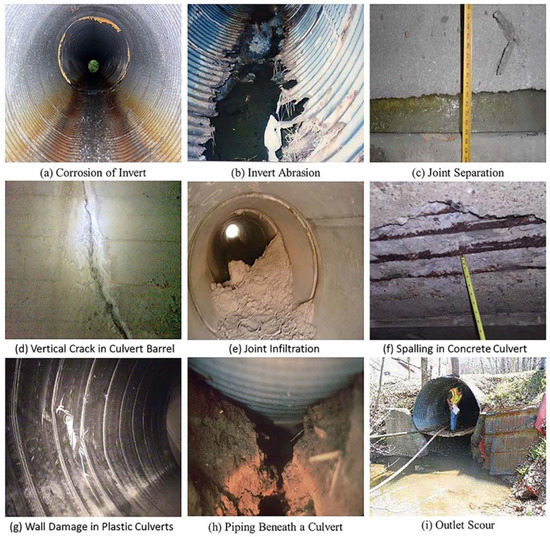
Figure 1.
Common defects observed in culverts.
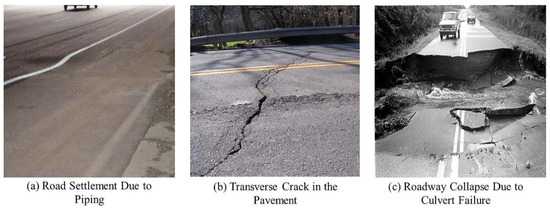
Figure 2.
Typical consequences of culvert defects and failures: (a) Road Settlement; (b) Transverse Pavement Crack; (c) Road Collapse.
2. Overview of the SCDOT’s Culvert Inspection Guidelines
The SCDOT is responsible for the systematic planning, construction, maintenance, and operation of the fourth largest (over 42,000 miles) state highway system in the U.S. Underneath those roads are tens of thousands of culverts that were installed over 50 years ago. A majority of the SCDOT’s culverts are made of reinforced concrete pipe (RCP), corrugated metal pipe (CMP), and high-density polyethylene (HDPE) materials. Traditionally, there has been less attention paid to culverts, especially to those that are less than 20 feet in span length, resulting in the lack of systematic inspection procedures.
The SCDOT had initiated a culvert inspection program in 2011 and launched an iPad application for easy and efficient collection of inventory and condition data in the field. A condition rating system was developed by the SCDOT to record culvert condition data. The condition inspection is primarily done by external non-intrusive human observations of a culvert’s inlet, outlet, and barrel using flashlights and binoculars. Several categories of possible concern for inlets, outlets, and barrels were identified as parameters that would be rated by field inspectors based on clearly defined objective guidelines. This program, currently in its initial phase, has focused on open-ended storm drainage structures 36” and greater in width (or diameter). The long-term goal of this program is to conduct frequent culvert inspections to identify and prioritize most critical culvert structures that need to be repaired prior to their potentially high-consequential failures. The SCDOT is currently in its initial phase of implementing the culvert inspection program by collecting the first round of inventory and condition data of large diameter culverts. Figure 3 shows a map of all culverts recorded in the latest of the SCDOT’s inventory database, categorized based on their material.
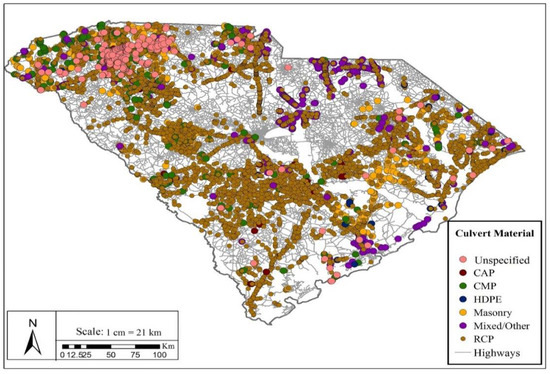
Figure 3.
A map of all the culverts recorded in the South Carolina Department of Transportation (SCDOT)’s inventory database (CAP—corrugated aluminum pipe; CMP—corrugated metal pipe; HDPE—high density polyethylene; RCP—reinforced concrete pipe).
The latest version of the SCDOT’s culvert inventory and assessment database was split into two sections, namely culvert inventory and culvert assessment. The culvert inventory included information that identified the physical properties of culverts such as culvert material, culvert shape and dimensions, number of barrels, latitude, and longitude. The culvert assessment section contained condition scores for various parameters of all the culverts that had been inspected to date, following the SCDOT (2011) guidelines. There are 8241 entries in the SCDOT culvert inventory and assessment database; several of these entries were, however, found to be incomplete. Despite a detailed description of the inspection procedures, the SCDOT (2011) culvert inspection manual does not provide guidance on how to prioritize culverts using the inspection rating information [5].
3. Previous Research
Rating scales are typically used to assess the condition of culverts based on several parameters. Descriptive rules are formulated for providing guidance to field inspectors in using such rating scales. There were several rating systems found in the literature that differed both in the parameters rated and the scales of rating. Some rating systems were proposed by researchers in the literature whereas others are currently being practiced by state departments of transportation (DOTs). Table 1 presents a comprehensive comparison of parameters proposed in the rating systems of five state Departments of Transportation (DOTs), Federal Highway Administration (FHWA) [6], and a technical research paper focusing on culvert structure.

Table 1.
Comparison of culvert parameters rated by different agencies.
Hunt et al. suggested rating 13 parameters, as shown in Table 1 [6], on a 4-point scale where “4” indicated “good” and “1” indicated “critical.” Najafi and Bhattachar proposed the use of a 5-point scale for the assessment and prediction of overall culvert condition [7]. They proposed a multi-level evaluation with level-1 focusing on the basic condition assessment (BCA), using the rating parameters as shown in Table 1 (roadway and waterway categories are not included in Table 1 due to space limitations and least relevance), and level-2 on advanced condition assessment (ACA). They used analytical hierarchy process (AHP) for developing weightings (i.e., relative importance) for each of the six parameters rated as part of the BCA in order to evaluate the overall risk for prioritizing culverts for repair actions. Only culverts that performed poorly in the BCA would be considered for further analysis using ACA. ACA uses a condition rating system for specific problems causing deterioration in concrete, metal, and plastic culverts.
Ohio DOT also developed a rating scheme for assessing the condition of their culvert structures. Masada et al. evaluated the inspection procedures for concrete culvert structures adopted by the Ohio DOT and subsequently presented a simplified risk assessment approach to assess the overall culvert health [8]. The risk assessment approach proposed by Masada et al. [8] is synonymous with the standard “failure probability multiplied with failure consequence” approach, wherein failure probability is accounted by the average rating for various inspection parameters, and failure consequence is substituted by a parameter that is dependent on the ratio of soil cover depth to culvert diameter. They also used a similar risk assessment approach to identify critical metal culverts managed by the Ohio Department of Transportation [9].
The SCDOT developed its own culvert inspection manual in 2011, which prescribes rating the culvert condition using 23 parameters—seven for “barrel” and eight each for “inlet” and “outlet,” on a 5-point scale [5]. As can be seen from Table 1, the number of unique parameters rated varied from 23 (Oregon DOT) to six [7].
Although several DOTs have their own rating systems, a majority of them lack appropriate tools for prioritizing culverts for repair using their respective rating systems. An exception is a study that used the Oregon DOT rating system to develop relative importance measures (i.e., weightings) of each of the 23 parameters in order to identify the most risky culverts [10]. A failure risk-based prioritization scheme based on the inspection criteria followed by the SCDOT is developed in this study using the principles of analytical hierarchy process (AHP). Numerous previous studies used the AHP approach for complex decision making applications in different disciplines. A few recent studies that used AHP or other multi-criteria decision making approaches in bridge and pipeline infrastructure management include [11,12,13,14].
4. Study Methodology
As discussed in the previous section, many DOTs inspect culvert structures using a variety of parameters. The challenge, however, is to appropriately combine the inspection scores for multiple parameters to produce a single condition score or criticality measure for prioritization related decision making. There is not much data available on the relative importance of these multiple inspection parameters (such as invert deterioration, bedding voids, joint misalignment, etc.).
The proposed risk-based prioritization model was developed in three steps. Step one entailed developing weightings (which indicate relative importance) of the barrel related condition assessment parameters identified in the SCDOT culvert inspection manual. Weightings were developed using AHP, a method that has been extensively used in scientific literature for decision making through estimating the relative importance of several criteria (or assessment parameters) using pair-wise comparison based on expert opinions [15]. AHP is a powerful expert perception-driven methodology for use in complex decision-making problems where quantitative data is scarcely available. Several previous studies employed AHP for complex decision-making problems. Najafi et al. [16] and [7] used AHP methodology for assessing culvert deterioration and for establishing a rational short and long-term rehabilitation planning approach. Similarly, Al-Barqawi et al. [17] employed AHP for water infrastructure related decision making through assessment of the pipeline conditions.
A survey was sent out to state DOTs as part of this study to seek expert opinions on the relative pair-wise comparison of the seven “barrel” parameters used in evaluating the overall culvert barrel condition. The survey identified specific structural defects for each of reinforced concrete pipe (RCP) and corrugated metal pipe (CMP) culverts that may eventually lead to the failure of their respective barrels. Figure 4 shows an exclusive map of RCP and CMP culverts recorded in the latest SCDOT’s culvert inventory database. All the structural barrel defects in the SCDOT’s assessment database are mapped with the defects included in the survey, as shown in Table 2 and Table 3 for RCP and CMP culverts, respectively. Non-structural defects such as blocking and sediments, which were included in the SCDOT’s culvert assessment manual and inventory database, were excluded in this study, as they do not directly contribute to barrel structural failures.

Figure 4.
A map showing all the RCP and CMP culverts recorded in the SCDOT’s inventory database.
Table 2.
Defect mapping for RCP culverts.
Table 3.
Defect mapping for CMP culverts.
The following is an example survey question for a pair of defects: “How concerning is defect #1 compared to defect #2 with respect to culvert barrel health while determining the need for its rehabilitation/replacement? The defects are defined in Table 4. Consider the defect severities to be of the threshold levels stated in Table 5”. The respondent was requested to choose one of the following seven options as an answer for each question that compared one pair of defects: (1) Significantly less concerning; (2) Less concerning; (3) Somewhat less concerning; (4) Equally concerning; (5) Somewhat more concerning; (6) More concerning; and (7) Significantly more concerning. The qualitative inputs of the participants were translated into quantitative comparisons using the scale presented in Table 6. Based on such pair-wise comparisons of several combinations of rating parameters, weightings for all the barrel inspection parameters were estimated using AHP analysis [10,15]. The participant’s opinion on the relative criticality of various defects was separately solicited for RCP and CMP culverts, thereby resulting in different sets of parametric weightings.
Table 4.
Definitions of defects commonly observed on culvert barrels.
Table 5.
Threshold defect severities.
Table 6.
Quantitative conversion scale used for the culvert failure risk assessment survey.
All the received responses were thoroughly scrutinized for completeness, as partially answered surveys would not be useful with the AHP methodology. It was determined that responses received from only eight states were complete enough to be useful. Specifically, completed responses were received from transportation agencies in the states of Arkansas, Indiana, Ohio, Iowa, Maine, Virginia, Utah, and South Dakota. Incomplete responses were either partially filled out surveys or mere comments on the survey. The response rate was found to be low, possibly because of the perceptive nature of the questions. It should, however, be recognized that the respondents include those transportation agencies that have invested in developing effective culvert management practices and have also sponsored or participated in culvert management studies in the past. Therefore, their responses were deemed valuable. Furthermore, given that the survey was distributed through the DOTs’ AASHTO_RAC listserv, it was assumed that the respondents were experienced professionals with considerable knowledge on culvert infrastructure issues.
The average of quantitative pair-wise comparison scores for each pair of defects was calculated based on the survey responses. Priority vectors were subsequently calculated to determine the relative criticality (or weighting) of each defect type based on the procedures of the Analytical Hierarchy Process (AHP) [15]. The average pair-wise comparisons and the resulting weightings—which are essentially the Eigen vectors derived from the pair-wise comparison matrices—are presented in Table 7 and Table 8 for RCP and CMP culvert materials, respectively. Although the eigenvalue method (EM) has been popularly used, other methods, such as the logarithm least square method (LLSM) and the least square method (LSM), were also proposed to obtain the priority vector in the literature [18]; EM-based approach was, however, proved to be logically justified for usage in AHP [18]. These weightings signify the relative influence of the various inspection parameters on the overall condition of a culvert barrel. Two defects from the survey, namely, “Joint misalignment” and “shape deformation,” are combined to match the “Alignment” defect specified in the SCDOT’s culvert inventory database for the purpose of consistency.
Table 7.
Average pairwise comparisons and the Eigen vector for RCP culvert parameters.
Table 8.
Average pairwise comparisons and the Eigen vector for CMP culvert parameters.
In step two, the parameter weightings were multiplied with their respective numerical ratings for each culvert structure to calculate the overall criticality (Ci) of a culvert, as shown in Equation (1). The overall criticality is a normalized metric that will range between zero and one. It should be noted that the set of weightings for all the parameters would be unique for different culvert materials because culverts made of different materials fail in different ways.
where Ci is the overall criticality score of culvert I; RBj,i is the numerical rating (between 1 and 5) given to culvert i for a barrel inspection parameter j as prescribed by the SCDOT culvert inspection manual [5]; and WBj is the weighting of barrel parameter j derived from the survey outcomes (also presented in Table 7 and Table 8).
In step three, a risk metric was developed by multiplying “one minus the overall criticality (Ci)” with an estimated culvert failure consequence (Fi), as shown in Equation (2). Failure consequences of culverts lying under small (or low-traffic) roads may not be as significant as of those buried under heavy-traffic corridors. Failure consequences are therefore assumed proportional to the type of road under which a culvert is buried. This information was obtained from the culvert inventory database which has a “Route” entry for each culvert classified into interstates (denoted by “I”), primaries (denoted by “US” or “SC”), and secondary (denoted by “S”). Figure 5a,b present the distribution of RCP and CMP culverts, respectively, measured by length based on the type of “Route” they are buried under. The consequence scores (Fi) identified in Table 9 for each route type are used in this study.
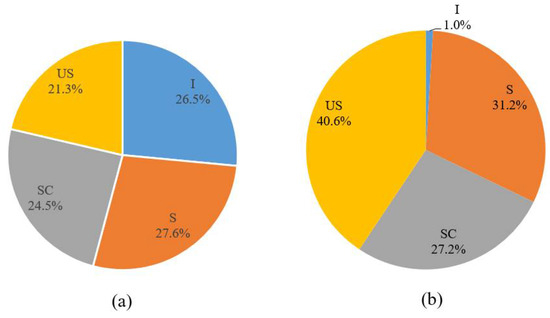
Figure 5.
Route type distribution for: (a) RCP culverts and (b) CMP culverts measured by length.
Table 9.
Failure consequence scores.
Culverts were ranked based on the risk measures to prioritize the most critical culverts that will need to be further inspected or scheduled for repair. It should be noted here that only barrel defects were considered in the failure risk analysis in the current study and that the inlet and outlet defects were not.
5. Demonstration and Results
The SCDOT culvert inventory and assessment database at the time of this study comprised of assessments for all the culverts inspected in the first phase of a recently launched inspection campaign. Five thousand entries for RCP culverts adding up to a length of 90.8 miles and about 225 entries for CMP culverts adding up to a length of 4.4 miles are found in that database, with each entry having a unique “Culvert ID”. Several culvert structures that the SCDOT manages are yet to be inspected and the entries found in the database are by no means representative of the share of CMP and RCP culverts the SCDOT manages. The overall criticality scores (Ci) were estimated using Equation (1) based on the condition ratings (RBj,i) of the inspected culverts and the defect criticality weightings (WBj). Subsequently, failure risk (Ri) estimates were calculated for each culvert using Equation (2) based on the overall criticality scores (Ci) and failure consequence scores (Fi). The failure risk values also ranged between zero and one.
Based on the assessment scores available in the SCDOT’s culvert inventory database, about 61.3% of RCP culverts (≈55.1 miles) were determined to be at no risk. Furthermore, Figure 6 shows the distribution of RCP culverts found to be at some risk (i.e., Ri > 0) as measured by length. Only about 4% (≈1.42 miles) of RCP culverts were found to be at some risk, having risk estimates in the range of 0.3 to 1, and all such RCP culverts are identified in Figure 7. It should be noted that the culvert inventory database of the SCDOT contained assessment scores of zero for a few RCP culverts, which were deemed incorrect entries and consequently excluded from the analysis.
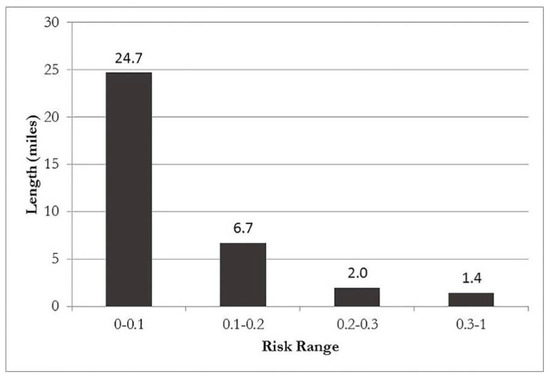
Figure 6.
Failure risk analysis of RCP culverts: risk vs. length.
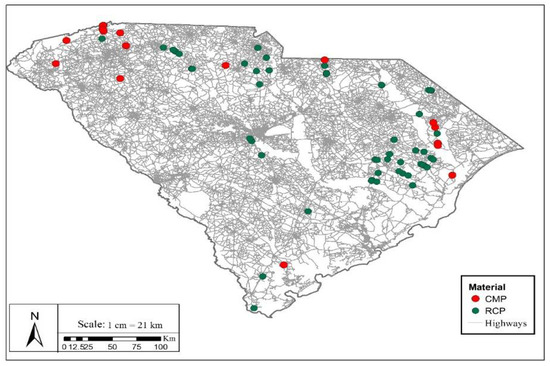
Figure 7.
A map showing the at-risk RCP and CMP culverts from the inventoried database.
On the other hand, about 61% of CMP culverts were found to be at some risk, with 47.8% (≈2 miles) having failure risk estimates ranging between 0 and 0.1 and the remaining 13% (≈0.4 miles) with failure risk estimates ranging between 0.1 and 1. The remaining 39% of CMP culverts (≈1.7 miles) were determined to be at no risk as per their risk estimates. Figure 8 shows a distribution of CMP culverts measured by length based on their failure risk estimates, and all the CMP culverts at risk are identified in Figure 7.
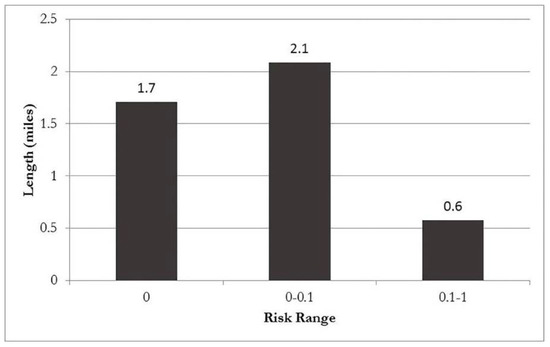
Figure 8.
Failure risk analysis of CMP culverts: risk vs. length.
Critical RCP and CMP culverts with greatest failure risk estimates were identified for further inspection and possible rehabilitation or renewal depending on the estimated remaining life and budgetary constraints. The assessment scores available in the SCDOT’s culvert inventory database, along with the derived defect weightings, form the basis for the calculated failure risk estimates. Estimated failure consequences of culverts are broadly assumed to be correlated to the type of route they are buried under. The proposed risk-based prioritization methodology can serve the SCDOT and other transportation agencies as a preliminary tool in identifying a few critical culverts for in-depth condition assessment investigations. One advantage of the proposed model is the flexibility it offers in adjusting the defect weightings and failure consequence estimates as and when needed by any transportation agencies depending on their specific preferences.
One major study limitation that should be addressed in the future includes the need for a comprehensive engagement of more transportation agencies in developing defect weightings in order to formulate a more universal risk assessment methodology; this may not be easy due to the varied practices across several DOTs in evaluating culvert structures. Other study limitations include: (a) the assumption that the defect severities as identified in the survey are representative of the various defects and their relative influence on the overall barrel condition; (b) the exclusion of inlet and outlet structures from the culvert risk assessment; and (c) the inherent uncertainty or lack of consistency with which culvert assessments were carried out, especially when multiple inspectors were involved in the process.
6. Conclusions
This paper presented and demonstrated a failure risk-based prioritization method for identifying critical culvert structures that need further inspection and possible rehabilitation. The failure risk assessment method was developed based on the analytical hierarchy process (AHP) using the defect weightings developed from the outcomes of a nation-wide survey of transportation agencies carried out as part of a research study (Piratla and Pang, 2017) sponsored by the South Carolina Department of Transportation. The condition assessment scores for various barrel defects were combined with their respective weightings to determine the failure risk estimates. RCP and CMP culverts with highest failure risk were identified from the group of culverts that were inspected by the SCDOT inspectors in their first phase of a multi-year inspection campaign. The contributions of this study are the developed weightings for various culvert inspection parameters and the developed failure risk-based prioritization model for managing deteriorating culvert infrastructure. The prioritization approach presented in this study is flexible and allows for easy modification of defect weightings and failure consequence estimates if deemed necessary.
Author Contributions
Conceptualization, K.R.P.; formal analysis, H.J.; funding acquisition, K.R.P.; methodology, K.R.P. and H.J.; visualization, H.J. and S.Y.; writing—original draft, K.R.P.
Funding
This research was supported by the South Carolina Department of Transportation (SCDOT) under Grant SPR718. The views and conclusions contained in this document are those of the authors alone and should not be interpreted as necessarily representing the official policies, either expressed or implied, of the SCDOT. The support of the SCDOT in general and that of the project steering committee in particular is greatly appreciated.
Conflicts of Interest
The authors declare no conflict of interest. The funders had no role in the design of the study, in the collection, analyses, or interpretation of data; in the writing of the manuscript, or in the decision to publish the results.
References
- Yang, C.; Allouche, E. Evaluation of non-destructive methods for condition assessment of culverts and their embedment. In Proceedings of the ICPTT 2009: Advances and Experiences with Pipelines and Trenchless Technology for Water, Sewer, Gas, and Oil Applications, Shanghai, China, 18–21 October 2009; pp. 28–38. [Google Scholar]
- Perrin, J., Jr.; Jhaveri, C.S.; Perrin, J., Jr. The economic costs of culvert failures. In Proceedings of the TRB 2004 Annual Meeting, Washington, DC, USA, 11–15 January 2004. [Google Scholar]
- National Cooperative Highway Research Program (NCHRP). Assessment and Rehabilitation of Existing Culverts Rep. No. 303; Transportation Research Board, National Research Council: Washington, DC, USA, 2002. [Google Scholar]
- Piratla, K.R.; Pang, W.; Jin, H.; Stoner, M. Best Practices for Assessing Culvert Health and Determining Appropriate Rehabilitation Methods; No. FHWA-SC-17-01; FHWA: Washington, DC, USA, 2017.
- SCDOT. Pipe & Culvert Inventory and Assessment Guidelines; SCDOT: Columbia, SC, USA, 2011.
- Hunt, J.H.; Zerges, S.M.; Roberts, B.C.; Bergendahl, B. Culvert Assessment and Decision—Making Procedures Manual for Federal Lands Highway; No. FHWA-CFL/TD-10-005; FHWA: Washington, DC, USA, 2010.
- Najafi, M.; Bhattachar, D.V. Development of a culvert inventory and inspection framework for asset management of road structures. J. King Saud Univ. Sci. 2011, 23, 243–254. [Google Scholar] [CrossRef]
- Masada, T.; Sargand, S.; Tarawneh, B.; Mitchell, G.; Gruver, D. New inspection and risk assessment methods for metal highway culverts in Ohio. Transp. Res. Rec. J. Transp. Res. Board 2006, 1976, 141–148. [Google Scholar] [CrossRef]
- Masada, T.; Sargand, S.M.; Tarawneh, B.; Mitchell, G.F.; Gruver, D. Inspection and risk assessment of concrete culverts under Ohio’s highways. J. Perform. Constr. Facil. 2007, 21, 225–233. [Google Scholar] [CrossRef]
- Yang, C. Predicting Deterioration Rate of Culvert Structures Utilizing a Markov Model. Ph.D. Thesis, Louisiana Tech University, Ruston, LA, USA, 2011. [Google Scholar]
- Contreras-Nieto, C.; Shan, Y.; Lewis, P.; Hartell, J.A. Bridge maintenance prioritization using analytic hierarchy process and fusion tables. Autom. Constr. 2019, 101, 99–110. [Google Scholar] [CrossRef]
- Chang, J.T.; Hsiao, H.C. Analytic Hierarchy Process for Evaluation Weights on Occupational Safety and Hygiene Items in the Bridge Construction Site. In IOP Conference Series: Earth and Environmental Science; IOP Publishing: Bristol, UK, 2019; Volume 233, p. 032031. [Google Scholar]
- Taheri Amiri, M.J.; Abdollahzadeh, G.; Haghighi, F.R.; Neves, J.M. Bridges Risk Analysis in View of Repair and Maintenance by Multi Criteria Decision Making Method (Case Study: Babolsar Bridges). Int. J. Transp. Eng. 2019, 7, 91–114. [Google Scholar]
- Vladeanu, G.J.; Matthews, J.C. Consequence-of-failure model for risk-based asset management of wastewater pipes using AHP. J. Pipeline Syst. Eng. Pract. 2019, 10, 04019005. [Google Scholar] [CrossRef]
- Saaty, R.W. The analytic hierarchy process—What it is and how it is used. Math. Model. 1987, 9, 161–176. [Google Scholar] [CrossRef]
- Najafi, M.; Salem, S.; Bhattachar, D.; Selman, B.; Patil, R.; Calderon, D. An Asset Management Approach for Drainage Infrastructure and Culverts (No. MRUTC 06-08); Midwest Regional University Transportation Center, University of Wisconsin: Madison, WI, USA, 2008. [Google Scholar]
- Al-Barqawi, H.; Zayed, T. Infrastructure management: Integrated AHP/ANN model to evaluate municipal water mains’ performance. J. Infrastruct. Syst. 2008, 14, 305–318. [Google Scholar] [CrossRef]
- Sekitani, K.; Yamaki, N. A logical interpretation for the eigenvalue method in AHP. J. Oper. Res. Soc. Jpn. 1999, 42, 219–232. [Google Scholar] [CrossRef]
© 2019 by the authors. Licensee MDPI, Basel, Switzerland. This article is an open access article distributed under the terms and conditions of the Creative Commons Attribution (CC BY) license (http://creativecommons.org/licenses/by/4.0/).