Article

On the Theoretical CO2 Sequestration Potential of Pervious Concrete

1
Department of Chemical and Biological Engineering, University of Colorado Boulder, Boulder, CO 80309, USA
2
Department of Civil, Environmental, and Architectural Engineering, University of Colorado Boulder, Boulder, CO 80309, USA
3
Materials Science and Engineering Program, University of Colorado Boulder, Boulder, CO 80309, USA
*
Author to whom correspondence should be addressed.
Infrastructures 2019, 4(1), 12; https://doi.org/10.3390/infrastructures4010012
Submission received: 17 January 2019 / Revised: 8 March 2019 / Accepted: 8 March 2019 / Published: 16 March 2019
(This article belongs to the Special Issue Durability and Sustainability of Concrete Mixtures)

Abstract

:
Pervious concrete, which has recently found new applications in buildings, is both energy- and carbon-intensive to manufacture. However, similar to normal concrete, some of the initial CO2 emissions associated with pervious concrete can be sequestered through a process known as carbonation. In this work, the theoretical formulation and application of a mathematical model for estimating the carbon dioxide (CO2) sequestration potential of pervious concrete is presented. Using principles of cement and carbonation chemistry, the model related mixture proportions of pervious concretes to their theoretical in situ CO2 sequestration potential. The model was subsequently employed in a screening life cycle assessment (LCA) to quantify the percentage of recoverable CO2 emissions—namely, the ratio of in situ sequesterable CO2 to initial cradle-to-gate CO2 emissions—for common pervious concrete mixtures. Results suggest that natural carbonation can recover up to 12% of initial CO2 emissions and that CO2 sequestration potential is maximized for pervious concrete mixtures with (i) lower water-to-cement ratios, (ii) higher compressive strengths, (iii) lower porosities, and (iv) lower hydraulic conductivities. However, LCA results elucidate that mixtures with maximum CO2 sequestration potential (i.e., mixtures with high cement contents and CO2 recoverability) emit more CO2 from a net-emissions perspective, despite their enhanced in situ CO2 sequestration potential.

Graphical Abstract

1. Introduction

Utilization of pervious concrete has increased in recent years in applications specific to both vertical (i.e., building) and horizontal (i.e., transportation) infrastructure [1,2,3]. Over the past decade, pervious concrete has been applied in buildings as non-structural components, such as sound barriers, insulation panels, and living walls—applications that take advantage of its favorable acoustic, thermal, and hydraulic conductivity properties. In more conventional horizontal pavement applications, the use of pervious concrete has been shown to reduce the quantity and improve the quality of stormwater runoff [4,5,6] in urban environments.
Pervious concrete consists of coarse aggregate, ordinary portland cement (OPC), and water, while water-reducing admixtures are commonly added to ensure proper workability and other fresh- and hardened-state characteristics [4]. The absence of fine aggregate in pervious concrete yields a porous structure, enabling water and air to permeate through the material. In pavement applications, infiltration of water through the surface significantly reduces stormwater runoff volume, which lowers the potential to pollute water supplies, mitigates downstream erosion caused by flooding, and may improve road safety by reducing the risk of hydroplaning [4,7,8,9]. These benefits have led green building rating systems, such as the United States Green Building Council’s Leadership in Energy and Environmental Design (LEED) building certification program, to promote the use of pervious concrete as a low-impact site development strategy.
Important material properties of pervious concrete (i.e., compressive strength, porosity, hydraulic conductivity) are governed primarily by the size of the coarse aggregate and the thickness of the cement paste that binds them together [4,10,11,12]. In general, paste thickness increases with cement content, which results in decreased porosity and hydraulic conductivity but improved compressive strength [10]. Contrastingly, pore sizes, on average, increase with the size of coarse aggregate [4,11], resulting in increased pore connectivity and hydraulic conductivity but decreased compressive strength [11,12,13].

1.1. CO2 Emissions and CO2 Sequestration

The manufacture, use, and disposal of OPC, a primary constituent of pervious concrete, has significant environmental impacts. While the production of OPC currently accounts for ≈ 5% of global carbon dioxide (CO2) emissions [14,15], previous research has shown that the natural carbonation process of cementitious materials can sequester—and, thus, recover—non-trivial quantities of CO2 both during and after their in-service lifetime [16,17,18].
Simple predictive models enable quantification of the CO2 sequestration potential of cementitious materials, allowing the positive effects of carbonation to be included in life cycle assessments (LCAs). LCA is a tool used by architects and engineers to better understand the environmental impacts of building products and manufacturing processes. Similar mathematical models have been used to analyze normal OPC concrete with results indicating that a significant percentage of initial CO2 emitted during OPC production is permanently sequestered by the concrete after placement [19,20,21,22]. For example, Yang et al. [19] estimated that up to 17% of CO2 emissions from concrete production could be recovered via sequestration over a 100-year period, given a 40-year service life and 60-year recycling strategy. García-Segura et al. [20] approximated that up to 47% of total CO2 emissions are recaptured through sequestration if concrete is demolished, crushed, and recycled. Previously developed models apply only to regular OPC concrete mixtures or OPC concrete mixtures with supplementary cementitious material (SCM) additives [17,20,23,24,25,26]. To date, however, to the authors’ knowledge, no studies have formulated a similar model for the carbonation potential of pervious concrete.

1.2. Scope of Work

The primary objective of this work was to formulate and implement a theoretical model for quantifying the maximum CO2 sequestration potential of OPC pervious concrete mixtures. The model developed herein is based on stoichiometric proportions of hydration and carbonation chemical reactions that occur in OPC, as well as conventional proportions of pervious concrete mixtures. A broad range of pervious concrete mixtures was theoretically designed (but not fabricated) to investigate their CO2 sequestration potential. Individual design aspects, such as water-to-cement (w/c) ratio, aggregate size, and design porosity, were explicitly investigated to elucidate their impact on CO2 sequestration potential. The model was applied to these concrete mix designs and implemented in a screening LCA to estimate the percentage of initial cradle-to-gate CO2 emissions that are recoverable by in situ CO2 sequestration.

2. Computational Methods

2.1. Theoretical Formulation

To determine total sequesterable CO2 for a representative volume of pervious concrete, first, the type of cement and the amount of reactive calcium hydroxide (CH) (i.e., portlandite) in the mixture were mathematically linked to the theoretical type and amount of cement hydration reaction products, including CH. Total sequesterable CO2 per mass of carbonated pervious concrete was then calculated using stoichiometric relationships of the carbonation reaction. Given that the appropriate depth of pervious concrete varies widely for different applications, a declared volumetric unit of 1 m3 was selected to simplify bulk CO2 sequestration calculations. The total volume of carbonated cement paste in pervious concrete was estimated using the cement content and theoretical porosity of each pervious concrete mixture. Quantification of the total sequesterable CO2 through carbonation of cement paste in pervious concrete relies on the assumption that all of the cement in each pervious concrete mixture carbonates within the lifetime of the concrete. This assumption is further discussed and justified in Section 2.1.5.

2.1.1. Chemical and Mineral Composition of OPC

Given that Type I cement is the most widely specified cement for pervious concrete applications, only Type I cement pervious concrete mixtures are considered. Table 1 summarizes the average chemical composition and mineral content for the Type I classification of OPC as specified by the American Society of Testing and Materials (ASTM) C150 Standard [27]. In oxide notation, the primary oxides present in OPC include silicon dioxide (S), aluminum oxide (A), ferric oxide (F), calcium oxide (C), magnesium oxide (M), sulfur trioxide (Š), and sodium oxide (N), which comprise four main cement minerals, including tricalcium silicate (C3S), dicalcium silicate (C2S), tricalcium aluminate (C3A), and tetracalcium aluminoferrite (C4AF).

2.1.2. Cement Hydration Reactions

According to Mehta 1986 [28], the primary hydration reactions of tricalcium silicate (C3S) and dicalcium silicate (C2S) with water (H) produce both a calcium silicate hydrate (C3S2H8) phase and CH as follows:
2 C 3 S + 11 H C 3 S 2 H 8 + 3 C H
2 C 2 S + 9 H C 3 S 2 H 8 + C H
The primary hydration reactions of other cement minerals, namely tricalcium aluminate (C3A) and tetracalcium aluminoferrite (C4AF) yields:
C 3 A + 3 C Š H 2 + 26 H C 6 A Š 3 H 32
C 4 A F + 2 C H + 14 H C 6 ( A , F ) H 13 + ( F , A ) H 3
where, in cement chemistry notation, CŠH2 is gypsum, C63H32 is ettringite, C6(A,F)H13 is calcium aluminoferrite hydrate, and (F,A)H3 is aluminoferrite hydrate.

2.1.3. Carbonation Reaction

Previous models used to quantify CO2 sequestration potential of concrete conservatively assume that CO2 is sequestered by CH alone, while others incorporate the carbonation of both CH and other calcium-bearing phases [19,20,25,26,28,29]. Given the existence of dissolved CH in pore solution, in situ diffusion of CO2 through the concrete matrix can initiate CH carbonation and subsequent precipitation of solid calcium carbonate (CaCO3):
C H + C ¯ C C ¯ + H
where, in cement chemistry notation, CH is Ca ( OH ) 2   (calcium hydroxide), C ¯ is CO 2 , C C ¯ is CaCO 3 , and H is H 2 O (water).
The assumption that only available CH reacts via carbonation results in a conservative model prediction of sequestered CO2 since the model does not account for the potential carbonation of other calcium-bearing phases (i.e., calcium silicate hydrate, or CSH). Previous studies have indicated that CSH formed in the hydration of cement paste might additionally sequester non-trivial quantities of CO2 [17]. The kinetics and stoichiometry of the carbonation of CSH are not well defined, and, thus, the CO2 sequestration potential of CSH in carbonated cement pastes cannot yet be readily and reliably predicted. Therefore, by assuming that only available CH participates in CO2 sequestration, the model prediction likely underestimates the actual CO2 sequestration potential of pervious concrete, a conservative prediction for the analysis conducted in this work.

2.1.4. CO2 Sequestration Potential of Cement Paste

Utilizing stoichiometric ratios of cement hydration and carbonation reactions, along with the Type I cement mineral composition, the theoretical mass of sequesterable CO2 in the hydrated cement paste on a per mass basis can be computed as follows:
C m = Φ h M W C H ( 3 2 · B C 3 S M W C 3 S + 1 2 · B C 2 S M W C 2 S 2 1 · B C 4 A F M W C 4 A F ) ( M W C O 2 M W C H )
where C m is the CO2 sequestration potential (kg CO 2 /kg cement), and Φ h is the degree of hydration of the cement minerals. B and M W represent the Bogue composition and molecular weight of the cement minerals, respectively. For the purposes of this model, the degree of hydration of the cement minerals was assumed to be 100% ( Φ h = 1.0 ) to calculate the theoretical maximum of sequesterable CO2 through carbonation of available CH. The stoichiometric ratios of CH produced or consumed in the hydration reactions, from Equations (1), (2) and (4), correlate to the multiplier for each mineral’s contribution to CO2 sequestration. Based upon full hydration of CH, Type I cement, Cm = 0.16. The conservative assumption that only CH carbonates (neglecting CSH carbonation) is in contrast to the hydration reaction being assumed to reach 100% completion. The proposed model allows for the flexibility to include other degrees of hydration and can be computed using Equation (6).

2.1.5. Carbonation Depth

The bulk porosity characteristics of pervious concrete are achieved as a result of a thin layer of cement paste that surrounds individual course aggregate particles and binds them together. The porosity of pervious concrete decreases with increases in average paste thickness. The void spaces in pervious concrete allow air to diffuse through the concrete unhindered. As a result, carbonation not only proceeds from external surfaces inward but also occurs in internal pores [3]. As such, it is assumed that the cement paste layer fully carbonates in service due to (i) the immediate diffusion of air containing CO2 and (ii) the small average cement paste thicknesses observed in pervious concrete mixtures [10]. This assumption enables calculation of a theoretical upper bound on the CO2 sequestration potential of each pervious concrete mixture. Carbonation in the thin cement paste layers has been previously studied [17], but no mathematical models for predicting carbonation kinetics have been developed. Further, it has been demonstrated that carbonation in pervious concrete mixtures proceeds quickly in indoor environments where CO2 concentrations are elevated in relation to the outdoors [3]. Carbonation degrees of 20–40% were observed in pervious concrete mixtures that were exposed to indoor environmental conditions for 2 months [3]. The typical service life of pervious concrete pavements has been conservatively estimated in the range of 7.5 to 14 years [30]. Thus, we assumed here that 100% carbonation is achievable in the typical lifetime of pervious concrete.

2.1.6. Total Carbonated Volume

To quantify the total carbonated volume, V c , of the solid fraction of pervious concrete, its bulk porosity, φ , must be accounted for in the calculation. The total solid fraction of fully carbonated pervious concrete can be calculated according to:
V c = V · ( 1 φ )
where V is the bulk volume of the pervious concrete element.

2.1.7. Total Mass of Sequestered CO2

Total sequesterable CO2 ( C s ) of pervious concrete can be calculated as the product of the total mass of carbonated cement paste and the CO2 sequestration potential ( C m ) :
C s = Φ c · C m · [ V c · m ]
The total mass of carbonated cement paste is calculated as the term in brackets, where m is the total mass of cement per unit volume of concrete as specified in the mixture proportions. The value of m does not account for the final porosity of the pervious mixture and cannot be used to determine carbonation potential directly. Φ c is defined as the degree of carbonation, which was assumed to be 100% ( Φ c = 1 ) for the purposes of this study. The use of lower degrees of carbonation will result in proportionally lower predictions of CO2 sequestration potential. Actual degrees of carbonation experimentally obtained in normal (non-pervious) concretes vary between 0.4 and 0.7 [30,31,32,33,34,35]. One previous study measured degrees of carbonation from 0.2 to 0.4 in pervious concrete samples exposed to indoor conditions after 60 days [3].

2.2. Carbonation Model Implementation

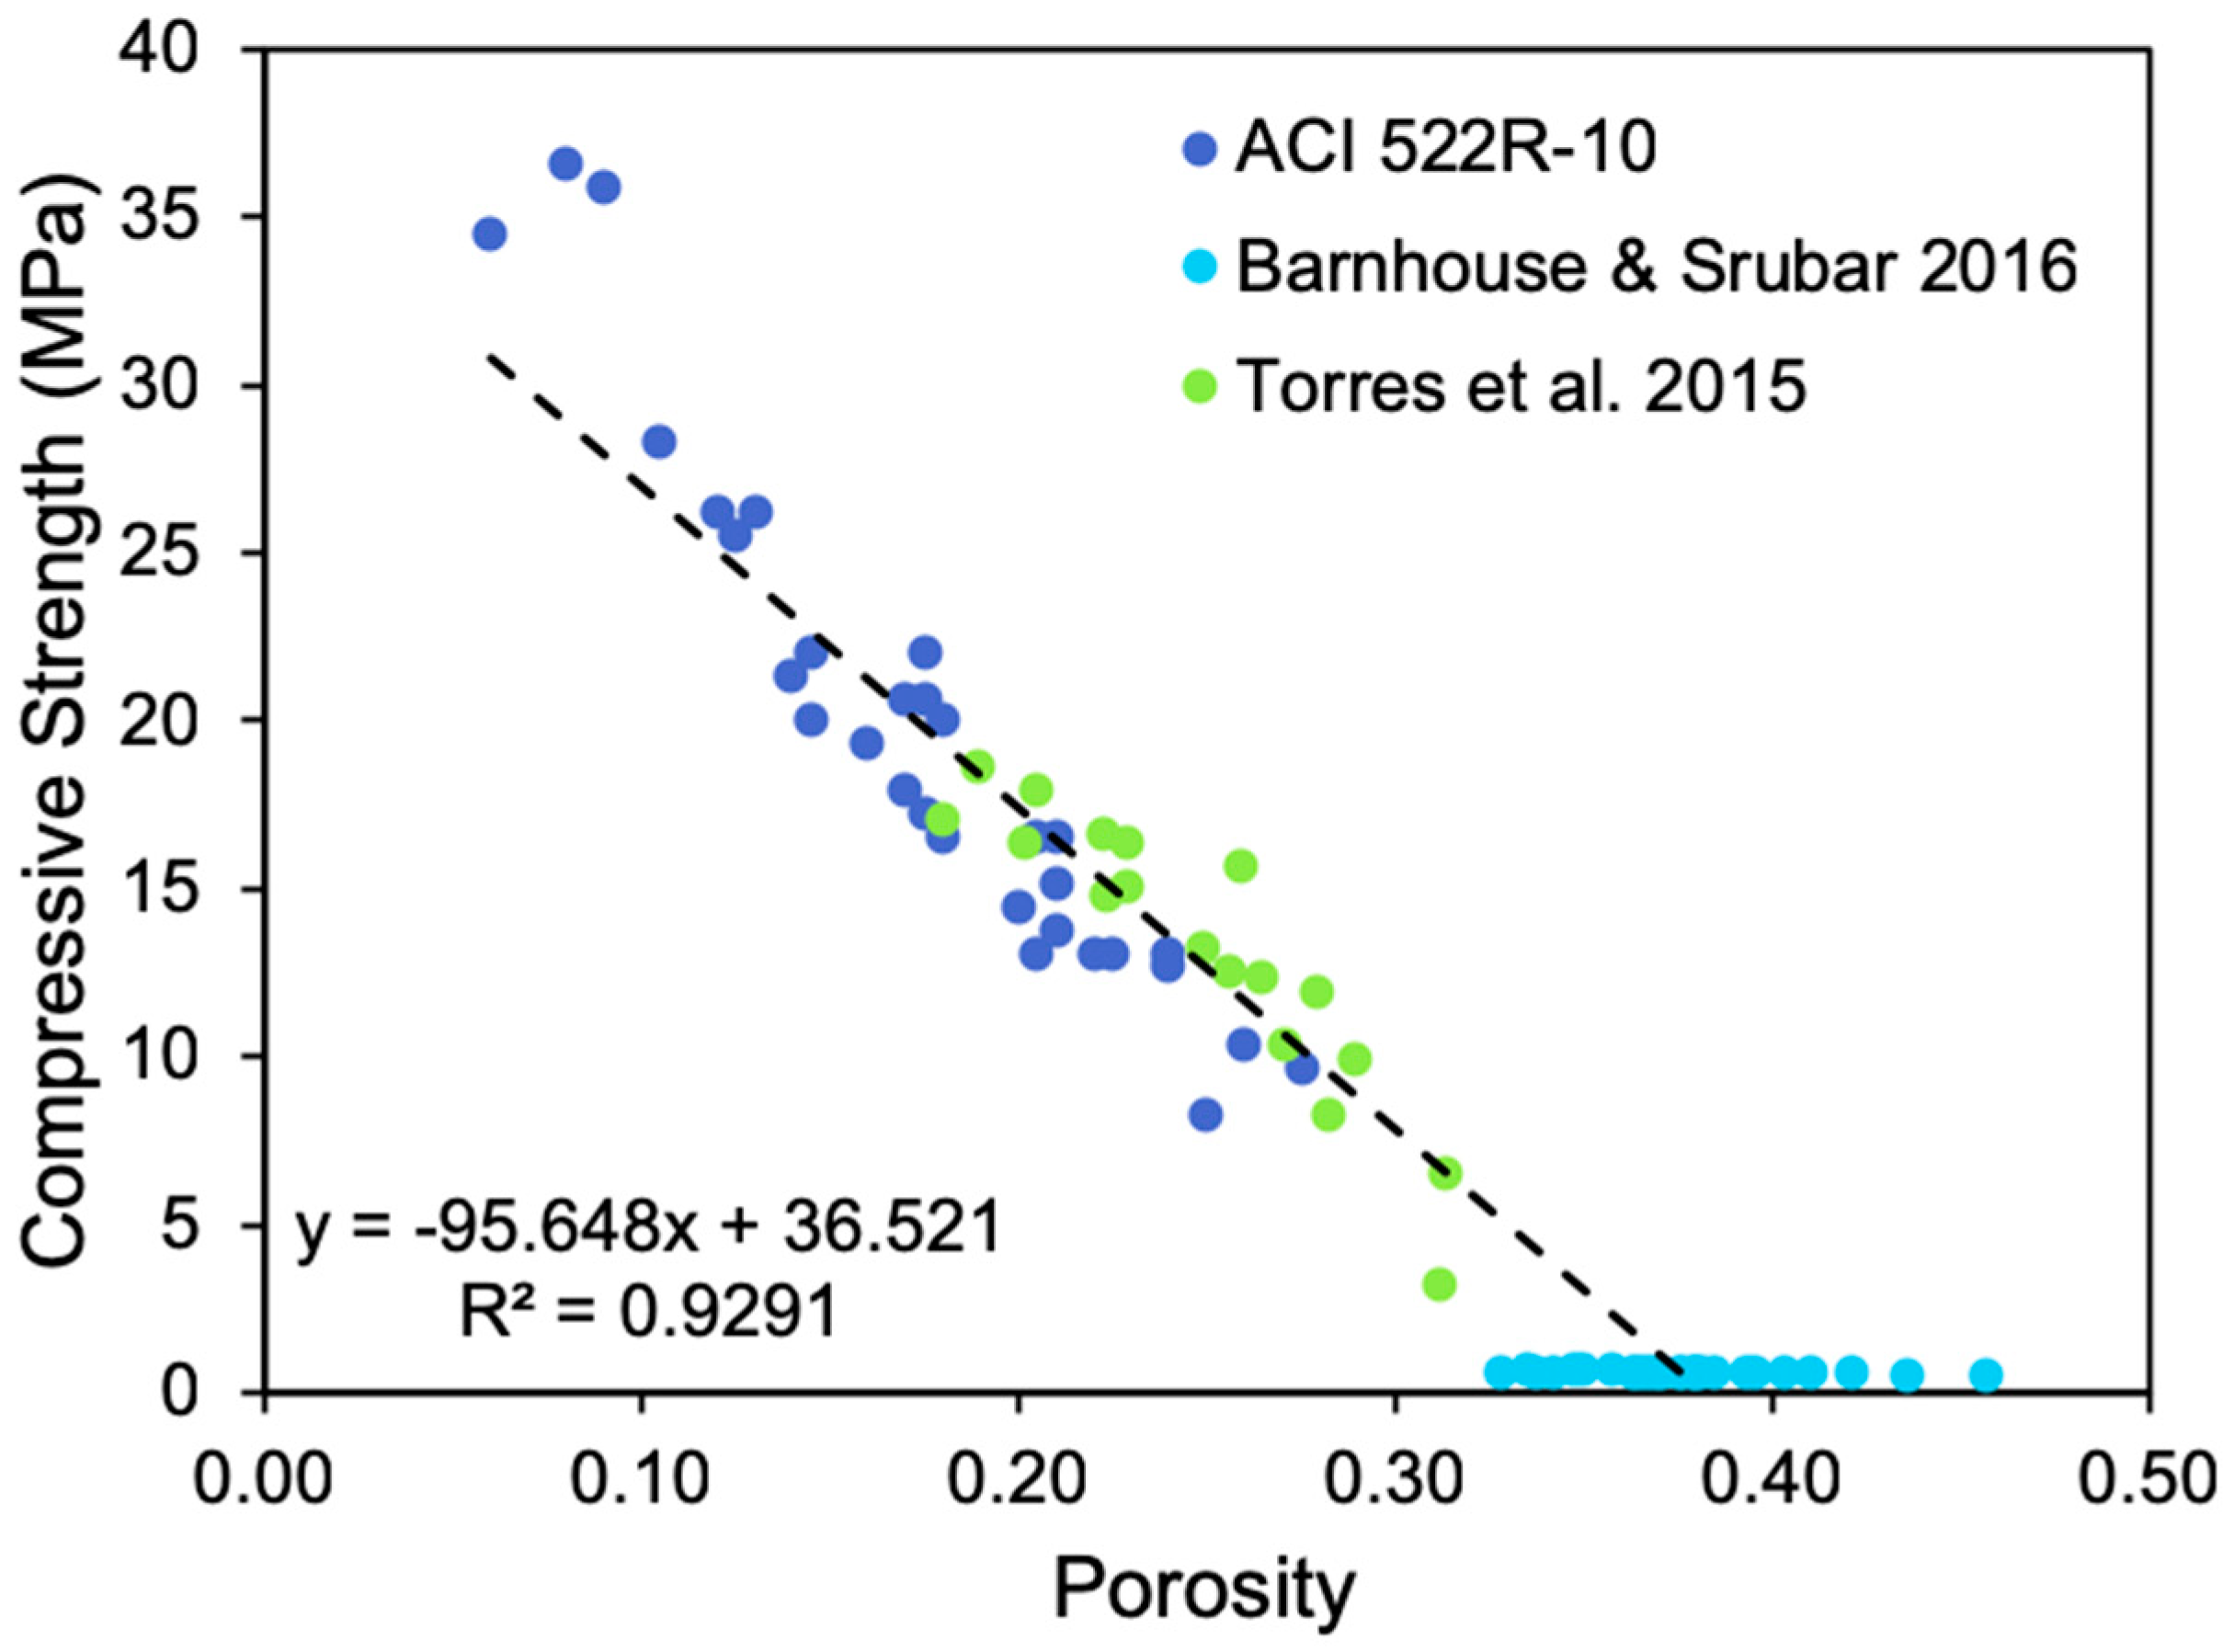
Once formulated, the model was used to investigate the effect of porosity, water-to-cement (w/c) ratio, and aggregate size on CO2 sequestration potential for the mixture designs displayed in Table 2. Design porosity is defined as the desired bulk void content of the pervious concrete mixture. Mixture proportions were created according to the National Ready Mixed Concrete Association (NRMCA) pervious concrete mixture proportioning guidelines [36]. Using the accompanying spreadsheet, mixture proportions (i.e., cement content, water content, coarse aggregate content) were determined from the specified design parameters, which include void content (porosity) (15–30%), w/c ratio (0.25–0.35), and aggregate properties, such as size, absorption, dry-rodded unit density, and specific gravity. The input parameters which were maintained constant are the cement specific gravity (3.15 for Type I OPC) and compaction index (5%). The calculations conducted by the NRMCA proportioning spreadsheet were derived from recommendations for pervious concrete described in ACI 522R-10 [4]. Furthermore, the designed porosity of each mixture was used to predict the theoretical compressive strength and hydraulic conductivity of the mixture. By combining data from previous studies [4,10,37], an empirical correlation, relating porosity and compressive strength, was determined. Data are plotted in Figure 1, while Equation (9) describes the linear relationship. Recent research has shown that a difference of 3–15% between design vs. actual porosity of pervious concrete can be observed [38]. Given that this study explicitly considers a large range of design porosities, the CO2 sequestration potential of as-built pervious concrete materials could be determined from this same modeling approach.
f c   [ M P a ] =   95.65 * φ + 36.52
where the porosity,   φ , is in decimal form (between 0.1 and 0.4). Similarly, a modified form of the Carman-Kozeny model [37] is used to calculate the hydraulic conductivity from porosity:
K   [ c m s ] =   [ φ 3 ( 1 φ ) 3 ]
In Equation (10), the porosity, φ , is in percentage form. A standard value of 30 is used. Using the relationships defined above, the compressive strength and hydraulic conductivity of each pervious concrete mixture can be estimated, enabling analysis of trends in CO2 sequestration potential with these important design parameters.

2.3. Lifecycle Assessment (LCA) Methodology

The LCA performed in this study followed the ISO 14040/14044 standard, including lifecycle stages A1–A3 and B1 as specified in EN 15804. The following sections define the LCA goal and scope, life cycle inventory (LCI) analysis, environmental impact assessment, and limitations of the study.

2.3.1. Goal and Scope Definition

This screening LCA investigated the net CO2 equivalent emissions (CO2e) emissions of pervious concrete mixtures with w/c rations of 0.25, 0.30, and 0.35 that have porosities ranging from 15% to 30%. The environmental impact reported has a global warming potential (kg CO2e) for each mix design, as summarized in Table 2. The results of the LCA were used to compare initial cradle-to-gate CO2 emissions—more specifically CO2e, which accounts for the global warming potential of other greenhouse gases, including methane and nitrous oxide—to the amount of CO2 recoverable during the use phase as calculated by the previously derived mathematical model.
The system boundary used for initial CO2e emissions was raw material supply (A1), transportation (A2), manufacturing (A3), while the system boundary for recoverable CO2 is the use phase (B1). The transportation stage (A4) and the construction stage (A5) were not included in the analysis.
The declared unit considered in this LCA was a 1 m3 of pervious concrete. As discussed in Section 2.1.5, 100% of the cement paste in each pervious concrete mixture is assumed to carbonate, due to its thin thickness relative to the depth of carbonation. Because 100% of the cement paste is assumed to carbonate, the declared unit is the same as the functional unit for the scope of this LCA since the geometry has no impact on the rate of carbonation.

2.3.2. Lifecycle Inventory (LCI) Data

Athena Impact Estimator for Buildings (IE4B) (v5.2) was used to calculate the cradle-to-gate emissions of each pervious concrete mix design. Athena IE4B is an industry-tested whole-building lifecycle assessment tool that is commonly used to perform LCAs of whole buildings and individual building components. The LCI that Athena IE4B uses for assessing environmental impacts is regionally sensitive, and all data is typically less than 10 years old.
The User Defined Concrete Mix Design Library tool within Athena IE4B was used to input each mix design considered for the USA region. The initial cradle-to-gate CO2 emissions (kg CO2e) for a declared unit (1 m3) of each mix design were calculated by the software. The cradle-to-gate environmental impacts for each mix design were compared to the recoverable CO2 for each concrete volume, as described in Section 2.1.

2.3.3. Limitations of the Study

  • As a screening LCA, emissions associated with construction and transportation (A4 and A5) were not considered. Only lifecycle stages A1–A3 and B1 were included in the scope of this study. To perform a complete LCA specific to a building project using pervious concrete, these stages should be included in the system boundary.
  • Only CH (i.e., portlandite) was considered to carbonate in the model used by this study. While other calcium silicate phases also have the potential to carbonate (as discussed), thus it is conservative to not consider their CO2 uptake.
  • This study assumed that all cement paste carbonates fully to report a conservative theoretical maximum. It has been shown that the actual degree of carbonation is less than 1.0 and may likely vary from 0.2 to 0.7 as previously discussed.
  • Due to limitations in IE4B, aggregate size was not differentiated in the formulation of the mix designs in the User Defined Concrete Mix Design Library. While different aggregate sizes require different manufacturing processes, for this study, “Coarse Aggregate Natural” was used as the input for the IE4B software. It is expected that smaller aggregate sizes will require a marginal increase in manufacturing emissions, but are ignored in this study.

3. Results and Discussion

3.1. Initial CO2 e Emissions

Figure 2 summarizes the initial cradle-to-gate CO2e emissions for a declared 1 m3 of each pervious concrete mixture analyzed herein. Expectedly, as the w/c ratio increases, initial CO2e emissions decrease due to lower cement content. For instance, for each unique porosity and aggregate size combination, the emissions of the w/c = 0.25 mixtures are approximately 17% larger than the w/c = 0.35 mixtures. In addition, increasing the porosity reduces the cradle-to-gate CO2e emissions. This trend is also expected, since higher-porosity mixtures have more void space and, therefore, contain less cement per unit volume. For example, each 1 m3 of pervious concrete with 15% porosity and a w/c = 0.30 emits 204 kg CO2e more than the 30% porosity mixture with the same w/c ratio. In fact, the initial CO2e emissions of the 15% porosity mixtures are 51% larger than those of the 30% porosity mixtures for the 0.25 w/c ratio considered herein. A similar magnitude difference was observed for the other w/c ratios. The mixture with a w/c = 0.25 and porosity of 15% generates the highest initial CO2e emissions (659 kg CO2e/m3), while the mixture with a w/c = 0.35 and porosity of 30% generates the least (374 kg CO2e/m3).

3.2. CO 2 Sequestration Potential

3.2.1. Effect of w/c Ratio

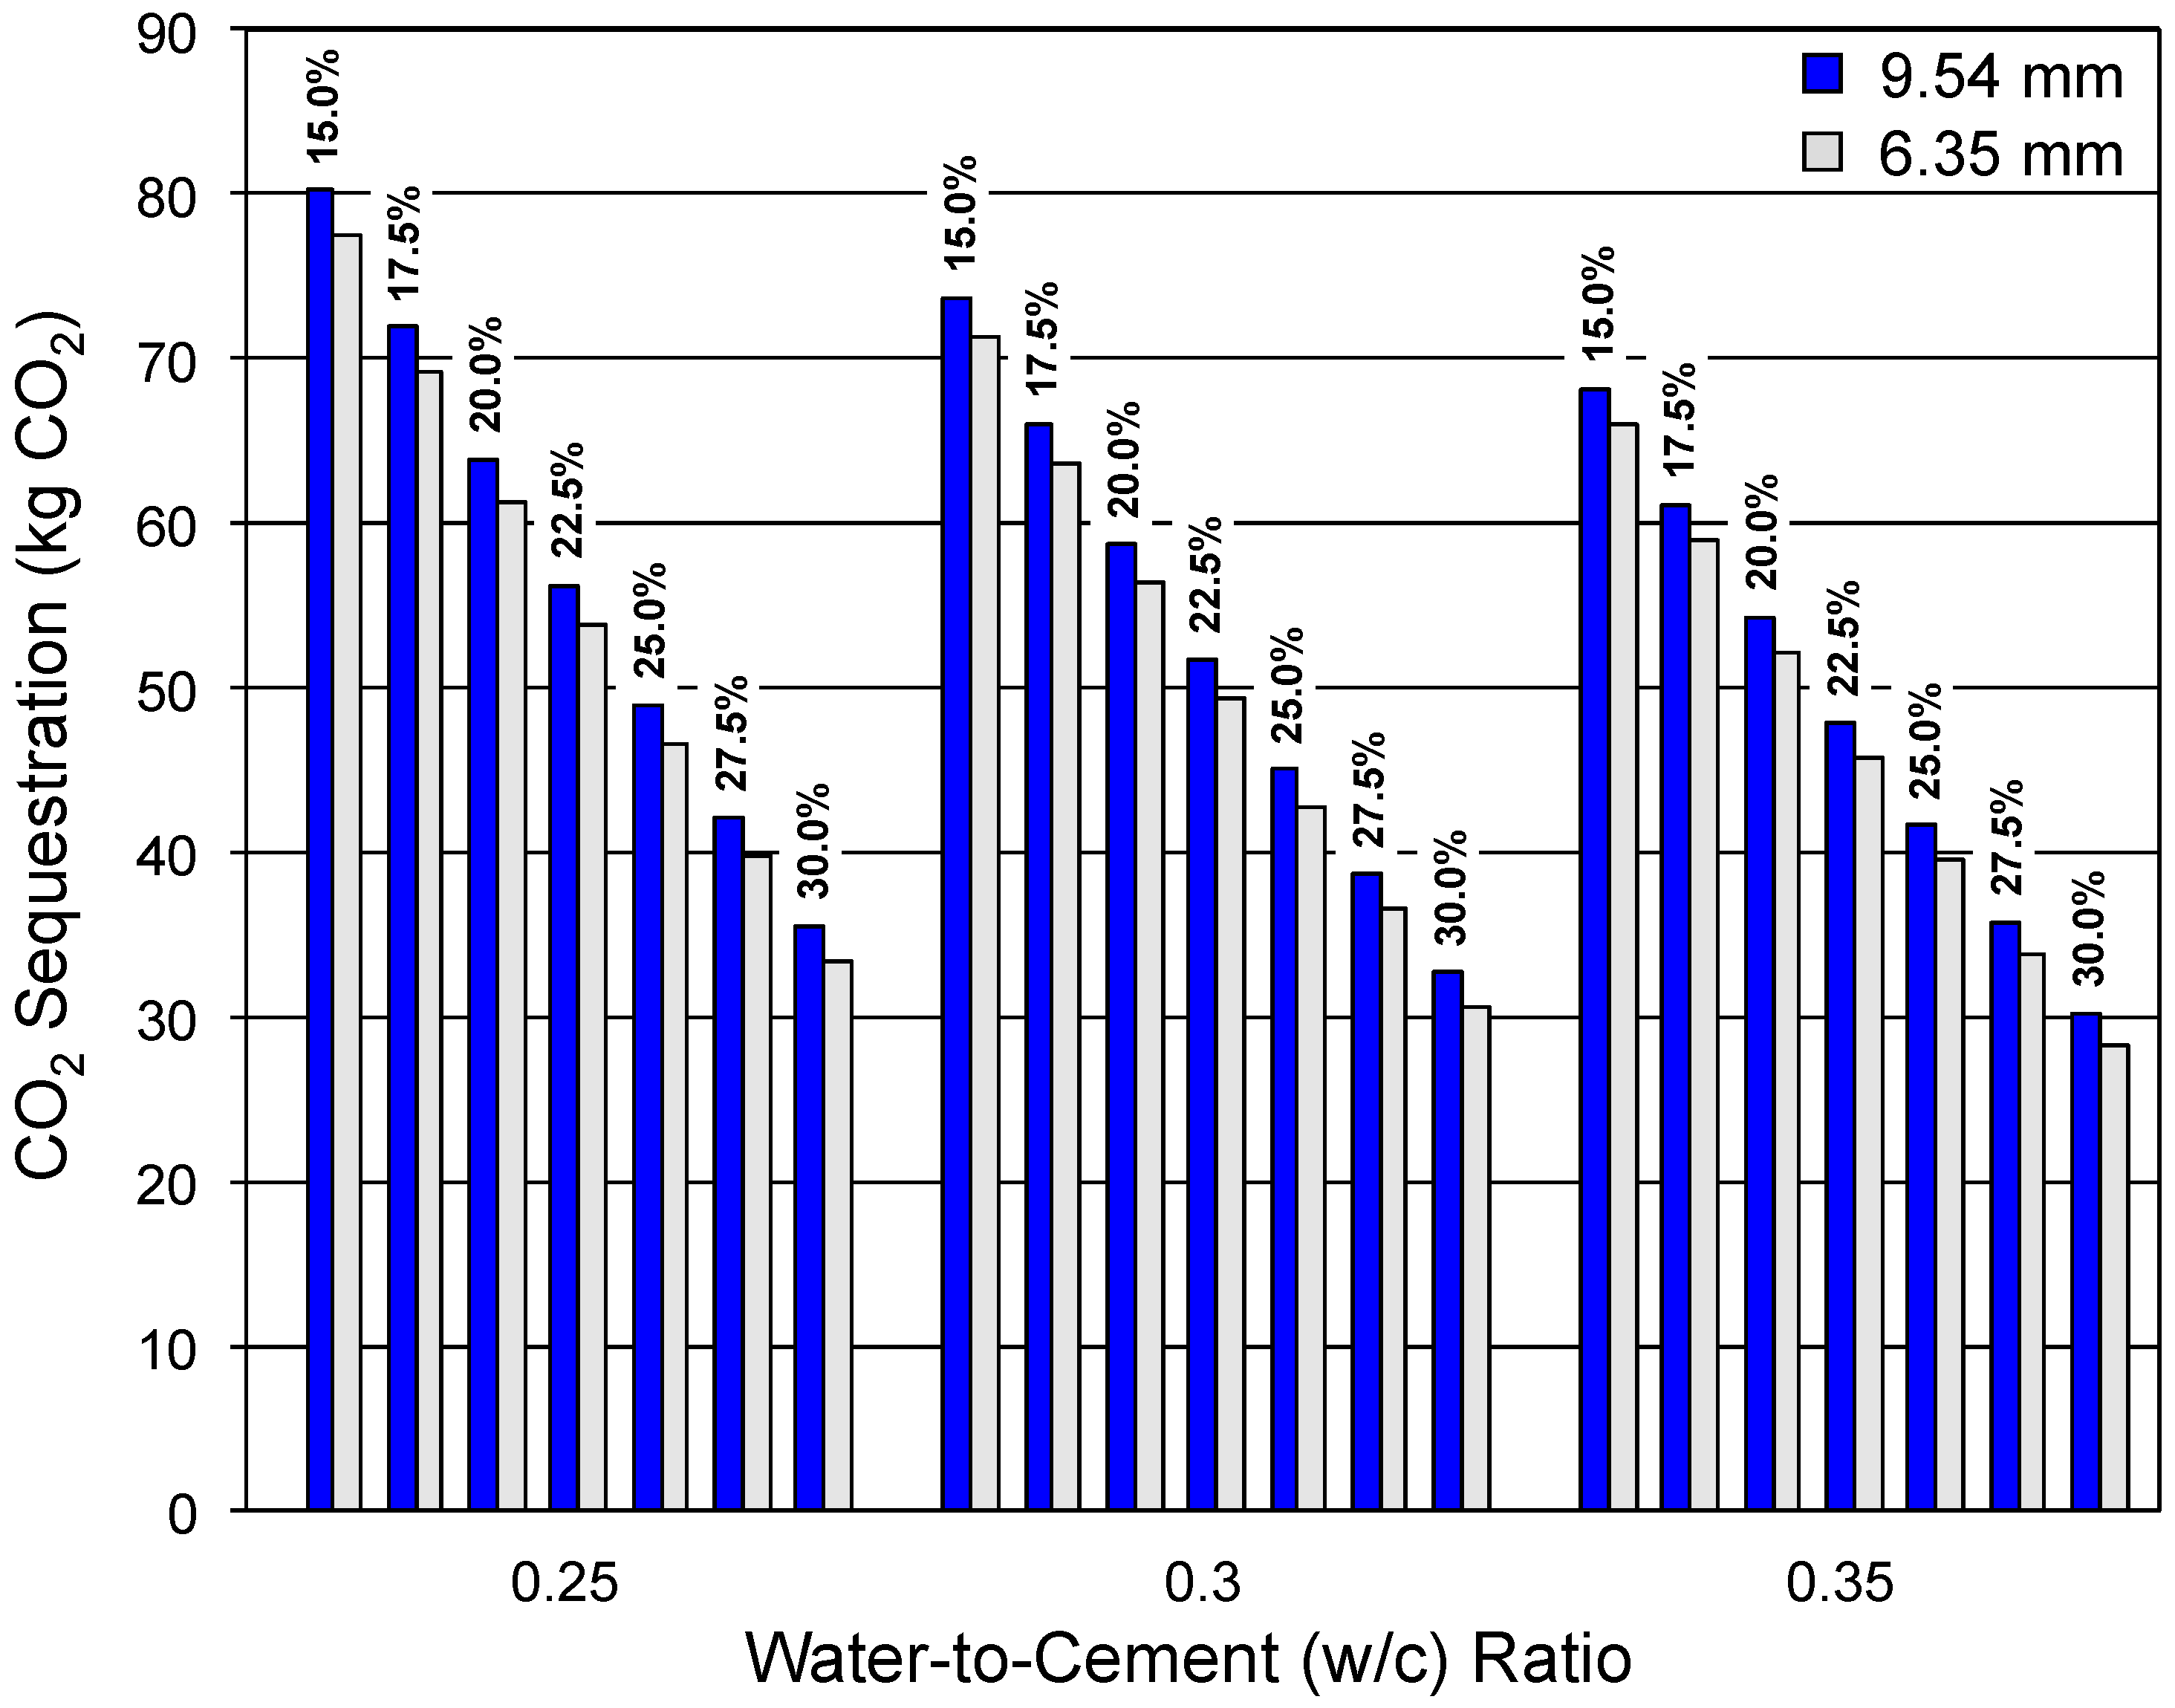
Figure 3 shows the effect of w/c ratio on the estimated CO2 sequestration potential of 1 m3 of pervious concrete for the aggregate types and porosities listed in Table 2. Expectedly, as w/c ratio increases for a given design porosity, the CO2 sequestration potential decreases. For example, a mixture with 9.54 mm aggregate, 15% porosity, and a w/c = 0.25 will sequester approximately 17.6% more CO2 than a mixture with an identical aggregate size and porosity but a w/c = 0.35. This reduction in CO2 sequestration potential is again attributable to the decreased cement content per unit volume of mixtures with lower w/c ratios.
Figure 3 also demonstrates that, for a given w/c ratio, CO2 sequestration potential decreases with increasing porosity. This result was also anticipated, as decreased cement content corresponds to thinner average cementitious paste thicknesses around aggregates within the pervious concrete matrix [10]. For mixtures with equivalent w/c ratios and design porosities, the use of smaller aggregate results in lower CO2 sequestration potentials as compared to the use of a larger aggregate (Figure 3). The cementitious paste thickness for small aggregate mixtures is, on average, less than a large aggregate mixture of equivalent porosity [10,39]. Thus, the total cement content in small-aggregate mixtures will be lower compared to large-aggregate mixtures with the same design porosity. Due to the decreased quantity of cement, and thus CH content, the in situ CO2 sequestration potential also decreases. As an example, mixtures designed for 30% porosity exhibit a 6.8% difference in CO2 sequestration potential between mixtures that use smaller versus larger aggregate sizes.

3.2.2. Effect of Compressive Strength

Figure 4 illustrates the effect of compressive strength on the CO2 sequestration potential of 1 m3 of pervious concrete designed according to the mixture proportions presented in Table 2. For the intermediate w/c ratio of 0.30, the highest compressive strength mixture (22.2 MPa) exhibits a CO2 sequestration potential 2.4 times greater than the lowest compressive strength mixture (7.8 MPa). As the compressive strength for a pervious concrete mixture design increases, higher cement contents are required, resulting in a higher CO2 sequestration potential compared to lower-strength mixtures. For normal concrete mixtures, previous work has also substantiated the relationship between higher cement content and higher in situ CO2 sequestration for a given volume of concrete [28].
Furthermore, Figure 4 demonstrates that mixtures containing larger coarse aggregates result in higher CO2 sequestration potentials for a given compressive strength. At the lowest compressive strength, mixtures containing 9.54 mm coarse aggregate have CO2 sequestration potentials 3.5% greater than equivalent 6.35 mm coarse aggregate mixtures for all w/c ratios. Similarly, at the highest compressive strength, the CO2 sequestration potential of 9.54 mm aggregate mixtures is 6.8% larger. As previously discussed, to achieve a desired compressive strength, large-aggregate mixtures require increased cement content as compared to small-aggregate mixtures, thereby increasing the potential for in situ CO2 sequestration.
Similar to Figure 3, Figure 4 indicates that, as w/c ratio increases, CO2 sequestration potential decreases. Figure 4 additionally demonstrates that the effect of varying w/c ratio on CO2 sequestration potential is more pronounced at higher design compressive strengths. At all compressive strengths, a 9.54 mm mixture with a w/c = 0.35 exhibits a CO2 sequestration potential 17.6% greater than a mixture with a w/c = 0.25. At the highest compressive strength, this difference is 85.4 kg CO2, while the difference is 46.3 kg CO2 at the lowest compressive strength. In this model, compressive strength is calculated only as a function of porosity using the relationship developed in Figure 1, and thus variations in w/c do not have an effect on compressive strength.

3.2.3. Effect of Design Porosity and Hydraulic Conductivity

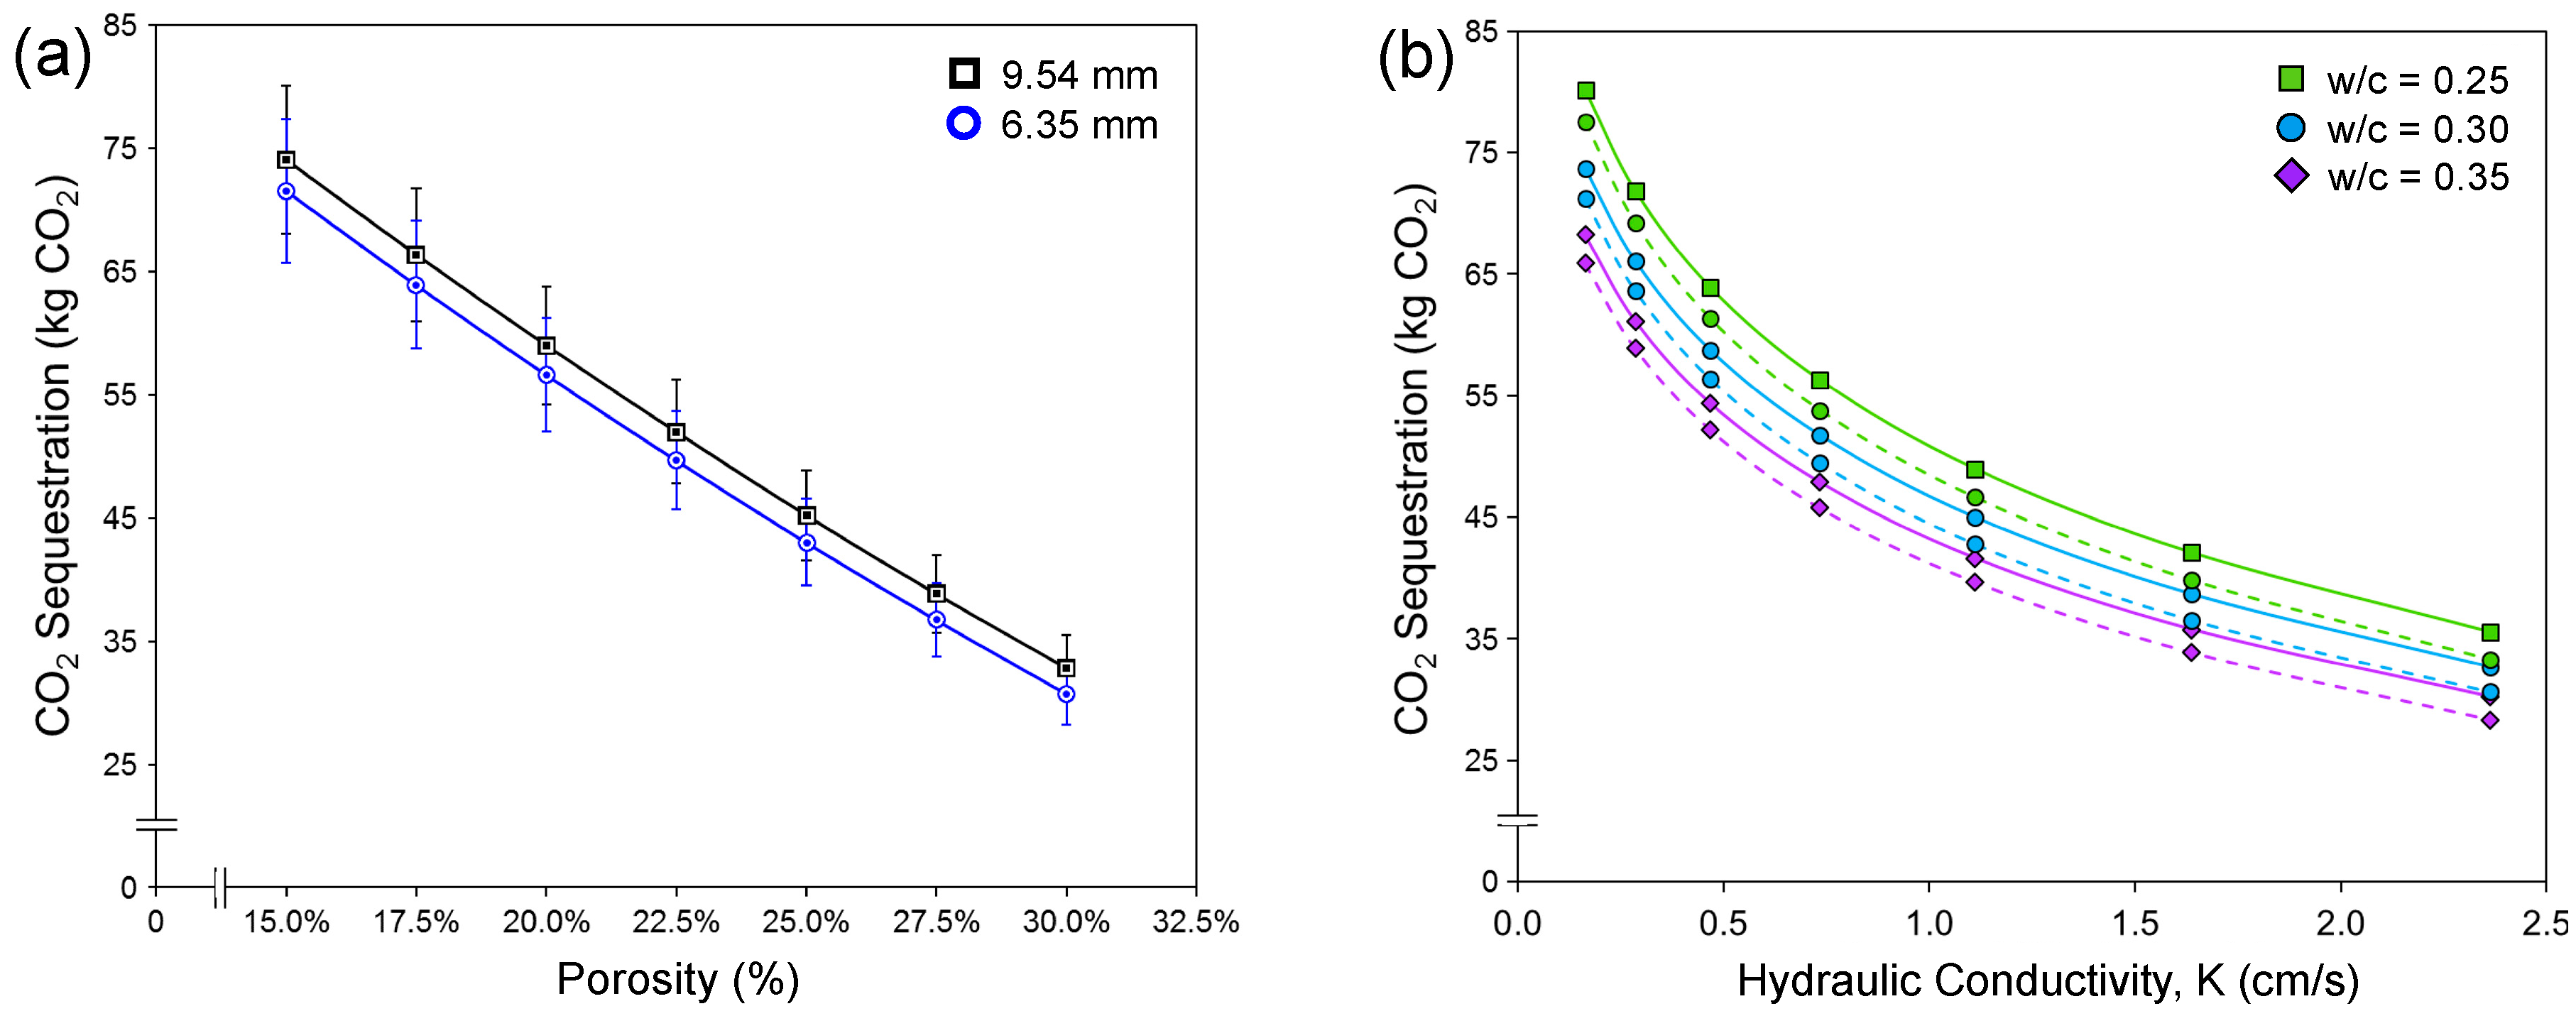
Figure 5a demonstrates that CO2 sequestration potential decreases almost linearly with increasing design porosity. For instance, the decrease in CO2 sequestration potential for an increase in porosity from 15% to 17.5% is 7.7 kg CO2 for 9.54 mm aggregate mixtures. This difference is marginally larger than the difference between 27.5% and 30% porosity for 9.54 mm aggregate mixtures, which differ in CO2 sequestration potential by approximately 6.0 kg CO2. While mixtures exhibit a slight decrease in the rate of change of CO2 sequestration potential with increases in bulk porosity, a linear regression of the relationship between sequestration potential and porosity results in an R2 = 0.998, indicating a near-linear relationship. Further, the standard deviation decreases as design porosity increases due to the guidelines of ACI 522R [4], indicating that the variation in CO2 sequestration potential between w/c = 0.25 and w/c = 0.35 mixtures decreases with increases in porosity. This finding is consistent with the trends exhibited in Figure 4.
A two-tail standard t-test assuming nonequivalent variances was conducted to determine the significance of the effect of aggregate size on CO2 sequestration potential. The null hypothesis predicts a zero difference between means of the two aggregate size mixture design samples. Using an α-parameter value of 0.05, p = 0.61, failing to reject the null hypothesis. Thus, based on this analysis, the mixture designs considered herein give no indication that aggregate size has a significant effect on CO2 sequestration potential.
Figure 5b demonstrates that increasing the design hydraulic conductivity of a mixture results in decreasing CO2 sequestration potential. Hydraulic conductivity is directly related to porosity, as a more porous concrete matrix enables faster permeation. Thus, similar to porosity, increasing hydraulic conductivity requires decreased cement paste thicknesses. Figure 5b also illustrates the trend of increasing deviation between mixtures of different w/c ratios. In the case of hydraulic conductivity, otherwise equivalent mixtures with w/c ratios of 0.25 and 0.35 exhibit the largest difference in sequestration potential at the lowest hydraulic conductivity.
Aggregate shape (angular vs. rounded) has a significant impact on the porosity of pervious concrete and, hence, the CO2 sequestration potential. More angular aggregates require more water in normal concrete to achieve the same workability as round aggregates and, for pervious concrete, the use of angular aggregates result in more porous mixtures [40,41]. While this study does not explicitly consider differences in aggregate type in the mixture designs or the analyses that ensue, it is expected that the use of more angular aggregates for the same target design porosity will result in only minor reductions in porosity and, therefore, impart trivial reductions on the CO2 sequestration potential.

3.3. Net Lifecycle (and Recoverable) CO2 Emissions

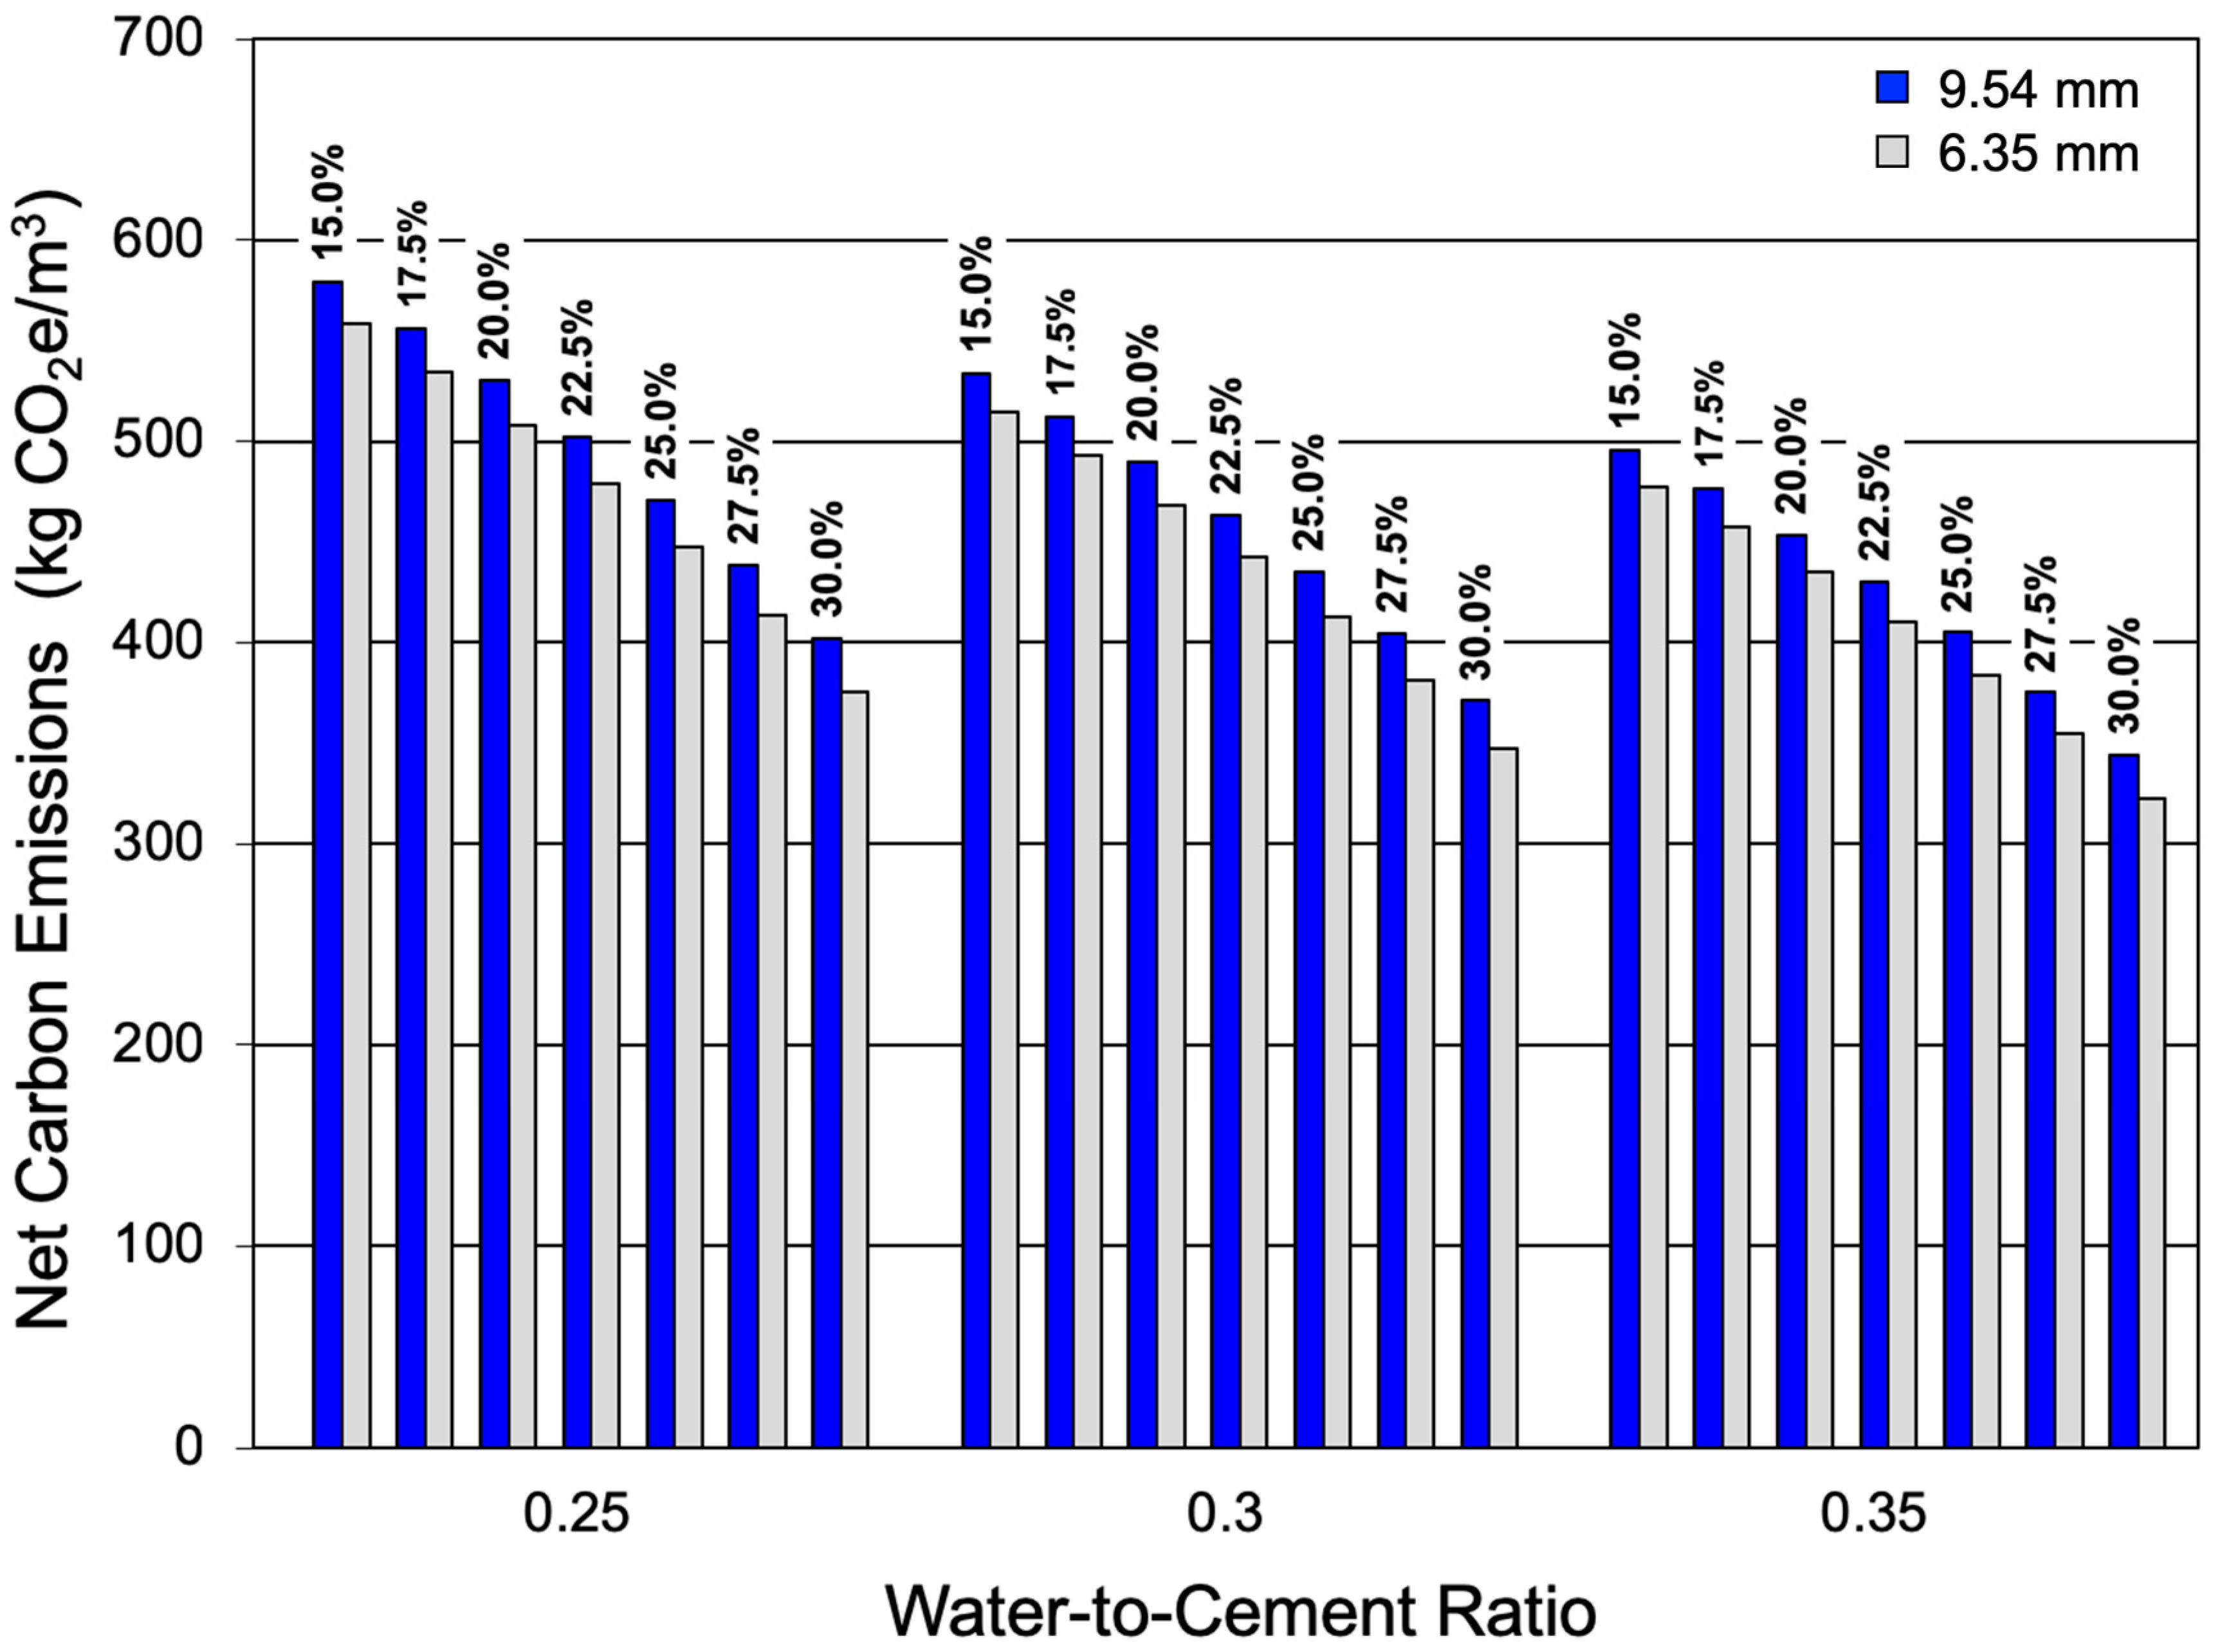
Net CO2e emissions for 1 m3 of each pervious concrete mixture were calculated by subtracting the CO2 sequestration potential discussed in Section 3.2 from the initial cradle-to-gate CO2e emissions discussed in Section 3.1. The results are summarized in Figure 6. As previously noted in Section 2.1.5, the CO2 sequestration potential assumes full carbonation of CH phases and represents the theoretical upper bound. Therefore, calculations of net emissions incorporate maximum CO2 sequestration potential with the conservative assumptions stated herein.
Figure 6 demonstrates that mixtures with higher cement contents correspond to larger CO2e emissions despite increased CO2 sequestration potential. As anticipated, pervious concrete mixtures with lower compressive strengths and, hence, lower cement contents, result in lower initial global warming potentials (Figure 4). For example, given that cement content decreases with increasing w/c ratio and increasing porosity, the net CO2e emissions for mixtures with w/c = 0.25 are 17% greater than mixtures with w/c = 0.35 for all porosities. For equivalent w/c ratios, mixtures with 15% porosity result in 44% more CO2e emissions than mixtures with 30% porosity. As discussed in Section 3.2, increased porosity correlates to decreased compressive strength. Therefore, net CO2e emissions are lower for mixtures exhibiting lower compressive strength. Similarly, as discussed in Section 3.3, increasing porosity correlates to increasing hydraulic conductivity. Thus, net CO2e emissions are lower for mixtures with higher hydraulic conductivity.
Table 3 displays the percentage of initial emissions associated with each pervious concrete mixture that is recoverable by CO2 sequestration. These data elucidate that lower porosity mixtures recover larger fractions of initial emissions. Further, Table 3 indicates that w/c ratio and aggregate size have negligible effects on the fraction of recoverable CO2 emissions. Because the model assumes full carbonation of CH, potential differences in the rate of carbonation between these mixtures are obfuscated by the assumption that all paste carbonates within the design service life. In reality, however, mixtures with lower w/c ratios and lower porosities (higher cement content) will, in theory, reach full carbonation at a slower rate due to thicker aggregate coating [3,10,17]. As design porosity increases, the fraction of initial emissions from cement production decreases, thereby reducing the fraction of emissions recoverable via CO2 sequestration. Likewise, the fraction of overall emissions that carbonation can recover is reduced with decreasing compressive strength and increasing hydraulic conductivity.
It is well known that incorporation of SCMs, such as fly ash and slag, in pervious concrete mixtures can reduce the initial cradle-to-gate CO2 emissions but also alter the CO2 sequestration potential. Previous studies concerning the impact of SCMs on CO2 sequestration for regular concrete mixtures indicate that CO2 sequestration potential ( C m ) linearly decreases as % replacement by SCM increases [28]. Given that OPC is used as the binder in both regular and pervious concrete mixtures, the same set of chemical reactions occur, indicating that CO2 sequestration potential in pervious concrete mixtures would also decrease with increased cement replacement by SCMs. Therefore, the inclusion of SCMs in pervious concrete mixtures would result in decreased initial CO2 emissions in addition to decreased CO2 sequestration potential. While CO2 sequestration potential would decrease in these circumstances, net CO2 emissions would also likely decrease [19], indicating that SCM use in pervious concrete should be encouraged from a net-emissions standpoint.
As previously discussed, the fraction of initial emissions recoverable via carbonation has been previously studied for regular OPC concrete mixtures [19,20,25,40]. For both regular and pervious concrete mixtures, the amount of sequesterable CO2 increases as compressive strength increases [40]. Results from [40] indicate that normal Type I OPC mixtures with compressive strengths of 15 MPa can sequester up to 16.8% of their initial CO2e emissions, while mixtures with compressive strengths of 45 MPa can recover approximately 17.1% through sequestration. Therefore, typical concrete elements have the ability to recover a larger fraction of initial emissions via complete carbonation of available CH than pervious concrete elements, which are predicted herein to recover approximately 8–12% of initial emissions. However, as previously discussed, the rates at which the carbonation process occurs are different in normal versus pervious concrete due the bulk porosity and air and water permeability of pervious concrete. Therefore, a pervious concrete would achieve full carbonation faster than a normal concrete with similar cement contents per unit volume.
In summary, this study elucidates that, for both regular and pervious concrete mixtures, lower initial CO2 emissions correspond to lower net CO2 emissions, even when carbonation is included in the carbon accounting. Concrete mixtures with higher cement contents exhibit higher CO2 sequestration potentials. However, increased CO2 sequestration potential is outweighed by increased initial CO2 emissions, which result in higher net lifecycle emissions for concrete mixtures with higher cement contents. Therefore, as was also concluded in [19] for normal OPC concrete, minimizing initial CO2 emissions when designing concrete mixtures—for either normal or pervious concrete—rather than maximizing in situ CO2 sequestration potential is a most beneficial strategy to minimize net overall CO2 emissions.

4. Conclusions

The formulation of a mathematical model for quantifying the in situ CO2 sequestration potential of pervious concrete mixtures was presented and implemented herein. The model was derived from OPC hydration and carbonation reactions and was implemented for 42 pervious concrete mixtures that varied in aggregate size (6.35 and 9.54 mm), water-to-cement (w/c) ratio (0.25, 0.30, 0.35), and design porosity (15–30%). Additionally, initial cradle-to-gate CO2e emissions of each concrete mixture were quantified using a screening LCA, enabling quantification of the percentage of initial CO2 emissions recoverable through in situ CO2 sequestration. Results elucidate the following main conclusions of this study:
  • The maximum amount of initial CO2 emissions of pervious concrete that can be recovered through CO2 sequestration is estimated to be approximately 12%.
  • Higher w/c ratios, design porosities, and hydraulic conductivities correspond to decreased CO2 sequestration potential, while higher compressive strength corresponds to higher CO2 sequestration potential. Aggregate size imparts a negligible effect.
  • LCA results indicate that net CO2e emissions decline with increases in w/c ratio, design porosity, and hydraulic conductivity, while increased cement content increases both CO2 sequestration potential and, to a greater extent, initial CO2e emissions.
  • Mixtures with higher cement contents always exhibit higher net CO2e emissions despite their increased CO2 sequestration potential.
The model presented here may be implemented by design engineers and architects in LCAs to make more informed decisions concerning the environmental impacts of pervious concrete in building and infrastructure applications. LCAs enable environmental impacts, such as global warming potential, to be considered in materials design, permitting engineers and architects the ability to reduce and avoid excess CO2 emissions. As illustrated herein, while LCA studies that negate in situ carbonation may be over-estimating the cradle-to-gate CO2 emissions of pervious concrete up to ≈ 12%, avoidance of initial CO2 emissions is a more advantageous strategy than relying on the carbonation process to recover a meaningful quantity of initial CO2 emissions.

Author Contributions

Conceptualization, W.V.S. III; Formal analysis, E.E., J.H.A., and W.V.S. III; Funding acquisition, W.V.S. III; Investigation, E.E. and J.H.A.; Methodology, E.E., J.H.A., and W.V.S. III; Project administration, W.V.S. III; Resources, W.V.S. III; Supervision, J.H.A. and W.V.S. III; Validation, J.H.A.; Visualization, E.E. and J.H.A.; Writing–original draft, E.E. and J.H.A.; Writing–review & editing, W.V.S. III.

Funding

This research was funded by the Discovery Learning Apprenticeship at the University fo Colorado Boulder.

Acknowledgments

This research was made possible by the Department of Civil, Environmental, and Architectural Engineering, the College of Engineering and Applied Sciences, the Living Materials Laboratory, and the Discovery Learning Apprenticeship Program at the University of Colorado Boulder. This work represents the views of the authors and not necessarily those of the sponsors.

Conflicts of Interest

The authors declare no conflict of interest. The funders had no role in the design of the study; in the collection, analyses, or interpretation of data; in the writing of the manuscript, or in the decision to publish the results.

References

  1. Poh, S.; Zhao, P.; Chen, C.; Goh, Y.; Adebayo, H.; Hung, K.; Wah, C. Characterization of pervious concrete with blended natural aggregate and recycled concrete aggregates. J. Clean. Prod. 2018, 181, 155–165. [Google Scholar]
  2. Carsana, M.; Tittarelli, F.; Bertolini, L. Use of no-fines concrete as a building material: Strength, durability properties and corrosion protection of embedded steel. Cem. Concr. Res. 2013, 48, 64–73. [Google Scholar] [CrossRef]
  3. Tamai, M.; Mizuguchi, H.; Hatanaka, S.; Katahira, H.; Nakazawa, T.; Yanagibashi, K.; Kunieda, M. Design, construction and recent applications of porous concrete in Japan. In Proceedings of the JCI Symposium on Design, Construction, and Recent Applications of Porous Concrete; Japan Concrete Institute: Tokyo, Japan, 2004. [Google Scholar]
  4. American Concrete Institute (ACI). ACI 522R-10: Report on Pervious Concrete; American Concrete Institute (ACI): Farmington Hills, MI, USA, 2010; Volume 10. [Google Scholar]
  5. Welker, A.L.; Barbis, J.D.; Jeffers, P.A. A side-by-side comparison of pervious concrete and porous asphalt. J. Am. Water Resour. Assoc. 2012, 48, 809–819. [Google Scholar] [CrossRef]
  6. Haselbach, L.; Boyer, M.; Kevern, J.; Schaefer, V. Cyclic heat island impacts on traditional versus pervious concrete pavement systems. Transp. Res. Rec. J. Transp. Res. Board 2011, 2240, 107–115. [Google Scholar] [CrossRef]
  7. Horst, M.; Welker, A.L.; Traver, R. Multiyear performance of a pervious concrete infiltration basin BMP. J. Irrig. Drain. Eng. 2011, 137, 352–358. [Google Scholar] [CrossRef]
  8. Nemirovsky, E.M.; Welker, A.L.; Lee, R. Quantifying evaporation from pervious concrete systems: Methodology and hydrologic perspective. J. Irrig. Drain. Eng. 2012, 139, 271–277. [Google Scholar] [CrossRef]
  9. Kwiatkowski, M.; Welker, A.L.; Traver, R.G.; Vanacore, M.; Ladd, T. Evaluation of an infiltration best management practice utilizing pervious concrete. J. Am. Water Resour. Assoc. 2008, 43, 1208–1222. [Google Scholar] [CrossRef]
  10. Torres, A.; Hu, J.; Ramos, A. The effect of the cementitious paste thickness on the performance of pervious concrete. Constr. Build. Mater. 2015, 95, 850–859. [Google Scholar] [CrossRef]
  11. Neithalath, N.; Sumanasooriya, M.S.; Deo, O. Characterizing pore volume, sizes, and connectivity in pervious concretes for permeability prediction. Mater. Charact. 2010, 61, 802–813. [Google Scholar] [CrossRef]
  12. Huang, B.; Wu, H.; Shu, X.; Burdette, E.G. Laboratory evaluation of permeability and strength of polymer-modified pervious concrete. Constr. Build. Mater. 2010, 24, 818–823. [Google Scholar] [CrossRef]
  13. Zhong, R.; Wille, K. Compression response of normal and high strength pervious concrete. Constr. Build. Mater. 2016, 109, 177–187. [Google Scholar] [CrossRef]
  14. Huntzinger, D.N.; Eatmon, T.D. A life-cycle assessment of Portland cement manufacturing: Comparing the traditional process with alternative technologies. J. Clean. Prod. 2009, 17, 668–675. [Google Scholar] [CrossRef]
  15. Worrell, E.; Price, L.; Martin, N.; Hendriks, C.; Meida, L.O. Carbon dioxide emissions from the global cement industry. Carbon 2001, 26, 303–329. [Google Scholar] [CrossRef]
  16. Xi, F.; Davis, S.J.; Ciais, P.; Crawford-Brown, D.; Guan, D.; Pade, C.; Shi, T.; Syddall, M.; Lv, J.; Ji, L.; et al. Substantial global carbon uptake by cement carbonation. Nat. Geosci. 2016, 9, 880–883. [Google Scholar] [CrossRef]
  17. Pade, C.; Guimaraes, M. The CO2 uptake of concrete in a 100 year perspective. Cem. Concr. Res. 2007, 37, 1348–1356. [Google Scholar] [CrossRef]
  18. Gajda, J.; Miller, F.M. Concrete as a Sink for Atmospheric Carbon Dioxide: A Literature Review and Estimation of CO2 Absorption by Portland Cement Concrete; Portland Cement Association: Skokie, IL, USA, 2000. [Google Scholar]
  19. Yang, K.H.; Seo, E.A.; Tae, S.H. Carbonation and CO2 uptake of concrete. Environ. Impact Assess. Rev. 2014, 46, 43–52. [Google Scholar] [CrossRef]
  20. García-Segura, T.; Yepes, V.; Alcalá, J. Life cycle greenhouse gas emissions of blended cement concrete including carbonation and durability. Int. J. Life Cycle Assess. 2014, 19, 3–12. [Google Scholar] [CrossRef]
  21. Souto-Martinez, A.; Delesky, E.A.; Foster, K.E.O.; Srubar, W.V. Accounting for the carbon sequestration potential of reinforced concrete in a whole-building life-cycle assessment. In AEI 2017; American Society of Civil Engineers: Reston, VA, USA, 2017; pp. 285–298. [Google Scholar]
  22. Souto-Martinez, A.; Arehart, J.H.; Srubar, W.V. Cradle-to-gate CO2e emissions vs. in situ CO2 sequestration of structural concrete elements. Energy Build. 2018, 167, 301–311. [Google Scholar] [CrossRef]
  23. Ashraf, W. Carbonation of cement-based materials: Challenges and opportunities. Constr. Build. Mater. 2016, 120, 558–570. [Google Scholar] [CrossRef]
  24. Papadakis, V.G.; Vayenas, C.G.; Fardis, M.N. Fundamental modeling and experimental investigation of concrete carbonation. ACI Mater. J. 1991, 88, 363–373. [Google Scholar]
  25. Collins, F. Inclusion of carbonation during the life cycle of built and recycled concrete: Influence on their carbon footprint. Int. J. Life Cycle Assess. 2010, 15, 549–556. [Google Scholar] [CrossRef]
  26. Lagerblad, B. Carbon Dioxide Uptake during Concrete Life Cycle—State of the Art; Nordic Innovation Centre: Oslo, Norway, 2006; Volume CBI 2005:2, ISBN 9197607002. [Google Scholar]
  27. ASTM C150/C150M-18 Standard Specification for Portland Cement. ASTM Int. 2018, 1–9.
  28. Mehta, P.K. Concrete Structure, Properties and Materials. 1986. Available online: https://trid.trb.org/view/273357 (accessed on 18 November 2017).
  29. Souto-Martinez, A.; Delesky, E.A.; Foster, K.E.O.; Srubar, W.V. A mathematical model for predicting the carbon sequestration potential of ordinary Portland cement (OPC) concrete. Constr. Build. Mater. 2017, 147, 417–427. [Google Scholar] [CrossRef]
  30. Haselbach, L.M.; Liu, L. Calcium hydroxide formation in thin cement paste exposed to air. ACI Mater. J. 2010, 107, 365–371. [Google Scholar]
  31. Golroo, A.; Tighe, S.L. Pervious concrete pavement performance modeling using the bayesian statistical technique. J. Transp. Eng. 2012, 138, 603–609. [Google Scholar] [CrossRef]
  32. Engelsen, C.J.; Justnes, H.; Rønning, A.R. The quantity of CO2 bound by concrete carbonation in Norway. In Proceedings of the Fourth International Conference on Sustainable Construction Materials and Technologies, Las Vegas, NV, USA, 7–11 August 2016. [Google Scholar]
  33. Fridh, K.; Lagerblad, B. Carbonation of indoor concrete: Measurements of depths and degrees of carbonation. Lund 2013. Available online: https://lup.lub.lu.se/search/publication/4390005 (accessed on 18 November 2017).
  34. Thiery, M.; Dangla, P.; Belin, P.; Habert, G.; Roussel, N. Carbonation kinetics of a bed of recycled concrete aggregates: A laboratory study on model materials. Cem. Concr. Res. 2013, 46, 50–65. [Google Scholar] [CrossRef]
  35. Van Balen, K. Carbonation reaction of lime, kinetics at ambient temperature. Cem. Concr. Res. 2005, 35, 647–657. [Google Scholar] [CrossRef]
  36. National Ready Mixed Concrete Association (NRMCA) Pervious Concrete: Guideline to Mixture Proportioning. Available online: https://my.nrmca.org/Main/ItemDetail?iProductCode=2PE001 (accessed on 18 November 2017).
  37. Barnhouse, P.W.; Srubar, W.V. Material characterization and hydraulic conductivity modeling of macroporous recycled-aggregate pervious concrete. Constr. Build. Mater. 2016, 110, 89–97. [Google Scholar] [CrossRef]
  38. Torres, A.; Gaedicke, C.; Hu, J.; Bejugam, R.; Mcmasters, S. Comparing Design Void Content with Actual Void Content of Laboratory Prepared Pervious Concrete. Mater. Sci. Appl. 2018, 9, 596–613. [Google Scholar]
  39. Joshaghani, A.; Ramezanianpour, A.A.; Ataei, O.; Golroo, A. Optimizing pervious concrete pavement mixture design by using the Taguchi method. Constr. Build. Mater. 2015, 101, 317–325. [Google Scholar] [CrossRef]
  40. Zhang, Z.; Zhang, Y.; Yan, C.; Liu, Y. Influence of crushing index on properties of recycled aggregates pervious concrete. Constr. Build. Mater. 2017, 135, 112–118. [Google Scholar] [CrossRef]
  41. Tennis, P.D.; Leming, M.L.; Akers, D.J. Pervious Concrete Pavements; EB302.02; Portland Cement Association: Skokie, IL, USA, 2004; ISBN 0893122424. [Google Scholar]
Figure 1. Relationship between compressive strength and porosity [4,10,38].
Infrastructures 04 00012 g001
Figure 2. Initial cradle-to-gate CO2e emissions of pervious concrete mixtures designed according to the NRMCA design methodology [35,36]. Design porosity of each mixture is indicated above its respective column. Aggregate size is differentiated by color.
Infrastructures 04 00012 g002
Figure 3. CO2 sequestration potential for 1 m3 of pervious concrete. Design porosity of each mixture is indicated above its respective column. Aggregate size is differentiated by color.
Infrastructures 04 00012 g003
Figure 4. Effect of compressive strength on the CO2 sequestration potential of 1 m3 of pervious concrete with varying water-to-cement (w/c) ratios and both 9.35 mm (⎯⎯⎯) and 6.35 mm (- - -) aggregate.
Infrastructures 04 00012 g004
Figure 5. (a) Effect of design porosity on average CO2 sequestration of 1 m3 of pervious concrete. Means and error bars represent ± one standard deviation of CO2 sequestration potential from fixed-porosity mixtures designed using water-to-cement (w/c) ratios of 0.25, 0.30, and 0.35. Aggregate size is differentiated by color. (b) Effect of design hydraulic conductivity on average CO2 sequestration potential of a 1 m3 of pervious concrete, with varying w/c ratios and both 9.35 mm (⎯⎯⎯) and 6.35 mm (- - -) aggregate.
Infrastructures 04 00012 g005
Figure 6. Net CO2e emissions of 1 m3 of pervious concrete. Design porosity of each mixture is indicated above its respective column. Aggregate size is differentiated by color.
Infrastructures 04 00012 g006
Table 1. Chemical and mineral composition of Type I OPC.
Average Oxide Composition (%)Average Mineral (Bogue) Composition (%)
S (SiO2)A (Al2O3)F (Fe2O3)C (CaO)M (MgO)Š (SO3)N (Na2O)OtherC3SC2SC3AC4AFOther
20.55.42.663.92.13.00.611.9541810810
Table 2. Mixture proportion of pervious concrete design using NRMCA guidelines.
w/cAggregate Size [mm]ComponentDesign Porosity
15.0%17.5%20.0%22.5%25.0%27.5%30.0%
0.259.54Cement572528484440396352308
Water143132121110998877
CA11349134913491349134913491349
6.35Cement553508465421377333288
Water138127116105948372
CA11383138313831383138313831383
0.39.54Cement526485445405364323283
Water1581451331211099785
CA11349134913491349134913491349
6.35Cement508468427387346306265
Water1521401281161049279
CA11383138313831383138313831383
0.359.54Cement486449412374336299262
Water17015714413111810591
CA11349134913491349134913491349
6.35Cement470432395358320283245
Water1641511381251129986
CA11383138313831383138313831383
1 CA = course aggregate.
Table 3. Percentage of initial emissions recoverable via CO2 sequestration for 1 m3 of pervious concrete.
Aggregate Size (mm)w/c = 0.25w/c = 0.30w/c = 0.35
Design Porosity 9.546.359.546.359.546.35
15.012.17%12.19%12.14%12.16%12.11%12.12%
17.511.45%11.47%11.42%11.44%11.37%11.40%
20.010.75%10.77%10.71%10.74%10.71%10.71%
22.510.07%10.09%10.05%10.06%10.01%10.03%
25.09.42%9.43%9.37%9.40%9.32%9.36%
27.58.76%8.79%8.73%8.75%8.71%8.71%
30.08.13%8.15%8.10%8.11%8.07%8.07%