Resilience-Based Recovery Assessments of Networked Infrastructure Systems under Localized Attacks
Abstract
1. Introduction
2. Recovery Strategies against Localized Attacks
2.1. Localized Attacks
2.2. Recovery Strategies
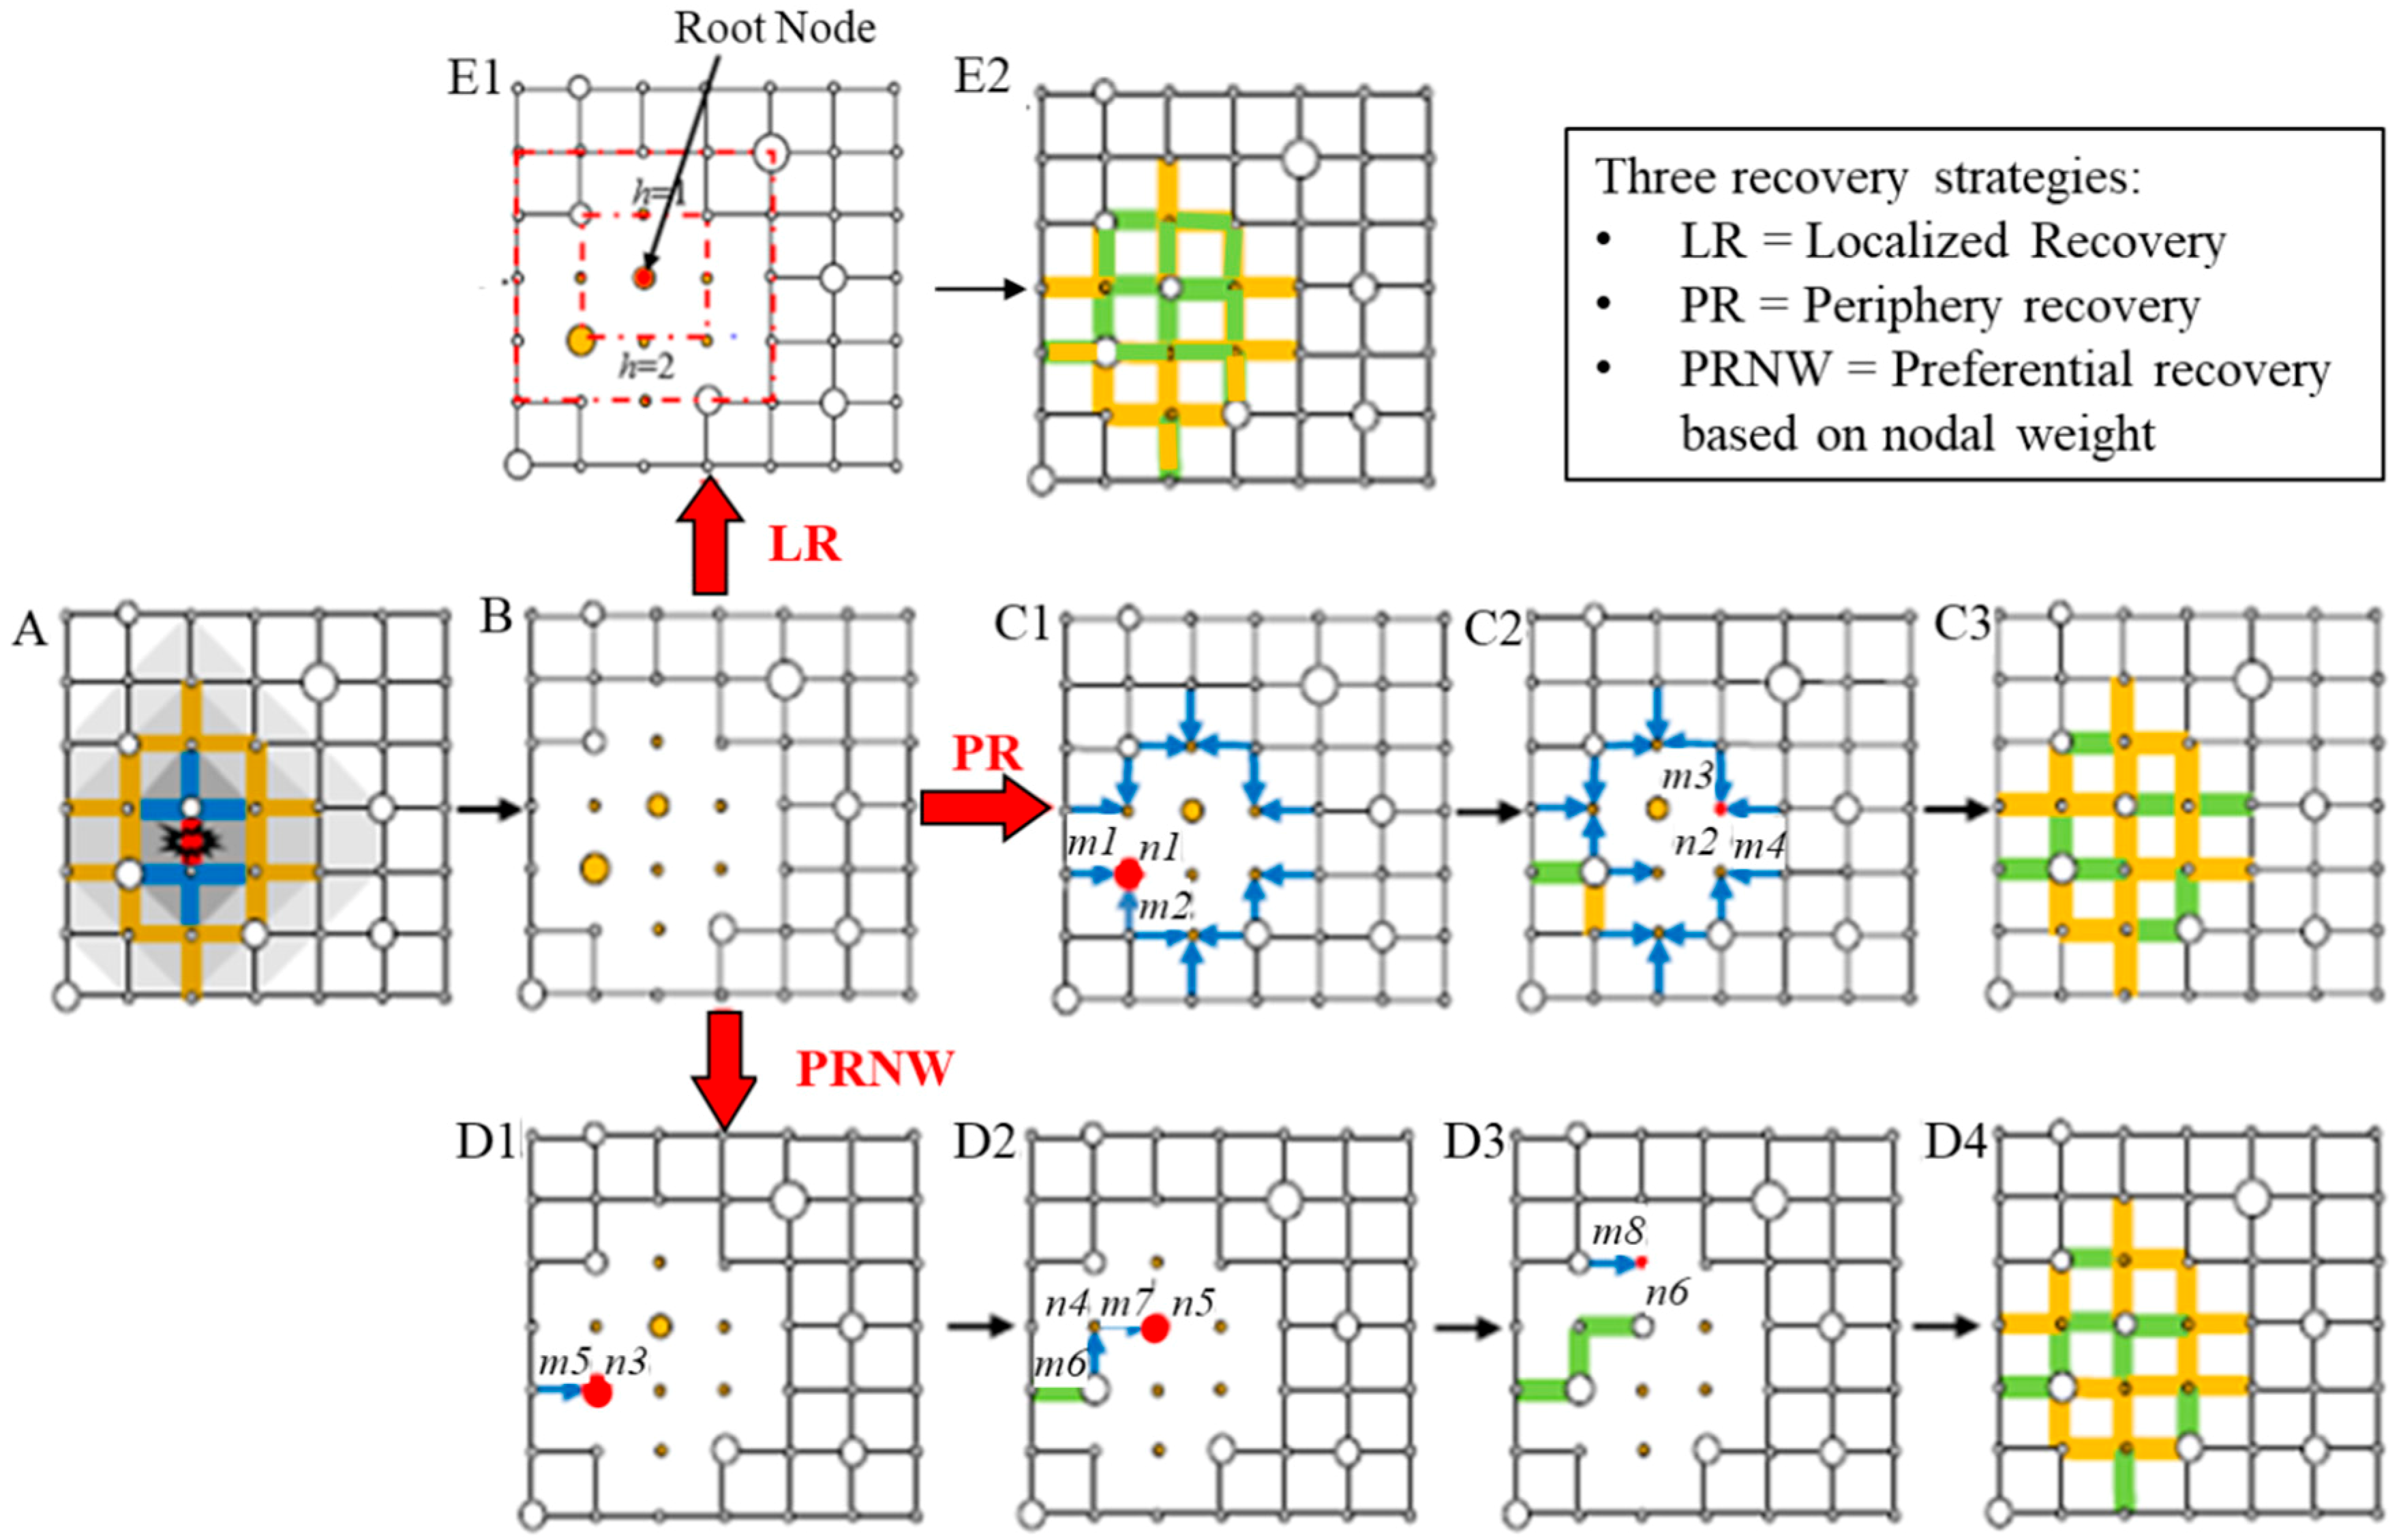
- Periphery recovery (PR). Recovery priorities are given to the most populated isolated node at the boundary [4]. In Figure 2(C1), the blue edges with arrowheads are the damaged edges adjacent to the functional components of the network. The red node n1 is the most populated boundary node of the functional network. According to this recovery rule, either edges m1 or m2 would be repaired first randomly. In this case, m1 is selected to be restored first and colored green. After all the isolated nodes are connected, m2 is repaired and colored yellow. At the next step, the node n2, in Figure 2(C2), is the most populated boundary node of the functional network, and either edge m3 or edge m4 is supposed to be repaired randomly. The process would be iterated until all the isolated nodes were connected to the functional network, as shown in Figure 2(C3). At last, the yellow edges are repaired randomly one by one until all are repaired.
- Preferential recovery based on nodal weight (PRNW). In this method, the repair preference is given to the links that could connect the most populated isolated nodes to the functional component of the network [4]. In Figure 2(D1), the red node n3 has the largest population among all the isolated nodes, and edge m5 connects edge n3 to the network. According to the PRNW algorithm, edge m5 is repaired first and colored green. Following the same procedure, the most populated node—n5—is connected to the functional network through the edges m6 and m7 in Figure 2(D2) and m8 in Figure 2(D3). The steps are iterated until all the isolated nodes are connected to the network, as shown in Figure 2(D4). At last, the yellow edges are repaired randomly one by one until all edges are repaired. PRNW shows high efficiency in connecting the most populated area reducing the recovery time. It can also provide a rational solution while limited resources are available.
- Localized recovery (LR). A localized recovery is where the priority of being recovered is given to the edges of a root node as well as its neighboring nodes, respectively [35]. This recovery process begins with the selection of root nodes. The rest of the nodes are listed in order of their distance from the root node as shown in Figure 2(E1). Nodes being in the same distance from the root node are placed in the same shell. The edges of the root node are recovered first with the edges connected to it. Then the nodes in the same shell h are randomly selected and their edges are further recovered. After all the nodes in the first shell h = 1 are recovered, recovery in the next shell h + 1 starts. The recovery process stops when all the edges are recovered, as shown in Figure 2(E2).
2.3. Resilience-Based Recovery Assessments Framework
3. Infrastructure Resilience
3.1. Resilience Metric
3.2. Resilience Optimization
4. Water Supply Network Case Study
4.1. Case Study Description
4.2. Multiobjective Optimization
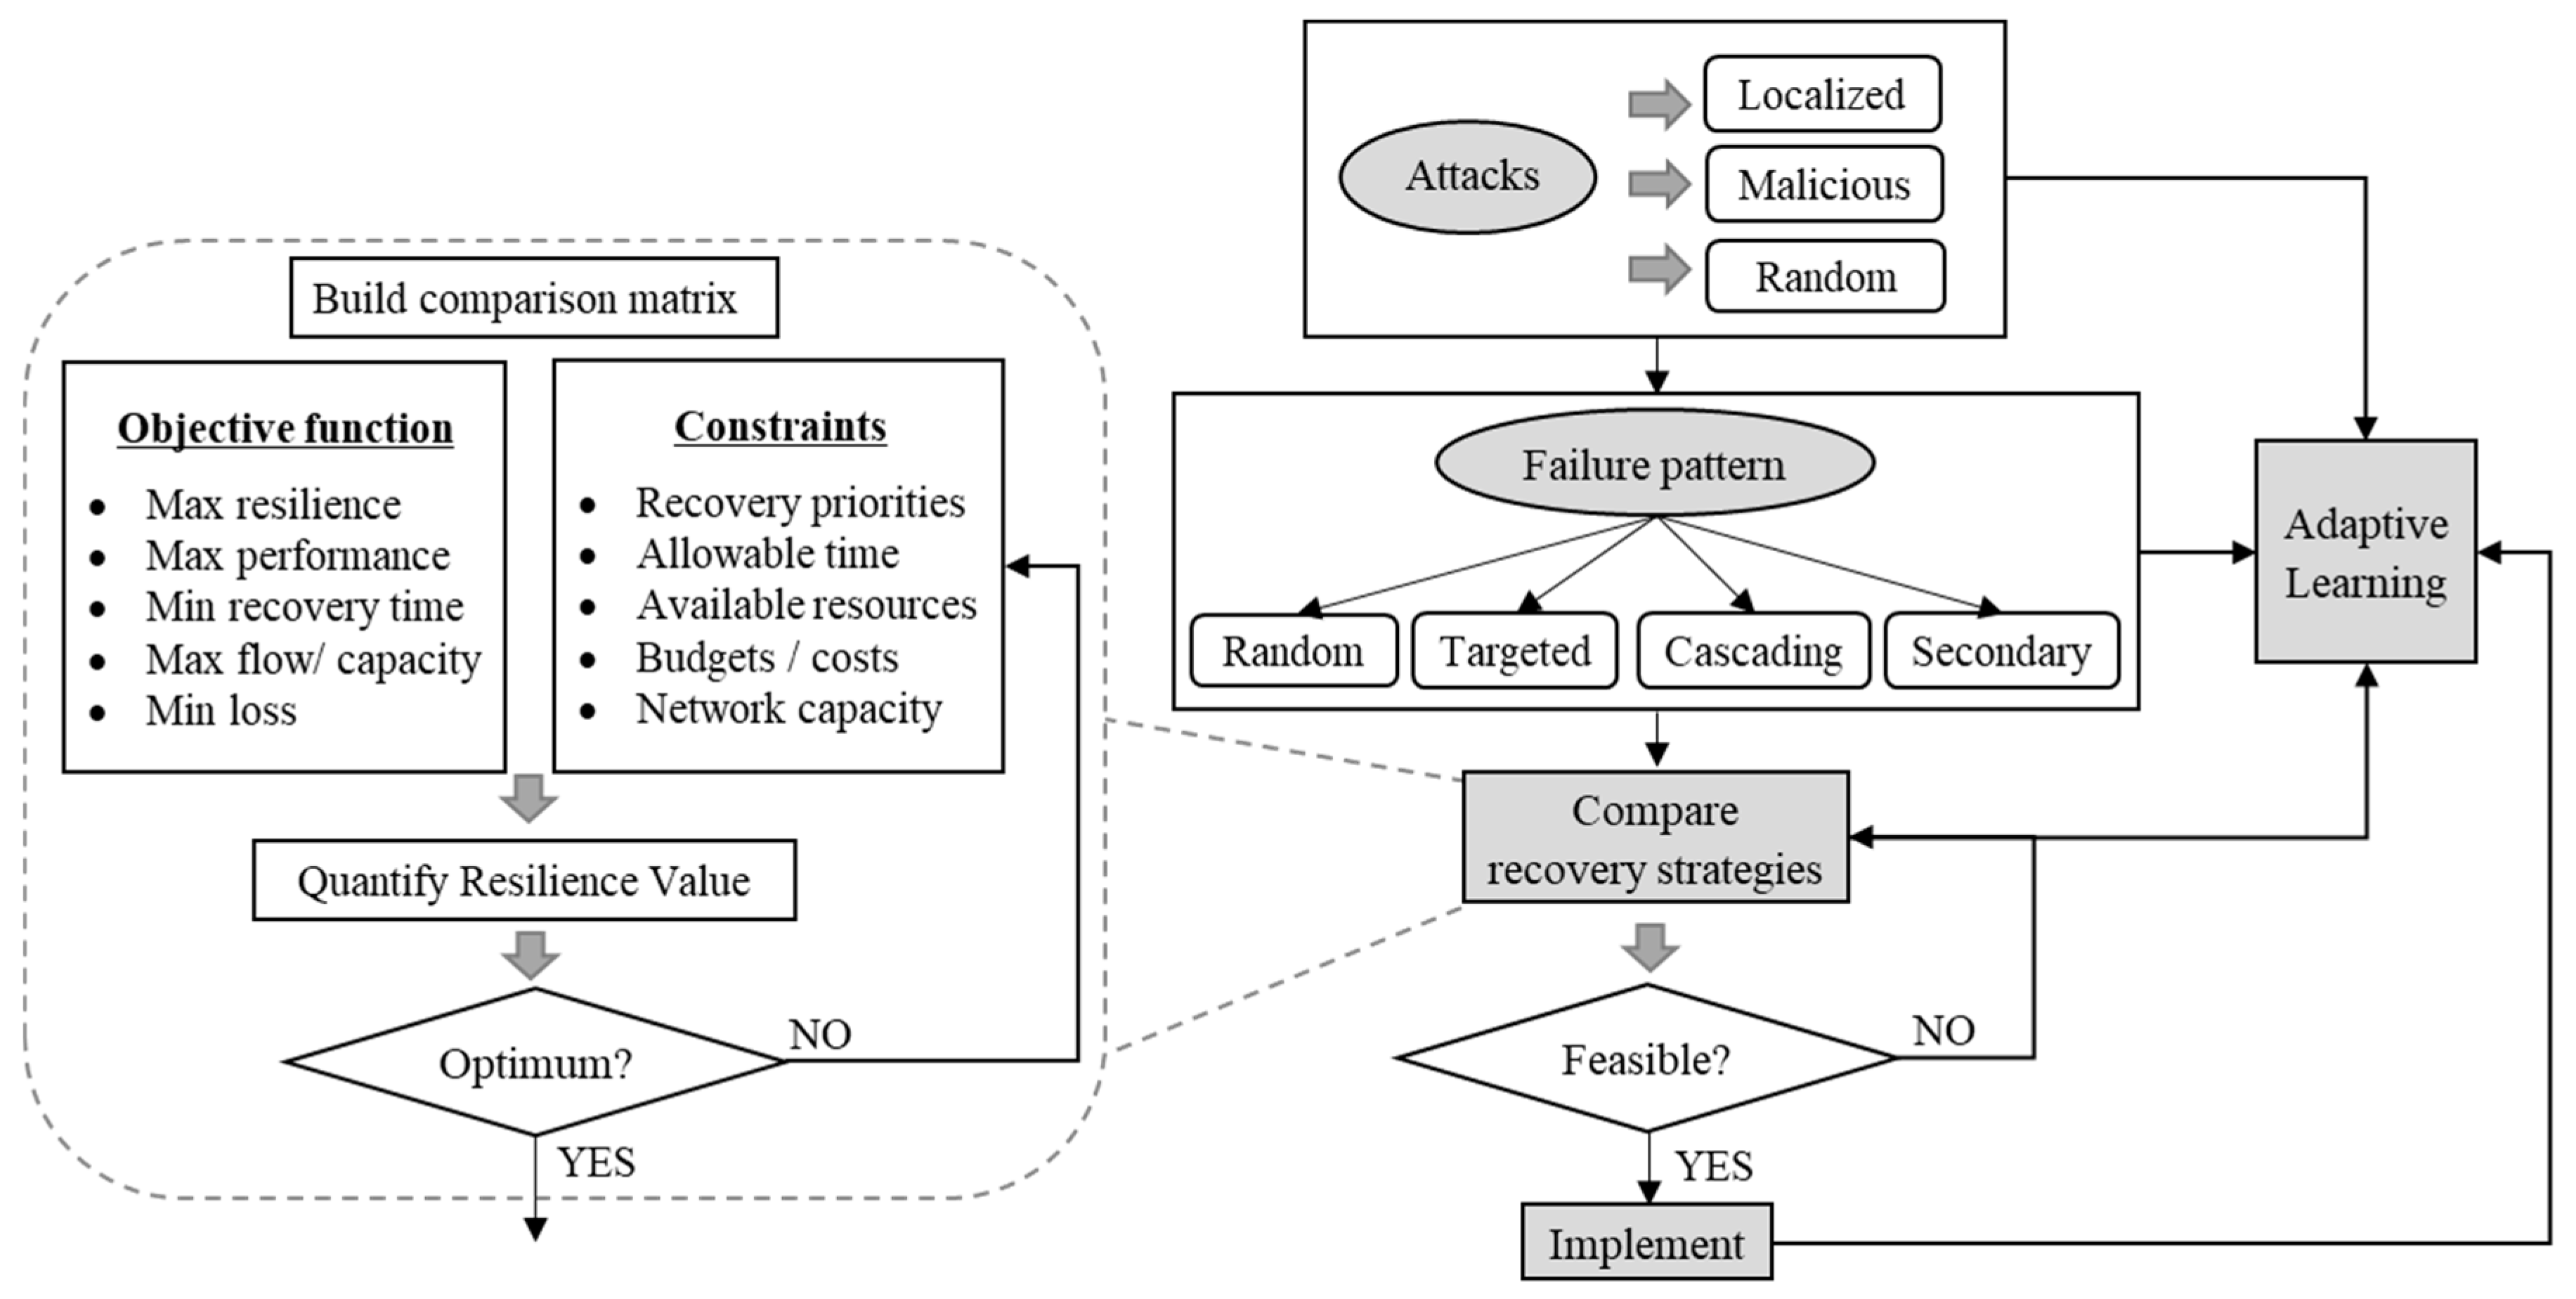
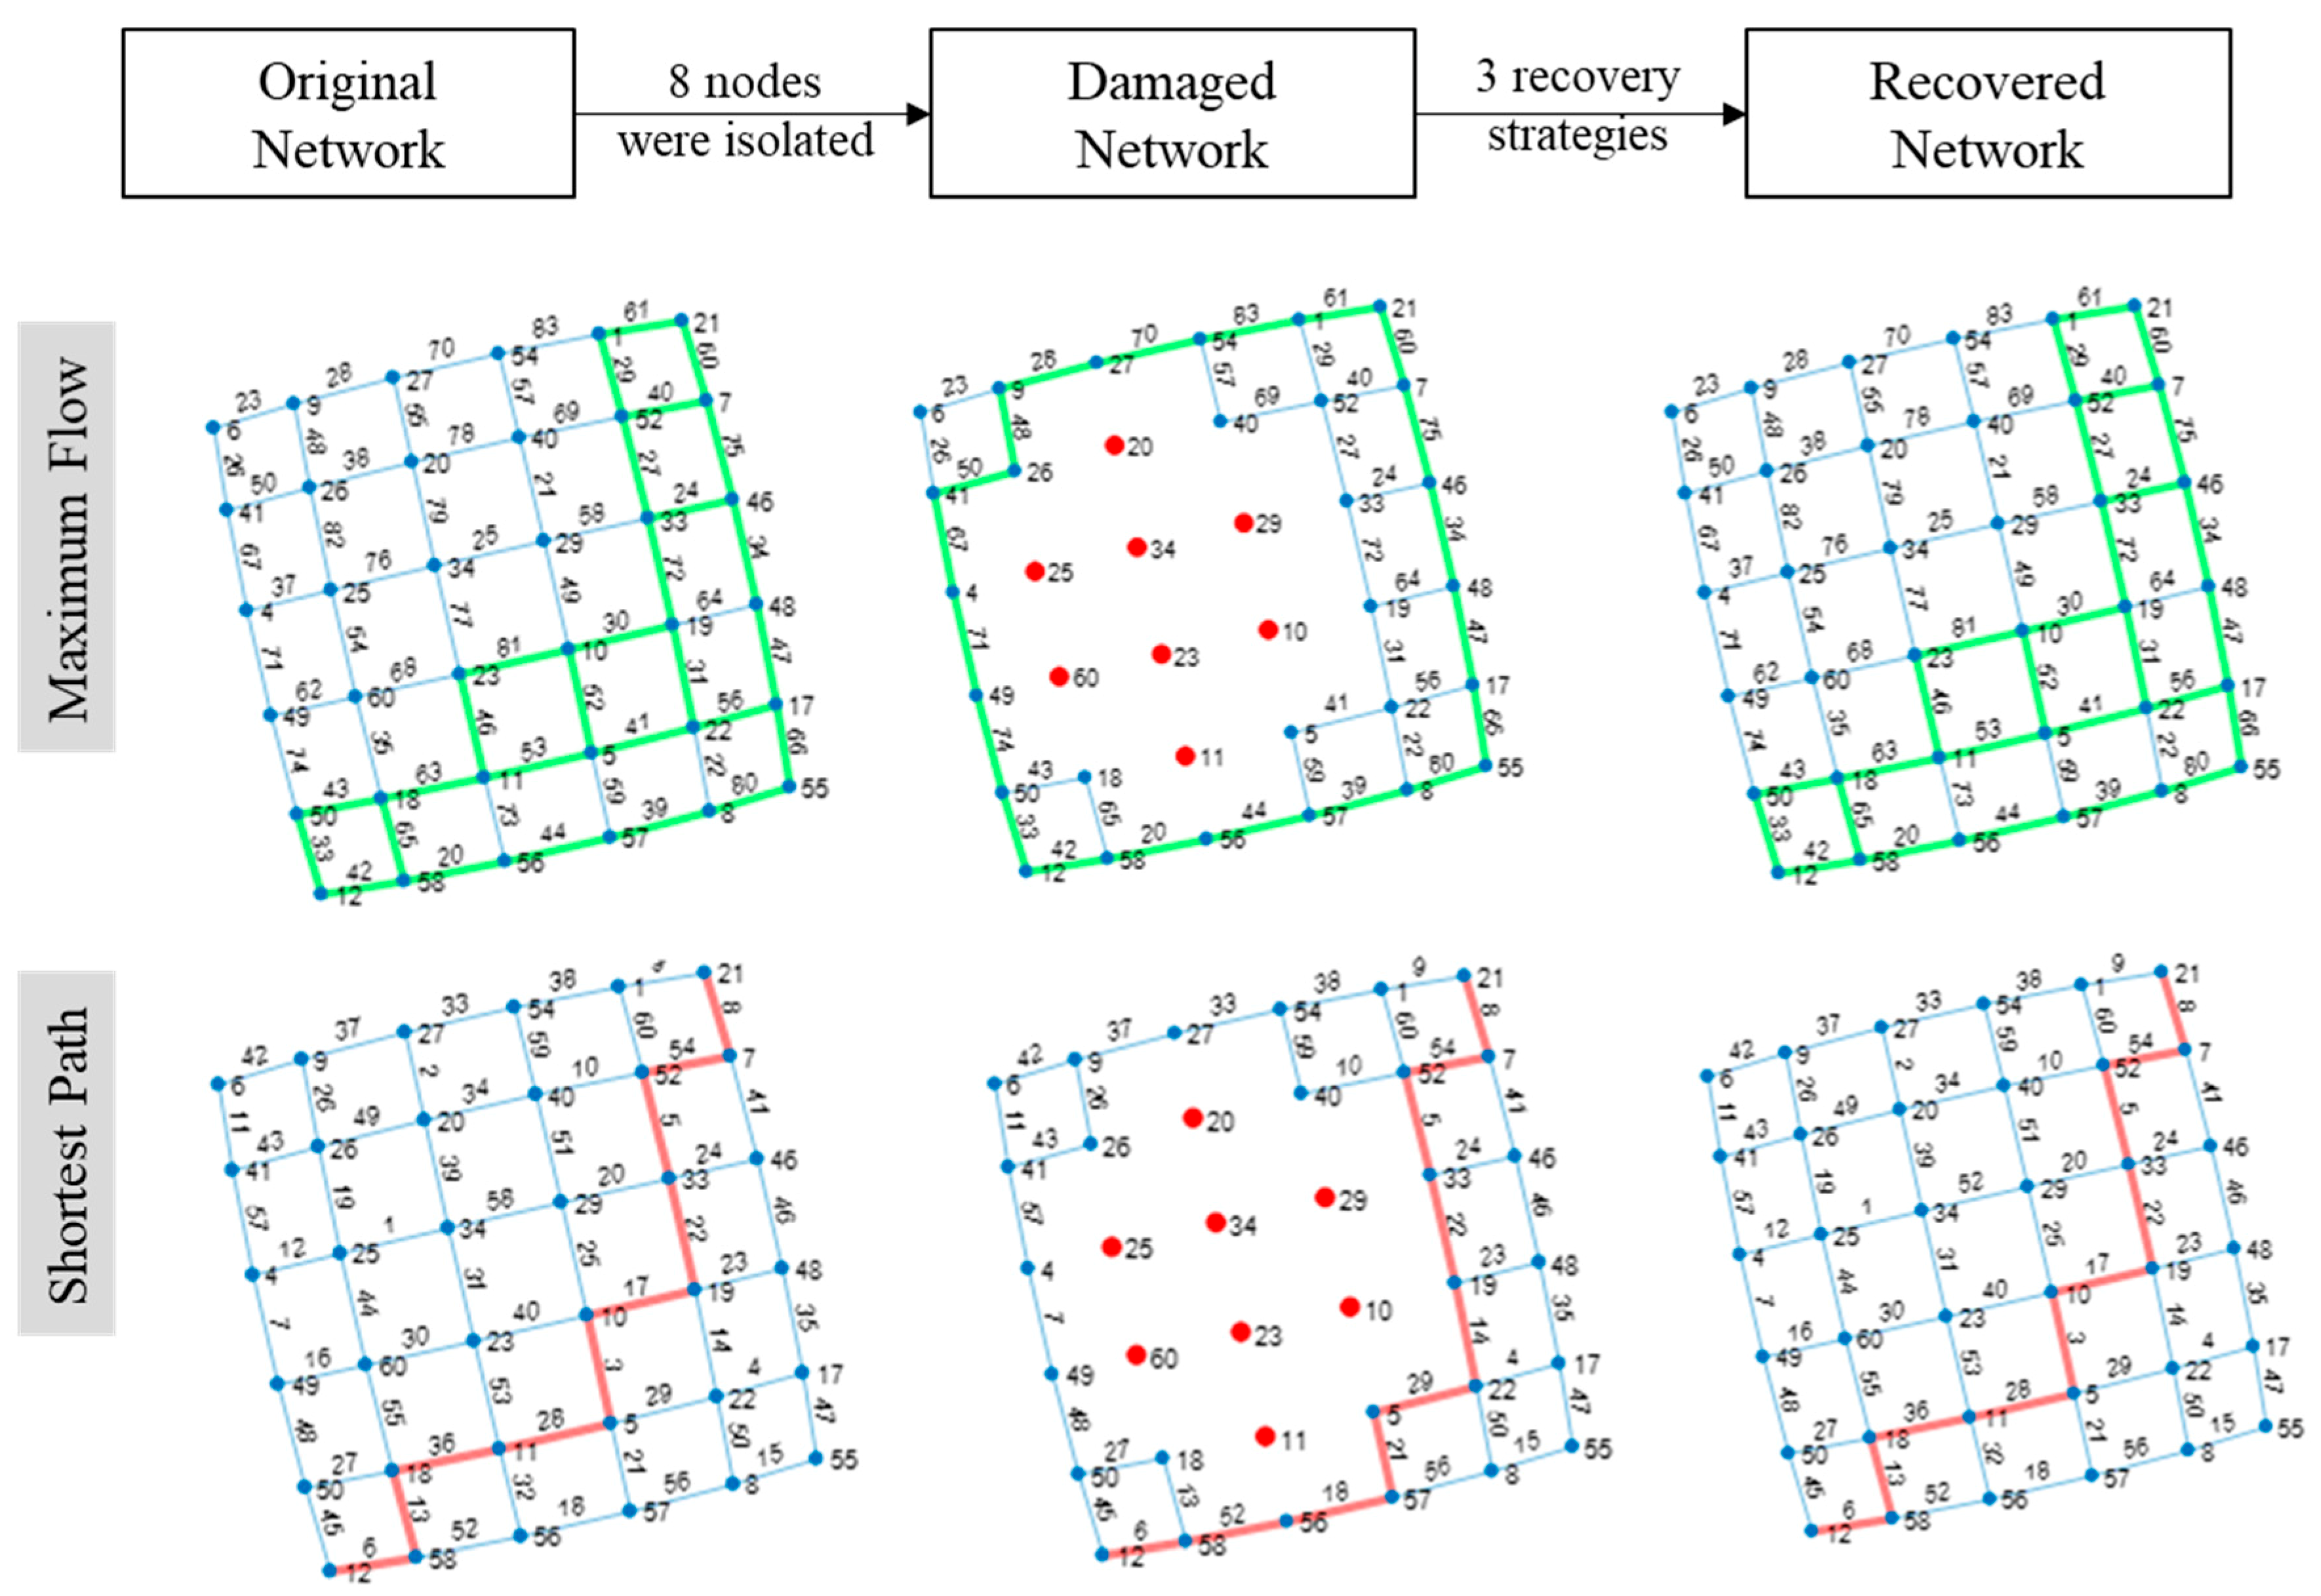
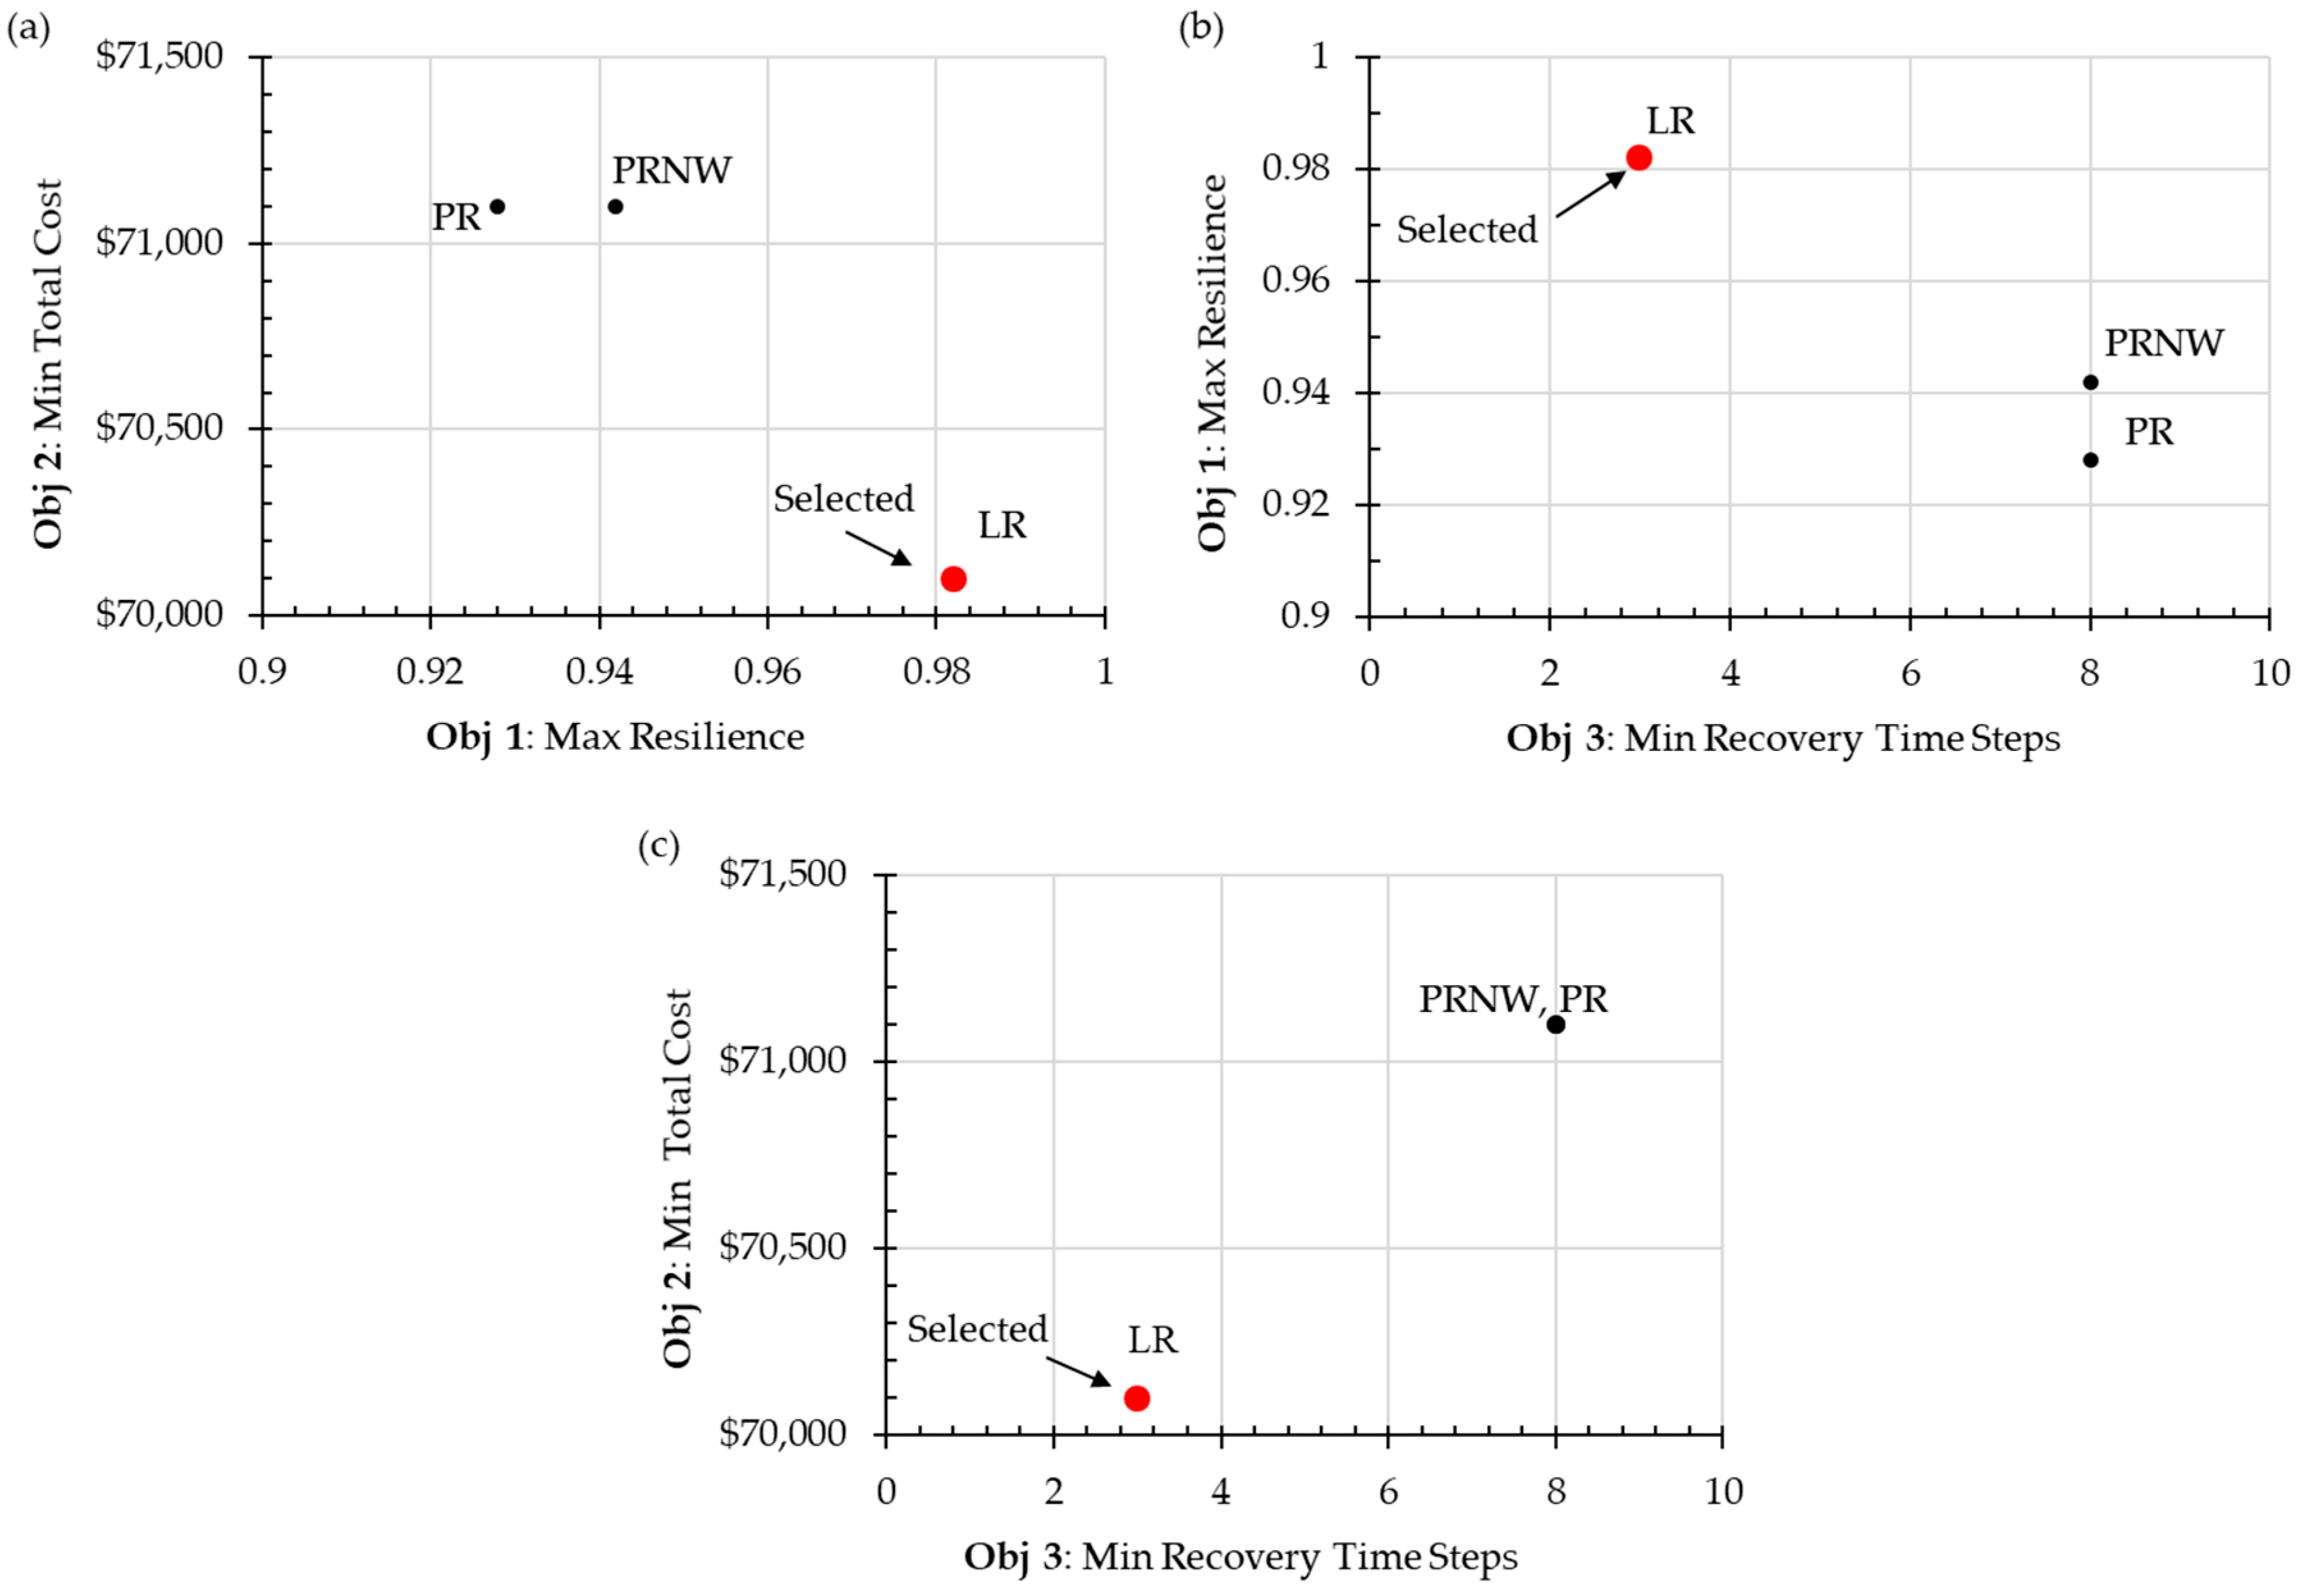
- Objective Function 1: Maximize resilience. The aim of the first objective function is to maximize the overall system resilience by applying the recovery strategy. Here, R was used as the resilience metric. Both maximum flow and the shortest path were considered as the performance measure. For all three recovery strategies, system resilience was quantified, and a recovery strategy was selected based on the highest resilience level.
- Objective Function 2: Minimize cost. The overall recovery cost is minimized by this objective function. For this purpose, the recovery cost at each time step was calculated based on the weight of the edges that need to be recovered. An amount of $200 was assumed to be the fixed cost for each time step of the recovery process. Additionally, the cost of $100 for repairing each unit of edges was added to find the total cost. The strategy with the lowest cost was selected.
- Objective Function 3: Minimize time or number of iterations. Through the third objective function the fastest recovery process was selected (the smallest number of iterations to full recovery).
- Integrated objective: To solve the multiobjective formulation, an integrated objective function, combining Objectives 1–3, is shown in Equation (13).
4.3. Results and Discussion
5. Conclusions
Author Contributions
Funding
Conflicts of Interest
References
- Bocchini, P.; Frangopol, D.M.; Ummenhofer, T.; Zinke, T. Resilience and sustainability of civil infrastructure: Toward a unified approach. J. Infrastruct. Syst. 2013, 20, 04014004. [Google Scholar] [CrossRef]
- Mattsson, L.-G.; Jenelius, E. Vulnerability and resilience of transport systems—A discussion of recent research. Transp. Res. Part A Policy Pract. 2015, 81, 16–34. [Google Scholar] [CrossRef]
- Hu, F.; Yeung, C.H.; Yang, S.; Wang, W.; Zeng, A. Recovery of infrastructure networks after localized attacks. Sci. Rep. 2016, 6, 24522. [Google Scholar] [CrossRef] [PubMed]
- Linkov, I.; Bridges, T.; Creutzig, F.; Decker, J.; Fox-Lent, C.; Kröger, W.; Lambert, J.H.; Levermann, A.; Montreuil, B.; Nathwani, J.; et al. Changing the resilience paradigm. Nat. Clim. Change 2014, 4, 407. [Google Scholar] [CrossRef]
- Ganin, A.A.; Kitsak, M.; Marchese, D.; Keisler, J.M.; Seager, T.; Linkov, I. Resilience and efficiency in transportation networks. Sci. Adv. 2017, 3, e1701079. [Google Scholar] [CrossRef] [PubMed]
- Adams, T.M.; Bekkem, K.R.; Toledo-Durán, E.J. Freight resilience measures. J. Transp. Eng. 2012, 138, 1403–1409. [Google Scholar] [CrossRef]
- Uday, P.; Marais, K. Designing resilient systems-of-systems: A survey of metrics, methods, and challenges. Syst. Eng. 2015, 18, 491–510. [Google Scholar] [CrossRef]
- Yodo, N.; Wang, P. A control-guided failure restoration framework for the design of resilient engineering systems. Reliab. Eng. Syst. Saf. 2018, 178, 179–190. [Google Scholar] [CrossRef]
- Ouyang, M.; Dueñas-Osorio, L.; Min, X. A three-stage resilience analysis framework for urban infrastructure systems. Struct. Saf. 2012, 36, 23–31. [Google Scholar] [CrossRef]
- Whitson, J.C.; Ramirez-Marquez, J.E. Resiliency as a component importance measure in network reliability. Reliab. Eng. Syst. Saf. 2009, 94, 1685–1693. [Google Scholar] [CrossRef]
- Yodo, N.; Wang, P. Engineering resilience quantification and system design implications: A literature survey. J. Mech. Design 2016, 138, 1–13. [Google Scholar] [CrossRef]
- Aydin, N.Y.; Duzgun, H.S.; Heinimann, H.R.; Wenzel, F.; Gnyawali, K.R. Framework for improving the resilience and recovery of transportation networks under geohazard risks. Int. J. Disaster Risk Reduct. 2018, 31, 832–843. [Google Scholar] [CrossRef]
- Cox, A.; Prager, F.; Rose, A. Transportation security and the role of resilience: A foundation for operational metrics. Transp. Policy 2011, 18, 307–317. [Google Scholar] [CrossRef]
- Wang, J.; Muddada, R.R.; Wang, H.; Ding, J.; Lin, Y.; Liu, C.; Zhang, W. Toward a resilient holistic supply chain network system: Concept, review and future direction. IEEE Syst. J. 2016, 10, 410–421. [Google Scholar] [CrossRef]
- Munoz, A.; Dunbar, M. On the quantification of operational supply chain resilience. Int. J. Prod. Res. 2015, 53, 6736–6751. [Google Scholar] [CrossRef]
- Yodo, N.; Wang, P. Resilience analysis for complex supply chain systems using bayesian betworks. In Proceedings of the 54th AIAA Aerospace Sciences Meeting, San Diego, CA, USA, 4–8 January 2016; p. 0474. [Google Scholar]
- Attoh-Okine, N.O.; Cooper, A.T.; Mensah, S.A. Formulation of resilience index of urban infrastructure using belief functions. IEEE Syst. J. 2009, 3, 147–153. [Google Scholar] [CrossRef]
- Borsekova, K.; Nijkamp, P.; Guevara, P. Urban resilience patterns after an external shock: An exploratory study. Int. J. Disaster Risk Reduct. 2018, 31, 381–392. [Google Scholar] [CrossRef]
- Wang, J.; Liu, H. Snow removal resource location and allocation optimization for urban road network recovery: A resilience perspective. J. Ambient Intell. Humaniz. Comput. 2018, 10, 395–408. [Google Scholar] [CrossRef]
- Murray-Tuite, P.M. A comparison of transportation network resilience under simulated system optimum and user equilibrium conditions. In Proceedings of the 2006 Winter Simulation Conference, Monterey, CA, USA, 3–6 December 2006; pp. 1398–1405. [Google Scholar]
- Dong, Y.; Frangopol, D.M. Risk and resilience assessment of bridges under mainshock and aftershocks incorporating uncertainties. Eng. Struct. 2015, 83, 198–208. [Google Scholar] [CrossRef]
- Zorn, C.R.; Shamseldin, A.Y. Post-disaster infrastructure restoration: A comparison of events for future planning. Int. J. Disaster Risk Reduct. 2015, 13, 158–166. [Google Scholar] [CrossRef]
- Liao, T.-Y.; Hu, T.-Y.; Ko, Y.-N. A resilience optimization model for transportation networks under disasters. Nat. Hazards 2018, 93, 469–489. [Google Scholar] [CrossRef]
- Losada, C.; Scaparra, M.P.; O’Hanley, J.R. Optimizing system resilience: A facility protection model with recovery time. Eur. J. Oper. Res. 2012, 217, 519–530. [Google Scholar] [CrossRef]
- Turnquist, M.; Vugrin, E. Design for resilience in infrastructure distribution networks. Environ. Syst. Decis. 2013, 33, 104–120. [Google Scholar] [CrossRef]
- Figueroa-Candia, M.; Felder, F.A.; Coit, D.W. Resiliency-based optimization of restoration policies for electric power distribution systems. Electr. Power Syst. Res. 2018, 161, 188–198. [Google Scholar] [CrossRef]
- Margolis, J.T.; Sullivan, K.M.; Mason, S.J.; Magagnotti, M. A multi-objective optimization model for designing resilient supply chain networks. Int. J. Prodt. Econ. 2018, 204, 174–185. [Google Scholar] [CrossRef]
- Almoghathawi, Y.; Barker, K.; Albert, L.A. Resilience-driven restoration model for interdependent infrastructure networks. Reliab. Eng. Syst. Saf. 2019, 185, 12–23. [Google Scholar] [CrossRef]
- Fang, Y.-P.; Sansavini, G. Optimum post-disruption restoration under uncertainty for enhancing critical infrastructure resilience. Reliab. Eng. Syst. Saf. 2019, 185, 1–11. [Google Scholar] [CrossRef]
- Ouyang, M. Critical location identification and vulnerability analysis of interdependent infrastructure systems under spatially localized attacks. Reliab. Eng. Syst. Saf. 2016, 154, 106–116. [Google Scholar] [CrossRef]
- Mathias, J.-D.; Clark, S.; Onat, N.; Seager, T. An integrated dynamical modeling perspective for infrastructure resilience. Infrastructures 2018, 3, 11. [Google Scholar] [CrossRef]
- Alderson, D.L.; Brown, G.G.; Carlyle, W.M.; Cox, L.A., Jr. Sometimes there is no “most-vital” arc: Assessing and improving the operational resilience of systems. Mil. Oper. Res. 2013, 18, 21–37. [Google Scholar] [CrossRef]
- Alderson, D.L.; Brown, G.G.; Carlyle, W.M. Operational models of infrastructure resilience. Risk Anal. 2015, 35, 562–586. [Google Scholar] [CrossRef]
- Alderson, D.L.; Brown, G.G.; Carlyle, W.M.; Wood, R.K. Assessing and improving the operational resilience of a large highway infrastructure system to worst-case losses. Transp. Sci. 2017, 52, 1012–1034. [Google Scholar] [CrossRef]
- Shang, Y. Localized recovery of complex networks against failure. Sci. Rep. 2016, 6, 30521. [Google Scholar] [CrossRef]
- Bruneau, M.; Chang, S.E.; Eguchi, R.T.; Lee, G.C.; O’Rourke, T.D.; Reinhorn, A.M.; Shinozuka, M.; Tierney, K.; Wallace, W.A.; Winterfeldt, D.V. A framework to quantitatively assess and enhance the seismic resilience of communities. Earthq. Spectra 2003, 19, 733–752. [Google Scholar] [CrossRef]
- Creaco, E.; Franchini, M.; Alvisi, S. Optimal placement of isolation valves in water distribution systems based on valve cost and weighted average demand shortfall. Water Resour. Manag. 2010, 24, 4317–4338. [Google Scholar] [CrossRef]

| Sets | Parameters | Decision Variables | |||
|---|---|---|---|---|---|
| r | Set of recovery strategies | R | Resilience | γr | Binary variable (1 if strategy r is selected, 0 otherwise) |
| PT | Targeted performance | ||||
| PR | Real performance | ||||
| AT | The area under the targeted performance curve | ||||
| AR | The area under the real performance curve | ||||
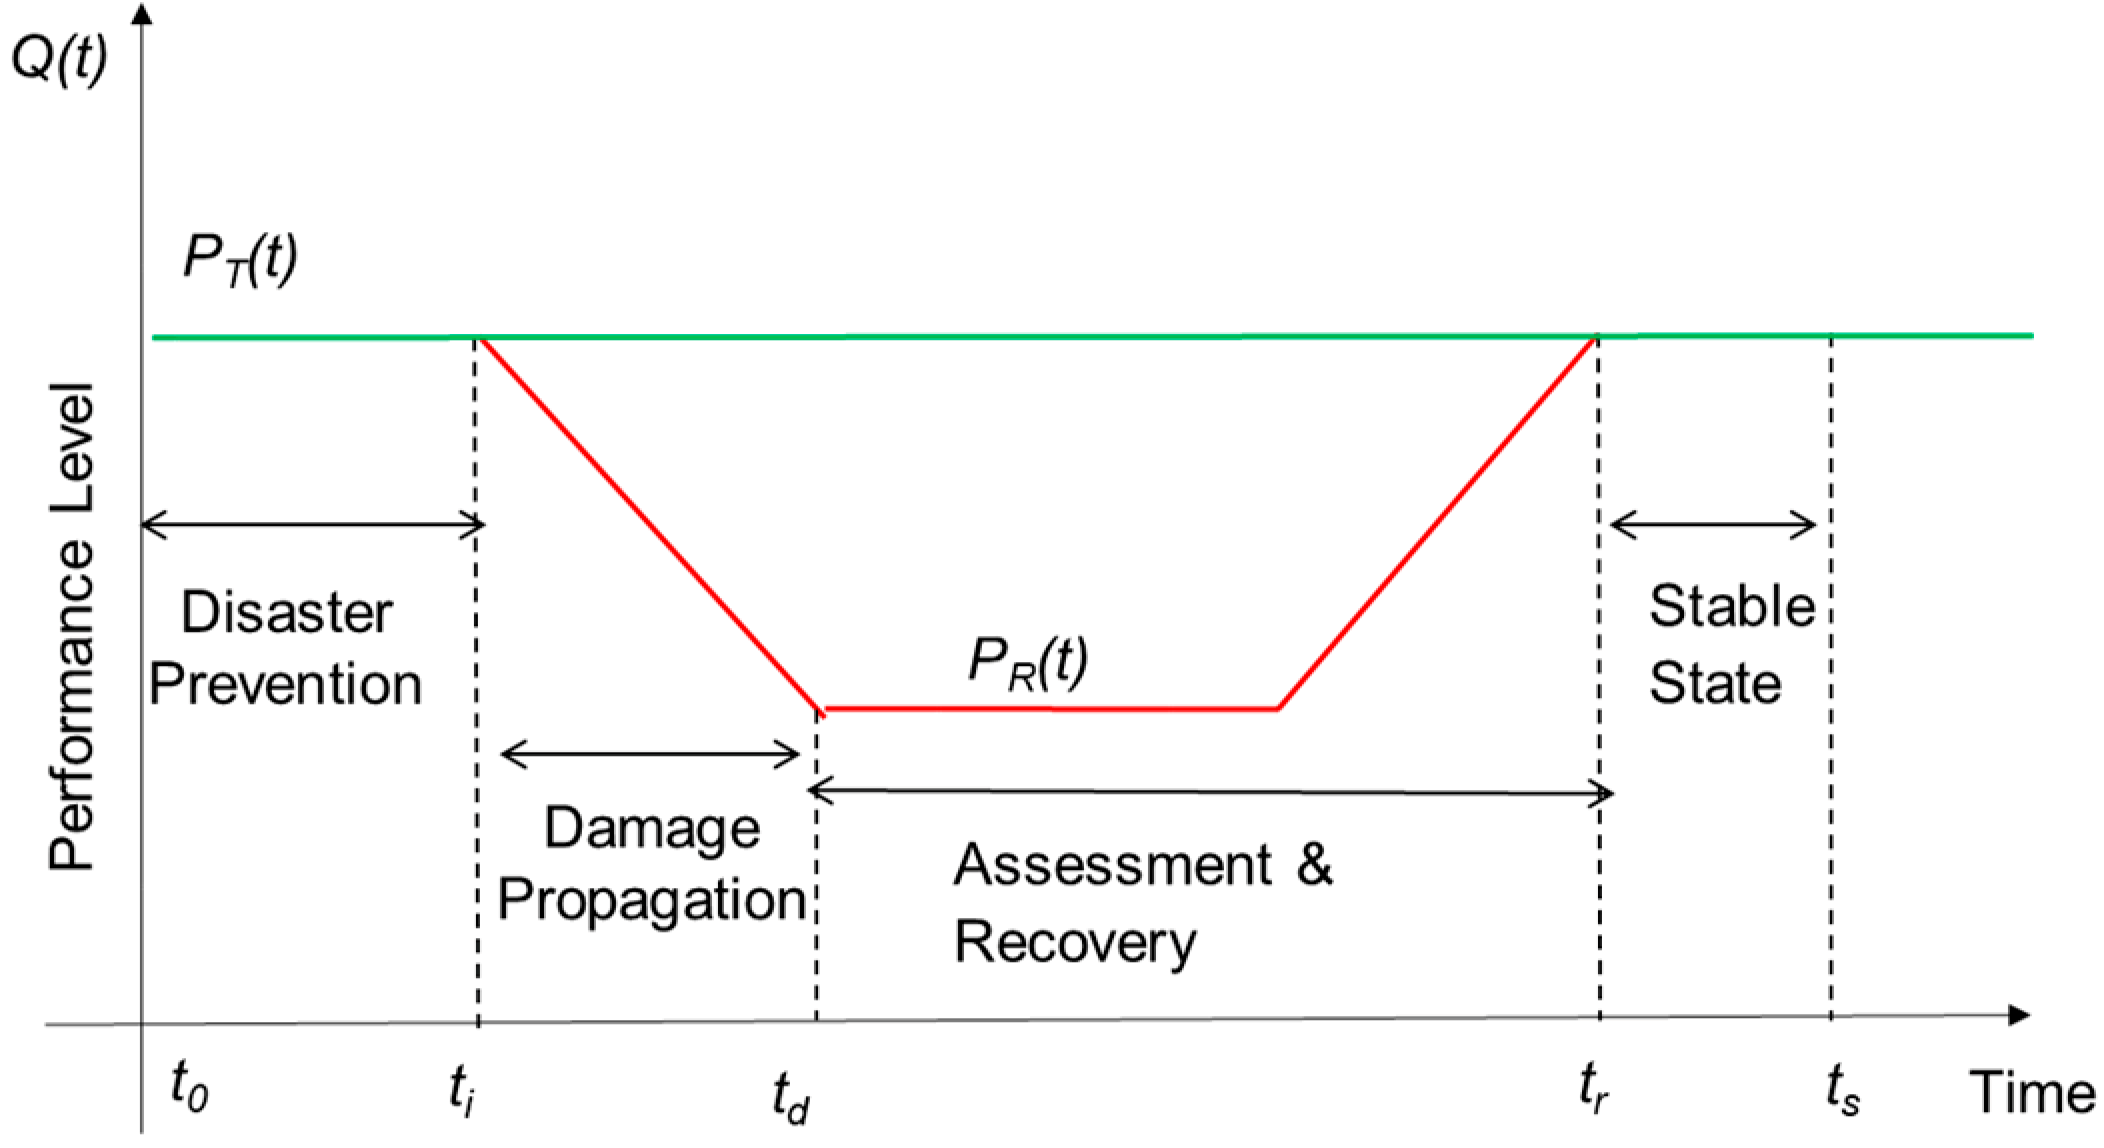
| t | Set of time steps | td | Time after the disaster stop propagating or the start of the recovery strategy | ||
| tr | Time at which the recovery is completed | ||||
| tt | Total recovery time required | ||||
| T | Maximum allowable time | ||||
| Ctr | Cost of recovery at time t for strategy r | ||||
| e | Set of edges to be repaired | Cf | Fixed cost to repair at each time step | ||
| Ce | Cost for repairing edge e | ||||
| Wet | Total edge weight recovered at time t | ||||
| C | Total cost for strategy r | ||||
| B | Budget | ||||
| Time | Critical Performance | Description | |
|---|---|---|---|
| Max flow | Shortest Path | ||
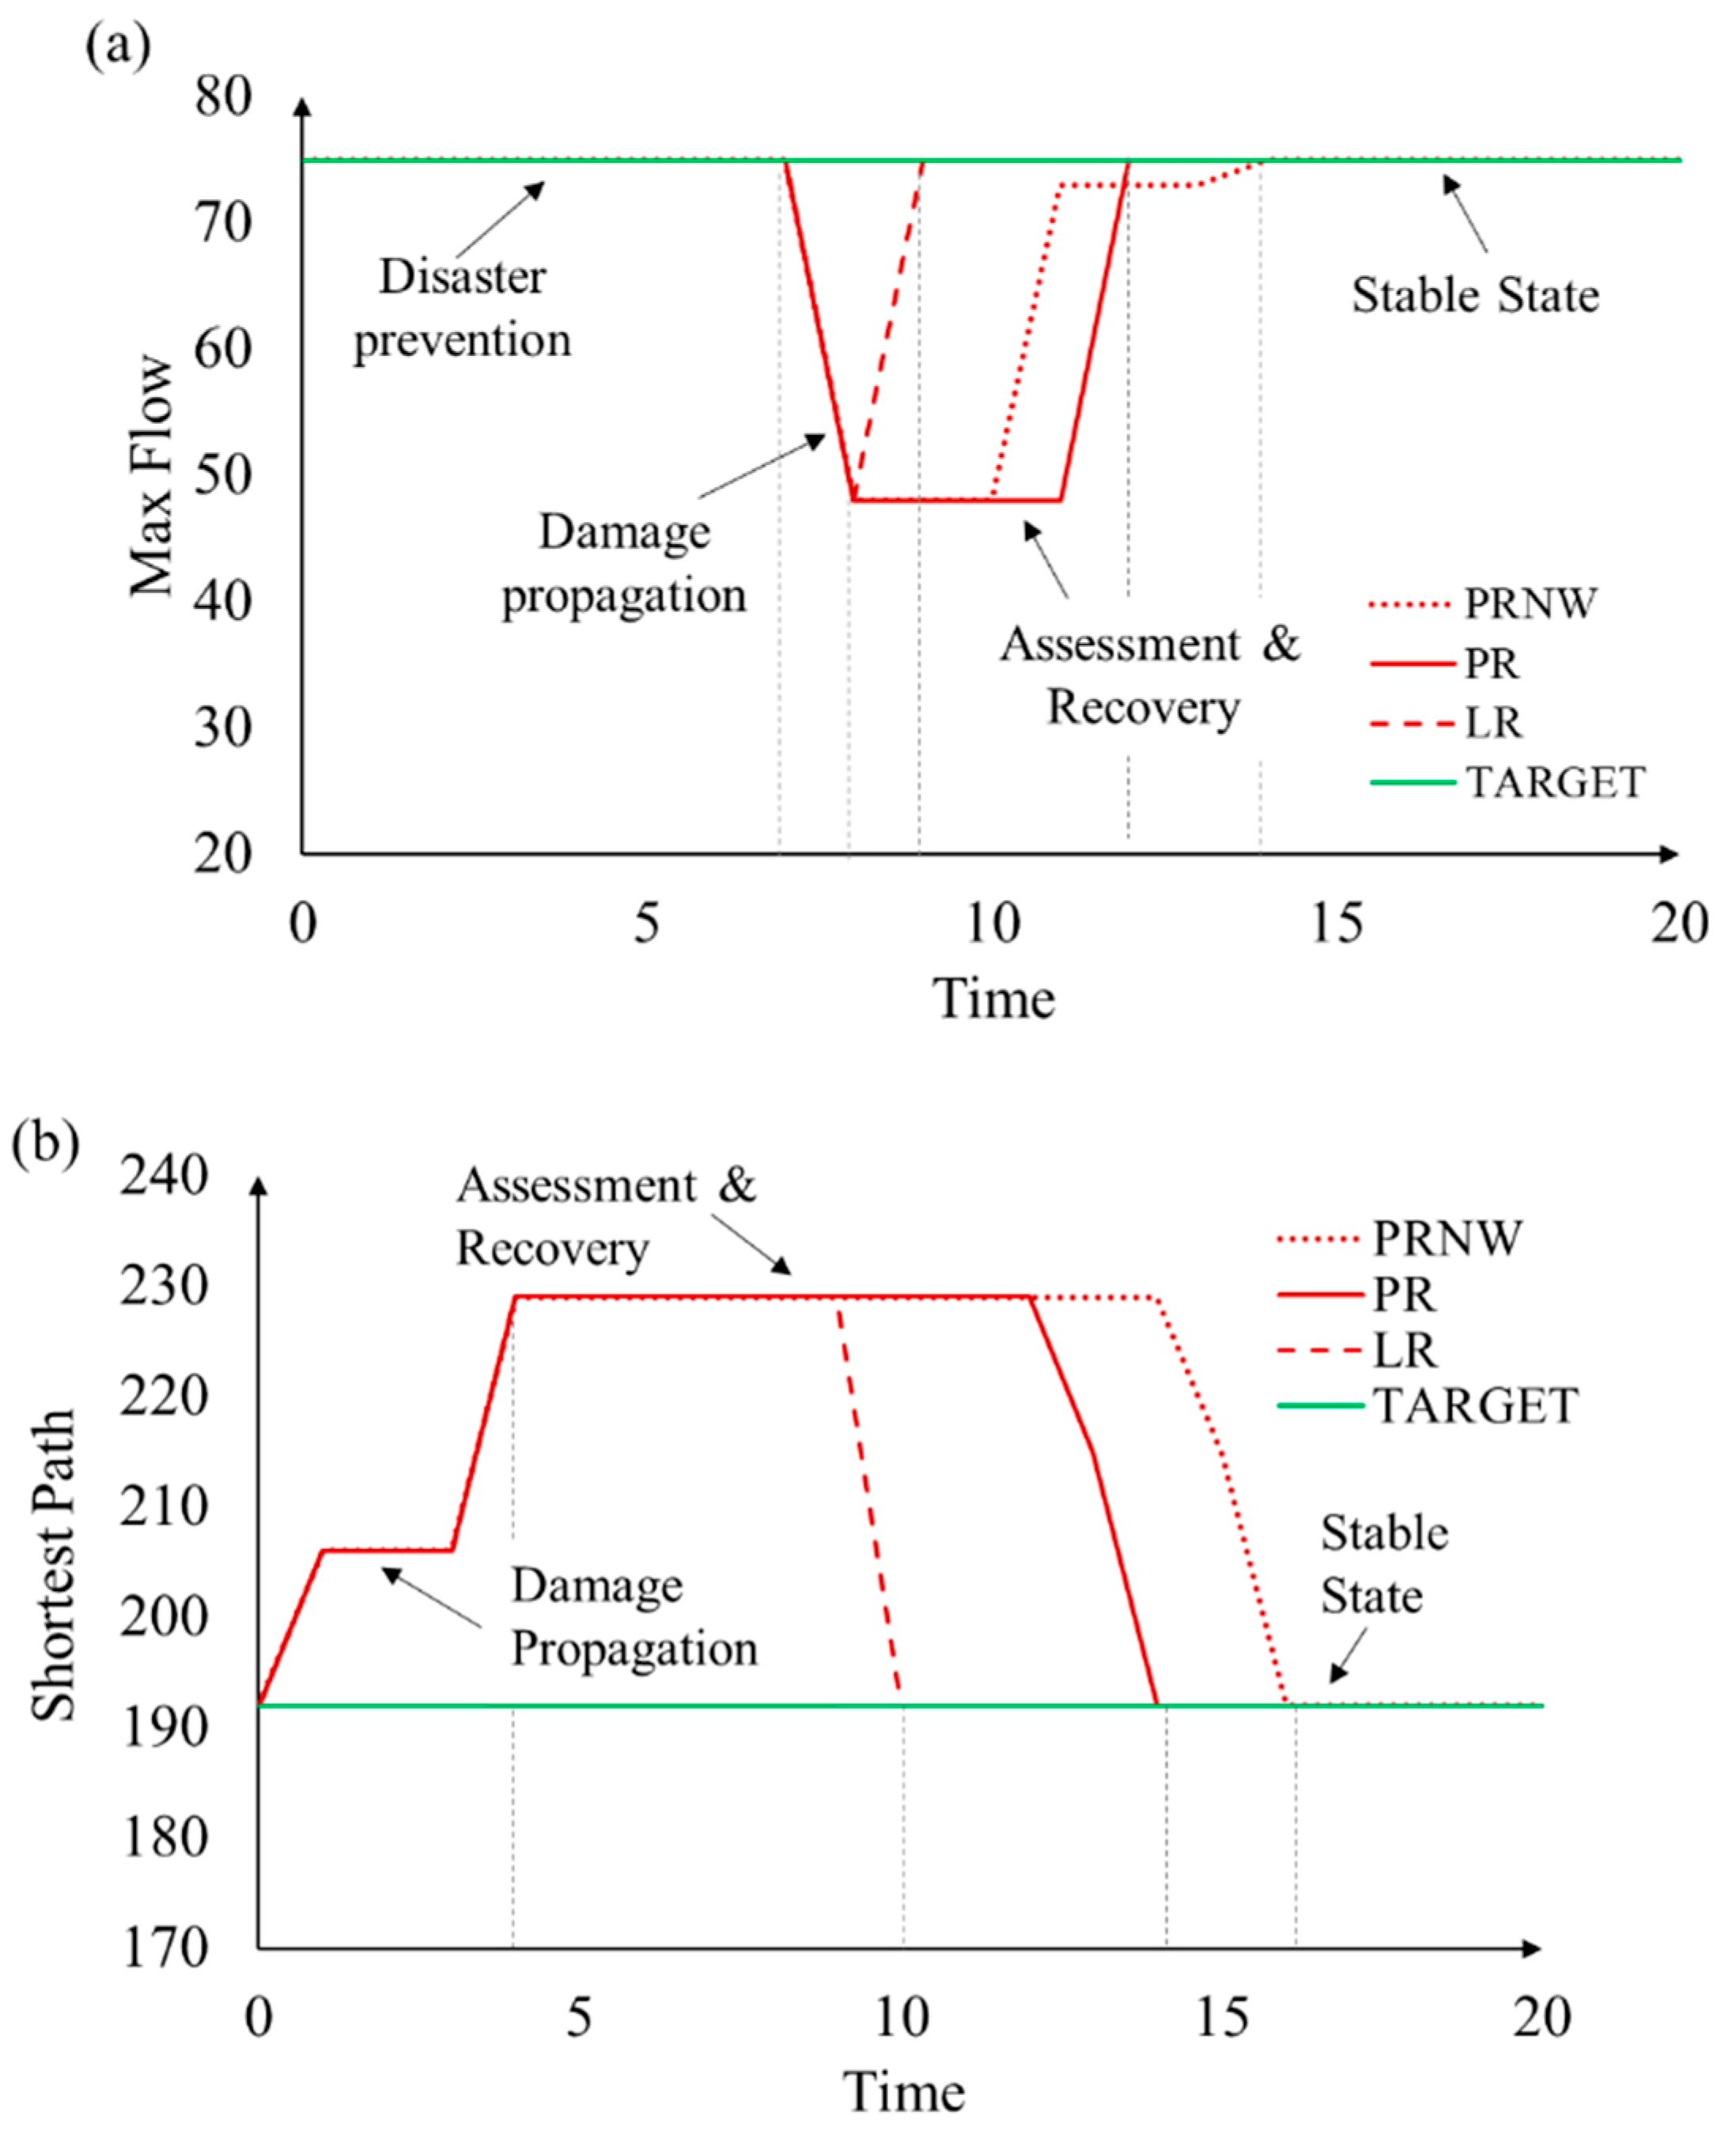
| 0 | 75 | 192 | Original state |
| 1 * | 75 | 206 | 1 node was isolated |
| 2 | 75 | 206 | 2 nodes were isolated |
| 3 | 75 | 206 | 3 nodes were isolated |
| 4 | 75 | 229 | 4 nodes were isolated |
| 5 | 75 | 229 | 5 nodes were isolated |
| 6 | 75 | 229 | 6 nodes were isolated |
| 7 | 75 | 229 | 7 nodes were isolated |
| 8 ** | 48 | 229 | 8 nodes were isolated |
| Time | PRNW ** | PR ** | LR *** | |||
|---|---|---|---|---|---|---|
| Max Flow | Shortest Path | Max Flow | Shortest Path | Max Flow | Shortest Path | |
| 9 * | 48 | 229 | 48 | 229 | 75 | 229 |
| 10 | 48 | 229 | 48 | 229 | 75 | 192 |
| 11 | 73 | 229 | 48 | 229 | 75 | 192 |
| 12 | 73 | 229 | 75 | 229 | 75 | 192 |
| 13 | 73 | 229 | 75 | 215 | 75 | 192 |
| 14 | 75 | 229 | 75 | 192 | 75 | 192 |
| 15 | 75 | 215 | 75 | 192 | 75 | 192 |
| 16 | 75 | 192 | 75 | 192 | 75 | 192 |
| 17 | 75 | 192 | 75 | 192 | 75 | 192 |
| 18 | 75 | 192 | 75 | 192 | 75 | 192 |
| 19 | 75 | 192 | 75 | 192 | 75 | 192 |
| 20 | 75 | 192 | 75 | 192 | 75 | 192 |
| PRNW | PR | LR | ||||
|---|---|---|---|---|---|---|
| Max Flow | Shortest Path | Max Flow | Shortest Path | Max Flow | Shortest Path | |
| AR | 1413 | 4312 | 1392 | 4238 | 1473 | 4104 |
| AT | 1500 | 3840 | 1500 | 3840 | 1500 | 3840 |
| R | 0.94 | 1.12 | 0.93 | 1.1 | 0.98 | 1.07 |
| Time Steps | Cost ($) | ||
|---|---|---|---|
| PRNW | PR | LR | |
| 1–8 | Damage Propagation Stage | ||
| 9 | 7300 | 7300 | 42,300 |
| 10 | 4700 | 7300 | 24,400 |
| 11 | 13,100 | 7700 | 3400 |
| 12 | 3300 | 8700 | 0 |
| 13 | 6300 | 9800 | 0 |
| 14 | 12,600 | 4700 | 0 |
| 15 | 15,100 | 10,000 | 0 |
| 16 | 8,700 | 15,600 | 0 |
| Total | 71,100 | 71,100 | 70,100 |
| Time Step | PRNW | PR | LR | |||
|---|---|---|---|---|---|---|
| Recovered Edges * | Sum of Weights | Recovered Edges * | Sum of Weights | Recovered Edges * | Sum of Weights | |
| 9 | 23, 15 | 71 | 23, 15 | 71 | 28, 36, 38, 39, 25, 27, 26, 30, 37, 47, 41, 49 | 421 |
| 10 | 26, 36 | 45 | 40, 41 | 71 | 14, 16, 15, 17, 19, 23, 29, 34, 40, 50 | 242 |
| 11 | 38, 40, 41 | 129 | 26, 34, 37 | 75 | 6 | 32 |
| 12 | 34, 37 | 31 | 47, 49, 50 | 85 | ||
| 13 | 25, 28 | 61 | 6, 14, 16 | 96 | ||
| 14 | 39, 47, 49, 50 | 124 | 19, 29, 30 | 45 | ||
| 15 | 6, 14, 16, 17 | 149 | 36, 38, 39 | 98 | ||
| 16 | 19, 27, 29, 30 | 85 | 17, 25, 27, 28 | 154 | ||
| 17–20 | Stable State | |||||
© 2019 by the authors. Licensee MDPI, Basel, Switzerland. This article is an open access article distributed under the terms and conditions of the Creative Commons Attribution (CC BY) license (http://creativecommons.org/licenses/by/4.0/).
Share and Cite
Afrin, T.; Yodo, N. Resilience-Based Recovery Assessments of Networked Infrastructure Systems under Localized Attacks. Infrastructures 2019, 4, 11. https://doi.org/10.3390/infrastructures4010011
Afrin T, Yodo N. Resilience-Based Recovery Assessments of Networked Infrastructure Systems under Localized Attacks. Infrastructures. 2019; 4(1):11. https://doi.org/10.3390/infrastructures4010011
Chicago/Turabian StyleAfrin, Tanzina, and Nita Yodo. 2019. "Resilience-Based Recovery Assessments of Networked Infrastructure Systems under Localized Attacks" Infrastructures 4, no. 1: 11. https://doi.org/10.3390/infrastructures4010011
APA StyleAfrin, T., & Yodo, N. (2019). Resilience-Based Recovery Assessments of Networked Infrastructure Systems under Localized Attacks. Infrastructures, 4(1), 11. https://doi.org/10.3390/infrastructures4010011


