1. Introduction
With the advent of the twenty-first century, global warming is one of the biggest challenges that the world faces. The increased emissions of greenhouse gases (GHG) as a result of human activities is regarded as its main cause [
1]. The year 2016 has been recorded as the warmest year on record as the first six months were the planet’s warmest half-year since data has been maintained (since 1880) [
2,
3]. The average atmospheric temperature in 2016 is recorded to be 1 °C warmer than the middle of the 20th century and 1.3 °C warmer than the late 19th century. Also, it is the third year in a row to set a new record for atmospheric temperature [
4]. The sea-level rise as a result of the melting of the glaciers because of higher atmospheric temperatures is one of the most prominent implications of global warming. It is reported that if the emission of GHG continues at the current rate, by the end of this century only the melting of Antarctica will be able to raise the ocean level by more than 3 feet [
5]. This situation is also leading to a wide range of other problems, including disorderly climatic patterns and weather-related incidents such as flooding, drought, and wild fires [
1,
6].
Buildings have an important role in the global environmental scenario. The importance of buildings is established from the fact that more than 40% of total materials consumption and over one-third of GHG emissions in the world are due to the building and construction sector [
7,
8]. It is reported that with proven and commercially available technologies, 30 to 80% of energy consumption in existing, as well as new, buildings can be reduced [
9]. Buildings not only consume energy and raw materials but also produce waste harmful for the atmosphere. In USA, for example, buildings account for 38% of CO
2 emissions, more than any other sector in the country [
10]. Within the European Union (EU), the building sector accounts for 40% of total energy and 55% of the electricity consumption [
11]. Transportation is the second highest sector after buildings, consuming almost 32% of total energy while industrial and agricultural sectors consume 26% and 2% of energy, respectively. Statistics suggest that in the EU, annual primary energy consumption of non-residential buildings is 286 kWh/m
2, 55% more than residential buildings accounting for 185 kWh/m
2. The overall average annual specific energy consumption is reported to be 210 kWh/m
2 for all types of buildings [
11]. Italy is one of the largest economies of Europe. According to a report in 2012, energy prices in Italy were higher than other European countries because of its heavy reliance on imported resources of energy, while other countries in the region were making use of nuclear power and coal for power generation [
12,
13]. Renewables have become a major source of energy generation in Italy contributing to 68.4% of the total indigenous supply mix [
14].
According to the EU’s Energy Efficiency Directives (EED), all member states need to submit National Energy Efficiency Action Plans (NEEAPs) [
15]. Additionally, EU member states have set a target of reducing 20% of CO
2 and energy consumption in the building sector by 2020 [
16]. The EU directive about 2020 targets not only emphasizes a 20% increase in energy efficiency but also an inclusion of 20% renewable energy sources in energy consumption [
17]. This situation leads towards the application of the Zero Energy building (ZEB), nearly Zero energy building (nZEB), or Zero energy homes (ZEH) concepts. According to the Energy Performance of Building Directive (EPBD), by the end of 2020, all buildings in EU countries need to be nearly zero-energy buildings [
18]. ZEH is a combination of state-of-the-art construction techniques and available renewable technology [
19]. The International Energy Agency (IEA) defines a zero energy building as a building with large photovoltaic (PV) cells and a photo-voltage system [
20]. According to another study, the concept of zero energy includes net zero site-energy, net zero source-energy, net zero energy emissions, and net zero energy costs [
21]. A study suggests the classification of net zero energy buildings (NZEB) on the basis of renewable resources used, from ZEB A to ZEB D, where “ZEB A” is best energy supply option [
22]. Researchers indicate that ZEBs can be attained through application of two strategies: energy efficient measures (EEMs) and renewable energy and other technologies (RETs) [
18]. The building envelope system, building services, and internal conditions are covered under EEMs, while measures like the use of solar PV, solar thermal energy, and wind turbines are regarded as RETs.
Hutton suggests a hierarchy of strategies which need to be employed to attain a zero-energy status based on importance; they are as follows: building envelope/orientation, daylighting/electric lighting, heating ventilation and air-conditioning (HVAC), and renewable energy [
23]. Wang compared different ZEB solutions for residential buildings in the UK and suggested the three-steps design process: climatic data analysis to understand the basic requirements, passive design to reduce energy demand, and renewable technology to produce energy to meet the remaining energy needs [
24]. In another study, after the application of passive and active strategies in six different climates, it was found that 19–30% annual energy demand can be reduced compared to the baseline code-compliant home after considering three simple steps to design ZEB, which are passive design strategies and energy efficiency measures, the selection of a proper combination of strategies, and the pairing of calculated energy demand with onsite energy production [
25].
A limited amount of energy can be produced through renewable resources depending upon the technology employed and the climatic condition of the region. The energy demand of the building needs to be reduced by the application of proper passive techniques, keeping in mind the amount of energy that can be produced on site. Utilizing the site analysis and climatic conditions properly is the first step to design ZEB [
26]. Using solar energy to cool or heat the building is part of the passive building design strategy which reduces the HVAC loads. Passive design reduces the dependency on active mechanical systems while providing the desired comfort for occupants [
27]. The following aspects need to be considered in passive design: orientation, wall and roof assemblies with low thermal conductivity values, window wall ratio (WWR), low-e glazing, and building shading, etc. [
28]. Orientation and the proper layout of the building can not only improve the thermal comfort inside the building but can also reduce the lighting demand [
29]. A balance needs to be created between natural lighting and building HVAC loads. Form factor or building shape play important roles in restricting the conductive heat flows and subsequently improve the thermal performance of building envelope [
30]. It can be done by reducing the surface area of the envelope. According to a study, in USA in 2010, heating and cooling demand was 37% of the total primary energy, which emphasizes the importance of building envelope towards the energy performance of the buildings [
31].
To improve the efficiency and performance of the buildings, sustainable materials and construction techniques are being actively pursued in developed countries. Specific and articulated solutions are being sought to improve the sustainability standards of buildings. Designers find structure-envelope construction more flexible in assembling materials/components. Theoretically, the changing of layers and their thickness provides a solution to every design problem. Both the light-weight steel/wood structure and the heavy-weight concrete structure can be used with layered construction. Normally, layered construction is light in weight, speedier, safer to carry out, and easy in demolition and recycling. By providing a cavity in this type of construction, a high performance level with less thickness can be achieved. Services can also be run through these cavities. The building envelope system can absorb heat, store it for some time, and then release it. This phenomenon is called thermal lag, which happens because of increased thermal mass [
32]. Thermal mass reduces heat gain and losses. It also reduces the HVAC system size because of shifting peak load conditions and ultimately reduces the total energy demand of building [
33]. Similarly, insulation provides the desired comfort inside the building spaces and saves the energy as well [
34]. Thermal Insulation reduces the risk of heat gain or losses through the building envelope and subsequently reduces the building energy demand [
35]. Thermal insulation not only controls thermal conductivity, but convective and radiative heat flows as well (ASHRAE 2001). Conversely, insulation is less effective in hot climates. An over-insulated envelope may increase the cooling load of a building, especially in mid-season. After a particular thickness, more insulation could be counter-productive. Thus, optimum insulation thickness needs to be calculated on the basis of life cycle cost and energy performance [
18]. Furthermore, even the installation of thin layer of insulation can be uneconomical because of the same installation cost for different insulation layer thicknesses. Climatic condition, environmental impact, impact on indoor air quality (IAQ), thermal resistance, acoustical properties, and fire resistance are some other aspects which need to be considered while choosing suitable insulation. Moreover, insulation is effective if there are no thermal leakages/bridges in the structure that can be attained by providing a continuous layer of insulation in the building envelope. A lot of research is also being conducted on improving the thermal performance of insulation, and vacuum insulated panels (VIP) are one of the best example of it [
36]. A study carried out in Thailand reveals 3–4% annual energy savings by application of R-11 batt insulation on walls and R-11 batt insulation on cement tiled roofs [
37]. According to another study, light-weight concrete blocks walled with thermal insulation inside can save more energy than an 8 to 12 inch (200–300 mm) thick, high-thermal, mass-brick wall [
38].
Optimal combination of strategies can result in a high-level of energy performance [
39]. In research made in Cyprus, nZEB was attained through application of optimum insulation in walls, floors, and roofs while studying thirteen different insulation thicknesses, and through the application of the appropriate glazing system [
31]. In this research, optimal thermal transmittance values were calculated against the compactness ratio (Ae/V) and a linear correlation was found between them, while 1.67 W/m
2K was found as the optimum thermal transmission coefficient for windows. Similarly, energy-efficient measures applied on an office building in the UK to attain zero carbon foot prints were: insulation, thermal mass with high ventilation, triple low-e glazing, LED lighting, and shading [
40]. Other research made on office buildings in China in five major architectural climatic zones recommended thermal insulation as an effective measure. Furthermore, double and triple glazing, lower WWR, and an improved chiller coefficient of performance (COP) were other important aspects which were considered in that research [
18]. Poirazis suggested that the double skin façade could be an optimal solution for highly glazed buildings [
16]. In other research made in Italy, the effect of different insulation thicknesses was measured, and it was found that by increasing the thickness of stone wool batts from 0–320 mm, primary energy consumption of two-storey dwellings halved, while a 25% energy saving was also noted because of a 0–20 mm increment in insulation thickness [
41]. Susorova suggested that by employing passive technologies like low-e glazing, shading, insulation, and daylight control, 20–30% on average energy consumption of new commercial buildings can be reduced, which may reach up to 40% depending upon building type and location [
42].
Different standards are also being developed to ensure better performance of such buildings and German Passive Haus (PH) standards are one of the most prominent among these. Provision of PV Cells and the solar collector also help in producing energy in these types of buildings. PV cells are also available in different forms and can also be installed on building facades. Such systems are called building integrated photovoltaics (BIPV). Research made in University of California to understand the effect of photovoltaic panels (PV) on roof temperature elaborates that roofs under PV were 2.5 K cooler than exposed roofs during the day time, while at night exposed roofs were cooler [
43], which enhances the insulation properties of roofs because of PV installation. The presented work aimed to design nearly zero-energy buildings (nZEB) in calolziocorte, Italy, with the key objectives being to:
Choose the most suitable material for walls, floors, roofs, and glazed areas in Calolziocorte, Italy and observe their effect on building energy demand.
Understand the effect of movable horizontal window louvers on building energy demand.
Monitor energy savings by reducing the air infiltration rate to make the building envelope airtight.
Understand on-site energy production through PV cells and calculate the net energy demand.
To achieve these objectives, it is critical to understand the climatic conditions of Calolziocorte, Italy. Subsequently, appropriate construction materials are selected for walls, floor, roofs, and windows, taking into account climatic conditions, thermal conductivity, material recyclability, and cost effectiveness. The total energy demand of the building is calculated with the help of ECOTECT software and this demand is further reduced by making the building envelope airtight. Solar access analysis is undertaken to understand how much electricity can be generated on site and then the net energy demand of the building is calculated.
2. Site Overview
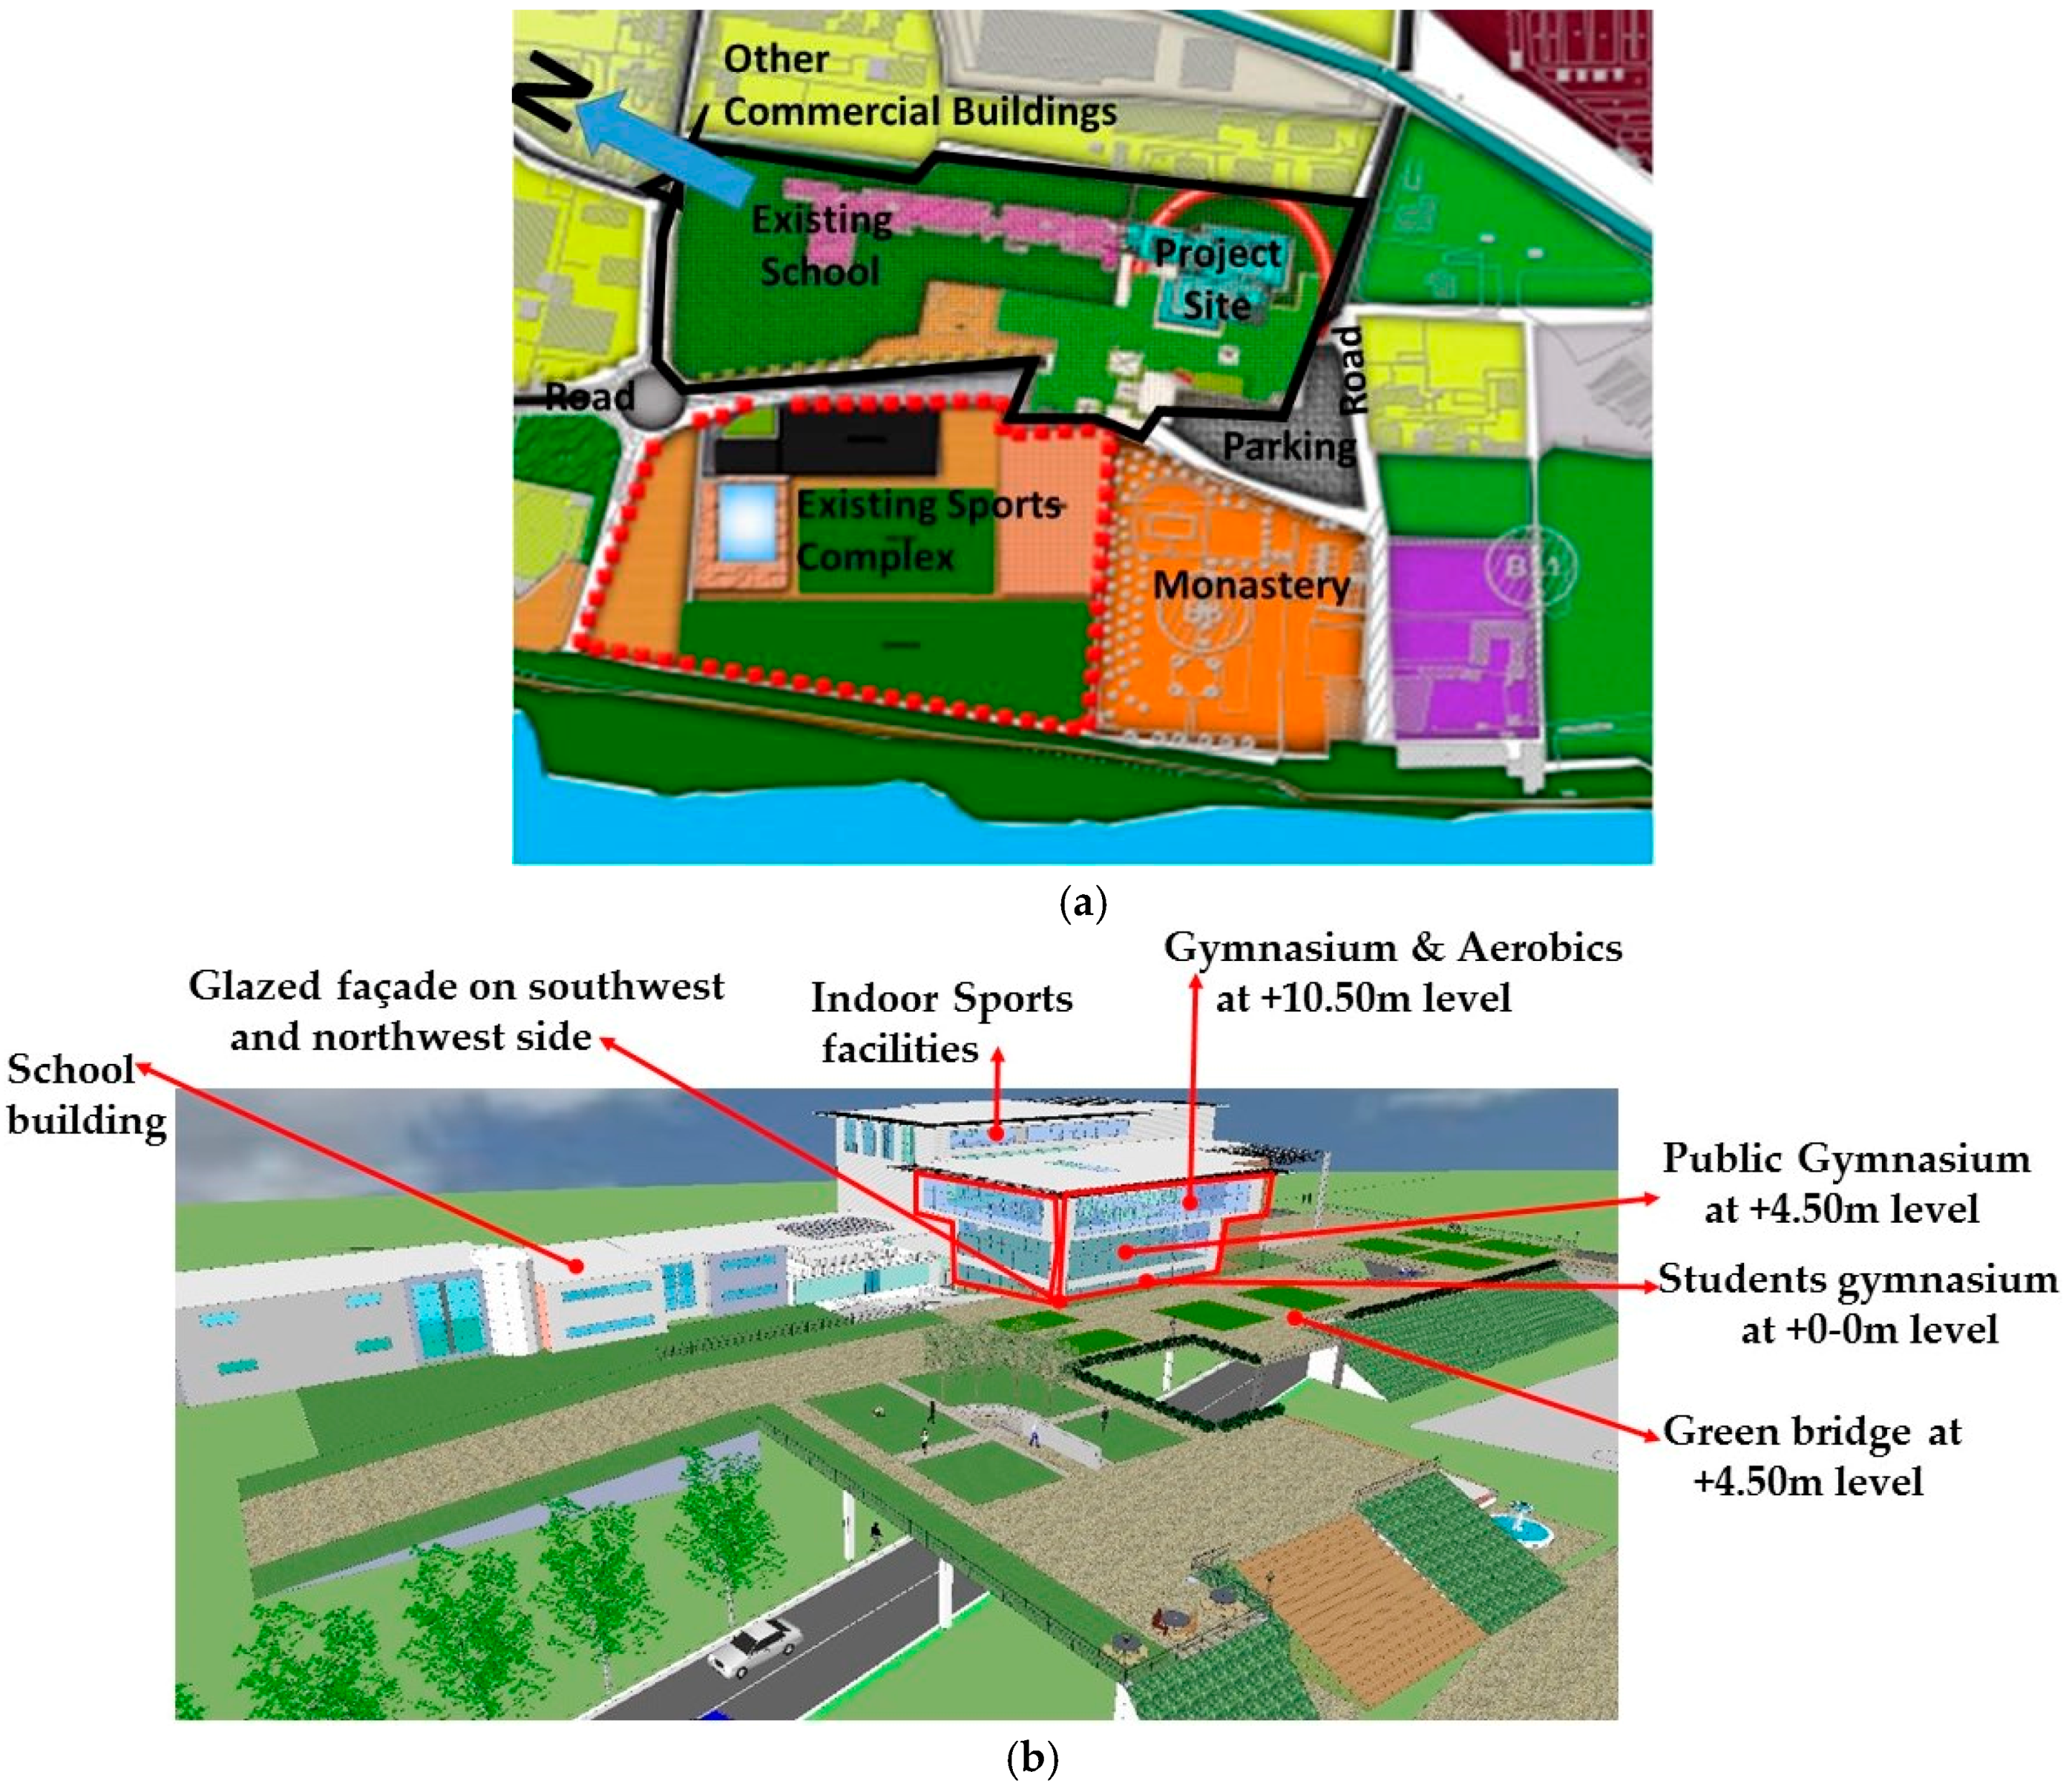
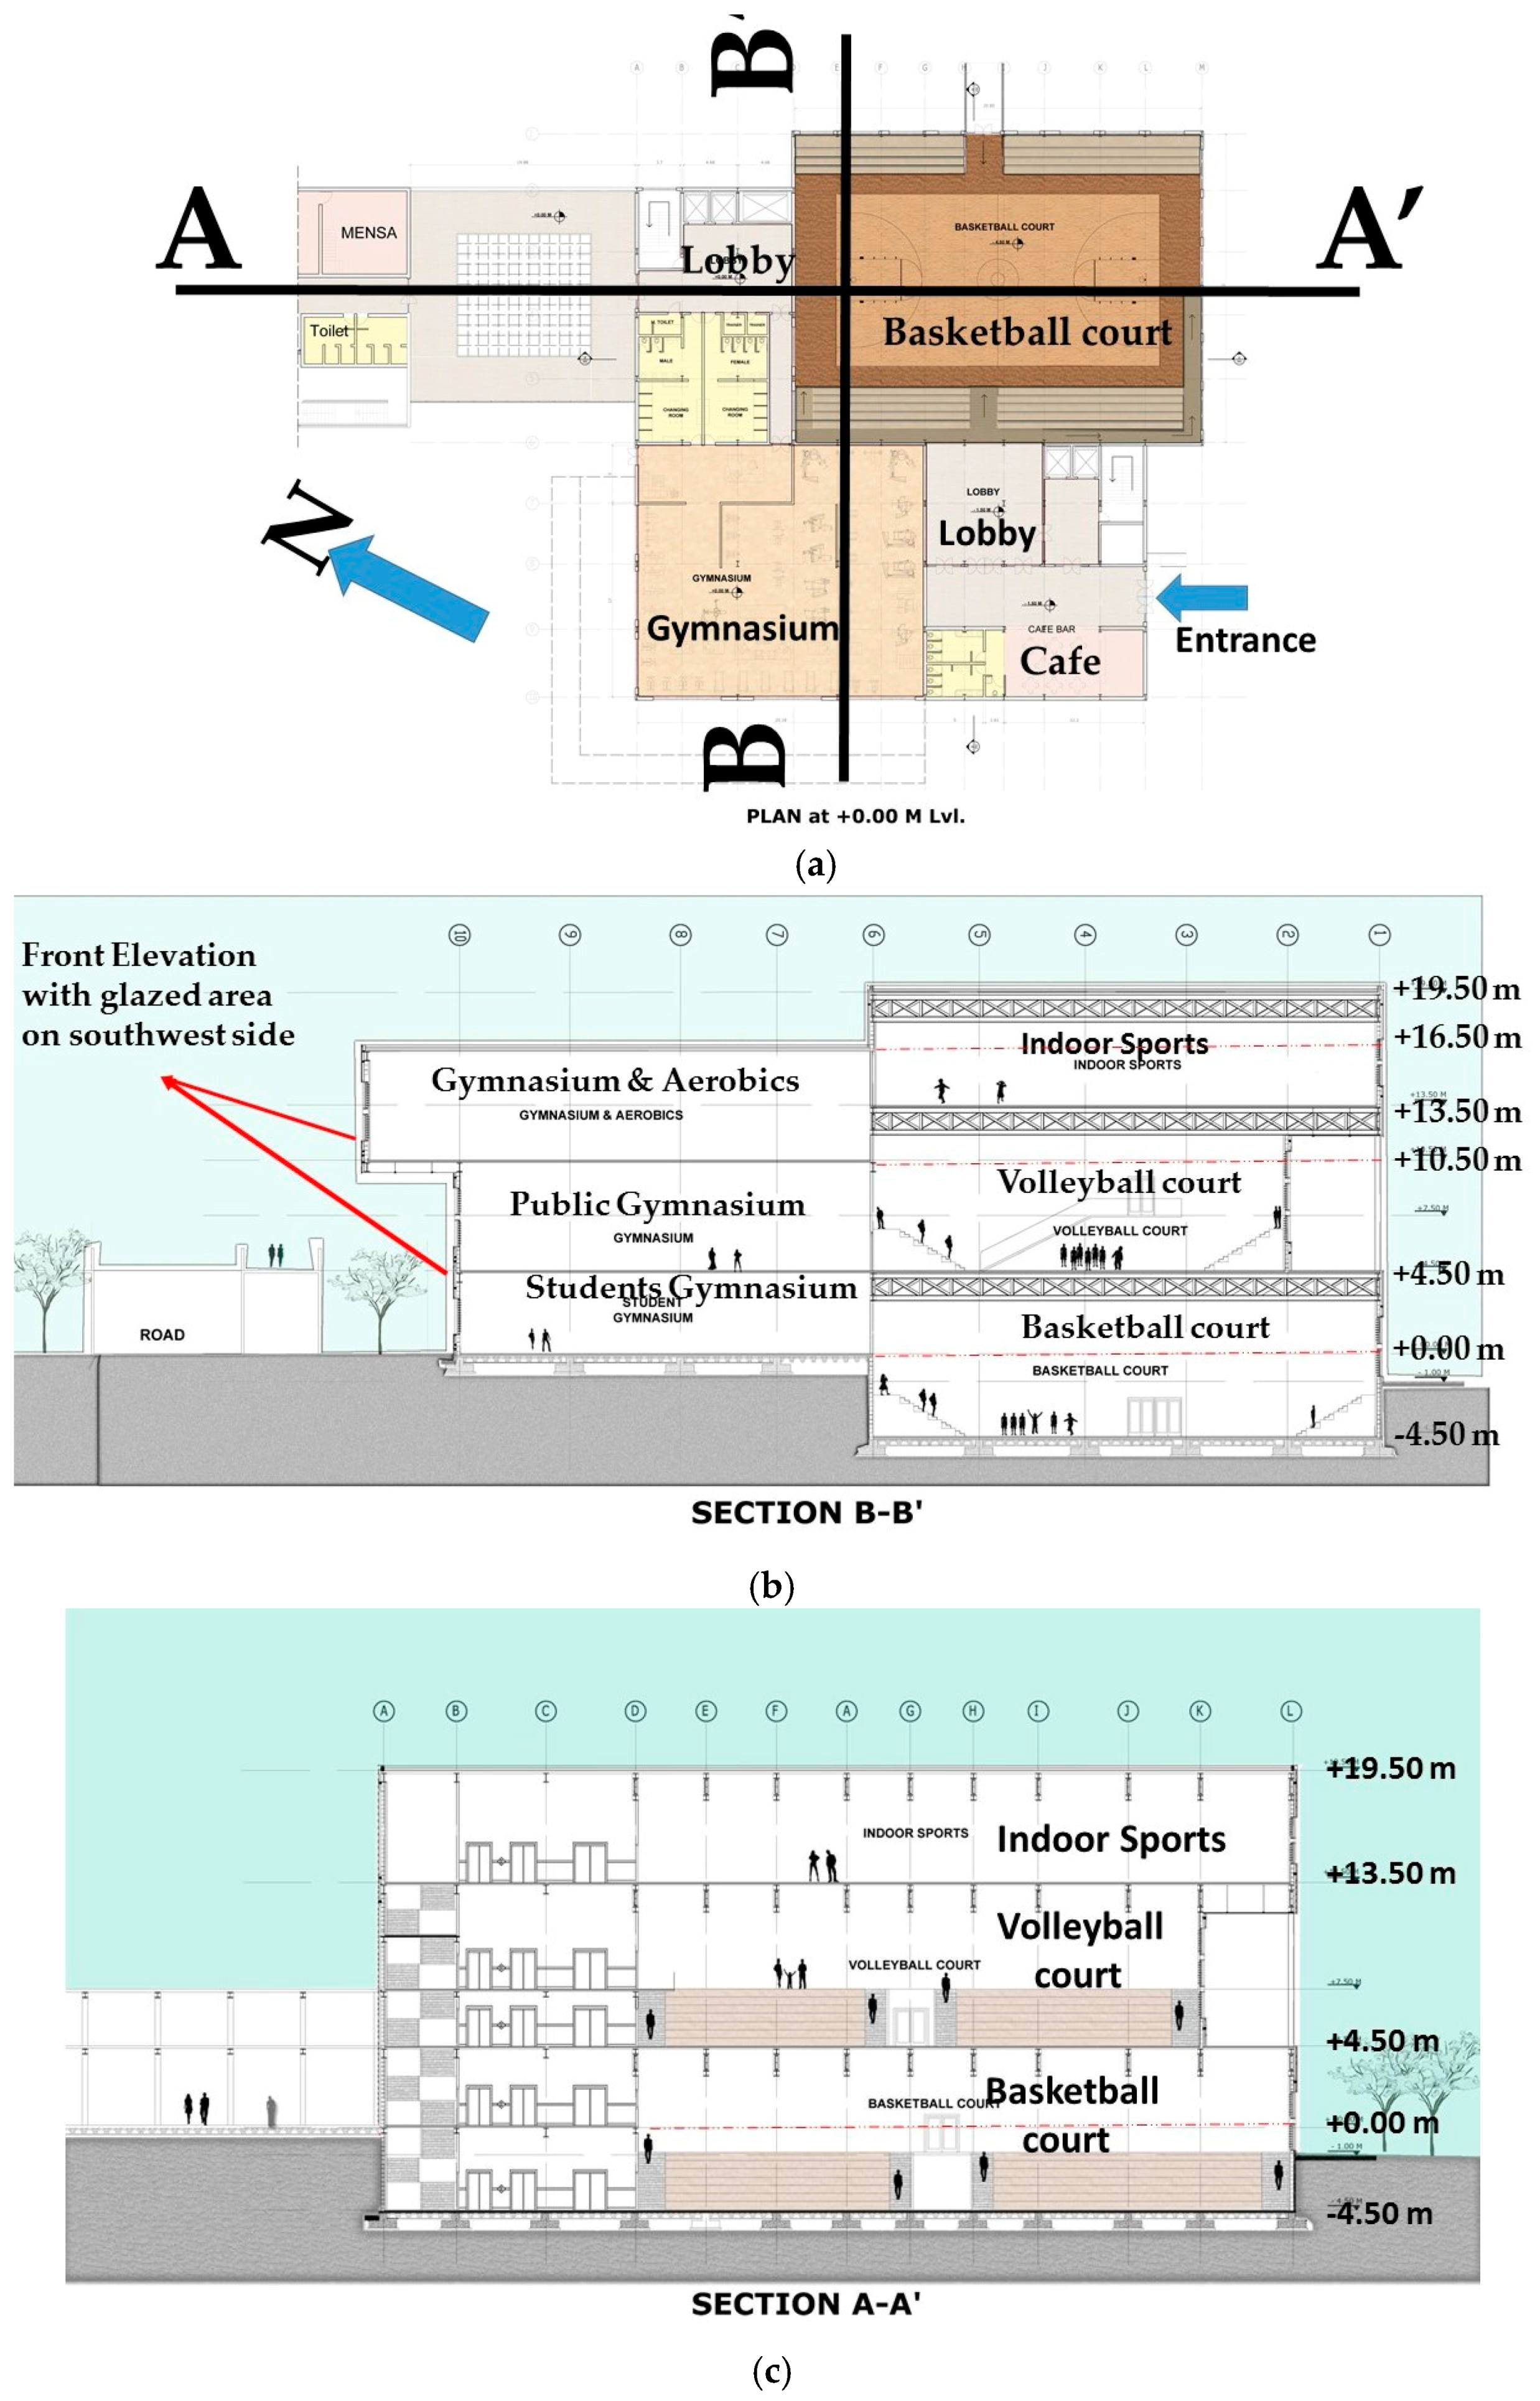
The Calolziocorte municipality, having received the title of city in 2002, is settled on the eastern edge of the Lombardy region, close to Lecco. The local administration has planned to improve the environmental outfit and cultural heritage of the city by setting some priorities and establishing various projects. Project site is highlighted with black outline, as shown in
Figure 1a, where we had to design the gymnasium building and connect it with existing school on same side of the road and parking and existing sports complex on the other side, as shown in
Figure 1a,b. To tackle the problem, an organic overhead pedestrian bridge was designed that would also help in reducing the site temperature. Site is basically on corner plot and there is a road passing by on southern side of it. In east and northwest side of site, congested commercial areas are there while a monastery is situated on southwest side, as shown in
Figure 1a.
Other requirements were to design a gymnasium building consisting of a basketball court, a volley ball court, a gym for students and employees, indoor game area, squash court, and administration offices. This building was designed in such a way that at −4.50 m level, basketball court is provided with changing rooms, as shown in section AA’ in
Figure 2b. Height of basketball court is 9 m and total area is 1000 m
2. Main entrance is provided on southeast side at +0.0 m level, as shown in
Figure 2a. At +0-0 m level, other functions provided are lobbies, café, and student gymnasium. Additionally, height of gymnasium at this level is 4.50 m, while basketball court is continued on this floor from −4.50 m level to attain 9 m height, as shown in section BB’ in
Figure 2c. Floor area of student gymnasium is 600 m
2, while area allocated to restaurants/café is 200 m
2. At +4.50 m level public gymnasium is provided with area 1200 m
2 and height of 6 m. Volleyball court is also situated at the same level with 700 m
2 area and 9 m height, as shown in section BB’ in
Figure 2c. People can also enter into this building through green ramp at +4.50 m level. At +10.50 m level, gymnasium and aerobics are provided with 6 m height and volleyball court is continued till +13.50 m level, as shown in
Figure 2c. At +13.50 m level, indoor games area and administration section are provided with 500 m
2 area and 250 m
2 area, respectively, with floor height of 6 m. In basketball, volleyball courts, and indoor sports area, column-free steel structure is provided with trusses and bracing on corner, while gymnasium floors have a steel “frame structure”, as shown in
Figure 2c. Total height of the building at the court area level (basketball, volleyball, and indoor games) is 19.50 m, while gymnasium area reaches to height of 16.5 m, as shown in
Figure 2c. Front elevation along the southwest direction and side elevation along the northwest direction have the following building functions: student gymnasium, public gymnasium, and gymnasium and aerobics and have a mostly glazed area, as shown in
Figure 1b and
Figure 2c. Floor at +0.0 m level is under shading because of proposed green bridge, while floor at 4.50 m level is shaded with projection provided at 10.50 m level, as shown in section BB’ in
Figure 2c. It is also important to mention that these projections are provided on southern side to control the intense solar radiation in summer, as in summer temperature is high, which will be discussed in climatic analysis. Mixed-mode air conditioning system is proposed, as during some months only natural ventilation can be used, while heating is required during winter and cooling is also required for a few months.
Calolziocorte Climatic Analysis
Geographically, Calolziocorte is located in the region of Lecco which is situated in the North of Italy. Located at 241 m of altitude, the town of Calolziocorte has the following coordinates: 45°48′4″ North, 9°25′57″ East. Average altitude of Calolziocorte is 100 m above sea level. At this latitude and longitude, the weather is considered a humid subtropical climate zone. Summer is normally hot and wet, while winters are moderately cold. Winter average temperatures are around 1 °C to 3 °C and more than 26 °C in summer [
44]. Summers are mild in the hills and quite hot in the plains. Warmest month is July, with maximum temperature of 28 °C, and December is coolest month with minimum of −1.5 °C [
45]. Moreover, May to September are the months that require cooling, while from mid-October till March heating is needed (hence the heating and cooling load calculations must be done based on this data, keeping in mind the effect of working hours, material properties, and ventilation systems of the building in study). The rain is a usual phenomenon and plentiful. Mostly it rains throughout the year and precipitation is high. Rain falls mostly during spring and autumn and is usually all year around, while May is the wettest month [
46].
The incident solar radiation study, both direct and diffuse, shows that there is a reasonable opportunity to utilize daylight. Length of the day varies from 9 to 16 h from winter to summer, respectively [
44]. However, we also need to consider the fact that useful amount of radiation might as well overheat our buildings during the summer months. Special care and deliberation should be exercised when planning the balance of day lighting versus the cooling loads. The city, despite its location on the banks of the lake, suffers relatively in terms of climate in the winter: in fact, in the period from November to March, temperatures fall consistently below freezing, especially in the months of December and January. The snow is constant and very intense sometimes. Relative humidity ranges from 45% to 93%, and mostly it is humid in October, while in June it is mostly dry [
44]. The highest average wind speed occurs in April, while December is the month with lowest average wind speed. Furthermore, average wind speed varies from 0 to 4 m/s [
44]. This helps to consider the air tightness and decrease the wind sensitivity in our building, which may affect the heating and cooling loads.
3. Strategies
The objective of research is to investigate the impact of passive design strategies on a commercial building which was still in design phase and to understand how energy demand of commercial buildings can be reduced in northern part of Italy. Commercial buildings are not only consuming great amounts of energy in the whole world but are also one of biggest source of carbon emission [
47]. In California, the government has set a target to reduce the energy demand of all state-owned buildings by 20% [
48]. Moreover, significant increase in energy consumption of commercial sector was also noted in all major economies [
47]. According to research, Italy is one of those European countries where energy demand of non-residential buildings is higher than residential buildings. Average energy demand of non-residential buildings in Europe is almost 286 kWh/(m
2yr), compared to residential buildings, which is 185 kWh/(m
2yr) [
11]. Research done on identical 4000 m
2 office buildings in various EU Countries reveals that in Germany, office buildings were consuming almost 225 kWh/(m
2yr) energy, while Italy was the second number on the list with 200 kWh/(m
2yr) energy consumption [
47]. Energy audit done of 413 “sports facilities” in Lombardy, Italy in 2011 suggests that “median heating demand” of sports facilities is 268 (kWh/m
2yr), while for Gym it is 180 kWh/(m
2yr) [
49]. Furthermore, according to other research, building energy demand in Milan, due to its cold climate, is 35–40% higher than in Rome or Croone [
41]. As a result, higher level of insulation is required in building envelope in our project to reduce the total energy demand, since Milan is also located in Lombardy region. Heating load of sports facilities in Lombardy region is reported to be 268 kWh/(m
2yr), implying the total primary energy demand to be around 300 kWh/(m
2yr). Thus, in this study, along with the base-case model energy demand, we are also considering 286 kWh/(m
2yr) as reference value for energy comparison, which is average primary energy demand for commercial buildings in Europe [
11].
Sustainable solutions are those which are viable environmentally and economically and are also effective in terms of energy. In built environment, challenge is to enhance the functionality of the buildings with maximum occupants’ comfort and minimum operating cost while using naturally available local materials. Purpose of such construction is to reduce the dependency on the electric grid by not only reducing the energy demand of the building but also producing energy through renewable energy resources. This idea leads towards the concept of nZEBS where important strategies are energy conservation, losses control, and energy production. To attain our goal, passive design strategies and renewable technologies are employed to reduce the net energy demand of gymnasium building. Passive strategies are comprised of appropriate architectural design, suitable building materials, especially insulation (for composite roof, floor, and ventilated façade system), efficient glazing system, proper joints sealing to control the heat losses, and efficient building shading system. Building envelope is made airtight by using insulated doors and windows and sealing the construction joints properly. Solar access analysis is performed to understand how much electricity can be generated on site through incident radiations. Strategies employed in this research project are also presented in
Table 1.
In case-1, we are assuming all materials/proposed sections (for walls, floors, roofs, windows, etc.) on the model without louvers on the glazed area to understand how much energy demand can be reduced by application of materials only. Moreover, in this case, we are also considering the air infiltration rate as 0.5 ach, as according to PH standards the allowable infiltration rate should not be more than 0.6 ach at 50 Pascals of pressure [
50]. Details on the air infiltration rate are provided in
Section 3.3. In case-2, we are considering a model with the same materials but added horizontal movable louvers around the windows, which is discussed with more details on the windows in the proposed materials section, to understand if there would be any impact of window louvers on the building energy demand. Again, in case-2, the air infiltration rate is considered as 0.5 ach. In case-3, along with all proposed materials (case-1), we are considering an improved infiltration rate from 0.50 ach to 0.25 ach to make the building envelope airtight. Further details on the air infiltration rate can be found in
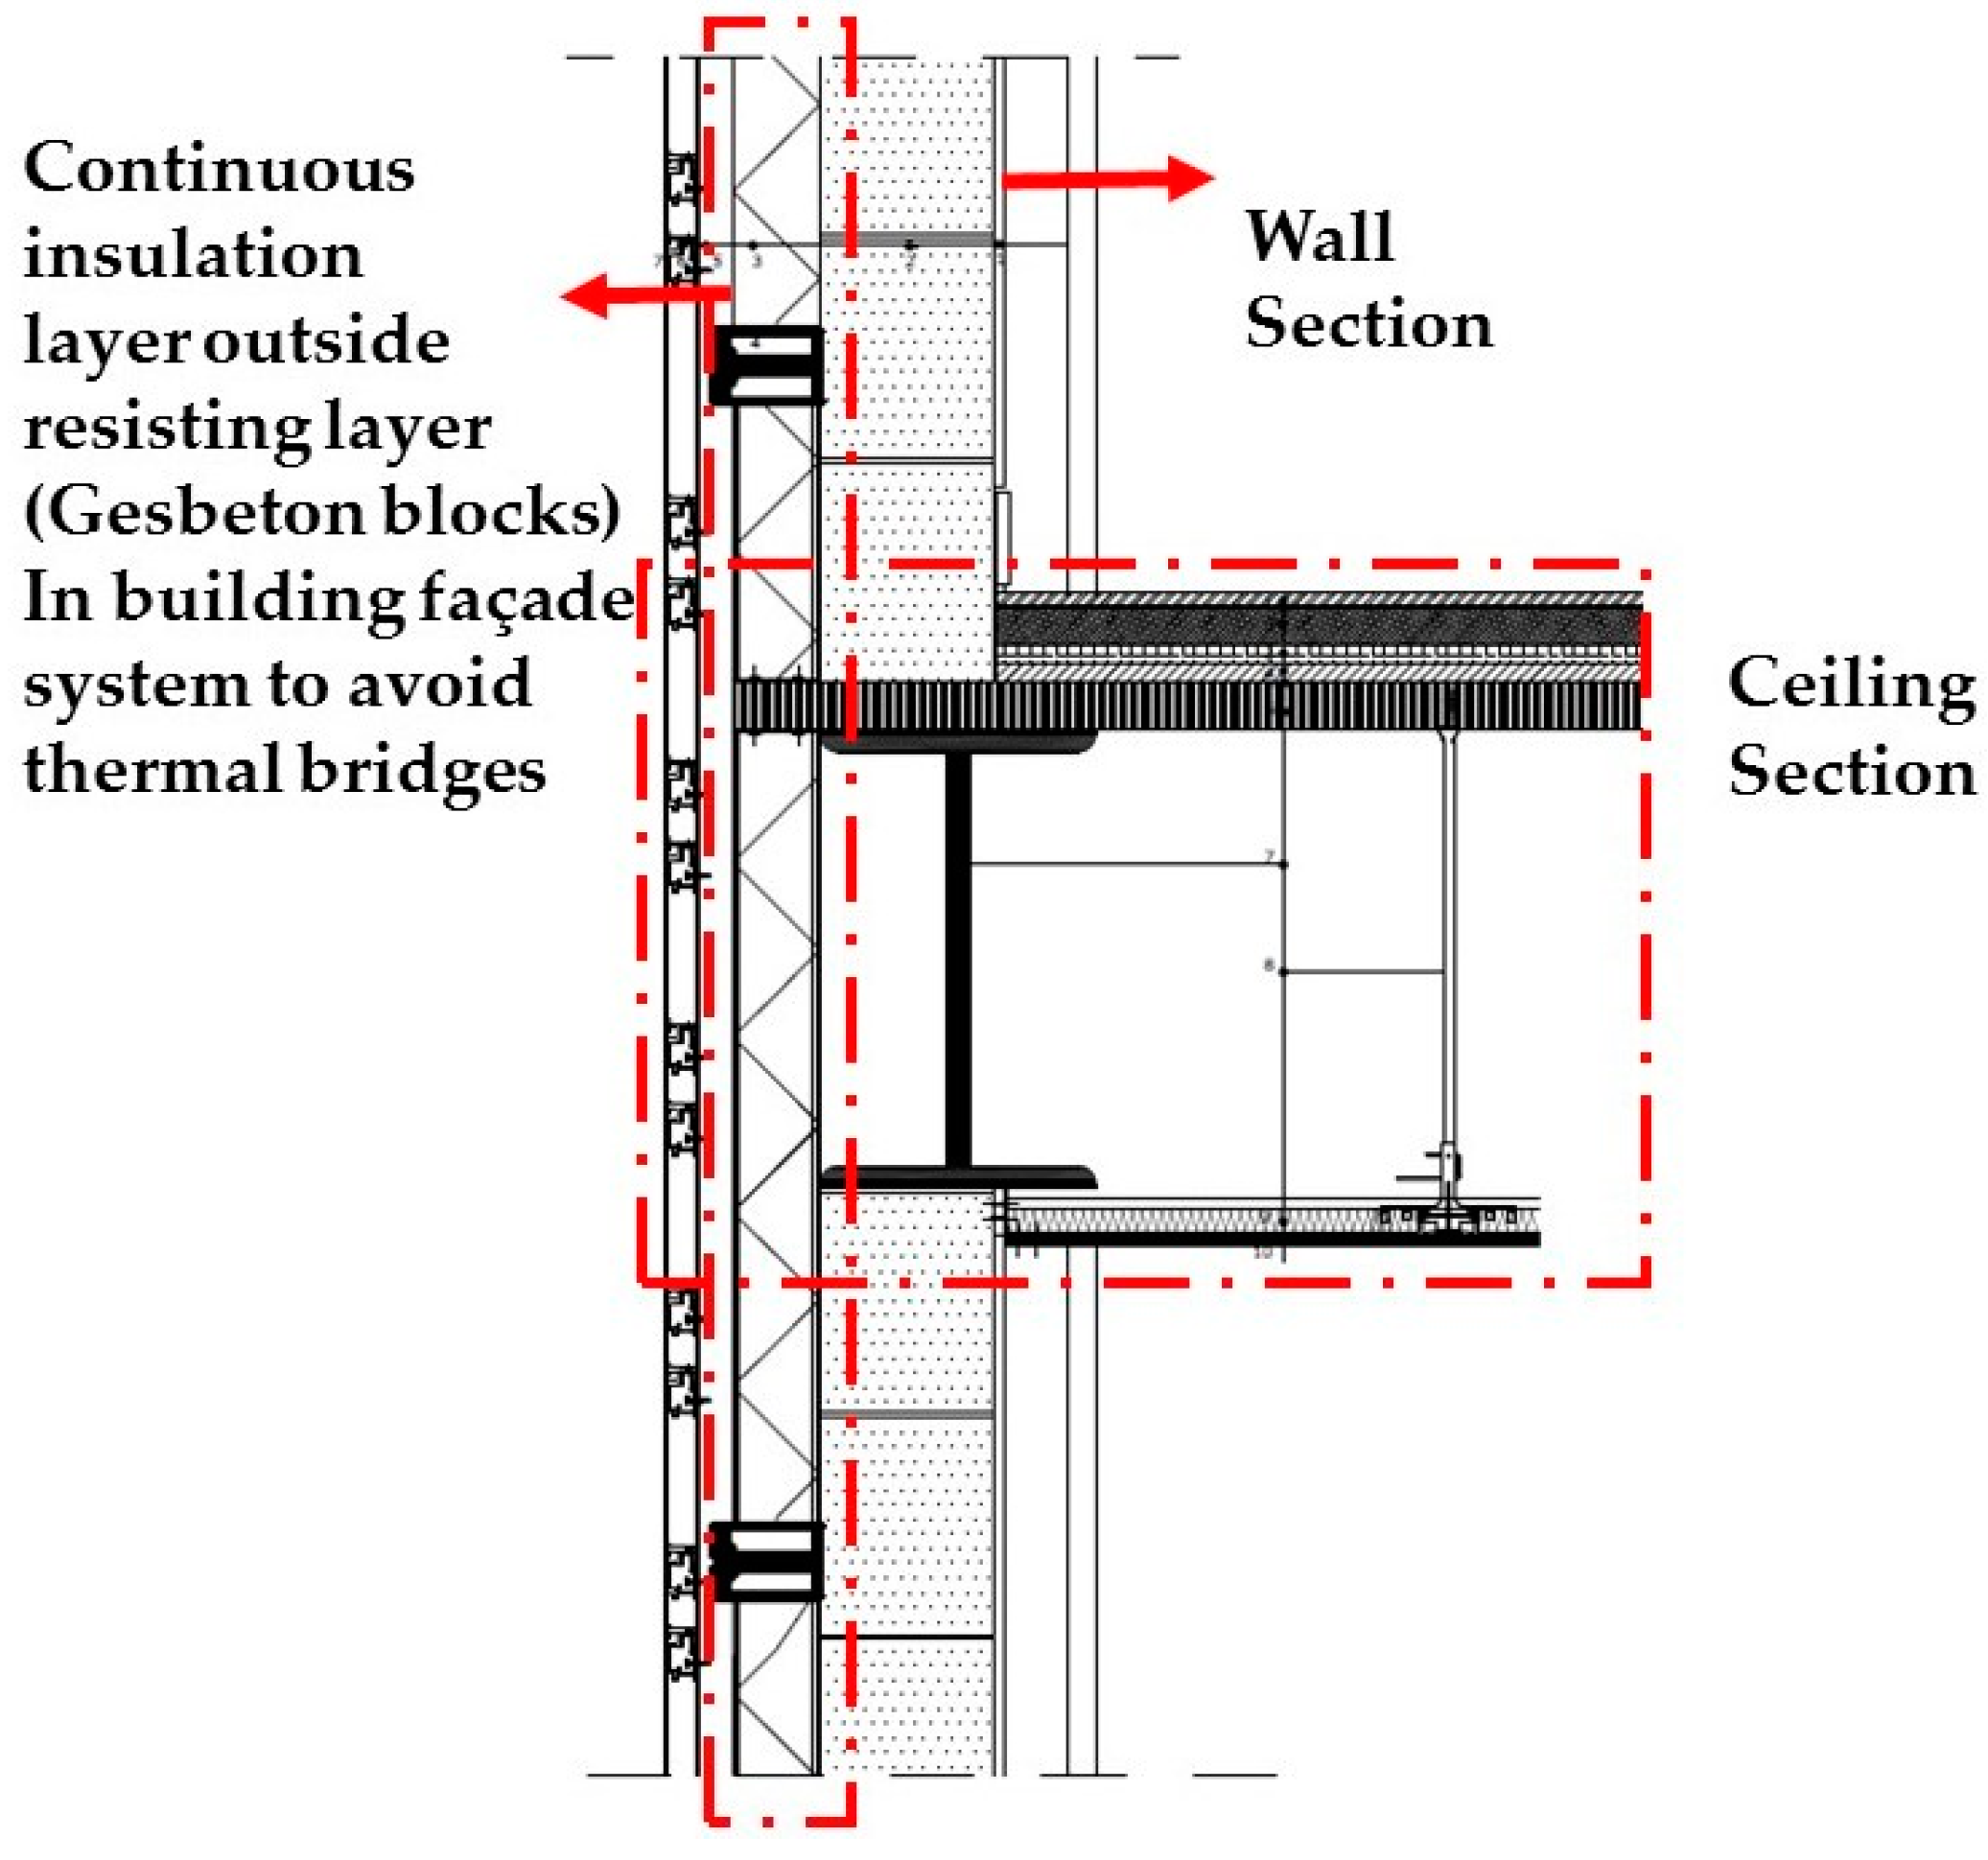
Section 3.3. It is done by considering well-insulated doors and windows with properly sealed joints and by application of a continuous insulation layer in the building envelope system, as shown in
Figure 3. In case 4, we are investigating how much electricity can be generated on site and what would be the net energy demand of the building at the end.
3.1. Base-Case Materials
Additionally, we are also considering the same building with conventional and typical materials, which have been used mostly in Italian commercial buildings lately. This model will be used as the base-case model and help us in understanding the impact of modern materials on the building energy demand. In the base-case model, exterior walls are considered as cavity brick masonry walls, having 7 cm thick cavity between 15 cm thick solid brick wall provided on the outer side and 15 cm hollow brick wall provided inside, as shown in part (c) of
Table 2. The roof is provided with prefabricated concrete slab having 20 cm thickness, while 4 cm thick expanded polystyrene is considered above it as an insulation layer, having been used in the roof structure in most Italian buildings [
41]. Roof tiles are provided on top of the structure with wet screed. Roof details can be seen in part (d) of
Table 2. PCC floor with ceramic tiles is considered, as shown in part (e) of
Table 2, while windows are single glazed, provided with aluminum frame.
3.2. Proposed Materials
The selection of materials, used in this project, is based on the study of weather and climatic conditions of Calolziocorte. We selected the best possible materials to attain the best thermal, acoustic, and lighting performance of the envelope. Our main focus, to enhance building performance, has been pursued through natural resources, limiting the use of mechanical systems to save energy, thus focusing on the passive strategies.
Different types of solutions are available for specific applications. For façades, for example, veture system, external thermal insulation component system, rain screen cladding, and vegetal walls can be suitable options depending upon the position of the insulation layer in the composite system [
51,
52,
53]. The most appropriate position of insulation is outside the resisting layer in the building façade system, continuous throughout, to avoid thermal bridges. Active Dynamic Air Envelope (ADAE), a composite envelope system with a mechanically ventilated air gap to control the radiative heat, may improve the energy performance and thermal comfort of buildings in bidirectional climates [
54]. According to research, in extreme weather conditions in Berlin and Palermo, good energy and environmental savings can be attained through ventilated and insulated walls [
18]. A study was conducted to understand the coupling of thermal mass with the exterior wall by providing an insulated outer wall with a thick thermal mass inside [
55]. To understand the behavior of the solar wall, research was carried out on “Trombe wall” in Mediterranean climate, where energy performance and thermal comfort studies were conducted [
56].
In Europe, Italian buildings are less energy efficient, according to a study conducted by Lazzarin, and it is due to their poor levels of thermal insulation [
41]. Optimum insulation thickness is key to saving energy and reducing cost. Bojie explored the optimum thickness of mineral wool and polystyrene through life-cycle analysis [
57]. Loukaidou chose extruded polystyrene as insulation material in Cyprus for walls, roofs, and ground floor and conducted an analysis with 30–200 mm thicknesses to explore the optimum thickness in terms of energy and cost [
31]. In another study on the composite concrete wall system, different insulation thicknesses—150, 200, 250, 300, and 390 mm—were analyzed and insulation with 200 mm thickness, 0.16 W/m
2K thermal transmittance value, and 179.50 Euro/m
2 investment cost was found to be the most financially viable solution [
16]. Other research shows that difference in the total energy demand of a two-storey dwelling in Milan was minimal, while using insulation thicknesses from 150 mm to 300 mm for the building with wool batt insulation [
41]; so, 150 mm thick wool batt insulation could be an optimum solution in terms of energy and cost. According to the same research, the payback period for the above-mentioned insulation, with 80 mm thickness and 29,000 Euro NPV, was 11.5 years. However, it became 27 years with 160 mm thick insulation and 34,000 Euro NPV. From here, we can conclude that insulation thickness between 80 mm and 150 mm could be optimum in terms of energy and cost. Moreover, polystyrene could be a better choice because of its availability. Furthermore, expanded polystyrene foam has the same thermal conductivity value as stone wool batt while having comparable cost [
41].
Now, while making a decision on the wall construction system, since most of the time it is raining in Calolziocorte, Italy, as mentioned in the climatic analysis, we chose “rain screen cladding” as the composite wall system. Rain screen cladding not only provides a good insulation level but also provides ventilation through cavity. The system is a form of double-wall construction that uses an outer layer to keep out the rain and an inner layer to provide thermal insulation, prevent excessive air leakage, and carry wind loading [
58]. The outer layer breathes like a skin while the inner layer reduces energy losses. Cavity between the outer and inner layer is maintained through mechanical (horizontal and vertical) profiles, which are provided to hold the finishing or cladding material. Furthermore, due to cavity, moisture penetration and radiant heat flow inside are controlled. In this system, insulation is provided after the resisting layer and then a vertical profile is placed above the insulation, which is held by a clump and connected with the resisting layer. To attain the maximum energy and cost benefits, 12-mm thick polystyrene is chosen as the optimum insulation, as discussed in the above paragraph. Above the vertical profile, a horizontal profile is connected, which also holds the cladding material above it. Proper air outlets and inlets are provided for convective flows. In order to obtain effective ventilation, cavity should be between 20 to 40 mm, as large cavity may cause turbulence. In the proposed system, wall in gasbeton is used as the resisting layer. The thermal transmittance value for the proposed wall section is 0.20 W/m
2K. The cladding material used in the building façade system is Aluzinc Panels; they have good thermal reflectivity, good fire resistance, and are easy to install. Part (a) of
Table 3 shows the proposed external façade x-section details.
The roof is one of the most important parts of the building envelope system, as most of the time during day, it is exposed to solar radiation. Thus, roof behavior plays an important role in a building’s thermal performance. Moreover, intensive and extensive green roofs are becoming popular solutions [
59]; however, these are more effective in hot climates. Additionally, while choosing between the rooftop PV system and green roof (in terms of roof utilization), energy production through the PV system is a more important aspect to consider compared to reducing the energy demand from the green roof. Furthermore, reflective roofs can also be a good option to reduce the building energy demand. Provision of an insulation layer in the roof system could be a good solution in cold climates as mentioned in the introduction. In roofs, it is better to provide an insulation layer above the structural member to avoid thermal bridges. Polystyrene was chosen as the insulation material in proposed composite roof system and 150 mm insulation thickness could be a cost- and energy-efficient solution, as indicated in a study from Italy [
41]. The U-Value of the provided composite roof section is 0.15 W/m
2K. The top layer will be of gravel/sand with a filter paper and water-proofing layers beneath it. Below the water-proofing layer, there is a thick layer of thermal insulation for maximum solar radiation protection and heat exchange between the inner and outer ambient. After insulation, a water proofing membrane and levelling concrete are provided for sloping purposes. Glulam sheet will act as a load-bearing membrane, which rests over the steel beam. Below the steel beam, a layer of rock wool insulation is provided for impact sound prevention and finally a gypsum plasterboard false ceiling is added, as shown in the roof construction details in part (b) of
Table 3.
The U-value for the proposed ground floor section is 0.18 W/m
2K, which will control heat exchange between the ground and the building. The top layer of the floor is composed of ceramic tiles laid over a wet screed layer. There are basically two layers of wet screed separated by a Damtec ceramic plus. After this layer, a moisture barrier is provided to control the vapor penetration from below. A layer of insulation is rested over the Gutex thermal flooring. Igloos are placed for prevention of water capillary action from the ground below. A leveled surface is provided over the igloo by concrete filling. Igloos are placed over a firm base of lean concrete. The construction details of the ground floor can also be seen in part (c) of
Table 3.
To improve the thermal performance of windows, efficient glazing and composite frames are used. Glazing units are available in single, double, and triple glazing with metal coating to reduce the thermal conductivity of glass [
60]. Polycarbonate is also available as a replacement of glass with a lower thermal conductivity value [
61]. According to research conducted in Estonia on the basis of energy performance and cost effectiveness, triple glazing with argon filling, with a unit price of 20 Euro/m
2, was the most suitable solution compared to double, quadruple, and quintuple glazing [
16]. Thus, in our case, we are also proposing triple-glazed windows with a thermal transmittance value of 1.2 W/m
2K. Moreover, aluminum with a thermal break is used as the window frame to reduce the thermal transmittance through the frame. To reduce the direct solar gain from windows, moveable louvers are also being used nowadays. Additionally, horizontal louvers can control the sun at high altitude, which is on south elevation, while sun at low height on east and west elevations can be controlled by movable vertical louvers [
62]. In our case, building orientation is northeast–southwest. For the front elevation along the southwest and side elevation along the northwest direction, with building functions, the student gymnasium, public gymnasium, and gymnasium and aerobic area have a mostly glazed area, as shown in
Figure 1b and
Figure 2c. To reduce the direct solar gain, movable horizontal louvers have been provided, since horizontal louvers can control the sun at high altitude on south elevation.
3.3. Air Infiltration through Building Envelope
Air Infiltration is basically air-leakages through gaps and cracks in the building envelope, and it can be measured in air changes per hour (ach). It greatly affects the energy consumption of the building, IAQ, and mechanical ventilation system performance. It also causes dampness in the thermal insulation layer and reduces its efficiency. Without an airtight building envelope, it is almost impossible to maintain the desired mechanical ventilation goals, since the performance of heat recovery devices in mechanical ventilation system gets affected by excessive leakages in the building envelope [
63]. According to research, tightening the building envelope properly and providing an appropriate mechanical ventilation system costs less compared to treating an excessive amount of infiltration air [
64]. To reduce air infiltration, buildings need to have well-insulated doors and windows with properly sealed joints. Ventilation ducts also need to be properly sealed. Thermal bridges should be avoided in new constructions by providing a continuous layer of insulation in the building envelope. Cracks in the building envelope need to be properly sealed to make them airtight. Based on the Ecotect database, the infiltration rate ranges from 0.25 to 2.0 ach. Additionally, 0.25 ach, 0.5 ach, 1.0 ach, and 2.0 ach infiltration rates represent airtight, well-sealed, average, and leaky building envelopes, respectively [
65]. According to research, the energy efficiency of the mechanical ventilation system is reduced by 11% with an increase of 0.1 ach in the infiltration rate through the building envelope [
63]. Research conducted in Canada shows considerable reduction in heating loads after changing the infiltration rate from 1 to 0 ach [
66]. In other research conducted in UK, Ampatzi chose an airtight envelope for the building with an infiltration rate of 0.25 ach [
67]. According to PH standards, the building envelope should be extremely airtight, and the allowable infiltration rate should not be more than 0.6 ach at 50 Pascals of pressure [
50].
In the present study, initially we are considering an infiltration rate of 0.5 ach, since according to PH standards, the infiltration rate should be less than 0.6 ach [
50] and an infiltration rate of 0.5 ach means a well-sealed building envelope [
65]. Then, to make the building envelope airtight, we are changing it from 0.5 to 0.25 ach, as considered by Ampatzi [
67]. Furthermore, to avoid the thermal bridges, we provided insulation outside the resisting layer in the building façade system in such a way that it is continuous and connected with roof insulation. It is supported on Glulam sheet, floor to floor, as shown in
Figure 3, which is basically a structural slab in our case and also has good thermal properties. We are also considering well-insulated doors and windows with properly sealed joints to make the building envelope airtight.
Moreover, this study assumed air temperature to be equal to the mean radiant temperature and indoor air velocity of 0.15 m/s to be equivalent to the lower level in the winter [
68]. A study by Walikewitz et al. (2015) confirms that the differences between Ta and Tmrt are negligible during most periods, as stated in previous literature [
69]. The relative humidity of 50% was used in the simulation and typical metabolic rate 2, signifying a typical walking person, with clothing level of 0.4 clo. The results indicate that the PMV at 18 °C is −0.56 which is slightly cool and the PMV at 20 °C and 22 °C is −0.14 and 0.28, respectively, which is neutral and comfortable, respectively. The results further show that, with temperatures of 24 °C and 26 °C, the PMV is 0.69 and 1.09, respectively, which is slightly warm and uncomfortable, respectively. Therefore, the temperatures selected were within the temperature band 18 and 26 °C, a comfortable temperature according to the ASHRAE standard. The gymnasium is comfortable between 20 and 22 °C because the percentage of dissatisfaction (PPD) is between 5 and 7%, as shown in
Table 4. The PMV and PPD calculation was conducted based on the ASHRAE 55 comfort tool developed by Hoyt [
70].
4. Thermal Analysis
Ecotect is the AUTODESK building performance simulation software which is used to perform all analyses in this research project. According to a survey, ECOTECT was the most-used building performance simulation (BPS) tool, followed by eQUEST in 2009 [
71]. It is widely used because of its user friendly interface and simple and intuitive 3D modelling nature to perform numerous analyses related to thermal, lighting, and acoustics. Analysis, for instance, of thermal comfort and monthly space loads, overshadowing and solar reflection, shading, artificial lighting, solar access and PV heat collection, and reverberation time and acoustics can be performed on this software for a desired location [
72]. It is also compatible with many other softwares, for instance AutoCAD, Sketckup, etc. Moreover, AUTODESK has also merged this software with REVIT, a building information modeling (BIM) software, which integrates building architecture, structure, and mechanical designs and is mostly used by building-design professionals nowadays. A major limitation of this software is the following: it is lacking with regard to studying fluid dynamics and creating complex geometry. This is because it uses the steady-state CIBSE admittance method for energy load calculation. Consequently, it is not good for detailed hourly thermal analysis but is suitable for comparative analysis and to study relative differences. On the other hand, using the admittance method makes simulation faster on this software, which makes it a good choice from the concept to design stage in the decision-making process of the building design [
73].
Main analyses done are “monthly load/discomfort” and “solar access analysis”. Monthly load/discomfort analysis gives energy in kWh/(m
2yr), required by a particular space to create comfortable conditions inside through mechanical or natural ventilation systems [
74]. It also helps in choosing an appropriate air-condition system, its capacity, and duct sizes. On the other hand, solar access analysis is helpful in understanding the availability and distribution of solar radiation over a particular surface or whole building or even a city block. This analysis can be done for both incident and absorbed/transmitted radiations for a particular duration and specific time period.
Firstly, while setting the project data on software, we defined the building type as sports and chose “Lecco, Italy” as the weather data file since Calolziocorte is located in the region of Lecco. With other settings, we defined the material properties (for walls, floor, roof, windows, doors, etc.) on software and prepared the model with almost 31 zones, where every single function (for instance, basketball court, volleyball court, etc.) is considered as a separate zone to understand the energy demand of every single area separately. The type of “active system for providing heating and cooling” is a mixed-mode system instead of a full air-conditioning system, as according to climatic analysis of Calolziocorte, Italy, there were few months during year where we had the opportunity to use natural ventilation along with heating in winter and cooling in summer. Thermostat temperature (T) is set from 18 to 26 °C, which is basically the temperature range within the comfortable zone, while relative humidity is 50%. Operating hours for the air-conditioning system are considered from 10 a.m. to 8 p.m. Occupancy is set as the typical sports facility, while activities are considered as “exercising” with 100 Watts. The clothing factor is set to 0.4 with shorts and T-shirts. To comply with PH standards, initially, the infiltration rate is considered as 0.5 ach which means that the building envelope is well-sealed. Then, to make the building envelope airtight, we changed this value from 0.5 to 0.25 ach as considered by Ampatzi in a research project [
67]. Details can also be found in
Table 5.
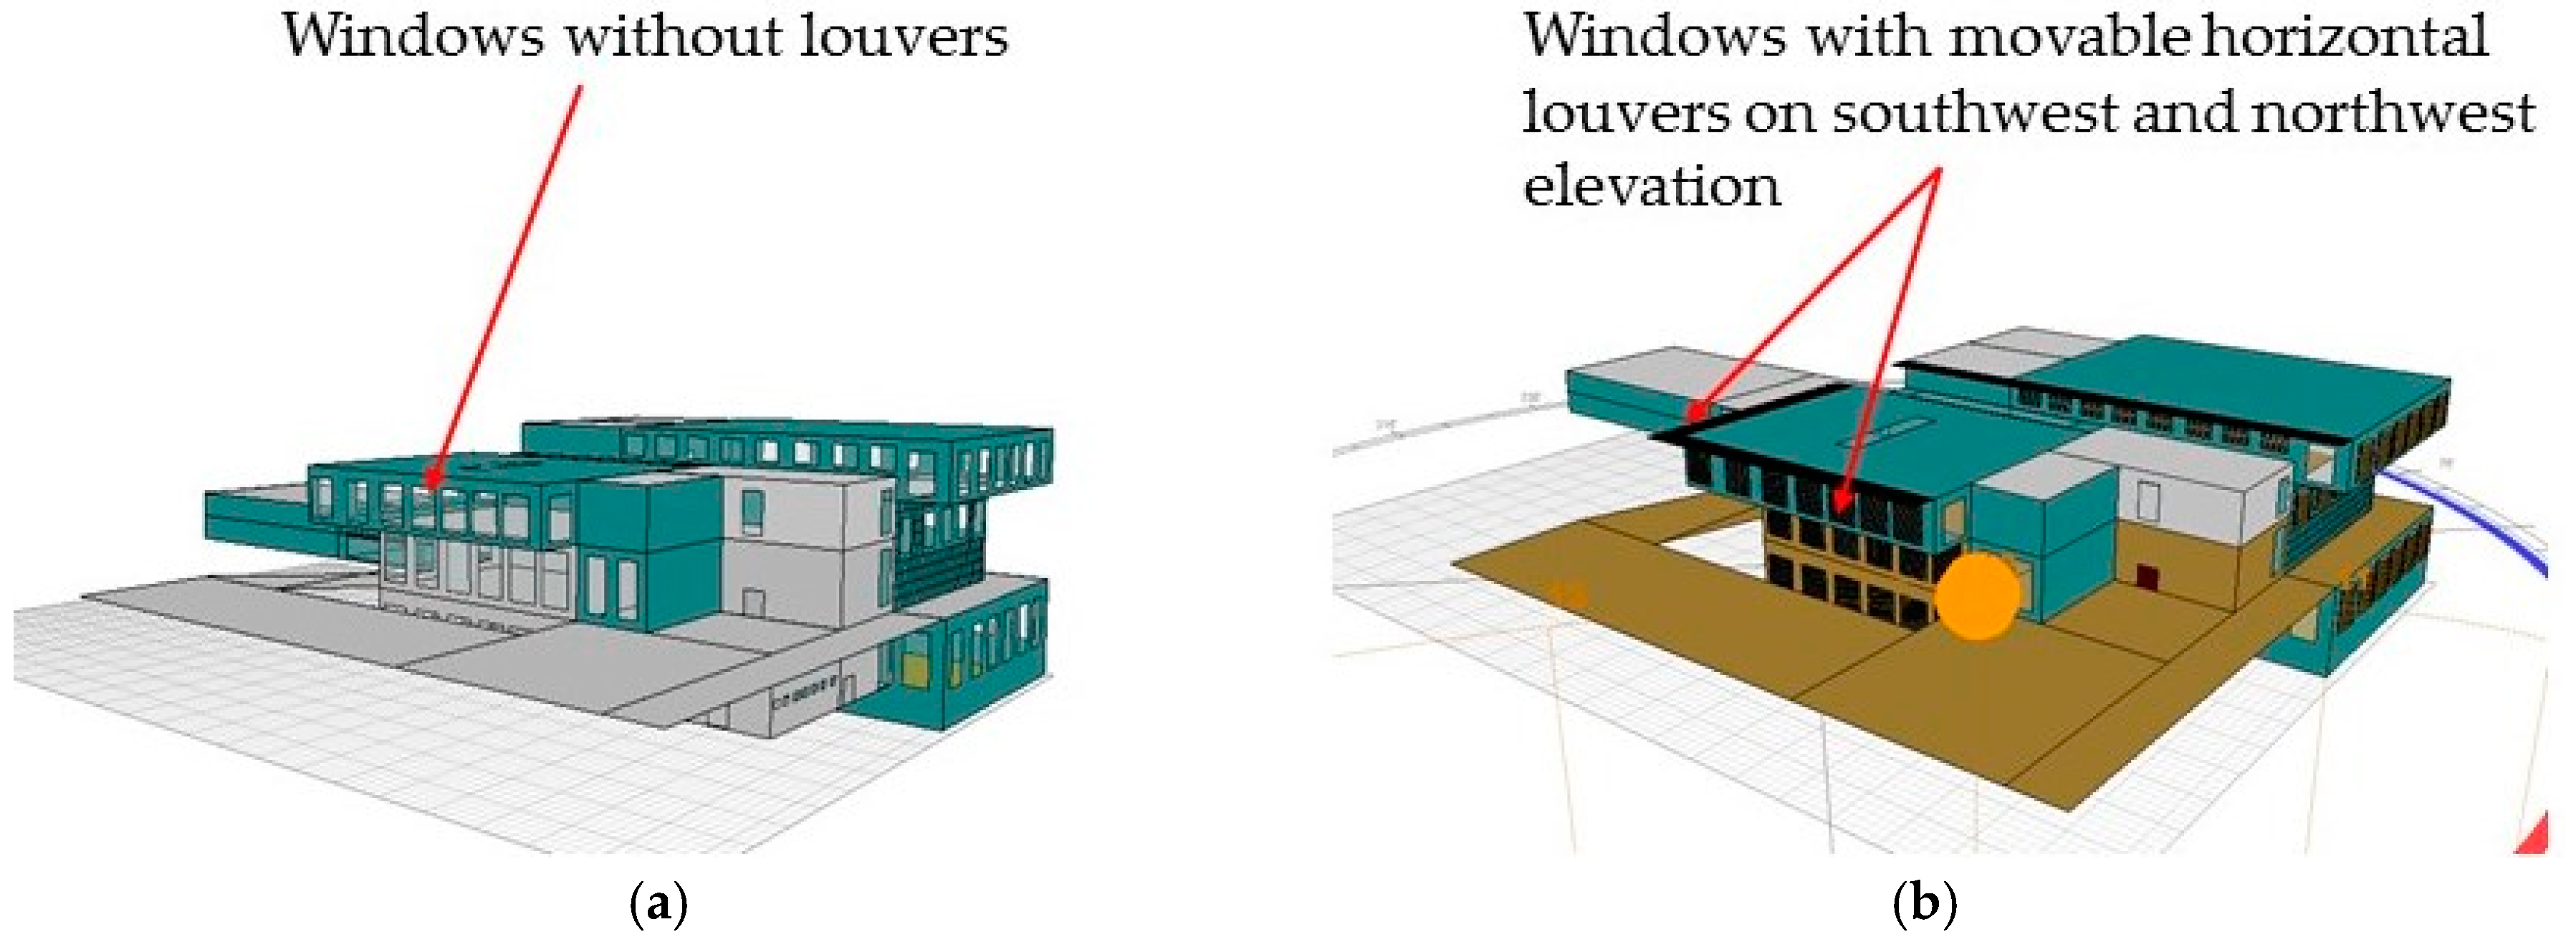
We prepared three separate building models in the software: (i) base-case model with conventional materials as discussed in
Table 2; (ii) model with proposed materials but “without louvers on the glazed area”; (iii) model with proposed materials and louvers, as shown in
Figure 4; other details of all three models were the same, as shown in
Table 5. Case-1 and case-3 were analyzed with model (ii), while case-2 was simulated with model (iii).
5. Results
As discussed in the strategies section, we considered four different scenarios—materials, window louvers, air infiltration rate and onsite energy production—to understand the impact on building energy demand. Initially, we analyzed model (i) to determine the building energy demand of the base-case and results are shown in
Table 6. According to
Table 6, the total energy demand of the building is 78.2 kWh/(m
2yr) which is much less than the average energy demand of non-residential buildings in Europe, i.e., 286 kWh/(m
2yr) as reported by [
11].
In case-1, we considered all proposed materials applied on walls, floors, roof, windows, etc., without window louvers and calculated the monthly load/discomfort to determine the total energy demand of the building. Results generated by software are shown in
Table 7 part (a). The total energy demand of the building was reduced to 48.15 kWh/(m
2yr) from 78.2 kWh/(m
2yr) after application of case-1. From here, it can be concluded that by application of the appropriate materials/section, a significant amount of energy can be saved. According to PH standards, the primary energy demand of buildings should not be more than 120 kWh/(m
2yr) while heating demand should not exceed 15 kWh/(m
2yr) [
50]. After application of case-1, heating demand was still higher, i.e., almost 37 kWh/(m
2yr) as shown in
Table 7 part (a). To further reduce the energy demand, we applied louvers around the glazed area to reduce the direct solar gain.
For case-2 analysis, we considered model (iii) where not only were all materials applied but also we considered horizontal movable louvers around the glazed area. After running the monthly load/discomfort analysis, we found that there was no difference in total energy demand even after providing horizontal movable louvers as the total energy demand of building remained almost the same because of an increased lighting load.
Table 7, part (b), shows the total energy demand of the building with horizontal movable louvers.
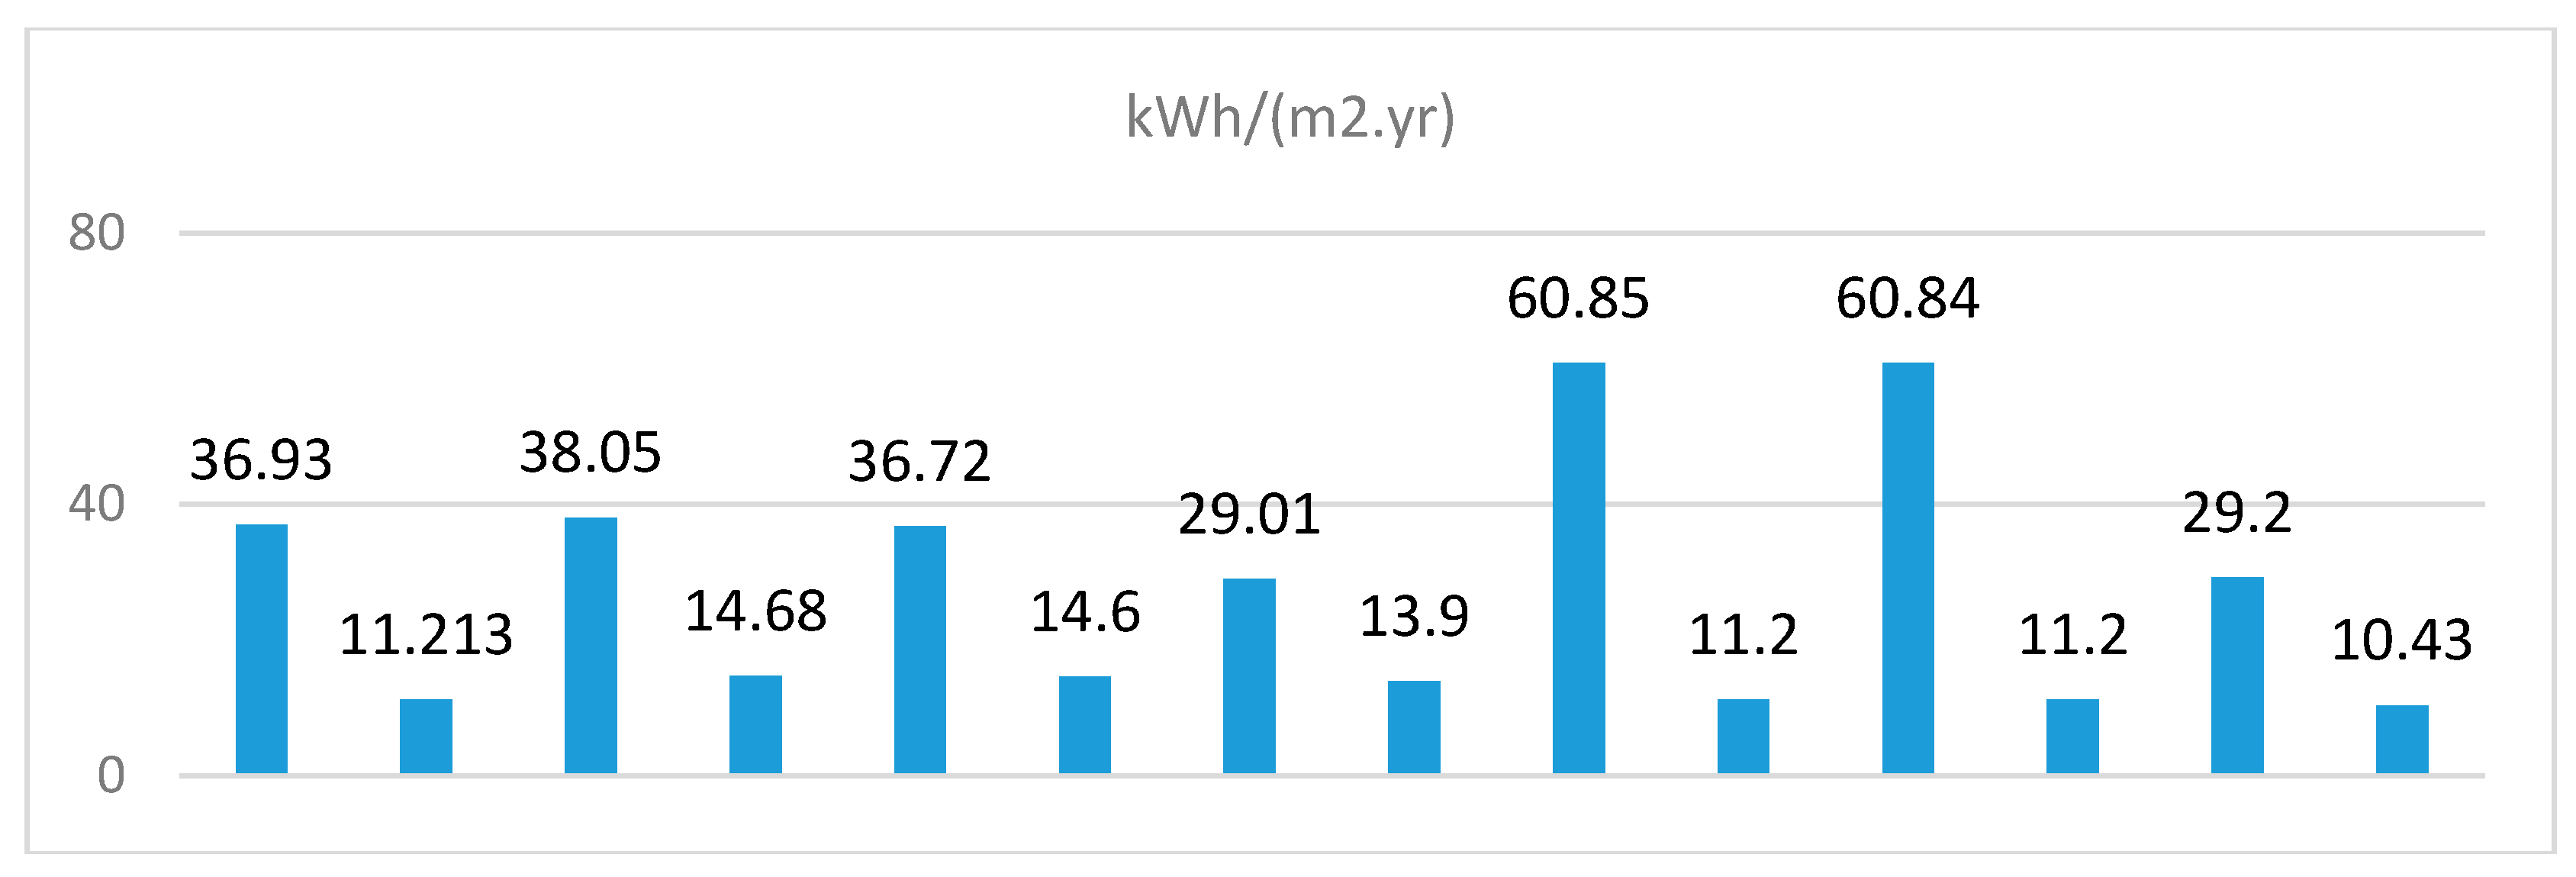
We also analyzed the different functions of the building individually to identify the areas consuming more energy; the model used for this purpose was model (ii) since there was no impact of louvers on the building total energy demand. Important areas which were analyzed were gym area on the ground floor, gym area on the first floor, gym area on the second floor, basketball court and volleyball court. Results generated are summarized in
Figure 5. From
Figure 5, it is clear that the per m
2 heating and cooling demand of the basketball and volley ball court was quite high compared to the whole building. This was due to the higher volume of this part of the building as both courts were 9 m in height. For the ground floor gym, the heating load was almost the same as that of the whole building but the cooling load was a bit higher. This was mainly due to the position of the ground floor gym as one of its walls was on the southern side and the other was on the western side with a huge glazed area. For the indoor games area, the total energy demand was less as it was positioned on the eastern side and was also of less volume. From here, we concluded that the major contribution to the total energy demand was due to basketball and volley ball courts, with heating loads of more than 60 kWh/(m
2yr); so, by reducing the air infiltration rate through a building envelope, energy demand was further reduced. Furthermore, it was done by changing the air infiltration rate from 0.5 to 0.25 ach to make the building envelope airtight.
Based on individual function results, we reduced the air infiltration rate from 0.5 to 0.25 ach to make the building envelope airtight and the results generated by the system were quite good, as the heating energy demand was reduced to 19 kWh/(m
2yr) from 37 kWh/(m
2yr) and the cooling demand was also reduced to 9 kWh/(m
2yr) compared to case-1 as shown in
Table 8. Additionally, we also found that by application of case-3, the total energy demand was reduced to almost 40% as compared to case-1 which showed how important “airtight building envelope” could be in reducing the energy demand of a building.
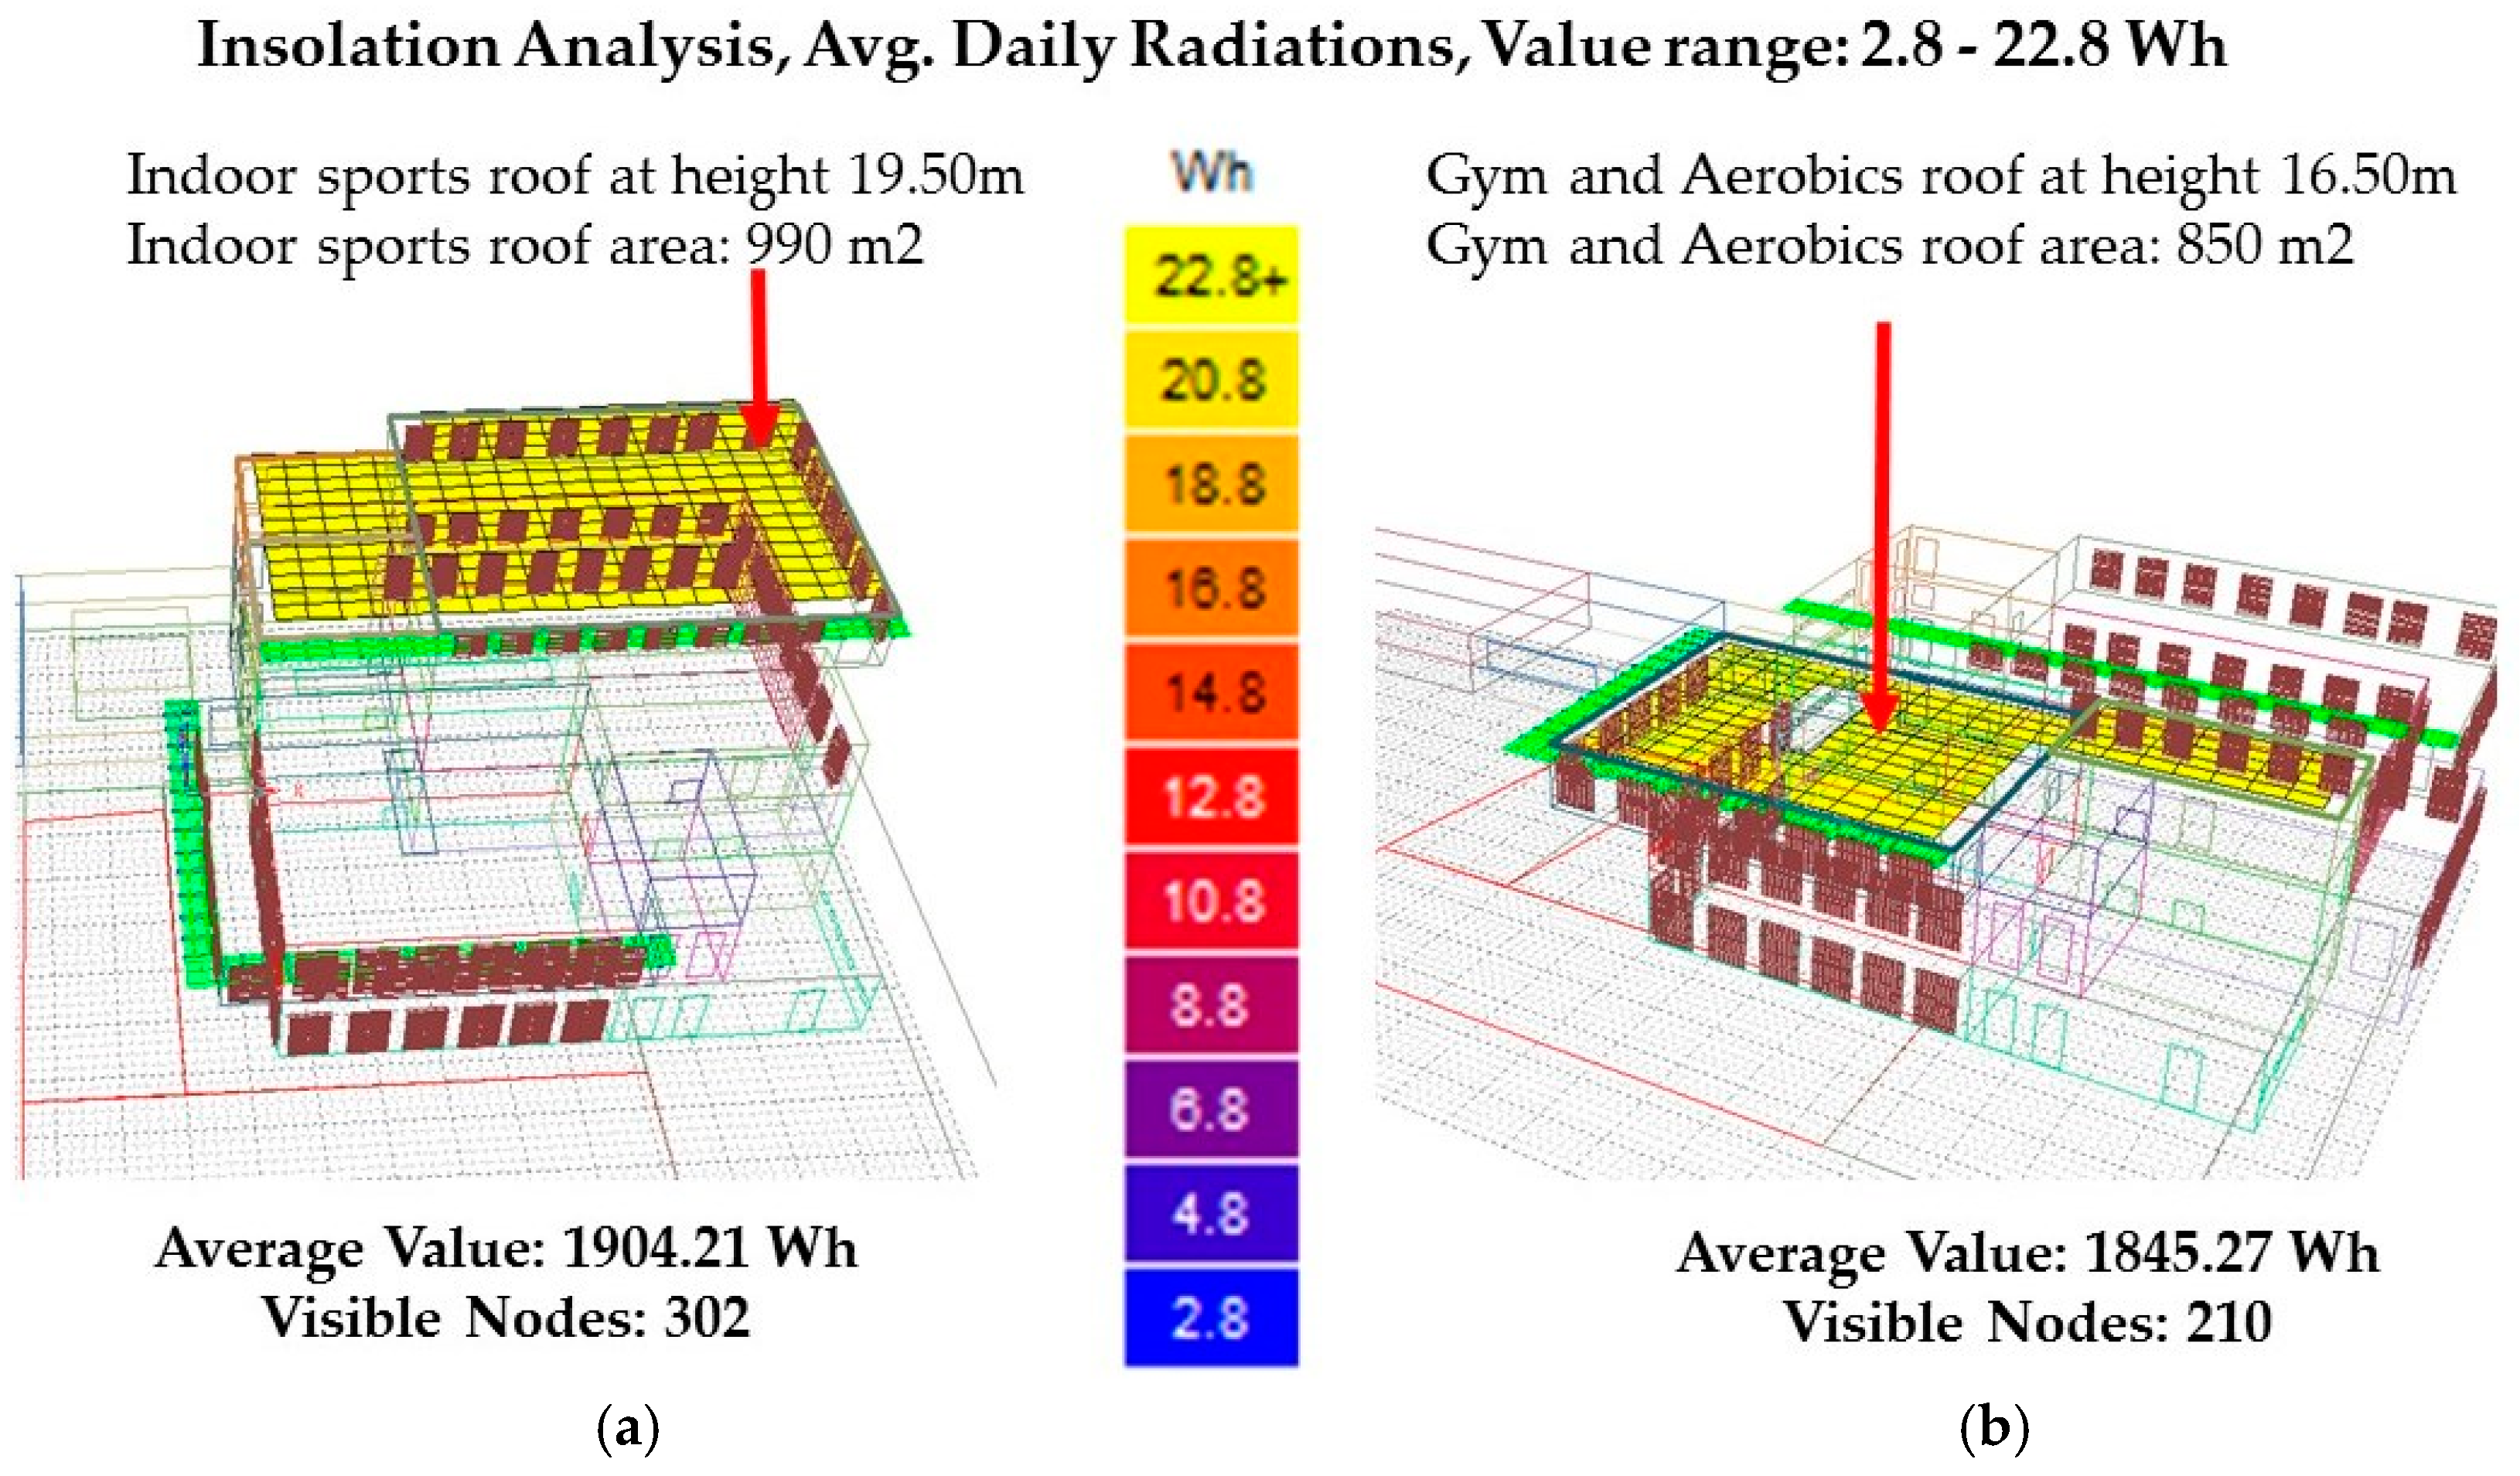
Now, to reduce the net energy demand further, we considered case-4 and conducted a solar access analysis to understand how much energy can be produced on site. As discussed in the thermal analysis section, solar access analysis not only calculates incident radiations but also transmitted radiations. We calculated incident solar radiation over the roof area. Since we had roofs at two different levels, as shown in section BB’ in
Figure 2c—indoor sports roof at 19.50 m height and gymnasium and aerobics area roof at 16.50 m height, as discussed in the project brief—we considered both roofs separately for solar access analysis. The roof area above the indoor game area was 990 m
2 while the roof area above the gym and aerobics area was 850 m
2.
Figure 6 shows a solar access analysis done on different parts of building roofs separately. It is also important to mention that the time period set for this analysis was a whole year while the time range per day was from 08:00 a.m. to 06:00 p.m. Subsequently, we calculated the average daily value for incident solar radiation which was basically the sum of all incident solar radiation per metric per number of days in a year.
It is important to mention that in case-4, on-site energy was supposed to be produced through the application of the rooftop solar PV system and the produced energy would be used to run the electrical energy loads including lighting. According to statistics, 15–18% of incident solar radiation can be converted into electricity depending upon the location and climatic conditions of the region [
75]. Moreover, because of line losses and the maintenance factor, etc., this figure can be further reduced to 12–13%. Geographically, Calolziocorte is located at a latitude of 45°48′4″ North, and a longitude of 9°25′57″ East, as mentioned in the climatic analysis section; so, Photovoltaic cells can be installed according to the latitude angle. After running a solar access analysis, we obtained 1904 Wh/m
2/day average daily incident solar radiation on the indoor games area roof and 1845 Wh/m
2/day average solar radiation on the gym roof. We converted both these figures into average annual incident radiations and assumed that 12% of these radiations would be converted into electricity. We also assumed that PV cells would be applied on 50% of both roof areas as some area was required for maintenance and installation purposes. Moreover, the space left for maintenance/installation also depends upon the installation angle of PV cells to avoid shading. The final value which we received was 21.49 kWh/(m
2yr), which was the amount of energy generated on site as shown in
Table 9. Owing to the intermittency of PV output, a backup system in the form of battery-storage or a grid is essential. For example, during the nighttime and overcast conditions, a typical PV system is not able to support the load requirements of the building for which it is designed. Furthermore, the PV system may come across occasions when its output exceeds the electricity requirements by the building. To deal with this mismatch between demand and supply, instead of the battery backup system which is expensive and maintenance-demanding, we considered a grid-connected PV system. Additionally, the price of solar PV cells has seen a fast decline in recent years, dropping from 76 US
$/W to 0.3 US
$/W [
76]. A recent study of a 20-kW PV facility in the Spanish building sector revealed a cost of 2500/kWp. The payback period of the installation is reported to be of the order of 13 years [
77].
As discussed in the strategies section, the average energy demand of commercial buildings in Europe is 286 kWh/(m
2yr) [
11]. According to another audit done on sports facilities in Lombardy, Italy, it was found that only the heating demand of sports facilities was 268 kWh/(m
2yr) [
49]. Moreover, through analysis, it was also found that the base-case model energy demand was 72% less than the average energy demand of commercial buildings in Europe as shown in
Table 10. Additionally, after application of all proposed sections, reducing the air infiltration rate through a building envelope and on-site energy production, we found that a significant amount of energy was reduced, as shown in
Table 10, as compared to the base-case model energy demand. Only after application of case-1 (through appropriate materials and passive strategies), we found that almost 38% of the building energy demand was reduced which is quite significant. Moreover, through case-3 (airtight envelope and appropriate materials), reduction in energy demand was noted to be 63%, as shown in
Table 10. Furthermore, according to the Zero energy building concept, the sum of Energy produced (+) and energy consumed (−) should be equal to zero. After application of case-3, the remaining energy demand of the building was 28.93 kWh/(m
2yr) which was Total Energy (TE). On the other hand, energy produced on site, in case-4, was 21.49 kWh/(m
2yr) which was in the form of Electrical Energy (EE). Thus, net energy demand could not be calculated by simply subtracting the energy produced from the energy consumed since as both were different forms of energies. However, from the results, it was very clear that energy produced on site after case-4 was almost equal to the remaining energy demand of the building after application of case-3. Thus, it can be concluded that the net energy demand of the building was very minimal compared to the base-case, and reduction in total energy demand after application of case-4 would be closer to 90%; so, we can call our building nZEB. Furthermore, according to PH standards, the heating demand should not exceed 15 kWh/(m
2yr) [
50], as discussed earlier in the results section; so, we can conclude that our building is also in compliance with PH standards.
6. Discussion
The concept of sustainable buildings fundamentally incorporates approaches such as minimizing heating and cooling loads, improving the building envelope, using energy efficient equipment and producing energy from renewable resources. In other words, nZEB can be attained through energy efficient measures (EEMs) and by application of renewable energy and other technologies (RETs) [
18]. An integrated building design approach can be helpful in this respect. Energy efficiency in buildings can be attained through intelligent design and implementation of the five Passive House principles: thermal bridge free design, superior windows, ventilation with heat recovery, quality insulation and airtight construction [
50]. The appropriate selection of the site, placement, shape and orientation, window arrangement, materials and envelopes are the governing aspects that define the building character. The architecture of a building has always been in a close relationship with the climatic context. Giving due consideration to climatic conditions is a crucial part of developing buildings and spaces. Especially for a sustainable design, where the impact on the environment needs to be kept insignificant, understanding the climate of the project area constitutes a crucial step at the very beginning of our design process.
The choice of material is critical in reducing the energy demand of a building and has to be made taking into account the prevalent climatic conditions. The present work focuses on Calolziocorte in Italy which has hot and wet summers with moderately cold winters and a high level of precipitation. In EEMs, our focus was on improvement of the building envelope performance and this was achieved through application of various conventional passive techniques such as insulation, high quality windows and solar shading. Insulation performs better in cold climates. Large insulation thicknesses are not helpful in terms of complete life cycle analysis as energy used in material production might be higher than energy savings in its lifetime span [
41]. Installation of thin insulation can also be uneconomical as the installation cost is the same for different thicknesses. Thus, according to various studies, optimal insulation thickness is required to obtain maximum benefits in terms of energy and cost saving. Pikas applied active and passive techniques in the cold Estonian climate to attain a nZEB office building. Another study from Estonia suggested cost optimal solutions for an office building while considering construction cost only. It showed that district heating with 140 kWh/(m
2yr) and specific heat loss through an envelope with 0.33 W/m
2K were cost optimal solutions [
78]. In the study conducted by Pikas, various insulation thicknesses in a concrete sandwich wall and six different types of glazing systems were analyzed without changing the HVAC system while the PV system was used as an active technique. Results suggested that triple glazing with argon filling and 200 mm insulation thickness in the walls were cost optimal solutions with a primary building energy demand of 110.6 kWh/(m
2yr) and 293.2 Euro/m
2 as 20-net present value (NPV). On the other hand, the most energy efficient solutions were quintuple glazing with Krypton filling and 390 mm insulation thickness in a concrete composite panel with 103.4 kWh/(m
2yr) primary energy consumption and 349.4 Euro/m
2 20-NPV [
16]. It is also worth mentioning that the total energy demand of an office building in this case was still higher compared to our case-1, i.e., 48 kWh/(m
2yr) since Pikas considered a full air conditioning system during analysis while we conducted our analysis with a mix-mode system as we considered natural ventilation for part of the year.
The roof is an important part of a building envelope system as most of the time during day, it is exposed to solar radiation. In the present work, composite roof is provided with a 150-mm thick polystyrene insulation layer to reduce the thermal gain. Polystyrene was chosen since it is widely available and 150 mm thick insulation could be cost and energy efficient according to a study, carried out in Italy, with another type of insulation having almost the same thermal conductivity and unit price. The U-value of the composite roof section is 0.15 W/m
2K, a figure close to the suggested value according to PH standards [
50]. For walls, rain screen cladding has been used as an insulated–ventilated façade system. It not only separates the external cladding material from the rest of the composite wall system but also blocks the rain penetration. The rain screen cladding system has also been used to avoid the thermal bridges as 120 mm thick expanded polystyrene insulation is placed outside the resisting layer to keep it continuous, as according to PH standards all edges, corners, connections and penetrations must be planned and executed with great care to avoid thermal bridges [
50]. The thermal transmittance value of the proposed wall system is calculated to be 0.20 W/m
2K which is closer to the maximum. The U-value of walls according to PH standards is 0.15 W/m
2K. Glulam, a structurally strong and sustainable material with low thermal conductivity is used in the floor, roof and ceiling sections as a structural member. The composite floor system with Igloos and 120 mm thick extruded polystyrene, with a thermal transmittance value of 0.18 W/m
2K, is provided to control the heat exchange between the ground and building. Similarly, the optimal level of glazing also needs to be selected. According to research, triple glazing with argon filling is the cost optimal solution as well as being energy efficient in cold climates [
16]. Thus, triple glazed windows with an advanced coating and frame have been provided with a thermal transmittance value of 1.2 W/m
2K. A glass façade, which is mostly on the southwest and northwest side, is provided with movable horizontal louvers since the sun is at high altitude on the southern side and movable horizontal louvers can block the solar radiation properly. All of these passive strategies led to an energy demand reduction of almost 38% compared to the base-case model energy demand. Making the building envelope airtight can help to reduce the building energy demand significantly. It also helps to maintain good IAQ inside spaces. The building envelope should be airtight and the maximum air infiltration rate should not be more than 0.6 ach, according to the PH standard [
50]. After changing the infiltration rate from 0.5 ach (well-sealed envelope) to 0.25 ach (airtight envelope), we obtained a reduction of almost 40% in the building energy demand as compared to case-1. Solar PV can not only be installed on the roof but also on the south façade. A study suggests that up to 35% of the total electricity needs of cities can be catered through PV systems [
18]. It has also been concluded by researchers that, in the case of low tariff structures, ideally it is more economical to use PV energy internally rather than selling it to the grid [
16]. In our case, we considered PV cells only on 50% of the roof area to provide some empty space for maintenance purposes. Furthermore, the entire power output from solar PV is considered to be internally consumed under normal operation of a building, though occasionally, for example during holidays when the building is closed, we may need to export unused electricity to the grid. Through PV application in our case, we produced 22 kWh/(m
2yr) of electricity which is almost equal to the remaining energy demand of a building after application of case-3, as shown in
Table 10.
From here, we can conclude that nZEBs can be attained through application of appropriate active and passive techniques. The nZEB model can be used as a reference model and be further investigated with other cost and energy efficient solutions. Since buildings consume energy during all phases of their life, i.e., construction, operation and maintenance, energy efficient buildings can greatly help in addressing the global energy and environmental concerns. Awareness of modern energy efficient solutions among the general public and in particular building sector stakeholders will help to attain the desired results.


