Article

Assessing the Impact of Roadside and Median Safety Barriers on Available Sight Distance on Croatian Motorways


by
Ivica Stančerić
1,*,
Igor Majstorović
2 and
Željko Stepan
1
1
Faculty of Civil Engineering, University of Zagreb, Fra Andrije Kačića-Miošića 26, 10000 Zagreb, Croatia
2
Centar građevinskog fakulteta d.o.o., Sveti Duh 129, 10000 Zagreb, Croatia
*
Author to whom correspondence should be addressed.
Infrastructures 2026, 11(9), 316; https://doi.org/10.3390/infrastructures11090316
Submission received: 28 July 2026 / Revised: 1 September 2026 / Accepted: 3 September 2026 / Published: 7 September 2026

Abstract

Available sight distance (ASD) on motorways represents the unobstructed line of sight from the driver’s perspective to an obstacle on the carriageway, which must equal or exceed the required stopping sight distance (SSD). This study evaluates ASD across both two-dimensional (2D) and three-dimensional (3D) motorway alignments, encompassing right- and left-hand horizontal curves combined with different vertical alignments, as well as roadside and median barriers. 2D analyses were performed on predefined theoretical profiles, while 3D ASD evaluations were conducted on real-world models of existing motorway sections in Croatia. These sections were selected based on their diverse horizontal and vertical geometric alignments, design eras, traffic characteristics, and historical crash data regarding collisions with obstacles. The findings reveal that safety barrier placement on motorways can severely constrain sightlines, demonstrating that even radii exceeding the regulatory minimums are insufficient to guarantee necessary SSD requirements. Visibility restrictions from safety barriers are especially pronounced along barrier-restricted horizontal curves, primarily on right-hand curves and occasionally on left-hand curves, depending on the radius. In certain real-world sections, cut slopes also restrict the required visibility. Current Croatian guidelines rely on 2D analysis, which fails to account for safety barriers obstructing visibility. This research emphasises the critical necessity of conducting continuous 3D sight visibility simulations during initial design phases, while recommending further research that could be implemented to update regulatory frameworks regarding parameters for ASD analysis.

1. Introduction

Stopping sight distance (SSD) is a critical safety parameter on motorways, defined as the distance necessary for a vehicle to come to a complete stop before colliding with a stationary object in its path. Available sight distance (ASD) represents the actual line of sight accessible to the driver to detect an obstacle on the carriageway, a value that must equal or exceed the required SSD. ASD is evaluated across both horizontal and vertical alignments in both directions of travel, typically in compliance with relevant geometric design guidelines, standards, and regulatory frameworks. Furthermore, ASD can be significantly constrained by various roadside and median features, meaning that the motorway alignment plays a decisive role in maintaining adequate visibility. The most prevalent obstructions on the motorways are safety barriers, which are typically installed within the median to separate opposing traffic streams. Furthermore, these systems are frequently positioned along the roadside adjacent to high embankments, on bridge structures, and over drainage culverts. Such barriers may be fabricated from a variety of materials and structural components, including steel or concrete, to absorb vehicle impact energy and mitigate injury severity.
Numerous studies [1,2,3,4,5,6,7,8,9] evaluate traffic barrier efficiency regarding crash severity. Using Iowa accident data, ref. [1] compared flexible cable barriers, semi-rigid guardrails, and rigid concrete barriers, revealing that cable barriers yield the lowest injury levels. Relative to cable barriers, crashes involving concrete barriers and guardrails present a 12.09% and 7.69% higher probability of injury, respectively. Traditional W-beam guardrails serve as critical safety infrastructure by absorbing crash energy and redirecting vehicles. A multivariate logistic regression analysis of single-vehicle run-off-road crashes [2] confirmed that W-beam guardrails provide the highest protection level. Conversely, concrete barriers, trees, and poles increase fatality odds by 2.5, 3.1, and 4.7 times, respectively, compared to W-beam guardrails, with concrete barriers showing no statistical risk difference from other fixed roadside hazards. To optimise W-beam systems, innovative modifications like rubber dampers, lamellar shock absorbers [3], or internal rubber sandwich layers [4] have been proposed to minimise lateral displacement and vehicular damage. However, barrier performance varies by environment. Ref. [5] analysed crash data from mountainous regions in Southwest China, indicating that local collisions involving W-beam guardrails are more prone to resulting in severe injuries than flexible alternatives or roadside trees.
Geographic, vehicle-specific, and structural factors heavily complicate barrier performance. In Latvia, where flexible W-beam guardrails and rigid concrete barriers predominate based on road section criteria, W-beam effectiveness depends strictly on the impact location relative to structural posts [6]. Because historical safety criteria focused primarily on passenger cars, barrier collisions leave motorcyclists 15 times more likely to suffer fatal injuries than car occupants [6]. Although modified systems improve vehicle containment [3], continuous, gapless concrete barriers are frequently safer for motorcyclists, as they eliminate the risk of catching on sharp post edges, a severe hazard inherent to W-beam configurations [6]. Furthermore, crash severity determinants vary by road classification. In Wyoming, road surface, vehicle age, and seatbelt use dictate crash severity on non-interstate highways, whereas interstate crash severity depends heavily on barrier type and driver condition [7]. Similarly, analysis of Croatian rural data identified nighttime driving and run-off-road manoeuvres as primary risk factors, emphasising the urgent need for targeted infrastructure upgrades to protect vulnerable motorcyclists [8].
Median crossover crashes carry high risks of severe injury, making median barriers a vital countermeasure. An assessment of barrier performance [9] revealed that flexible cable systems have the highest penetration rates due to vehicle underride or heavy vehicle breaching, whereas rigid concrete barriers have the lowest. Penetration risks increase on dry roads due to higher travel speeds and among large trucks due to their mass. Conversely, motorways with two lanes in each direction exhibit lower penetration risks, although the exact reasons remain unclear. Collisions on horizontal curves and high-speed segments show a greater probability of vehicle redirection due to altered impact angles and increased momentum.
Medians and barriers are frequently implemented where motorways merge with or yield to rural roads. At these intersections, traffic-calming features, such as gateways and chicanes, can be deployed to segregate and calm traffic [10,11,12,13,14]. Illustrative cases documented in the literature [10,11,12,13,14] demonstrate how policymakers can enhance the efficacy of speed reduction measures to meet the requirements of all road users. When seamlessly integrated into the road network, these measures can foster safer traffic conditions that discourage reckless driving while promoting a more considerate and energy-efficient approach to road use [13]. Furthermore, recent research indicates that driver perception serves as a critical determinant of compliance on traffic-calmed roads [14].
To preserve protective functionality, barrier systems must be properly maintained [15]. Grey Relational Analysis (GRA) mitigates the subjectivity inherent in traditional Multi-Criteria Decision Analysis (MCDA) tools—such as the Analytic Hierarchy Process (AHP) or the Technique for Order of Preference by Similarity to Ideal Solution (TOPSIS) by objectively determining maintenance weights based on inherent data, offering a reliable approach to maximising safety within tight budget constraints [15].
While this extensive body of literature establishes how barrier selection impacts collision mechanics and maintenance frameworks, it introduces a critical engineering trade-off: roadside safety barriers significantly restrict ASD on horizontal curves. Consequently, conventional minimum curve radii based purely on centrifugal force are often inadequate to meet SSD demands [16]. The widespread implementation of rigid concrete barriers ranging from 1.1 m to over 1.4 m in height along median and outer-shoulder edges, interchange ramps, and bridge overpasses severely constrains the sightline [17]. Maintaining adequate SSD around these tall concrete structures, bridge abutments, and retaining walls requires wide shoulders that are frequently compromised or omitted due to economic constraints or artificial design assumptions [17]. These visibility limitations become more critical on high-speed divided highways where horizontal curves overlap with crest or sag vertical alignments [18,19]. These three-dimensional (3D) compound alignments cause widespread SSD deficiencies under standard guidelines, which can be mitigated by optimising curvature parameters, utilising specialised 3D estimation charts, or increasing the regulatory vehicle taillight design height to 1.08 m [18,19].
Ultimately, evaluating required SSD remains a highly complex issue governed by interacting human, vehicle, and environmental factors, prompting public road authorities in Germany, America, and Australia to continuously revise the mathematical models in their geometric design guidelines to better integrate critical human factors [20]. A major limitation of conventional, deterministic SSD guidelines is their failure to protect drivers with reduced cognitive or physical capabilities, which is a growing concern given aging global demographics [21]. To evaluate this gap, automated MATLAB and Python algorithms have been used to extract continuous ASD profiles from mobile Light Detection and Ranging (LiDAR) data across seven crash-prone highway segments in Alberta, Canada. This empirical ASD was compared against standard American Association of State Highway and Transportation Officials (AASHTO) [22] criteria, SSD for highly skilled drivers, and SSD for drivers with limited abilities. The analysis revealed that up to 6% of the segments fell short of AASHTO guidelines [22]. Comparative evaluations demonstrated that areas with insufficient sight distance experienced crash rates 2.15 times higher under AASHTO guidelines [22] and 1.25 times higher when integrating driver limitations. Furthermore, older drivers were significantly overrepresented in collisions within these noncompliant regions.
SSD requirements vary globally, displaying a distinct lack of international harmonisation even among European Union (EU) member states [23,24,25,26,27,28,29,30]. ASD is conventionally evaluated based on the geometric relationship between the driver’s eye position and a target obstacle, making these design heights highly influential. Generally, the standard driver eye height ranges from 1.0 m to 1.1 m [23], with Austria [24], Croatia [25], Germany [26,27], and Slovenia [28] mandating 1.0 m, the US [29] requiring 1.08 m, and Italy [30] specifying 1.1 m. Target obstacle heights exhibit even more severe discrepancies, ranging from 0.0 m in Austria [24] to 0.1 m in Slovenia [28] and Italy [30], and between 0.2 m and 0.25 m in Croatia [25]. Meanwhile, the US [29] specifies a 0.6 m obstacle height, whereas German guidelines apply a baseline of 1.0 m for both motorways (0.5 m exclusively for crest vertical curve estimation) [26] and rural roads [27]. Regarding lateral positioning, most international guidelines place both the driver’s eye and the obstacle in the centre of the traffic lane [24,26,27,28,29,30], whereas Croatian regulations [25] dictate a placement 1.5 m away from the carriageway shoulder line. Empirical field data frequently challenge these conservative design standards. For instance, UK survey data [31] indicate that all observed vehicles exceed the 1050 mm minimum standard, yielding a fifth-percentile driver eye height of 1078 mm. Similarly, research from Italy [32] identifies 15th-percentile eye heights between 116 cm and 118 cm, which represents a 6% to 13% variance from current domestic design policies [30].
The primary limitation of current geometric design guidelines is their separate evaluation of SSD for horizontal and vertical alignments using two-dimensional (2D) analysis [24,25,26,27,28,29,30]. This conventional approach yields imprecise results on compound curves and fails to account for critical roadside obstructions and superelevation of carriageway, prompting researchers [33,34,35,36,37] to integrate three-dimensional (3D) ASD integration. For instance, an analysis of 402 horizontal curves across 12 rural highways confirmed that 3D-modelled sight distance, particularly 3D digital surface modelling (DSM) of ASD, provides more realistic results, emphasising its importance over 2D methods when evaluating safety risks both in highway design and during the operational service life [34]. Furthermore, a recent study [35] introduced a 3D method to address the sight distance-related safety effects of installing median barriers at horizontal curves on undivided highways. In that study, the 3D approach allowed for simultaneous consideration of both the 3D geometry of the highway and features outside the travelled way, thereby delivering a more reliable outcome. Additionally, the capability of this modelling method to incorporate fully 3D elements provides a highly accurate and dependable risk assessment tool. Similarly, an evaluation of rural roads under Croatian regulations [36] demonstrated that 2D analysis cannot account for specific cross-sectional features that restrict ASD.
Although available sight distance (ASD) on the passing lane of left-hand horizontal curves is occasionally overlooked, research indicates that visibility limitations frequently occur within these segments. One specific study [37] examined potential safety violations regarding SSD provision at a vehicle speed of 130 km/h. The analysis focused on the passing lane of left-hand curved, divided highways overlapping with crest vertical curves across various design values for horizontal alignment, vertical alignment, and inner shoulder widths. The results revealed distinct zones of SSD inadequacy. Subsequently, using an explanatory modelling approach across a range of geometric parameters, an evaluation of SSD sufficiency was conducted. This assessment quantified the probability of SSD inadequacy and predicted the required adjustment to object height (amended object height) to guarantee adequate sight distance. These models offer valuable utility for researchers and practitioners seeking to evaluate the complex interactions of design parameters that induce SSD deficiencies.
When investigating the influence of safety barriers on available sight distance (ASD), accurate 3D modelling is essential. A relevant study [38] evaluated ASD variations across different barrier types and heights, reflecting diverse design decisions and cross-country variations in road standards. To achieve this, the Shape Bender extension within the SketchUp Pro 2019 environment was employed to adapt the barriers to terrain models depicting various combinations of horizontal and vertical alignments. This tool significantly facilitates 3D design and proves particularly beneficial for linear transport infrastructure. Furthermore, Geographic Information System (GIS) tools enable a comprehensive understanding of how different guardrail configurations affect ASD on horizontal curves. The integration of multipatch features allows the lines of sight to account for complex obstructions previously generated via 3D computer-aided design software. Consequently, a high-fidelity 3D reproduction of guardrails yields highly reliable results with minimal error, outperforming more simplified analytical methods.
To address these deficiencies between 2D and 3D ASD estimation, researchers [39] deployed 3D mobile LiDAR mapping on a mountainous expressway in Zhejiang Province to measure ASD directly within a 3D environment, factoring in vehicle speeds, driver reaction times, and pavement friction. Using a reliability framework and Monte Carlo simulations, they evaluated the probability of ASD meeting SSD demands under varying weather conditions. The findings indicate that road sections with a probability of insufficient sight distance exceeding 10% experienced crash rates 1.5 times higher than compliant sections. Furthermore, this failure probability increased 2.3 times on rainy days, validating the necessity of 3D, weather-adjusted safety modelling during a highway’s operational service life. Cars equipped with Advanced Driver Assistance Systems (ADASs) can mitigate safety issues, but their efficacy relies entirely on accurate environmental sensing. Current sensors remain vulnerable to weather and internal errors, leading to malfunctions or misinterpretations [40]. Further development is needed to improve precision detection, reduce false alarms, and optimise interface usability [41]. Most legacy road infrastructure was built without considering Automated Vehicles (AVs). A comprehensive review [42] evaluated physical infrastructure adaptations and geometric design parameters, such as stopping sight distance (SSD), vertical curve radii, and lane configurations, necessary for integrating AVs into mixed traffic. These physical modifications, illustrated through a deceleration lane example, were analysed based on AV market penetration rates. To evaluate if AVs can safely adapt to as-built vertical geometry, a study [43] used virtual simulations to analyse AV ASD and its impact on speed limits. Using a scenario generation framework, various vertical alignments and LiDAR sensors were simulated to determine maximum safe AV speeds. The results [43] show that crest curves do not disadvantage ASD compared to sag curves or tangents. However, compatibility depends heavily on automation levels: a Level 4 AV requires multichannel LiDAR and advanced perception algorithms to navigate an as-built vertical alignment at a design speed of 100 km/h, while a Level 3 AV can only adapt to profiles where the design speed is 60 km/h [43].
ASD fundamentally pertains to obstacle recognition from the driver’s perspective. Within modern motorway infrastructure, the incorporation of dynamic signage proves highly beneficial during traffic incidents and abrupt changes in the operating environment. Dynamic speed limits (DSLs) [44] or variable speed limits (VSLs) [45] on variable message signs vary in response to real-time traffic or road conditions. Within this context, recent research evaluated the influence of selected variable speed limit scenarios on traffic efficiency and safety across various motorway and expressway sections under diverse traffic conditions. Such systems effectively detect fluctuations in traffic flow and provide early warnings to mitigate potential accidents.
This paper investigates the impact of median and roadside safety barriers on the ASD on Croatian motorways, a topic that has remained unexamined in published research. The primary objective is to evaluate the ASD as a function of horizontal and vertical alignments for both left- and right-hand curves on barrier-restricted motorway sections, with the aim of determining the minimum horizontal curve radii for such segments. Because the combined influence of safety barriers and spatial alignment is particularly problematic for high-speed corridors, the research methodology encompasses both 2D and 3D ASD analyses. The 2D analysis is conducted on theoretical motorway models, whereas the 3D analysis is performed using Bentley OpenRoads Designer 2025 (ORD) software [46] on real-world motorway models generated from LiDAR point cloud data, in accordance with Croatian regulations [25,47]. Consequently, this study evaluates and, to a limited extent, compares theoretical and real-world scenarios based on a standard cross-sectional profile: a dual-carriageway motorway featuring two traffic lanes with a central median and an emergency lane in each direction. As a result of this research, the study introduces two parameters: the minimum horizontal curve radius (Rmin,bar) for both left- and right-hand curves on barrier-restricted motorway sections with varying longitudinal grades and design speeds, and the available sight distance under barrier restrictions (ASDbar), which quantifies the extent to which a safety barrier limits the ASD within specific horizontal radii and longitudinal gradients and operating speeds. Both parameters exhibit limited applicability, making them suitable primarily for the preliminary phases of motorway design to ensure the adequate selection of horizontal curve radii. Consequently, further investigation is required to establish a model that will fully validate the practical application of Rmin,bar. By demonstrating this integrated approach and illustrating how infrastructure elements restrict visibility, this study provides a specific addition to international research and makes a valuable contribution to the transport engineering literature. This study aims to raise awareness among road designers and decision makers regarding the necessity of analysing ASD on barrier-restricted curves, thereby contributing to future updates of regulatory frameworks and promoting better-informed choices during the initial alignment phases.
Following this introduction, Section 2 outlines the methodology, reviewing Croatian road design and equipment regulations regarding barrier placement. It details the generation of geometric models within ORD software, utilising both theoretical and empirical motorway sections, and explains the ASD evaluation protocol. Section 3 presents the analytical results, determining the minimum horizontal curve radii under barrier restrictions (Rmin,bar) necessary for the ASD to satisfy the required SSD criteria. These values are then compared against standard minimum radii (Rmin) across various design speeds (Vd). Finally, Section 4 discusses the implications of these findings, outlines key conclusions, and proposes directions for future research.

2. Materials and Methods

National guidelines, regulations, standards, and recommendations typically govern sight visibility analysis on motorways [22,23,24,25,26,27,28,29,30], which can be performed using 2D and 3D approaches. While 2D analysis only requires a traditional road plan, 3D analysis relies on specialised software, such as ORD [46], to construct a comprehensive spatial model of the carriageway, safety barriers, and other physical obstructions.
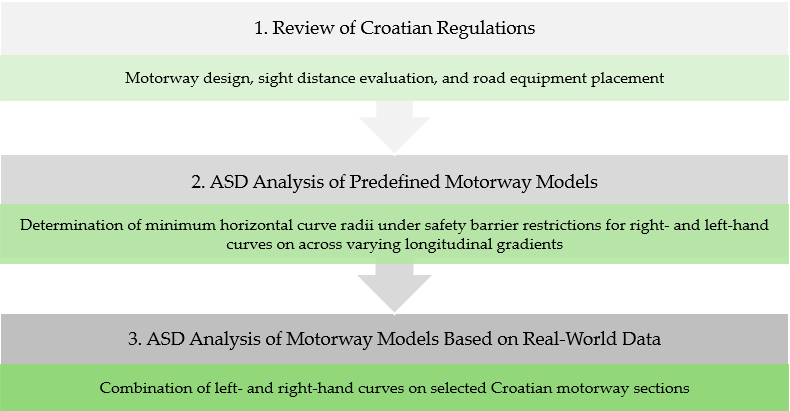
This section reviews the Croatian regulations [25,47] governing geometric motorway design, sight visibility analysis, and safety barrier placement. Additionally, it details the ASD analyses of 2D and 3D models, incorporating predefined motorway models based on Croatian regulations [25,47], as well as real-world data from selected motorway sections. Figure 1 illustrates the key steps of this research methodology.

2.1. Review of Croatian Regulations

Croatian regulations [25] for public road design outside urban areas establish the baseline for motorway design from a traffic safety perspective. Based on these regulations, geometric design is governed by two critical speeds: design speed (Vd) and operating speed (Vo). The design speed is utilised to determine the minimum horizontal radii (Rmin), transition curve length (Lmin), maximum longitudinal gradients (smax), and cross-sectional elements. The operating speed is used to determine the required SSD, the minimum radius of vertical crest curves (RVmin), and the rate of the carriageway cross slope. Although these two speeds can differ under certain geometric conditions, they were assigned identical values within the scope of this research. This approach was adopted because the regulatory speed limit prevents the operating speed from exceeding the design speed. The geometric design elements and dimensions of the motorway horizontal alignment based on the design speed are presented in detail in Table 1.
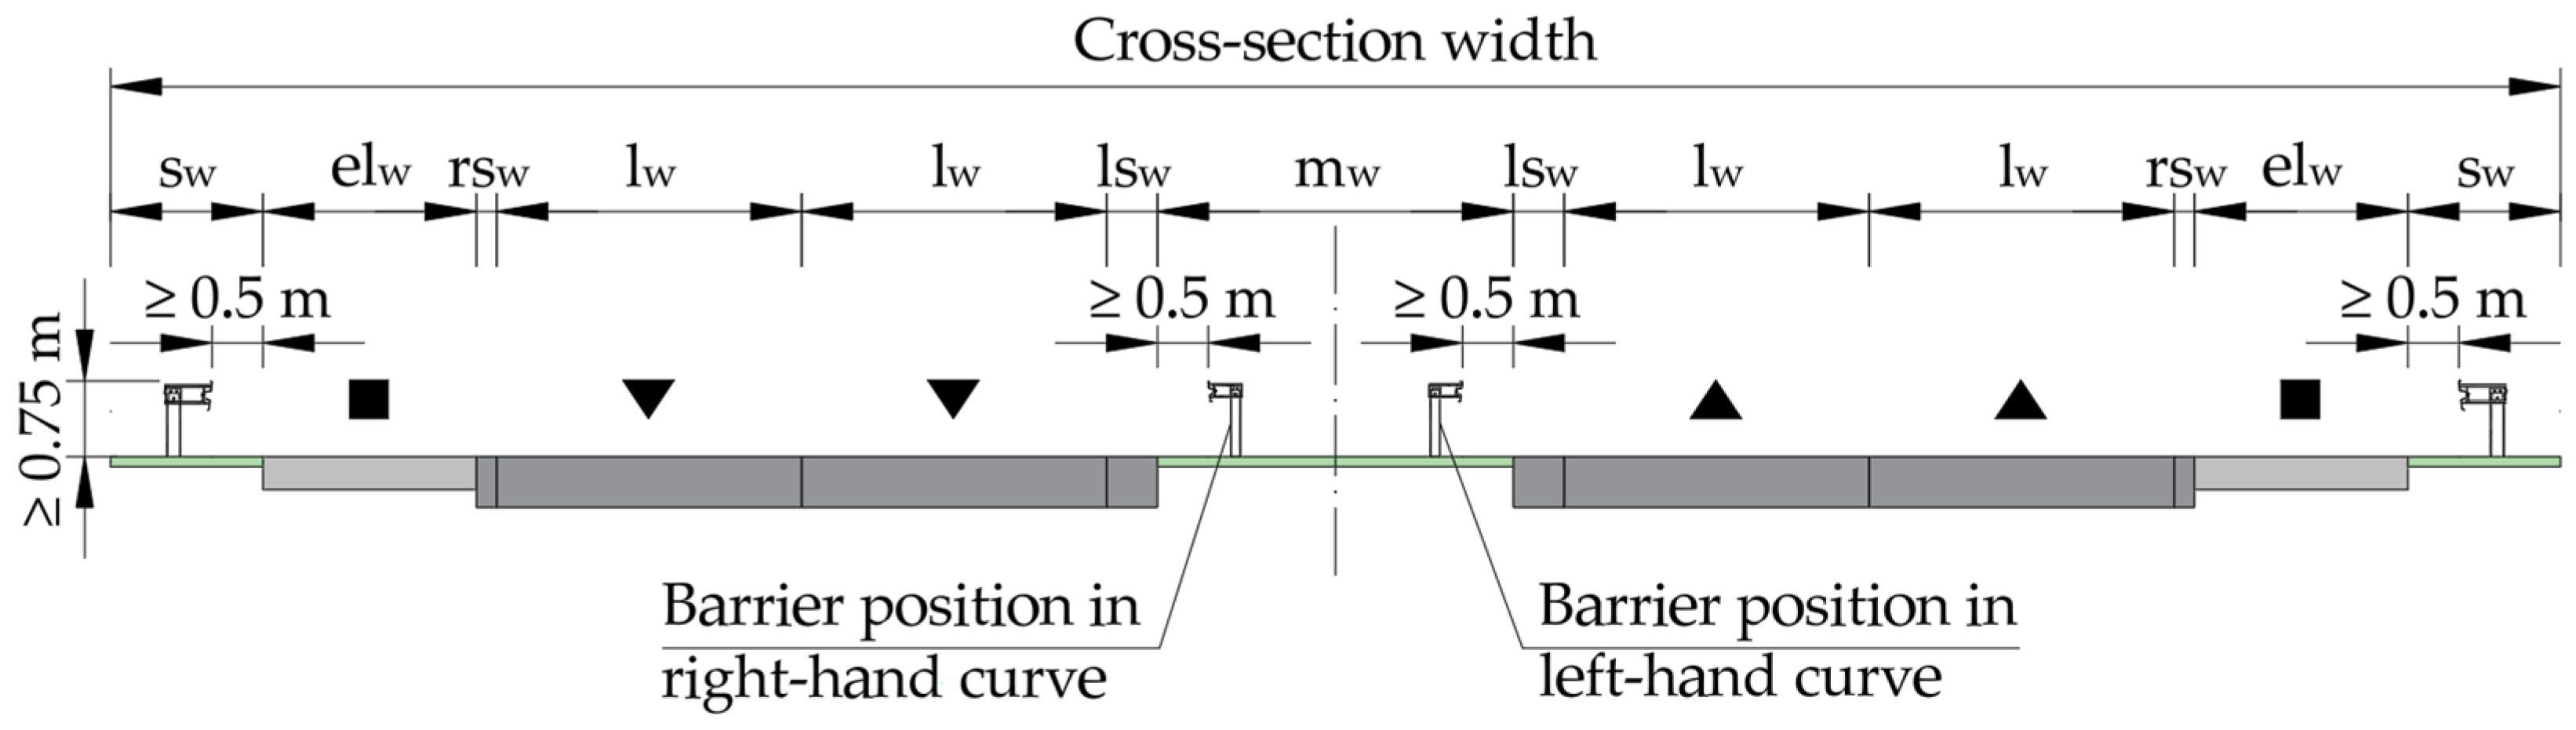
The standard cross-section elements for varying design speeds (Vd) are illustrated in Figure 2 and detailed in Table 2, which specify the exact dimensions for the soft shoulder width (sw), emergency lane width (elw), right shoulder lane width (rsw), traffic lane width (lw), left shoulder lane width (lsw), and median width (mw). Notably, a design speed of 110 km/h is excluded from the geometric configuration requirements for both the horizontal alignment and cross-sectional elements of motorways, whereas 130 km/h represents the maximum permissible operating speed on Croatian motorways.
Based on these regulations, SSD is the critical parameter for operational safety. The sight visibility evaluation confirms whether the ASD is equal to or greater than this required safety threshold. If the ASD falls below the threshold at specific operating speeds and longitudinal gradients, the operating speed must be reduced to comply with SSD requirements. This conventional methodology represents a 2D sight visibility analysis. It involves separate, sequential calculations for each travel direction across both horizontal and vertical planes.
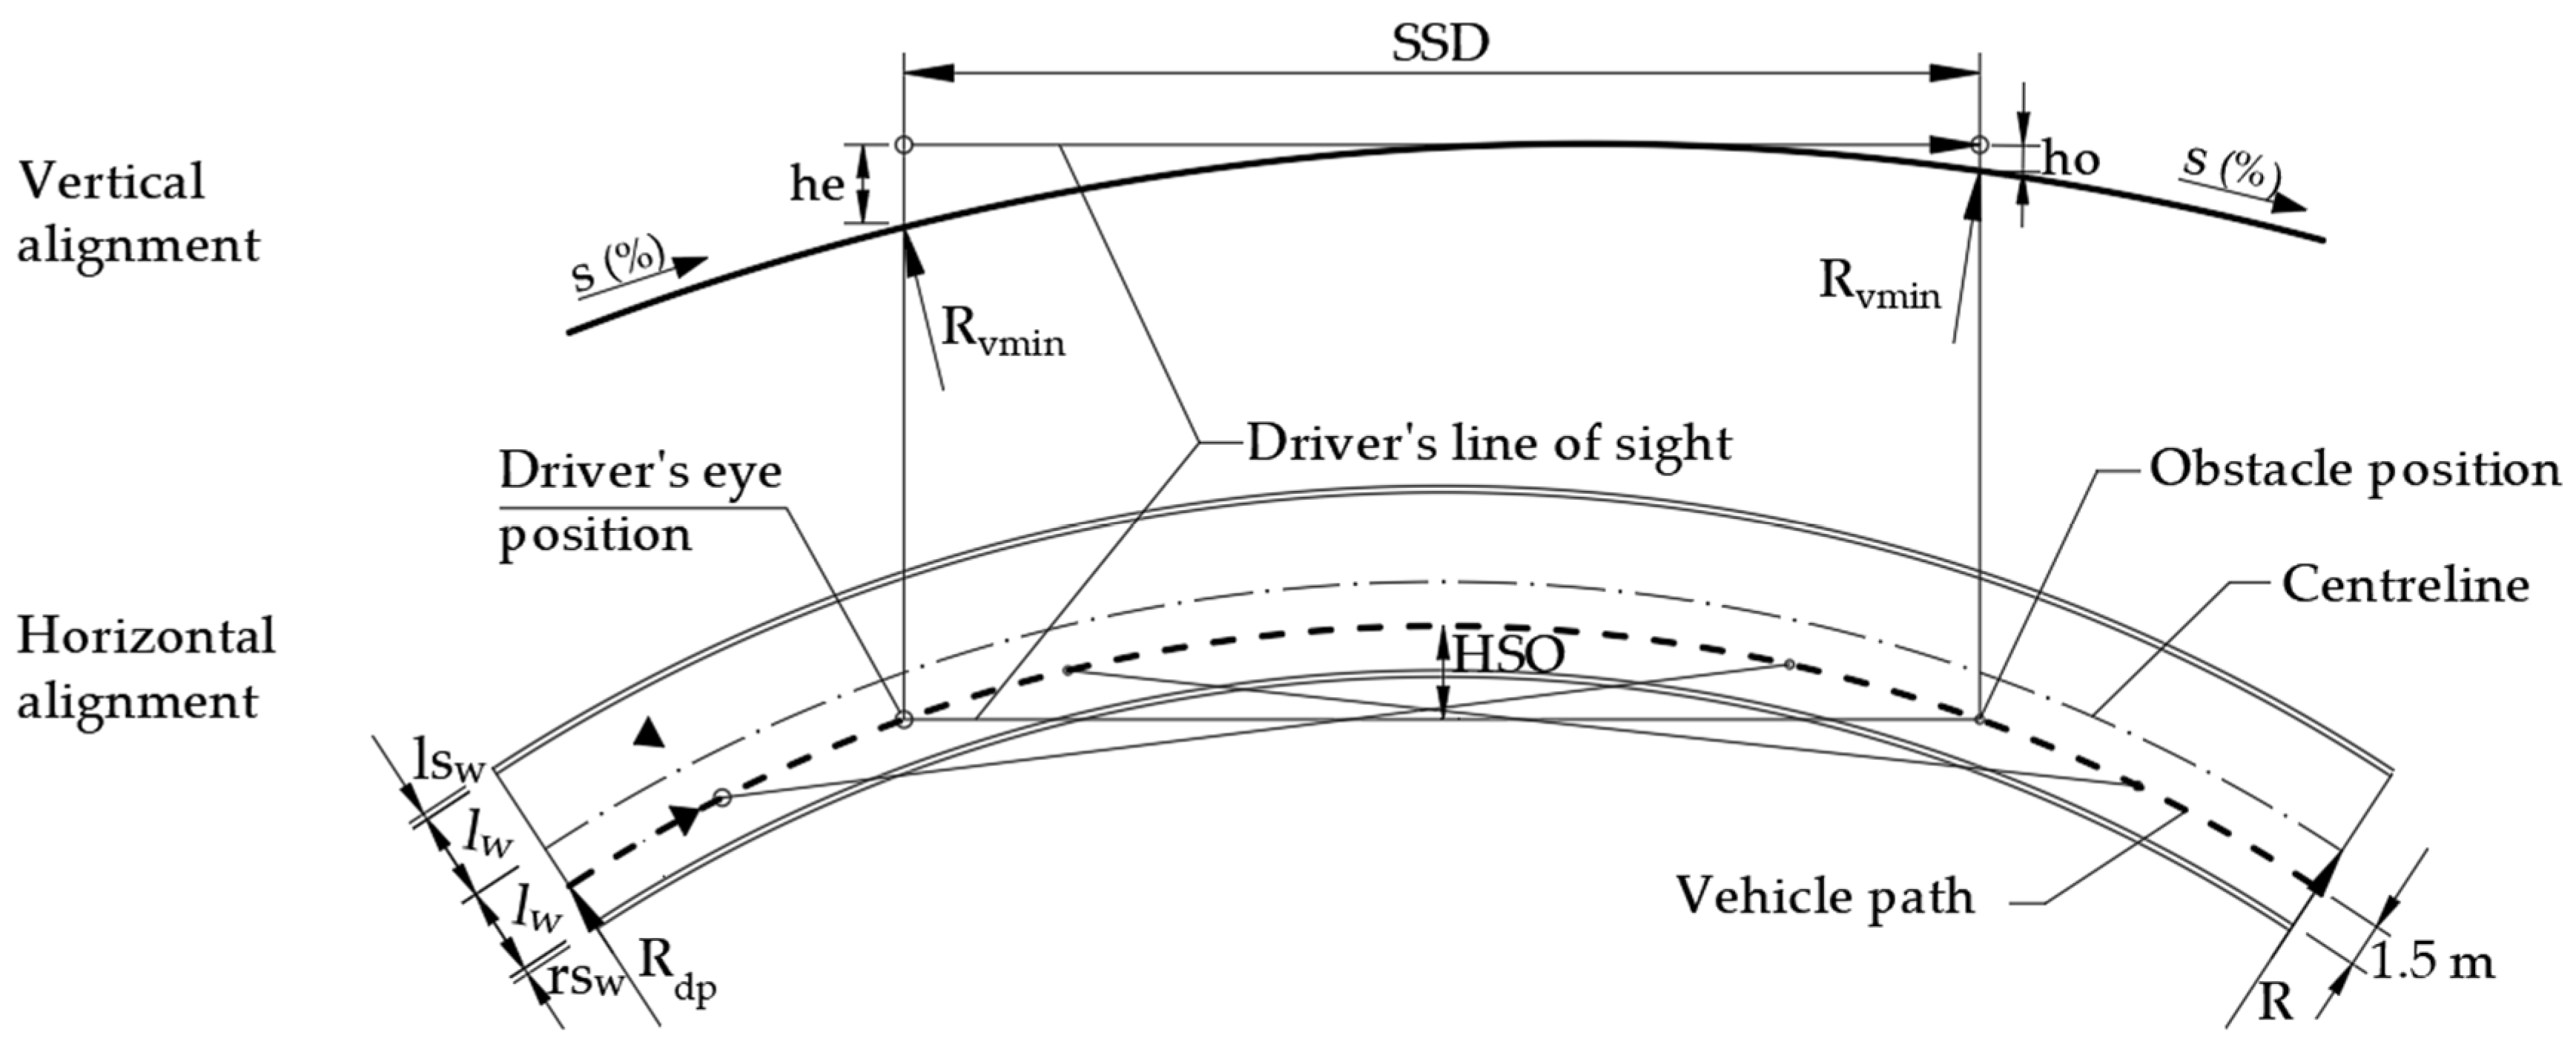
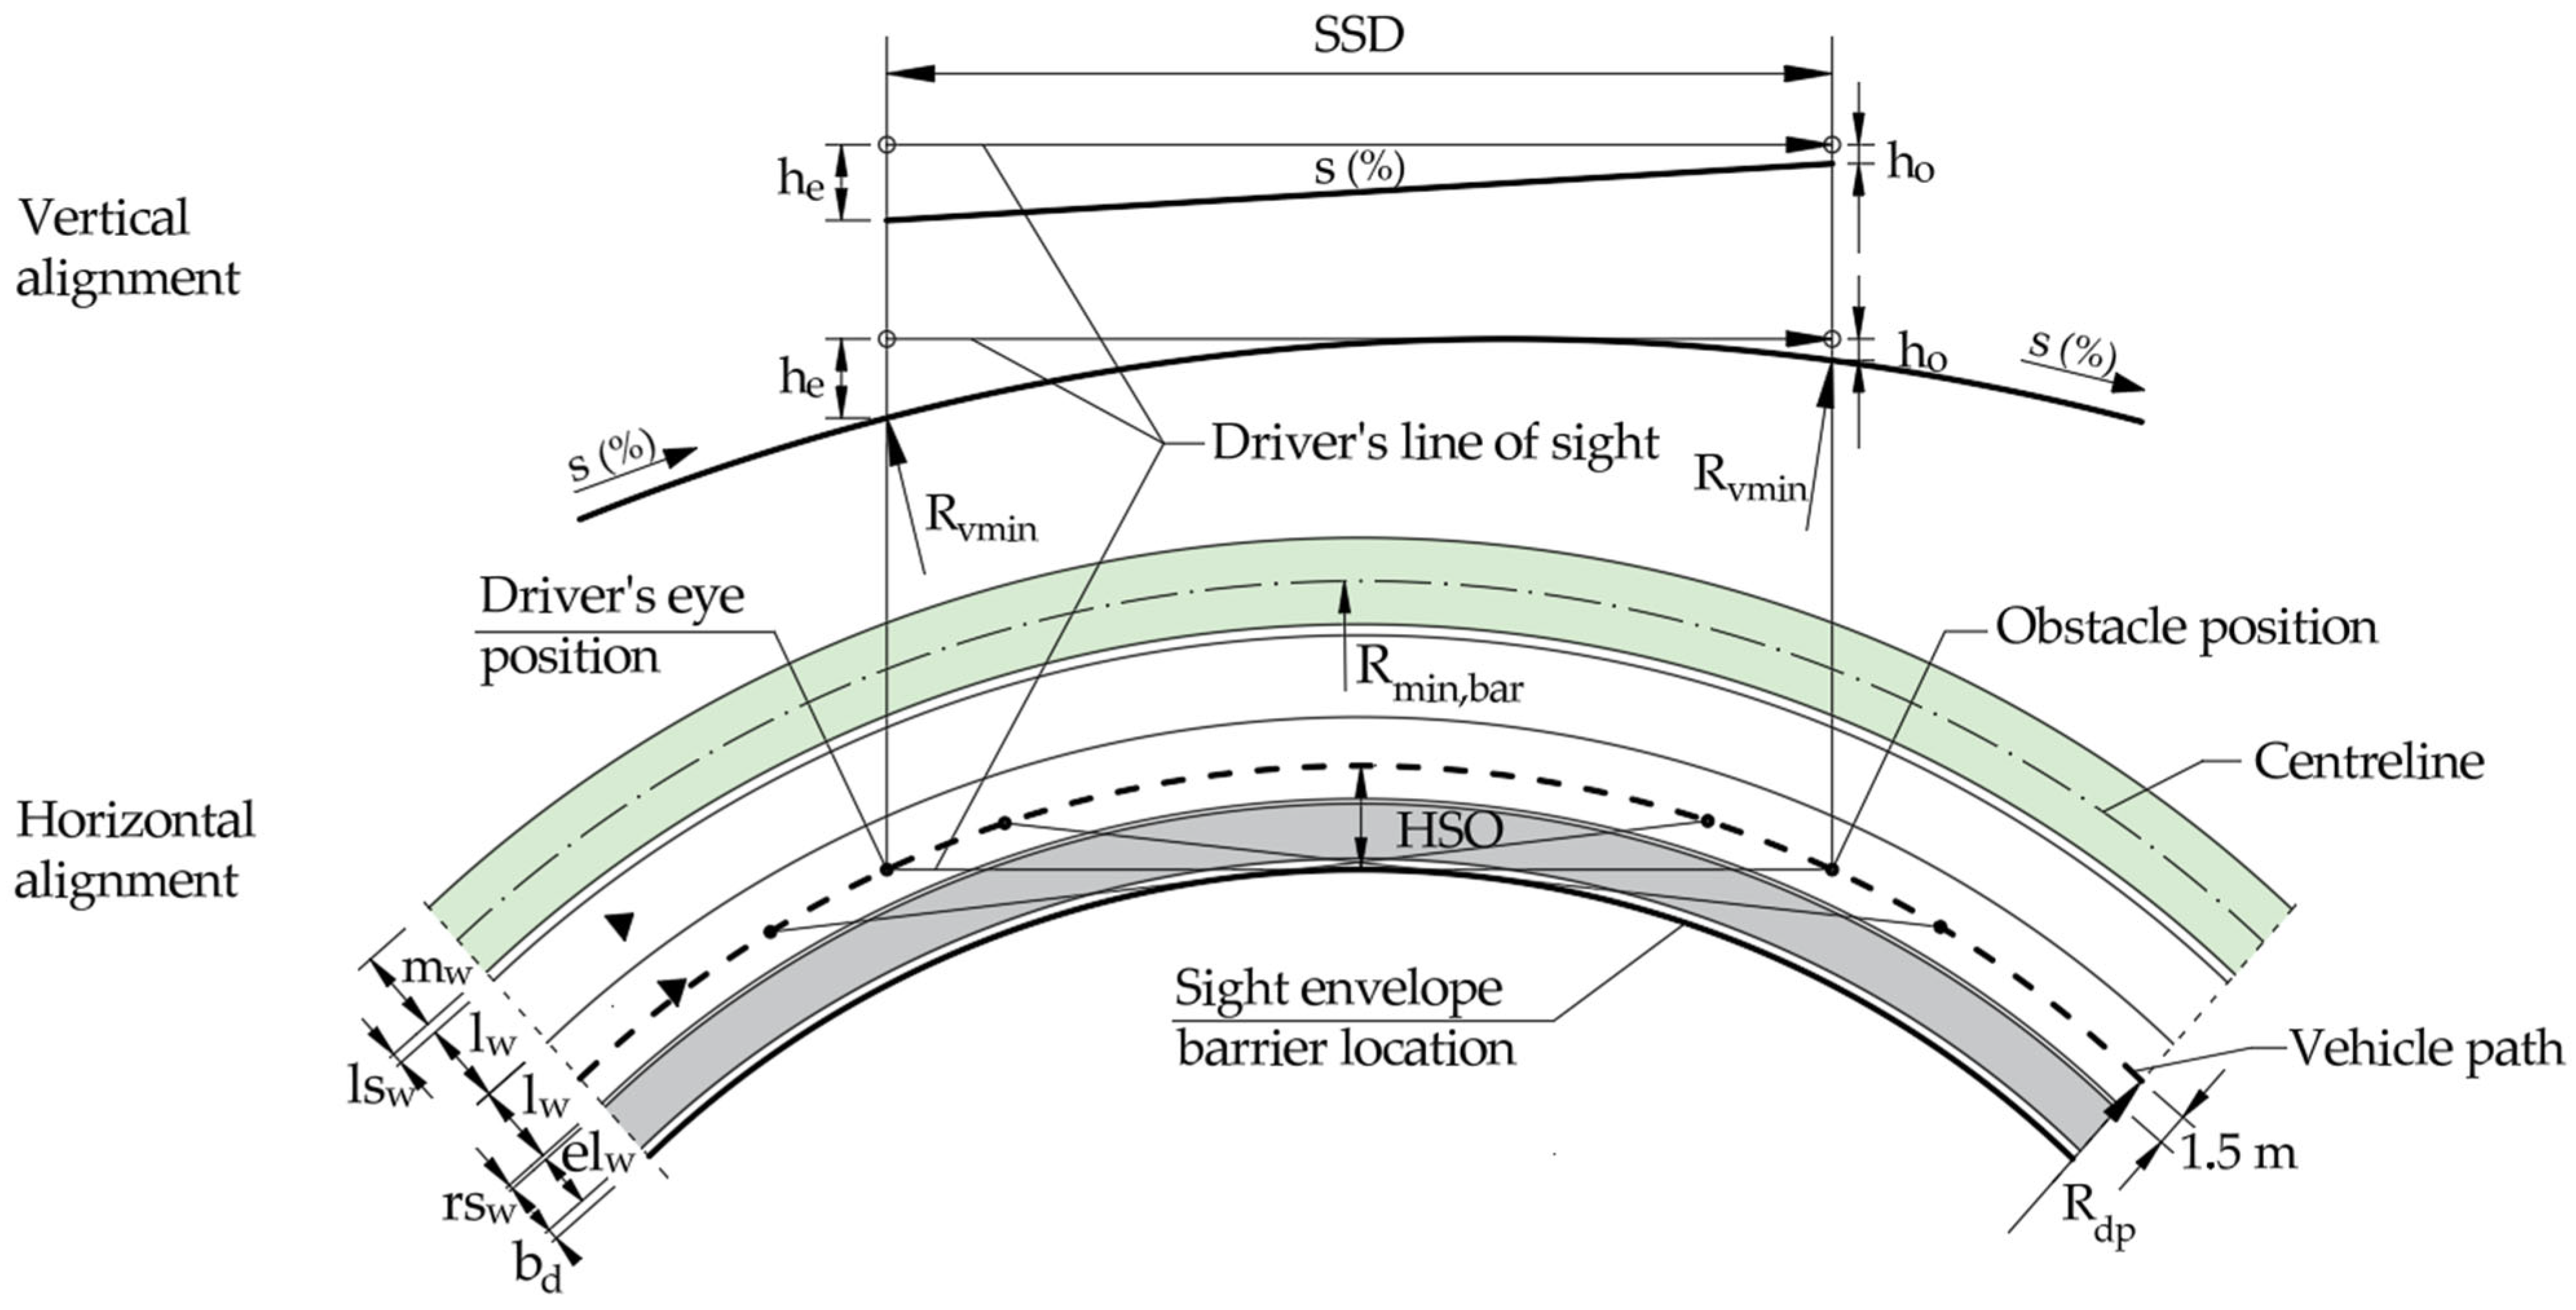
In the horizontal plane, sufficient ASD (i.e., equal to the SSD) is secured by clearing physical obstructions along horizontal curves to ensure they do not breach the driver’s line of sight (Figure 3), thereby establishing the necessary horizontal sight offset (HSO). Consequently, the HSO depends directly on the line of sight along the driver’s path and is determined using Equation (1):
HSO   =   SSD 2 8 · R dp
where HSO (m) is horizontal sightline offset, SSD (m) is the stopping sight distance, and Rdp (m) is the radius of the driver’s path. The required SSD values are dependent on both the operating speed (Vo) and the longitudinal gradient (s) of the carriageway (Appendix A, Table A1). In the direction of travel, the driver’s path is positioned 1.5 m from the right shoulder lane (Figure 3).
Current Croatian regulations [25] lack specific guidelines or technical figures for evaluating sight visibility on motorways. Instead, the regulations rely on a single schematic (Figure 3) tailored exclusively to two-lane rural roads with opposing traffic, offering no guidance for left-hand motorway curves where the driver’s path is located on the inner lane.
In the vertical plane, the ASD on the road depends primarily on the selected radius of the crest vertical curve (Figure 3). The minimum radius of crest curves is calculated using Equation (2):
R Vmin   =   SSD 2 2 · ( h e + h o ) 2
where RVmin (m) is the minimum radius of the crest vertical curve, SSD (m) is the stopping sight distance (depending on the operating speed (Vo) and longitudinal grade (s) (Appendix A, Table A1)), he (m) is the eye height (1.0 m), and ho (m) is the target obstacle height, which is defined as 0.25 m for operating speeds (Vo) between 80 and 100 km/h, 0.22 m for a speed of 120 km/h, and 0.20 m for a speed of 130 km/h. According to the regulations [25], if the minimum radius of a crest vertical curve (RVmin) determined by Equation (2) is applied, the ASD will be exactly equal to the SSD. However, if the ASD at any point along the alignment is found to be less than the required SSD, the operating speed must be reduced to a value at which the SSD requirements are fully satisfied, or alternatively, the curve radius must be increased.
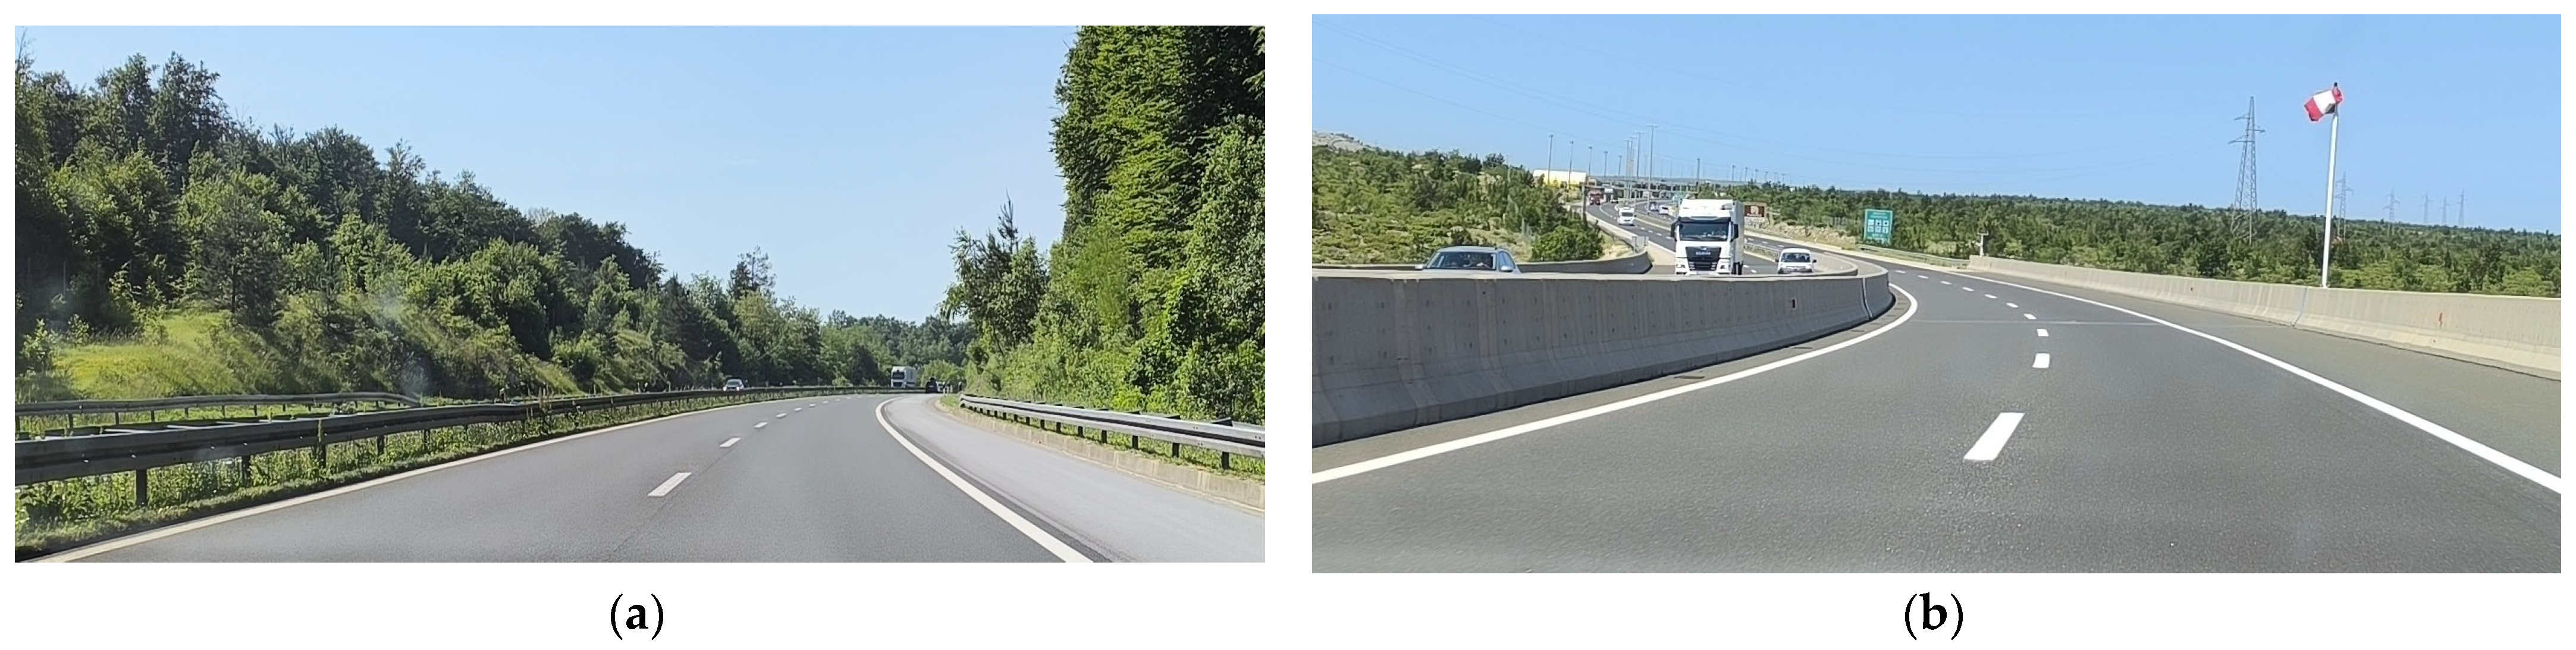
According to Croatian regulations [47], road safety barriers are structural containment systems designed to prevent vehicles from run-off-road accidents. These systems, constructed from materials such as steel, concrete, or wood, must comply with the performance requirements of the HRN EN 1317 standard [48]. Safety barriers are typically installed within the median of motorways, on the edges of bridges and viaducts, along embankments exceeding 3.0 m in height, and in front of high-risk roadside features (Figure 2 and Figure 4). The crash barrier should be positioned at a minimum distance of 0.5 m from the edge of the traffic lane or emergency lane on motorways. An exception to this rule applies when the barrier is installed flush with a curb or drainage gutter. The minimum mounting height for the upper edge of steel barriers is set at 0.75 m above the carriageway edge, whereas concrete barriers require a minimum height of 0.80 m. To enhance motorcyclist safety on high-risk segments, underride protection systems must be integrated beneath the primary barrier profile. In accordance with national regulations [47] and the HRN EN 1317 standard [48], the minimum containment level for safety barriers is designated as H2 along motorway medians, H1 to H2 along motorway outer edges, and H2 to H3 on bridges and viaducts. Within the Croatian road network, flexible steel safety barriers serve as the predominant vehicle restraint system, vastly outnumbering rigid concrete alternatives across both motorways and state routes (Figure 4).

2.2. Evaluation of Available Sight Distance on Right-Hand Curves Using Motorway Models

The ASD on right-hand curves was evaluated across multiple motorway models incorporating roadside safety barriers designed in accordance with Croatian regulations [47]. The first part applied them to calculate the modified minimum horizontal curve radius under barrier restrictions (Rmin,bar), ensuring that the ASD meets or exceeds the required SSD (Appendix A, Table A1) across all operating speeds and longitudinal gradients. The second part extended this analysis to calculate the ASDbar as affected by barrier restrictions across different horizontal curve radii, speeds, and longitudinal gradients, assessing the sight distance provided by specific configurations. The parameters incorporated into these models included the following:
  • Horizontal Alignment: The horizontal curves were modelled using the minimum curve radius under barrier restrictions (Rmin,bar) across a range of design speeds (Vd) from 80 to 130 km/h;
  • Cross-Sectional Elements: Cross-sections were selected to correspond with these design speeds and comprised a dual-carriageway layout separated by a median. Each direction featured two traffic lanes, an emergency lane, shoulder lanes, and a hard shoulder configuration, with precise dimensions matching the values specified in Table 2 (see also Figure 2 and Figure 5);
  • Safety Barriers: Roadside barriers were positioned at lateral offsets (bd) of 0.50 and 0.75 m from the outer edge of the emergency lane. The 0.75 m offset was selected to evaluate a closed drainage system configuration, where the safety barrier is installed flush with a 0.75 m wide drainage channel.
Although previous studies [49,50] provided algorithms for calculating sight distance profiles based on horizontal geometry, this phase of the research focuses exclusively on horizontal curves evaluated via Equation (1).
The determination of Rmin,bar within the 2D model is fundamentally based on a sight visibility test. This test evaluates the continuity of the line of sight between the driver’s eye height and the target obstacle height along the driver’s path. Correspondingly, calculating the centreline radius Rmin,bar for a right-hand horizontal curve within the t2D model relies directly on the HSO and he radius of the driver’s path (Rdp).
The HSO is defined as the absolute distance between the driver’s path along the curve, positioned at a lateral offset of 1.5 m from the shoulder lane, and the physical location of the safety barrier (Figure 5), which is determined by its lateral offset from the emergency lane (bd). The horizontal sightline offset is calculated using the following equation:
HSO = 1.5 + rsw + elw + bd
where HSO (m) is the horizontal sightline offset, rsw (m) is the right shoulder lane width, elw (m) is the emergency lane width, and bd (m) is the barrier distance from the shoulder lane. The radius of driver’s path is calculated using the following equation (Figure 4):
R dp   =   SSD 2 8 · HSO
where Rdp (m) is the radius of the driver’s path, SSD (m) is the stopping sight distance (which depends on the operating speed (Vo) and longitudinal grade (s) (Appendix A, Table A1)), and HSO (m) is the horizontal sightline offset (from Equation (3)).
Based on the Rdp values generated in this step (Equation (4)) and the required SSD across various operating speeds and longitudinal gradients, the modified minimum horizontal curve radius under barrier restrictions is calculated using the following equation:
R min , bar   =   R dp   +   ( m w 2   +   ls w   +   l w   +   l w     1.5 )
where Rmin,bar (m) is the modified minimum horizontal curve radius under barrier restrictions, Rdp (m) is the radius of the driver’s path, mw (m) is the median width, lsw (m) is the left shoulder lane width, and lw (m) is the traffic lane width.
Equation (4) was rearranged to calculate ASDbar across various operating speeds, radii, and longitudinal gradients, resulting in the following equation:
ASD bar   =   8 · R · HSO
where ASDbar (m) is the available sight distance as affected by barrier restrictions, R (m) is the curve radius (obtained from Equation (5) analogously to Rmin,bar), and HSO (m) is the horizontal sightline offset obtained from Equation (3).

2.3. Evaluation of Available Sight Distance on Left-Hand Curves Using Motorway Models

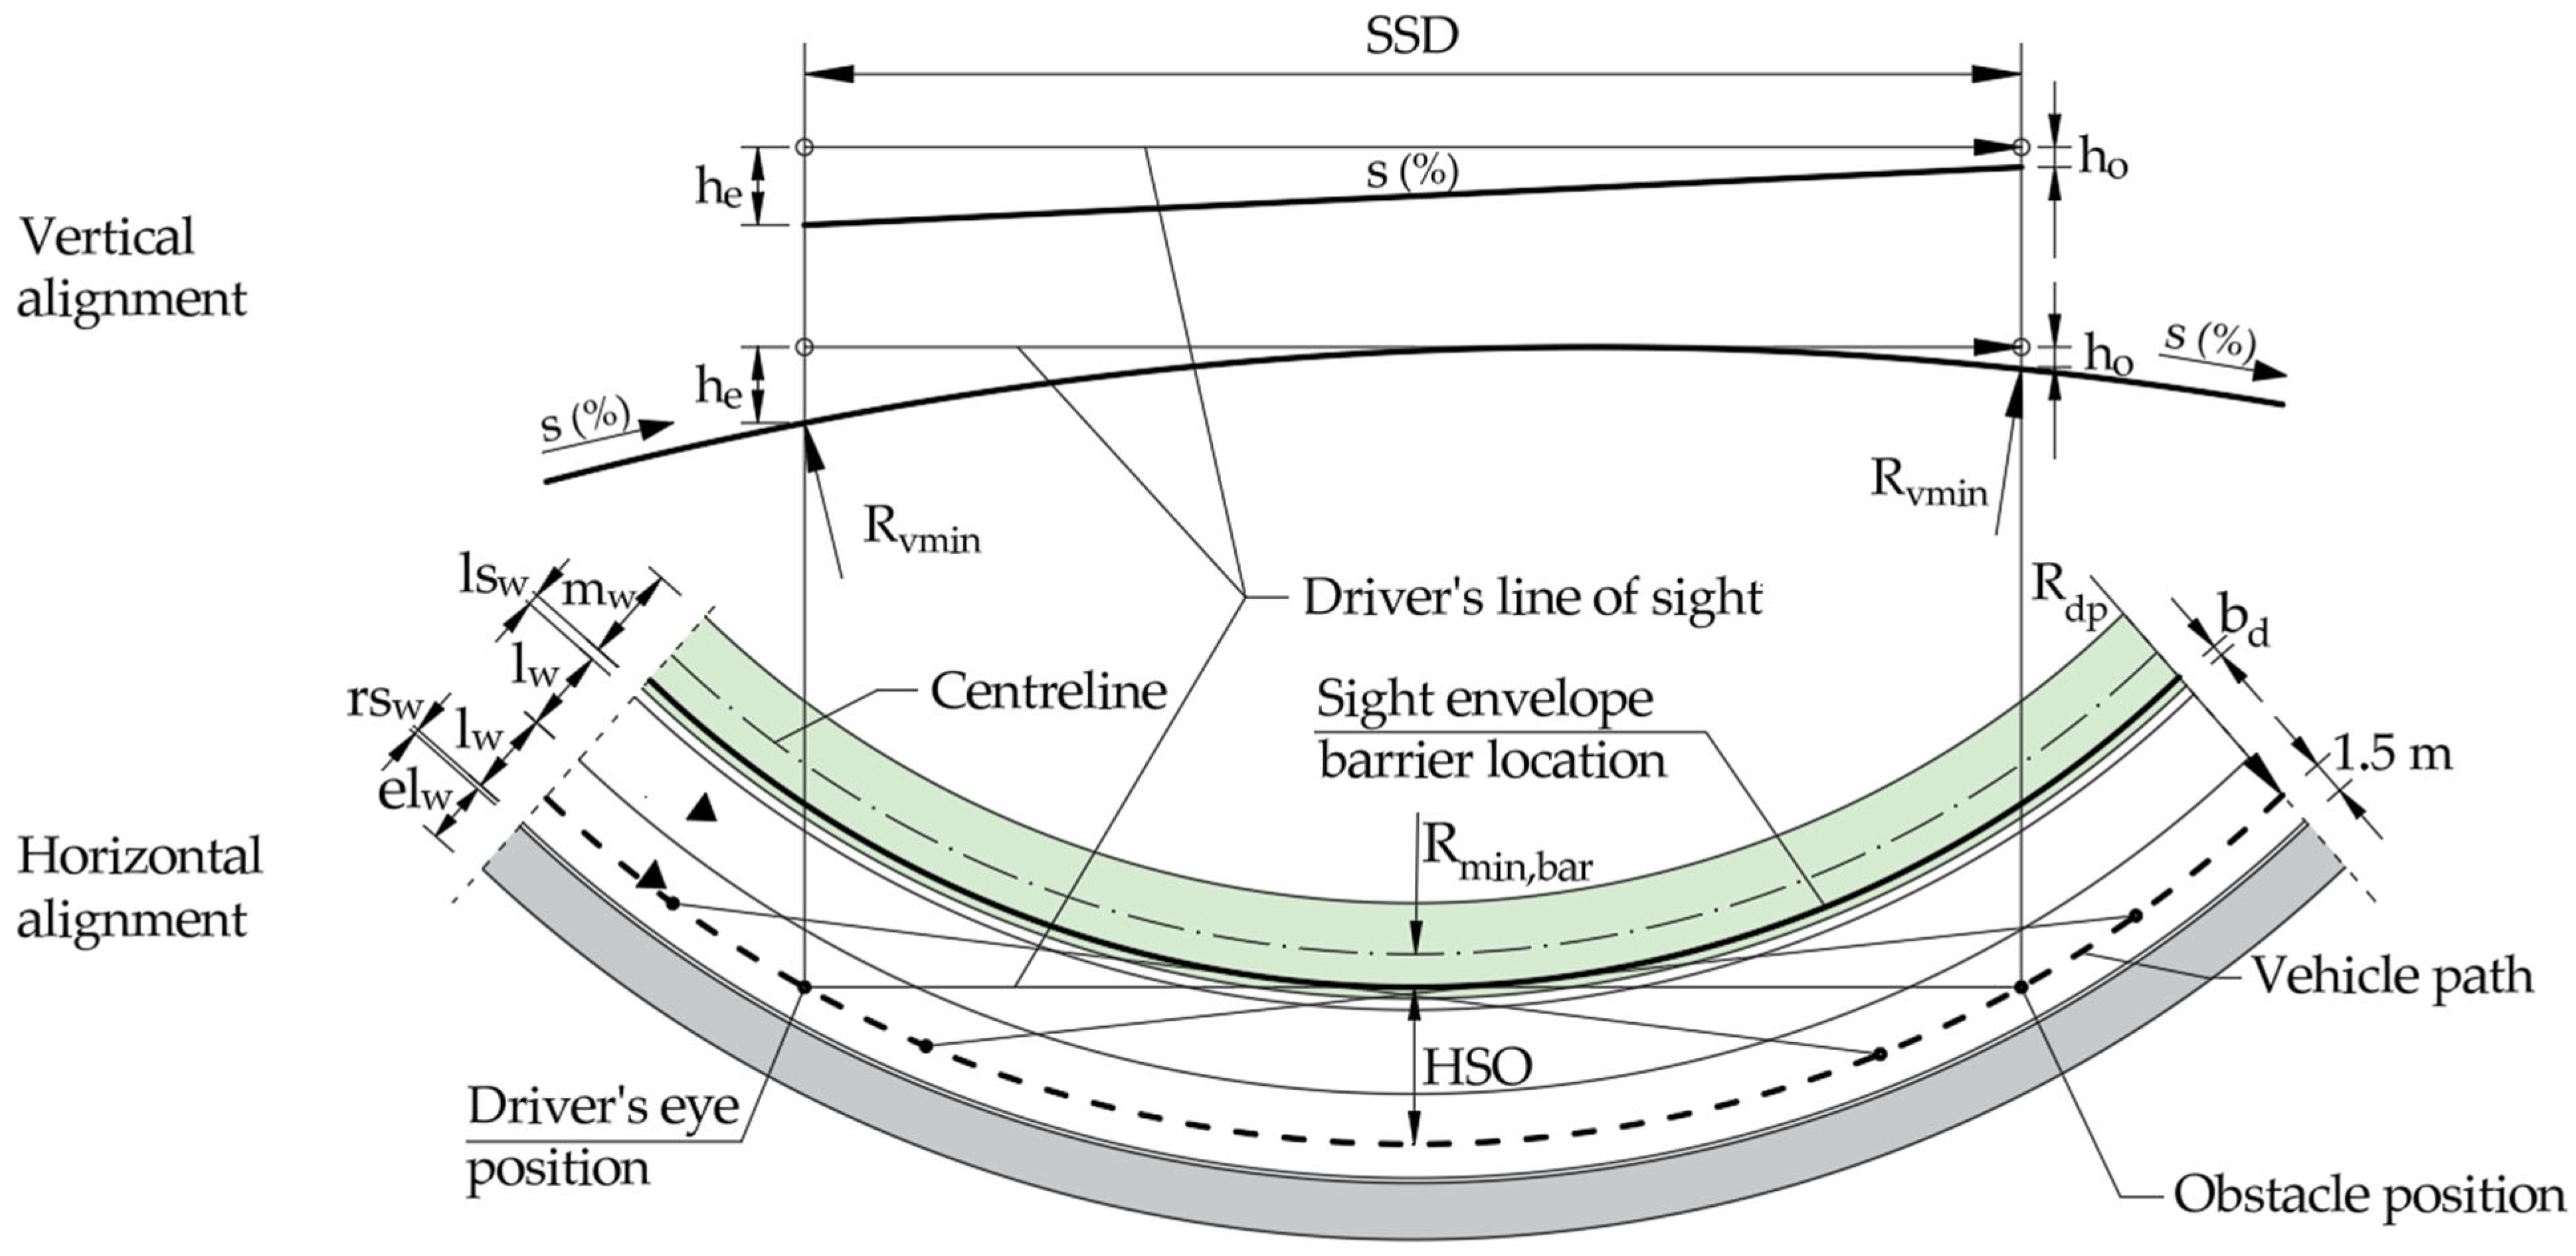
The evaluation of ASD on left-hand curves was conducted across various motorway models featuring median safety barriers designed in accordance with Croatian regulations [25,47], focusing on the sight visibility from the outer traffic lane of a dual-lane carriageway. This approach followed a methodology similar to that used for the right-hand curve evaluation. However, the primary distinction lies in the mathematical formulations utilised to calculate the respective Rmin,bar, and ASDbar values, as illustrated in Figure 6.
The horizontal sightline offset is calculated using the following equation:
HSO = lw − 1.5 + lw + lsw + bd
where HSO (m) is the horizontal sightline offset, lw (m) is the traffic lane width, lsw (m) is the left shoulder lane width, and bd (m) is the barrier distance from the shoulder lane. The radius of driver’s path (Figure 6) is calculated using the following equation:
R dp   =   SSD 2 8 · HSO
where Rdp (m) is the radius of the driver’s path, SSD (m) is the stopping sight distance (which depends on the operating speed (Vo) and longitudinal grade (s) (Appendix A, Table A1)), and HSO (m) is the horizontal sightline offset obtained from Equation (7).
Based on the Rdp values obtained from Equation (8) and the required SSD across various operating speeds and longitudinal gradients, the modified minimum horizontal curve radius under barrier restrictions (Figure 6) is calculated using the following equation:
R min , bar   =   R dp   ( m w 2   +   ls w   +   l w   +   l w   1.5 )
where Rmin,bar (m) is the modified minimum horizontal curve radius under barrier restrictions, Rdp (m) is the radius of the driver’s path, mw (m) is the median width, lsw (m) is the left shoulder lane width, and lw (m) is the traffic lane width.
Equation (8) was rearranged to calculate ASDbar across various operating speeds, radii, and longitudinal gradients, resulting in the following equation:
ASD bar   =   8 · R · HSO
where ASDbar (m) is the available sight distance as affected by barrier restrictions, R (m) is the curve radius (obtained from Equation (9) analogously to Rmin,bar), and HSO (m) is the horizontal sightline offset obtained from Equation (7).

2.4. Evaluation of Available Sight Distance Using 3D Motorway Models Based on Real Data

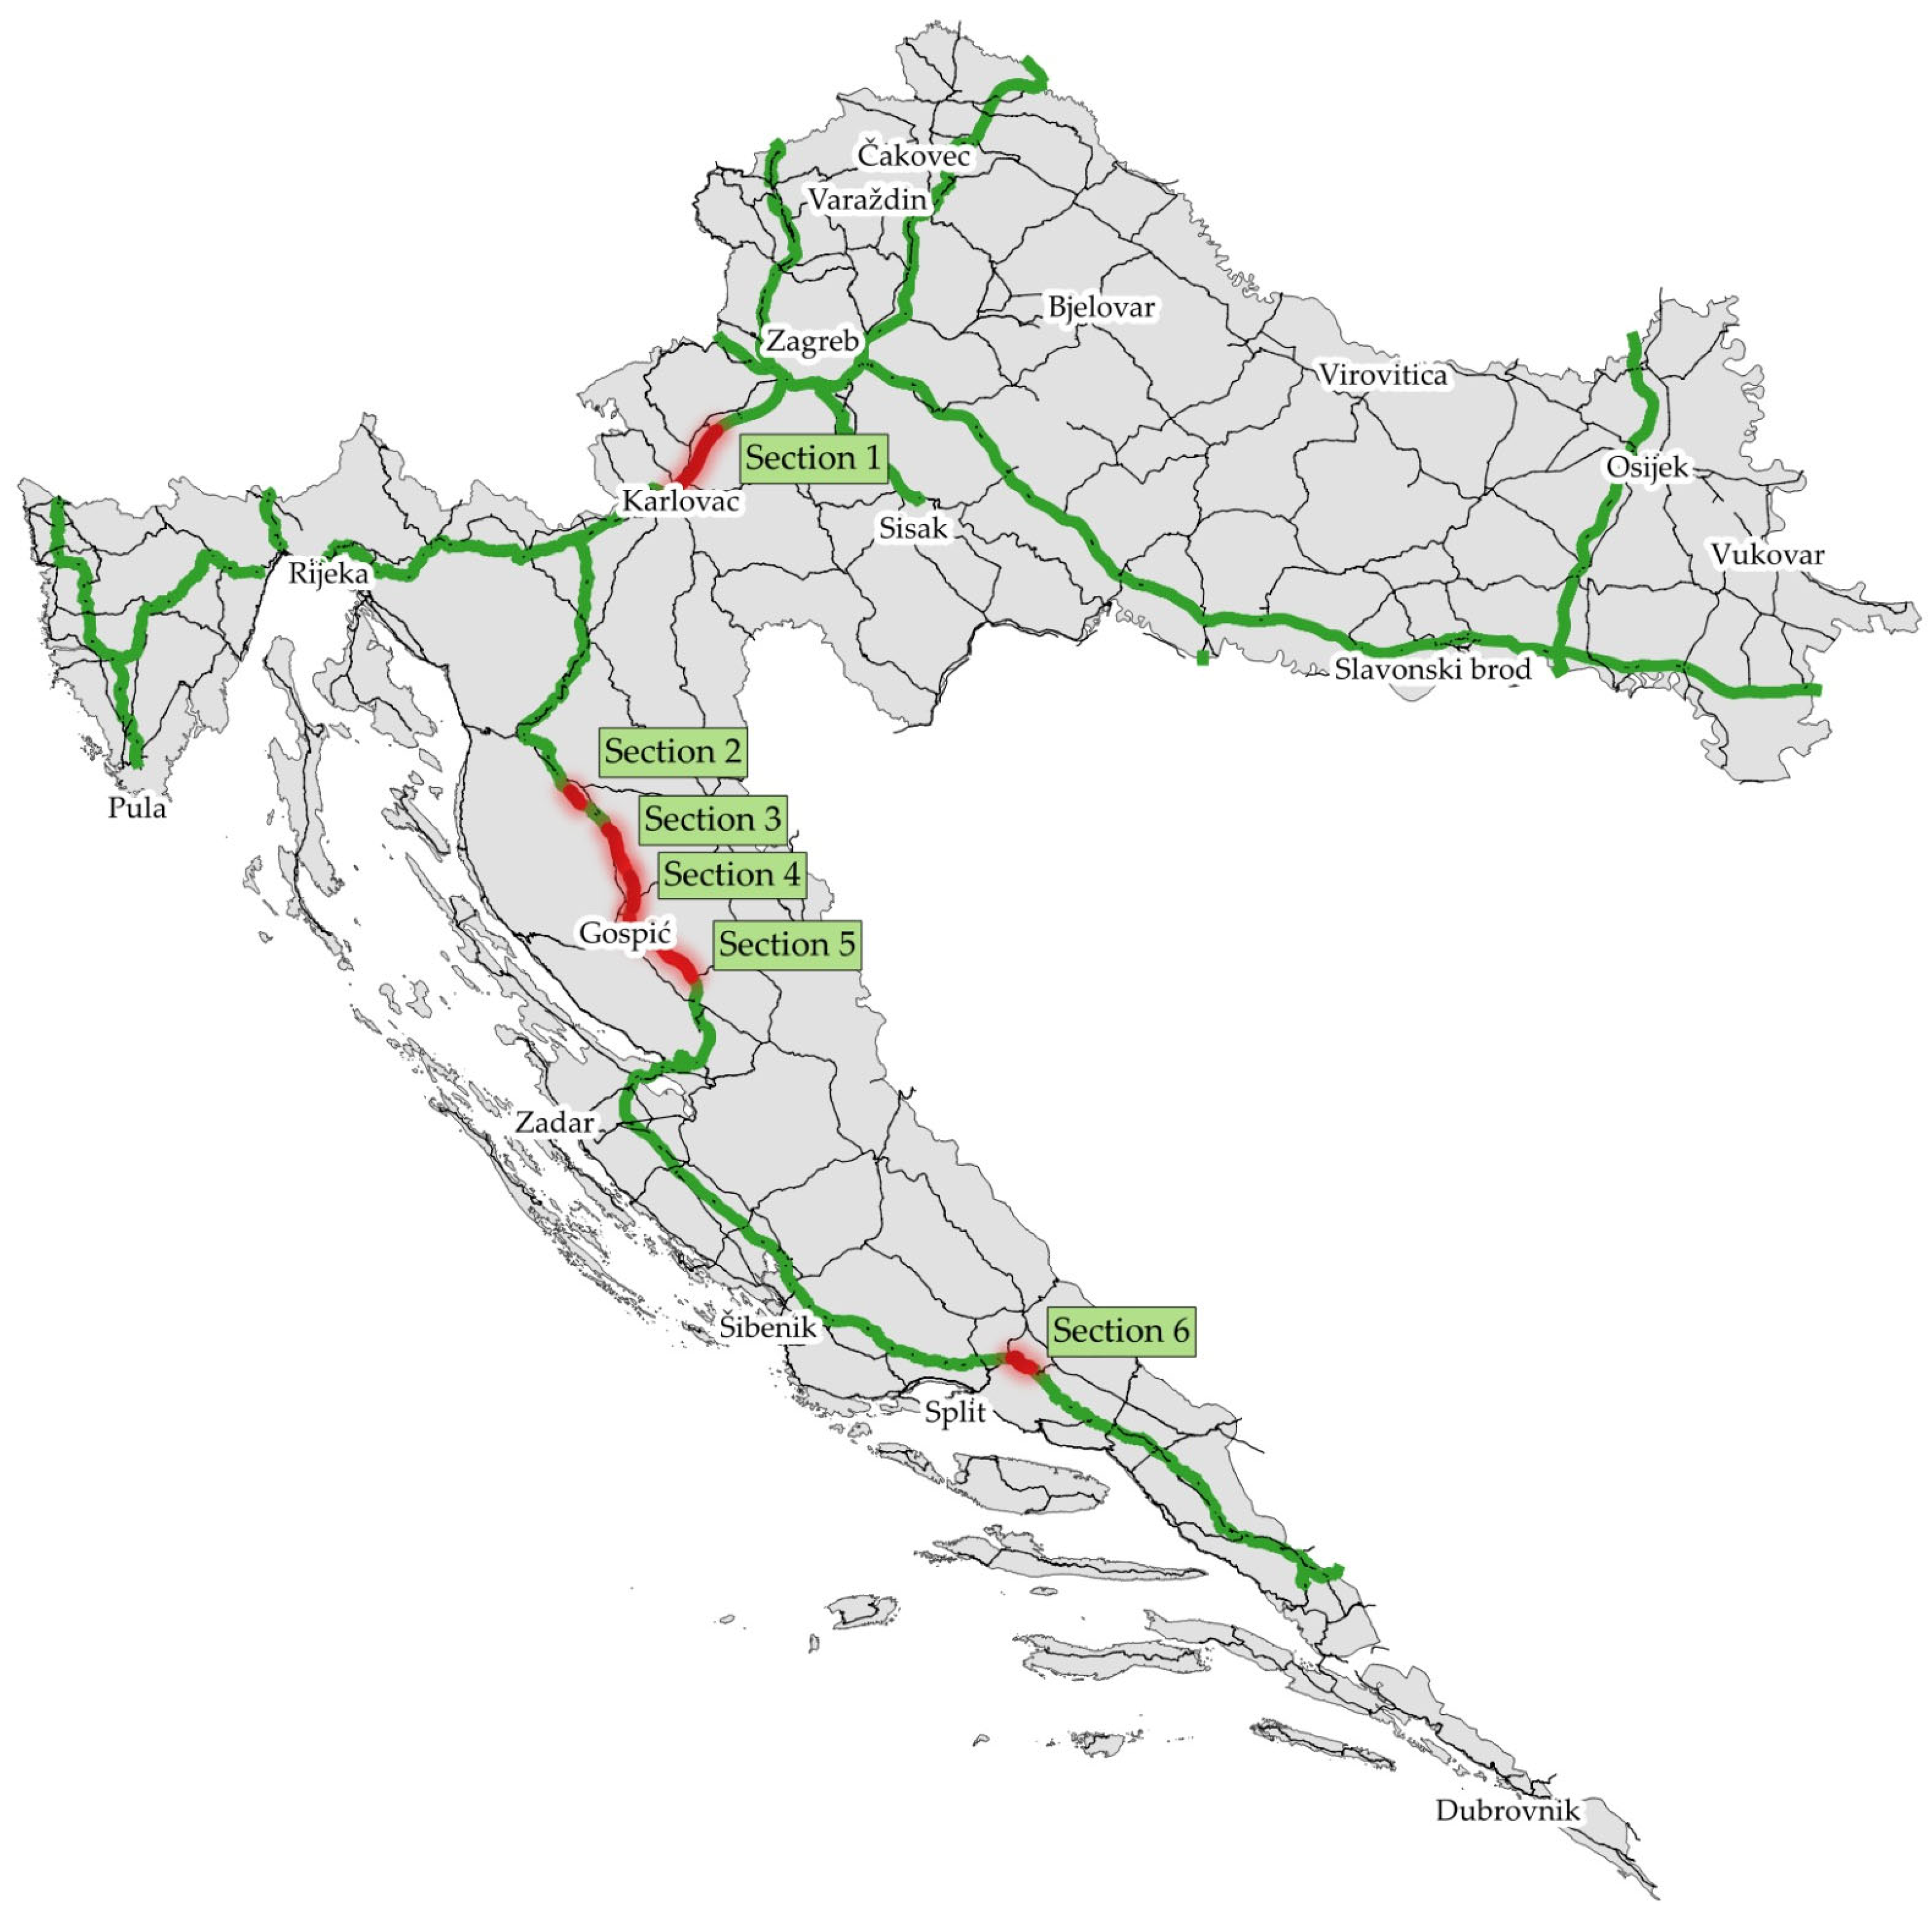
The Croatian motorway network encompasses 1492.37 km of operational routes, designated A1 to A11 [51]. This study focuses on the A1 motorway (Zagreb (ZG)–Split (ST)–Dubrovnik (DU)), Croatia’s primary 558.11 km arterial corridor connecting the continental interior with the Adriatic coast. To conduct a comprehensive assessment of ASD across varying horizontal and vertical geometric alignments, design eras, traffic and terrain characteristics, and historical crash data, specific motorway sections were selected for analysis. The historical crash data obtained from the Ministry of the Interior [52,53,54,55] were geolocated to support this selection process. Sections containing tunnels, as well as those adjacent to motorway entry and exit ramps, were excluded from the investigation. Safety barriers near these ramps are typically positioned further from the edge of the outer traffic lane because interchange acceleration and deceleration lanes are wider than the standard emergency lane, thereby exerting less influence on the ASD.
The highest traffic volume on the A1 motorway is recorded on the Zagreb–Karlovac section (built in 1972), with an AADT of ~46,000 veh/day, peaking at 72,000 veh/day in summer [56]. Geolocated data from 2023 to 2025 [52,53,54,55] reveal that the highest frequency of collisions with obstacles occurred between the Brinje and Sveti Rok interchanges, accounting for 120 out of 240 total incidents. However, for the purposes of this study, the sections immediately surrounding the Brinje and Sveti Rok interchanges were omitted due to tunnel proximity and Brinje’s non-standard three-lane cross-section. Consequently, the intermediate sections between Otočac and Gornja Ploča within the Brinje–Sveti Rok section were selected for investigation; this area recorded 77 collisions with obstacles [52,53,54,55].
Based on the aforementioned criteria, six distinct sections of the A1 motorway were selected for analysis (Figure 7):
  • Jastrebarsko–Karlovac (17.3 km): Constructed in 1972, this section represents the oldest infrastructure era and is located on the corridor between Zagreb and Karlovac. Characterised by predominantly flat terrain, it serves as a baseline for legacy design alignments from an earlier engineering period. As the most heavily trafficked segment on the A1 motorway, it recorded an AADT volume of 43,742 veh/day in 2024, which rose to 72,746 veh/day during the summer months [56].
2.
Otočac–Tunnel Plasina (3.5 km): Opened to traffic in 2004, this section reflects design parameters defined by the 2001 design regulations [25]. Situated in hilly terrain, it recorded a 2024 AADT of 21,749 veh/day, which rose to 48,965 veh/day during the summer months [56].
3.
Tunnel Grič–Perušić (9.6 km): Opened to traffic in 2004, this section was also designed in accordance with the 2001 design regulations [25]. Situated in hilly terrain, it recorded the same traffic volume as the preceding section, as both lie within the corridor between the Otočac and Perušić interchanges.
4.
Perušić–Gospić (5.6 km): Opened to traffic in 2004, this section reflects design parameters defined by the 2001 design regulations [25]. Located in hilly terrain, it recorded a 2024 AADT of 21,624 veh/day, which rose to 48,889 veh/day during the summer months [56].
5.
Gospić–Gornja Ploča (18.5 km): Opened to traffic in 2004, this section complies with the 2001 design regulations [25]. Situated on flat terrain, it recorded a 2024 AADT of 21,391 veh/day, which rose to 48,583 veh/day during the summer months [56].
6.
Dugopolje–Bisko (5.35 km): Opened in 2007, this newer section was also designed under the 2001 design regulations [25]. Located in hilly terrain, its geometric layout and safety barriers present unique sightline constraints with a lower traffic volume, recording a 2024 AADT of 15,726 veh/day and a summer peak of 28,836 veh/day [56]. It features a known geometry alignment engineered for a design speed of 120 km/h, and is further distinguished by a narrower, non-standard central median width of 3.0 m.
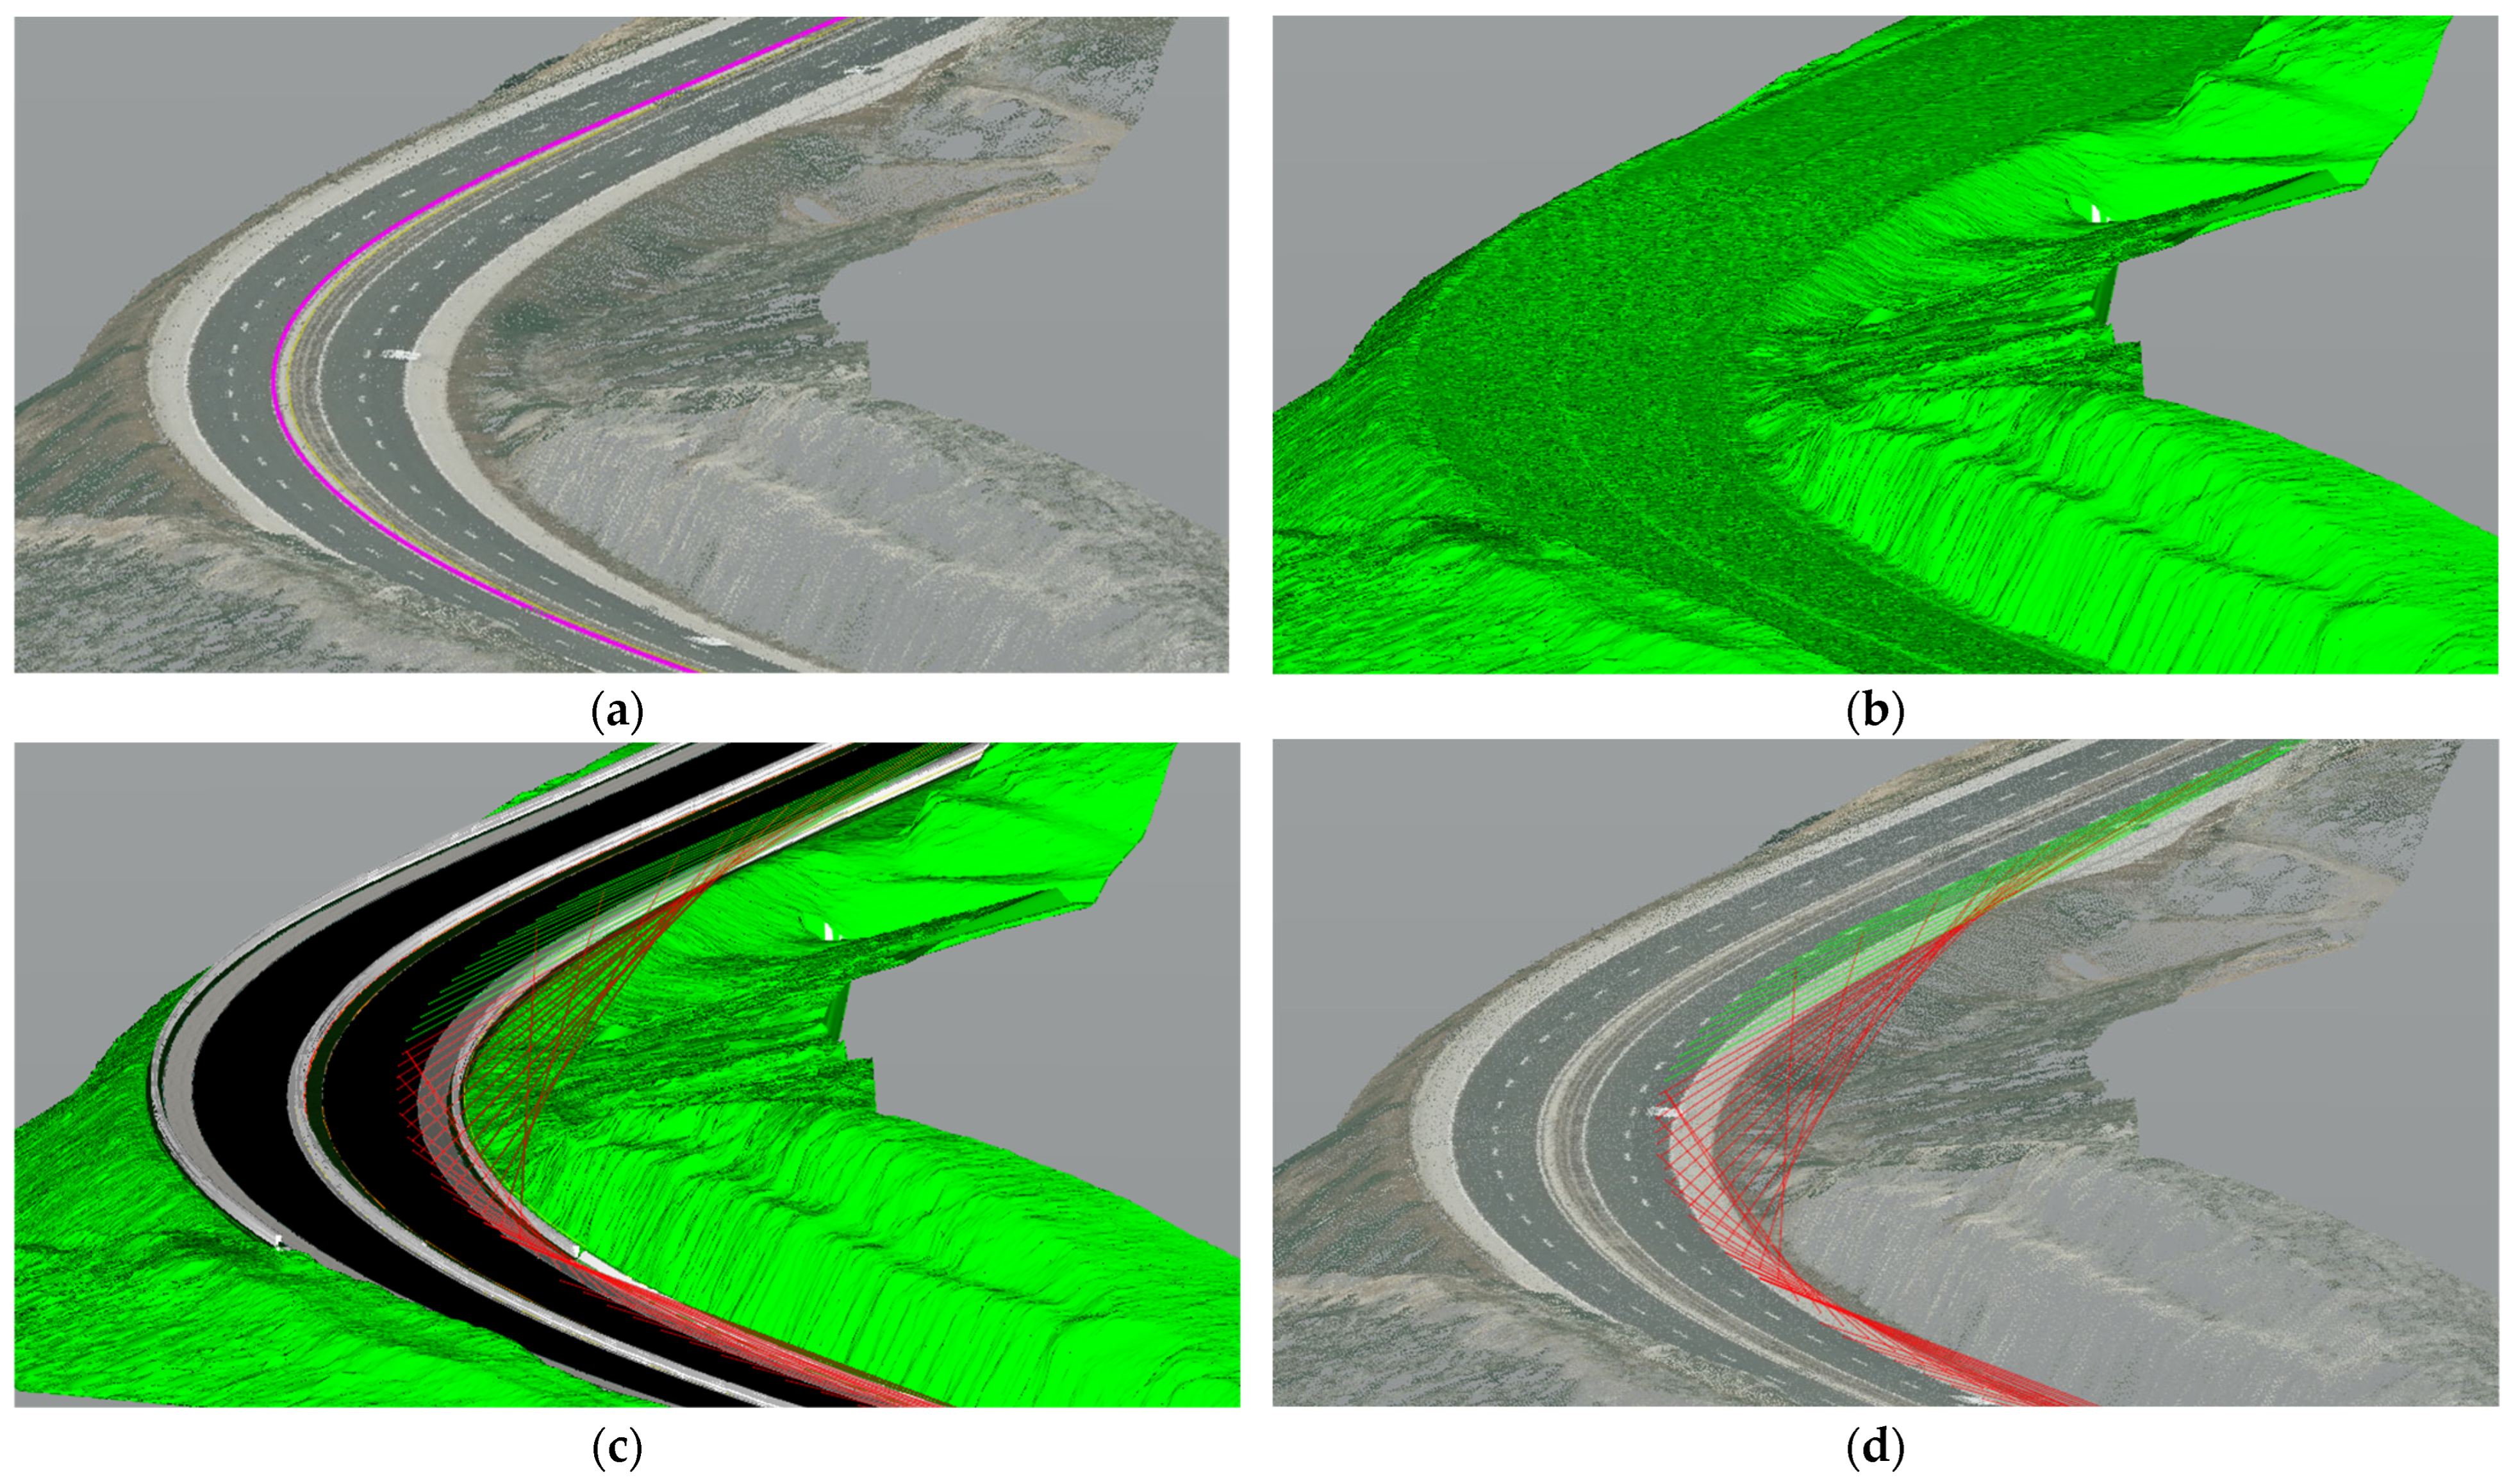
A 3D motorway model was developed within the ORD software suite using LiDAR data (Figure 8), including point clouds and orthophotographs obtained from the Croatian State Geodetic Administration (DGU; Državna geodetska uprava) [57]. Recorded video footage captured while driving along the selected sections was also utilised to achieve more precise positioning of safety barriers within the 3D model. The maximum errors of the point clouds are ±20 cm in the horizontal direction and ±10 cm in the vertical direction, whereas the spatial resolution of the orthophotograph is 20 cm per pixel. The point cloud density varies, with a minimum of four points per square metre (points/m2), depending on the terrain and geographical location. For example, the triangulated surface mesh illustrated in Figure 8b, which was generated from the point cloud utilised in this study, as was the case for the surfaces in the other analysed sections, features an average density of 13 points/m2 of planar area.
The horizontal alignment of the selected sections of the A1 motorway was interpreted based on the visible edge lines of the hard shoulder identified in the digital orthophotographs (Figure 8a), while the vertical alignment was extracted from the DSM.
The road safety barriers evaluated in this study include steel W-beam profiles with a profile depth of 31 cm, where the corrugated beam protrudes by 85 mm in front of the continuous supporting structure toward the traffic lane or emergency lane, while the concrete safety barriers utilise the standard New Jersey profile.
Roadside safety barriers on right-hand curves were positioned in distinct configurations (Figure 2): 0.50 m from the edge of the emergency lane in standard fill areas, 0.75 m from the edge of the emergency lane in fill areas featuring a drainage gutter, and 0.75 m from the emergency lane in cut areas to accommodate the drainage gutter located between the barrier and the traffic lane. All horizontal offsets for steel barriers were measured directly from the face of the W-beam. Similarly, median barriers on left-hand curves were positioned 0.75 m from the inner shoulder edge, measured from the W-beam, to accommodate the drainage gutter located between the barrier and the lane (Figure 2). The standard height of the barriers above the pavement surface was 0.75 m for W-beam profiles and 0.85 m for concrete barriers. For the ORD software to recognise these barriers as a visibility obstructions, they must be modelled as a continuous object assigned the specific “Barrier” feature type. The positions of the driver’s eye and the target obstacle remained identical to those utilised in the 2D analysis, with their respective heights conforming to the Croatian guidelines [25] described in Section 2.1.
Regarding OpenRoads Designer (ORD) software, the validity of this tool was demonstrated in prior research [36], as it accounts for three-dimensional features that are neglected in traditional 2D analyses, such as the berm height in cut areas of the road. Furthermore, comparative evaluations with Autodesk Civil 3D yielded similar results. Notably, both ORD and Autodesk Civil 3D are the most utilised software solutions for highway design in Croatia.
The ASD evaluation was conducted in 5 m increments along selected sections of the A1 motorway. After configuring the sight analysis parameters, the ORD software automatically generates 3D lines of sight between the driver’s eye and the target obstacle along the corridor, providing tabular data on visibility and identifying whether obstructions stem from design elements or terrain. The analysis was performed on a dual carriageway in the Zagreb–Split–Dubrovnik direction and in the opposite direction at an operating speed of 130 km/h, apart from Section 6 (Figure 7), which was tested at 120 km/h.
A comprehensive comparison between 2D and 3D ASD evaluations of actual motorway models is unfeasible due to the complexity of 2D sightline drawing at 5 m intervals and the difficulty of distinguishing berms from cut slope under vegetation and on uneven cut slope surfaces. Consequently, the comparison of 2D and 3D ASD values is limited to horizontal curves with safety barriers, focusing solely on the lowest generated values. Notably, the errors associated with Equations (6) and (10) range from 0.1% to 0.5%, where larger curve radii consistently yield lower errors.

3. Results

This section presents the findings from evaluation of ASD across right- and left-hand motorway curves using both 2D (Section 3.1 and Section 3.2) and 3D motorway models (Section 3.3).

3.1. Results from the Evaluation of Available Sight Distance on Right-Hand Curves Using Motorway Models

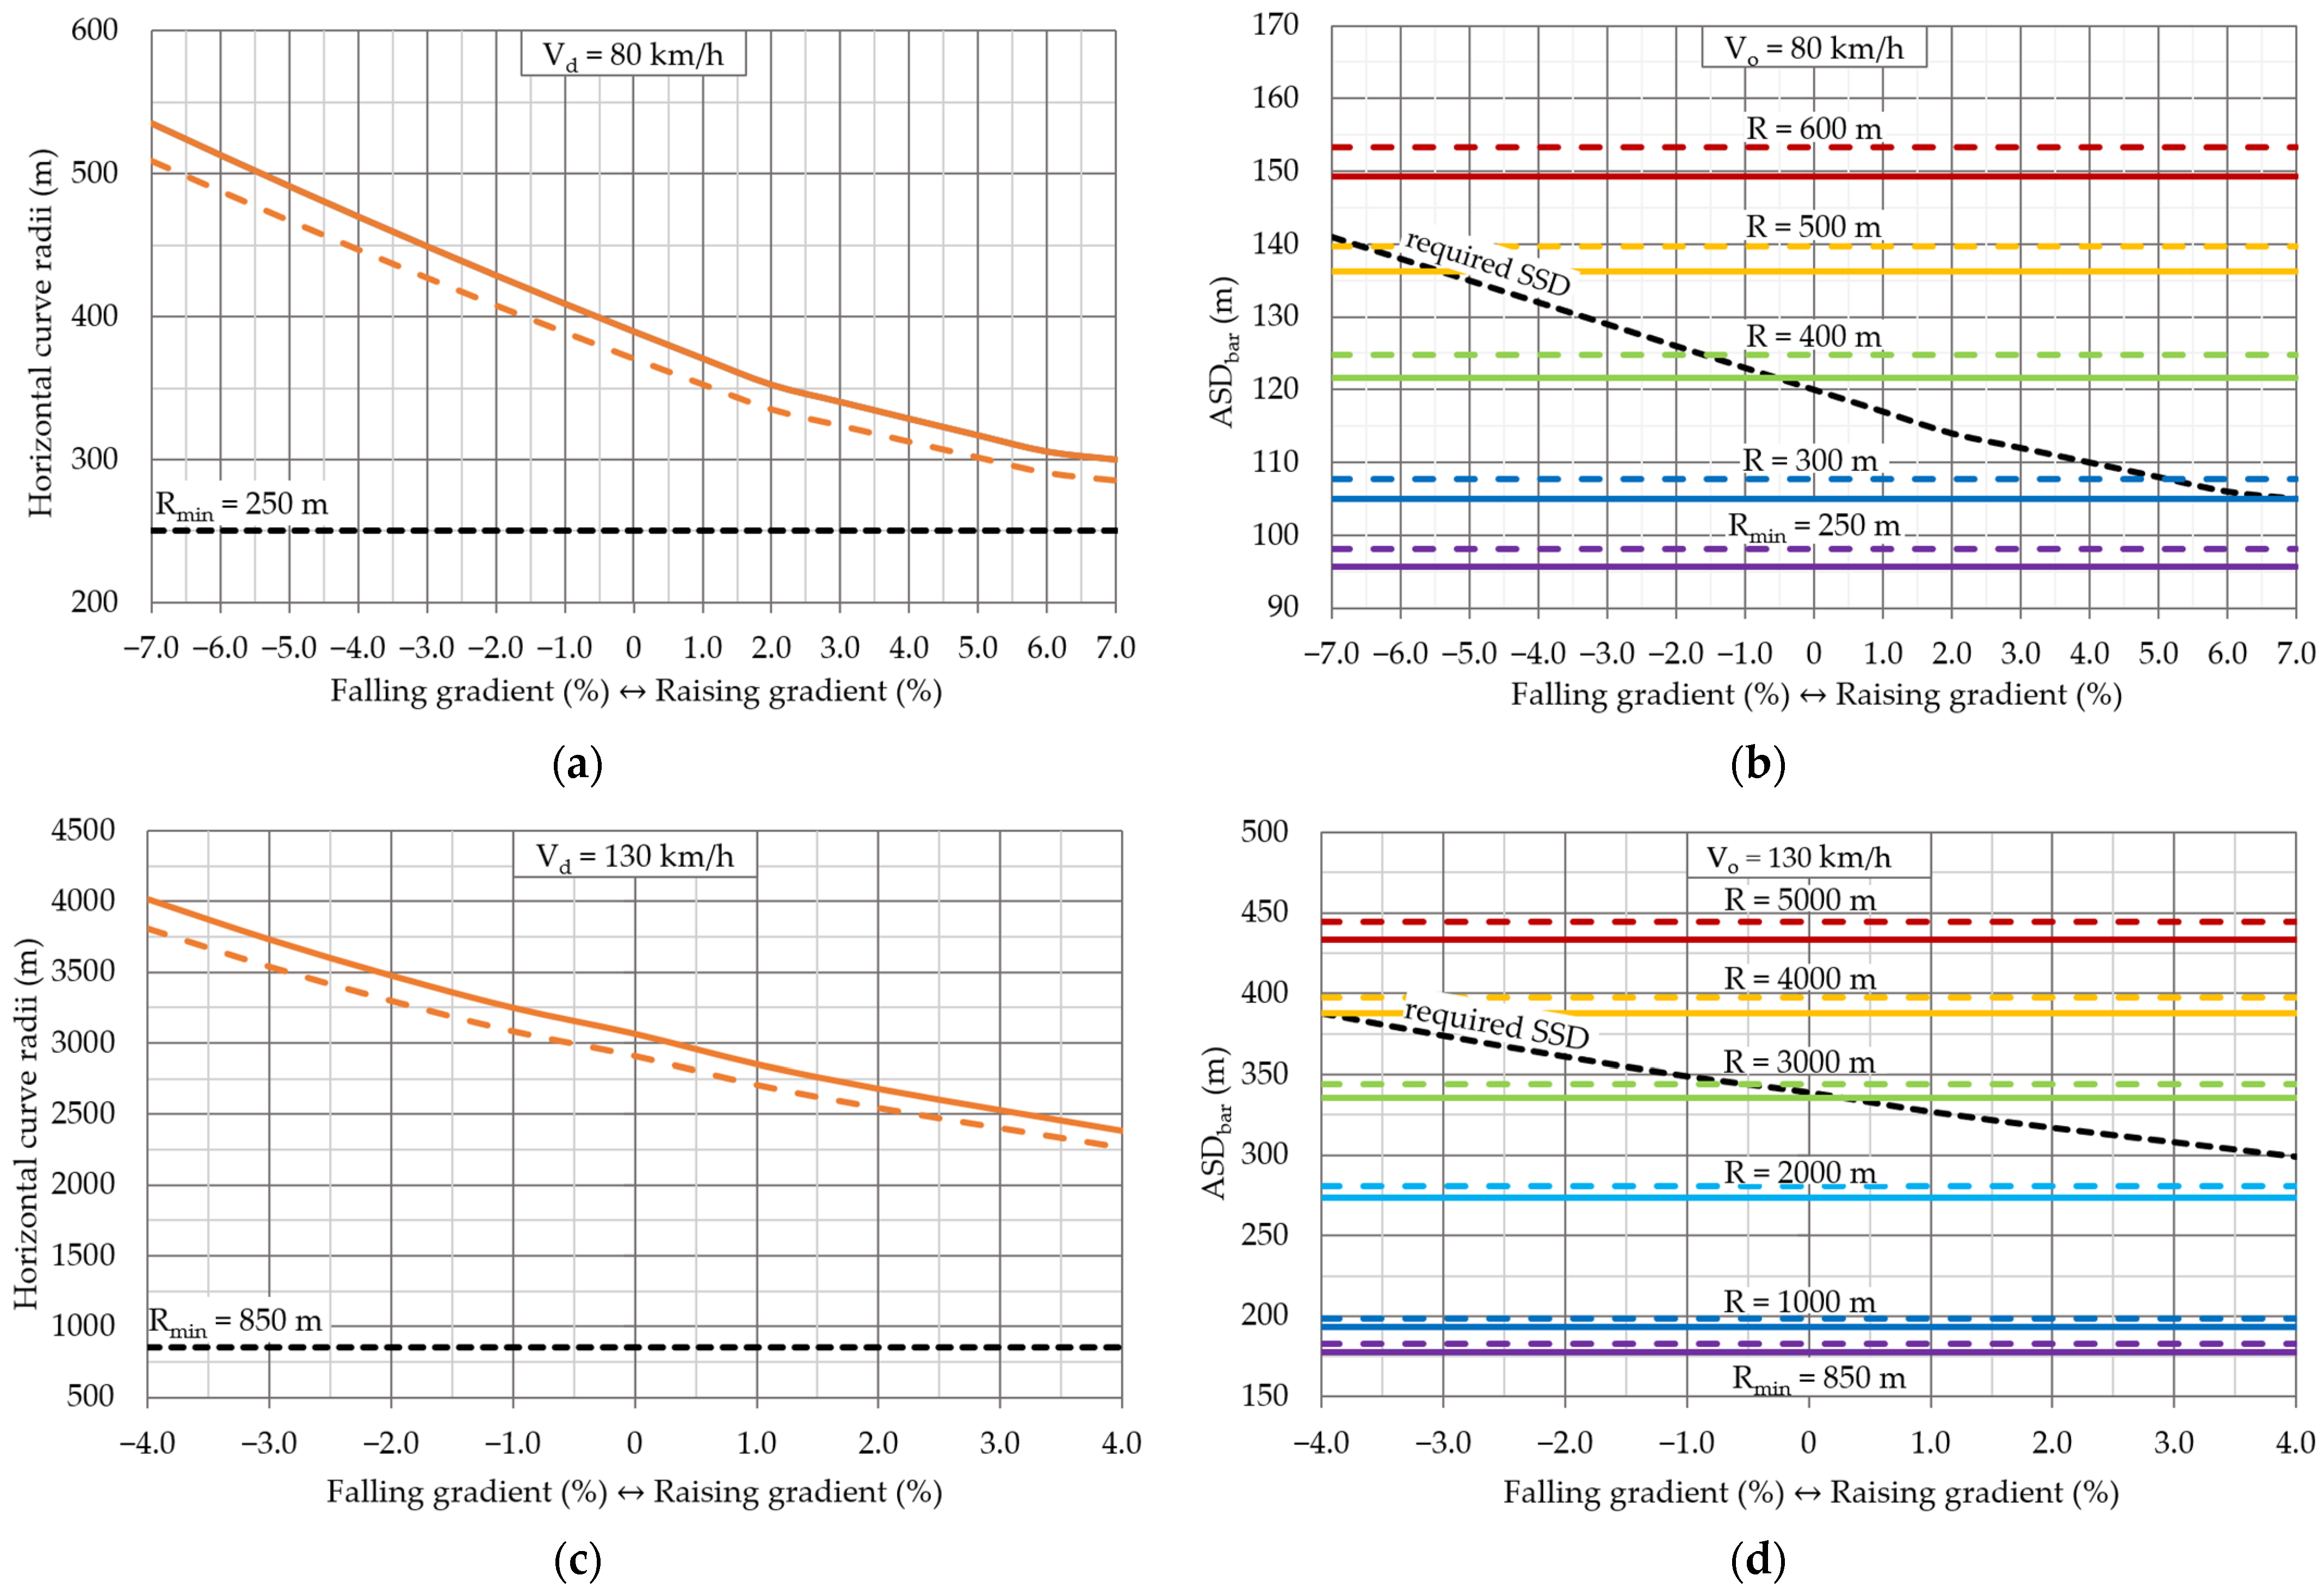
The results from the preliminary ASD analysis for right-hand horizontal curves (as described in the Section 2.2) demonstrate that motorway models featuring minimum allowable horizontal curve radii (Rmin) fail to provide adequate sight distance across the designated design speeds (Vd) and barrier configurations. Crucially, this deficiency persists even in horizontal curves that exceed the minimum required radii. Consequently, the findings illustrated in Figure 9a,c introduce modified minimum horizontal curve radii for barrier-restricted motorways (Rmin,bar) to ensure parity between the ASD and the required SSD (Appendix A, Table A1). Across all design speeds, Rmin,bar consistently exceeds standard Rmin, with disparity intensifying as descending longitudinal gradients increase. Similarly, the findings illustrated in Figure 9b,d show that the ASDbar values across various horizontal curve radii, operating speeds, and longitudinal gradients fail to achieve the required SSD for specific radii, upon which the longitudinal gradient exerts a significant influence. This confirms that the minimum horizontal curve radii for barrier-restricted motorways must be substantially larger than the standard Rmin stipulated in the regulations [25] to guarantee sufficient visibility.
Considering two distinct safety barrier distances (bd) of 0.50 m and 0.75 m from the emergency lane edge, the findings illustrated in Figure 9 reveal notable variance. Specifically, the 0.75 m distance yields approximately 5% lower Rmin,bar values than the 0.50 m distance, whereas the 0.50 m distance results in approximately 3% lower ASDbar values compared to the 0.75 m distance.

3.2. Results from the Evaluation of Available Sight Distance on Left-Hand Curves Using Motorway Models

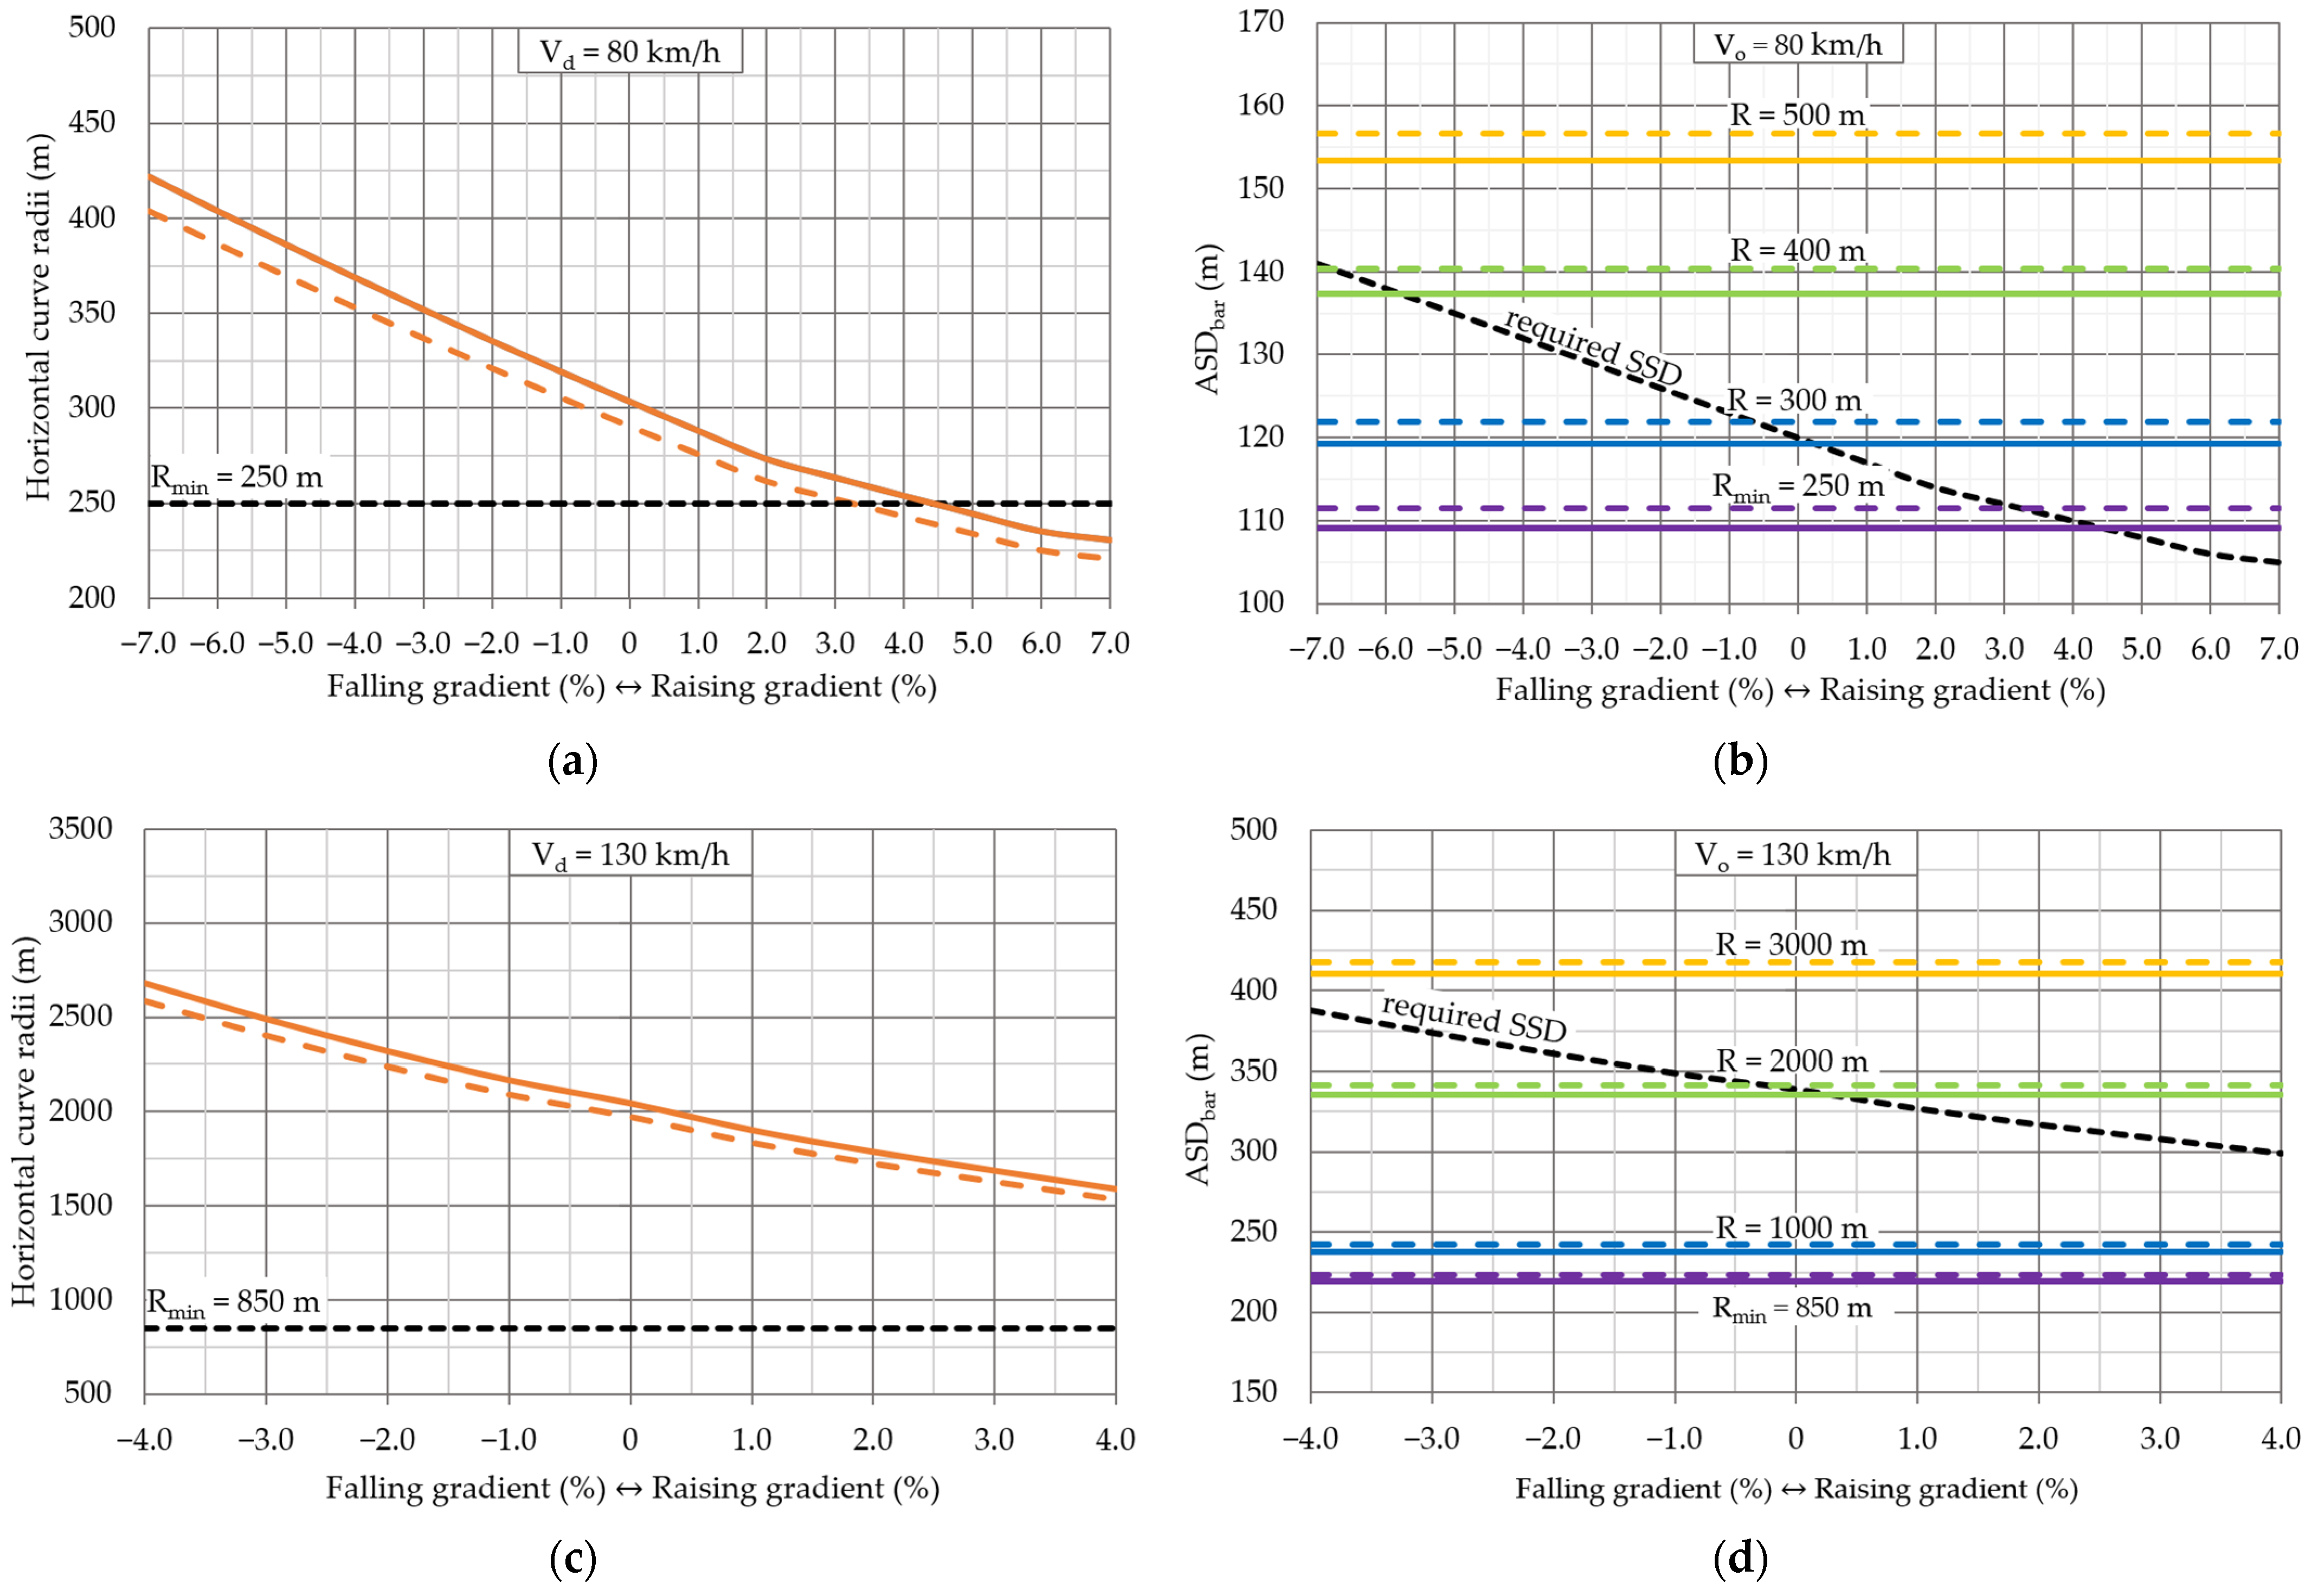
The results from the preliminary ASD analysis for left-hand horizontal curves (as described in the Section 2.2) demonstrate that motorway models featuring the minimum allowable horizontal curve radii (Rmin) mostly fail to provide adequate sight distance across designated design speeds (Vd) and barrier configurations.
However, this visibility deficiency persists even within horizontal curves that exceed the minimum required radii (Figure 10b). Consequently, the findings illustrated in Figure 10a,c introduce modified minimum horizontal radii for barrier-restricted motorways (Rmin,bar) that ensure the ASD is equal to the required SSD (Appendix A, Table A1) for any given design speed (Vd) and longitudinal gradient. Across all design speeds, except for 80 and 90 km/h, Rmin,bar consistently exceeds standard Rmin, with this disparity intensifying as descending longitudinal gradients increase.
Similarly, the findings illustrated in Figure 10b,d show that the ASDbar values across various horizontal curve radii, speeds, and longitudinal gradients fail to achieve the required SSD for specific radii, upon which the longitudinal gradient exerts a significant influence. In specific instances, namely ascending longitudinal gradients exceeding 3% at design speeds of 80 and 90 km/h, the ASD satisfies the required SSD (Figure 10a). This confirms that the minimum horizontal curve radii for barrier-restricted motorways must be substantially larger than the standard Rmin stipulated in the regulations [25] to guarantee sufficient visibility. Considering two distinct safety barrier distances (bd) of 0.50 m and 0.75 m from the emergency lane edge, the findings illustrated in Figure 9 reveal notable variance. Specifically, the 0.75 m distance yields approximately 4% lower Rmin,bar values than the 0.50 m distance, whereas the 0.50 m distance results in approximately 2% lower ASDbar values compared to the 0.75 m distance.

3.3. Results from the Evaluation of Available Sight Distance Using Motorway Models Based on Real Data

The research results are presented for each section in both directions from the perspective of the observer’s eye. The results for the sections in the DU–ST–ZG direction should be observed from the highest to the lowest stationing (from right to left). These sections in the DU–ST–ZG direction are shorter due to the geometric limitations of the 3D model, as the line of sight cannot extend beyond the model boundary. Following the ASD analysis across the six selected sections of the A1 motorway, the findings are presented below:
  • Section 1: The ASD consistently meets the required SSD in both directions for an operating speed of 130 km/h (Appendix A, Table A1). In the DU–ST–ZG direction, the section is shorter, spanning a total length of 16,950 m. This full compliance is attributed to the presence of two large-radius horizontal curves (R = 14,000 m and 15,000 m) transitioning into a long straight alignment, combined with minimal longitudinal gradients ranging from 0.24% to 0.11% and large vertical sag radii of 40,000 m and 150,000 m. Consequently, unobstructed sight visibility is maintained throughout this section.
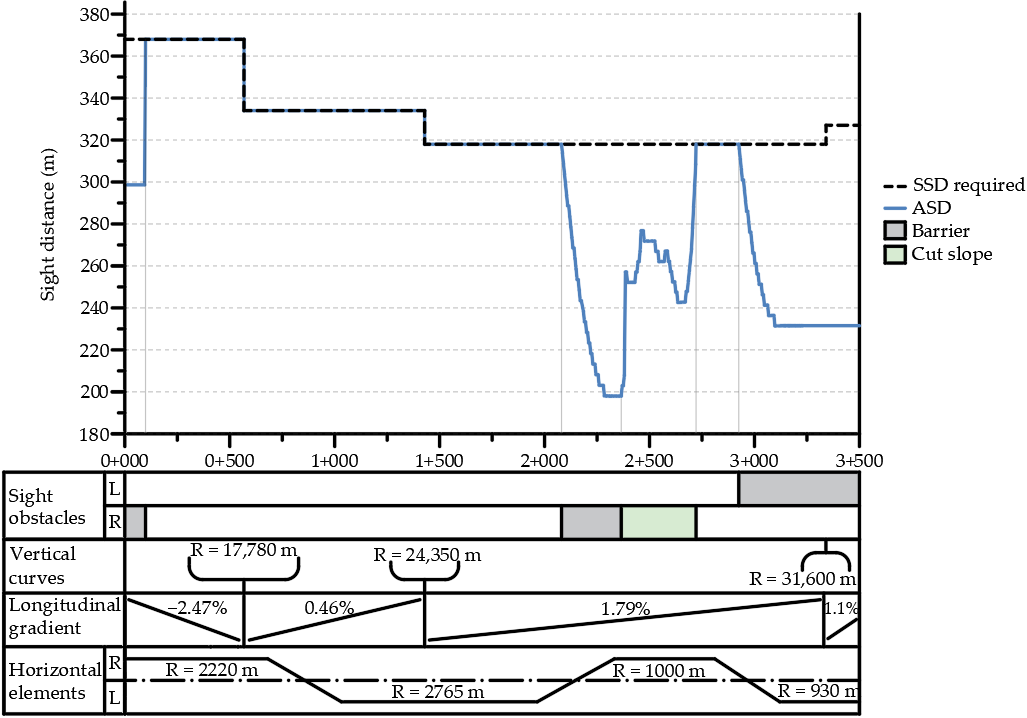
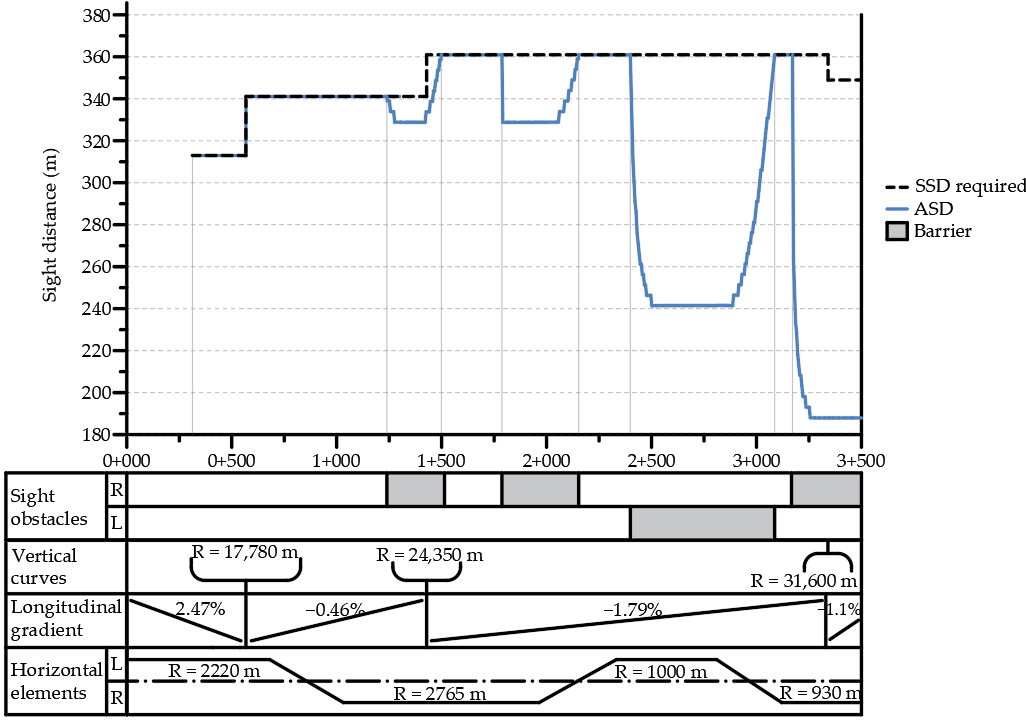
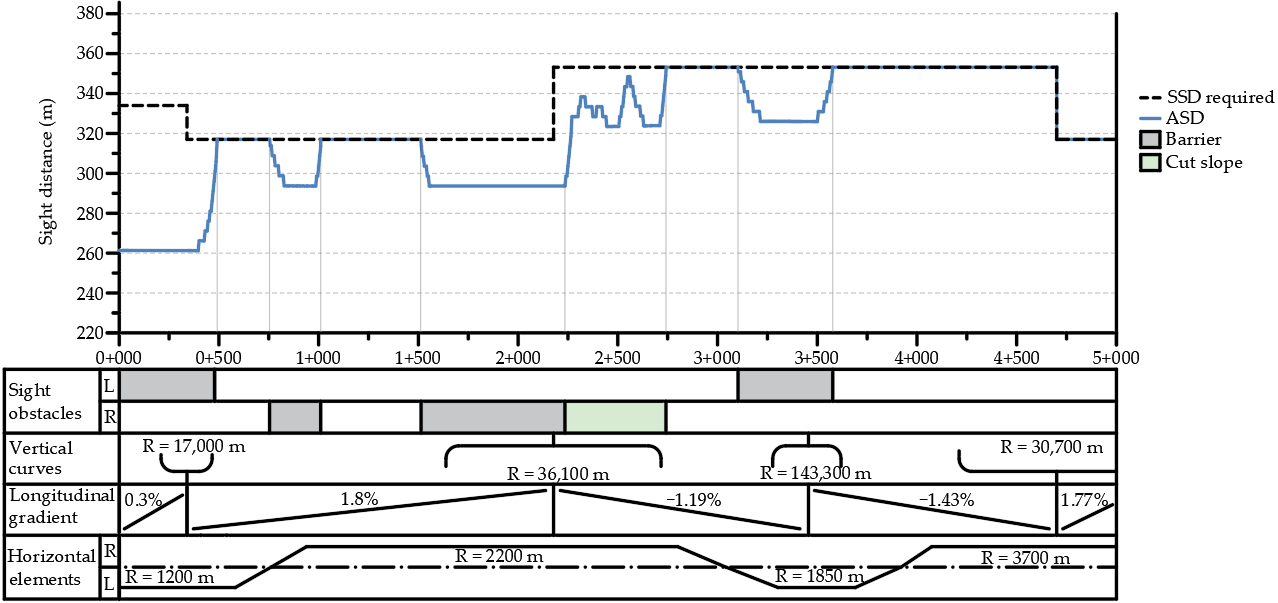
  • Section 2: In the direction of ZG–ST–DU the ASD meets the required SSD (Appendix A, Table A1) for the operating speed of 130 km/h across 2215 m of this 3500 m long section (Figure 11), representing 63.3% of the total section length. On the segments where it fails to do so, the restriction is primarily caused by the roadside or median safety barriers, as illustrated in Figure 11.
The crest and sag vertical curves radii are significantly larger than the mandatory minimum thresholds, meaning they do not negatively influence sight visibility. Additionally, certain segments within this section lack adequate sight distance due to the cut slope, resulting from an insufficient berm width. A comparison of the 2D and 3D ASD analysis values revealed that, for a right-hand curve with a radius of R = 1000 m, the 2D model obtained an ASD of 199 m, whereas the 3D evaluation yielded 198.01 m. Similarly, for a left-hand curve with a radius of R = 930 m, the 2D ASD was 232.25 m compared to a 3D ASD of 231.51 m.
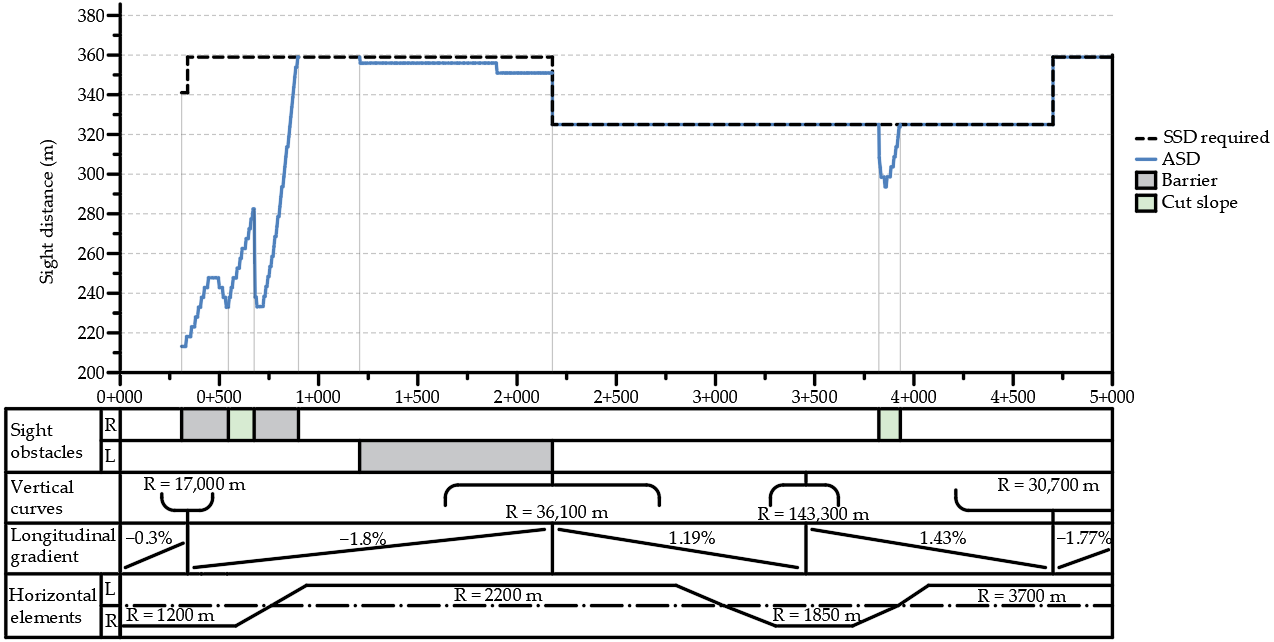
In the DU–ST–ZG direction, the ASD meets the required SSD (Appendix A, Table A1) for the operating speed of 130 km/h across 1535 m of this 3180 m long section (Figure 12), representing 48.3% of the total section length. On the segments where it fails to do so, the restriction is primarily caused by the roadside or median safety barriers, as illustrated in Figure 12. A comparison of the 2D and 3D ASD analysis values revealed that, for a left-hand curve with a radius of R = 1000 m, the 2D model obtained an ASD of 240.83 m, whereas the 3D evaluation yielded 241.45 m. Similarly, for a right-hand curve with a radius of R = 930 m, the 2D ASD was 191.91 m compared to a 3D ASD of 187.93 m.
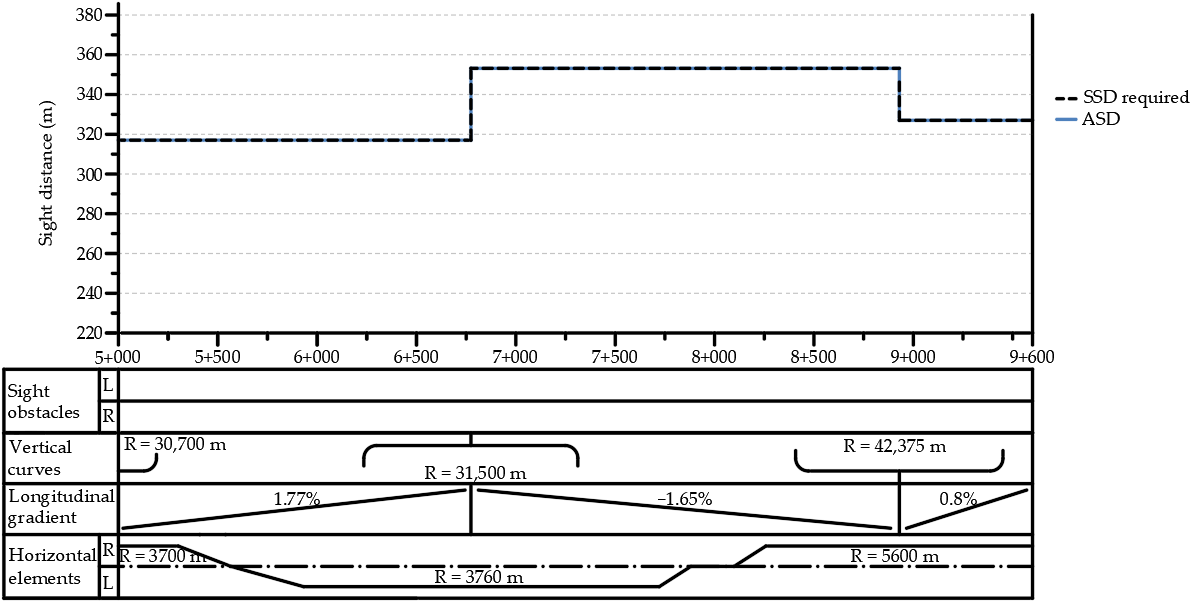
  • Section 3: In the ZG–ST–DU direction, the ASD meets the required SSD (Appendix A, Table A1) for the operating speed of 130 km/h across 6895 m of this 9600 m long section, representing 71.8% of the total length (Figure 13 and Figure 14), primarily owing to three large horizontal radii between 3700 m and 5600 m. On the segments where it fails to do so, the restriction is caused by the roadside or median safety barriers, as illustrated in Figure 13. The crest and sag vertical curves radii are significantly larger than the mandatory minimum thresholds, meaning they do not negatively influence sight visibility. Additionally, certain segments within this section lack adequate sight distance due to the cut slope, resulting from an insufficient berm width. A comparison of the 2D and 3D ASD analysis values revealed that, for a right-hand curve with a radius of R = 2200 m, the 2D model obtained an ASD of 295.16 m, whereas the 3D evaluation yielded 293.64 m. Similarly, for a left-hand curve with a radius of R = 1200 m, the 2D ASD was 263.82 m compared to a 3D ASD of 261.33 m, while for the radius of R = 1850 m, the 2D ASD reached 327.57 m compared to a 3D ASD of 326.05 m.
In the DU–ST–ZG direction, the ASD meets the required SSD (Appendix A, Table A1) for the operating speed of 130 km/h across 7630 m of this 9300 m long section, representing 82.0% of the total length (Figure 15). On the segments where it fails to do so, the restriction is caused by the roadside or median safety barriers, as illustrated in Figure 15. Additionally, certain segments within this section lacks adequate sight distance due to the cut slope, resulting from an insufficient berm width. A comparison of the 2D and 3D ASD analysis values revealed that, for a left-hand curve with a radius of R = 2200 m, the 2D model obtained an ASD of 357.21 m, whereas the 3D evaluation yielded 350.98 m. Similarly, for a right-hand curve with a radius of R = 1200 m, the 2D ASD was 217.98 m compared to a 3D ASD of 213.19 m.
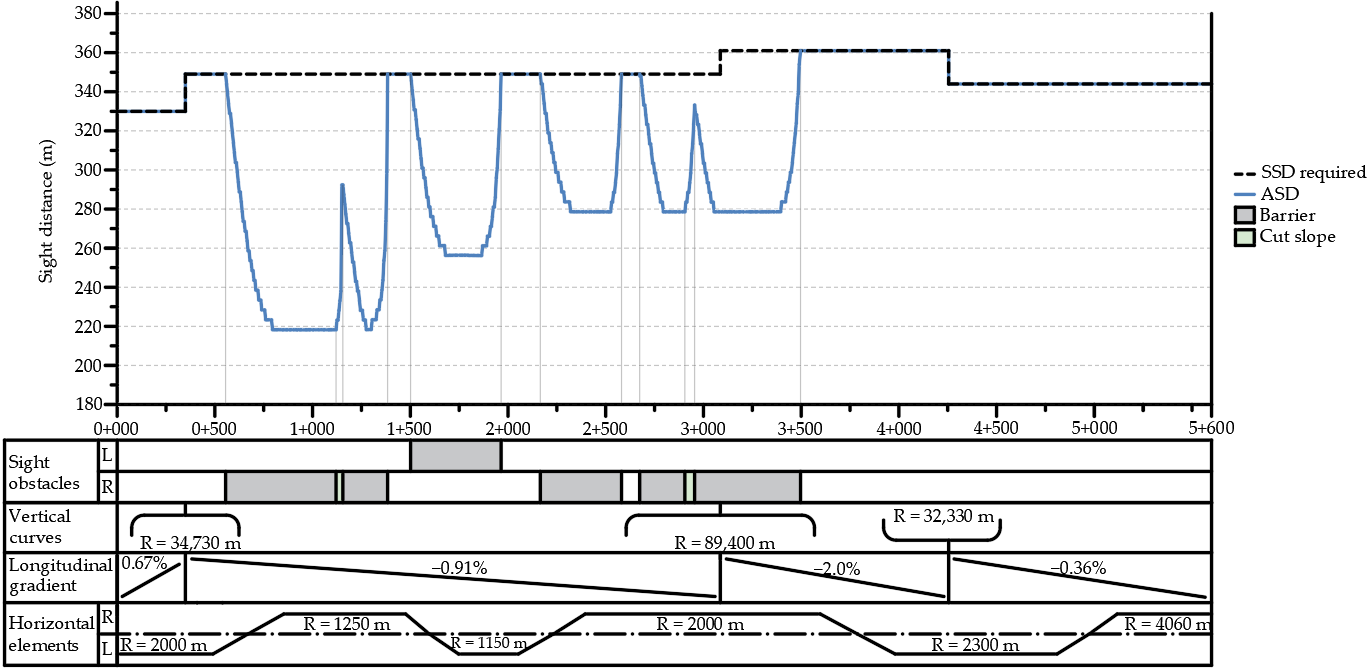
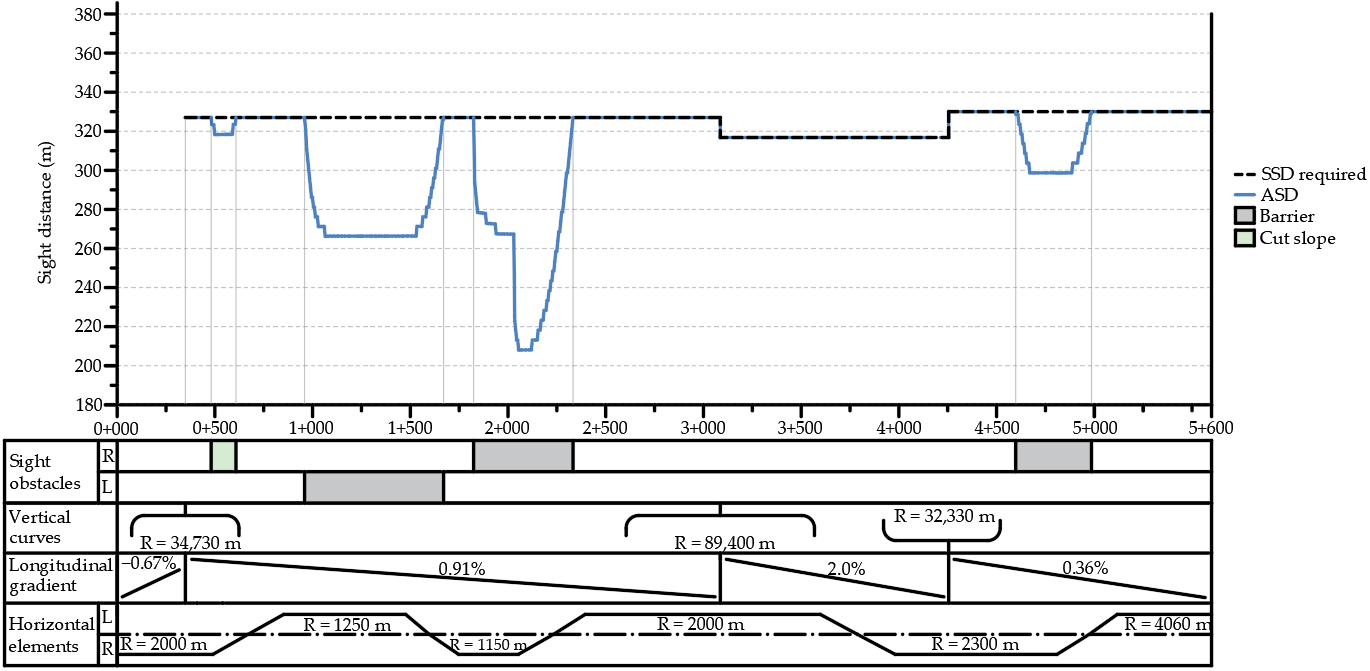
  • Section 4: In the ZG–ST–DU direction, the ASD meets the required SSD (Appendix A, Table A1) for the operating speed of 130 km/h across 3065 m of this 5600 m long section, representing 54.7% of the total length (Figure 16). On the segments where it fails to do so, the restriction is caused by the roadside or median safety barriers, as illustrated in Figure 16. The crest and sag vertical curves radii are significantly larger than the mandatory minimum thresholds, meaning they do not negatively influence sight visibility.
Additionally, two short segments lack adequate sight distance due to the cut slope resulting from an insufficient berm width. A comparison of the 2D and 3D ASD analysis values revealed that, for a right-hand curve with a radius of R = 1250 m, the 2D model obtained an ASD of 222.49 m, whereas the 3D evaluation yielded 219.23 m, while for a radius of R = 2000 m, the 2D model obtained 281.42 m, whereas the 3D evaluation yielded 278.58 m. Similarly, for a left-hand curve with a radius of R = 1150 m, the 2D ASD was 258.26 m compared to a 3D ASD of 256.37 m.
In the DU–ST–ZG direction, the ASD meets the required SSD (Appendix A, Table A1) for the operating speed of 130 km/h across 3535 m of this 5270 m long section, representing 67.1% of the total length (Figure 17). On the segments where it fails to do so, the restriction is caused by the roadside or median safety barriers, as illustrated in Figure 17. Additionally, short segments lack adequate sight distance due to the cut slope resulting from an insufficient berm width. A comparison of the 2D and 3D ASD analysis values revealed that, for a left-hand curve with a radius of R = 1250 m, the 2D model obtained an ASD of 269.26 m, whereas the 3D evaluation yielded 266.30 m. Similarly, for a right-hand curve with a radius of R = 1150 m, the 2D ASD was 213.40 m compared to a 3D ASD of 208.50 m, while for a radius of R = 2300 m, the 2D model obtained 301.79 m, whereas the 3D evaluation yielded 298.68 m.
  • Section 5: The available ASD consistently meets the required SSD in both directions for an operating speed of 130 km/h (Appendix A, Table A1). In the DU–ST–ZG direction, the section is shorter, spanning a total length of 18,150 m. This full compliance is attributed to the presence of five large-radius horizontal curves, ranging from 3940 m to 6300 m, combined with minimal longitudinal gradients between 0.28% to 0.42% and large vertical crest and sag radii between 38,500 m and 122,000 m. Consequently, unobstructed sight visibility is maintained throughout this section.
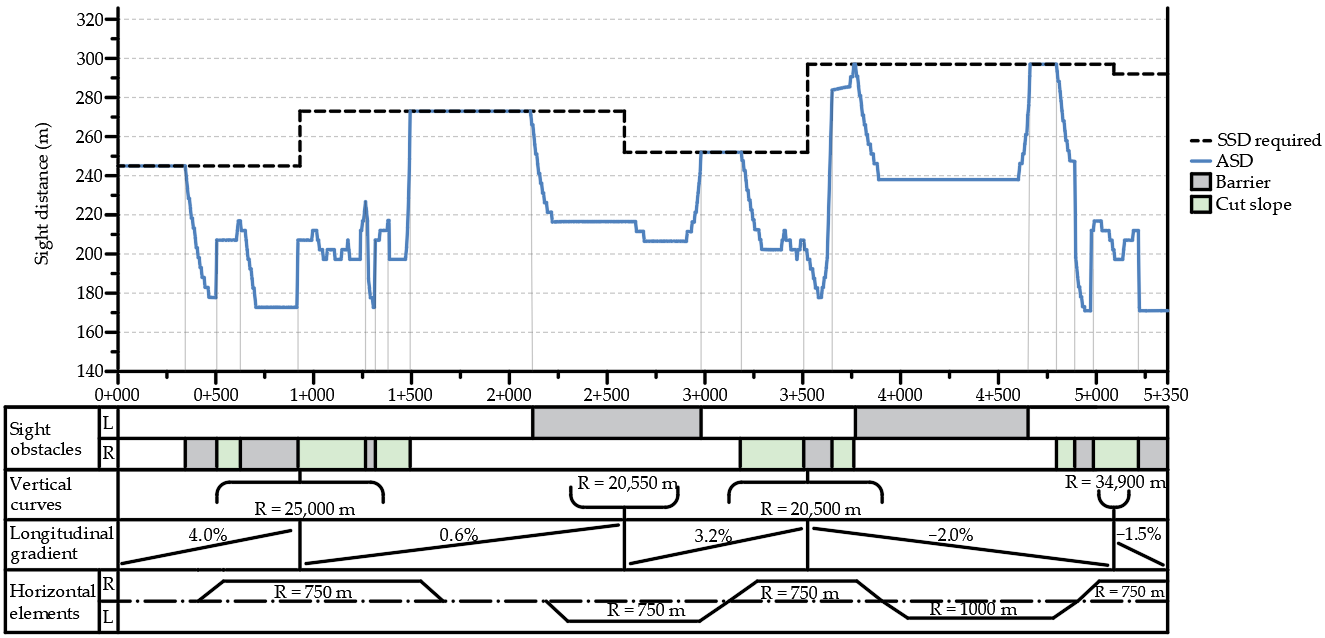
  • Section 6: In the ZG–ST–DU direction, the ASD meets the required SSD (Appendix A, Table A1) for the operating speed of 120 km/h across only 1310 m of this 5350 m long section, representing 24.5% of the total length (Figure 18), meaning it fails to comply over most of the section. This widespread deficiency is primarily a consequence of applying a minimum horizontal radius of 750 m in several curves for a design speed of 120 km/h. As illustrated in Figure 18, the resulting visibility restriction is caused by the roadside or median safety barrier. The crest and sag vertical curves radii are significantly larger than the mandatory minimum thresholds, meaning they do not negatively influence sight visibility. Furthermore, seven short segments lack adequate sight distance due to the cut slope resulting from an insufficient berm width. A comparison of the 2D and 3D ASD analysis values revealed that, for a right-hand curve with a radius of R = 750 m, the 2D model obtained an ASD of 172.34 m, whereas the 3D evaluation yielded 172.79 m. Similarly, for a left-hand curve with a radius of R = 750 m, the 2D ASD was 208.57 m compared to a 3D ASD of 206.54 m, while for the radius of R = 1000 m, the 2D ASD reached 240.83 m compared to a 3D ASD of 237.43 m.
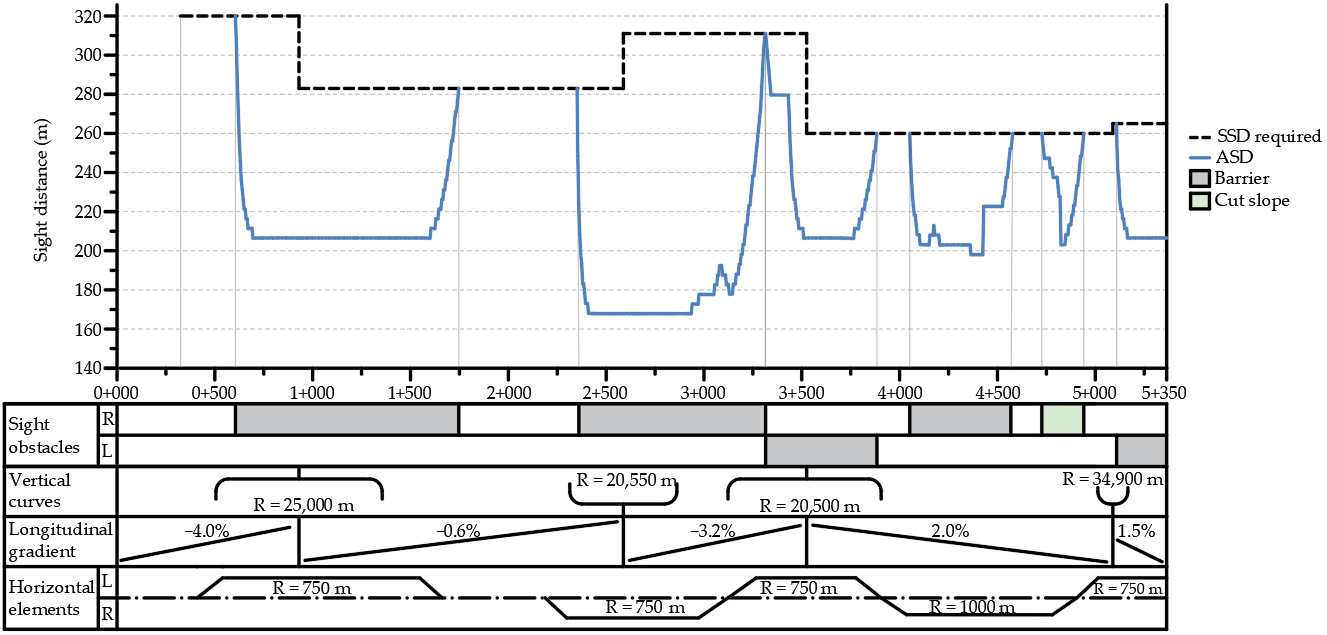
In the DU–ST–ZG direction, the ASD meets the required SSD (Appendix A, Table A1) for the operating speed of 120 km/h across only 1370 m of this 5020 m long section, representing 27.3% of the total length (Figure 19), meaning it fails to comply over most of the section. This widespread deficiency is primarily due to the application of the minimum horizontal radius of 750 m in several curves for a design speed of 120 km/h. As illustrated in Figure 19, the resulting visibility restriction is caused by the roadside or median safety barrier. This section features not only a steel sheet barrier, but also long segments of a concrete safety barrier positioned along a high embankment slope. Furthermore, one segment lacks adequate sight distance due to the cut slope resulting from an insufficient berm width. A comparison of the 2D and 3D ASD analysis values revealed that, for a left-hand curve with a radius of R = 750 m, the 2D model obtained an ASD of 208.57 m, whereas the 3D evaluation yielded 206.55 m. Similarly, for a right-hand curve with a radius of R = 750 m, the 2D ASD was 172.34 m compared to a 3D ASD of 167.84 m, while for the radius of R = 1000 m, the 2D ASD reached 199.01 m compared to a 3D ASD of 198.23 m.
Based on the ASD analysis data shown in Table 3, the geometric and infrastructure-driven ASD deficiencies across the evaluated motorway sections yield several conclusions:
  • Section 6 exhibits the highest vulnerability, accumulating 7690 m of restricted sight distance, which accounts for nearly 40% of the total recorded deficiencies across all sections;
  • Roadside safety barriers represent the leading cause of limited visibility, accounting for a cumulative 9285 m of deficient segments across both directions;
  • The ZG–ST–DU direction experiences a higher total length of ASD deficiencies (10,565 m) compared to the opposite DU–ST–ZG direction (8700 m);
  • Cut slopes severely restrict visibility in the ZG–ST–DU direction (2385 m), whereas their impact is significantly lower in the opposite direction (585 m);
  • Section 1 and Section 5 achieve perfect spatial visibility, recording zero ASD deficiencies across all geometric and infrastructure parameters in both traffic directions.

4. Discussion

Safety barriers act as prominent physical obstructions in the driver’s visual field, as demonstrated in prior research [16,17,18,19,20] and further substantiated by this study. Beyond structural containment and energy absorption from vehicle impacts, which represent the primary functions of barriers [1,2,3,4,5,6,7,8,9], when installed along horizontal curves with radii near the required minimum on high-speed motorway corridors, these structures significantly restrict a driver’s line of sight, thereby reducing the ASD below required safety thresholds. This study focuses on 2D and 3D spatial visibility analyses, investigating how barrier configurations and motorway geometry on the A1 motorway in Croatia interact to limit the necessary SSD. This investigation demonstrated that, out of the total 59.85 km analysed across the selected sections in the ZG–ST–DU direction, 49.29 km exhibit an ASD that satisfies the required SSD for the defined operating speed, representing 82.3% of the total length. In the opposite, DU–ST–ZG, direction, out of the total 57.87 km, 49.17 km exhibit an ASD that complies with the required SSD, representing 85.0% of the total length. However, a more detailed analysis (Figure 11, Figure 12, Figure 13, Figure 14, Figure 15, Figure 16, Figure 17, Figure 18 and Figure 19) yielded varied outcomes. Within specific segments of four out of the six evaluated sections in both directions, the available ASD remains below the required SSD. This disparity intensifies as horizontal radii decrease towards the mandatory minimum and as descending longitudinal gradients increase (Figure 9, Figure 10, Figure 11, Figure 12, Figure 13, Figure 14, Figure 15, Figure 16, Figure 17, Figure 18 and Figure 19), whereas vertical curves do not negatively influence sight visibility, because their radii are significantly larger than the minimum required values. Notably, Section 6 features the lowest overall sight visibility, with the ASD achieving the required SSD across only 24.5% of the section length in the ZG–ST–DU direction and 27.3% in the DU–ST–ZG direction. The analysis also reveals that both roadside and median barriers restrict visibility. Accident data [52,53,54,55], which were utilised in this study solely as background information, indicate that not a single collision with roadside obstacles was recorded on Section 6 between 2023 and 2025, despite this severe restriction. Section 1, which accommodates the highest traffic volume, exhibits no visibility deficiencies due to its favourable horizontal and vertical alignment. Consequently, only three collisions with obstacles were recorded along this section between 2023 and 2025. The remaining four sections, located between the Otočac and Gornja Ploča interchanges, were specifically selected for ASD analysis because they exhibited the highest frequency of collisions with obstacles, totalling 77 incidents between 2023 and 2025, with 26 of these occurrences taking place at night [52,53,54,55]. Within this 37.20 km stretch, the evaluation showed that, while the ASD meets the required SSD across most of the distance, 17.2% of the section length fails to meet this requirement in the ZG–ST–DU direction and 14.1% in the DU–ST–ZG direction. Section 5, which is 18.50 km long, is particularly noteworthy because its favourable geometry ensures that the ASD fully complies with the required SSD across its entire length in both directions. Along specific segments of Section 2, Section 3, Section 4 and Section 6 (Figure 11, Figure 13, Figure 15, Figure 16, Figure 17, Figure 18 and Figure 19), cut slopes severely obstruct the ASD of the A1 motorway, raising substantial safety concerns. This study also highlights the critical need to assess visibility in left-hand curves, a requirement that is often neglected. Consequently, the findings suggest that sight visibility was not evaluated during the design phase, because cut slopes and median barriers interfere with the ASD. Data from the 240 total collisions with obstacles recorded on the A1 motorway between 2023 and 2025 indicate that these incidents predominantly resulted in property damage (230 incidents), rarely caused injuries (10 incidents), and resulted in no fatalities [52,53,54,55]. Road design errors often occur, making mitigation essential. Thus, in this study [58] we investigated the safety implications of 3D alignment designs, focusing on sight distance, visual perception, and coordination defects. We focus on methodologies that integrate advanced simulation tools with statistical models to evaluate and analyse the safety implications of geometric design features. Finally, the study examines how design guidelines address poor 3D coordination and outlines upcoming challenges in the field.
This study establishes a methodology for 2D and 3D ASD analysis of barrier-restricted motorways, introducing two parameters exclusively for the 2D approach: the minimum horizontal curve radius (Rmin,bar) and the available sight distance (ASDbar). The retroactive application of these parameters to existing networks with insufficient visibility is financially unviable due to corridor reconstruction costs (owing to the excessive earthworks required in the cross-section to widen the shoulder, berm, or median). Concurrently, this study highlights the critical need to integrate these parameters during preliminary design, noting that, for operational highways, the most pragmatic immediate countermeasure is restricting operating speeds to align the ASD with the required SSD. For instance, along Section 4 (Figure 16), between approximately 500 m and 1400 m, the speed limit would need to be reduced to 100 km/h in accordance with Appendix A, Table A1. This measure is straightforward to implement using variable message signs (VMSs) and dynamic or variable speed limits (DSLs/VSLs) [44,45]. However, enforcing such speed reductions directly challenges the fundamental economic justification for constructing high-cost transport infrastructure intended for high-speed mobility.
This study presents a transferable workflow for 2D and 3D analysis of sight visibility on motorways. Its primary contribution extends beyond national assessments to a supranational scale. The developed formulations for 2D sight distance testing are globally applicable, requiring only local parameter adjustments such as stopping sight distance, lane, median, shoulder, and emergency lane widths, alongside the lateral offset of barriers from the roadway or gutter edge. Furthermore, this broad applicability extends to 3D environments, where standard industry software, such as ORD by Bentley Systems, can be deployed to generate motorway models with integrated barriers and LiDAR-derived DSM point clouds to evaluate sight distance. Although, 2D analysis is straightforward for barrier-restricted motorways, it exhibits critical limitations. It requires longitudinal grades and vertical curve radii to be known beforehand to operate effectively, and it fails to account for carriageway superelevation and transition road segments. Furthermore, it cannot accommodate complex cross-sectional features such as vegetation and cut slope irregularities, and evaluating a 60 km motorway corridor using 2D sightlines would be highly time-consuming. Finally, distinguishing where a berm ends and a cut slope begins remains challenging when relying solely on orthophotographs. Nonetheless, 2D analysis could be useful for the initial selection of horizontal curve radii during the preliminary design phases of roads.
In contrast, 3D modelling utilising DSMs derived from LiDAR point clouds overcomes these limitations by capturing every geometric detail. Consequently, this 3D methodology can be readily deployed when retrofitting new barriers to verify whether a given section satisfies the required SSD. While complex motorway environments with intricate supplementary features fell outside the immediate scope of this investigation, such elements can be comprehensively modelled using road design software. This 3D approach enables automatic calculation of the ASD and generation of sightlines. By rotating the 3D model through various angles, users can directly visualise the precise locations where visibility deficiencies occur. While both methodologies present distinct advantages and limitations, the primary disadvantage of the 3D point cloud-based DSM model is the substantial volume of data generated. Processing these data necessitates significant hardware performance, which can lead to computational bottlenecks and demands specialised personnel with advanced expertise in road design software. Comparisons show that differences between the 2D and 3D ASD analyses are within 3.0% for the minimum ASD values calculated in horizontal curves (Section 3.3). Crucially, the 3D model mostly derives smaller ASD values, meaning it errs on the side of safety.
Therefore, the limitations of this study include the limited applicability of the 2D analysis, as well as the dependency of the 3D motorway sections model’s accuracy on the quality and interpretation of the underlying DSM. Furthermore, while the ORD software suite was successfully tested before [36], more extensive validation is required to fully evaluate its precision across diverse scenarios. Finally, the scope of this review is limited by the number of selected sections, which comprise approximately 10% of the total length of the A1 motorway.
Globally, and even within the European Union (EU), significant discrepancies exist between countries regarding SSD values and ASD analysis parameters, particularly concerning driver eye heights and obstacle heights [22,23,24,25,26,27,28,29,30]. It is worth noting that the current Croatian regulations [25] were enacted in 2001, but the mandated design parameters date back to the 1990s or earlier. Given that Croatian road design principles are traditionally aligned with German practices, and the A1 motorway is part of the E65 corridor and the TEN-T network, it is important to compare Croatian, German, and TEM design criteria. A direct comparison among Croatian regulations [25], German guidelines [26], and the TEM Standards and Recommended Practice [59] reveals substantial differences. For instance, at an operating speed of 130 km/h on a 0% longitudinal gradient (s), the required SSD is 340 m in Croatia (Appendix A, Table A1) compared to only 248 m in Germany. For comparison, the TEM Standards [59] specify a stopping sight distance of 325 m for a design speed of 140 km/h, though no data are provided for 130 km/h. This demonstrates that Croatian regulations [25] enforce significantly higher SSD thresholds due to their reliance on obsolete friction coefficients, in contrast to the current German guidelines [26], which utilise deceleration rates that reflect recent scientific research.
Although Croatian regulations [25] and German guidelines [26] apply an identical 1.0 m driver’s eye height, obstacle heights differ significantly and are undefined in the TEM Standards. German guidelines [26] use a 0.5 m obstacle height for crest designs and 1.0 m for ASD analysis, while Croatian regulations [25] require a lower, speed-dependent height of 0.2 m at 130 km/h. Additionally, German guidelines [26] mandate that all obstructions to sight lines, such as cut slopes planted with grass or shrubs, noise barriers, and safety barriers, must be avoided up to the height of the line of sight within the visual field that must be kept clear along the carriageway. Otherwise, it is necessary to revise the design geometry or, in the case of roads undergoing reconstruction or improvement, introduce a reduced speed limit, which is generally applicable only under wet conditions. Due to these geometric variations and differing SSD thresholds, the minimum crest radius for 130 km/h is 27,600 m in Croatia [25], compared to 13,000 m in Germany [26] and 27,000 m for 140 km/h in TEM [59]. According to German guidelines [26], applying this minimum crest diameter inherently ensures that the required SSD is maintained, allowing drivers to safely perceive a vehicle at the end of a traffic queue during congestion. However, critical safety considerations, such as vehicle recognisability at night or in fog and driver perception–reaction behaviour during long, high-speed motorway journeys, would result in larger minimum crest diameters than those strictly required for seeing the end of a traffic queue [26]. This comparative analysis indicates that German guidelines [26] effectively neglect both day and night visibility in terms of small obstacles lower than 0.5 m. Cost–benefit analysis may have favoured routine vehicle repairs over large-scale infrastructural reconstruction to accommodate the sight visibility of such minor objects.
Future research should focus on a broader analysis of the motorway network to encompass diverse geometric configurations and cross-sectional features, while also extending the ASD analysis to the inner traffic lane. To build upon these initial findings, subsequent studies should utilise alternative 3D ASD analysis tools to conduct comparative evaluations and employ Digital Surface Models (DSMs) with greater spatial accuracy. A comprehensive framework is vital for updating Croatian road design regulations, specifically regarding ASD analysis, SSD requirements, and crest vertical curve determination. Rather than partially adopting international guidelines, a holistic systemic analysis is required to improve safety. Nonetheless, this study represents a valuable contribution to the civil and transport engineering literature, providing specific insights from Croatia that have previously remained undocumented in international research.

5. Conclusions

This research provides a transferable 2D and 3D ASD analysis methodology for motorways, which was used for selected sections of the A1 motorway in Croatia. Furthermore, these approaches to 2D and 3D sight distance testing are globally applicable, requiring only local parameter adjustments. Evaluation of the six selected sections demonstrated that the available ASDs along specific segments of four sections fail to meet the required SSD thresholds, primarily due to sight obstructions caused by safety barriers. Moreover, spatial visibility tests appear to have been neglected during the design phase along sections where cut slopes severely restrict driver sightlines. Current Croatian guidelines [25] solely rely on 2D analysis, which fails to account for safety barriers obstructing visibility, and utilise outdated SSD parameters that require revision. Consequently, Croatian regulations [25] should be updated, specifically regarding ASD analysis, SSD criteria, and crest vertical curve determination, to fulfil modern operational demands and enhance traffic safety. However, executing such updates necessitates comprehensive and rigorous research, for which this study represents the initial phase. This research aims to raise awareness among both national and supranational designers and decision makers, thereby prompting regulatory updates and encouraging better-informed choices during the initial phases of horizontal alignment design.

Author Contributions

Conceptualisation, I.S. and I.M.; methodology, I.S., I.M., and Ž.S.; validation, I.S. and I.M.; formal analysis, I.S. and I.M.; investigation, I.S. and I.M.; resources, I.S., I.M., and Ž.S.; writing—original draft preparation, I.S.; writing—review and editing, I.M. and Ž.S.; visualisation, I.S. and I.M.; supervision, I.S. and I.M. All authors have read and agreed to the published version of the manuscript.

Funding

This research received no external funding.

Data Availability Statement

The original contributions presented in this study are included in the article. Further inquiries can be directed to the corresponding author.

Acknowledgments

The authors express their sincere gratitude to the Croatian Ministry of the Interior for their assistance in obtaining the accident data required for the obstacle collision analysis on the A1 motorway. The authors also wish to thank the Croatian State Geodetic Administration (DGU) for providing the LiDAR DSM point clouds and digital orthophotographs used in this study.

Conflicts of Interest

Author Igor Majstorović was employed by the company Centar građevinskog fakulteta d.o.o., Croatia. The remaining authors declare that the research was conducted in the absence of any commercial or financial relationships that could be construed as potential conflicts of interest.

Abbreviations

The following abbreviations are used in this manuscript:
∆sGrade difference
2DTwo-dimensional
3DThree-dimensional
AASHTOAmerican Association of State Highway and Transportation Officials
AADTAnnual average daily traffic
ADASAdvanced driver assistance systems
AHPAnalytic hierarchy process
ASDAvailable sight distance
AVAutomated Vehicles
bdLateral offset of safety barrier from the emergency lane
CADComputer-aided design
DGUDržavna geodetska uprava
DSMDigital Surface Model
DSLDynamic speed limit
DUDubrovnik
elwEmergency lane width
ERDFEuropean Regional Development Fund
GISGeographic Information System
GRAGrey Relational Analysis
heEye height
hoObstacle height
HSOHorizontal sight offset
LiDARLight Detection and Ranging
LminTransition curve length
lswLeft shoulder lane width
lwTraffic lane width
MCDAMulti-Criteria Decision Analysis
mwMedian width
ORDOpenRoads Designer 2025
RdpRadius of driver path
RminMinimum horizontal radii
Rmin,barMinimum horizontal curve radius under barrier restrictions
rswRight shoulder lane width
RVminRadius of vertical crest curve
sLongitudinal grade
smaxMaximum longitudinal gradient
SSDStopping sight distance
STSplit
swSoft shoulder width
TOPSISTechnique for Order of Preference by Similarity to Ideal Solution
VSLVariable speed limit
VdDesign speed
VMSVariable message sign
VoOperating speed
ZGZagreb

Appendix A

Table A1. Stopping sight distance for various operating speeds (Vo) and longitudinal gradients (s).
Vo (km/h)\s (%)−7−6−5.5−5−4−3−2−10123455.567
80141138136135132129126123120117114112110108107106105
90--175172167162158154150146143140137134133--
100---222215208202196190185180176172168---
120----320308297287280269260252245----
130----388374361349340327317308299----

References

  1. Dong, Y.; Mumtarin, M.; Wood, J.S. Impacts of traffic barrier types on crash severity. Transp. Res. Interdiscip. Perspect. 2025, 32, 101517. [Google Scholar] [CrossRef] [Scilit]
  2. Albuquerque, F.D.B.d.; Awadalla, D.M. Roadside Fixed-Object Collisions, Barrier Performance, and Fatal Injuries in Single-Vehicle, Run-Off-Road Crashes. Safety 2020, 6, 27. [Google Scholar] [CrossRef] [Scilit]
  3. Jigaa, G.; Stamin, Ş.; Popovici, D.; Dinu, G. Study of Shock Attenuation for Impacted Safety Barriers. Procedia Eng. 2014, 69, 1191–1200. [Google Scholar] [CrossRef] [Scilit]
  4. Xie, Z.; Wang, R.; Zhao, H.; Xu, S.; Chen, W.; Ren, J. Road safety performance of a new W-beam guardrail system with rubber sandwich layer under vehicle collisions: Experimental and numerical studies. Eng. Struct. 2025, 343, 121216. [Google Scholar] [CrossRef] [Scilit]
  5. Zhang, C.; Wang, Y.; Wu, K.; Tian, L.; Song, D. An Assessment of the Safety Effects of Roadside Barriers on Reducing Mountainous Crash Injury Severity. J. Adv. Transp. 2024, 2024, 5568950. [Google Scholar] [CrossRef] [Scilit]
  6. Butāns, Ž.; Gross, K.A.; Gridnevs, A.; Karzubova, E. Road Safety Barriers, the Need and Influence on Road Traffic Accidents. In IOP Conference Series: Materials Science and Engineering, Proceedings of the 2nd International Conference on Innovative Materials, Structures and Technologies, Riga, Latvia, 30 September–2 October 2015; IOP Publishing: Bristol, UK, 2015; Volume 96. [Google Scholar] [CrossRef] [Scilit]
  7. Rezapour, M.; Molan, A.M.; Ksaibati, K. Application of Multinomial Regression Model to Identify Parameters Impacting Traffic Barrier Crash Severity. Open Transp. J. 2019, 13, 57–64. [Google Scholar] [CrossRef] [Scilit]
  8. Ferko, M.; Babić, D.; Babić, D.; Pirdavani, A.; Ševrović, M.; Jakovljević, M.; Luburić, G. Influence of Road Safety Barriers on the Severity of Motorcyclist Injuries in Horizontal Curves. Sustainability 2022, 14, 14790. [Google Scholar] [CrossRef] [Scilit]
  9. Russo, B.J.; Savolainen, P.T. A comparison of freeway median crash frequency, severity, and barrier strike outcomes by median barrier type. Accid. Anal. Prev. 2018, 117, 216–224. [Google Scholar] [CrossRef] [Scilit] [PubMed]
  10. Lantieri, C.; Lamperti, R.; Simone, A.; Costa, M.; Vignali, V.; Sangiorgi, C.; Dondi, G. Gateway design assessment in the transition from high to low speed areas. Transp. Res. Part F Traffic Psychol. Behav. 2015, 34, 143–153. [Google Scholar] [CrossRef] [Scilit]
  11. Sołowczuk, A.B.; Kacprzak, D. Identification of the Determinants of the Effectiveness of On-Road Chicanes in the Village Transition Zones Subject to a 50 km/h Speed Limit. Energies 2021, 14, 4002. [Google Scholar] [CrossRef] [Scilit]
  12. Cantisani, G.; Corazza, M.V.; Di Mascio, P.; Moretti, L. Eight Traffic Calming “Easy Pieces” to Shape the Everyday Pedestrian Realm. Sustainability 2023, 15, 7880. [Google Scholar] [CrossRef] [Scilit]
  13. Tumminello, M.L.; Macioszek, E.; Granà, A.; Giuffrè, T. Evaluating Traffic-Calming-Based Urban Road Design Solutions Featuring Cooperative Driving Technologies in Energy Efficiency Transition for Smart Cities. Energies 2023, 16, 7325. [Google Scholar] [CrossRef] [Scilit]
  14. Jassal, K.; Sharma, U. A Cognitive Review of Urban Traffic Calming Measures. Acta Sci. Technol. 2025, 48, e70944. [Google Scholar] [CrossRef] [Scilit]
  15. Rossi, M. A new reliable and easily applicable approach to establish a road crash barriers maintenance priority. Transp. Res. Procedia 2025, 91, 608–615. [Google Scholar] [CrossRef] [Scilit]
  16. Bassan, S. Sight distance restriction on highways’ horizontal curves: Insights and sensitivity analysis. Eur. Transp. Res. Rev. 2016, 8, 21. [Google Scholar] [CrossRef] [Scilit]
  17. Arndt, O.K.; Cox, R.L.; Lennie, S.C.; Whitehead, M.T. Provision of sight distance around concrete barriers and structures on freeways and interchanges. Transp. Res. Rec. J. Transp. Res. Board 2011, 2262, 22–30. [Google Scholar] [CrossRef] [Scilit]
  18. Psarianos, B.; Mavromatis, S.; Mertzanis, F.; Vardaki, S. Three-dimensional stopping sight distance control on left-turn curves of freeways overlapped with crest vertical curves. In Proceedings of the 5th International Symposium on Highway Geometric Design, Vancouver, BC, Canada, 22–24 June 2015. [Google Scholar]
  19. Sarhan, M.; Hassan, Y. Consideration of Sight Distance in Placement of Concrete Barriers on Horizontal Curves of Roads. Transp. Res. Rec. J. Transp. Res. Board 2012, 2301, 9–16. [Google Scholar] [CrossRef] [Scilit]
  20. Roussiamanis, N.; Kaltsounis, A.; Vardaki, S.; Kanellaidis, G. A review of stopping sight distance in road design guidelines. In Proceedings of the Institution of Civil Engineers-Transport; Thomas Telford Ltd.: London, UK, 2013; Volume 166, pp. 305–312. [Google Scholar] [CrossRef] [Scilit]
  21. Gargoum, S.A.; Tawfeek, M.H.; El-Basyouny, K.; Koch, J.C. Available sight distance on existing highways: Meeting stopping sight distance requirements of an aging population. Accid. Anal. Prev. 2018, 112, 56–68. [Google Scholar] [CrossRef] [Scilit] [PubMed]
  22. AASHTO (American Association of State Highway and Transportation Officials). A Policy of Geometric Design of Highways and Streets, 6th ed.; AASHTO: Washington, DC, USA, 2011; pp. 3-1–3-14. [Google Scholar]
  23. PIARC. Models for Sight Distance in Road Design—A Worldwide Comparison of Standards (Technical Report No. 2023R37EN). World Road Association (PIARC), Task Force 4.1 “Road Design Standards”. 2023. Available online: https://www.piarc.org/en/order-library/43532-en-Models%20for%20Sight%20Distance%20in%20Road%20Design%20-%20A%20Worldwide%20Comparison%20of%20Standards%20-%20A%20PIARC%20Technical%20Report (accessed on 4 June 2026).
  24. Forschungsgesellschaft Straße-Schiene-Verkehr (FSV). RVS 03.03.23: Linienführung und Trassierung; FSV: Vienna, Austria, 2025. [Google Scholar]
  25. Ministry of Maritime Affairs, Transport and Communications. Pravilnik o Osnovnim Uvjetima Kojima Javne Ceste Izvan Naselja Moraju Udovoljiti sa Stajališta Sigurnosti Prometa (Regulations on Basic Conditions to Be Met by Public Roads Outside Settlements from the Standpoint of Traffic Safety); Narodne Novine; Ministry of Maritime Affairs, Transport and Communications: Zagreb, Croatia, 2001; Volume 110, p. 1829. Available online: https://narodne-novine.nn.hr/clanci/sluzbeni/2001_12_110_1829.html (accessed on 4 June 2026).
  26. Forschungsgesellschaft für Straßen und Verkehrswesen (FGSV). Richtlinien für die Anlage von Autobahnen (RAA); Forschungsgesellschaft für Straßen und Verkehrswesen (FGSV): Köln, Germany, 2008. [Google Scholar]
  27. Forschungsgesellschaft für Straßen und Verkehrswesen (FGSV). Richtlinien für die Anlage von Landstraßen (RAL); Forschungsgesellschaft für Straßen und Verkehrswesen (FGSV): Köln, Germany, 2012. [Google Scholar]
  28. Ministrstvo za Promet. Uradni list Republike Slovenije. Pravilnik o Projektiranju cest; Ministrstvo za Promet: Ljubljana, Slovenia, 2005; Volume 91, pp. 9303–9319. Available online: https://pisrs.si/pregledPredpisa?id=PRAV5811 (accessed on 19 May 2026).
  29. AASHTO (American Association of State Highway and Transportation Officials). A Policy of Geometric Design of Highways and Streets, 7th ed.; AASHTO: Washington, DC, USA, 2018; pp. 3-2–3-6, 3-15, 3-114–3-117. [Google Scholar]
  30. Ministero delle Infrastrutture e dei Trasporti. Decreto Ministeriale 5 Novembre 2001. Norme Funzionali e Geometriche per la Costruzione Delle Strade. Gazzetta Ufficiale Della Repubblica Italiana 2001, No. 3. 4 January 2002. Available online: https://www.mit.gov.it/normativa/decreto-ministeriale-protocollo-6792-del-05112001 (accessed on 21 May 2026).
  31. Llewellyn, R.; Sarkar, P.; Taylor, M.D. Naturalistic measurement of driver eye height and object height using photogrammetry. In Proceedings of the Institution of Civil Engineers-Transport; Thomas Telford Ltd.: London, UK, 2021; Volume 174, pp. 430–440. [Google Scholar] [CrossRef] [Scilit]
  32. Capaldo, F.S. Driver eye height: Experimental determination and implications on sight distances. Procedi-Soc. Behav. Sci. 2012, 43, 375–383. [Google Scholar] [CrossRef] [Scilit]
  33. Mavromatis, S.; Palaskas, S.; Psarianos, B. Continuous three-dimensional Stopping Sight Distance control on crest vertical curves. Adv. Transp. Stud. 2012, 17–30. [Google Scholar] [CrossRef]
  34. De Santos-Berbel, C.; Essa, M.; Sayed, T.; Castro, M. Reliability-Based Analysis of Sight Distance Modelling for Traffic Safety. J. Adv. Transp. 2017, 2017, 5612849. [Google Scholar] [CrossRef] [Scilit]
  35. De Santos-Berbel, C.; González-Gómez, K.; Castro, M.; Anta, J.A. Addressing sight-distance-related safety effects of installing median barriers at horizontal curves of undivided highways under a 3D approach. In Road and Rail Infrastructure V, Proceedings of the Conference CETRA 2018, Zadar, Croatia, 17–19 May 2018; Faculty of Civil Engineering, University of Zagreb: Zagreb, Croatia, 2018; pp. 1067–1073. [Google Scholar] [CrossRef] [Scilit]
  36. Stančerić, I.; Bezina, Š.; Stepan, Ž.; Džambas, T. Evaluation of available sight distance estimation method on rural roads according to Croatian regulation. In Road and Rail Infrastructure VIII, Proceedings of the Conference CETRA 2024, Cavtat, Croatia, 17–19 May 2024; Faculty of Civil Engineering, University of Zagreb: Zagreb, Croatia, 2024; pp. 153–160. [Google Scholar] [CrossRef] [Scilit]
  37. Papadimitriou, E.; Mavromatis, S.; Psarianos, B. Stopping sight distance adequacy assessment on freeways: The case of left horizontal curves over crest vertical curves. Transp. Lett. 2018, 10, 269–279. [Google Scholar] [CrossRef] [Scilit]
  38. Lioi, A.; De Santos-Berbel, C.; Bassani, M.; Castro, M. 3D Modeling of Highway Guardrails for Sight Distance Assessment. J. Transp. Eng. Part A Syst. 2021, 147, 04021078. [Google Scholar] [CrossRef] [Scilit]
  39. Chen, Y.; Chen, Y. Reliability Evaluation of Sight Distance on Mountainous Expressway Using 3D Mobile Mapping. In Proceedings of the 5th International Conference on Transportation Information and Safety (ICTIS); IEEE: New York, NY, USA, 2019; pp. 1–7. [Google Scholar] [CrossRef] [Scilit]
  40. Franković, L.; Kučina, I.; Fiolić, M.; Babić, D.; Babić, D. Detection of road markings and road signs by advanced driver assistance systems—A literature review. In Road and Rail Infrastructure VIII, Proceedings of the Conference CETRA 2024, Cavtat, Croatia, 15–17 May 2024; Faculty of Civil Engineering, University of Zagreb: Zagreb, Croatia, 2024; pp. 255–262. [Google Scholar] [CrossRef] [Scilit]
  41. Neumann, T. Analysis of Advanced Driver-Assistance Systems for Safe and Comfortable Driving of Motor Vehicles. Sensors 2024, 24, 6223. [Google Scholar] [CrossRef] [Scilit] [PubMed]
  42. Čudina Ivančev, A.; Džambas, T.; Dragčević, V. The Impact of Autonomous Vehicles on the Transportation Network with a Focus on the Physical Road Infrastructure. Infrastructures 2025, 10, 347. [Google Scholar] [CrossRef] [Scilit]
  43. Wang, S.; Ma, Y.; Easa, S.M.; Zhou, H.; Lai, Y.; Chen, W. Sight Distance of Automated Vehicles Considering Highway Vertical Alignments and Its Implications for Speed Limits. IEEE Intell. Transp. Syst. Mag. 2024, 16, 45–61. [Google Scholar] [CrossRef] [Scilit]
  44. De Pauw, E.; Daniels, S.; Franckx, L.; Mayeres, I. Safety effects of dynamic speed limits on motorways. Accid. Anal. Prev. 2017, 114, 83–89. [Google Scholar] [CrossRef] [Scilit] [PubMed]
  45. Oskarbski, J.; Kamiński, T.; Kyamakya, K.; Chedjou, J.C.; Żarski, K.; Pędzierska, M. Assessment of the Speed Management Impact on Road Traffic Safety on the Sections of Motorways and Expressways Using Simulation Methods. Sensors 2020, 20, 5057. [Google Scholar] [CrossRef] [Scilit] [PubMed]
  46. Bentley Systems. OpenRoads Designer, Version 2025; Bentley Systems: Exton, PA, USA, 2025; Available online: https://www.bentley.com/software/openroads-designer (accessed on 18 May 2026).
  47. Ministry of the Sea, Transport and Infrastructure. Pravilnik o Prometnim Znakovima, Signalizaciji i Opremi na Cestama (Regulations on Traffic Signs, Signaling and Equipment on Roads); Narodne Novine; Ministry of the Sea, Transport and Infrastructure: Zagreb, Croatia, 2019; Volume 92, p. 1823. Available online: https://narodne-novine.nn.hr/clanci/sluzbeni/2019_09_92_1823.html (accessed on 4 June 2026).
  48. HRN EN 1317-5:2012; Road Restraint Systems—Part 5: Product Requirements and Evaluation of Conformity for Vehicle Restraint Systems (EN 1317-5:2007+A2:2012). Comite Europeen de Normalisation (CEN): Brussels, Belgium, 2012. Available online: https://repozitorij.hzn.hr/norm/HRN+EN+1317-5%3A2009 (accessed on 21 May 2026).
  49. Lovell, D.J. Automated Calculation of Sight Distance from Horizontal Geometry. J. Transp. Eng. 1999, 125, 297–304. [Google Scholar] [CrossRef] [Scilit]
  50. Lovell, D.J.; Jong, J.C.; Chang, P.C. Improvements to Sight Distance Algorithm. J. Transp. Eng. 2001, 127, 283–288. [Google Scholar] [CrossRef] [Scilit]
  51. Ministry of the Sea, Transport and Infrastructure. Odluka o Razvrstavanju Javnih Cesta (Decision on the Classification of Public Roads); Narodne Novine; Ministry of the Sea, Transport and Infrastructure: Zagreb, Croatia, 2025; Volume 109, p. 1561. Available online: https://narodne-novine.nn.hr/clanci/sluzbeni/full/2025_08_109_1561.html (accessed on 2 June 2026).
  52. Ministry of the Interior of the Republic of Croatia. Access to Information. Available online: https://mup.gov.hr/ministry-of-the-interior/access-to-information-127/127 (accessed on 2 July 2026).
  53. Ministry of the Interior of the Republic of Croatia. Bilten o Sigurnosti Cestovnog Prometa 2023 (Road Traffic Safety Bulletin 2023), 49th ed.; Ministry of the Interior: Zagreb, Croatia, 2024. Available online: https://mup.gov.hr/UserDocsImages/statistika/2024/6/Bilten_o_sigurnosti_cestovnog_prometa_2023.pdf (accessed on 2 June 2026).
  54. Ministry of the Interior of the Republic of Croatia. Bilten o Sigurnosti Cestovnog Prometa 2024 (Road Traffic Safety Bulletin 2024), 50th ed.; Ministry of the Interior: Zagreb, Croatia, 2025. Available online: https://mup.gov.hr/UserDocsImages/statistika/2025/6/Bilten_o_sigurnosti_cestovnog_prometa_2024.pdf (accessed on 2 June 2026).
  55. Ministry of the Interior of the Republic of Croatia. Bilten o Sigurnosti Cestovnog Prometa 2025 (Road Traffic Safety Bulletin 2024), 51st ed.; Ministry of the Interior: Zagreb, Croatia, 2026. Available online: https://mup.gov.hr/UserDocsImages/dokumenti/bilteni/Bilten_o_sigurnosti_cestovnog_prometa_2025.pdf (accessed on 12 June 2026).
  56. Croatian Roads. Traffic Counting on the Roadways of Croatia in 2024, Zagreb, 2025. Available online: https://hrvatske-ceste.hr/uploads/documents/attachment_file/file/1827/Brojenje_prometa_na_cestama_Republike_Hrvatske_godine_2024.pdf (accessed on 15 June 2026).
  57. State Geodetic Administration. Available online: https://dgu.gov.hr (accessed on 14 June 2026).
  58. De Santos-Berbel, C.; Zimmermann, M. Safety Implications of Three-Dimensional Alignment Coordination in Highway Design: Sight Distance, Visual Perception, Design Methodologies, and Future Challenges. J. Transp. Eng. Part A Syst. 2025, 151, 04025049. [Google Scholar] [CrossRef] [Scilit]
  59. United Nations Economic Commission for Europe (UNECE). TEM Standards and Recommended Practice, 3rd ed.; TEM Project Central Office: Warsaw, Poland, 2002. [Google Scholar]
Figure 1. Key steps in the research methodology.
Infrastructures 11 00316 g001
Figure 2. Standard cross-sectional elements of a motorway.
Infrastructures 11 00316 g002
Figure 3. Sight visibility analysis on a road in the horizontal and vertical directions.
Infrastructures 11 00316 g003
Figure 4. Examples of steel and concrete road safety barriers on the A1 motorway (Croatia): (a) steel barriers on a right-hand curve; (b) concrete barriers on a left-hand curve.
Infrastructures 11 00316 g004
Figure 5. Analysis of available sight distance on right-hand horizontal curves of a motorway in both the horizontal and vertical planes.
Infrastructures 11 00316 g005
Figure 6. Analysis of available sight distance on left-hand horizontal curves of a motorway in both the horizontal and vertical planes.
Infrastructures 11 00316 g006
Figure 7. Overview of the Croatian motorway network, illustrating the six test sections selected on the Zagreb–Split–Dubrovnik section of the A1 motorway for ASD analysis.
Infrastructures 11 00316 g007
Figure 8. 3D motorway section modelling workflow in ORD: (a) LiDAR point cloud; (b) triangulated surface mesh; (c) 3D model with sightlines on a triangulated surface; (d) LiDAR point cloud with sightlines.
Infrastructures 11 00316 g008
Figure 9. Results from the ASD analysis for right-hand curves using 2D motorway models (coloured continuous lines represent bd at 0.5 m, and coloured dashed lines represent bd at 0.75 m): (a) Rmin,bar for a design speed of 80 km/h; (b) ASDbar for an operating speed of 80 km/h; (c) Rmin,bar for a design speed of 130 km/h; (d) ASDbar for an operating speed of 130 km/h.
Infrastructures 11 00316 g009
Figure 10. Results from the ASD analysis for left-hand curves using 2D motorway models (coloured continuous lines represent bd at 0.5 m, and coloured dashed lines represent bd at 0.75 m): (a) Rmin,bar for a design speed of 80 km/h; (b) ASDbar for an operating speed of 80 km/h; (c) Rmin,bar for a design speed of 130 km/h; (d) ASDbar for an operating speed of 130 km/h.
Infrastructures 11 00316 g010
Figure 11. Results from the 3D ASD analysis in the ZG–ST–DU direction for Section 2.
Infrastructures 11 00316 g011
Figure 12. Results from the 3D ASD analysis in the DU–ST–ZG direction for Section 2 from station 0+320 m to 3+500 m.
Infrastructures 11 00316 g012
Figure 13. Results from the 3D ASD analysis in the ZG–ST–DU direction for Section 3 from station 0+000 m to 5+000 m.
Infrastructures 11 00316 g013
Figure 14. Results from the 3D ASD analysis in the ZG–ST–DU direction for motorway Section 3 from station 5+000 m to 9+600 m.
Infrastructures 11 00316 g014
Figure 15. Results from the 3D ASD analysis in the DU–ST–ZG direction for Section 3 from station 0+300 m to 5+000 m.
Infrastructures 11 00316 g015
Figure 16. Results from the 3D ASD analysis in the direction ZG–ST–DU direction for Section 4.
Infrastructures 11 00316 g016
Figure 17. Results from the 3D ASD analysis in the DU–ST–ZG direction for Section 4 from station 0+330 m to 5+600 m.
Infrastructures 11 00316 g017
Figure 18. Results from the 3D ASD analysis in the ZG–ST–DU direction for Section 6.
Infrastructures 11 00316 g018
Figure 19. Results from the 3D ASD analysis in the DU–ST–ZG direction for Section 6, from station 0+330 m to 5+350 m.
Infrastructures 11 00316 g019
Table 1. Geometric design elements of motorway horizontal alignment.
VdRminLminsmax (%)
80250606
90350655.5
100450755
120750954
1308501154
Table 2. Cross-sectional design elements of motorways and their corresponding dimensions.
Vd (km/h)sw (m)elw (m)rsw (m)lw (m)lsw (m)mw (m)
801.52.50.23.250.33.0
901.52.50.23.50.53.0
1001.52.50.23.50.54.0
≥1201.52.50.23.750.54.0
Table 3. ASD deficiency length (m) depending on type and position of obstacle.
DirectionsZG–ST–DUDU–ST–ZG
Deficient ASD Segment Length (m)Deficient ASD Segment Length (m)
SectionRoadside bar.Median bar.Cut slopeRoadside bar.Median bar.Cut slope
1------
2375560350965680-
310951065545460970240
4198546585900705130
5------
6895174014052610825215
Total43503830238549353180585
Disclaimer/Publisher’s Note: The statements, opinions and data contained in all publications are solely those of the individual author(s) and contributor(s) and not of MDPI and/or the editor(s). MDPI and/or the editor(s) disclaim responsibility for any injury to people or property resulting from any ideas, methods, instructions or products referred to in the content.