Article

Safety Effects of an Improved Highway Tunnel Lighting Environment: A Real-Vehicle Study of Drivers’ Visual and Physiological Responses


1
Nanping Wusha Expressway Co., Ltd., Nanping 354200, China
2
Fujian Expressway Science & Technology Innovation Research Institute Co., Ltd., Fuzhou 350001, China
3
College of Civil Engineering, Fuzhou University, Fuzhou 350108, China
*
Author to whom correspondence should be addressed.
Infrastructures 2026, 11(9), 309; https://doi.org/10.3390/infrastructures11090309
Submission received: 2 July 2026 / Revised: 19 August 2026 / Accepted: 21 August 2026 / Published: 1 September 2026
(This article belongs to the Special Issue Advances in Road Infrastructure Safety)

Abstract

Abrupt changes in the lighting environment at highway tunnel entrances, transition zones, and exits can impose substantial visual adaptation demands on drivers. This real-vehicle study evaluated a modified LED tunnel lighting environment designed to enlarge the effective luminous area, improve road surface lighting uniformity, and reduce direct glare, compared with the original lighting system. The field experiment was conducted using 24 licensed drivers in a 610 m highway tunnel. Pupil area, mean fixation duration, and heart rate growth rate (HRG) were recorded in six longitudinal zones under the original and modified lighting conditions. The measured interior zone illuminance uniformity increased from 0.71 to 0.87 after modification. Repeated-measures ANOVA showed significant lighting-by-zone interactions for all three outcomes (p ≤ 0.001). Bonferroni-adjusted comparisons localized significant reductions in pupil area and HRG in the threshold, transition, and interior zones, while fixation duration increased significantly in those zones and in the exit zone. Across the averages for the six zones, pupil area decreased by 8.39%, HRG decreased by 13.78%, and mean fixation duration increased by 6.63%. The findings suggest that the modified lighting environment reduced visual adaptation demand and physiological arousal, especially in the threshold and transition zones. Fixation duration changes are interpreted as altered visual information processing rather than direct evidence of improved safety, and no inference about crash reduction can be made without direct driving performance or safety outcome data.

1. Introduction

Road tunnels are critical components of modern transport infrastructure. With the continued expansion of road networks, both the number and the total length of tunnels have increased rapidly. By the end of 2023, China had 27,297 road tunnels, with a total length of 30,231.8 km [1]. Tunnel crashes can have severe consequences because enclosed geometry, restricted access, smoke accumulation, and difficult rescue conditions may increase the likelihood of secondary events and magnify losses [1,2,3,4,5,6]. These characteristics make the design of a stable and visually legible tunnel environment an important road safety concern.
Drivers obtain most roadway information visually [7]. At tunnel entrances and exits, abrupt changes between exterior and interior lighting can produce “black-hole”, “white-hole”, and dark or light adaptation effects that temporarily impair target detection, lane perception, and visual search [8,9,10,11,12]. Threshold and transition lighting is therefore intended to manage visual adaptation by progressively reducing the difference between exterior and interior luminance. In China, guidance is provided by the Guidelines for Design of Lighting of Highway Tunnels (JTG/T D70/2-01—2014), while CIE and PIARC documents provide corresponding international recommendations on entrance lighting, uniformity, glare, and adaptation [13,14,15,16].
Previous studies have examined tunnel lighting from several perspectives. Wang et al. [17] evaluated the safety implications of lighting service degradation, and developed a tunnel safety coefficient prediction method. Zhao et al. [18] assessed the influence of LED color rendering on dark adaptation. Zhang et al. [19] showed that dimming-induced luminance changes affect reaction time, pupil response, and blink behavior. Other studies have addressed fixation characteristics at tunnel entrances, multiparameter lighting control, obstacle visibility, wall and portal environments, and vehicle headlamps [20,21,22]. Collectively, these studies indicate that tunnel lighting should be evaluated not only through photometric performance but also through driver-centered responses.
Pupil area, fixation duration, and heart rate reflect partly different mechanisms. Pupil area is strongly affected by the pupillary light reflex and cannot, by itself, be treated as a direct measure of cognitive workload or driving safety. Mean fixation duration may indicate sustained information processing, but it may also reflect difficulty in extracting information. Heart rate responses can reflect arousal or task demand, but are influenced by baseline definition, traffic conditions, and other aspects of the driving task [23,24,25,26,27,28,29,30,31]. Conclusions about safety therefore require cautious interpretation and, ideally, converging evidence from direct driving performance measures.
The present study compared an original tunnel lighting environment with a modified LED lighting environment designed to enlarge the effective luminous area, improve roadway illumination uniformity, and reduce direct glare. The objectives were to quantify the photometric difference between the two lighting conditions, compare pupil area, mean fixation duration, and HRG across six tunnel-related zones, and assess the practical implications of the observed physiological changes. The primary expectation was that the largest changes would occur in the threshold and transition zones, where visual adaptation demands are greatest.

2. Materials and Methods

2.1. Study Site and Test Conditions

The field experiment was conducted in a 610 m tunnel on the Nanping Wusha Expressway. The reported design speed was 80 km/h. The field program included daytime testing between 11:00 and 14:00 and nighttime testing between 20:30 and 22:00, both under clear weather. The 24 participants were allocated equally between the two testing periods: 12 participants completed the experiment during daytime, and the remaining 12 participants completed the experiment during nighttime. Each participant was tested in only one time-of-day condition. For analysis, the driving route was divided into six longitudinal zones: access, threshold, transition, interior, exit, and departure.
For analysis, the driving route was divided into six longitudinal zones: access, threshold, transition, interior, exit, and departure. The operational definitions and geometric limits of these zones are provided in Table 1.

2.2. Original and Modified Lighting Conditions

Two lighting conditions were compared. The original condition was the pre-modification tunnel lighting system. The modified condition used a newly designed LED luminaire described in the study records as producing a “cloud-like” light distribution. Its intended design features were a larger effective luminous area, more uniform roadway illumination, and lower direct glare than the original system. The principal luminaire specifications are summarized in Table 2.
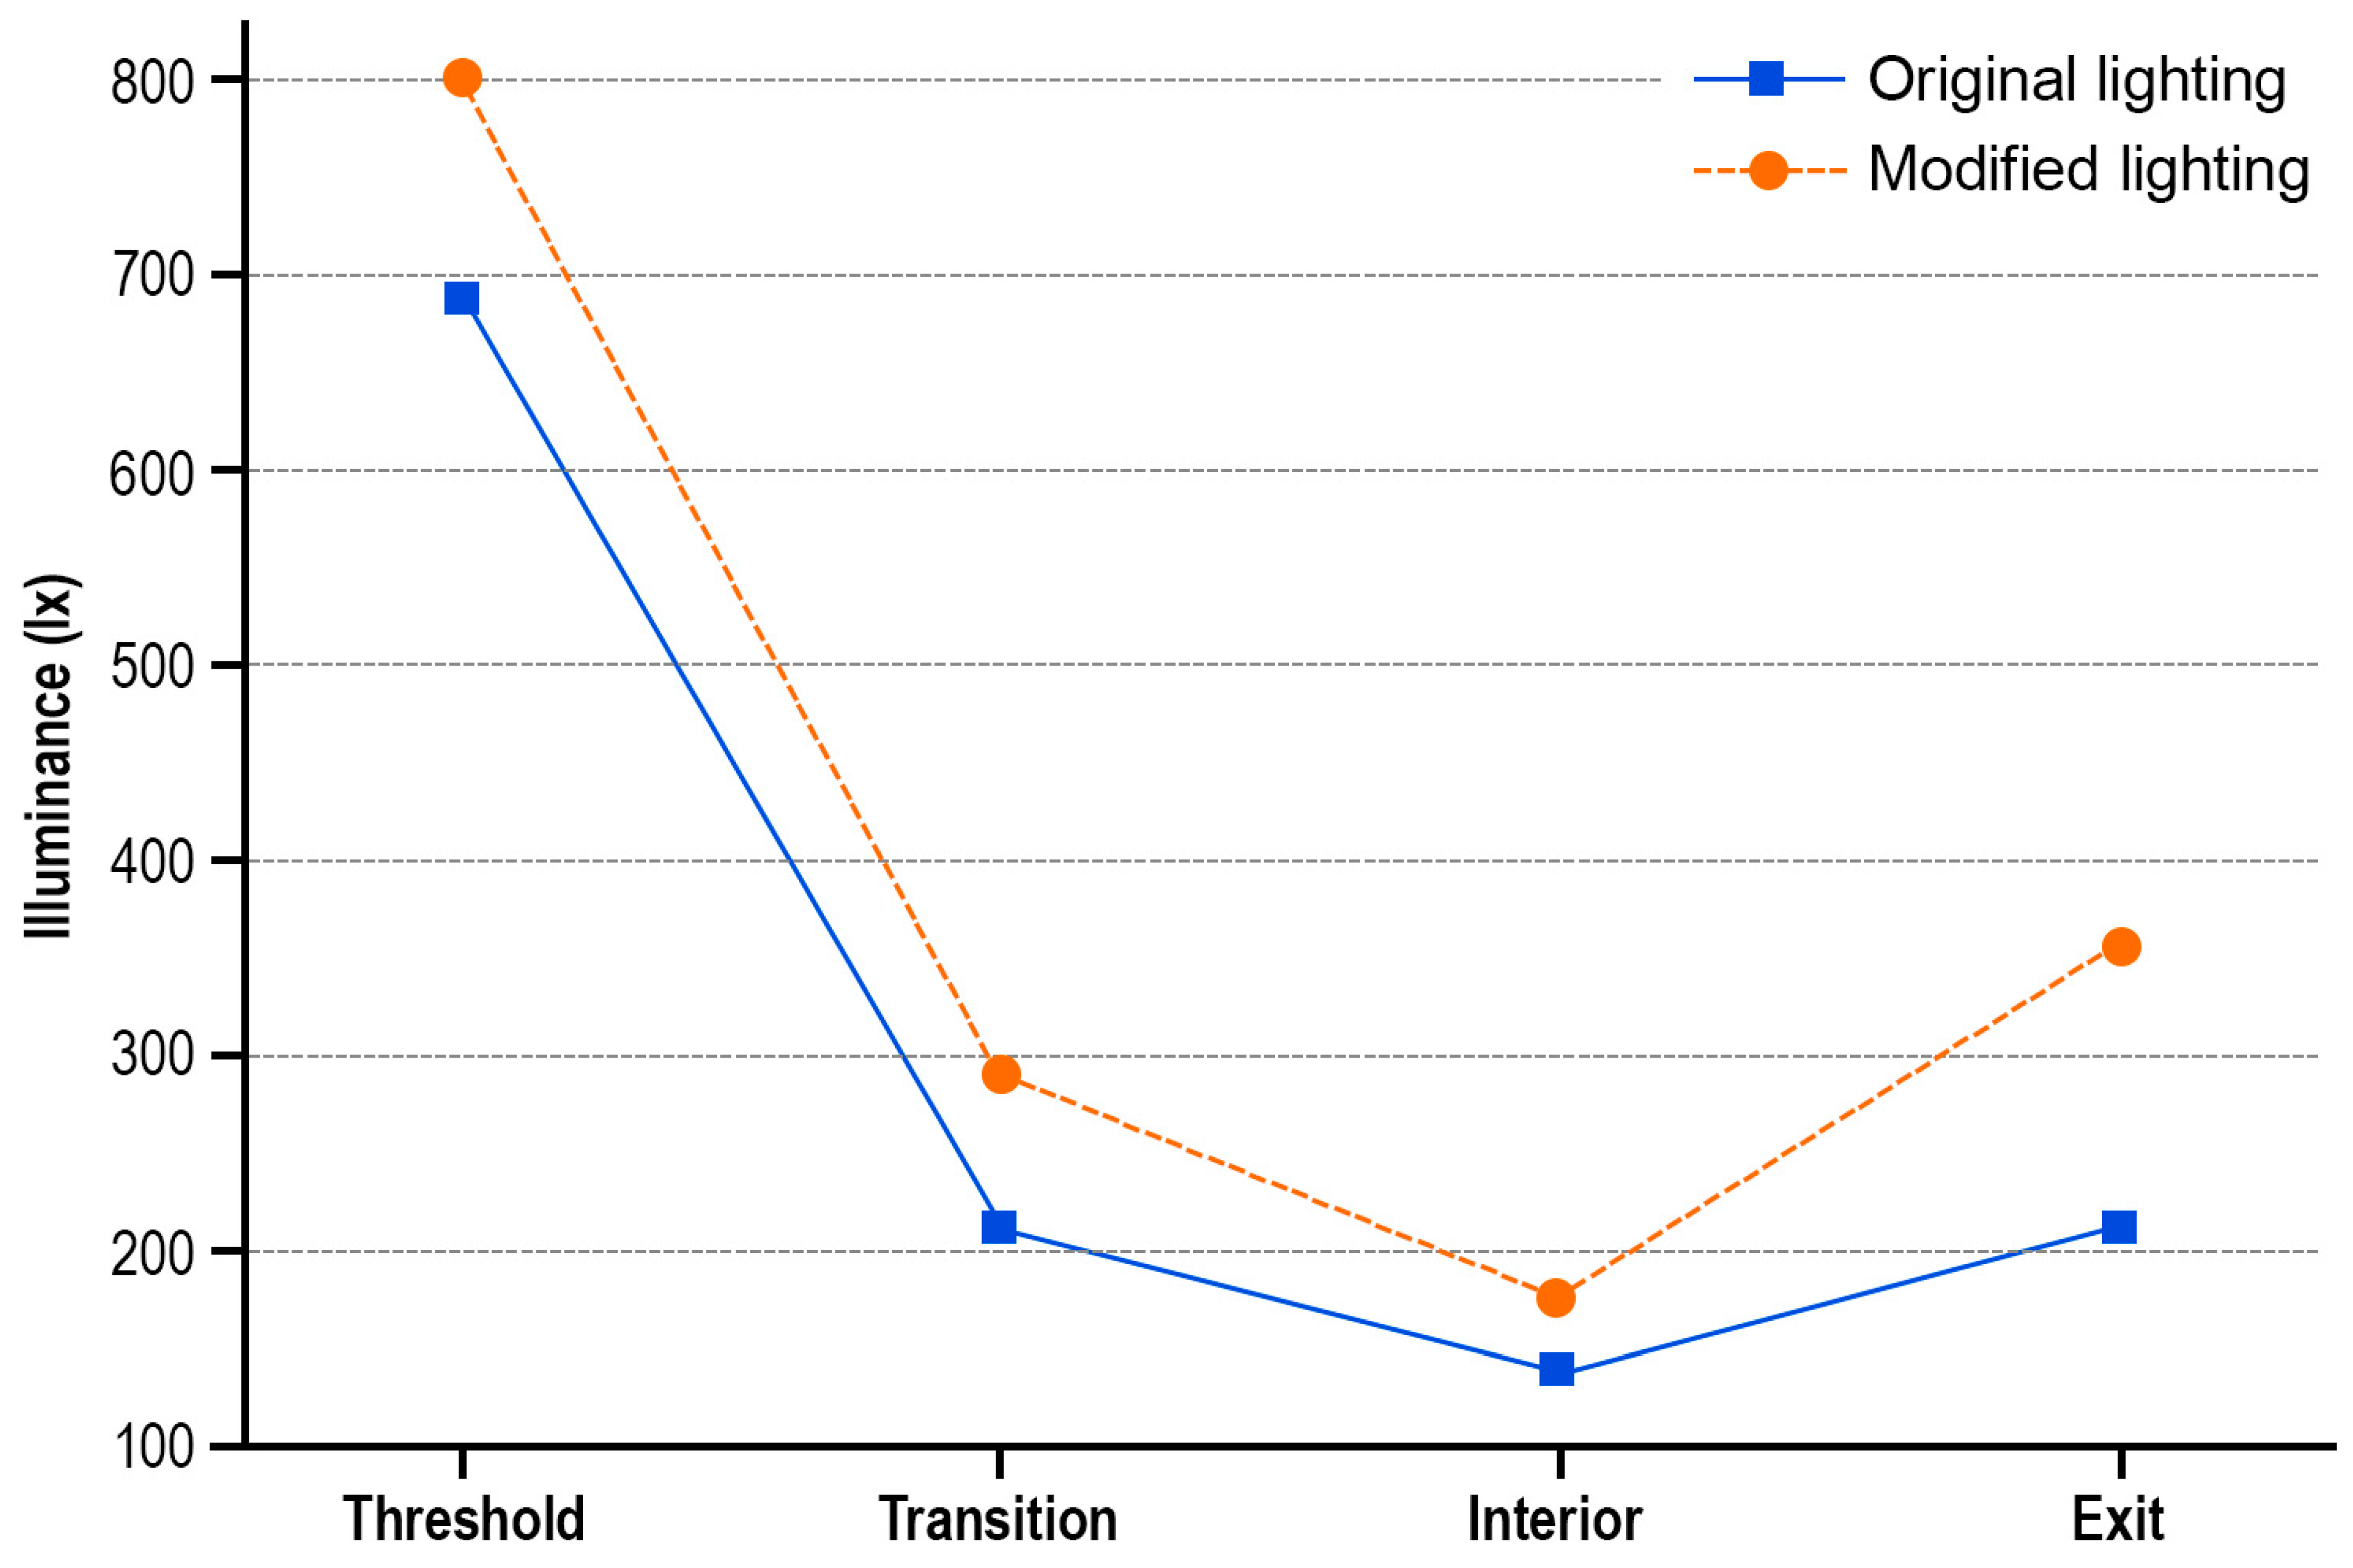
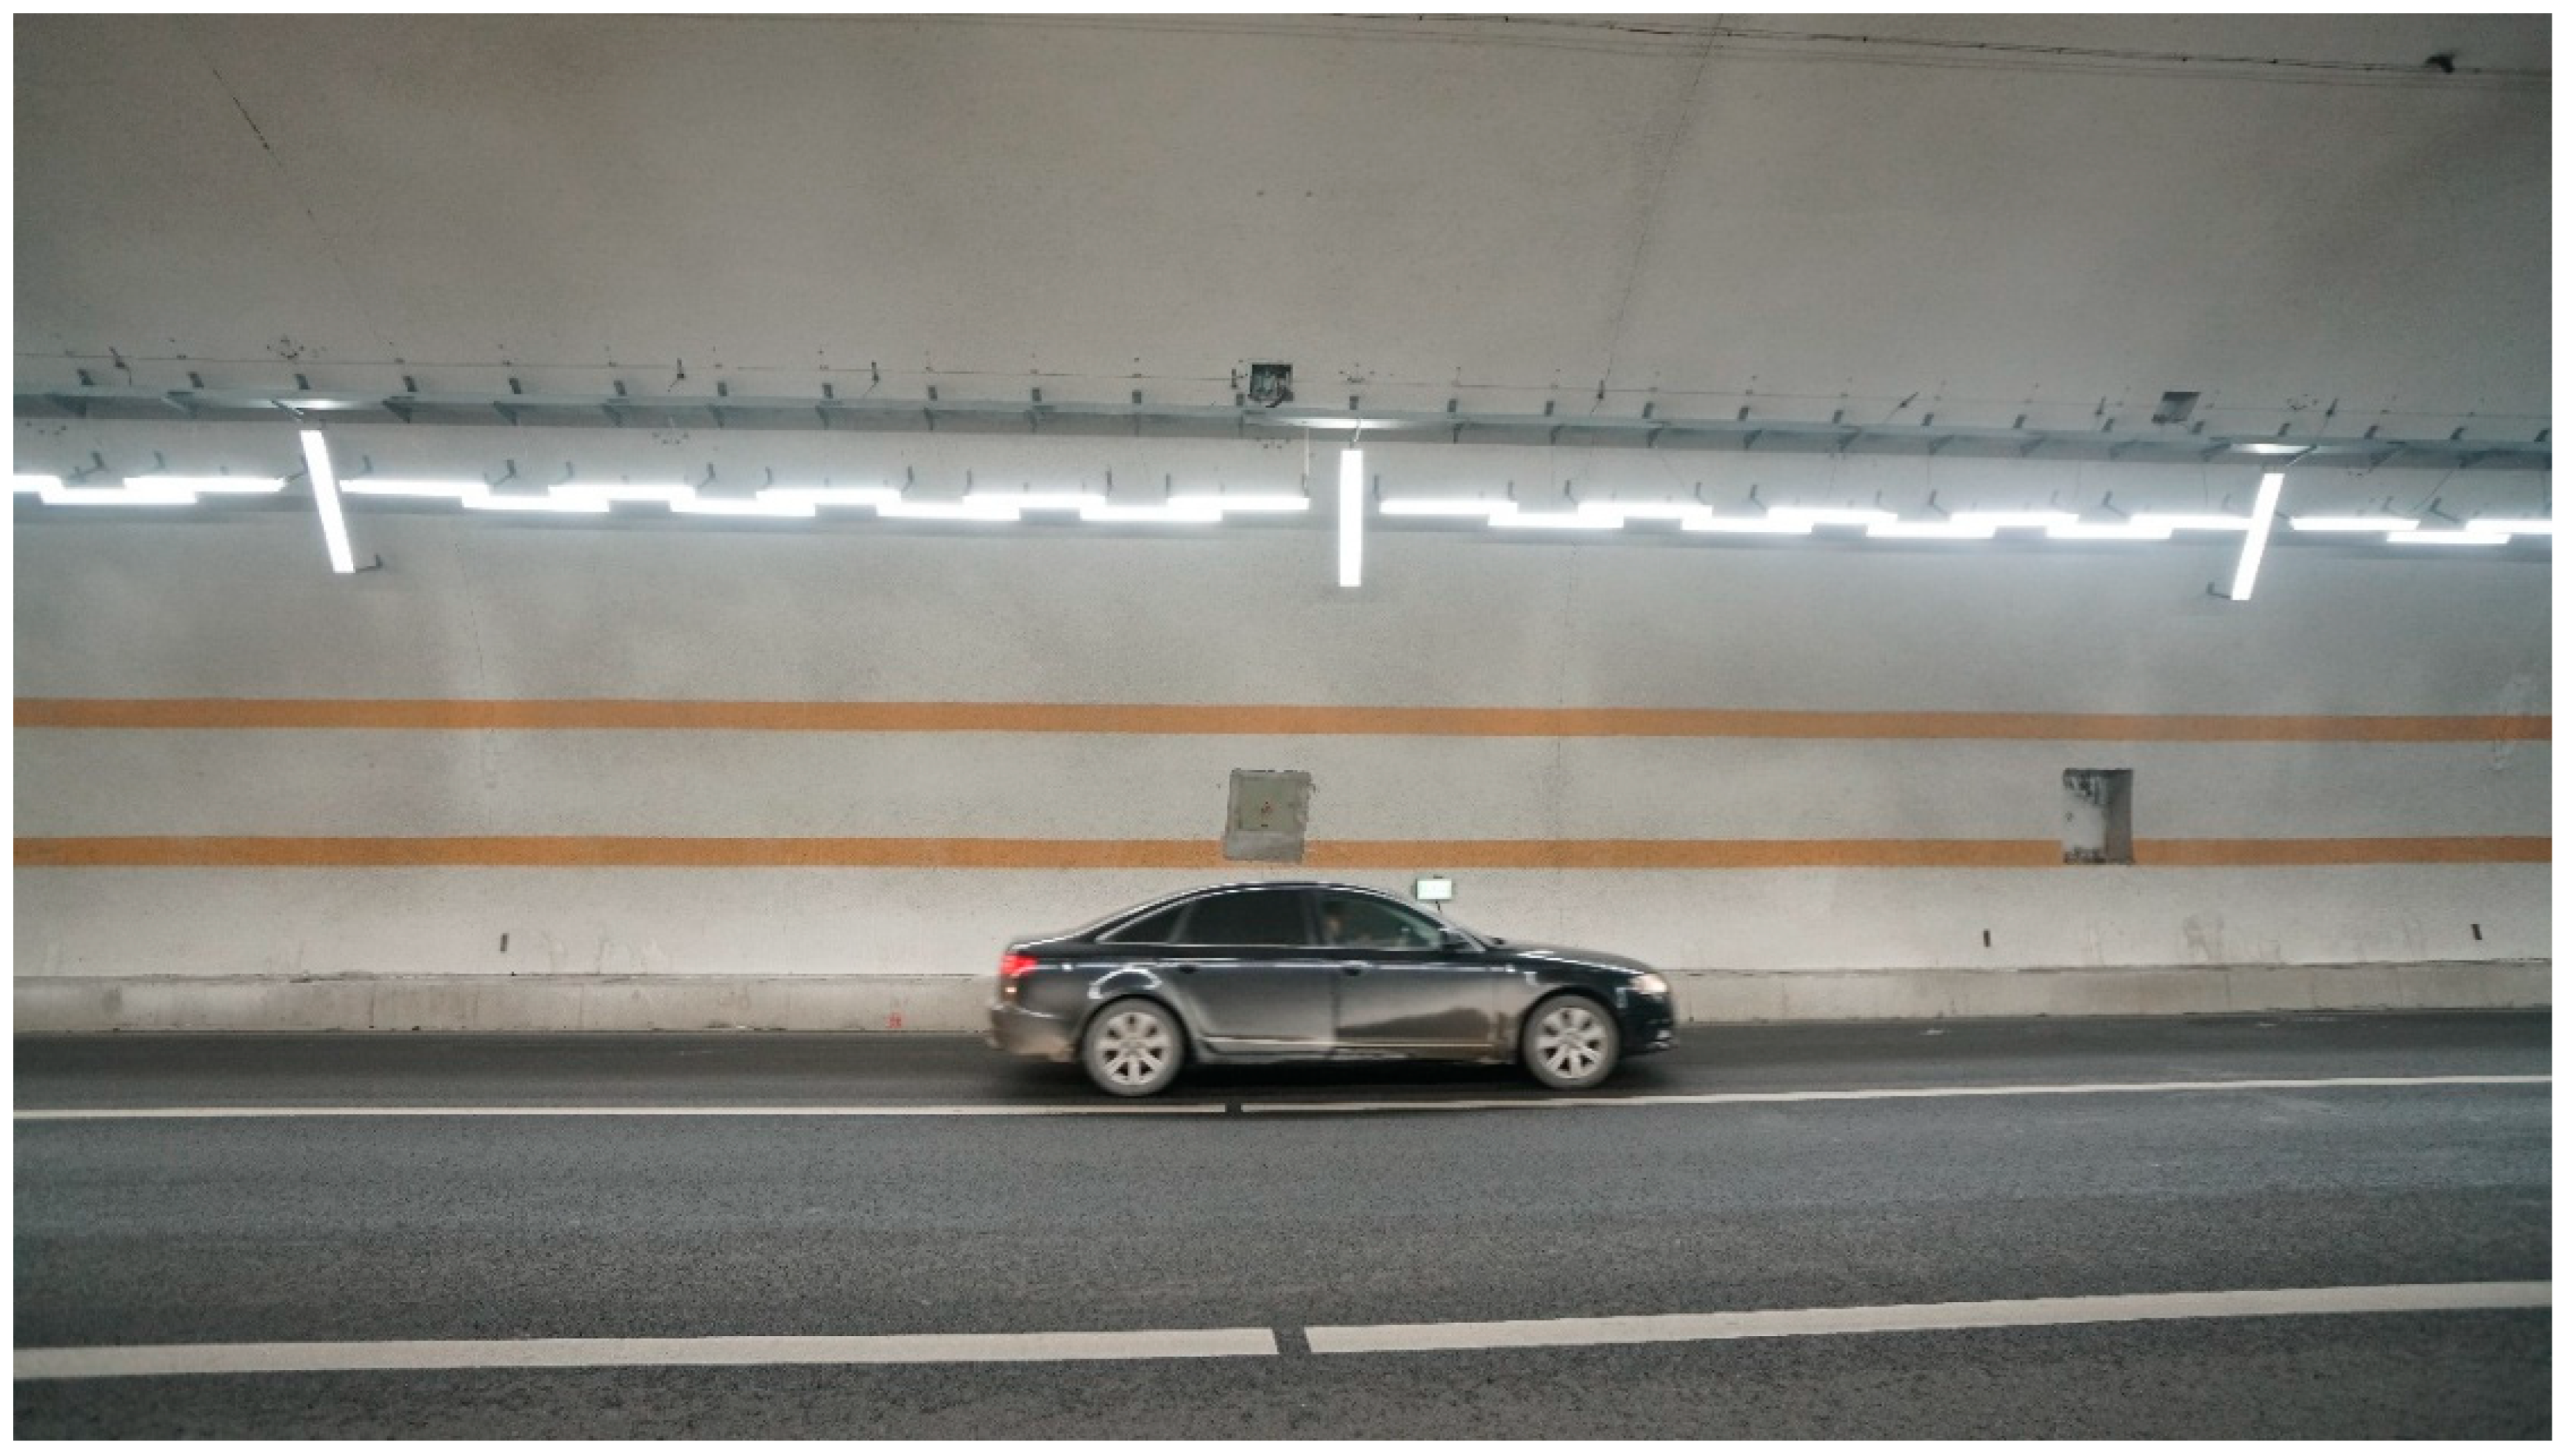
Figure 1 shows the modified tunnel-lighting environment used in the real-vehicle experiment. Roadway illuminance was measured in lux (lx) and used as the photometric variable. Figure 2 shows the reported illuminance distribution in the threshold, transition, interior, and exit zones under the two lighting conditions. Overall illuminance uniformity was calculated as U 0 = E m i n E a v g , where E m i n is the minimum roadway illuminance and E a v g is the mean roadway illuminance within the calculation area. The measured interior zone uniformity increased from 0.71 under the original condition to 0.87 under the modified condition. Because this ratio was derived from illuminance rather than road surface luminance, it should not be interpreted as direct evidence of compliance with luminance-based tunnel lighting criteria [13].

2.3. Participants

Twenty-four licensed adult drivers participated in the real-vehicle experiment. Their ages ranged from 25 to 45 years, and their driving experience ranged from 2 to 10 years. All participants had previous tunnel driving experience, normal or corrected-to-normal visual acuity, and no self-reported color vision deficiency. Participants were instructed not to consume alcohol, coffee, other stimulant beverages, or take any neuroactive medication for 24 h before the experiment. Participants were also instructed to avoid strenuous exercise for 2 h before testing, and to obtain sufficient sleep. Participant characteristics are summarized in Table 3.

2.4. Apparatus and Experimental Procedure

A D-Lab driver behavior research and analysis system (Ergoneers GmbH, Geretsried, Germany) was used to synchronize eye-movement, physiological, and external data streams. Eye movements were recorded using Dikablis Glasses (Ergoneers GmbH, Geretsried, Germany) and processed in D-Lab software, version 3.55 (Ergoneers GmbH, Geretsried, Germany); physiological signals were collected using a D-Lab Physio system (Ergoneers GmbH, Geretsried, Germany). The Dikablis system wasproduced by Ergoneers GmbH, Geretsried, Germany [32]. The D-Lab recordings were replayed, segmented, and exported to Microsoft Excel 2021 (Microsoft Corporation, Redmond, WA, USA) for data organization.
Before testing, the research team checked the vehicle, calibrated the instruments, verified battery and computer power, prepared emergency equipment, and explained the route and safety requirements. Other occupants in the vehicle remained quiet during driving except when intervention was required for safety. Participants selected their driving speed and their vehicle control actions according to their usual habits, subject to the posted speed limit and prevailing traffic conditions. Adequate rest was provided between consecutive runs.

2.5. Outcome Measures and Data Processing

2.5.1. Pupil Area

Pupil area was used as an indicator of ocular adaptation to the lighting environment. Under brighter illumination the pupil generally constricts, whereas under darker illumination it dilates. Because this response is dominated by the pupillary light reflex, pupil area was not interpreted as an independent measure of cognitive load or safety.

2.5.2. Definition of Mean Fixation Duration

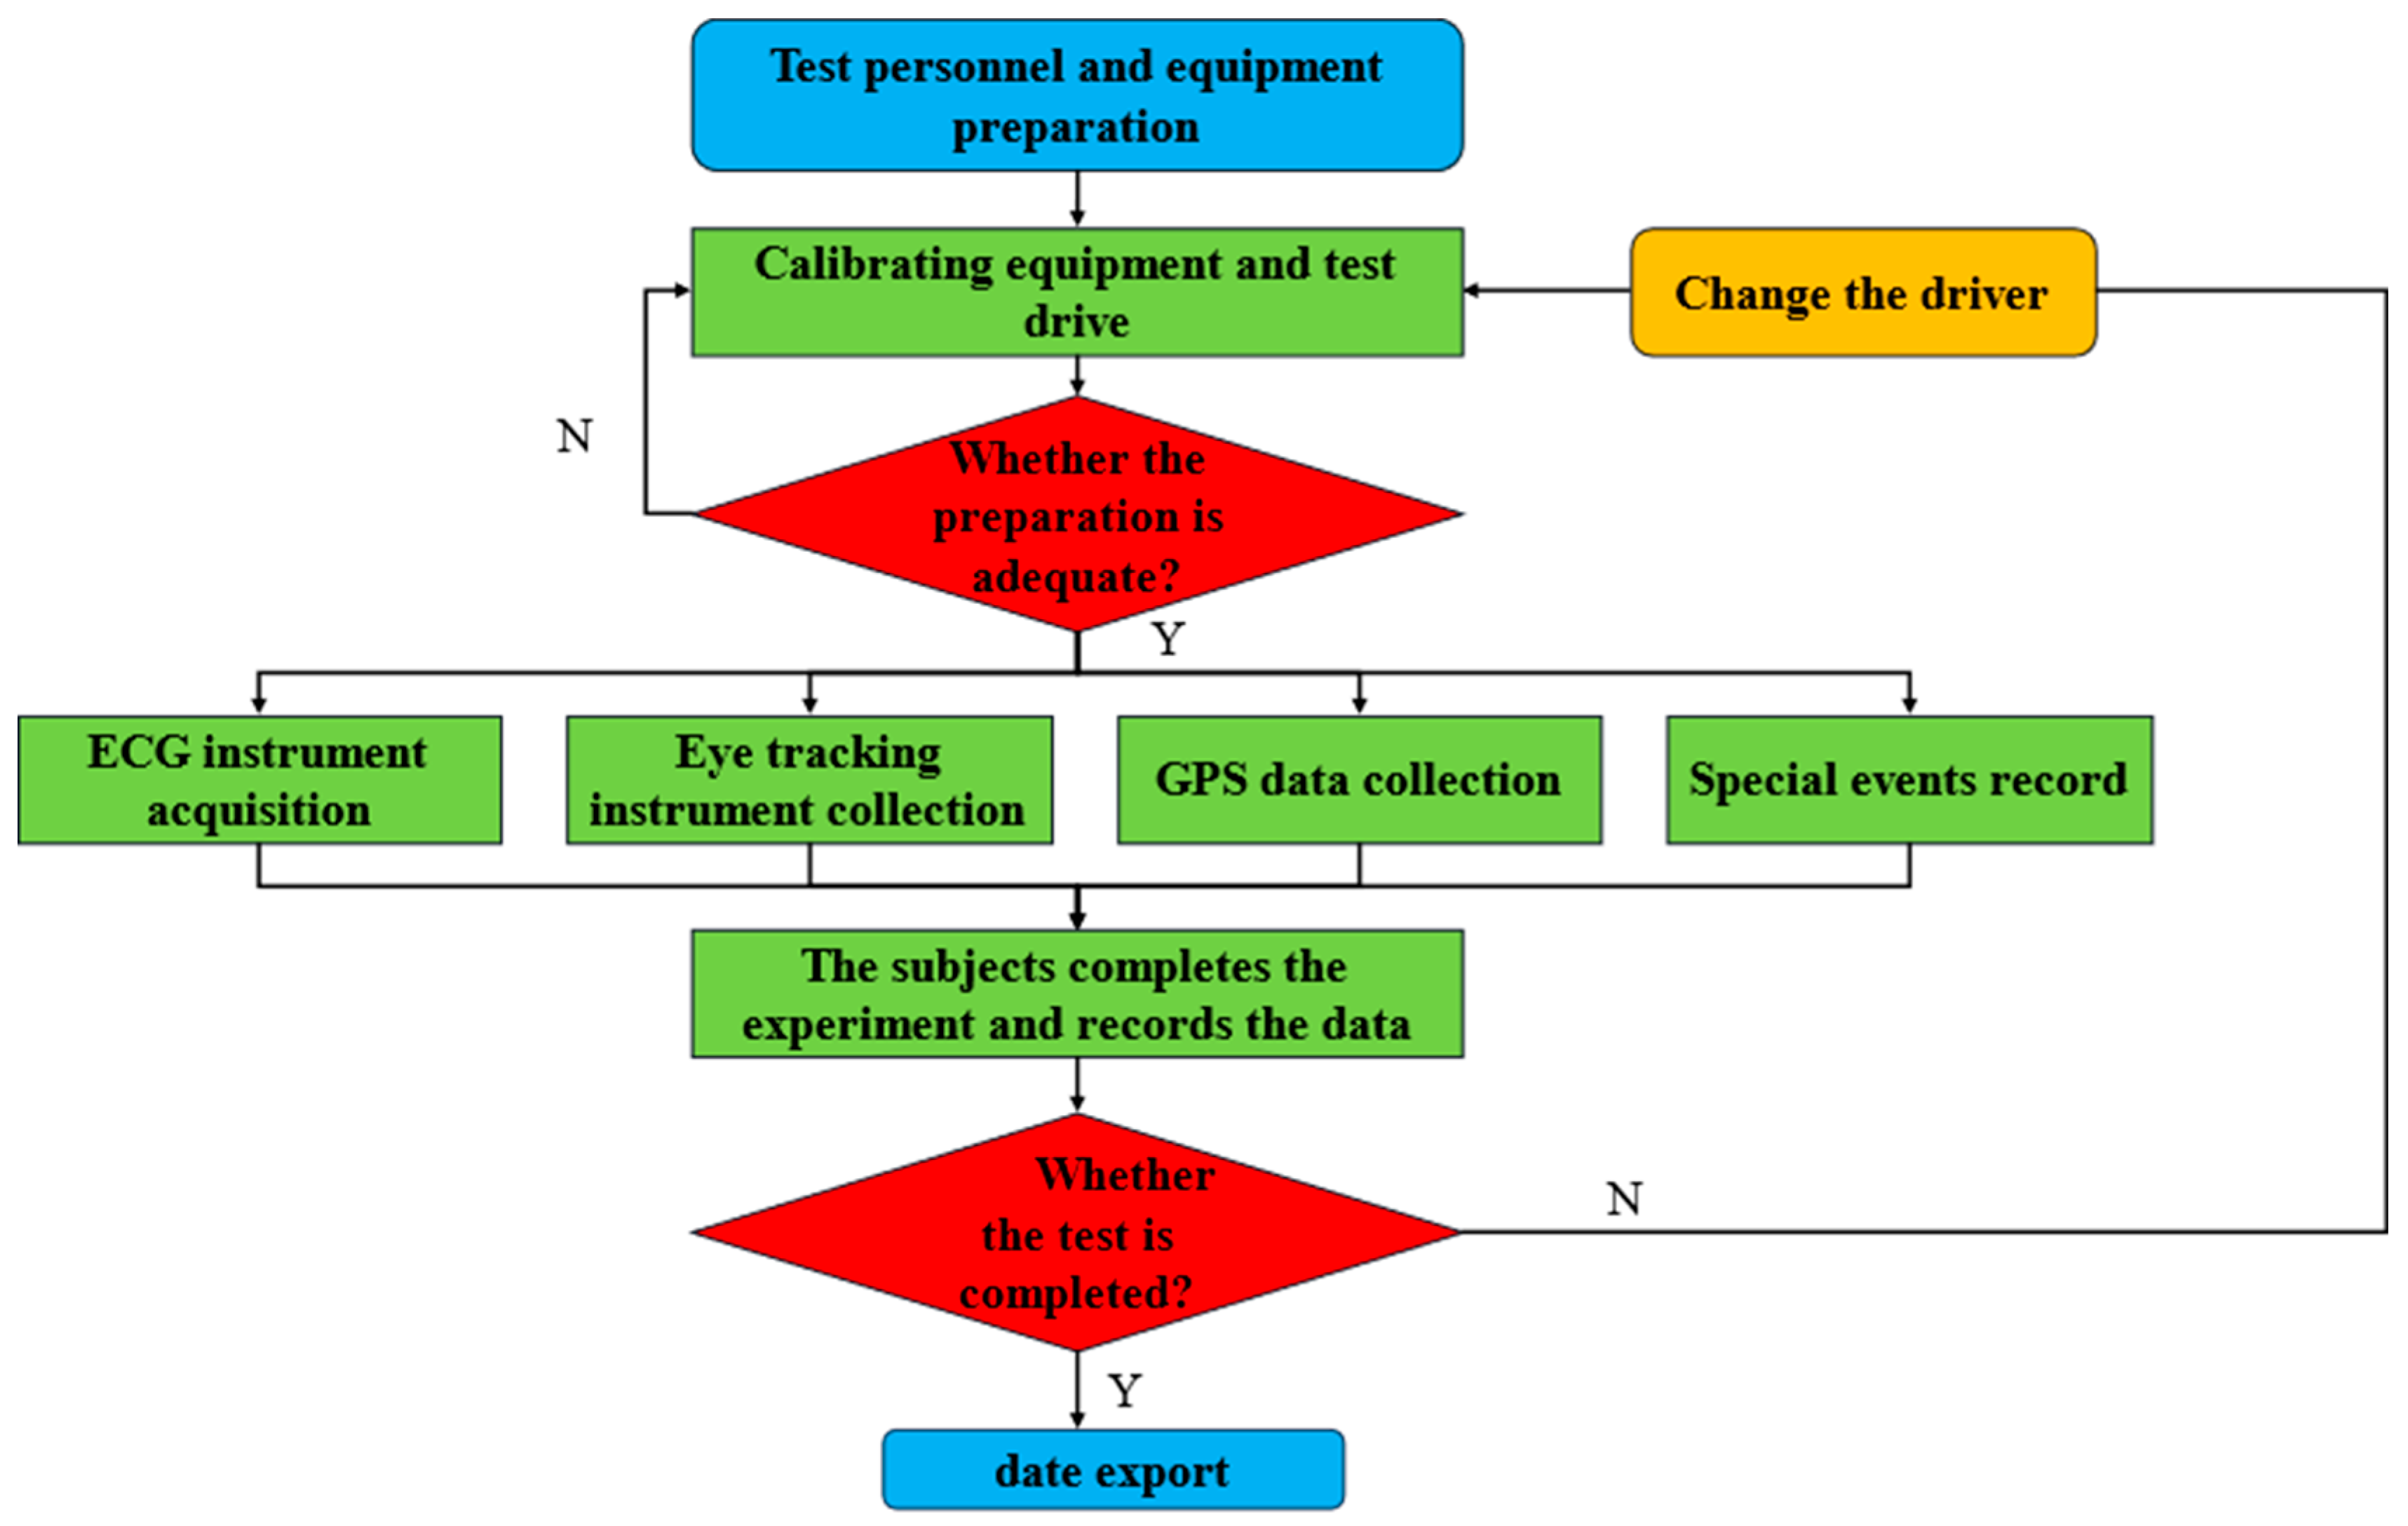
Mean fixation duration was defined as the average duration, in milliseconds, of fixation events detected within each analyzed zone. Longer fixation duration may reflect sustained processing of relevant roadway information, but it may also indicate greater difficulty in extracting information. It was therefore interpreted as a visual processing measure rather than a unidirectional safety indicator [33,34,35]. The overall experimental procedure is illustrated in Figure 3.

2.5.3. Definition of Heart Rate Growth Rate

Heart rate growth rate was calculated as HRG = ( H R d r i v i n g H R c a l m )/ H R c a l m × 100%, where H R d r i v i n g is the mean heart rate during driving in the relevant zone and H R c a l m is the calm-state reference heart rate. Heart rate measures were treated as indicators of physiological arousal or workload rather than direct measures of crash risk [26,27,28,31].

2.5.4. Data Processing and Statistical Analysis

The synchronized recordings were segmented according to the six analysis zones. Potential abnormal observations were screened using the three-sigma (3σ) rule. For each outcome, the mean, standard deviation (SD), and 95% confidence interval (CI) were calculated. Statistical analyses were performed using R version 4.2.2 (R Foundation for Statistical Computing, Vienna, Austria). A two-factor repeated-measures analysis of variance (ANOVA) was conducted with lighting condition (original versus modified) and tunnel zone (access, threshold, transition, interior, exit, and departure) as within-subject factors. Participants were assigned to either the daytime or nighttime testing period, with 12 participants in each period. Testing period was not included as an independent factor in the primary statistical model. Effect sizes are reported as partial eta squared (ηp2). Bonferroni-adjusted pairwise comparisons were used to compare the two lighting conditions within each tunnel zone, with statistical significance set at p < 0.05. Relative change was calculated as (modified − original)/original × 100%. Eye tracking and pupil data reporting were interpreted in accordance with established guidance on data quality and preprocessing [36,37,38].

3. Results

3.1. Photometric Change

The modified lighting condition increased the measured interior zone illuminance uniformity from 0.71 to 0.87. The reported illuminance profile also showed higher roadway illuminance under the modified condition in the threshold, transition, interior, and exit zones (Figure 2).

3.2. Pupil Area Response

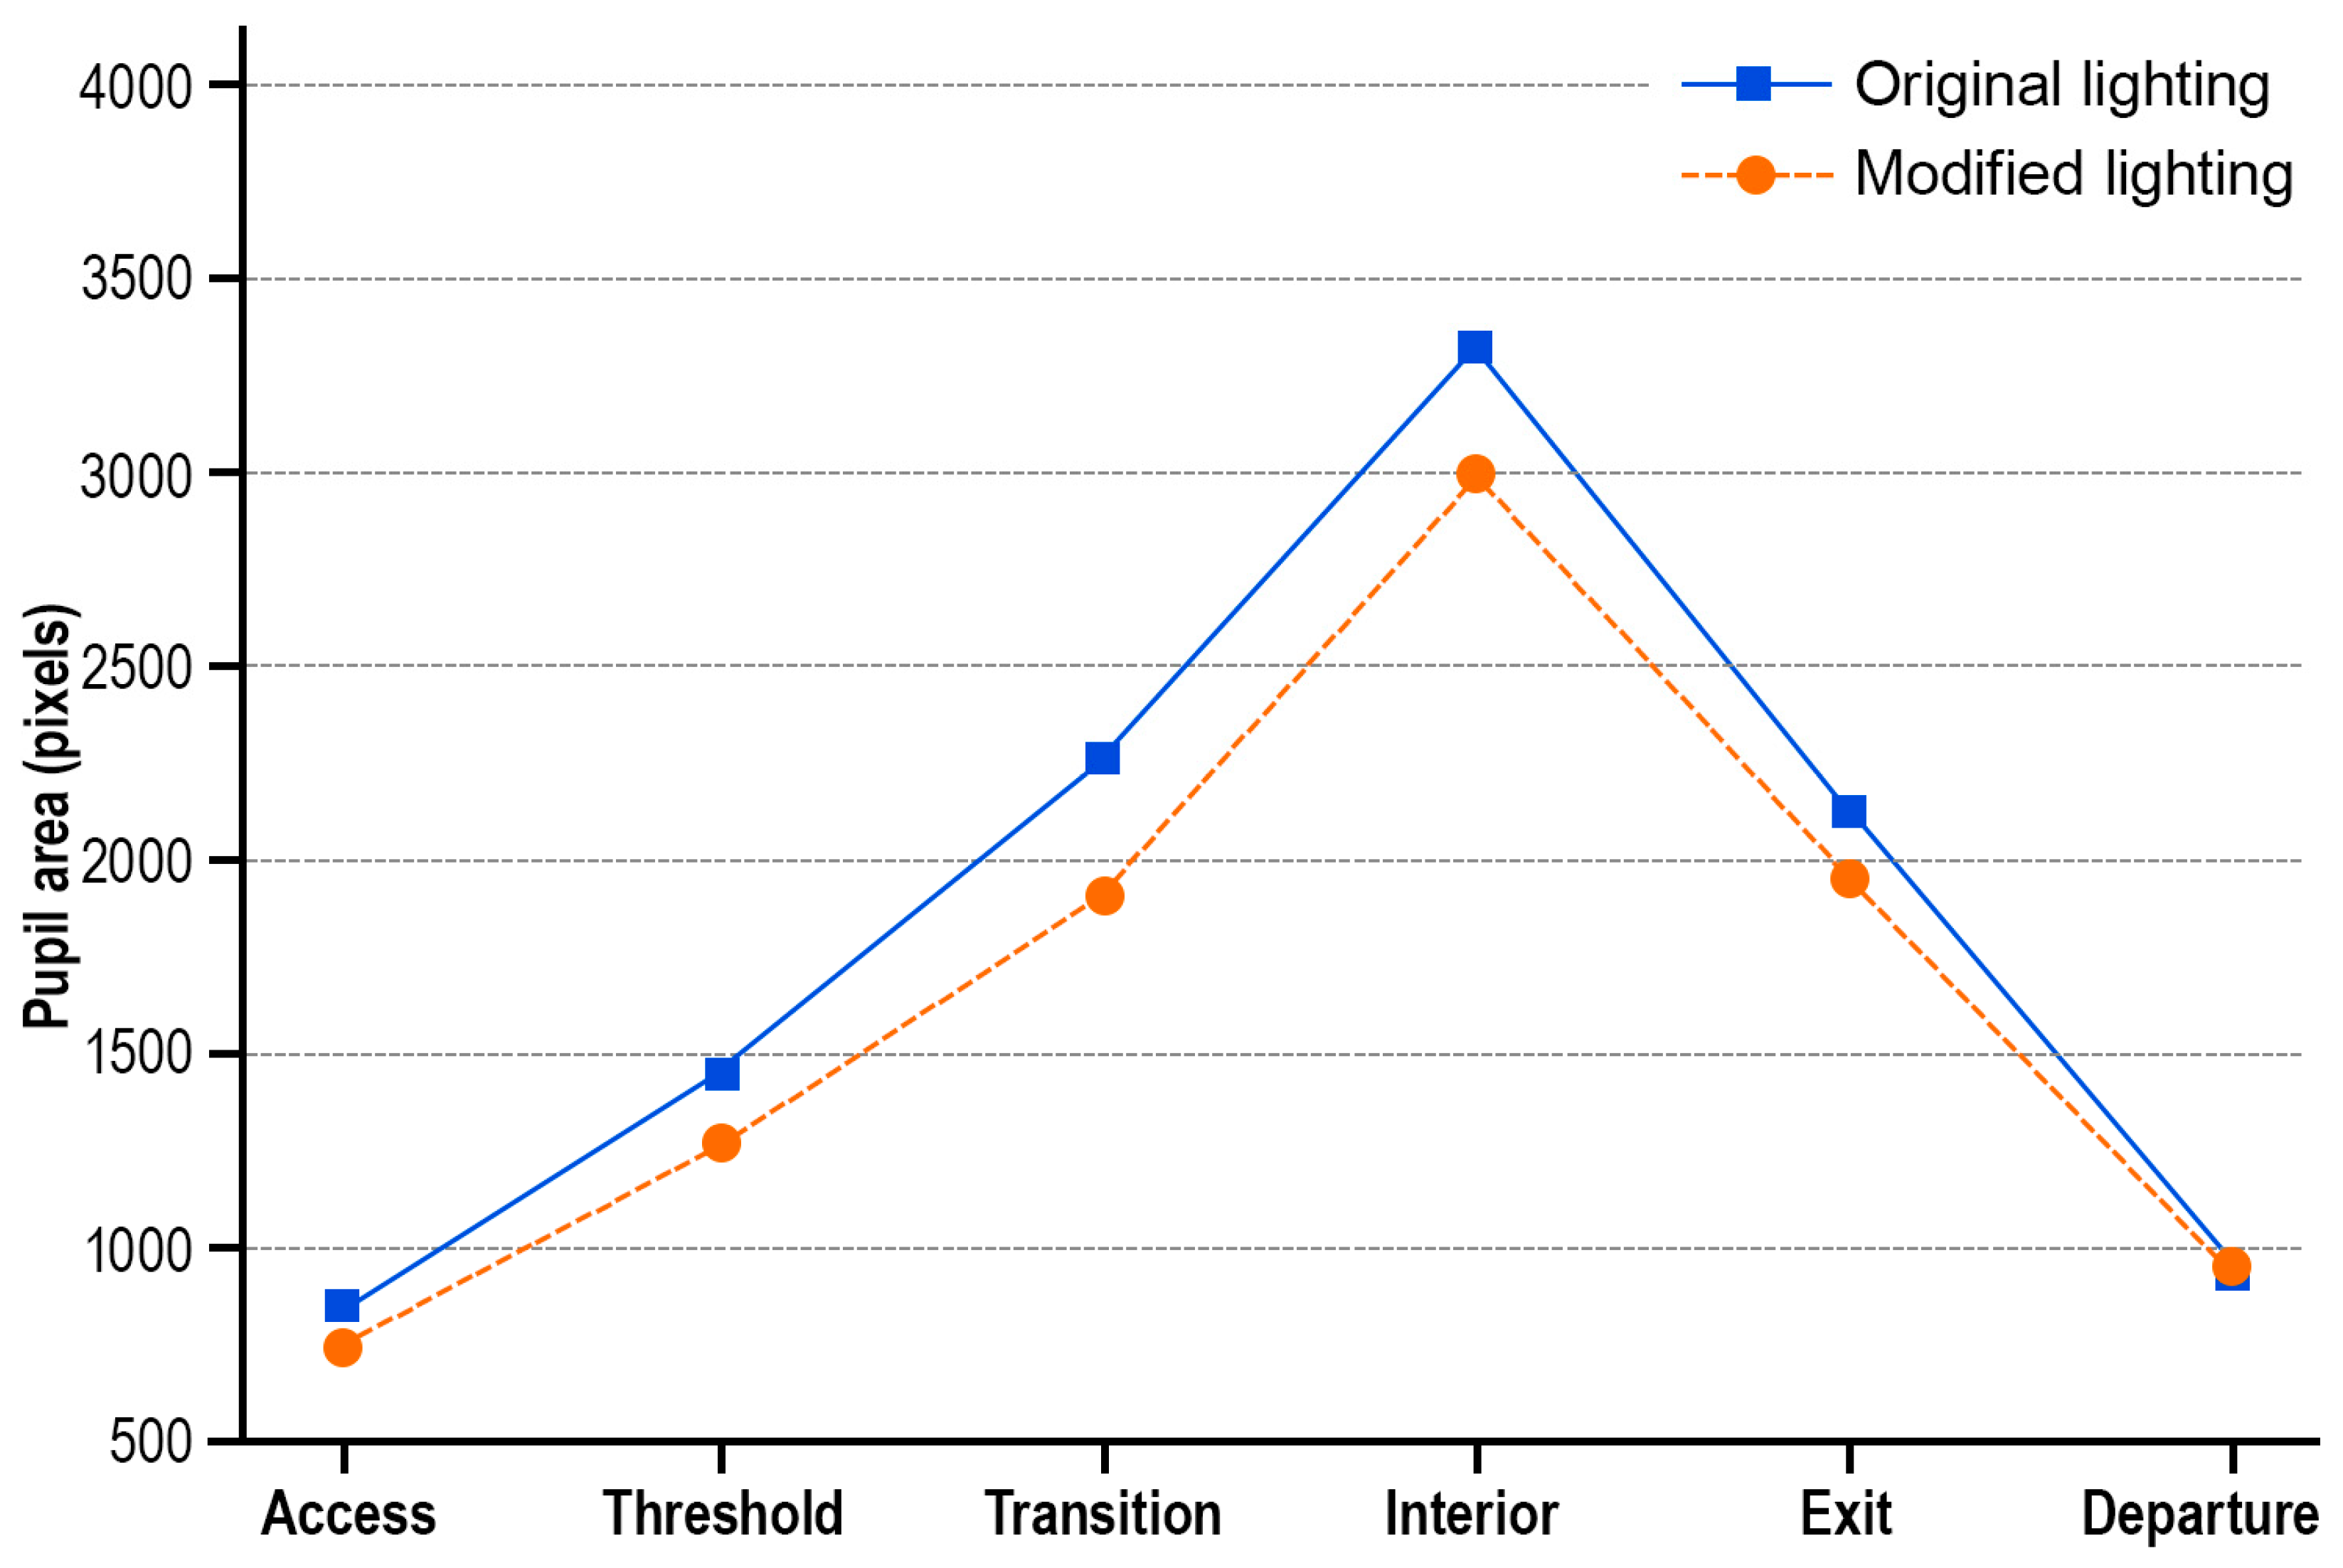
Under both lighting conditions, pupil area increased from the access zone toward the tunnel interior and decreased toward the exit and departure zones. Relative to the original condition, the modified condition produced smaller mean pupil areas in the access, threshold, transition, interior, and exit zones. The largest reductions occurred in the transition zone (15.64%) and threshold zone (10.14%). Pupil area was 1.85% larger in the departure zone under the modified condition. The corresponding results are summarized in Table 4.
The repeated-measures ANOVA showed significant main effects of lighting condition, F(1, 23) = 18.60, p < 0.001, ηp2 = 0.45, and tunnel zone, F(5, 115) = 742.30, p < 0.001, ηp2 = 0.97, together with a significant lighting × zone interaction, F(5, 115) = 6.84, p < 0.001, ηp2 = 0.23. Bonferroni-adjusted comparisons indicated significant reductions in the threshold (p = 0.031), transition (p < 0.001), and interior (p = 0.004) zones; the access, exit, and departure zone differences were not significant. The mean pupil area across the six analysis zones is shown in Figure 4.

3.3. Mean Fixation Duration

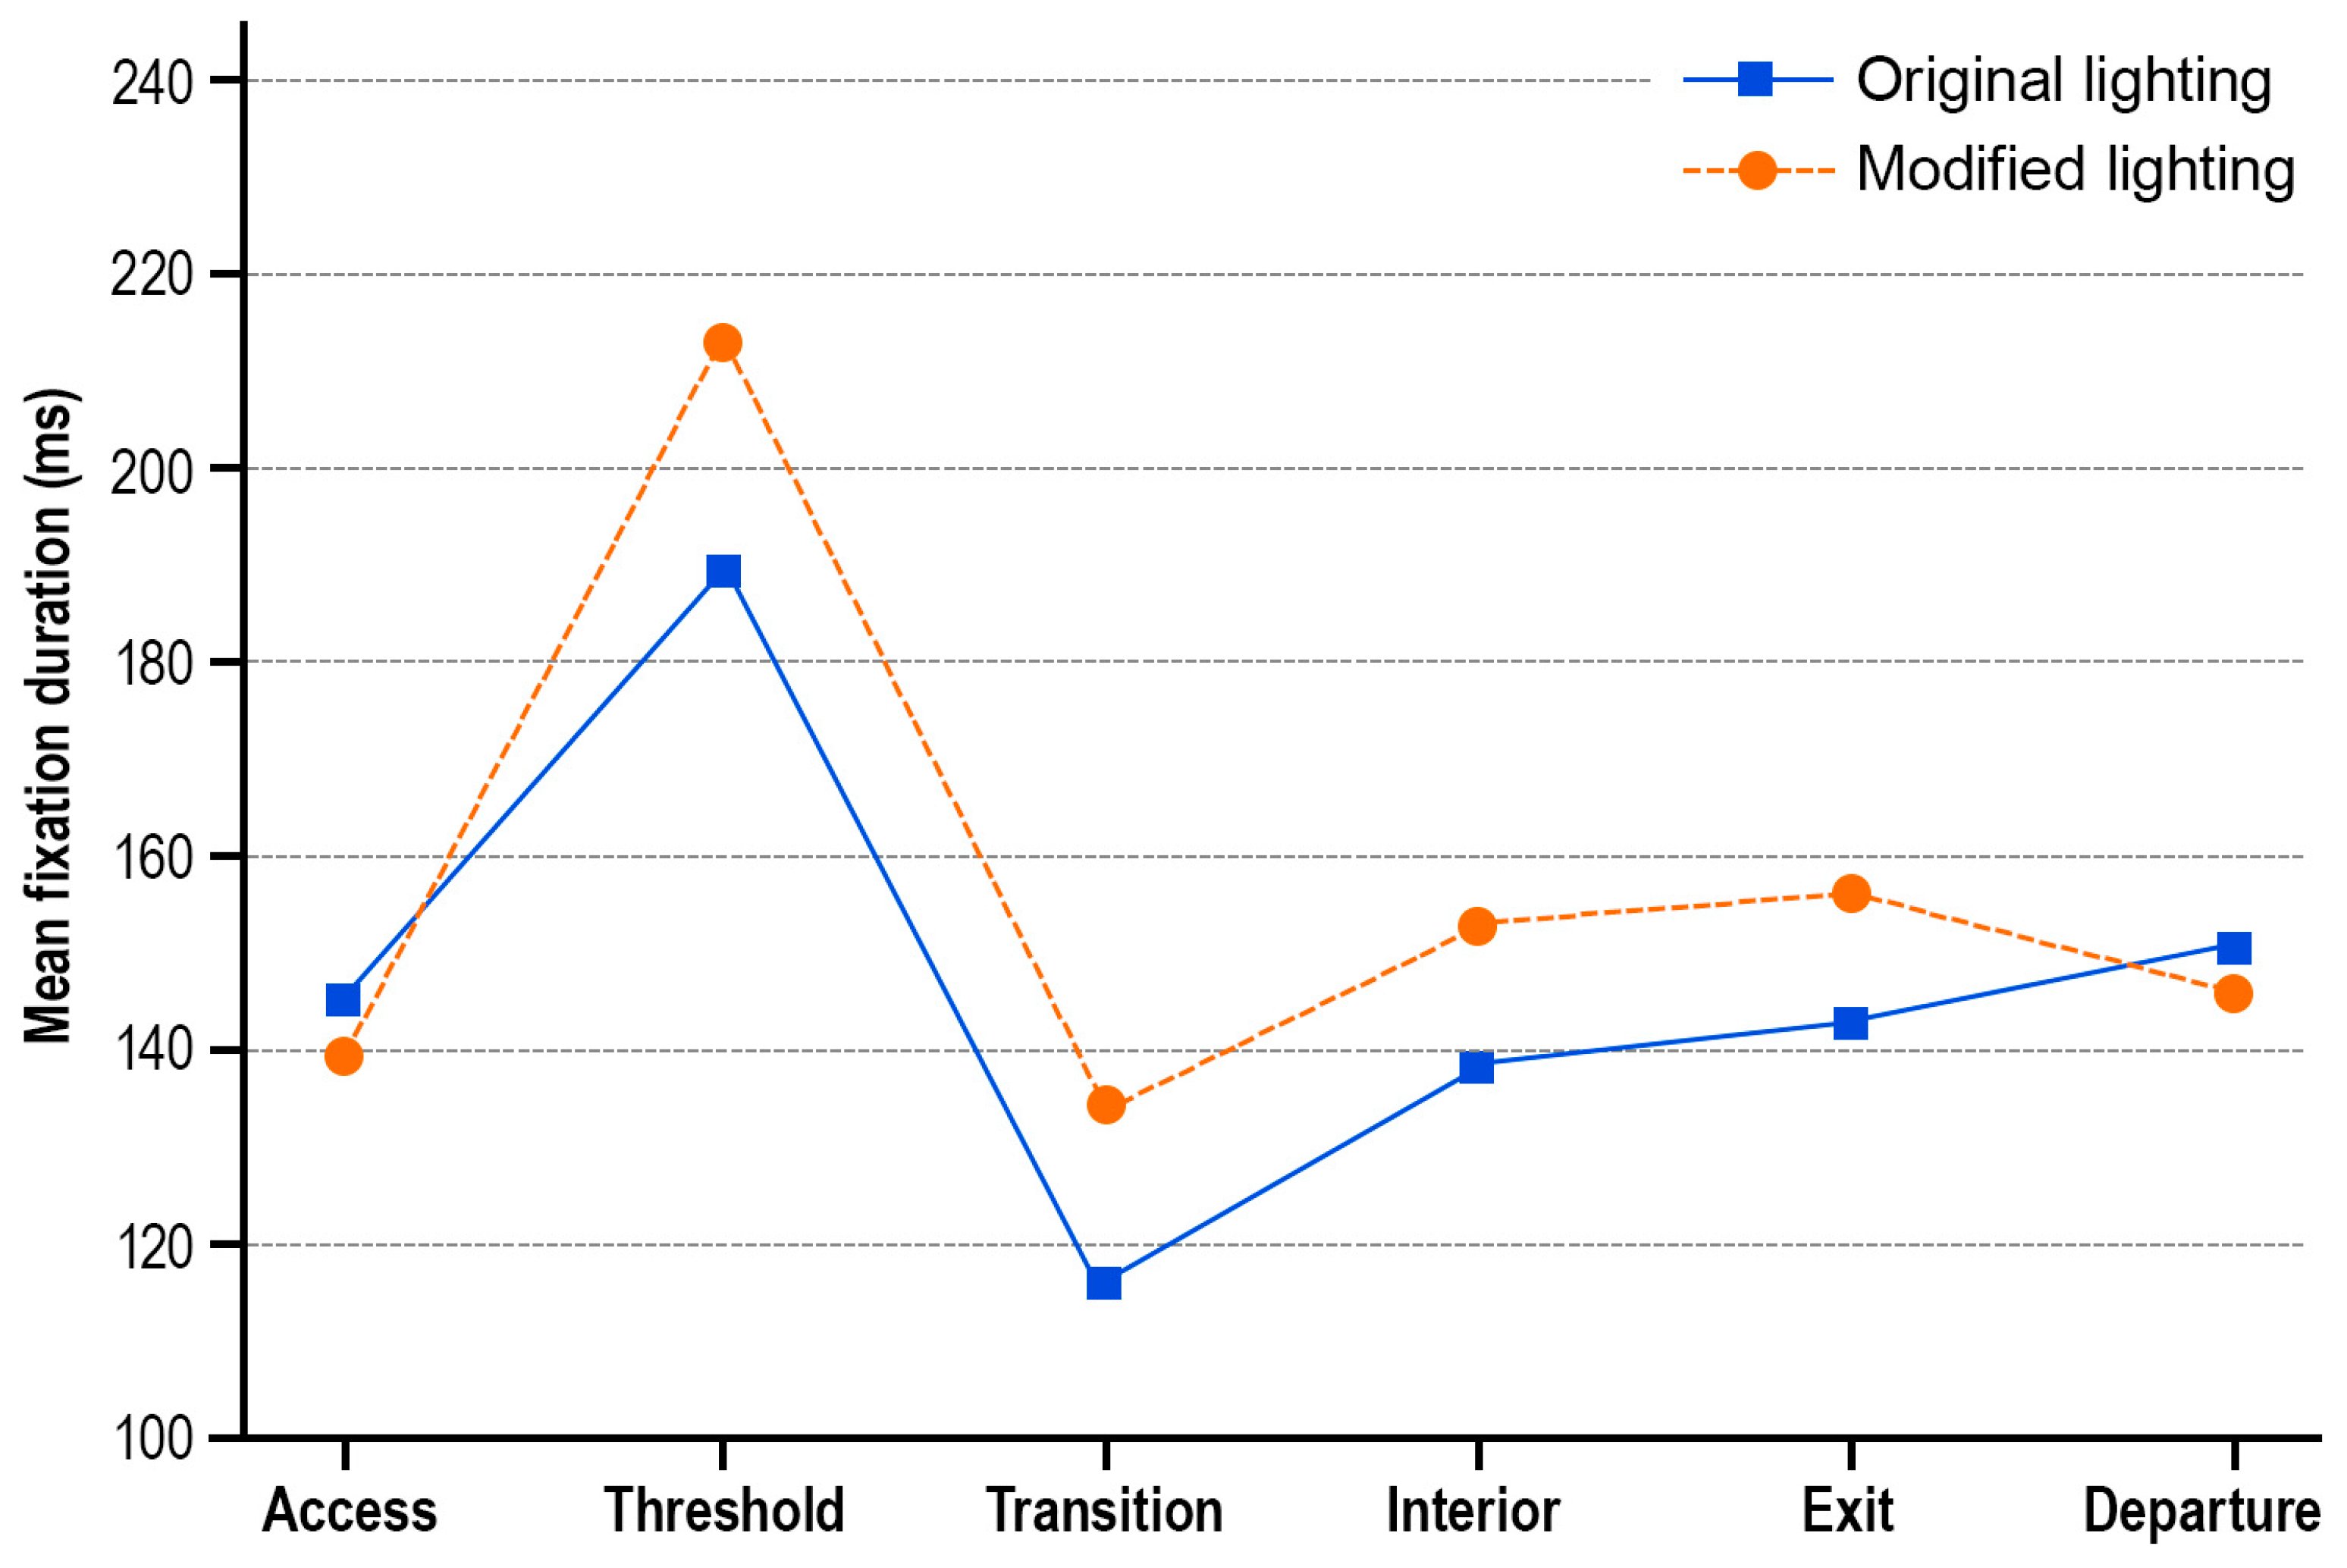
Compared with the original condition, the modified condition increased mean fixation duration in the threshold (+11.04%), transition (+15.74%), interior (+10.87%), and exit (+9.88%) zones. Small decreases occurred in the access (−3.72%) and departure (−3.04%) zones. The detailed results are presented in Table 5.
The repeated-measures ANOVA showed significant main effects of lighting condition, F(1, 23) = 9.84, p = 0.005, ηp2 = 0.30, and tunnel zone, F(5, 115) = 58.67, p < 0.001, ηp2 = 0.72, together with a significant lighting × zone interaction, F(5, 115) = 5.46, p < 0.001, ηp2 = 0.19. Bonferroni-adjusted comparisons indicated significant increases in the threshold (p = 0.018), transition (p = 0.006), interior (p = 0.021), and exit (p = 0.038) zones; the access and departure zone differences were not significant. The mean fixation duration across the six analysis zones is shown in Figure 5.
Across the six zone means, mean fixation duration increased from 147.70 to 157.49 ms (+6.63%). In the combined threshold–transition region, it increased from 153.60 to 173.32 ms (+12.84%).

3.4. Heart Rate Growth Rate

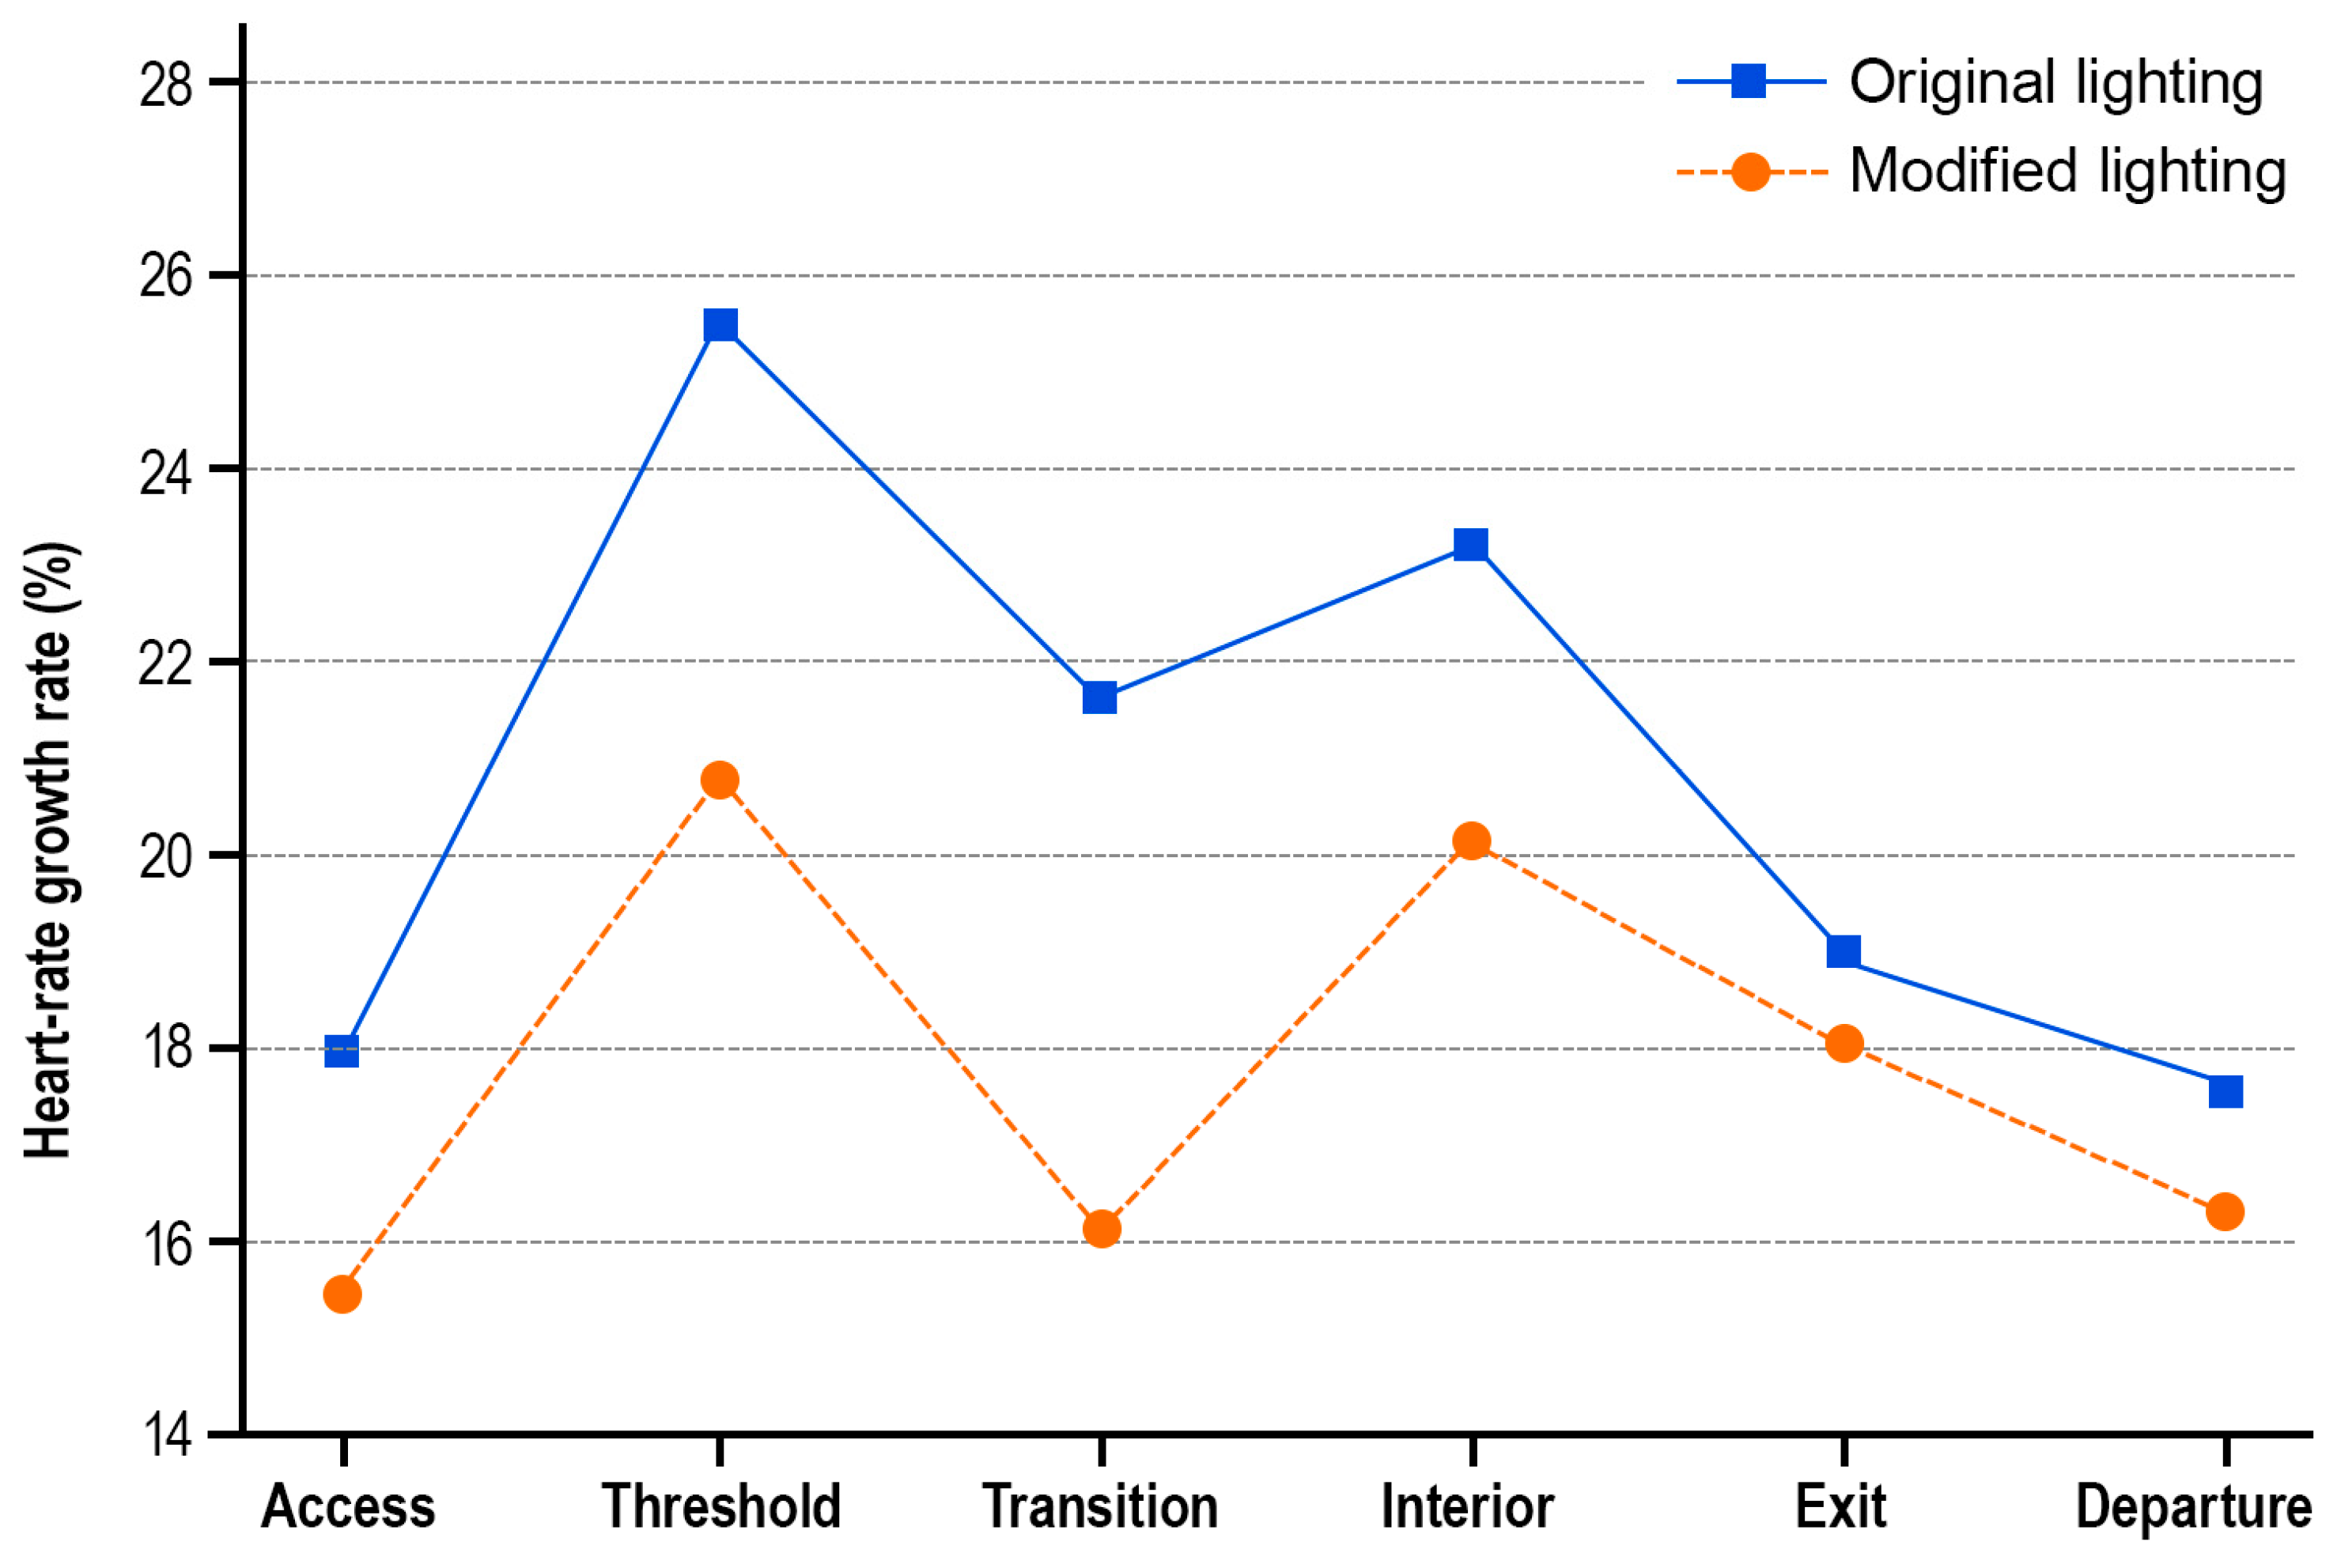
HRG was lower under the modified lighting condition in all six zones. The largest reductions occurred in the transition zone (23.95%) and threshold zone (18.17%), followed by the access zone (13.76%), interior zone (13.06%), departure zone (6.22%), and exit zone (4.23%). The corresponding results are presented in Table 6.
The repeated-measures ANOVA showed significant main effects of lighting condition, F(1, 23) = 14.72, p = 0.001, ηp2 = 0.39, and tunnel zone, F(5, 115) = 37.86, p < 0.001, ηp2 = 0.62, together with a significant lighting × zone interaction, F(5, 115) = 4.58, p = 0.001, ηp2 = 0.17. Bonferroni-adjusted comparisons indicated significant reductions in the threshold (p = 0.004), transition (p < 0.001), and interior (p = 0.012) zones; the access, exit, and departure zone differences were not significant. The HRG values across the six analysis zones under the two lighting conditions are shown in Figure 6.

4. Discussion

4.1. Principal Findings

This real-vehicle study compared driver responses under original and modified tunnel lighting environments. The intervention increased measured interior zone illuminance uniformity from 0.71 to 0.87. The repeated-measures analyses identified significant lighting-by-zone interactions for pupil area, mean fixation duration, and HRG. Descriptively, pupil area was smaller in five of the six zones and HRG lower in all six zones under the modified condition, with the largest changes being observed in the threshold and transition zones. Mean fixation duration increased in the threshold, transition, interior, and exit zones but decreased slightly in the access and departure zones. These patterns indicate that the lighting modification altered ocular adaptation, visual processing behavior, and physiological arousal.

4.2. Pupil Response and Visual Adaptation

The reduction in pupil area under the modified condition is consistent with the observed improvement in roadway illumination uniformity and the overall change in the tunnel lighting environment. The transition zone showed the largest descriptive reduction, which is plausible because this zone is intended to reduce the visual difference between the bright exterior or threshold environment and the darker tunnel interior. Improved longitudinal consistency may reduce the magnitude of rapid pupil adjustment. Nevertheless, pupil constriction is a normal light reflex response and should not be interpreted as direct evidence that cognitive workload or crash probability decreased. This interpretation is consistent with previous tunnel lighting studies showing that luminance level, longitudinal uniformity, color rendering, and dimming rate influence ocular response and visual performance [10,18,19,21,22].

4.3. Fixation Duration and Visual Processing

The modified lighting condition was associated with longer mean fixation durations in four zones. Longer fixations can reflect more sustained processing of relevant roadway information, but they can also indicate a reduced search efficiency or greater difficulty in extracting information. Because the available materials did not include gaze allocation or area-of-interest results, the fixation findings are best described as altered visual processing behavior rather than unequivocal improvement in information processing efficiency.

4.4. Heart Rate Growth Rate and Physiological Arousal

HRG was lower under the modified lighting condition, particularly in the threshold and transition zones. This pattern is consistent with reduced physiological arousal during the most demanding visual adaptation period. Heart rate measures can respond to systematic changes in cognitive demand during on-road and simulated driving, but they are also influenced by speed control, surrounding traffic, emotional state, and recent physical activity [26,28,31]. HRG should therefore be treated as converging physiological evidence rather than direct evidence of reduced crash risk.

4.5. Engineering Implications and Limitations

The results indicate that the threshold and transition zones should receive particular attention in tunnel lighting rehabilitation because the largest changes in pupil area and HRG were observed in these zones. From an engineering perspective, improving longitudinal lighting uniformity and reducing abrupt changes in the visual environment may help alleviate the physiological demands associated with tunnel entry and adaptation. Adaptive LED lighting also provides the potential to adjust lighting output according to exterior luminance, time of day, weather, and traffic conditions. However, the present findings should not be interpreted as defining a specific optimal illuminance or luminance threshold, because the intervention simultaneously changed several characteristics of the lighting environment.
Several limitations should be acknowledged. First, the study involved only 24 drivers and a single 610 m highway tunnel; therefore, the generalizability of the results to longer tunnels, curved tunnels, different traffic conditions, and other driver populations remains to be established. Second, pupil area is strongly influenced by the pupillary light reflex, while fixation duration does not provide an unequivocal measure of improved visual processing. Third, the present analysis did not include direct driving performance outcomes such as speed variability, lane position control, braking behavior, or traffic conflict measures. Consequently, the physiological findings cannot be interpreted as direct evidence of reduced crash risk. Fourth, participants were equally allocated to daytime and nighttime testing, with each participant completing the experiment in only one testing period. Although this balanced allocation reduced gross imbalance between the two periods, time of day was not explicitly modeled as an independent factor in the present analysis. Differences in exterior luminance and other time-dependent environmental conditions may therefore have contributed to the observed variability. Future studies should incorporate time of day as a formal between-subject or repeated-measures factor and continuously record exterior luminance. Finally, future studies should concurrently measure exterior portal luminance, explicitly incorporate time of day into the experimental design and statistical model, and integrate photometric, eye-movement, physiological, and vehicle control indicators under a wider range of tunnel geometries, traffic conditions, and adaptive lighting strategies.

5. Conclusions

This real-vehicle study aimed to investigate how a modified LED tunnel lighting environment—designed to enlarge the effective luminous area and improve roadway illumination uniformity—impacts drivers’ physiological responses and visual adaptation, compared to a traditional lighting system. The experiment achieved its primary objective by quantifying the physiological responses to the modified lighting, providing evidence that the new system may reduce visual adaptation demands and physiological arousal, particularly in the threshold and transition zones.
Photometrically, the measured interior zone illuminance uniformity increased from 0.71 to 0.87. Physiologically, significant lighting-by-zone interactions were observed for pupil area, mean fixation duration, and HRG, and the Bonferroni-adjusted comparisons localized the most consistent changes to the threshold, transition, and interior zones. Across the six tunnel zones, mean pupil area, HRG, and mean fixation duration changed by −8.39%, −13.78%, and +6.63%, respectively. The strongest reductions in pupil area and HRG occurred in the threshold and transition zones, indicating that these zones are especially sensitive to lighting modification.
Ultimately, this study established that the modified lighting environment reduces visual adaptation demand and physiological arousal, whereas the fixation duration results indicate a change in visual processing whose safety meaning remains ambiguous. By providing empirical evidence that improved lighting uniformity can reduce driver workload during the visually demanding process of tunnel entry, the findings offer a practical foundation for future human-centric tunnel lighting design, although the available evidence does not directly demonstrate crash reduction or improved vehicle control.

Author Contributions

Methodology, H.M. and X.W.; investigation, H.M. and Z.H.; data curation, J.T. and Y.Y.; formal analysis, X.W. and J.T.; writing—original draft preparation, H.M.; writing—review and editing, H.M., Z.H. and X.W.; supervision, H.M.; project administration, Y.Y. All authors have read and agreed to the published version of the manuscript.

Funding

This research received no external funding.

Institutional Review Board Statement

According to Fuzhou University policy, ethical review was not required for this study because it involved no procedures subject to institutional ethics review.

Data Availability Statement

The data supporting the findings of this study are available from the corresponding author upon reasonable request. The data are not publicly available because they contain experimental records and information associated with real-vehicle field testing.

Conflicts of Interest

Authors Honglin Mu and Zhangwen Huang were employed by Nanping Wusha Expressway Co., Ltd. Authors Xinyuan Wang and Junshan Tian were employed by Fujian Expressway Science & Technology Innovation Research Institute Co., Ltd. The remaining author declares that the research was conducted in the absence of any commercial or financial relationships that could be construed as a potential conflict of interest.

References

  1. Chang, X.; Li, H.; Zhang, X.; Rong, J.; Zhao, X. Transition patterns of driving style from a traditional driving environment to a connected vehicle environment: A case of an extra-long tunnel road. Transp. Res. Part F Traffic Psychol. Behav. 2022, 90, 181–195. [Google Scholar] [CrossRef] [Scilit]
  2. Zheng, H.; Du, Z.; Wang, S. Dynamic driving risk in highway tunnel groups based on pupillary oscillations. Accid. Anal. Prev. 2024, 195, 107414. [Google Scholar] [CrossRef] [Scilit] [PubMed]
  3. Lee, J.; Kirytopoulos, K.; Pervez, A.; Huang, H. Understanding drivers’ awareness, habits and intentions inside road tunnels for effective safety policies. Accid. Anal. Prev. 2022, 172, 106690. [Google Scholar] [CrossRef] [Scilit] [PubMed]
  4. Wang, F.; Wang, J.; Zhang, X.; Gu, D.; Yang, Y.; Zhu, H. Analysis of the causes of traffic accidents and identification of accident-prone points in long downhill tunnel of mountain expressways based on data mining. Sustainability 2022, 14, 8460. [Google Scholar]
  5. Zhao, X.; Liu, Q.; Li, H.; Qi, J.; Dong, W.; Ju, Y. Evaluation of the effect of decorated sidewall in tunnels based on driving behavior characteristics. Tunn. Undergr. Space Technol. 2022, 127, 104591. [Google Scholar] [CrossRef] [Scilit]
  6. Tušer, I.; Hošková-Mayerová, Š. Traffic safety sustainability and population protection in road tunnels. Qual. Quant. 2023, 57, 249–270. [Google Scholar] [CrossRef] [Scilit]
  7. Han, L.; Du, Z.; Ma, A. Evaluation of traffic sign information volume at highway tunnel entrance zone based on the visual sample entropy of novice and experienced drivers. Traffic Inj. Prev. 2024, 25, 499–509. [Google Scholar] [CrossRef] [Scilit] [PubMed]
  8. Deng, Y.; Zhu, H.; Shen, Y.; Ling, J.; Feng, S. Insights into the analysis and evaluation of tunnel lighting environments influenced by vehicle headlights. Tunn. Undergr. Space Technol. 2024, 144, 105546. [Google Scholar] [CrossRef] [Scilit]
  9. Azadani, M.N.; Boukerche, A. Driving behavior analysis guidelines for intelligent transportation systems. IEEE Trans. Intell. Transp. Syst. 2022, 23, 6027–6045. [Google Scholar] [CrossRef] [Scilit]
  10. Kang, C.; Lin, G.; Ye, L.; Zhang, C.; Huang, Z.; Wu, K. Influence of luminance and longitudinal luminance uniformity of tunnel lighting on drivers’ comprehensive visual performance. Tunn. Undergr. Space Technol. 2023, 140, 105282. [Google Scholar] [CrossRef] [Scilit]
  11. Liu, J.; Ye, F.; Zhu, W.; Su, E.; Peng, W.; Han, X.; Wen, X. Evaluation of the impact of landscape zone on driver distraction and visual comfort in road tunnels. Tunn. Undergr. Space Technol. 2025, 156, 106248. [Google Scholar] [CrossRef] [Scilit]
  12. Song, Y.; Zhu, H.; Shen, Y.; Feng, S. Green tunnel lighting environment: A systematic review on energy saving, visual comfort and low carbon development. Tunn. Undergr. Space Technol. 2024, 144, 105535. [Google Scholar] [CrossRef] [Scilit]
  13. JTG/T D70/2-01–2014; Guidelines for Design of Lighting of Highway Tunnels. Ministry of Transport: Beijing, China, 2014.
  14. CIE 088:2004; Guide for the Lighting of Road Tunnels and Underpasses, 2nd ed. CIE: Vienna, Austria, 2004.
  15. CIE 189:2010; Calculation of Tunnel Lighting Quality Criteria. CIE: Vienna, Austria, 2010.
  16. World Road Association (PIARC). Road Tunnels Manual: Tunnel Lighting System; PIARC: Paris, France, 2011. [Google Scholar]
  17. Wang, X.; You, L.; Chen, J.; Han, S. The impact of different service states of tunnel lighting on traffic safety. Accid. Anal. Prev. 2023, 192, 107237. [Google Scholar] [CrossRef] [Scilit] [PubMed]
  18. Zhao, E.-Z.; Dong, L.-L.; Chen, Y.; Lou, Q.; Xu, W.H. The impact of LED color rendering on the dark adaptation of human eyes at tunnel entrances. Int. J. Environ. Res. Public Health 2020, 17, 1566. [Google Scholar] [CrossRef] [Scilit] [PubMed]
  19. Zhang, C.; Kang, C.; Ye, L.; Weng, J.; Huang, Z.; Wu, K. The influence of dimming-induced luminance changes on driving safety in tunnels. Heliyon 2023, 9, e12928. [Google Scholar] [CrossRef] [Scilit] [PubMed]
  20. Qin, L.; Yang, D.; Weng, Y.; Leon, A.; Shi, X. Tunnel safety: A pilot study investigating drivers’ fixation characteristics when approaching tunnel entrance at different driving speeds. Light. Res. Technol. 2023, 55, 155–169. [Google Scholar] [CrossRef] [Scilit]
  21. Niu, J.; Liang, B.; He, S.; Xiao, J.; Qin, C. Long-tunnel lighting environment improvement method based on multiple-parameter intelligent control: Considering dynamic changes in luminance difference. Tunn. Undergr. Space Technol. 2022, 128, 104637. [Google Scholar] [CrossRef] [Scilit]
  22. Feng, S.; Gao, W.; Zhou, L.; Li, J.; Mao, W.; Liu, X. Experimental study on obstacle visibility and driving safety in lighting environment of road tunnel interior zones. Tunn. Undergr. Space Technol. 2024, 146, 105641. [Google Scholar] [CrossRef] [Scilit]
  23. Jiang, Y.; Lianekhammy, J.; Lawson, A.; Guo, C.; Lynam, D.; Joseph, J.E.; Gold, B.T.; Kelly, T.H. Brain responses to repeated visual experience among low and high sensation seekers: Role of boredom susceptibility. Psychiatry Res. Neuroimaging 2009, 173, 100–106. [Google Scholar] [CrossRef] [Scilit] [PubMed]
  24. Su, B.; Hu, J.; Zeng, J.; Wang, R. Traffic safety improvement via optimization of the lighting environment in highway tunnels. Int. J. Environ. Res. Public Health 2022, 19, 8517. [Google Scholar] [CrossRef] [Scilit] [PubMed]
  25. Chen, S.; Lin, Y.; Zhao, H. Effects of flicker with different brightness contrasts on visual fatigue in road lighting using fixed low-mounting-height luminaires. Tunn. Undergr. Space Technol. 2023, 136, 105091. [Google Scholar] [CrossRef] [Scilit]
  26. Mehler, B.; Reimer, B.; Coughlin, J.F. Sensitivity of physiological measures for detecting systematic variations in cognitive demand from a working-memory task: An on-road study across three age groups. Hum. Factors 2012, 54, 396–412. [Google Scholar] [PubMed]
  27. Bashiri, B.; Mann, D.D. Heart rate variability in response to task automation in agricultural semi-autonomous vehicles. Ergon. Open J. 2014, 7, 6–12. [Google Scholar] [CrossRef] [Scilit]
  28. Task Force of the European Society of Cardiology and the North American Society of Pacing and Electrophysiology. Heart rate variability: Standards of measurement, physiological interpretation and clinical use. Eur. Heart J. 1996, 17, 354–381. [Google Scholar] [CrossRef] [Scilit]
  29. Han, C.; Sun, X.; Yang, Y.; Che, Y.; Qin, Y. Brain complex network characteristic analysis of fatigue during simulated driving based on electroencephalogram signals. Entropy 2019, 21, 353. [Google Scholar] [PubMed]
  30. Qin, L.; Dong, L.-L.; Xu, W.-H.; Zhang, L.-D.; Leon, A.S. Influence of vehicle speed on the characteristics of driver’s eye movement at a highway tunnel entrance during day and night conditions: A pilot study. Int. J. Environ. Res. Public Health 2018, 15, 656. [Google Scholar] [CrossRef] [Scilit] [PubMed]
  31. Rendon-Velez, E.; Van Leeuwen, P.; Happee, R.; Horvath, I.; Van der Vegte, W.; de Winter, J.C.F. The effects of time pressure on driver performance and physiological activity: A driving simulator study. Transp. Res. Part F Traffic Psychol. Behav. 2016, 41, 150–169. [Google Scholar] [CrossRef] [Scilit]
  32. Ergoneers GmbH. Dikablis Eye Tracking Glasses Professional: Manual; Ergoneers GmbH: Geretsried, Germany, 2014. [Google Scholar]
  33. Chen, Y.; Du, Z.; Xu, J.; Luo, S. Impact of traffic signs on driving speed at mountain highway tunnel entrances—The role of low-volume intermittent information. Transp. Res. Part F Traffic Psychol. Behav. 2024, 106, 328–339. [Google Scholar] [CrossRef] [Scilit]
  34. Schnell, T.; Yekhshatyan, L.; Daiker, R. Effect of luminance and text size on information acquisition time from traffic signs. Transp. Res. Rec. 2009, 2122, 52–62. [Google Scholar] [CrossRef] [Scilit]
  35. Chi, C.-F.; Lin, Y.-H.; Lan, W.-S. Measurement of information processing load and visual load on a dynamic information processing task. Behav. Inf. Technol. 2003, 22, 365–374. [Google Scholar] [CrossRef] [Scilit]
  36. Kret, M.E.; Sjak-Shie, E.E. Preprocessing pupil size data: Guidelines and code. Behav. Res. Methods 2019, 51, 1336–1342. [Google Scholar] [CrossRef] [Scilit] [PubMed]
  37. Holmqvist, K.; Nyström, M.; Mulvey, F. Eye tracker data quality: What it is and how to measure it. In Proceedings of the Symposium on Eye Tracking Research and Applications, Santa Barbara, CA, USA, 28–30 March 2012; pp. 45–52. [Google Scholar] [CrossRef] [Scilit]
  38. Mathôt, S.; Fabius, J.; van Heusden, E.; Van der Stigchel, S. Safe and sensible preprocessing and baseline correction of pupil-size data. Behav. Res. Methods 2018, 50, 94–106. [Google Scholar] [CrossRef] [Scilit] [PubMed]
Figure 1. Modified tunnel lighting environment used in the real-vehicle experiment.
Infrastructures 11 00309 g001
Figure 2. Reported illuminance distribution in four tunnel zones. Scenario 1 denotes the original lighting condition, and Scenario 2 denotes the modified condition.
Infrastructures 11 00309 g002
Figure 3. Flow chart of the experiment. Y/N indicates “Yes/No,” and arrows indicate the direction of the experimental procedure.
Infrastructures 11 00309 g003
Figure 4. Mean pupil area across the six analysis zones under the original and modified lighting conditions. Across the six zone means, pupil area decreased from 1839.35 to 1685.05 pixels (−8.39%). In the combined threshold–transition region, the mean decreased from 1867.79 to 1615.45 pixels (−13.51%). These values are descriptive aggregates of the reported zone means.
Infrastructures 11 00309 g004
Figure 5. Mean fixation duration across the six analysis zones under the original and modified lighting conditions.
Infrastructures 11 00309 g005
Figure 6. Heart rate growth rate across the six analysis zones under the original and modified lighting conditions.
Infrastructures 11 00309 g006
Table 1. Definitions and geometric limits of the analyzed tunnel zones.
ZoneOperational DefinitionStart ChainageEnd ChainageLength (m)
Access zoneOpen-road segment before the tunnel portal−100.0 m (relative to entrance portal)0.0 m100.0
Threshold zoneInitial tunnel segment intended to support dark adaptation0.0 m80.8 m80.8
Transition zoneSegment with progressive reduction in lighting level80.8 m373.6 m292.8
Interior zoneCentral segment with a relatively stable lighting level373.6 m550.0 m176.4
Exit zoneFinal tunnel segment before the exit portal550.0 m610.0 m60.0
Departure zoneOpen-road segment immediately after leaving the tunnel610.0 m710.0 m (100 m after portal)100.0
Table 2. Technical specifications of the original and modified tunnel lighting systems.
ParameterOriginal LightingModified Lighting
ManufacturerCommercial LED tunnel luminaire HPWinner TS2C series LED tunnel luminaire (Hangzhou Hpwinner Opto Corporation, Hangzhou, China)Prototype cloud-distribution LED tunnel luminaire (custom research prototype; Hebei Jingrui Electronic Technology Co., Ltd., Shijiazhuang, China)
Rated power120–180 W120–180 W
CCT4000 K4000 K
CRIRa > 70Ra > 70
DistributionConventional bat-wing/Type I distributionCloud-like luminous distribution
ControlFixed outputAdaptive dimming
Table 3. Characteristics of the study participants.
CharacteristicValue
Sample size24
Sex12 males, 12 females
Age (years)30.0 ± 6.8 (range: 25–45)
Driving experience (years)4.8 ± 2.8 (range: 2–10)
RecruitmentLocal university students and employees of nearby companies
Visual acuityNormal or corrected-to-normal visual acuity (Chinese logarithmic visual acuity ≥ 4.9, equivalent to decimal visual acuity ≥ 0.8).
Time-of-day allocationDaytime, n = 12; nighttime, n = 12
Table 4. Pupil area by lighting condition and tunnel zone (mean ± SD, 95% CI, relative change, and Bonferroni-adjusted comparisons).
Tunnel ZoneOriginal Lighting
Mean ± SD (Pixels)
Modified Lighting
Mean ± SD (Pixels)
Original
95% CI
Modified
95% CI
Relative
Change (%)
Bonferroni-
Adjusted p
Access896.9 ± 235861.6 ± 228796–998764–959−3.940.180
Threshold1447.6 ± 3521300.8 ± 3361298–15981159–1443−10.140.031 *
Transition2288.0 ± 4951930.1 ± 4632079–24971735–2126−15.64<0.001 ***
Interior3300.6 ± 6123009.8 ± 5883042–35592761–3258−8.810.004 **
Exit2116.4 ± 4522003.2 ± 4391925–23081817–2190−5.350.072
Departure986.6 ± 2481004.9 ± 255882–1091897–1113+1.850.640
Note: * p < 0.05; ** p < 0.01; *** p < 0.001.
Table 5. Mean fixation duration by lighting condition and tunnel zone (mean ± SD, 95% CI, relative change, and Bonferroni-adjusted comparisons).
Tunnel ZoneOriginal Lighting
Mean ± SD (ms)
Modified Lighting
Mean ± SD (ms)
Original
95% CI
Modified
95% CI
Relative
Change (%)
Bonferroni-
Adjusted p
Access145.68 ± 34.5140.26 ± 33.8131.1–160.3126.0–154.5−3.720.231
Threshold189.69 ± 41.8210.63 ± 44.6172.0–207.3191.8–229.5+11.040.018 *
Transition117.50 ± 28.3136.00 ± 31.2105.6–129.4122.8–149.2+15.740.006 **
Interior139.58 ± 36.1154.75 ± 37.9124.3–154.8138.7–170.8+10.870.021 *
Exit142.88 ± 35.6157.00 ± 36.8127.8–158.0141.4–172.6+9.880.038 *
Departure150.89 ± 38.2146.30 ± 37.5134.8–167.0130.5–162.1−3.040.487
Note: * p < 0.05; ** p < 0.01.
Table 6. Heart rate growth rate by lighting condition and tunnel zone (mean ± SD, 95% CI, relative change, and Bonferroni-adjusted comparisons).
Tunnel ZoneOriginal Lighting
Mean ± SD (%)
Modified Lighting
Mean ± SD (%)
Original
95% CI
Modified
95% CI
Relative
Change (%)
Bonferroni-
Adjusted p
Access17.95 ± 4.6215.48 ± 4.3516.00–19.9013.64–17.32−13.760.061
Threshold25.50 ± 5.8420.87 ± 5.2123.03–27.9718.67–23.07−18.170.004 **
Transition21.75 ± 5.3316.54 ± 4.8819.50–24.0014.48–18.60−23.95<0.001 ***
Interior23.25 ± 5.5720.21 ± 5.1620.90–25.6018.03–22.39−13.060.012 *
Exit19.13 ± 4.9118.32 ± 4.7517.06–21.2016.31–20.33−4.230.318
Departure17.68 ± 4.5416.58 ± 4.3915.76–19.6014.73–18.43−6.220.174
Note: * p < 0.05; ** p < 0.01; *** p < 0.001.
Disclaimer/Publisher’s Note: The statements, opinions and data contained in all publications are solely those of the individual author(s) and contributor(s) and not of MDPI and/or the editor(s). MDPI and/or the editor(s) disclaim responsibility for any injury to people or property resulting from any ideas, methods, instructions or products referred to in the content.