Article

Punching Shear Behavior of Engineered Cementitious Composites Flat-Plate Slabs Incorporating Cement Kiln Dust and Crumb Rubber

by
Rabie A. M. Amnisi
1,2,
Mohamed E. El-Zoughiby
1,
Basem S. Abdelwahed
1 and
Osama Youssf
1,3,*
1
Structural Engineering Department, Mansoura University, Mansoura 35516, Egypt
2
Department of Structure Engineering, University of Derna, Alqubah 0810, Libya
3
Civil and Environmental Engineering Department, United Arab Emirates University, Al Ain 15551, United Arab Emirates
*
Author to whom correspondence should be addressed.
Infrastructures 2026, 11(9), 304; https://doi.org/10.3390/infrastructures11090304 (registering DOI)
Submission received: 8 July 2026 / Revised: 13 August 2026 / Accepted: 25 August 2026 / Published: 28 August 2026

Abstract

This study experimentally investigated the punching shear behavior of engineered cementitious composite flat-plate slabs incorporating cement kiln dust and crumb rubber. The considered criteria included replacing 50% of the rubber without treatment and treating the rubber at the same percentage; the flexural reinforcement ratio, whether in the bottom tensile reinforcement ratio or in the top compressive reinforcement; and the ECC cube compressive strength (fcu). For this purpose, thirteen reinforced flat-plate slabs were cast and tested. All slabs had the same dimensions of 1100 × 1100 × 100 mm, with a central square column that had dimensions equal to 160 × 160 × 160 mm. The flexural RFT ratios in the tension and compression zones were 1.0, 1.2, and 1.6%. The tested slabs were cast with different values of fcu of 50, 65, and 70 MPa. The study first presented and discussed the first cracking load, ultimate load, crack pattern, load–deflection response, stiffness, and RFT strain. The experimental results demonstrated that increasing the tensile reinforcement RFT ratio significantly improved punching shear capacity by up to 33%, while the concrete cube compressive strength only contributed an approximately 14.2% increase. Treated crumb rubber engineered cementitious composite slabs showed greater initial stiffness and reduced deflections under the same loads, along with higher post-cracking stiffness degradation compared to crumb rubber concrete engineered cementitious composite slabs. Increased tension reinforcement improved initial and post-cracking stiffness and reduced deflections, with more significant effects in crumb rubber concrete engineered cementitious composite slabs. The flexural tension had a more substantial impact on punching shear behavior than compression. Comparisons with building design codes (ECP 203-2020, ACI 318-25, and Eurocode 2) revealed that while these codes could estimate shear capacity, they were conservative, with Eurocode 2 providing the best predictions by considering flexural tension.

1. Introduction

Flat-plate slabs’ structural integrity is popular in buildings due to its special qualities such as large internal space and efficient construction. However, early shear failure may expose a system to severe damage and collapse, as occurred in Mexico and the Northridge earthquake in the 1980s and 1990s [1]. This is mainly due to the lower tensile strength of common concrete. To overcome these problems, designers install shear bolts or vertical braces in the punching shear-failure-sensitive regions. However, this shear reinforcement comes with challenges in execution and construction, which affects the economic feasibility and quality of the projects [2,3,4]. The tensile strength of concrete is minimal but is compensated for by using some applicable methods, including increasing the thickness of the slabs, using drop panels, or creating a capital for the column head. However, such measures lead to an increase in the dead load of the structure, thereby complicating the process of construction at the expense of reducing the floor height [4]. To make construction and design easy and simple, there is an urgent need to innovate to ensure the strength and flexibility of the joints. Among these preferred solutions is enhancing the ductility of concrete, particularly through the use of engineered cementitious composites (ECCs), which are types of high-performance ductile concrete [5,6,7]. Multiple fine cracks appear in ECC concrete with high tensile strength, under direct tension, and before failure. The tensile stress capacity of ECC is 2–3 times greater than that of traditional concrete, which ranges between 3% and 12%. Its tensile strength ranges between 4 and 16 MPa, which is several times higher than that of traditional concrete [8]. Furthermore, when ECC is subjected to uniaxial compressive loading, its behavior is either elastic shear failure or lateral expansion [9,10]. ECC has an exceptional compressive strain capacity. At maximum load, its compressive stress and failure stress are 1.5 to 2.0 and 2.0 to 3.0 times higher than those of traditional concrete, respectively, and the failure stress ranges from 2.0 to 3.0 times higher than that of traditional concrete. The strength of ECC ranges between 20 and 170 MPa, covering all current strength classes of standard concrete [8,9,10].
Shear cracking in RECC members has been found to progress in three distinct phases: (1) an initial shear crack forms in the ECC, (2) additional small shear cracks develop and spread, and (3) these shear cracks become concentrated in certain regions. By comparison, shear failure in conventional RC members typically involves only two phases: the creation of shear cracks and the subsequent localization of those cracks [11,12,13]. When replace traditional concrete with ECC and no shear reinforcement is provided, shear-related failure patterns (such as diagonal tension failure or shear tension failure) may shift toward more ductile failure behaviors, including flexural–shear failure or even a predominantly flexural failure mechanism [13,14]. Overall, the ductile failure behavior of RECC is attributable to the material properties of ECC, especially its high tensile strength and its ability to undergo large deformations [9,10,11,12,13,14,15]. These material characteristics make it possible to use a design strategy that emphasizes high shear capacity with reduced reliance on bending effects while also encouraging micro-cracking and multiple-cracking behavior within RECC members. However, earlier research has concentrated on the response of RECC components under shear or flexural loading. As a result, a limited number of research studies investigate how ECC might improve the performance of slab–column connections.
Used tires constitute one of the most significant and complex waste sources in contemporary society, largely because of their long service life and the very high volumes produced every year [16,17]. The increased interest in used tires stems from their widespread availability and large-scale production, with 300 million scrap tires generated each year in the U.S., according to the Institute of Scrap Recycling Industries. This figure is expected to increase further due to global population growth and higher vehicle usage [18]. The burial of waste tires would limit the service life of burial places and have minimal economic advantage; thus, it is doubtful that they would be decomposed [19]. Adding crumb rubber (CR), produced by processing waste tires, to concrete mixtures can help protect the environment and reduce the consumption of natural resources [20]. However, several studies have shown that adding shredded rubber to concrete can reduce certain mechanical properties, including compressive and tensile strength. These reductions may, in turn, compromise the durability and overall performance of concrete in construction uses [20,21,22,23]. In another investigation, Youssf et al. [24] performed a series of chemical treatments on rubber crumbs that raised compressive strength by up to 40% [25]. Among the different treatment approaches, treating rubber with stone processing waste proved to be the most effective, yielding the least decrease in the strength of CR concrete compared to other techniques [26]. The reduction in mechanical performance was mainly attributed to the non-uniform dispersion of CR particles. CR–cement bonding deteriorates due to the following: (i) the more hydrophobic nature of the CR particle surface, which produces a high contact angle with the mixing water and promotes the development of air voids, and (ii) the higher deformability (plasticity) of CR particles relative to the stiffness of the surrounding cementitious matrix, which leads to pronounced stress concentration in the ITZ [27,28,29,30].
Cement kiln dust (CKD) is a by-product generated during cement production. It appears as a very fine powder similar in appearance to Portland cement and is made up of micro-scale particles captured by electrostatic precipitators throughout the clinker manufacturing process. Key constituents of CKD comprise aluminum, calcium, iron, magnesium, potassium, silicon, sodium, and titanium, along with smaller amounts of elements such as manganese, sulfur, and chloride [31,32]. In the United States, the cement sector produces roughly 15 million tons of CKD each year [33]. For example, a typical medium-scale cement plant may generate as much as 30,000 tons annually. Cement kiln dust has potential to be reused in many different ways, but the best option to utilize this leftover material is to reciprocate it in cement production process. This is not always possible in some kiln facilities. About 60–67 percent (8–8.4 million tons) of the CKD produced in the United States is utilized in this method [34]. The most prevalent beneficial applications of CKD are for soil stabilization, waste treatment, cement substitution, asphalt paving and other purposes [34]. Cement kiln dust contains the same types of fine compounds present in Portland clinker, though in different proportions. Its specific surface area typically lies in the range of 4000–14,000 cm2/g. In CKD, chlorides and carbonates act as effective accelerators, and cement pastes incorporating CKD generally show comparatively lower values of the relevant performance indicators [34,35,36]. The introduction of CKD in manufacturing concrete contributes to reducing environmental impact and lowering construction costs [35,36,37,38,39].
The fibers used today in ECC, including polyvinyl alcohol (PVA), polypropylene (PP), and polyethylene (PE) fibers, are manufactured polymer fibers. Because they are produced from engineered chemical compositions, they are considered synthetic fibers. By contrast, other synthetic fibers commonly applied in traditional concrete, such as steel fibers (StFs) and carbon fibers (CFs), have been used more extensively. Basalt fibers (BFs) are attracting growing interest as well, mainly due to the wide availability of basalt resources in the Earth’s crust, their comparatively low cost, and their reduced environmental footprint during production [40,41]. On the other hand, PPF-ECC mixtures can attain tensile ductility comparable to that of PVA-ECC, although their tensile strength is lower [42,43,44]. The low cost and strong chemical resistance of PPF fibers make them a promising option as a substitute for PVA fibers in certain applications [40]. PPF has been incorporated into conventional concrete, where it can enhance compressive strength, splitting tensile strength, and flexural strength. The addition of PPF fibers also enhanced the specimens’ ultimate bending capacity, durability, and overall ductility. That said, few studies have been published on the use of CKD in rubber processing. With the increasing need to recycle industrial by-products and protect the environment, there is a growing demand for technical data on the performance of ECC concrete and CKD-treated rubber. This study investigates the potential benefits of using CKD in ECC concrete. This was achieved by studying its effects on the properties of concrete.
ECC shows better performance, which has increased its use in slab–column connections. The aim is to reduce the brittleness of shear behavior and improve the ductility of conventional reinforced concrete connections [45,46,47,48]. Such a trend has been supported by recent works, e.g., Ye et al.’s [46]. Hamouda et al. [47] reported an increase in shear resistance for slabs reinforced with steel columns by about 33% for centrally loaded slabs and 28% for eccentrically loaded slabs when using high-performance concrete. However, from an environmental and economic standpoint, it may not be practical or feasible to cover an entire structure with ECC concrete.
Recent research has focused on enhancing punching shear resistance in ECC slabs through geometric improvements. However, the influence of fiber bridging on the punching shear response and the failure mechanisms, including critical crack angles related to shear penetration, require further exploration. Additionally, the energy absorption mechanisms in conventional ECC plates from a material perspective are still not fully understood.
This study addressed the preparation of eco-friendly engineered cementitious composites (ECCs) by replacing cement with 10% cement kiln dust (CKD) and substituting 50% of sand with crumb rubber. Physical treatment was applied to the rubber, and experimental tests were conducted on thirteen square slabs (1100 × 1100 mm, thickness 100 mm) to evaluate the shear response under punching shear. The research assessed the impact of tensile and compressive reinforcement ratios, along with concrete strength, on the performance of rubber–ECC slabs. Key findings included insights into crack patterns, load-bearing capacity, and failure modes, enhancing understanding of ECC slab behavior under various loading conditions and contributing to sustainable floor system development.
The flexural failure resistances of the models were calculated using the yield line analysis, while the shear failure resistances were estimated based on the empirical formulas provided in ECP 203-2020, ACI 318-25, and Eurocode 2. The failure force estimates were matched with the test results to verify their accuracy. This research aims to evaluate the effectiveness of incorporating tire crumbs into ECCs and its impact on the punching shear resistance of RC slabs. The study also detailed the effect of replacing part of traditional cement with cement kiln dust on the mechanical properties and spalling behavior of these sustainable mixes. To achieve the study’s objectives, 13 reinforced concrete slabs were designed, manufactured, and tested under the influence of a one-way load. A comparison was made between the slabs that included flexural reinforcement ratios of 0.01, 0.012, and 0.016. An additional comparison was made between reinforced flat-plate slabs that have the same tensile reinforcement ratios but differ in concrete strength. Both comparisons were built on load-versus-deflection curves and stress distributed across the slabs’ thickness. It is essential to provide additional experimental data in the literature to evaluate the impact of using high-strength cement compounds in RC slabs, as this data can help lay the design foundations that allow the use of these compounds in concrete structures.

2. Materials

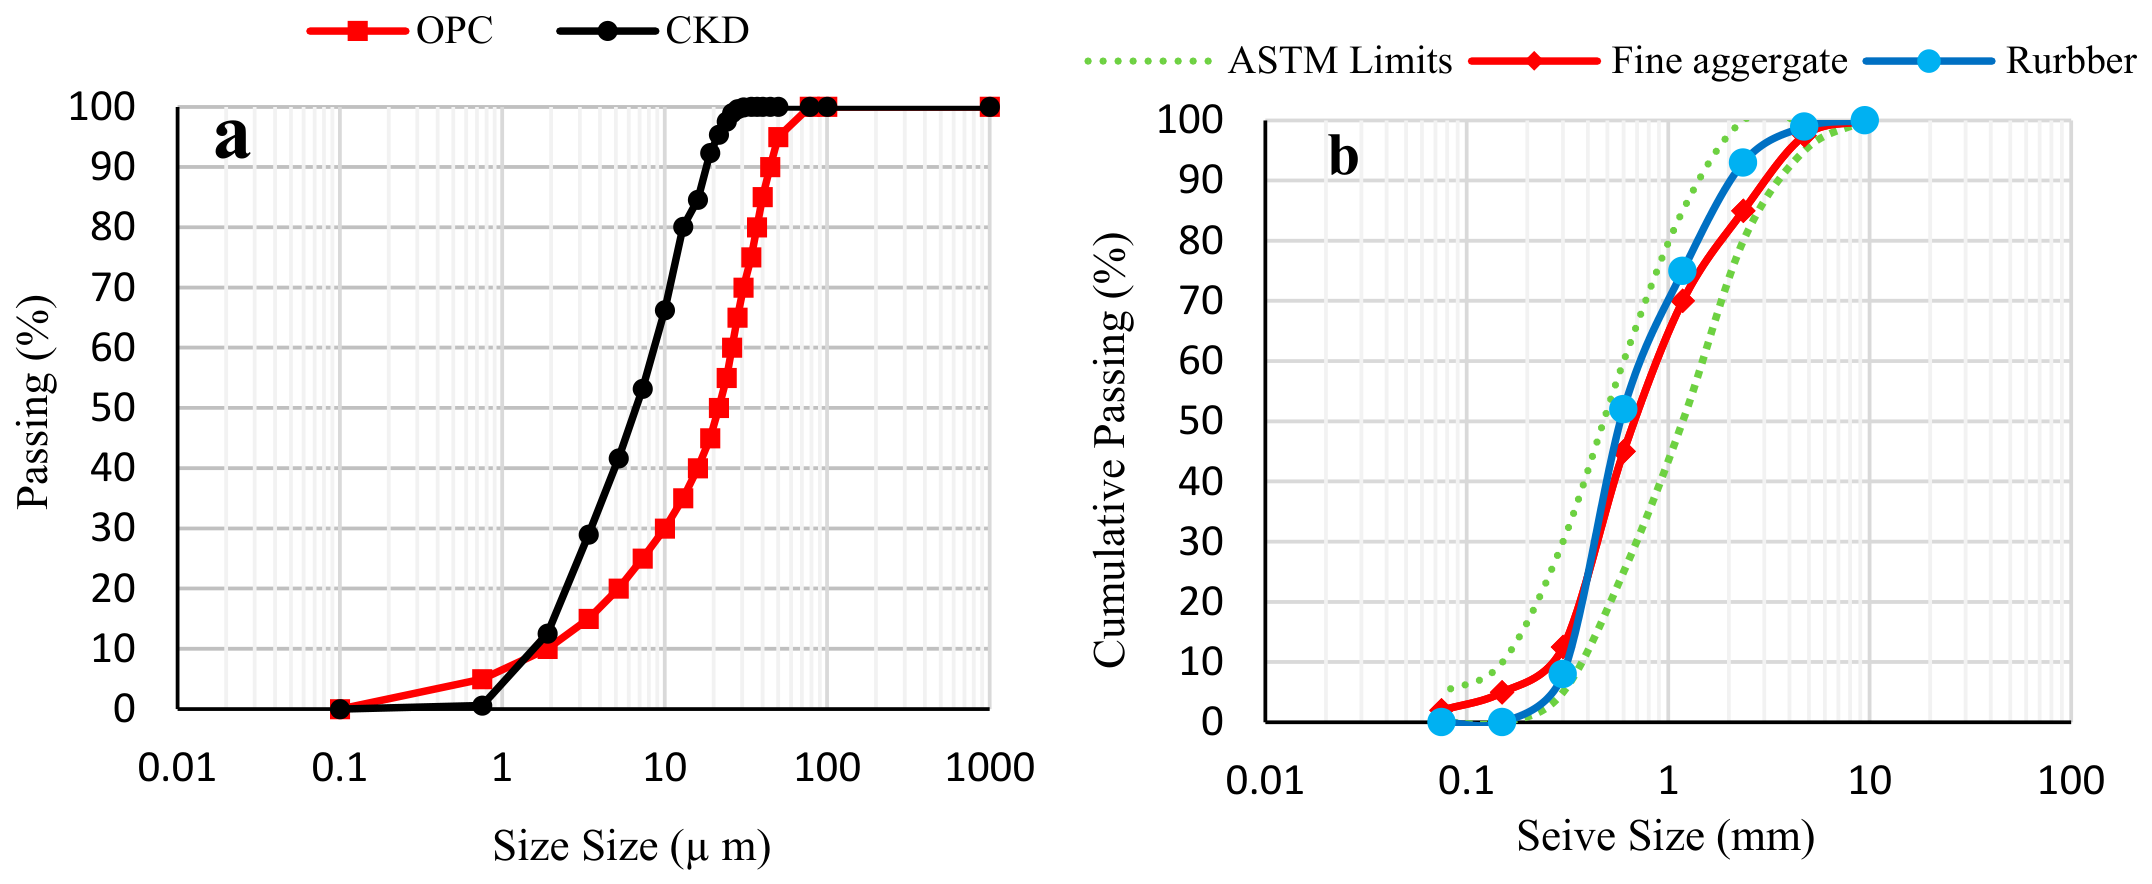
In order to study the behavior of punching shear on reinforced ECC slabs, three types of ECC mixtures with different 28-day compressive strengths of 50 MPa, 65 MPa, and 70 MPa were made. The mix compositions for each strength type are presented in Table 1. The mix for the fCU = 50 MPa category contained 100 kg/m3 of non-treatment crumb rubber without the addition of any supplementary materials. For an fCU of 65, 100 kg/m3 of treatment crumb rubber was used, using a cement dust kiln. A quantity of 10% of cement kiln dust was also used as a partial substitute for cement; see Figure 1a. An fCU of 70 was used for ECC with no supplementary material. Portland cement (CEM I 52.5N), silica fume (SF), and ground granulated blast-furnace slag (GGBFS) with specific gravities of 3.15, 2.2, and 2.8, respectively, were used as the main binders for all ECC mixtures. Superplasticizer based on polycarboxylate ether (SP) was used to make the ECC mixes more workable. CR was used as a partial replacement for sand. The CR had a particle size of 2–5 mm, a specific gravity of 0.97, and a bulk density of 0.53 t/m3. A sieve analysis of sand and CR is shown in Figure 1b. All ECC mixes used PPF with a diameter of 0.9 mm and a length of 12 mm.

2.1. Crumb Rubber Physical Treatment

Studies in the literature [49,50] reported weak bonding between rubber particles and cementitious materials. In this research, the physical treatment of rubber was conducted using CKD, which was also used to partially replace 10% of the cement. The slurry was prepared at a water-to-dust ratio of 0.7 by weight by CKD. The paste was prepared by adding water to maintain a constant volume and viscosity of the CKD slurry [32]. In a bucket, the slurry was combined with rubber particles and mixed for 7 min to guarantee that all particle surfaces were fully coated. Rubber particles were sieved for easy collection and cured on plastic sheets at ambient temperature for 48 h. The coated rubber particles were transferred into sealed bags for storage until the day of mixing after the curing period.

2.2. Slab Coding System

The slab specimens were named in the form of A-NR-RR, where the symbols refer to the relevant mix parameters.
(a)
A refers to the type of concrete (ECC without additives, R-ECC concrete with 50% rubber, TR-ECC concrete with 50% rubber treated with cement kiln dust, and 10% replacement of cement with cement kiln dust).
(b)
NR indicates the number of layers of reinforcement (1 and 2).
(c)
RR is the reinforcement ratio (1.0%, 1.2%, and 1.6%).

3. Experimental Work

A study was developed and executed to investigate the punching shear behavior of reinforced concrete flat-plate slabs influenced by various factors. The experimental program consisted of thirteen specimens with constant dimensions of 1100 × 1100 mm and a 100 mm slab thickness. Each slab specimen included an embedded column stub cast in situ, with the slab centered over it. The column stub had a cross-sectional dimension of 160 mm and a height of 160 mm. The column was adequately reinforced to ensure that failure did not occur during the applied loading.
This experimental investigation aimed to investigate the impact of untreated and treated rubber, as well as the ratios of flexural reinforcement (tension and compression), on the punching shear performance of the flat-plate slabs under diverse situations. The circumstances included the absence of stirrups and two strength values of fcu with the reference sample. The thirteen specimens were classified into three groups according to the investigated criteria, with each group consisting of four slabs, as presented in Table 2.
The first, second, and third groups each included four slabs made with two concrete grades and different flexural tension reinforcement ratios (0.01, 0.012, and 0.016). Some slabs also included compression reinforcement (C-RFT) at the same percentage, but the design focused primarily on achieving the targeted flexural tension (T-RFT) ratio within each group. The lowest ratio, 0.01, was selected to ensure that the slabs would fail in punching rather than in flexure.
The first and second slabs of the first group had the same reinforcement ratios T-RFT as the reference sample to study the pure effect of treated and untreated rubber in concrete mixes on punching shear behavior. The third and fourth slabs contained compressive reinforcement C-RFT. The aim of the second group was to predict the effect of using compression reinforcement and the performance of reinforcement in flexural tension with the different grades of concrete.
For each group, the first and third slabs were produced using a concrete mix with a compressive strength (fcu) of 50 MPa, while the second and fourth slabs were cast with concrete that had an fcu = 65 MPa. The goal of preparing these slabs was to evaluate how raising fcu influences the tension flexural behavior, particularly relative to the control mix. The second and fourth slabs from all groups were used to consider compression flexural reinforcement relative to tension reinforcement of 0.01, 0.012, and 0.016 for groups A, B, and C, respectively, to prioritize the flexural compression RFT ratio in this group.
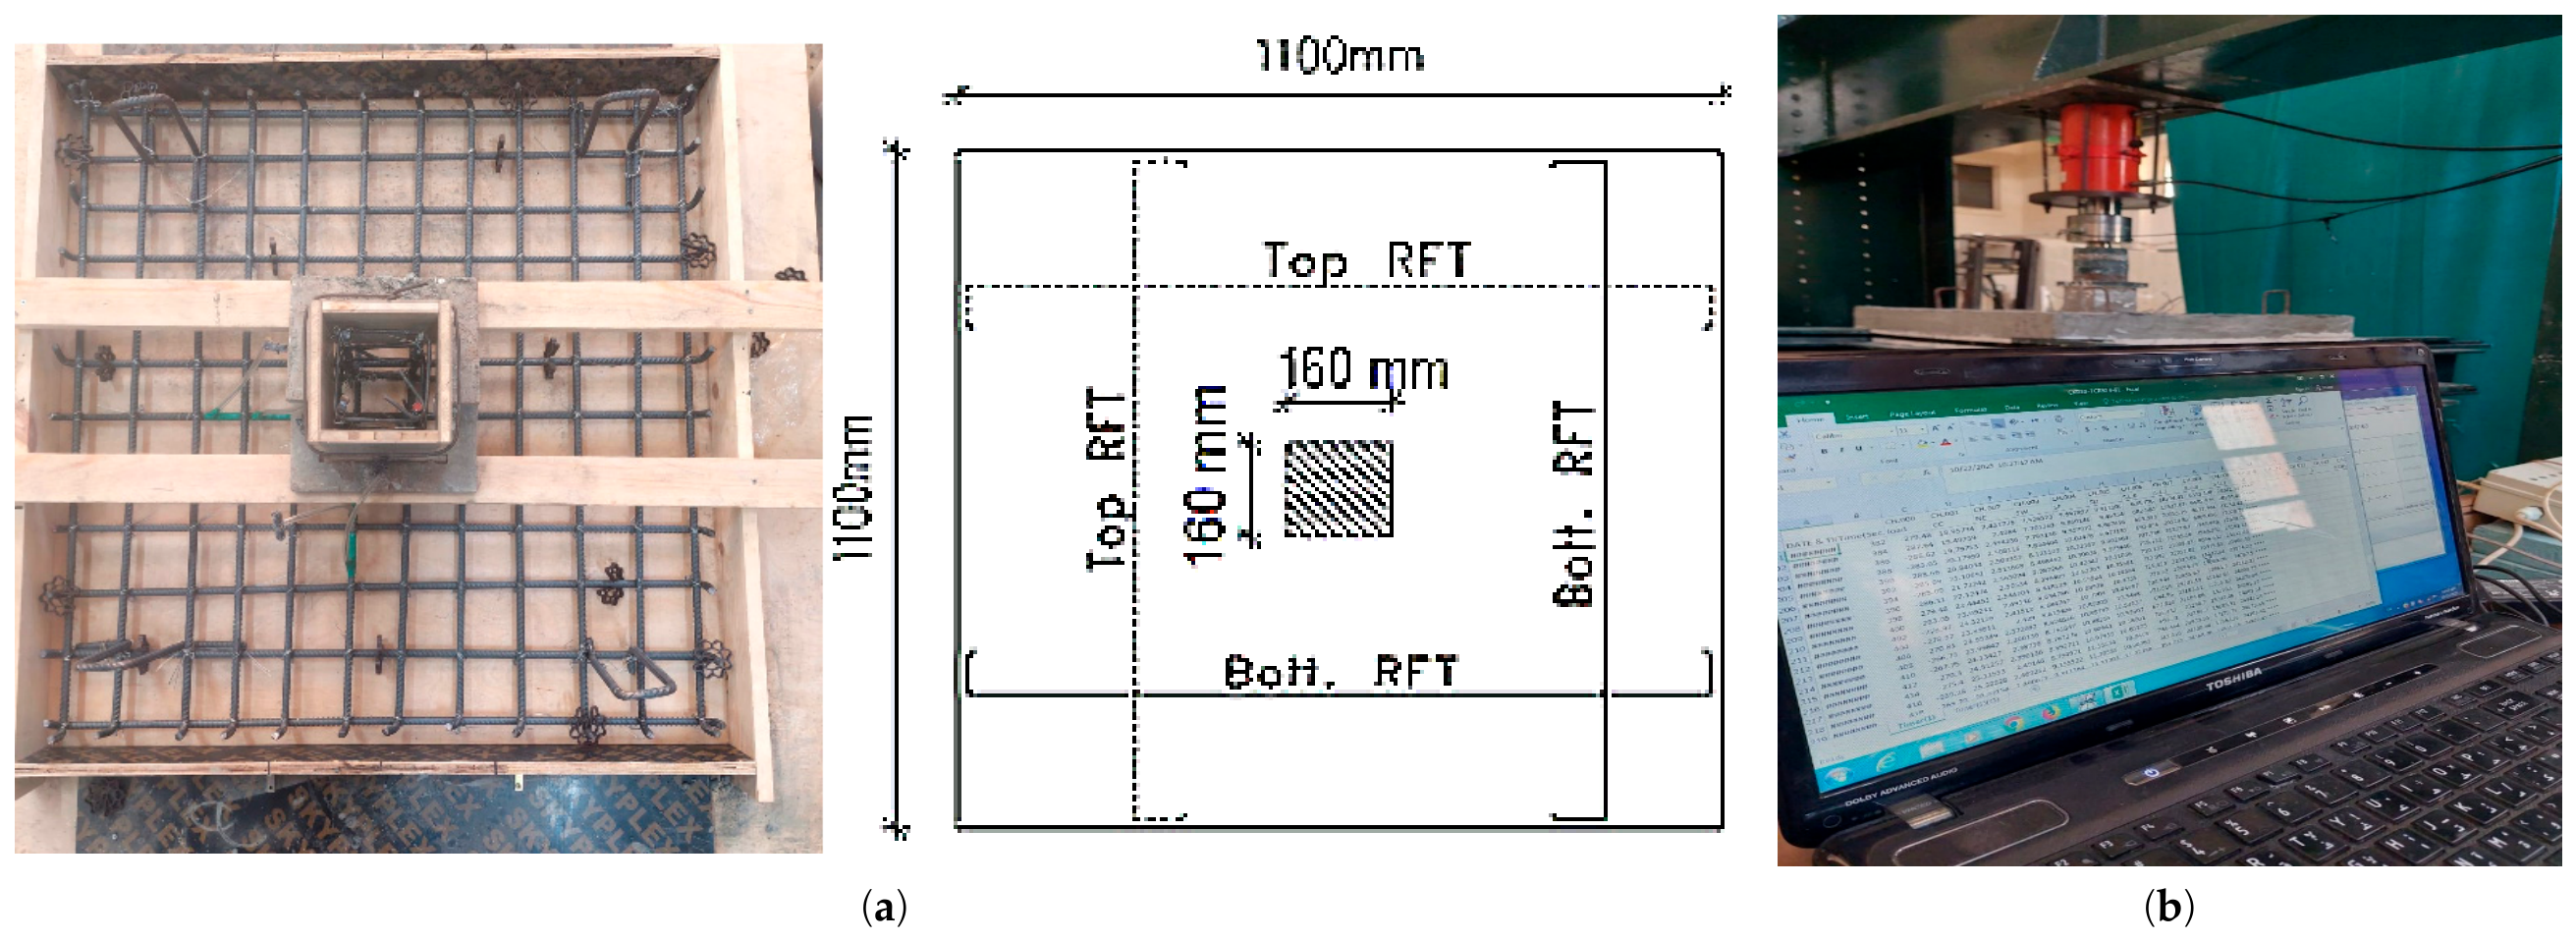
In each group, the change in concrete grade and the effect of compression reinforcement were compared to those of the reference mix, and then the effect of the reinforcement ratio between the three groups was studied. Figure 2a shows typical RFT details and dimensions of the tested slabs.
The quantity and placement of both tension and compression reinforcement were constantly the same for slabs consisting of two layers arranged in three groups. The bars used were 12 mm in diameter and two-way, with top and bottom covers of 200 mm, as shown in Figure 2a. The flexural top and bottom RFT steel used consisted of high-grade deformed bars with a yielding strength of 540 MPa. The ACI standard specified two mean strength values to achieve 50, 65, and 70 MPa characteristic strengths. For each cast group, six cubes of 100 × 100 × 100 mm were sampled from the concrete mixture. On day 7, three cubes were tested, and the remaining were tested on day 28.
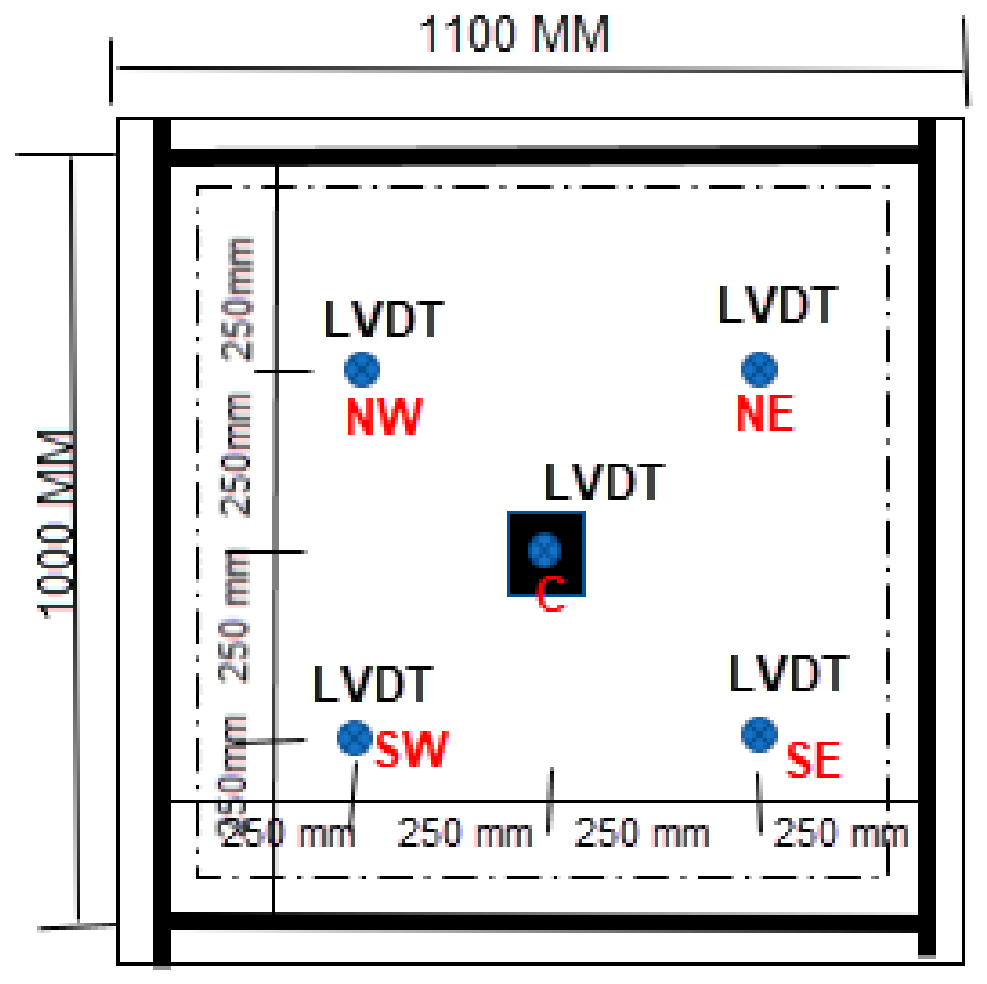
For the slab tests, a load was applied concentrically to the top of the column to induce punching failure. For this purpose, a heavy loading frame was used in which the slabs were supported on all four sides of the loading frame to provide a clear span of 1100 mm, as shown in Figure 2b. To allow rotation at the loading area, the supports were 20 mm diameter rods resting on the steel frame plates. With load increments of 5.0 kN, the hydraulic jack was connected to load cells to monitor the applied load. To ensure a uniformly distributed load on the column surface, a 10 mm thick plate was placed between the loading platen and the column. Deflections at various locations were measured using six linear variable differential transformers (LVDTs). The first LVDT was placed at the center of the slab (under load), the second LVDT was positioned at a distance of 2d (twice the depth) from the face of the column, and the other four LVDTs were installed at distances of 250 mm (both horizontally and vertically) from the center of the slab, directed towards the northeast, northwest, southeast, and southwest, indicating positions between the center of the column and the slab support, as well as directly under the support [51]. Displacements of the slabs were measured using these LVDTs at different loading stages. Figure 3 presents a schematic of the experimental setup. Strains in the flexural tension and compression regions were measured using 10 mm long strain gauges. In all groups, strain gauges were installed on the bottom reinforcement bars at distances d and 2d from the column face and orientated parallel to the slab bending direction. All slab specimens were coated with white paint and marked with a grid pattern to facilitate crack investigation, as will be illustrated by Figure 4.

4. Results and Discussion

This section deals with the influence of CR content (untreated and treated) and CKD content on the punching shear resistance of RC slabs, slump, short- and long-term compressive strength, and flexural strength.

4.1. Failure Mode

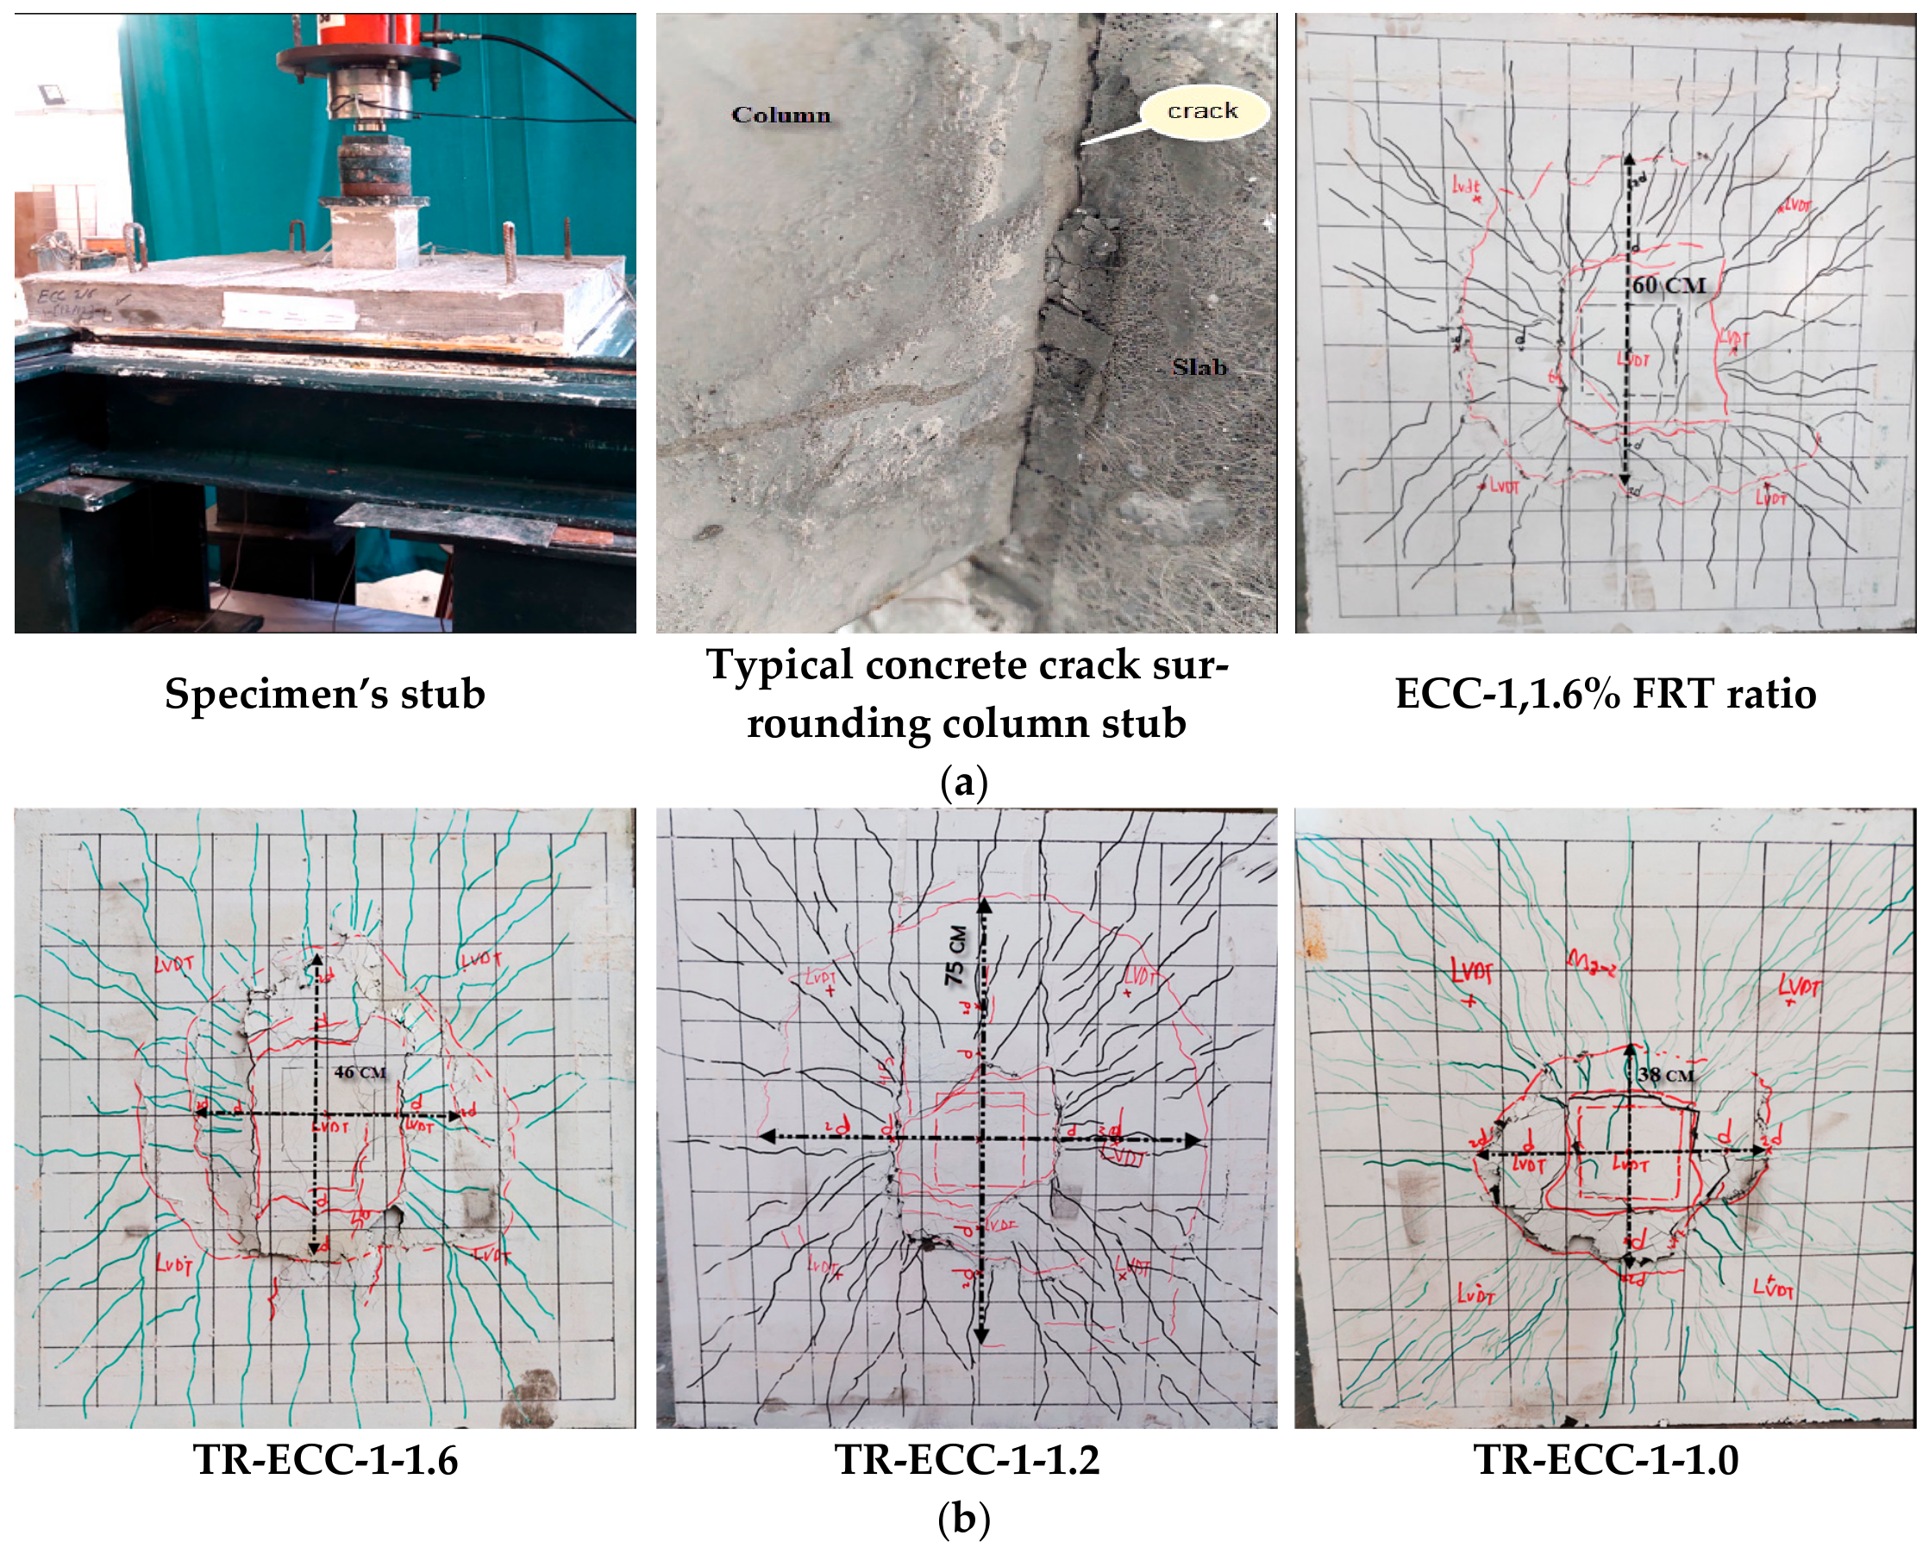
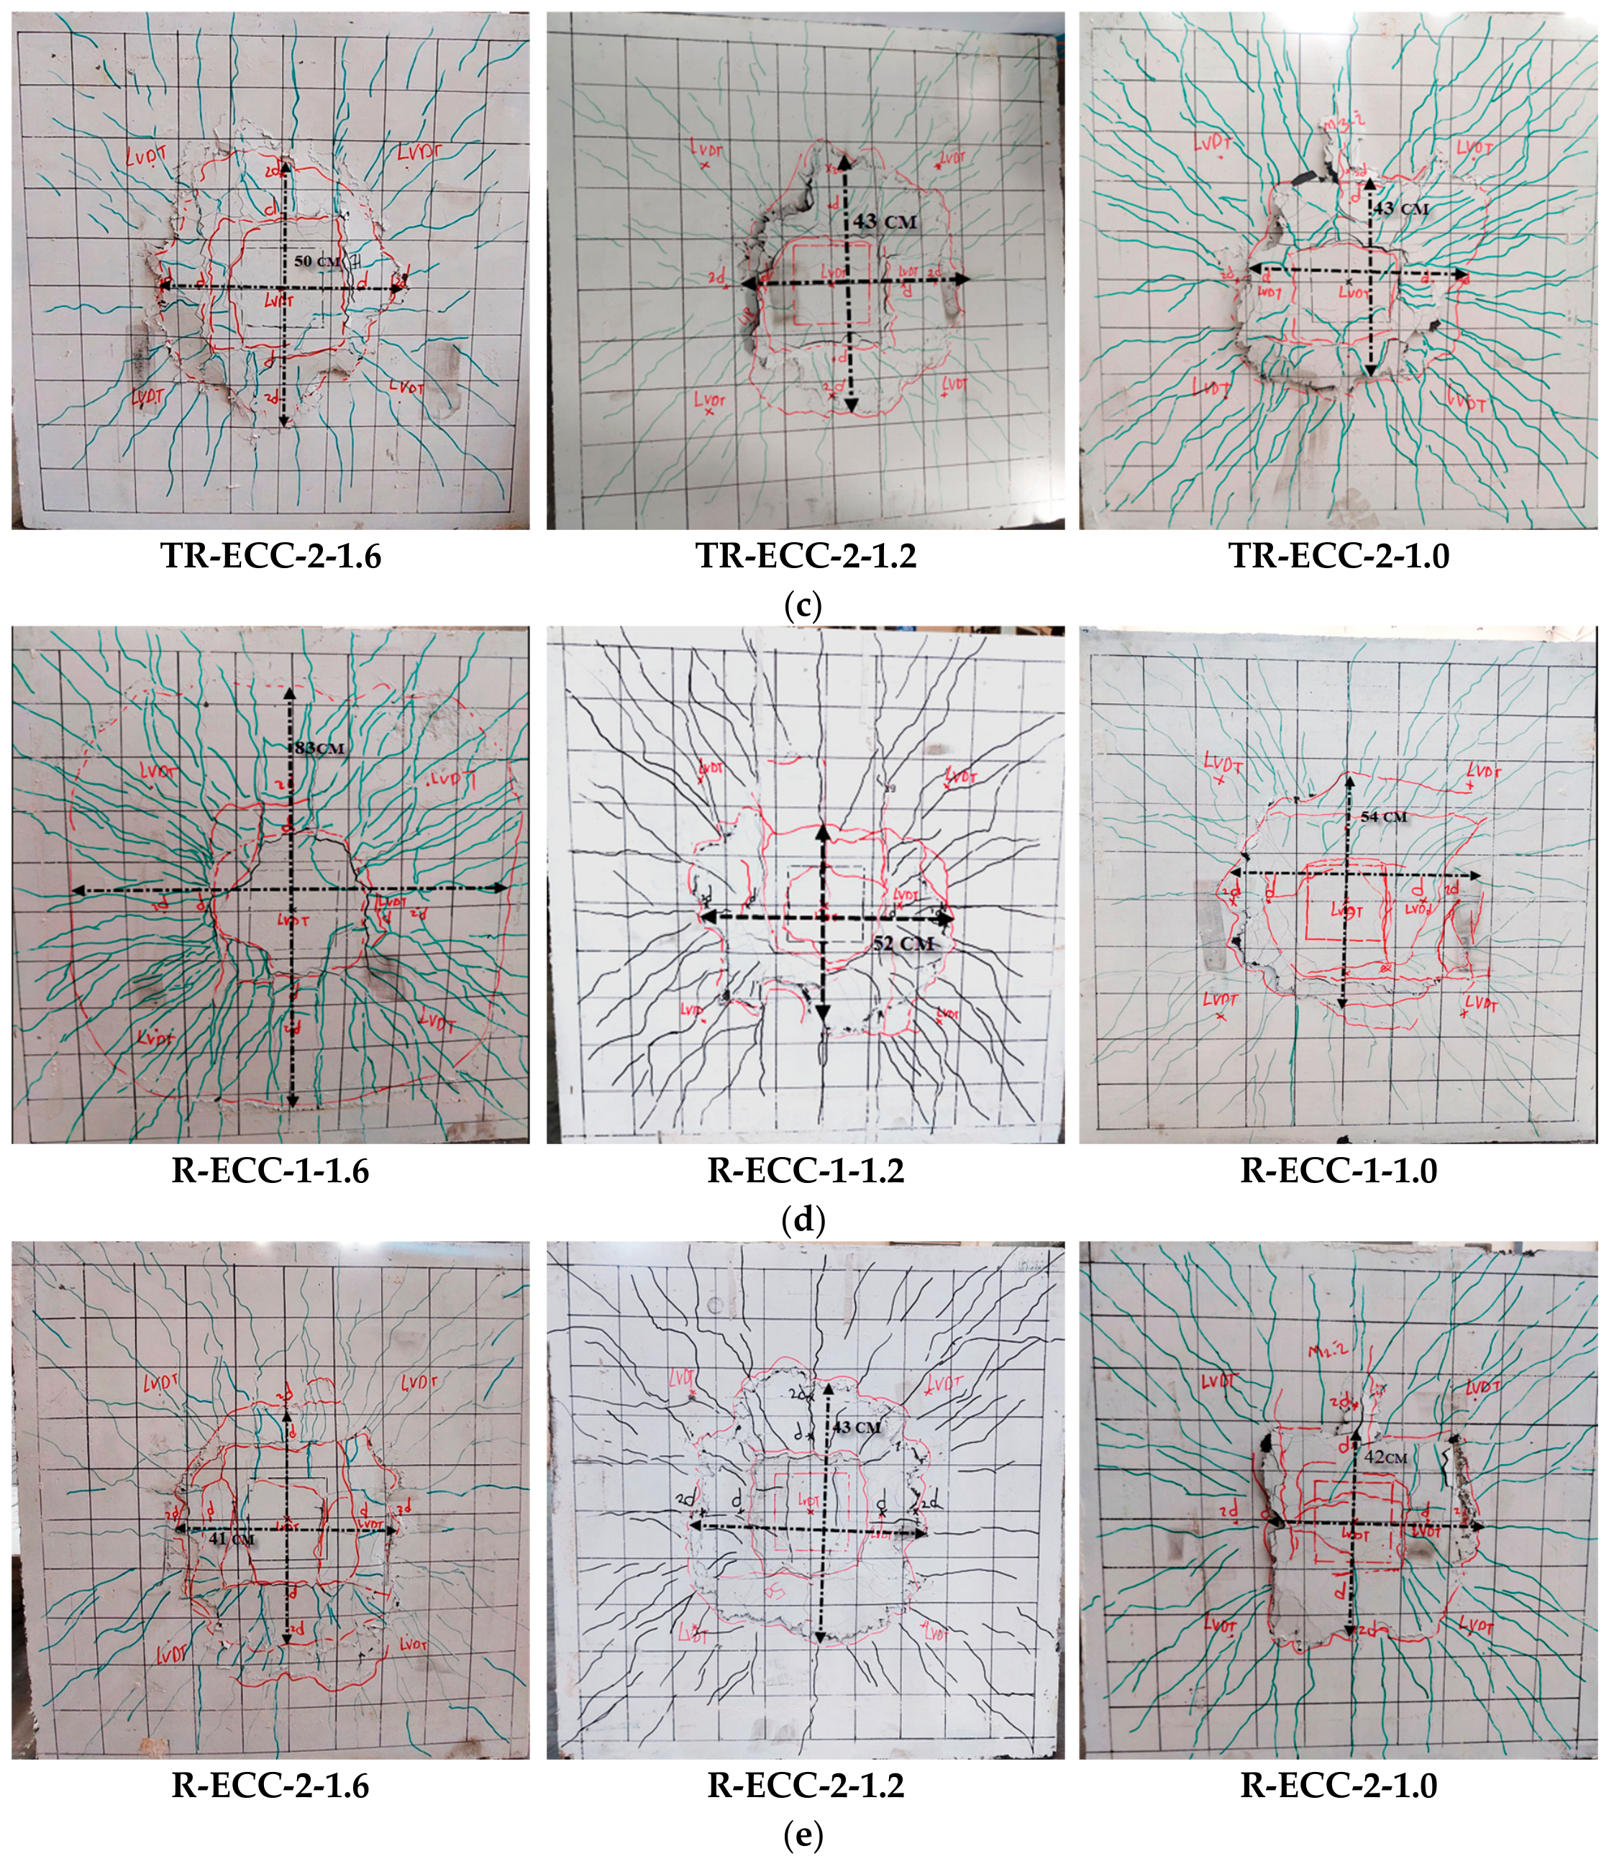
Figure 4 shows the cracks and their patterns in the tested slabs. The control specimen shows brittle shear punching failure, while it changes to a more flexible combination of punching shear and flexural failure in the TR and CR samples. Perpendicular and parallel to the edges of the slabs, the cracks began to appear from the center of the slabs. The first cracking load for the slabs with combined rubber and treated rubber ranged between 45 kN and 50 kN, while that for the reference ECC sample was around 46 kN.
For the ECC specimen, a punching shear failure occurred with localized crushing of the concrete in the compression zone around the column with the following characteristics: (a) At the time of failure, there was no clear deflection of the slabs, and most of the reinforcement did not yield except for a small area near the column perimeter. (b) The punching shear failure caused the formation of a conical area noticeable on the bottom of the slabs through a large annular crack (as shown in Figure 4a). A brittle characteristic synchronized with the occurrence of failure can be observed before the yield point of the slabs.
Figure 4b,d show a common failure in the shear and flexural failure of specimens (CR and TCR) with the following characteristics: (1) Upon failure, a significant flexural deformation of the slabs was observed, and the reinforcement around the column had undergone deformation. (2) With continued loading, many radial cracks appeared on the underside of the panels, extending outward from all around the edge of the loading slab, with an increase in the width of the cracks. (3) In the final phase, the specimens evolved into geometrically variable systems, with the collapse resembling a circle and the appearance and sound of the pulled fibers, as shown in Figure 4b,d. The ductility property during the failure process of engineered cement composite panels, indicating better integrity and a higher energy dissipation capacity, is more pronounced in these samples.
Crack patterns were observed in all tested slabs. As shown in Figure 4b,d, the CR and TR models generally exhibit similar behaviors and trends. However, TCR specimens showed narrower and less widespread cracks compared to CR samples at the same reinforcement ratio. The delayed initiation of cracks and the reduced width of the flexural cracks can be attributed to the higher modulus of elasticity. In addition, no crushing of the concrete was observed on the slab’s compression face.
The failure perimeter generally took on a circular or semi-circular shape in the tested panels. It was noted that in slabs with a relatively raised reinforcement ratio (1.6%) for TCR, the circular perimeter was more prominent, while the other slabs mainly exhibited a semi-circular failure pattern. The perimeter and angle of the punching shear failure can be accurately determined from the failure perimeter on the tensile face of the slabs, which is located at the end of the diagonal cracks extending through the depth of the slab, according to Figure 4. Table 3 shows the failure angles resulting from the hole. An equivalent circle radius was drawn at the observed failure area to determine the critical perimeter location and the failure angle (as shown by the black dashed line in Figure 4). The data indicates a grid type of crack on the underside of the slabs at the column perimeter, spreading towards the edges of the slab due to the flexural moment. Some of the grid cracks spread from the loading area towards the corners of the slab due to the flexural moment. The observed failure mode was affected by the concrete grade. Using higher-strength concrete slightly increased the slab’s resistance, leading to a more flattened shear failure characterized by a reduced inclination angle. Similar results were reported in previous work [52,53]. Regarding reinforcement, the higher the ratio, the lower the failure angle due to an increase in the failure radius and a less steep inclination of the shear cracks. This observation aligns with the results of [54,55]. The average calculated failure position was 3.35d from the column face, which corresponds to a failure angle of 17 degrees.
As the applied load increased, the tangential cracks widened at larger radii. Meanwhile, the radial cracks tended to spread both inward and outward. In general, after cracking and near failure, the load showed repeated decreases, and the slab’s vertical displacement increased markedly once the slabs failed. Large and widespread cracks lead to the movement of the cut concrete cone surrounding the column during the final failure. No noticeable cracks appeared on the upper compressed face of the reinforced concrete. The crack around the perimeter of the column caused it to separate from the cut concrete cone at the slab, as shown in Figure 4d, indicating the displayed crack patterns, due to an increase in the ratio of tensile reinforcement and a significant decrease in the intensity and width of the crack [56], and this effect was not related to the presence or absence of compressive reinforcement or changes in fcu.
Altering the flexural compression RFT produced no noticeable change in the cracking patterns of the tested slabs [57]. This result was observed in the crack patterns of the TR-ECC-2-1.2, TR-ECC-2-1.6, R-ECC-2-1.2, and R-ECC-2-1.6 specimens, regardless of the increase in fcu.
As shown in Figure 4, after the micro-cracks, peripheral cracks formed connecting them at a distance of approximately 200–375 mm from the center of the slab. These fissures manifested at the peak load of the slabs, causing a cone of fracture around the load center and leading to the final failure of the samples. All the samples failed due to shear punching resulting from the hole, noted on the tensile face of the slabs.
The ECC mixture showed a critical punching shear crack angle of 19 degrees. When crumb rubber was added, this critical angle increased to approximately 19 to 22 degrees with tension reinforcement and to a range of 20 to 30 degrees in the sample with compression reinforcement.
Adding treated crumb rubber raised the critical punching shear crack angle to about 20 to 34 degrees in specimens with tension reinforcement and to approximately 23 to 28 degrees in specimens containing compression reinforcement. The key quantitative findings from the study are presented in Table 4.
In the above table, Pcr = first cracking load; Py = yield load; Pp = peak load; Pu = ultimate load, which is 80% of the peak load; Δcr = central displacement at Pcr; Δy = central displacement at Py; Δp = central displacement at Pp; Δu = central displacement at Pu; PS = punching shear failure; and F = flexural failure.

4.2. Load–Deflection Behavior

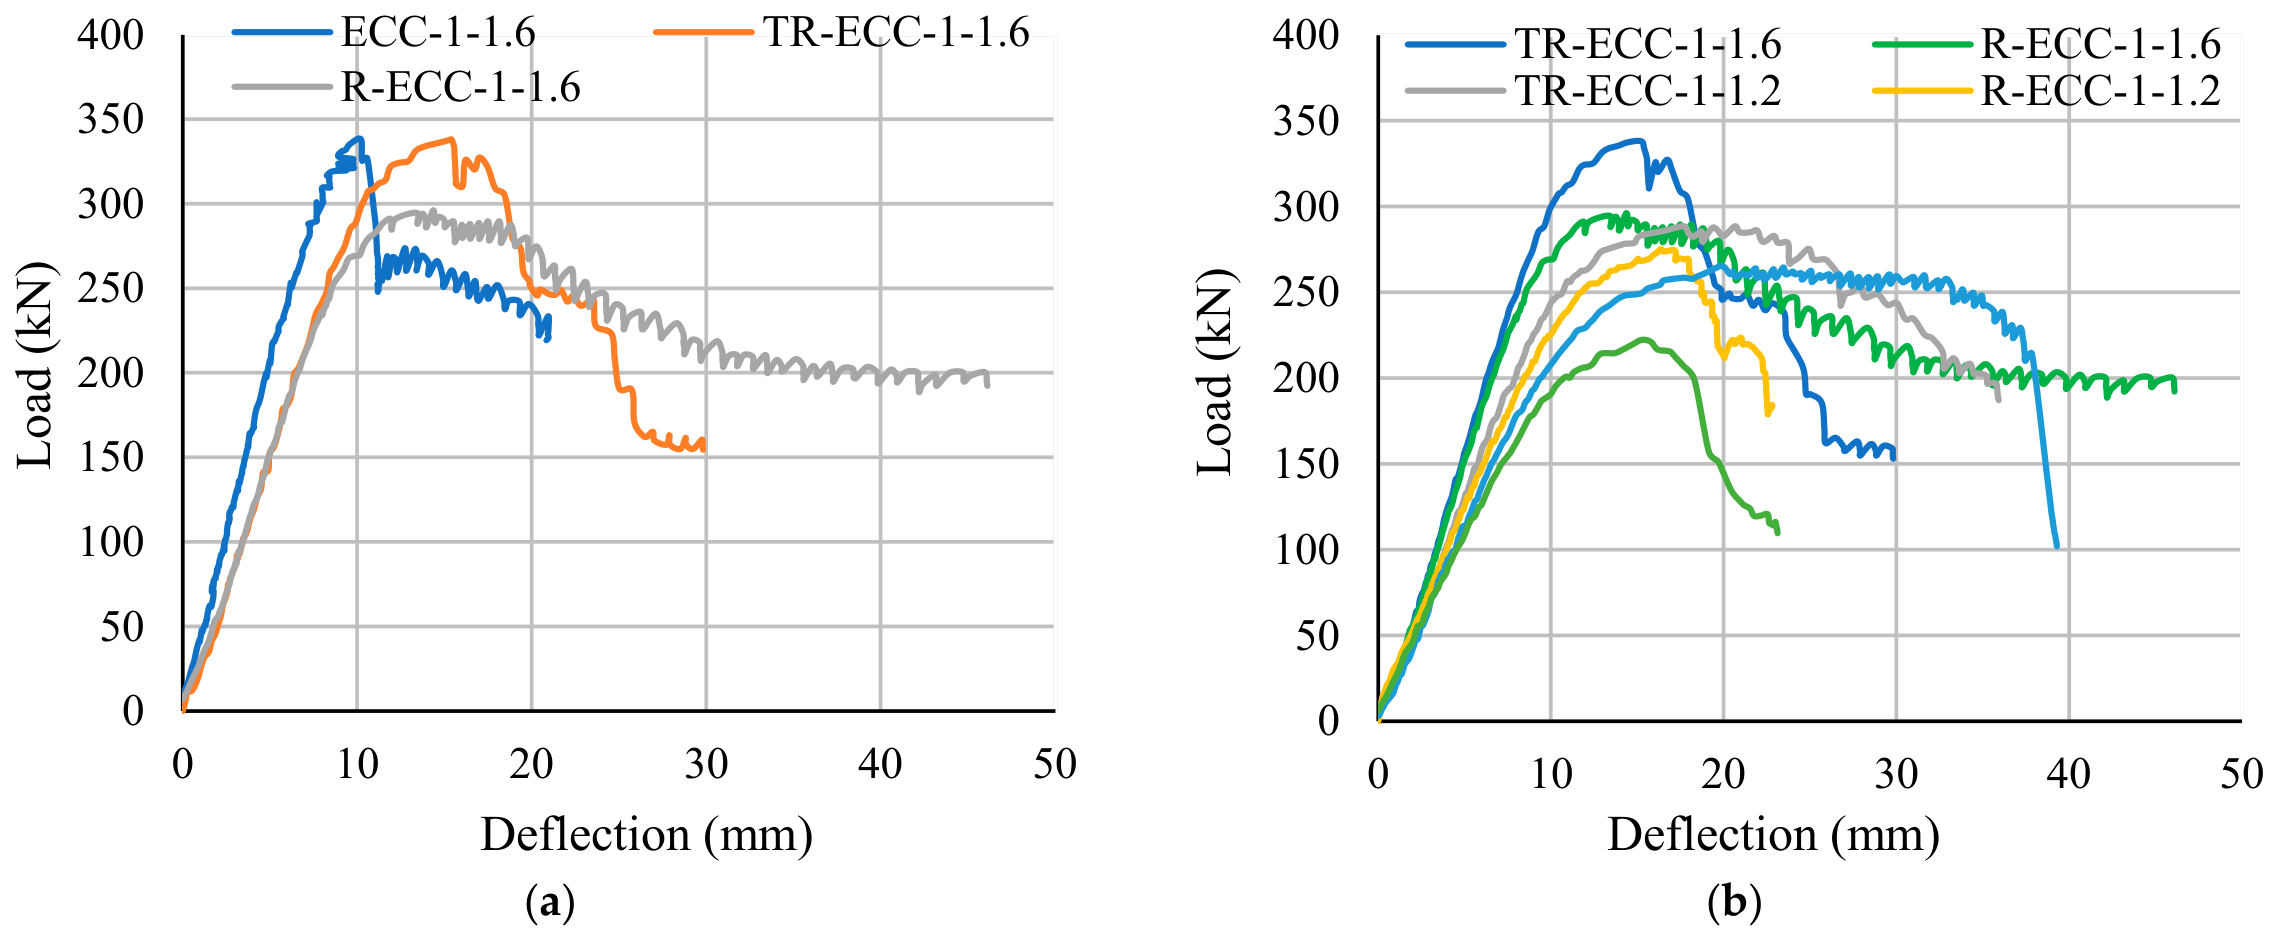
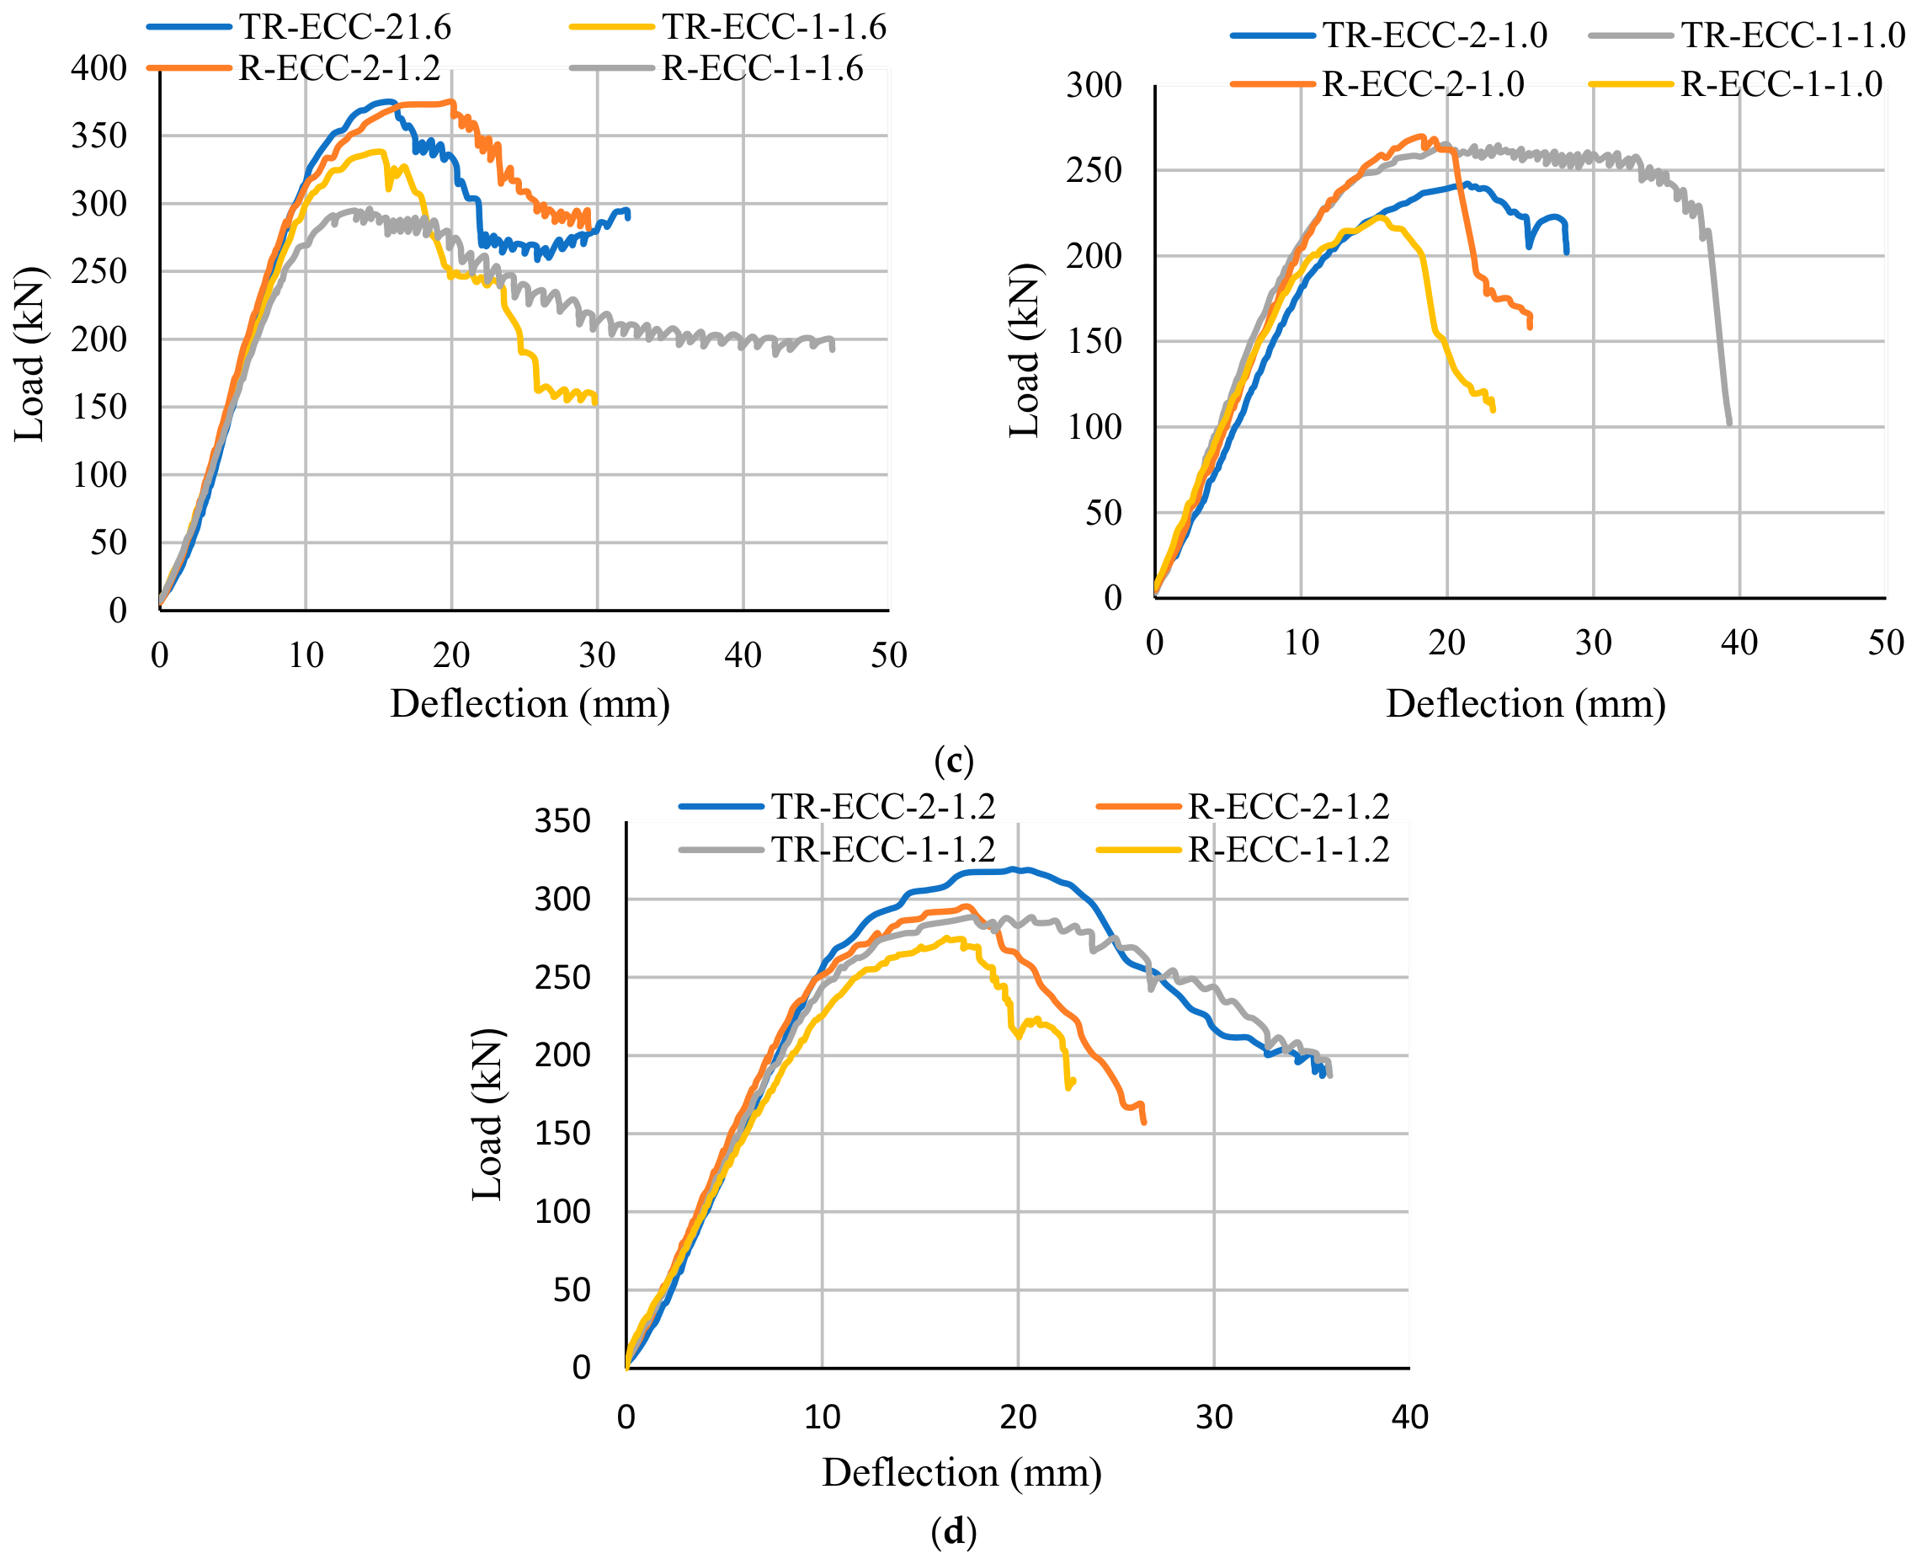
Figure 5 illustrates how the applied load relates to the mid-span deflection of the tested slabs. Overall, all specimens exhibit a bilinear response: the initial stiffness (ki) corresponds to the first slope of the curve, while the post-cracking stiffness (kp) is reflected by the second slope.
Table 5 shows the initial cracking loads, ultimate loads, and deflection, from which the initial stiffness of the uncracked section and post-cracking stiffness were determined. The reference concrete samples with a strength of 70 MPa exhibited greater initial stiffness due to the higher elastic modulus.
However, the average initial stiffness values were almost identical for the R-ECC and TR-ECC specimens, which can be attributed to the fact that the modulus of elasticity (EC) for fcu = 50 MPa is close to the modulus of elasticity for fcu = 65 MPa, where it was 30.4 MPa for the fcu = 50 MPa group, calculated using Equation (1) [58], and 34 MPa for the fcu = 65 MPa sample, calculated using Equation (1). Additionally, several other factors can cause some variation in the initial stiffness, such as the sample placement, manufacturing defects, and handling processes.
E C = 4700 f c 0.5  
where f′c denotes the concrete compressive strength measured in MPa. The initial stiffness also escalates with the tension reinforcement ratio. Augmenting the tension reinforcement ratio by 60%, with reference to specimens TR-ECC-1-1.6 and TR-ECC-1-1.0, yielded an approximately 31% enhancement in initial stiffness, while doubling (tension and compression) the reinforcement ratio (from TR-ECC-2-1.6 to TR-ECC-2-1.0) led to about a 43% increase in initial stiffness. Conversely, the reinforcement ratio barely affected the initial stiffness of the R-ECC specimens.
However, post-cracking stiffness is mainly governed by the tension reinforcement ratio. Increasing the reinforcement ratio leads to a marked rise in post-cracking stiffness. For example, raising the reinforcement ratio by 60% (from 1.0 to 1.6) produced approximately a 70% increase when comparing specimens TR-ECC-1-1.0 and TR-ECC-1-1.6. A similar increase was observed for specimens R-ECC-1-1.0 and R-ECC-1-1.6, where post-cracking stiffness increased by about 47%, while augmenting the compression reinforcement ratio from 1.0 to 1.6% with tensile reinforcement at the same ratio contributed to an increase of 100% and 23% in post-cracking stiffness when comparing specimen TR-ECC-2-1.6 and R-ECC-2-1.6 with specimens TR-ECC-2-1.0 and R-ECC-2-1.0, respectively.
A tendency similar to that observed in the samples in Group C was noted (1.2% tension RFT), but the enhancement in post-cracking stiffness was less significant. Specimens TR-ECC-1-1.2 and RECC-1-1.2 showed an increase in the reinforcement ratio, resulting in about 22.4% and 11% increases in post-cracking stiffness, respectively, compared to the TR-ECC-1-1.0 and R-ECC-1-1.0 specimens. Nevertheless, the strength of concrete positively influences post-cracking stiffness.
ECC tends to exhibit lower strength after cracking because its denser microstructure leads to more brittle behavior. This brittleness is visible in the stress–strain response of HSC, where the ascending branch is steeper and the stress drops more sharply immediately after the peak [14].
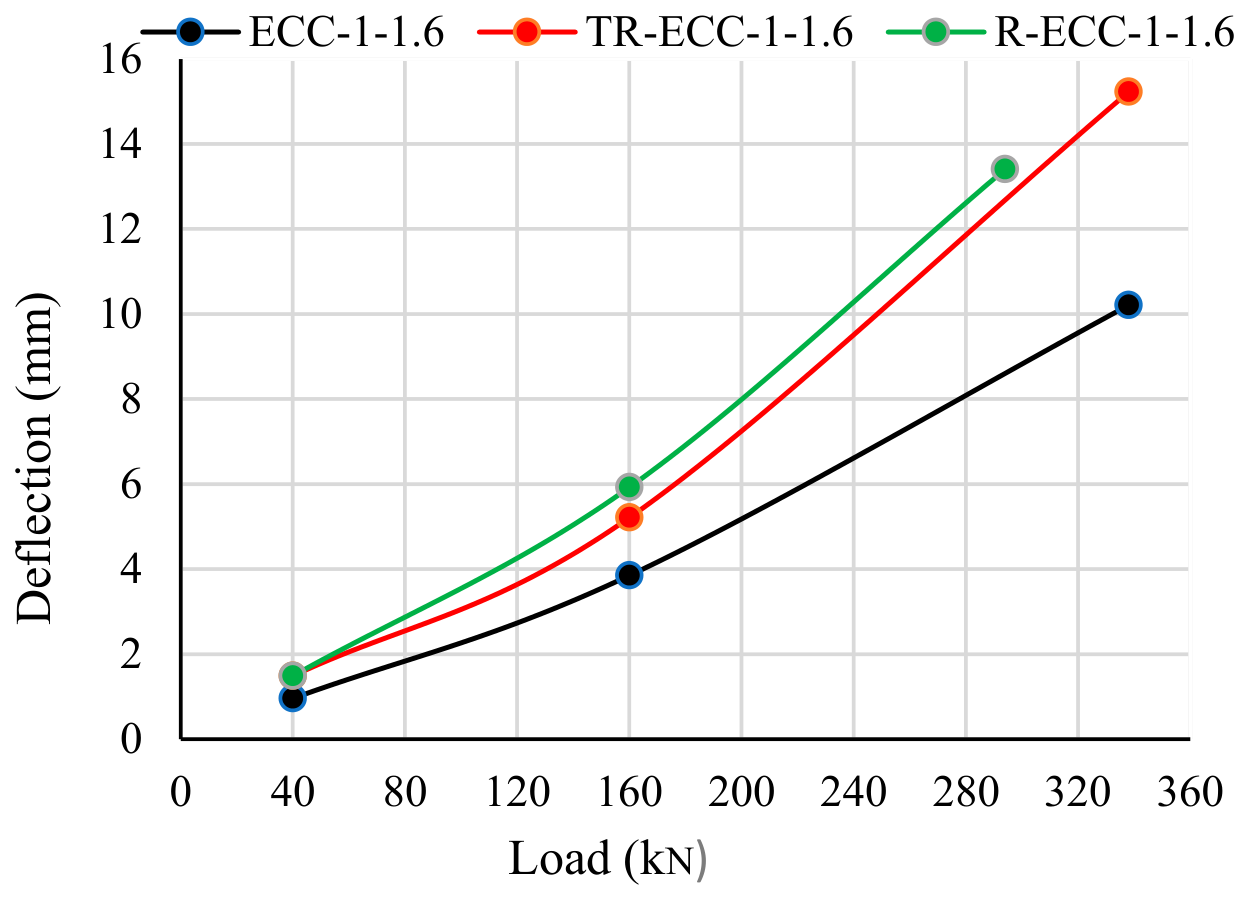
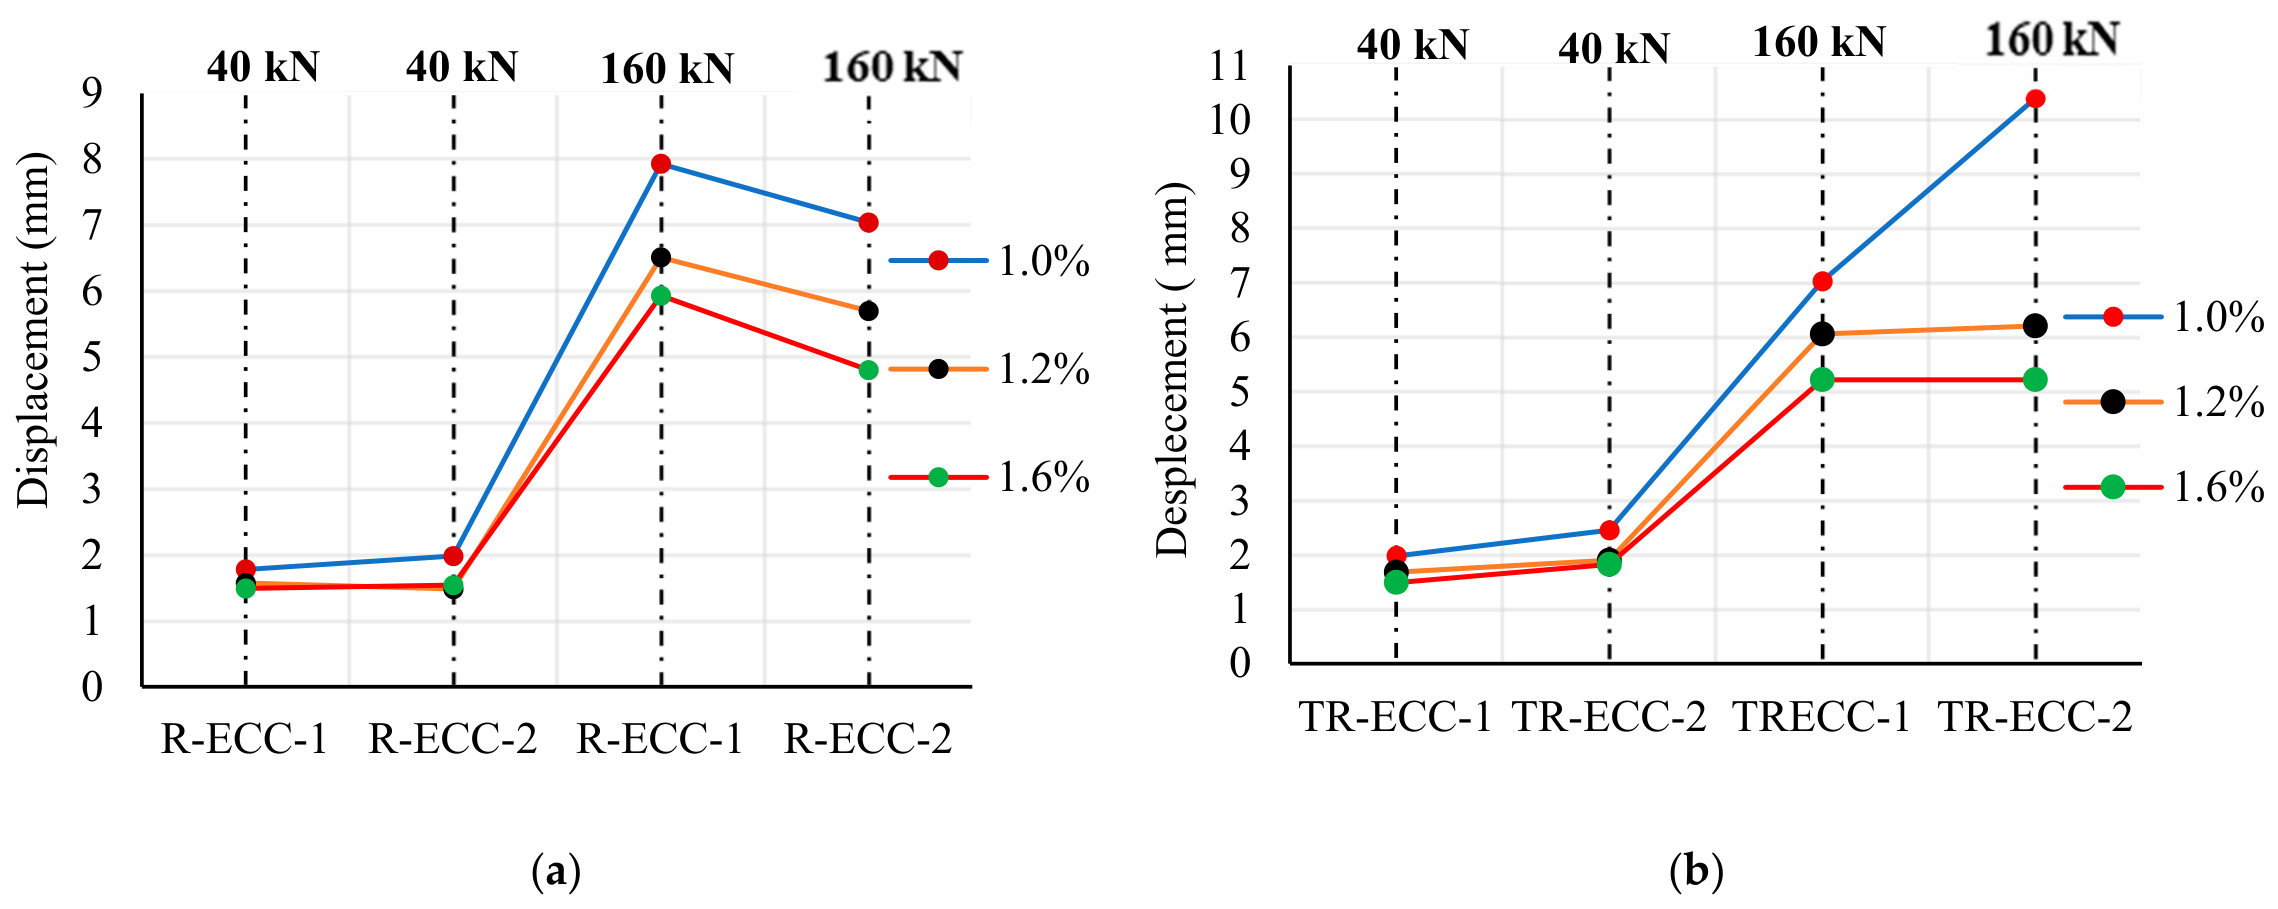
A comparison of deflection values at equivalent load levels for various concrete strengths and at the same reinforcement ratios reveals that the variation in concrete grade has no clear impact on the value of deflection before cracking, Meanwhile, greater reinforcement ratios consistently result in reduced deflection. This behavior agrees with the results presented by Hassan et al. [59]. In the reference specimen (ECC-1-1.6), the displacement was 3.85 and 6.25 mm at 40 and 160 kN, respectively. In contrast, the displacement was 5.22 and 7.63 mm for the TR-ECC-1-1.6 slab and 5.93 and 8.19 mm for the R-ECC-1-1.6 slab, respectively, under the same loads; see Figure 6.
Raising the tension reinforcement ratio by 33% (from 1.0 to 1.2%) resulted in an approximately 17.8% decrease in deviation, while raising the reinforcement ratio (from 1.0 to 1.6%) resulted in about a 35% reduction in deviation. As expected, increasing the T-RFT from 1.0 to 1.2% (by 33%) for the TR-ECC-1 specimen lowered the deviation by 18%. Increasing the reinforcement ratio from 1.0 to 1.6% (by 21.5%) lowered the deviation by 21.5%. For the R-ECC-1 concrete sample, the sample treated with cement kiln dust showed approximately 50% less deviation in comparison to the sample with unprocessed rubber at the same reinforcement ratio.
Figure 7 illustrates the load–deflection relationship for TR-ECC-2 and R-ECC-2 with different ratios of compression reinforcement. For the TR-ECC-2 specimens, increasing the C-RFT by 60% (from 1.0 to 1.6%) resulted in 35% and 85% reductions in deflection at loads of 40 and 160 kN, respectively. These reductions indicate that the effectiveness of the compression steel in the post-cracking stage is raised, although less pronounced than those observed in the R-ECC-2 specimens. Additionally, the use of compression reinforcement in the TR-ECC specimens led to about a 22% reduction in deflection compared to those without compression reinforcement at the same ratio.
Table 4 summarizes the punching shear capacity, associated deflection, and normalized stresses measured for the distance (d) from the column face for the examined specimens. The results show a consistent pattern: increasing the reinforcement ratio raises the punching shear capacity for all specimens, independently of the concrete strength. When the reinforcement ratio was raised from 1.0% to 1.6%, the punching shear capacity increased by 33% for a concrete nominal strength of 50 MPa and by 27.5% for a concrete nominal strength of 65 MPa. Further increasing the compression reinforcement ratio from 1.0% to 1.6% led to even greater improvements in punching shear capacity, increasing it by approximately 50.8% and 39% for the two corresponding nominal concrete strengths.
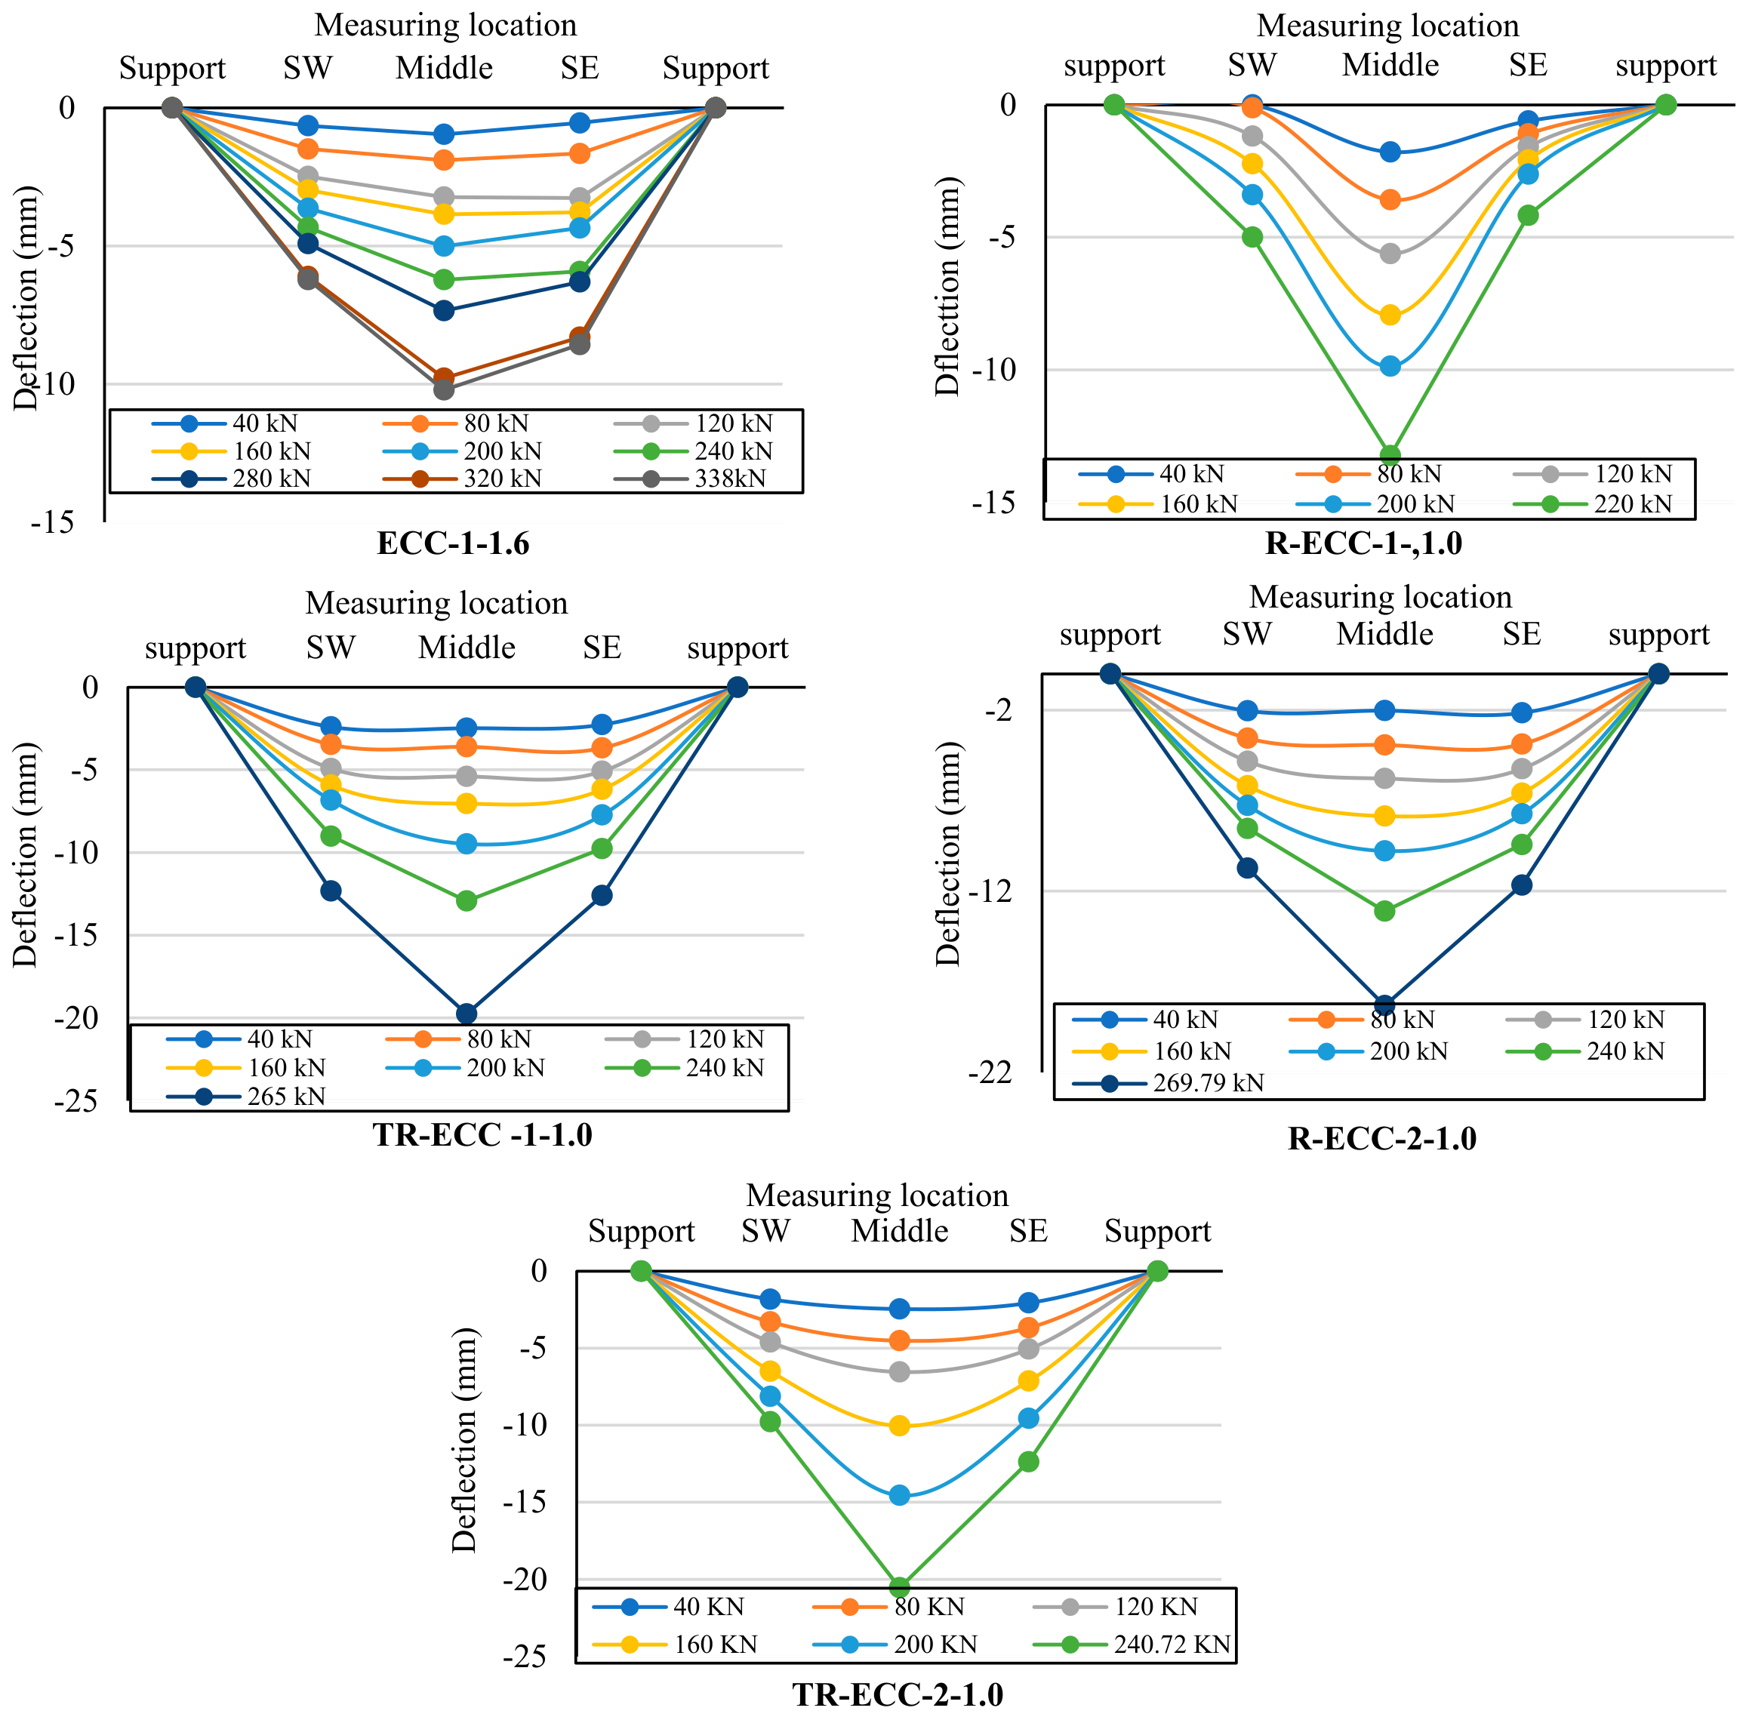
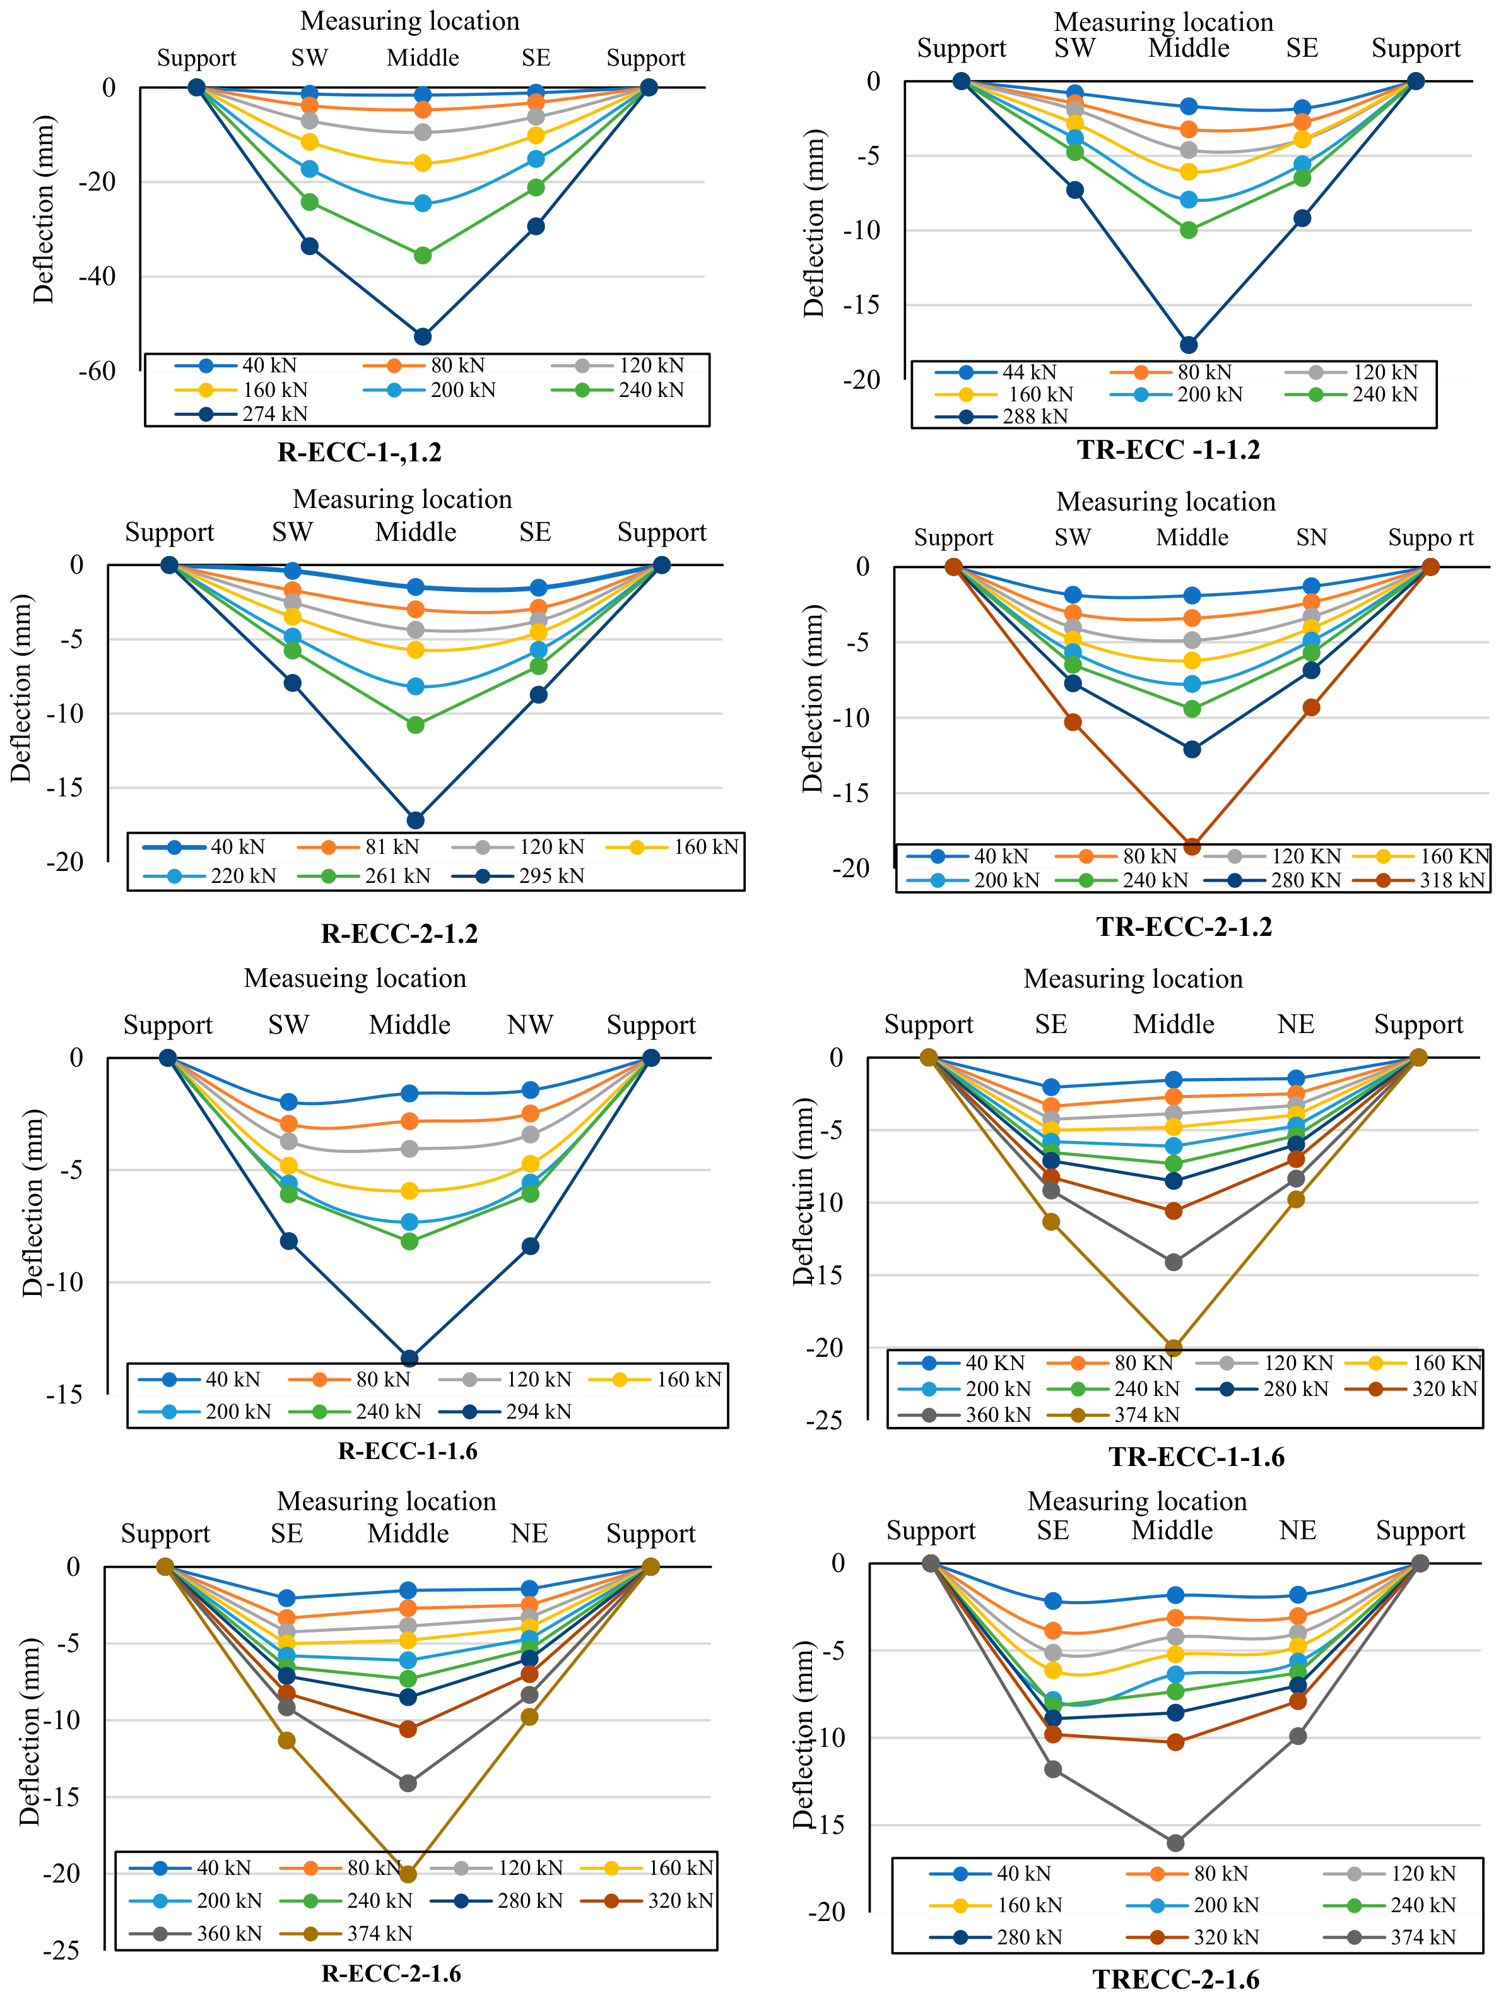
As shown in Figure 3, at five distinct places designated “NE, NW, middle, SE, and SW,” LVDTs were installed on the underside of the two-way slabs. Figure 8 shows the deflections at the aforementioned distributions with an increase in load of 40 kN up to the maximum load. From the figure, it can be seen that with the increase in the applied load, the deflection in the slabs increases in a regular and symmetrical manner around the center of the slabs or the load, except for specimen TR-ECC-2,1.6, where the initial appearance of flexural cracks in the sample began, leading to the emergence of irregular deflection symmetry around the center of the slabs.
Higher deflection values were measured in the most heavily damaged regions of the specimens. Overall, for every slab, the largest deflections occurred at the center, and the type of concrete or the reinforcement ratios, whether tensile or compressive, did not affect this. On the other hand, the panels containing rubber exhibited relatively high deformations due to their high elasticity ratio, while the slabs containing treated rubber were closer to the reference specimen, showing improvements in crack patterns, distribution, and flexibility under load, as observed in the comparison of deformation under punching shear load.

4.3. First Cracking Load

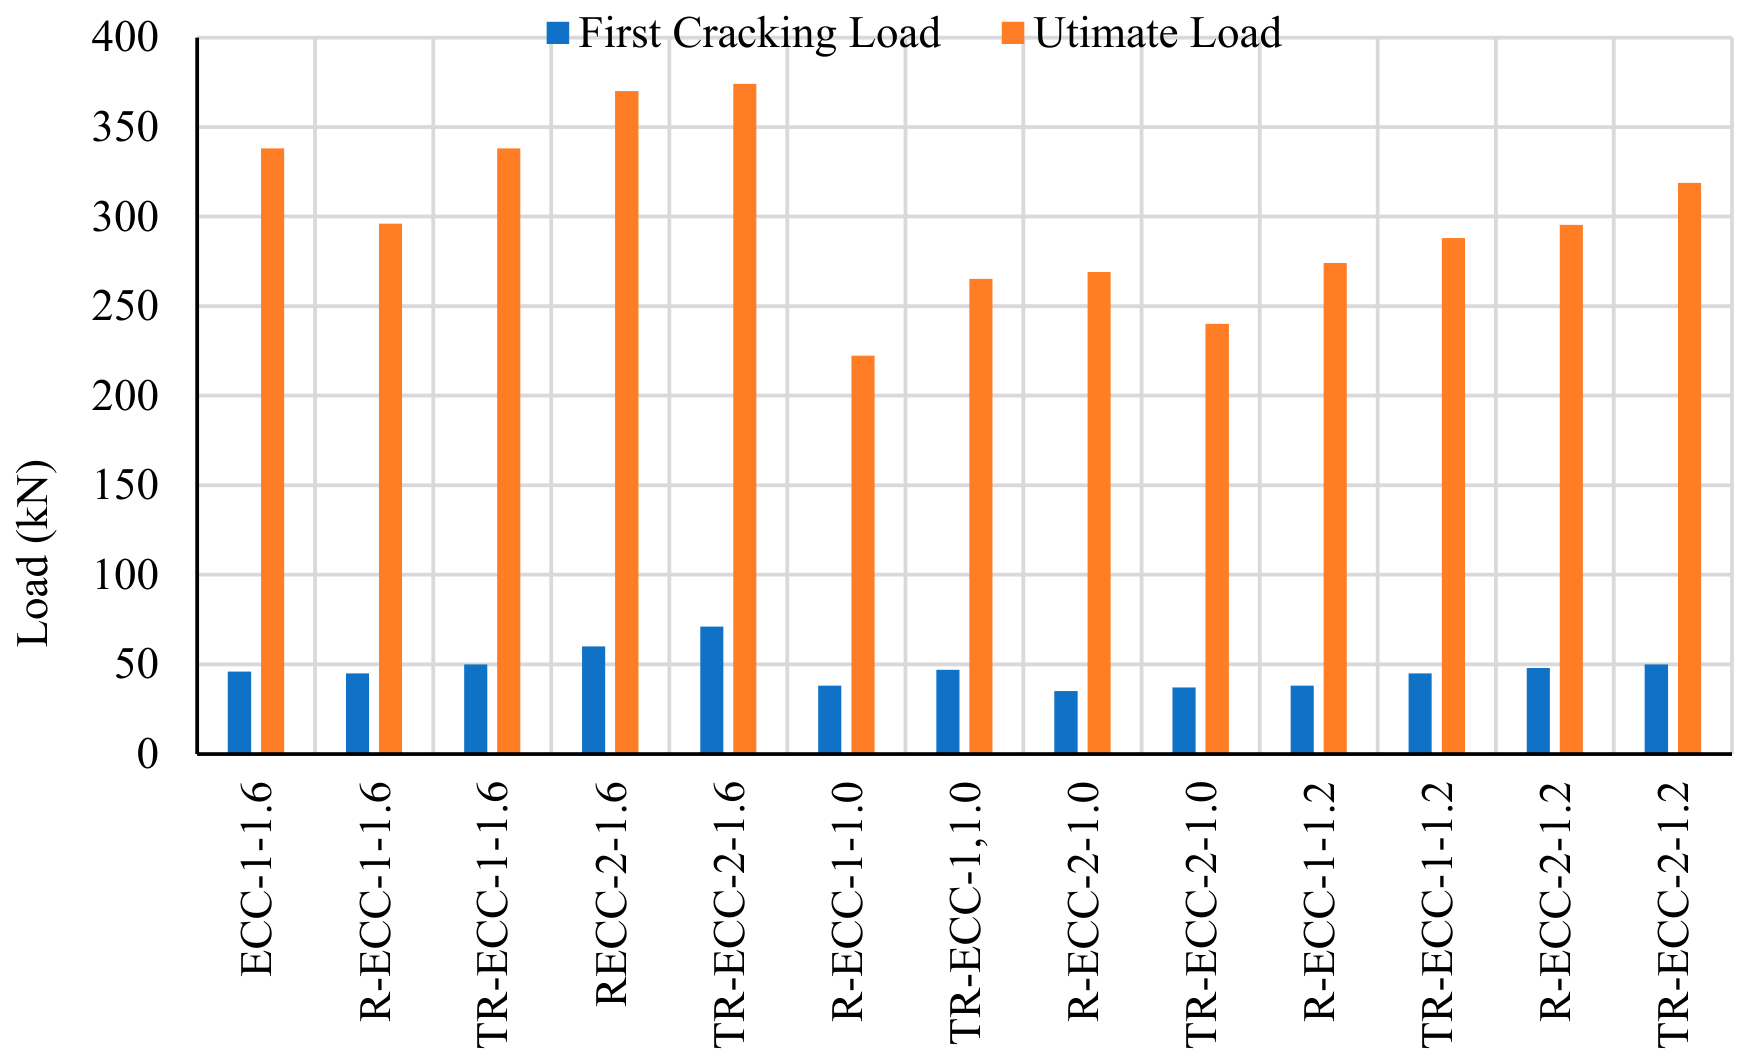
During the tests, the first cracking load of each specimen was identified and recorded, as shown in Table 4 and Figure 9. For all slabs, this load ranged from 35 to 71 kN, depending on the specific parameters used in each slab. For the fcu of 50 and 65 MPa, as the T-RFT ratio increased from 1.0 to 1.6%, the cracking load rose by 18.5% and 11.12%, respectively. In the second group, which included compression reinforcement, a comparable trend was observed: the first cracking load increased by 42% for slabs TR-ECC-2-1.6 and by 33% for R-ECC-2-1.6 when compared with R-ECC-1-1.6 and R-ECC-1-1.6, respectively. For the specimens with 1.2% tension reinforcement, the first cracking load increased by 6.5% and 28% for slabs TR-ECC-2-1.2 and R-ECC-2-1.2 compared to R-ECC-1-1.2 and R-ECC-1-1.2, respectively. Hence, as found in previous research [51,52,53,54,55,60,61], in summary, increasing the tensile RFT ratio improved the first-cracking load for all specimens, independently of whether compression reinforcement was present and regardless of the fcu value used. However, when the reference mix with fcu = 70 MPa (without additives) was considered, this increase in the first cracking load diminished, while the rubber treated with CKD improved the first cracking load, indicating the elongation acquired from the rubber. The use of C-RFT with lower ratios did not have a significant impact on the first cracking load of the tested slabs, as reported by Said et al. [57].

4.4. Ultimate Load

The ultimate load measured for each tested slab, under the effects of the parameters considered, is presented in Figure 9. Obviously, for the TR-ECC-1 specimens (with no compression RFT), increasing the T- RFT ratio from 1.0 to 1.2 and 1.6% increased the ultimate load by 8.5 and 46.3%, respectively. Correspondingly, the ultimate deflection decreased by 10.7% and 23%, respectively. For the R-ECC-1 specimens, the ultimate punching load increased by 23.25% for R-ECC-1-1.2 and by 33.15% for R-ECC-50-1-1.6 when compared with R-ECC-1-1.0, corresponding to increases in the tension RFT ratio from 1.0% to 1.2% and 1.6%, respectively. The effect of compression reinforcement (C-RFT) on punching shear behavior shown in Figure 5 was then examined by plotting the results for the TR-ECC specimens to assess how the compression RFT ratio influenced the tested slabs.
According to Figure 9, increasing the compression RFT ratio from 1.0% to 1.2% and 1.6% resulted in an increase of 32.8% in the maximum punching load for TR-ECC-2,1.2 and 55.8% for TR-ECC-2-1.6 compared to TR-ECC-2-1.0. Also, the corresponding deflection of TR-ECC-2-1.2 and TR-ECC-2-1.6 decreased by 1.0 and 25.24% compared to TR-ECC-2-1.0, respectively. As shown in Figure 5, for the specimens with fcu = 50 MPa and compression RFT, the maximum punching load was augmented by 9.7% for R-ECC-2-1.2 and by 37.39% for R-ECC-2-1.6, compared to R-ECC-2-1.0, upon raising the compression reinforcement ratio from 0.1% to 0.12% and 0.16%, respectively.
Similarly, the related deflection of R-ECC-2-1.2 increased by 6.57% and that of R-ECC-2-1.6 decreased by 9.44% relative to R-ECC-2-1.0. It was also found that the compression RFT ratio affected the punching shear response of the slabs more than the tension RFT ratio, which is consistent with outcomes reported in earlier studies [57,62]. To evaluate the influence of adding compression reinforcement, comparisons were made between the TR-ECC-1 and TR-ECC-2 specimens, as well as between the R-ECC-1 and R-ECC-2 specimens. The findings indicated an increase in punching shear capability of 10.6% for TR-ECC-2-1.6 compared with TR-ECC-1-1.6 and a 10.4% increase for TR-ECC-2-1.2 compared with TR-ECC-1-1.2. In addition, the ultimate deflection decreased: it dropped by 4.5% for TR-ECC-2-1.0, by 16.3% for TR-ECC-2-1.2, and by 7.6% for TR-ECC-2-0.16 relative to TR-ECC-1-1.0, TR-ECC-1-1.2, and TR-ECC-1-1.6, respectively.
It may be established that augmenting the longitudinal tensile reinforcement ratio in bending (RFT) effectively increased the slab’s ultimate punching load and reduced the associated deflections, in agreement with results reported by several researchers [56,57]. It was also observed that a 50% ratio of rubber treated with cement kiln dust improved the mix properties and provided the same load-bearing capacity as the reference specimen, and the compression reinforcement had a slight effect on the punching shear behavior of the tested slabs compared to the tension reinforcement ratio. This outcome was also reported by previous research [56,62].

4.5. Estimate Slab Moment Capacity

The yield line theory (a lower-bound theory) is commonly used to measure the moment capacity (M) of CR flat-plate slabs [63]. Both the measured yield strength of the flexural reinforcing bars and the compression strength of the concrete cylinders were considered. This form of analysis assumes that punching shear does not control the slab’s overall strength. Consequently, the flexural ultimate load, Pf, was identified using the associated default working principle with the loads acting along the yield lines and is expressed as
P f = K × M
K = 8 s a C 0.172
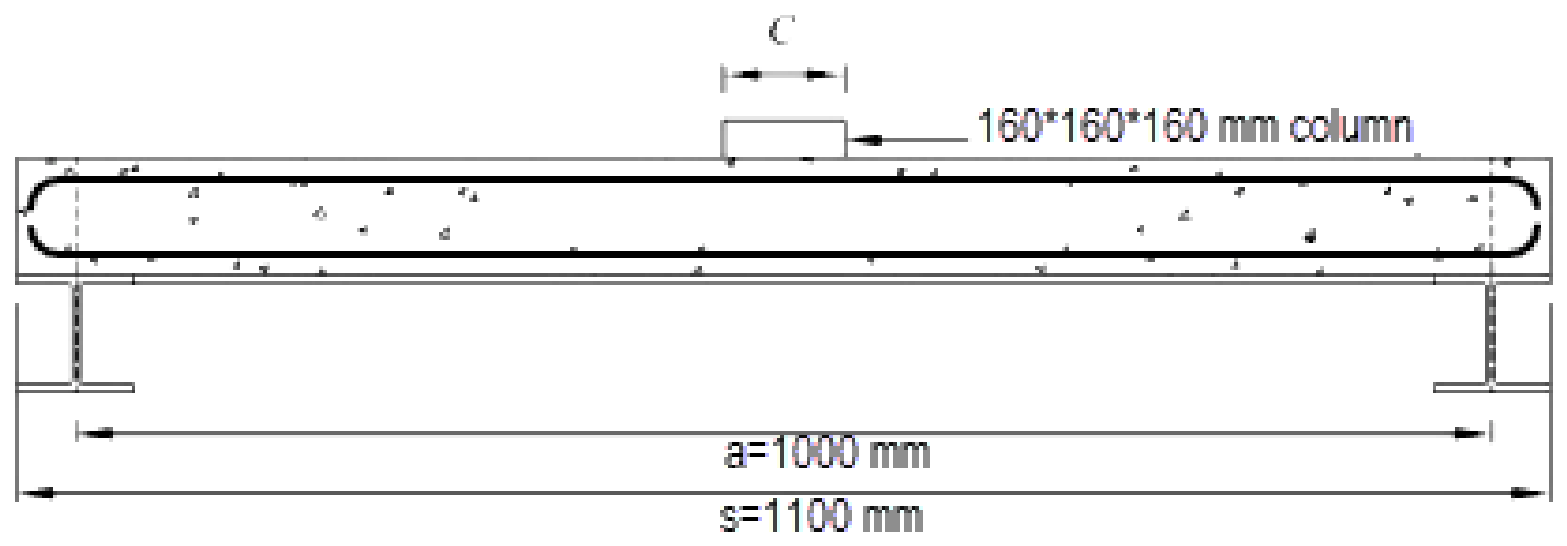
where s represents a side dimension of the square slab, a denotes the span length between the supports, and C is the side dimension of the square column illustrated in Figure 10. The moment capacity, M, per unit length was determined using the ultimate limit state design approach [64] (neglecting safety factors for both concrete and steel) as follows:
M = ρ f y k b d 2 1 0.59 ρ f y k f c k
where ρ denotes the flexural tension reinforcement ratio, fyk represents the steel yield strength, fck is the concrete compressive strength, b indicates the slab width, and d refers to its effective depth. As shown in Table 6, all slabs experienced failure before achieving their calculated flexural capacities. It is also understood that, at the slab–column connection, flexural behavior and punching shear behavior are interrelated [65]. The ratio of the slab’s ultimate punching shear capacity to its flexural ultimate load capacity calculated from yield-line theory, φ0, is commonly used to identify the slab failure mode [66,67]. When the value of φ0 ≤ 1, the punched shear failure pattern transpires at the relevant slab. Meanwhile, the slab may exhibit a flexural failure pattern when φ0 ≥ 1. In this study, all the slabs were subjected to a failure mode caused by punching shear, and all φ0 values were ≤ 1, except for specimens TR-ECC-1-1.0 and R-ECC-2-1.0, which had φ0 values ≥ 1, where the failure was between shear and flexural. The slabs R-ECC-1-1.6 displayed the minimum values for φ0, while the other slabs containing treated rubber showed high values. This analysis proved that the treatment of rubber with cement kiln dust effectively resisted the shear load to the extent that it surpassed the reference slab.

4.6. Reinforcement Strain

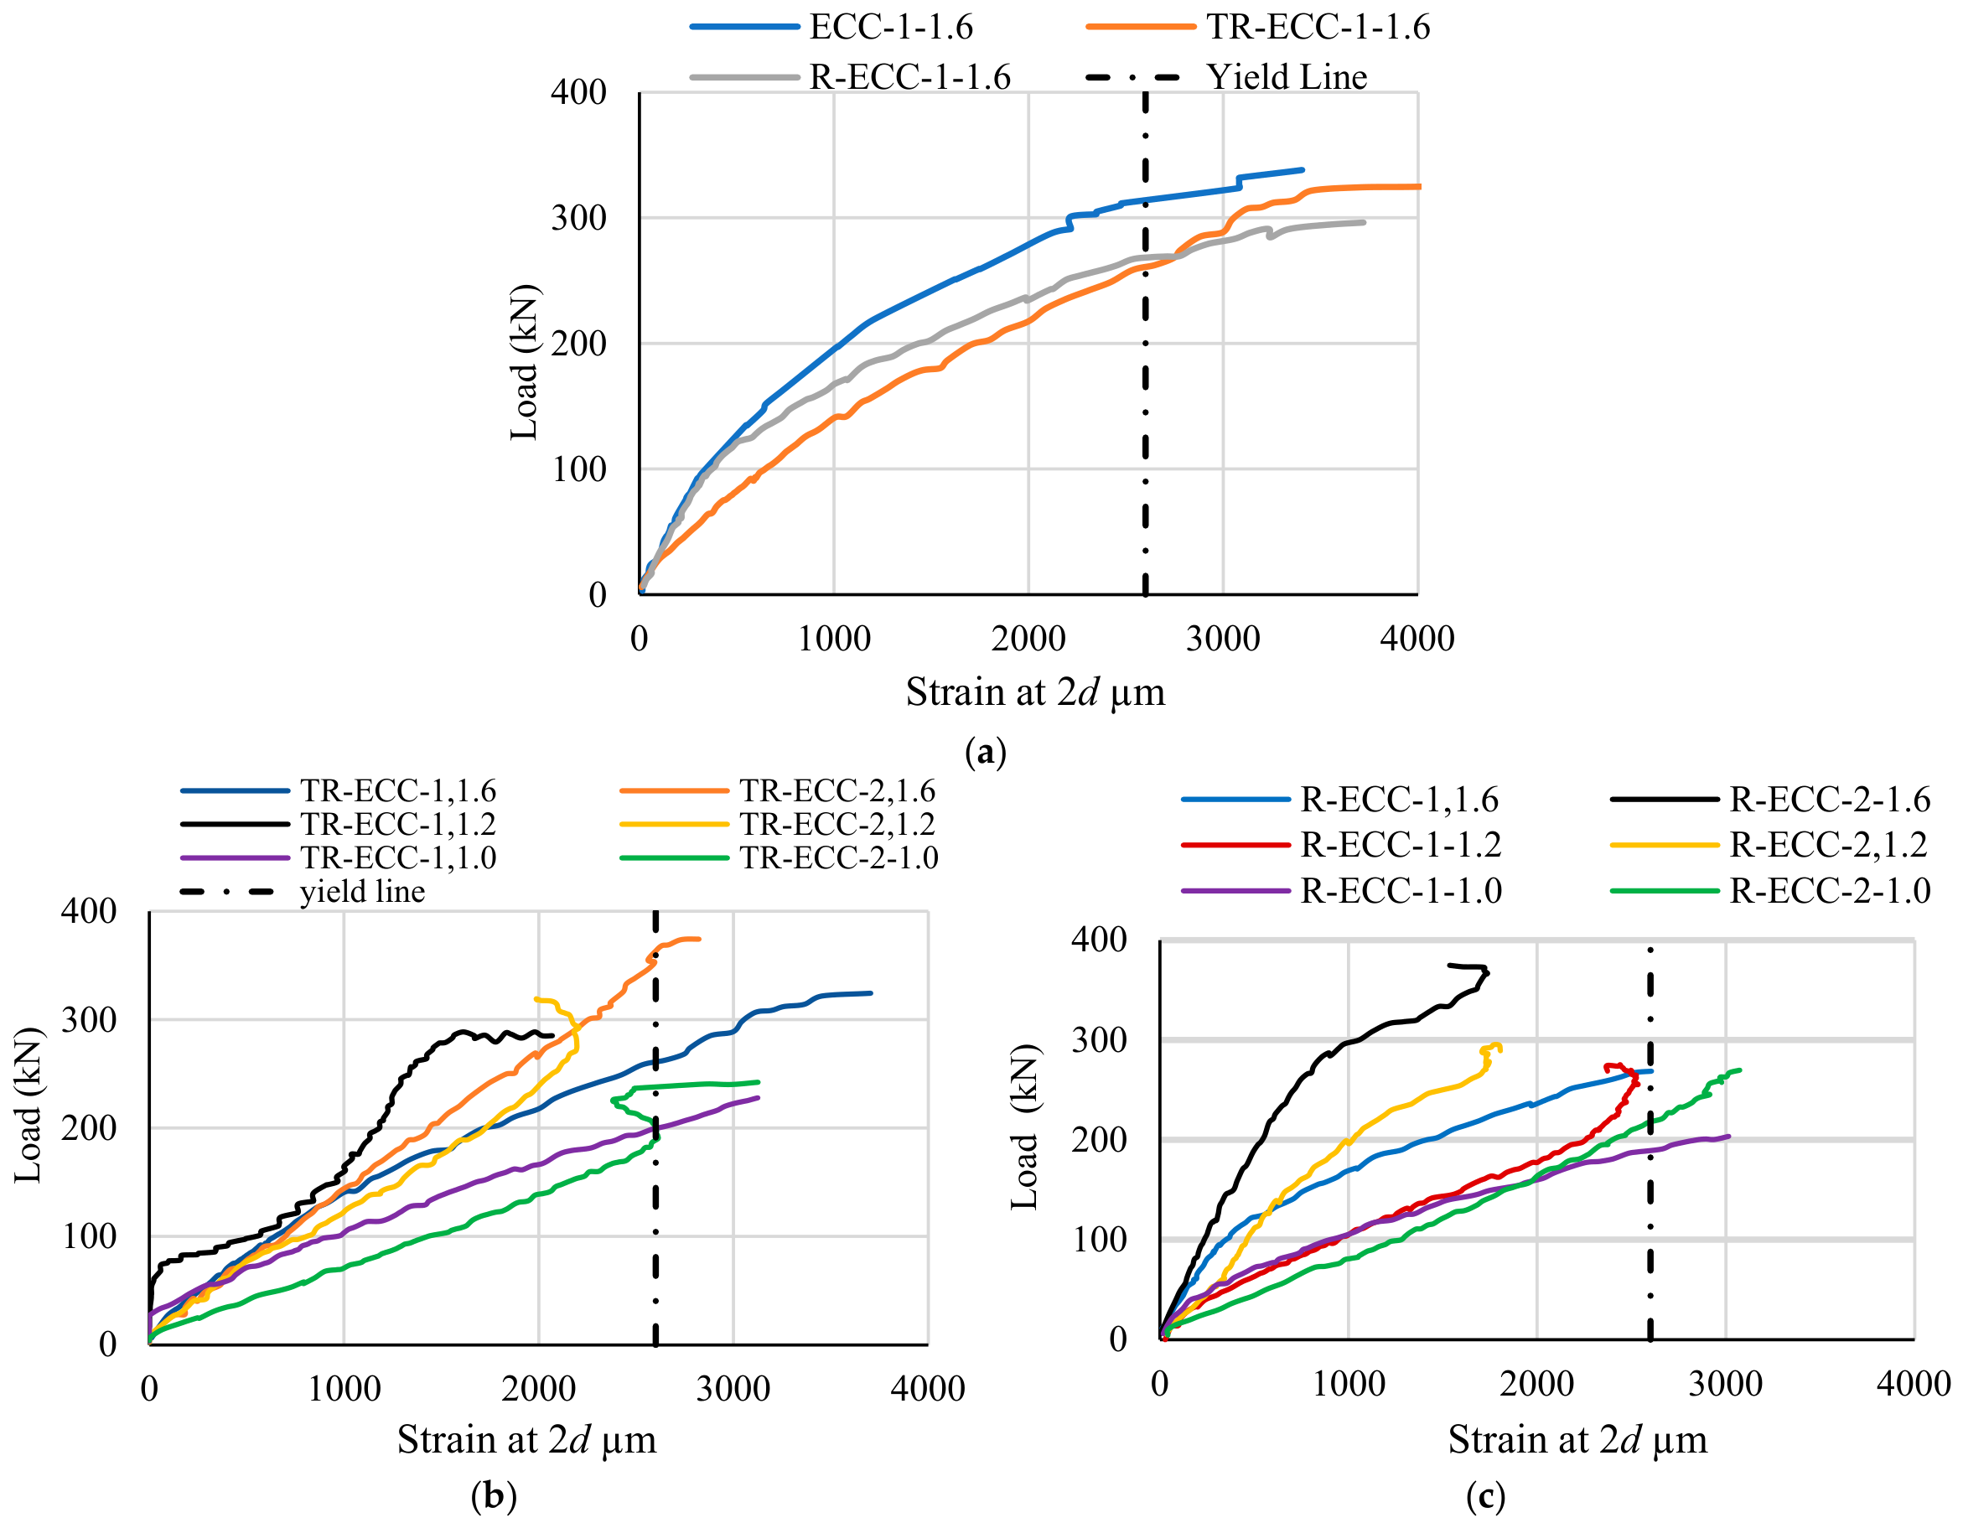
Load-versus-longitudinal steel strain curves of the examined slabs are presented in Figure 11. The curves were based on the values recorded by the two strain gauges provided. The curves are labeled d and 2d, based on their locations (Figure 11). The vertical dotted line in Figure 11 indicates that the yielding strain, calculated as 2600 × 10−6, is based on an elastic modulus of 200 GPa for a diameter of 12 mm in the longitudinal reinforcement bars [68].
Figure 11a illustrates the impact of crumb rubber and treated crumb rubber on the strain of tension reinforcement. It shows that the crumb rubber in the ECC mixture reduced the strain experienced by the longitudinal tension reinforcement. The crumb rubber increased the bending depth of the section, thereby reducing the tensile force acting on the longitudinal tension reinforcement. This in turn reduced the strains in the longitudinal steel reinforcement. The longitudinal steel strains in the rubber-treated slabs exhibited highly elastic behavior with micro, intricate cracks. Figure 11a shows that the load–strain curve of the TR-ECC slab follows a very similar trend to that of the reference slab just before the first crack. Table 4 indicates that the strain in the bottom bars persisted below their yield strain until the specimen was close to the peak load. At that load level, the steel strain was higher than in the R-ECC specimen.
The reinforcement strain distributions at various loading stages are shown in Figure 11a,b. For all specimens, the strain gauges located at distance d from the column face measured higher strain values than the gauges positioned farther away at 2d. Figure 11 presents the strain measurements at different loading stages and at various distances 2d from the column face. The strain reduction with increasing distance implies that bond slip did not develop during the experiments. In addition, abrupt rises in strain values were generally associated with cracking occurring near the strain gauge. In the strain file for sample R-ECC-2-1.0, as illustrated in Figure 11b, the strain readings exhibit a clear increase at the 2d location during the final phases of loading. Such an increase aligns with the crack development in the identical slab shown in Figure 4, where cracking started at the second site during the final phases of loading.
Table 7 delineates the reinforcement stresses at peak loads (ԑpeak) for gauges positioned at d and 2d from the column faces. As expected, the slabs with a higher reinforcement ratio exhibit reduced strain levels in the reinforcing bars. More particularly, when the reinforcement strain at peak load is compared to the ultimate strain ratio, slabs exhibiting reinforcement rates of 1.6% and 1.2% show significantly smaller strains than the specimen with a 1.0% reinforcement ratio of 81% and 51%, respectively, for R-ECC specimens and 76% and 75%, respectively, for TR-ECC specimens. In the slabs incorporating rubber, the reinforcement strains decreased by 1.2% relative to the reference slab, likely because of the inadequate bonding between the reinforcement and the rubber. By contrast, the slab in which rubber was used together with cement kiln dust showed a doubling of the reinforcement strain, likely due to the combined influence of the cement kiln dust treatment and the cement replacement ratio. These factors contribute to improved mix performance. Specimens with a lower compressive strength of concrete exhibit a decrease in reinforcement strains associated with the highest reinforcement ratio, and this becomes less noticeable as concrete strength increases.
Furthermore, the strains in the tension bars in the slabs with no compression RFT are almost twice those in the tension bars in slabs with compression RFT.

5. Predicted Punching Shear Load Based on Design Codes

Punching shear models of some selected design codes were used to enable comparison with the experimental results of this study: Eurocode 2 [69], ACI Code 318-25 [58], and ECP 203-2020 [70]. In the experiment, the properties of the used materials were defined in advance.

5.1. ECP-203-2020

The ultimate punching shear capacity of the slabs (Vu = VC, where VC, denotes the shear resistance supplied by concrete) can be determined as the minimum value among the following expressions [70].
V c 0.8 α . d b o + 0.2 f c u γ c b o d                     0.316 0.50 + a b f c u γ c b o d                   0.316 f c u γ c b o d                                                              
The shear perimeter, bo, is defined as 0.5d from the face of the column; a and b are shorter and longer sides of column, respectively; αs = column location coefficient; α = αs = 4 for the inner column; and ɣc is the strength reduction factor of concrete.

5.2. ACI-318-25

The ultimate punching shear capacity of the slabs (Vu = VC, wherein VC denotes the shear resistance supplied by concrete) can be determined as the minimum value among the following expressions [58].
V c 0.17 1 + 2 β f c     b o d                                       0.083 2 + α s d b 0 λ         f c     b o d               0.33 λ f c     b o d                                                                
where b o is defined at 0.5 d from the face of the column; β = the ratio of the longer side to the shorter side of the column; λ = the load factor; λ = 1.0 for axial loading; α and αs = the column location factors; and α = αs = 4 for an internal column.

5.3. Eurocode 2

The ultimate punching shear capacity (Vu = VRdc, the design punching resistance) of the slabs can be ascertained using the subsequent formula [69]:
V R d c = C R d c k 100 ρ i f c k 1 / 3 + k 1 σ c p b o d
k = 1 + 200 d 2
ρ i = ρ 1 x ρ 1 y 0.02
where b o is defined at 2 d from the column face; CRd,c = experimental factor; CRd,c = 0.18; ρi = longitudinal reinforcement ratio; σ c p represents the prestressing stress; ρcp = compressive reinforcement ratio; ρ 1 x   a n d   ρ 1 y are the amounts of tension reinforcement in the x and y directions.

6. Experimental Results vs. Code Predictions

The experimental findings were evaluated against the predicted results calculated using ECP-203-2020 [70], ACI 318-25 [58], and Eurocode 2-2004 [69], as shown in the equations listed in Table 8, to determine their applicability to concrete samples containing TCR.
It is clear that there is a difference between the codes in the calculations of punching shear, and the results show that, where the overall average (PExp./PPred. Code) ranges between 1.93 and 3.01 and the coefficient of variation ranges between 0.24 and 0.29. The mean values of PExp/PPre. were 2.8 and 3.1 for the ECP-203-2020 and ACI-318-25 codes, respectively. Out of the provisions examined, the European Code provided the most accurate predictions, as the shear strength was based on the cube root of the compressive strength of the concrete. In addition, its design equations incorporate the tensile reinforcement ratio, whereas the other codes do not account for the influence of tensile reinforcement.
The equations of ACI 318-25 [58] and ECP 203–2020 [70] consider only the square root of the concrete strength as the controlling factor for the punching shear capacity. The design code equations of ACI 318-25 [58] and ECP 203-2020 [70] are inconsistent with the final punching load because they ignore the effects of reinforcement. The panels reinforced with treated and untreated rubber chips are predicted by ECP-203, ACI-318-25, and EC2.
Table 8 provides a brief description of the results of the research findings, which showed that the ECP-203 and ACI-318 codes had higher safety factors than EC2. The average values of Pexp/Ppre. for the codes ECP-203, ACI-318, and EC2 were 2.81, 3.01, and 1.93, respectively.

7. Conclusions

An experimental investigation was conducted using thirteen flat-plate slabs of engineered cementitious composites (ECCs) with added rubber to predict the effects of tension and compression longitudinal reinforcement on the punching behavior at the flat-plate slab–column connection, both with and without treatment and under different reinforcement ratios. Particular attention was directed towards the effects of the rubber treatment and the variability in reinforcement ratio. Slabs were grouped into three groups based on the ratio of tensile reinforcement (1.6%, 1.2%, and 1.0%). For the concrete cube compressive strength (50 and 65 MPa), each group contained models with reinforcement ratios of 1.6%, 1.2%, and 1.0%. The groups had 50 and 65 MPa compressive strengths, in addition to the reference specimen of ECC concrete without additives and with a concrete cube compressive strength (70 MPa). The ECC concrete was reinforced with steel at a ratio of 1.6%. The study focused on two primary variables: concrete strength and reinforcement ratio. The experimental findings covering failure modes, cracking patterns, load–deflection behavior, and stress evolution were presented and analyzed. In addition, the experimentally obtained punching shear capacities were compared with values predicted by several selected design codes. From the punching shear slab tests performed in this research, the following conclusions can be drawn:
  • Using rubber with high-strength cementitious composites reduces the punching shear resistance of polypropylene-fiber-reinforced slabs. The experimental results of this study show that replacing 50% of the fine aggregate with rubber crumb led to about a 12.4% reduction in punching shear resistance.
  • The addition of rubber resulted in an almost identical load for the first cracking of the reference specimen, a decrease in the final load. Increasing the tension reinforcement ratio leads to significant improvements in the first crack load, ultimate load, and initial and final stiffness. In contrast, the compression reinforcement rate had a slight or unclear effect.
  • The treated rubber with cement kiln dust contributed to an increase in concrete compressive strength, a significant increase in the maximum load, and an improvement in both the initial and final stiffness, unlike the use of untreated rubber.
  • The tensile steel ratio has a clear influence on the cracking pattern of the tested specimens, whereas the concrete compressive strength has only a minor effect. Similarly, the compression steel ratio shows only limited influence.
  • The comparison of slab test results using both rubber and rubber treated with 50% sand replacement showed a clear improvement in ultimate loads, corresponding deflections, and crack pattern development.
  • The treatment of rubber using cement kiln dust significantly increases the punching shear resistance by up to 12%, as shown in this study, where it reaches the resistance of concrete without addition (the reference specimen). Conversely, the addition of treated rubber improved the crack pattern and increased the resistance before the cracks appeared.
  • Increased reinforcement ratios significantly improve punching shear resistance by up to 33.3%, as shown in this study, with the effect being more pronounced in untreated rubber concrete by 33.3% compared to high-strength concrete (65 MPa) with treated rubber by 17.4%.
  • The experimental results from slabs made with RC–ECC, whether treated or untreated, were compared with predictions from design codes. The comparison indicated conservative estimates when using the European code, regardless of whether compression reinforcement was included. In contrast, the Egyptian and American codes appear to be overly conservative with respect to punching shear strength.

Author Contributions

Conceptualization, R.A.M.A., M.E.E.-Z. and B.S.A.; methodology, R.A.M.A., M.E.E.-Z. and O.Y.; software, R.A.M.A.; validation, R.A.M.A., O.Y. and B.S.A.; formal analysis, R.A.M.A. and O.Y.; investigation, R.A.M.A. and M.E.E.-Z.; resources, B.S.A. and O.Y.; data curation, B.S.A. and O.Y.; writing—original draft preparation, R.A.M.A., O.Y. and B.S.A.; writing—review andediting, R.A.M.A., M.E.E.-Z., O.Y. and B.S.A.; visualization, M.E.E.-Z.; supervision, M.E.E.-Z. and B.S.A.; project administration, M.E.E.-Z. and B.S.A.; funding acquisition, O.Y. and B.S.A. All authors have read and agreed to the published version of the manuscript.

Funding

This research received no external funding.

Data Availability Statement

All data supporting the findings of this study are available within the manuscript.

Conflicts of Interest

The authors declare no conflicts of interest.

References

  1. Wang, L.; Wang, C.; Lu, X. Seismic Performance of Flat Plate Structure with Steel Capital. ACI Struct. J. 2019, 116, 221–232. [Google Scholar] [CrossRef] [Scilit]
  2. Dam, T.X.; Wight, J.K. Flexurally-triggered punching shear failure of reinforced concrete slab–column connections reinforced with headed shear studs arranged in orthogonal and radial layouts. Eng. Struct. 2016, 110, 258–268. [Google Scholar] [CrossRef] [Scilit]
  3. Marí, A.; Cladera, A.; Oller, E.; Bairán, J.M. A punching shear mechanical model for reinforced concrete flat slabs with and without shear reinforcement. Eng. Struct. 2018, 166, 413–426. [Google Scholar] [CrossRef] [Scilit]
  4. Cheng, M.-Y.; Parra-Montesinos, G. Evaluation of Steel Fiber Reinforcement for Punching Shear Resistance in Slab-Column Connections-Part I: Monotonically Increased Load. ACI Struct. J. 2010, 107, 101–109. [Google Scholar] [CrossRef] [Scilit]
  5. Li, F.; Feng, Z.; Deng, K.; Yu, Y.; Hu, Z.; Jin, H. Axial behavior of reinforced PP-ECC column and hybrid NSC-ECC column under compression. Eng. Struct. 2019, 195, 223–230. [Google Scholar] [CrossRef] [Scilit]
  6. Al-Tam, S.M.; Youssf, O.; Mahmoud, M.H.; Tahwia, A.M. Towards greener construction: A comprehensive evaluation of eco-friendly UHPC reinforced with hybrid fibers. Sci. Rep. 2026, 16, 7196. [Google Scholar] [CrossRef] [Scilit]
  7. Mahmoud, I.A.; Youssf, O.; Nabil, A. Performance of sustainable ECC and EGC in hybrid concrete beams: Experimental evaluation and finite element validation. Innov. Infrastruct. Solut. 2025, 11, 23. [Google Scholar] [CrossRef] [Scilit]
  8. Mishra, D.; Yu, J. Engineered Cementitious Composites (ECC): Bendable Concrete for a Sustainable and Resilient Infrastructure; Springer: Berlin/Heidelberg, Germany, 2019. [Google Scholar]
  9. Bandelt, M.; Billington, S. Impact of Reinforcement Ratio and Loading Type on the Deformation Capacity of High-Performance Fiber-Reinforced Cementitious Composites Reinforced with Mild Steel. J. Struct. Eng. 2016, 142, 4016084. [Google Scholar] [CrossRef] [Scilit]
  10. Shao, Y.; Billington, S.L. Flexural performance of steel-reinforced engineered cementitious composites with different reinforcing ratios and steel types. Constr. Build. Mater. 2020, 231, 117159. [Google Scholar] [CrossRef] [Scilit]
  11. Paegle, I.; Fischer, G. Phenomenological interpretation of the shear behavior of reinforced Engineered Cementitious Composite beams. Cem. Concr. Compos. 2016, 73, 213–225. [Google Scholar] [CrossRef] [Scilit]
  12. Yazan, A.; Khaldoun, R.; Mohamed, M. Shear Strength of Beams Made Using Hybrid Fiber–Engineered Cementitious Composites. J. Struct. Eng. 2018, 144, 4017177. [Google Scholar] [CrossRef] [Scilit]
  13. Xu, S.; Hou, L.; Zhang, X. Shear Behavior of Reinforced Ultrahigh Toughness Cementitious Composite Beams without Transverse Reinforcement. J. Mater. Civ. Eng. 2012, 24, 435. [Google Scholar] [CrossRef] [Scilit]
  14. Xu, S.; Hou, L.; Zhang, X. Flexural and shear behaviors of reinforced ultrahigh toughness cementitious composite beams without web reinforcement under concentrated load. Eng. Struct. 2012, 39, 176–186. [Google Scholar] [CrossRef] [Scilit]
  15. Kang, S.-B.; Tan, K.H.; Zhou, X.-H.; Yang, B. Influence of reinforcement ratio on tension stiffening of reinforced engineered cementitious composites. Eng. Struct. 2017, 141, 251–262. [Google Scholar] [CrossRef] [Scilit]
  16. Yi, O.; Mills, J.E.; Zhuge, Y.; Ma, X.; Gravina, R.J.; Youssf, O. Performance of crumb rubber concrete composite-deck slabs in 4-point-bending. J. Build. Eng. 2021, 40, 102695. [Google Scholar] [CrossRef] [Scilit]
  17. Tahwia, A.; Noshi, A.; Ellatief, M.; Matthana, M. Experimental investigation of rubberized concrete slab-on-grade containing tire-recycled steel fibers. Innov. Infrastruct. Solut. 2024, 9, 46. [Google Scholar] [CrossRef] [Scilit]
  18. Onuaguluchi, O.; Panesar, D.K. Hardened properties of concrete mixtures containing pre-coated crumb rubber and silica fume. J. Clean. Prod. 2014, 82, 125–131. [Google Scholar] [CrossRef] [Scilit]
  19. Yung, W.H.; Yung, L.C.; Hua, L.H. A study of the durability properties of waste tire rubber applied to self-compacting concrete. Constr. Build. Mater. 2013, 41, 665–672. [Google Scholar] [CrossRef] [Scilit]
  20. Jokar, F.; Khorram, M.; Karimi, G.; Hataf, N. Experimental investigation of mechanical properties of crumbed rubber concrete containing natural zeolite. Constr. Build. Mater. 2019, 208, 651–658. [Google Scholar] [CrossRef] [Scilit]
  21. Medina, N.F.; Medina, D.F.; Hernández-Olivares, F.; Navacerrada, M.A. Mechanical and thermal properties of concrete incorporating rubber and fibres from tyre recycling. Constr. Build. Mater. 2017, 144, 563–573. [Google Scholar] [CrossRef] [Scilit]
  22. Bisht, K.; Ramana, P.V. Waste to resource conversion of crumb rubber for production of sulphuric acid resistant concrete. Constr. Build. Mater. 2019, 194, 276–286. [Google Scholar] [CrossRef] [Scilit]
  23. Qaidi, S.M.A.; Dinkha, Y.Z.; Haido, J.H.; Ali, M.H.; Tayeh, B.A. Engineering properties of sustainable green concrete incorporating eco-friendly aggregate of crumb rubber: A review. J. Clean. Prod. 2021, 324, 129251. [Google Scholar] [CrossRef] [Scilit]
  24. Youssf, O.; Hassanli, R.; Mills, J.; Skinner, W.; Ma, X.; Zhuge, Y.; Roychand, R.; Gravina, R. Influence of Mixing Procedures, Rubber Treatment, and Fibre Additives on Rubcrete Performance. J. Compos. Sci. 2019, 3, 41. [Google Scholar] [CrossRef] [Scilit]
  25. Raffoul, S.; Garcia, R.; Pilakoutas, K.; Guadagnini, M.; Medina, N.F. Optimisation of rubberised concrete with high rubber content: An experimental investigation. Constr. Build. Mater. 2016, 124, 391–404. [Google Scholar] [CrossRef] [Scilit]
  26. Polydorou, T.; Constantinides, G.; Neocleous, K.; Kyriakides, N.; Koutsokeras, L.; Chrysostomou, C.; Hadjimitsis, D. Effects of pre-treatment using waste quarry dust on the adherence of recycled tyre rubber particles to cementitious paste in rubberised concrete. Constr. Build. Mater. 2020, 254, 119325. [Google Scholar] [CrossRef] [Scilit]
  27. Xiaowei, C.; Sheng, H.; Xiaoyang, G.; Wenhui, D. Crumb waste tire rubber surface modification by plasma polymerization of ethanol and its application on oil-well cement. Appl. Surf. Sci. 2017, 409, 325–342. [Google Scholar] [CrossRef] [Scilit]
  28. Zhang, H.; Gou, M.F.; Liu, X.; Guan, X. Effect of Rubber Particle Modification on Properties of Rubberized Concrete. J. Wuhan Univ. Technol.-Mater. Sci. Ed. 2014, 29, 763–768. [Google Scholar] [CrossRef] [Scilit]
  29. Aslani, F.; Deghani, A.; Asif, Z. Development of Lightweight Rubberized Geopolymer Concrete by Using Polystyrene and Recycled Crumb-Rubber Aggregates. J. Mater. Civ. Eng. 2020, 32, 04019345. [Google Scholar] [CrossRef] [Scilit]
  30. Li, Y.; Zhang, X.; Wang, R.; Lei, Y. Performance enhancement of rubberised concrete via surface modification of rubber: A review. Constr. Build. Mater. 2019, 227, 116691. [Google Scholar] [CrossRef] [Scilit]
  31. Collins, R.J.; Emery, J.J. Kiln Dust-fly Ash Systems for Highway Bases and Subbases: Final Report; U.S. Department of Transportation, Federal Highway Administration: Washington, DC, USA, 1983. [Google Scholar]
  32. Amnisi, R.A.M.; El-Zoughiby, M.E.; Abdelwahed, B.S.; Youssf, O. Valorization of Multi-Waste Materials in Eco-Friendly Engineered Cementitious Composites. Infrastructures 2026, 11, 149. [Google Scholar] [CrossRef] [Scilit]
  33. Al-Harthy, A.S.; Taha, R.; Al-Maamary, F. Effect of cement kiln dust (CKD) on mortar and concrete mixtures. Constr. Build. Mater. 2003, 17, 353–360. [Google Scholar] [CrossRef] [Scilit]
  34. Siddique, R. Waste Materials and By-Products in Concrete; Springer: Berlin/Heidelberg, Germany, 2007. [Google Scholar] [CrossRef] [Scilit]
  35. Ravindrarajah, R.S. Usage of cement kiln dust in concrete. Int. J. Cem. Compos. Lightweight Concr. 1982, 4, 95–102. [Google Scholar] [CrossRef] [Scilit]
  36. Detwiler, P.J.; Bhatty, J.I.; Battacharja, S. Supplement Cementing Materials for Use in Blended Cement; PCA: Skokie, IL, USA, 1996. [Google Scholar]
  37. Batis, G.; Rakanta, E.; Sideri, E.; Chaniotakis, E.; Papageorgiou, A. Advantages of simultaneous use of cement kiln dust and blast furnace slag. In Challenges of Concrete Construction: Volume 5, Sustainable Concrete Construction: Proceedings of the International Conference Held at the University of Dundee, Scotland, UK on 9–11 September 2002; Thomas Telford Publishing: London, UK, 2002; pp. 205–212. [Google Scholar]
  38. Daugherty, K.E.; Funnell, J.E. The incorporation of low levels of by-products in portland cement and the effects on cement quality. Cem. Concr. Aggreg. 1983, 5, 14–20. [Google Scholar] [CrossRef] [Scilit]
  39. Ji, Y.; Chen, A.; Chen, Y.; Han, X.; Li, B.; Gao, Y.; Liu, C.; Xie, J. A state-of-the-art review of concrete strength detection/monitoring methods: With special emphasis on PZT transducers. Constr. Build. Mater. 2023, 362, 129742. [Google Scholar] [CrossRef] [Scilit]
  40. Zhang, D.; Yu, J.; Wu, H.; Jaworska, B.; Ellis, B.R.; Li, V.C. Discontinuous micro-fibers as intrinsic reinforcement for ductile Engineered Cementitious Composites (ECC). Compos. B Eng. 2020, 184, 107741. [Google Scholar] [CrossRef] [Scilit]
  41. Jamshaid, H.; Mishra, R. A green material from rock: Basalt fiber—A review. J. Text. Inst. 2016, 107, 923–937. [Google Scholar] [CrossRef] [Scilit]
  42. Yang, E.-H. Designing Added Functions in Engineered Cementitious Composites. Ph.D. Thesis, University of Michigan, Ann Arbor, MI, USA, 2008. [Google Scholar]
  43. Yang, E.-H.; Li, V.C. Strain-hardening fiber cement optimization and component tailoring by means of a micromechanical model. Constr. Build. Mater. 2010, 24, 130–139. [Google Scholar] [CrossRef] [Scilit]
  44. Felekoglu, B.; Tosun-Felekoglu, K.; Ranade, R.; Zhang, Q.; Li, V.C. Influence of matrix flowability, fiber mixing procedure, and curing conditions on the mechanical performance of HTPP-ECC. Compos. B Eng. 2014, 60, 359–370. [Google Scholar] [CrossRef] [Scilit]
  45. Ye, B.; Pan, P.; Xiao, G.; Zhang, Y.; He, Z. Experimental investigation on failure modes of RECC slab-column connections under concentric gravity loading. Eng. Struct. 2021, 230, 111559. [Google Scholar] [CrossRef] [Scilit]
  46. Ye, B.; Pan, P.; Xiao, G.; Han, J.; Zhang, Y. Comparative study of reinforced-engineered cementitious composites and reinforced-concrete slab-column connections under a vertical monotonic load. Eng. Struct. 2021, 244, 112740. [Google Scholar] [CrossRef] [Scilit]
  47. Hamoda, A.; Abadel, A.A.; Ahmed, M.; Wang, V.; Vrcelj, Z.; Liang, Q.Q. Punching shear performance of reinforced concrete slab-to-steel column connections incorporating ECC and UHPECC. Eng. Struct. 2025, 322, 119145. [Google Scholar] [CrossRef] [Scilit]
  48. 50010-2010 GB; Code for Design of Concrete Structures. Standardization Administration of China: Beijing, China, 2010.
  49. Swilam, A.; Tahwia, A.M.; Youssf, O. Effect of rubber heat treatment on rubberized-concrete mechanical performance. J. Compos. Sci. 2022, 6, 290. [Google Scholar]
  50. Helal, K.A.; Tahwia, A.M.; Youssf, O. Performance of eco-friendly ECC made of pre-treated crumb rubber and waste quarry dust. J. Build. Eng. 2024, 97, 110820. [Google Scholar]
  51. Youssf, O.; Hassanli, R.; Elchalakani, M.; Mills, J.E.; Tayeh, B.A.; Saad Agwaa, I. Punching Shear Behaviour and Repair Efficiency of Reinforced Eco-friendly Lightweight Concrete Slabs. Eng. Struct. 2023, 281, 115805. [Google Scholar] [CrossRef] [Scilit]
  52. Eladawy, M.; Hassan, M.; Benmokrane, B. Experimental Study of Interior Glass Fiber-Reinforced Polymer-Reinforced Concrete Slab-Column Connections under Lateral Cyclic Load. ACI Struct. J. 2019, 116, 165–180. [Google Scholar] [CrossRef] [Scilit]
  53. Salama, A.; Hassan, M.; Benmokrane, B. Punching-Shear Behavior of Glass Fiber-Reinforced Polymer-Reinforced Concrete Edge Column-Slab Connections: Experimental and Analytical Investigations. ACI Struct. J. 2021, 118, 147–160. [Google Scholar] [CrossRef] [Scilit]
  54. Hassan, H.; Muhammed, D. Punching shear behavior of RC-FRP slabs: State of art review. In AIP Conference Proceedings; AIP Publishing LLC: Melville, NY, USA, 2024; p. 50009. [Google Scholar] [CrossRef] [Scilit]
  55. Gouda, A.; El-Salakawy, E. Punching Shear Strength of GFRP-RC Interior Slab–Column Connections Subjected to Moment Transfer. J. Compos. Constr. 2015, 20, 4015037. [Google Scholar] [CrossRef] [Scilit]
  56. Torabian, A.; Isufi, B.; Mostofinejad, D.; Ramos, A. Behavior of thin lightly reinforced flat slabs under concentric loading. Eng. Struct. 2019, 196, 109327. [Google Scholar] [CrossRef] [Scilit]
  57. Said, M.; Mahmoud, A.; Salah, A. Performance of reinforced concrete slabs under punching loads. Mater. Struct. 2020, 53, 68. [Google Scholar] [CrossRef] [Scilit]
  58. ACI CODE-318-25; Building Code for Structural Concrete—Code Requirements and Commentary. ACI: Farmington Hills, MI, USA, 2025.
  59. Hassan, M.; Ahmed, E.A.; Benmokrane, B. Punching-Shear Strength of Normal and High-Strength Two-Way Concrete Slabs Reinforced with GFRP Bars. J. Compos. Constr. 2013, 17, 4013003. [Google Scholar] [CrossRef] [Scilit]
  60. Pacheco-Torgal, F.; Ding, Y.; Jalali, S. Properties and durability of concrete containing polymeric wastes (tyre rubber and polyethylene terephthalate bottles): An overview. Constr. Build. Mater. 2012, 30, 714–724. [Google Scholar] [CrossRef] [Scilit]
  61. Youssf, O.; Hassanli, R.; Mills, J.E. Retrofitting square columns using FRP-confined crumb rubber concrete to improve confinement efficiency. Constr. Build. Mater. 2017, 153, 146–156. [Google Scholar] [CrossRef] [Scilit]
  62. Ferreira, M.; Melo, G.; Regan, P.; Vollum, R. Punching of Reinforced Concrete Flat Slabs with Double- Headed Shear Reinforcement. ACI Struct. J. 2014, 111, 363. [Google Scholar] [CrossRef] [Scilit]
  63. Elstner, R.C.; Hognestad, E. Shearing Strength of Reinforced Concrete Slabs. J. Am. Concr. Inst. 1956, 53, 29–58. [Google Scholar] [CrossRef] [Scilit]
  64. EN 1992-1-1:2004; Eurocode 2: Design of Concrete Structures-Part 1-1: General Rules and Rules for Buildings. Comite Europeen de Normalisation: Brussels, Belgium, 2004.
  65. Rankin, G.; Long, A. Predicting the Punching Strength of Conventional Slab-Column Specimens. Proc. Inst. Civ. Eng. 1987, 82, 327–346. [Google Scholar] [CrossRef] [Scilit]
  66. Marzouk, H.; Hussein, A. Experimental investigation on the behavior of high-strength concrete slabs. ACI Struct. J. 1991, 88, 701–713. [Google Scholar] [CrossRef] [Scilit]
  67. Hassanli, R.; Youssf, O.; El-Naqeeb, , M.H.; Yekrangnia, , M.; Elchalakani, , M.; Ghanbari-Ghazijahani, , T.; Bazli, M. Investigation of punching shear performance in concrete slabs reinforced with GFRP and synthetic fibers: An experimental study. Eng. Struct. 2024, 311, 118215. [Google Scholar] [CrossRef] [Scilit]
  68. Inácio, M.; Almeida, A.; Faria, D.; Lucio, V.; Ramos, A. Punching of high strength concrete flat slabs without shear reinforcement. Eng. Struct. 2015, 103, 275–284. [Google Scholar] [CrossRef] [Scilit]
  69. Eurocode No. 2; Design of Concrete Structures—Part 1: General Rules and Rules for Buildings. Commission of the European Communities: Brussels, Belgium, 2002.
  70. ECP 2003-2020; Egyptian Code of Practice for Design and Construction of Concrete Structures. Housing and Building National Research Center: Giza, Egypt, 2020.
Figure 1. Gradation curves for (a) cement and cement kiln dust and (b) natural fine aggregate and crumb rubber.
Infrastructures 11 00304 g001
Figure 2. (a) Typical RFT details and dimensions of the tested slabs. (b) Loading test setup.
Infrastructures 11 00304 g002
Figure 3. Schematic diagram for the test setup.
Infrastructures 11 00304 g003
Figure 4. Crack pattern and failure mode of test specimens at tension side. (a) ECC failure modes. (b) Failure mode of slabs with different tension reinforcement ratios for treatment rubber. (c) Failure mode of slabs with different tension and compression reinforcement ratios for treatment rubber. (d) Failure mode of slabs with different tension reinforcement ratios for non-treatment rubber. (e) Failure mode of slabs with different tension and compression reinforcement ratios for non-treatment rubber.
Infrastructures 11 00304 g004aInfrastructures 11 00304 g004b
Figure 5. Load–deflection response of tested slabs. (a) Load–deflection with different concrete types. (b) Load–deflection relation for TCR and NTR specimens with different flexural reinforcement ratios. (c) Load–deflection of groups A and B with and without compression reinforcement. (d) Load–deflection of group C with and without compression reinforcement.
Infrastructures 11 00304 g005aInfrastructures 11 00304 g005b
Figure 6. Load–deflection curves.
Infrastructures 11 00304 g006
Figure 7. Displacement at center of specimens at loads of 40 kN and 160 kN. (a) Load–displacement profile for R-ECC. (b) Load–displacement profile for TR-ECC.
Infrastructures 11 00304 g007
Figure 8. Deflection patterns at each 40 kN for all slabs.
Infrastructures 11 00304 g008aInfrastructures 11 00304 g008b
Figure 9. Initial and ultimate stiffness of tested specimens.
Infrastructures 11 00304 g009
Figure 10. Dimensions of the specimens used to calculate the value of K in Equation (3).
Infrastructures 11 00304 g010
Figure 11. Load-versus-longitudinal steel strain curves. (a) Steel strain curves for control, treatment and non-treatment crumb rubber slabs. (b) Steel strain curves for TR-ECC slabs. (c) Steel strain curves for R-ECC slabs.
Infrastructures 11 00304 g011
Table 1. Design of ECC mixes (per 1 m3).
Mixturefcu,
MPa
Cement, kgCR, kgTCR, kgGGBFS, kgSF, kgSand, kgCKD, kgWater, kgSP, kgPPF,
2%
ECC70685--41013654803321025
R-ECC50685100-41013627403321025
TR-ECC65616-100410136274573321025
Table 2. Details of the tested specimens.
GroupSpecimenMixturefcu, MPaColumn Size, mmDepth, mmFlexural Reinforcement (%)Compression Reinforcement (%)
AECC-1-1.6ECC70160 × 16080(1.6) T12-95
R-ECC-1-1.6R + ECC50160 × 16080(1.6) T12-95
TR-ECC-1-1.6TR + 10% CKD 65(1.6) T12-95
R-ECC-2-1.6R + ECC50(1.6) T12-95(1.6) T12-95
TR-ECC-2-1.6TR + 10% CKD65(1.6) T12-95(1.6) T12-95
BR-ECC-1-1.0R + ECC50160 × 16080(1.0) T12-175
TR-ECC-1-1.0TR + 10% CKD65(1.0) T12-175
R-ECC-2-1.0R + ECC50(1.0) T12-175(1.0) T12-175
TR-ECC-2-1.0TR + 10% CKD65(1.0) T12-175(1.0) T12-175
CR-ECC-1-1.2R + ECC50160 × 16080(1.2) T12-131
TR-ECC-1-1.2TR + 10% CKD65(1.2) T12-131
R-ECC-2-1.2R + ECC50(1.2) T12-131(1.2) T12-131
TR-ECC-2-1.2TR + 10% CKD65(1.2) T12-131(1.2) T12-131
Table 3. Failure angles.
No.SpecimenLf,
mm
Ѳf,
Degrees
1ECC-1-1.660018
2R-ECC-1-1.658019
3TR-ECC-1-1.646026
4RECC-2-1.641030
5TR-ECC-2-1.650023
6R-ECC-1-1.054021
7TR-ECC-1-1.038034
8R-ECC-2-1.042029
9TR-ECC-2-1.043028
10R-ECC-1-1.252022
11TR-ECC-1-1.275014
12R-ECC-2-1.255020
13TR-ECC-2-1.243028
Table 4. Test results.
No.SpecimenCracking StateYielding StatePeak StateUltimate StateFailure Mode
Pcr (kN)Δcr (mm)Py
(kN)
Δy
(mm)
Pp
(kN)
Δp (mm)Pu
(kN)
Δu (mm)
1ECC-1-1.6461.1269.006.85338.0010.21270.406.86PS (Brittle)
2R-ECC-1-1.6451.58268.709.71296.0014.36236.807.98PS + F (Ductile)
3TR-ECC-1-1.6501.85262.658.41338.1315.23270.408.8PS + F (Ductile)
4RECC-2-1.6602.20316.0010.04374.0020.04299.209.44PS + F (Ductile)
5TR-ECC-2-1.6712.88353.4012.3374.0016.04299.209.32PS + F (Ductile)
6R-ECC-1-1.0381.51190.7410.23222.3615.23177.888.76PS + F (Ductile)
7TR-ECC-1-1.0472.28201.009.57265.2019.75212.1610.45PS + F (Ductile)
8R-ECC-2-1.0351.85226.9511.46269.0018.31215.2010.65PS + F (Ductile)
9TR-ECC-2-1.0372.15193.8011.1240.0020.54190.0010.71PS + F (Ductile)
10R-ECC-1-1.2381.33264.7014.69274.0017.17219.209.41PS + F (Ductile)
11TR-ECC-1-1.2451.78245.8010.14288.0017.67230.409.1PS + F (Ductile)
12R-ECC-2-1.2481.87230.008.15295.2917.18236.208.15PS + F (Ductile)
13TR-ECC-2-1.2502.25263.1610.39318.7520.56255.009.91PS + F (Ductile)
Table 5. Initial cracking loads and ultimate loads of the tested slabs.
GroupSpecimenVcr,
kN
Δcr,
mm
VPeak,
kN
ΔPeak,
mm
νPeak,
MPa
ki,
kN/mm
kp,
kN/mm
kp/ki
ECCECC-1-1.6461.1338.0010.215.8741.4432.050.77
AR-ECC-1-1.6451.58296.0014.365.1428.4819.640.69
TR-ECC-1-1.6501.85338.1315.235.8727.0321.530.80
RECC-2-1.6602.20374.0020.046.4927.2717.600.65
TR-ECC-2-1.6712.88374.0016.046.4924.6523.020.93
BR-ECC-1-1.0381.51222.3615.233.8625.1713.440.53
TR-ECC-1-,1.0472.28265.2019.754.6020.6112.490.61
R-ECC-2-1.0351.85269.0018.314.6718.9214.220.75
TR-ECC-2-1.0372.15240.0020.544.1717.2111.040.64
CR-ECC-1-1.2381.33274.0017.174.7628.5714.900.52
TR-ECC-1-1.2451.78288.0017.675.0025.2815.290.60
R-ECC-2-1.2481.87295.2917.185.8725.6716.150.63
TR-ECC-2-1.2502.25318.7520.565.1422.2214.680.66
Table 6. The flexural ultimate load capacity of tested flat-plate slabs based on yield-line theory.
No.SampleVcr
(kN)
Δcr
(mm)
Ultimate Punching Shear Load,
Vu (kN)
Flexural Ultimate Load Capacity,
Pf (kN)
Ҩ0 = Vu/Pf
1ECC-1-1.6461.10338.00396.000.85
2R-ECC-1-1.6451.58296.00381.000.77
3TR-ECC-1-1.6501.85338.13393.000.86
4RECC-2,1.6602.20370.00381.000.97
5TR-ECC-2-1.6712.88374.00393.000.95
6R-ECC-1-1.0381.51222.36250.000.88
7TR-ECC-1-1.0452.28265.20255.401.03
8R-ECC-2-1.0351.85269.00250.001.07
9TR-ECC-2-1.0372.15240.00255.400.94
10R-ECC-1-1.2381.33274.00324.600.84
11TR-ECC-1-1.2471.78288.00302.700.95
12R-ECC-2-1.2481.87295.29324.600.90
13TR-ECC-2-1.2502.25318.75302.701.05
Table 7. Reinforcement strains at peak load at different locations.
No.SampleUltimate Load,
Vu (kN)
εpeakεpeaku
d2d
1ECC-1-1.6338.132281.943405.301.09
2R-ECC-1-1.6296.311246.173719.460.95
3TR-ECC-1-1.6338.139924.608335.713.51
4RECC-2,1.6374.853181.58424,136.065.25
5TR-ECC-2-1.6374.345252.182831.251.55
6R-ECC-1-1.0222.3615,234.8611,547.765.15
7TR-ECC-1-1.0265.2-4438.220.85
8R-ECC-2-1.0269.7910,748.082933.112.63
9TR-ECC-2-1.0242.251886.862761.750.89
10R-ECC-1-1.2275.410,408.222593.252.50
11TR-ECC-1-1.2288.66688.29617,048.423.41
12 R-ECC-2-1.2295.2919,932.032370.484.29
13TR-ECC-2-1.2319.2617,587.252736.053.91
Table 8. Experimental ultimate loads vs. code predictions.
No.Slab’s DesignationPExp.
(kN)
ECP-203-2020ACI-318-25EC2-2004
PPred. (kN)PExp./PPred.PPred. (kN)PExp/PPred.PPred. (kN)PExp/PPred.
1ECC-1,1.6338152.192.22142.242.38213.521.58
2R-ECC-1,1.6296146.652.02120.222.46193.021.53
3TR-ECC-1,1.6338.13128.622.63137.072.47208.821.62
4RECC-2,1.6374146.652.56120.223.11193.021.94
5TR-ECC-2,1.6374128.622.91137.072.73208.821.79
6R-ECC-1,1.0222.36146.651.52120.221.85193.021.15
7TR-ECC-1,1.0265.2128.622.06137.071.93208.821.27
8R-ECC-2,1.0269146.651.84120.222.24193.021.39
9TR-ECC-2,1.0240128.621.88137.071.75208.821.15
10R-ECC-1,1.2274146.651.88120.222.28193.021.42
11TR-ECC-1,1.2288128.622.24137.072.10208.821.38
12R-ECC-2,1.2295.29146.652.01120.222.46193.021.53
13TR-ECC-2,1.2319.75152.192.22137.072.33208.821.53
Mean2.813.011.93
Standard deviation0.690.890.57
Coefficient of variation0.240.290.29
PExp and PPred. are the experimental and predicted ultimate load.
Disclaimer/Publisher’s Note: The statements, opinions and data contained in all publications are solely those of the individual author(s) and contributor(s) and not of MDPI and/or the editor(s). MDPI and/or the editor(s) disclaim responsibility for any injury to people or property resulting from any ideas, methods, instructions or products referred to in the content.