1. Introduction
Airport pavement maintenance is a critical component of aircraft operational safety. Up to 20% of runway excursions are associated with insufficient friction [
1], and adequate friction levels of friction also contribute to reduced runway occupancy times [
2], thereby improving airport operational efficiency. During service, pavement friction can decrease below the minimum level due to surface deterioration, leading to an increased risk of slippery conditions.
The International Civil Aviation Organization (ICAO) recommends periodic evaluation of runway friction and macrotexture to ensure timely maintenance [
3]. However, the primary mechanism of friction reduction is microtexture deterioration, which occurs due to rubber accumulation and surface polishing. While ICAO guidance emphasizes the need for adequate microtexture, there are currently no standardized methods for its assessment, nor clear guidance on evaluating microtexture degradation or improvement [
4].
Various microtexture assessment methods have been explored in research. Several attempts have been made to incorporate microtexture measurements into pavement evaluation practice for both highways and runways, including the development of the International Friction Index by the World Road Association [
5] and research initiatives supported by the European Union Aviation Safety Agency [
6]. However, the outcomes of these efforts have not yet been widely implemented in operational practice. Beyond large-scale projects, recent studies have investigated practical applications of modern techniques such as 3D scanning, image analysis, and profilometry, demonstrating that microtexture assessment can be a valuable tool for runway condition evaluation [
7,
8]. In this study, laser profilometry was adopted as a simple and precise and repeatable method for microtexture assessment.
Numerous experimental and theoretical studies have demonstrated the influence of microtexture on friction. Recent experimental work by Maeger et al. [
9] employed laser profilometry for asphalt aggregate assessment and reported a strong correlation between microtextural parameters and friction measurements. Similar findings were reported for concrete surfaces by Izuo et al. [
10]. Theoretical studies based on the Persson rubber friction model [
11] further confirm the critical role of microtexture in friction generation [
12,
13]. Hence, it is important to detect and predict microtexture reduction over time.
The primary cause of microtexture reduction on runways is rubber contamination [
14]. In touchdown zones, high contact stresses between the aircraft tire and pavement surface result in elevated tire temperatures and subsequent deposition of rubber onto the pavement surface. These deposits fill and smooth the surface texture, increasing the likelihood of skid-related incidents [
15].
Another important mechanism of microtexture degradation is polishing. Polishing occurs due to the abrasive action of repeated aircraft traffic, leading to the removal of the binder film, exposure and loss of fine aggregate, and polishing of the coarse aggregate particles, ultimately reducing overall microtexture. Although field studies of runway polishing under aircraft loading are limited, the process has been investigated in laboratory conditions [
16,
17] and on road pavements [
18,
19]. These studies indicate that polishing is a non-linear process, characterized by a higher rate of texture reduction in the early stages, which then asymptotes with further exposure. It is also strongly influenced by the polishing resistance of the aggregate particles, and mixture composition, with coarser mixtures and lower air void content generally exhibiting greater resistance to polishing [
18,
19].
Several techniques are available to restore microtexture. Rubber removal is the most commonly applied method for runway surfaces, including water blasting, chemical treatment, and shot blasting, as well as mechanical approaches such as scraping, brooming, milling, and grinding [
20]. In addition, surface treatments such as chip seals or sand coatings applied after rejuvenation have been proposed to enhance texture [
21,
22]. However, such treatments must be applied cautiously due to the risk of coating degradation and the potential generation of foreign object debris (FOD) in the form of loose chips or sand.
At present, there is limited research on the evolution of microtexture under real runway conditions, as most existing studies are based on laboratory simulations of texture degradation [
23,
24]. Although the evolution of skid resistance has been extensively studied [
25,
26], a detailed understanding of microtexture changes under operational conditions remains lacking. Such understanding is essential for optimizing runway maintenance strategies and ensuring safe aircraft operations.
The aim of this case study was to investigate microtexture reduction under aircraft loading and its subsequent recovery following rubber removal and surface rejuvenation, based on a typical regional airport in Australia. The study also examined the polishing behaviour of the surface material under operational wear, to evaluate the influence of aggregate polishing resistance on the rate of microtexture deterioration. The findings are expected to support the development of recommendations for microtexture monitoring frequency and runway maintenance practices.
2. Materials and Methods
2.1. Testing Runway
For this study, the main runway of a typical regional Australian airport was investigated. The runway accommodates approximately 20 landings per day, predominantly by narrow-body passenger aircraft such as the Boeing 737 and the Airbus A321. The pavement surface was grooved at the time of construction, and no groove deformation was observed during the texture measurements. The runway is located in South-East Queensland, which is characterised by a humid subtropical climate. The number of landings on each runway end was obtained from airport operational records provided by the airport administration.
The runway surface was constructed in 2019, using a dense-graded 14 mm maximum-sized asphalt mixture, meeting the requirements of the Australian airport asphalt specification [
27]. The coarse aggregate consists of trachyte, with a Los Angeles abrasion value of 17%. Although Micro-Deval or other standardized polishing resistance tests were not conducted during mixture design, previous studies on similar aggregates suggest that, based on the reported Los Angeles abrasion value, the polishing resistance of the material can be classified as moderate to high [
28].
Macrotexture testing was previously conducted on this runway, showing uniform results across the entire surface, with an average MPD of 1.27 mm on grooved areas and 0.20 mm on non-grooved areas. The runway grooves were not deformed at the time of the texture measurements, and no significant cross-sectional variation in MPD was observed. For this reason, macrotexture evolution was not analysed for this runway.
Previous friction testing results showed skid resistance above the ICAO recommended maintenance intervention level [
4], with local areas near the touchdown zones experiencing friction levels below the maintenance planning level, which led to the rubber removal described further. Furthermore, the surface is approaching six years of age, and a sprayed bituminous rejuvenation was planned, intended to extend the life of the surface.
2.2. Microtexture Measurements
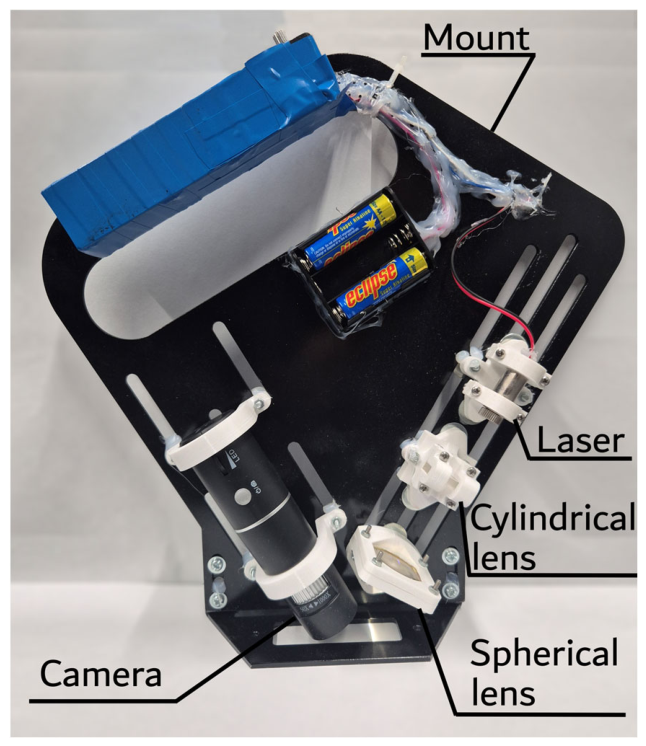
Microtexture measurements were performed using a custom-designed laser profilometer with a nominal maximum vertical and horizontal resolution of 6 μm (
Figure 1). However, the effective vertical resolution was approximately 10–20 μm, primarily limited by the laser beam thickness. The measured profile length (horizontal sampling range) was approximately 3.6 mm [
29,
30].
At each measurement location, 30 to 50 individual profiles were recorded and subsequently averaged to reduce random variability and improve measurement reliability. Measured profiles were randomly distributed within the measurement area. When fewer measurement points were available, additional profiles were recorded to reduce uncertainty and minimise error. The average microtexture roughness was used as the primary parameter for microtexture characterisation.
Macrotexture filtering was performed by applying a linear approximation to remove the macrotexture component from the measured profile [
29,
30]. The profilometer design enhances the representativeness of the captured microtexture, as measurements are obtained only from the protruding surface asperities that are directly involved in tire–pavement contact.
The measurement methodology has been presented in previous studies and has demonstrated high repeatability and reliability. A detailed description of the profilometer design and the data processing algorithm used for surface reconstruction and analysis is provided in those earlier publications [
29,
30].
A detailed statistical analysis of the method performed in previous publications, shows that the average standard deviation of a single microtexture measurement is 4.4 µm, resulting in an error margin of 1.2–1.6 µm at a 95% confidence level, for the studies described in
Section 3.1 and
Section 3.2, where 30–50 individual measurements were performed at each testing area. For the studies described in
Section 3.3 and
Section 3.4, where 70–100 individual measurements were obtained at each point, the corresponding error margin at a 95% confidence level is 0.85–1.0 µm.
2.3. Evaluation of the Microtexture Deterioration
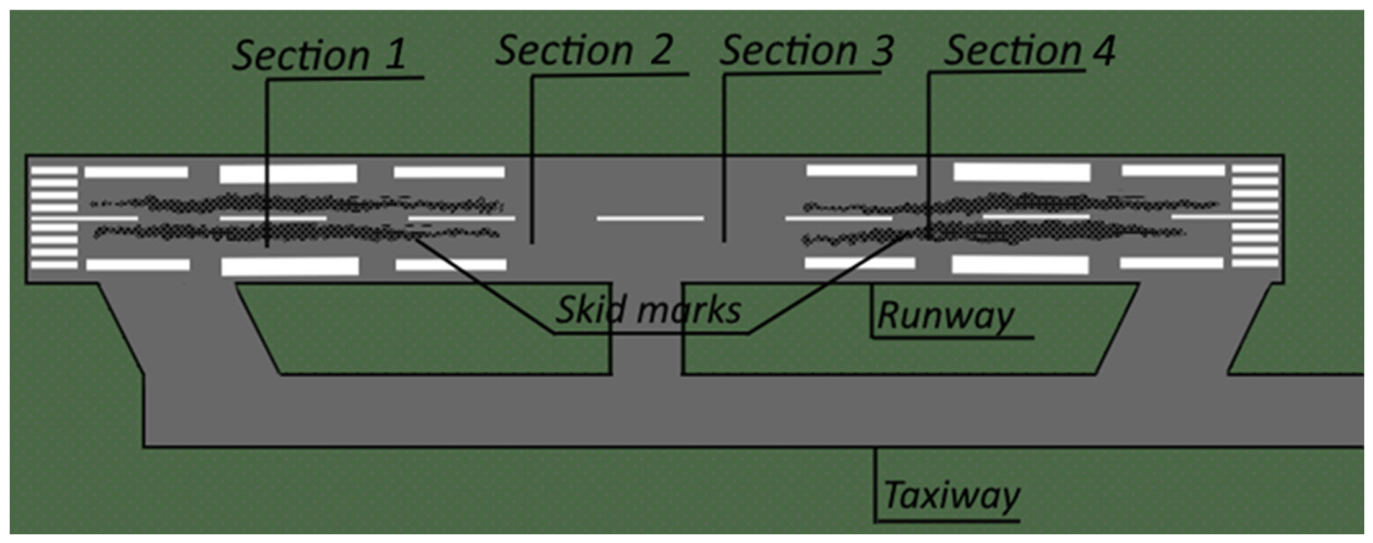
To evaluate microtexture deterioration, measurements were conducted at four cross-sections along the runway, as shown in
Figure 2. Each cross-section was subdivided into test zones in an ad hoc and non-uniform manner, due to airport operational constraints, with frequent aircraft movements requiring periodic interruption of the measurements.
2.4. Approximation of Number of Contacts
To evaluate the influence of individual landings on runway microtexture deterioration, it was necessary to consider the lateral distribution of landing aircraft. According to the Federal Aviation Administration [
31], the lateral distribution of aircraft during landing can be approximated by a normal distribution. In an earlier FAA study, the standard deviation of the lateral touchdown position on a 45 m wide runway was reported to be 2–3 m [
32].
In contrast, the ICAO Aerodrome Design Manual (Doc 9157, Part 3) recommends adopting a standard deviation of 0.75 m for pavement design purposes [
33]. More recent field measurements indicate a standard deviation of approximately 1.2 m in the touchdown zone, and 2.2 m in the mid-runway section [
34]. Comparable values were reported in a study conducted at Denver International Airport [
35]. For the purposes of the present study, the most recent field-based measurements were adopted, with a standard deviation of 1.2 m assumed for the touchdown zone and 2.2 m for the mid-runway section.
To estimate the number of tire contacts experienced by each portion of a runway cross-section during landing, the lateral width of the rubber track formed by the main landing gear was also considered. For most commercial aircraft, the width of a single tire imprint is approximately 0.5 m. Assuming a dual-wheel configuration, this corresponds to an effective track width of about 1 m on each side of the runway centreline. This simplified value was adopted to estimate the number of tire contacts within each region of the runway cross-section.
Accordingly, the approximate number of tire contacts (
n) within a segment of the cross-section bounded by lateral coordinates
x1 and
x2, can be determined from Equation (1) to Equation (3).
where
n is the approximate number contacts,
x1 and
x2 are lateral coordinates of the cross-section;
Fl(
x) and
Fr(
x) are the cumulative distribution functions for left and right landing gear, which are 3.1 m from the centreline;
pl and
pr represent the probabilities of tire contact within the cross-section during a single landing, for the left and right landing gear, respectively;
N is the total number of landings on a runway over considered time period;
w is the effective track width, taken 1 m in the present study.
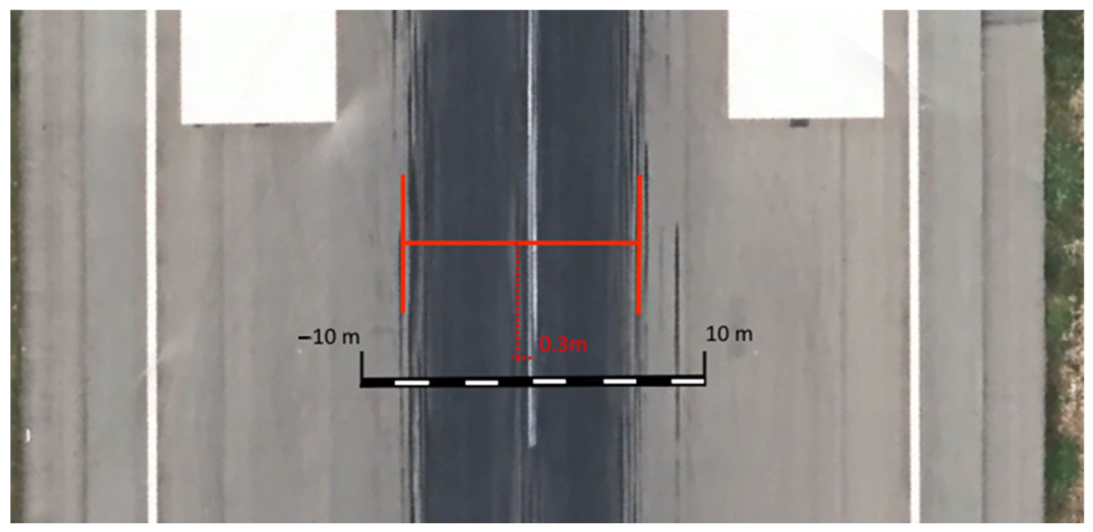
To improve the accuracy of the distribution model, a lateral shift of 0.3 m was introduced, based on visual observations of the rubber tracks (
Figure 3). This adjustment was applied to account for the prevailing crosswind conditions during landing operations on this particular runway.
2.5. Evaluation of Aggregate Polishing
To evaluate aggregate polishing, three test locations were selected on the runway. One location, situated near the runway edge, was designated as a control point. The second location was positioned 3 m from the centreline at the boundary between the touchdown zone and the mid-runway section. The third location was selected within the most heavily rubber-contaminated area of the touchdown zone, also 3 m from the centreline.
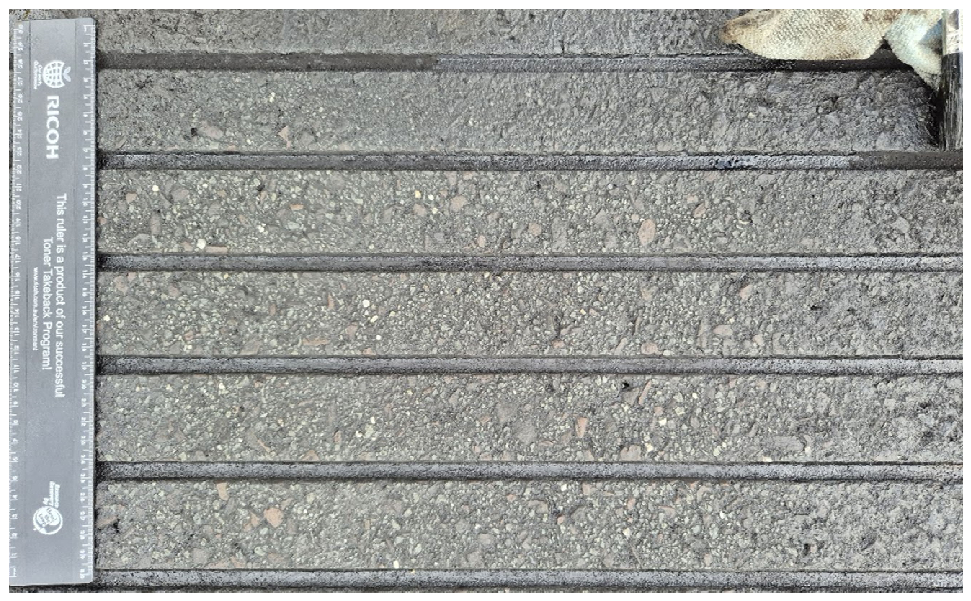
The selected points were subsequently cleared of rubber contamination and binder film using a mixture of industrial solvents, and gently cleaned with a soft fabric to preserve the original aggregate texture (
Figure 4). Although some degree of microtexture reduction may have occurred, due to residual binder within microtexture asperities and minor removal of fine aggregate during the cleaning process, all locations were treated using the same procedure. This consistent treatment enabled a valid comparison between the test points.
Three points were selected within each cleared area, which ranged from approximately 0.3 to 0.5 m2. At each point, more than 20 individual measurements were performed and subsequently averaged to ensure reliability. This resulted in a total of 72 to 116 individual measurements per cleared area.
2.6. Evaluation of the Effect of the Rubber Removal on Pavement Texture
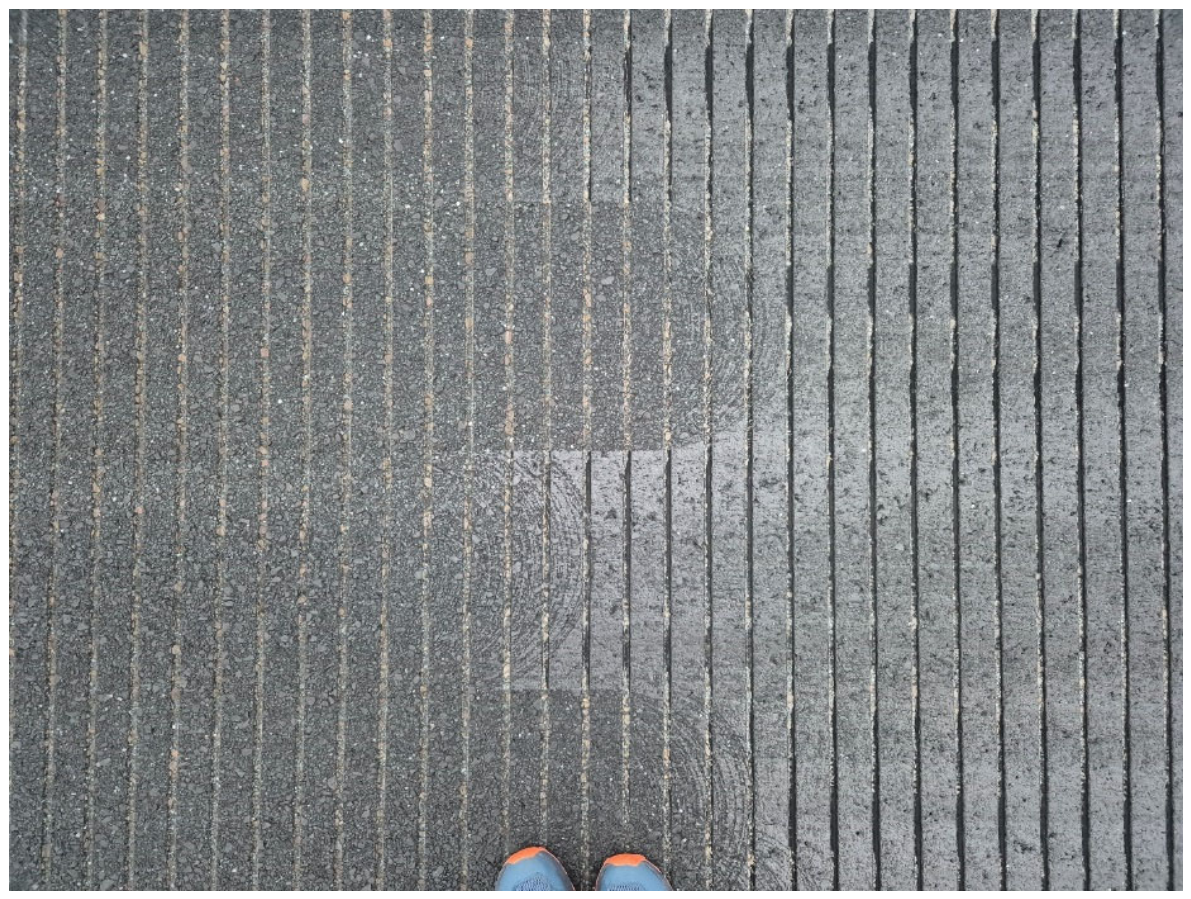
During the study, rubber removal was carried out in one touchdown zone, using high-pressure water blasting, a commonly employed method in airport maintenance practice. Microtexture measurements were conducted both within the treated area and in an adjacent untreated section. The two cross-sections were separated by approximately 2 m, providing sufficiently similar surface and operational conditions to enable a reliable comparison. The visual difference between treated and untreated sections is shown in
Figure 5. Each section was subsequently divided into nine equal areas, and microtexture measurements were performed within each area.
2.7. Evaluation of the Effect of the Rejuvenation Treatment
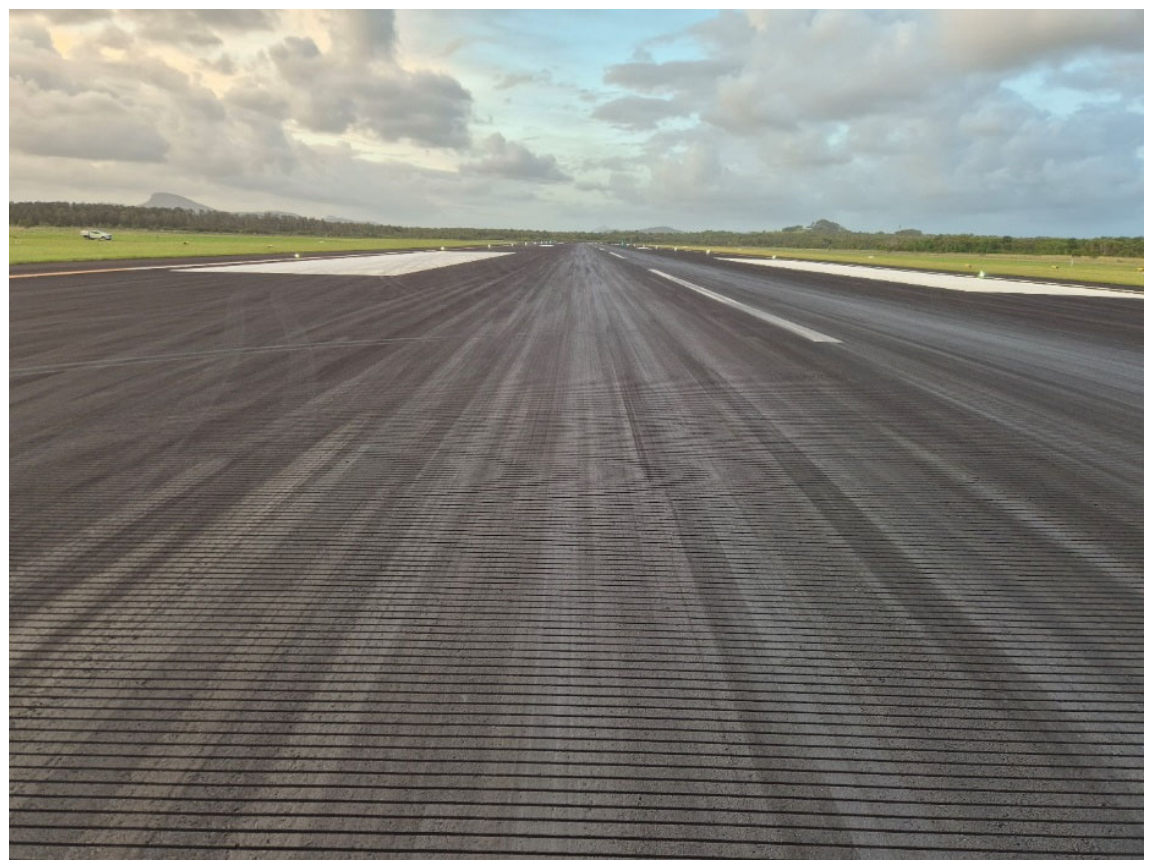
During this study, a rejuvenation treatment was applied to the pavement surface (
Figure 6). The treatment consisted of applying a sprayed modified bituminous product to the pavement surface for preservation, followed by the application of a fine (0.5–0.7 mm particle size) sand layer to ensure adequate skid resistance. The sprayed application rate was 0.45 L/m
2, with a sand application rate of 0.5 kg/m
2. The application method and rates were based on testing results to ensure even and complete surface coverage. Two months after the treatment application, microtexture measurements were performed at distances of 3 m, 4.5 m, 6 m, and 7.5 m from the runway centreline at the touchdown point.
2.8. Data Analysis
Data analysis and processing of microtexture profiles for this study were performed in MS Excel. Nonlinear regression analysis was applied to assess the relationship between the estimated number of tire contacts and the measured microtexture roughness. Differences in average microtexture roughness, between selected test locations were used to assess aggregate polishing and were evaluated using a Student’s t-test, with statistical significance determined at a p-value of less than 0.05.
A local (one-at-a-time) sensitivity analysis was performed for the tire wandering (contact distribution) model. The key input parameters (standard deviation of lateral distribution, lateral shift, distance to the rubber track, and effective track width) were varied individually around their baseline values, while all other parameters were kept constant. The resulting changes in the deterioration model coefficients, coefficient of determination, and estimated number of tire contacts were used to assess model sensitivity and robustness.
3. Results and Discussion
3.1. Microtexture Across the Cross-Section of the Runway
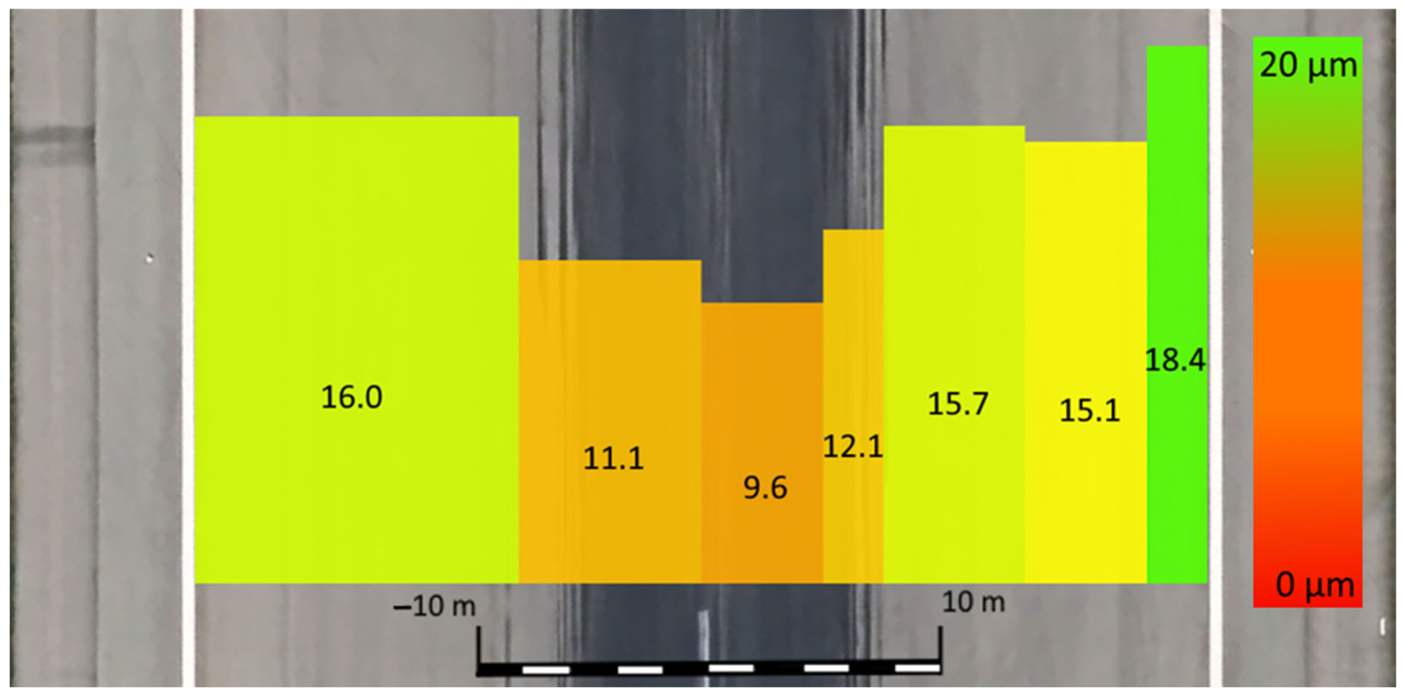
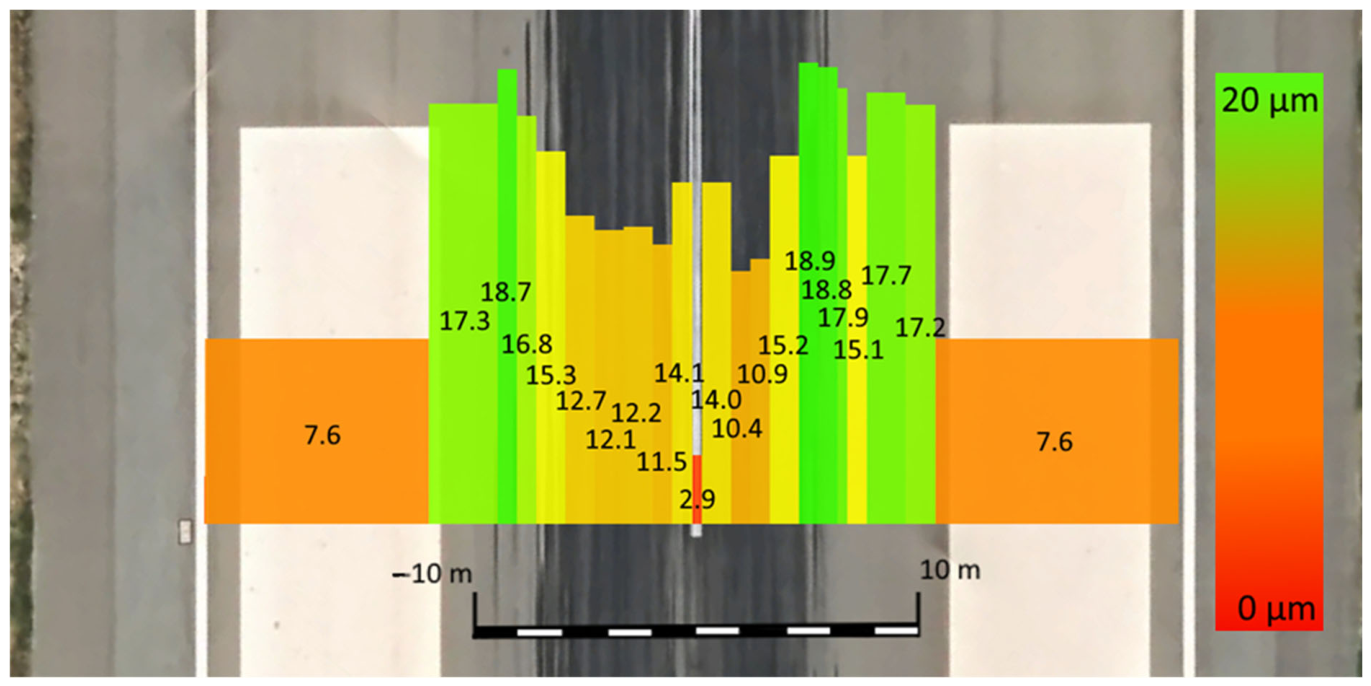
Figure 7 shows the average microtexture roughness at different portions of
Section 1 at the runway touchdown point. A significant reduction in microtexture was observed within the rubber-contaminated area. Microtexture closer to the extremities remained largely unchanged, ranging from approximately 16 to 18 μm.
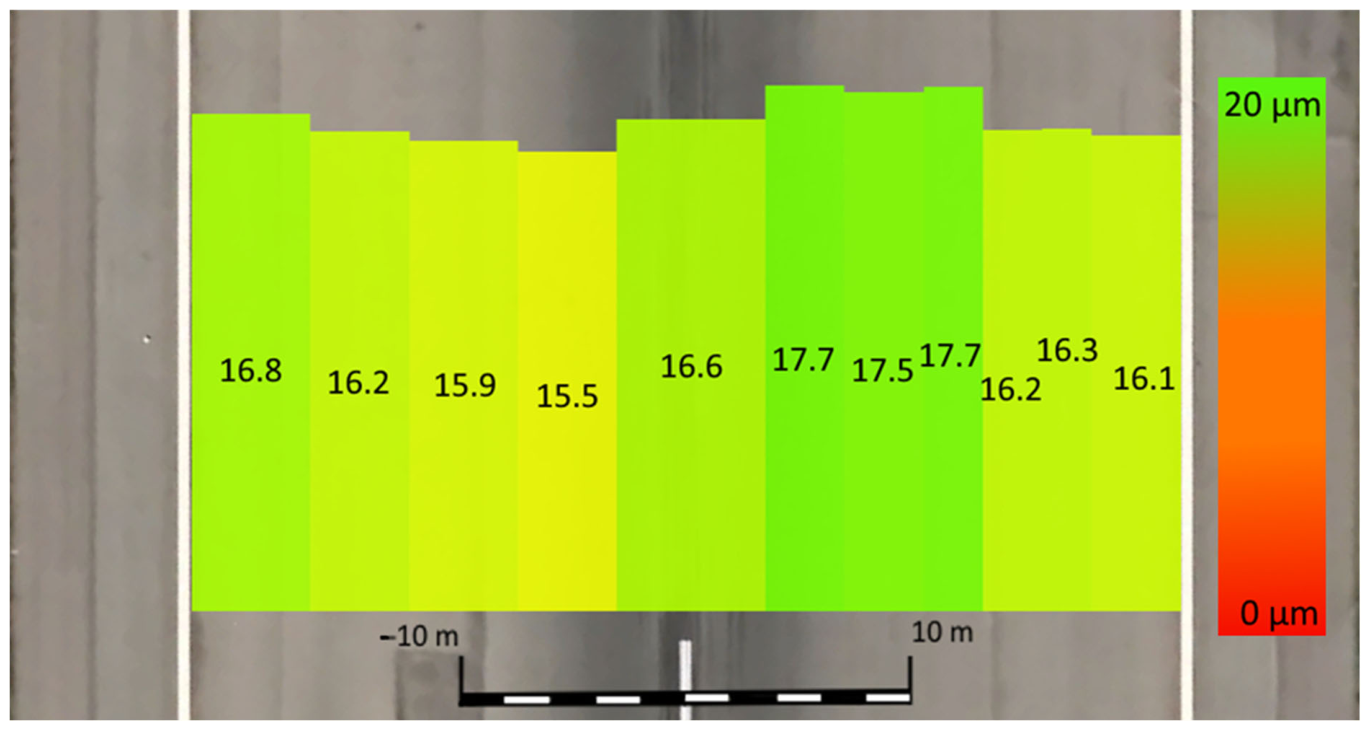
Figure 8 and
Figure 9 show microtexture measurement results from
Section 2 and
Section 3 in the middle zone of the runway. A slight reduction in microtexture was observed closer to the left side of the section, near the exit taxiway. However, this reduction was not significant. Overall, the microtexture level in the middle zone was slightly lower than at the extremities in the touchdown zones, which was attributed to irregular aircraft movements across the cross-section, and the proximity of the exit taxiway.
Figure 10 shows microtexture measurement results from
Section 4 at the second touchdown point. Similar to
Section 1, a significant reduction in microtexture was observed around the rubber-contaminated area, including the influence of an individual rubber track on the right side of the section, with an average microtexture roughness of approximately 17 μm.
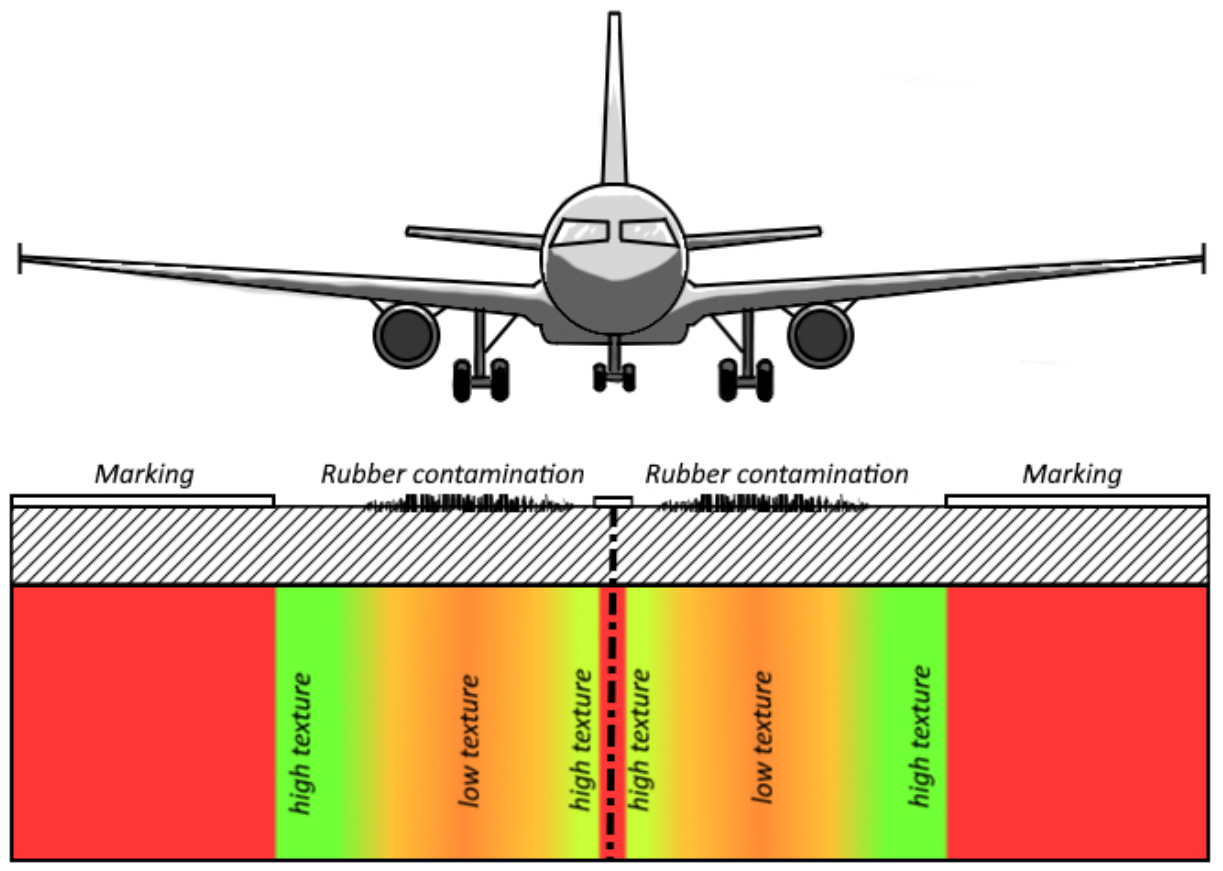
In all sections, microtexture closer to the runway edges was not significantly affected by aircraft traffic, whereas the centre of the runway exhibited reduced microtexture. The microtexture of pavement markings was also significantly reduced in all cases. This reduction in the marking areas was attributed to the inherent smoothness of the paint layer forming the markings, and is therefore unavoidable. Nevertheless, it is important to account for this effect in order to provide a complete description of microtexture variation across the runway width.
Overall, the measurement results demonstrated the effectiveness of laser profilometry as a tool for microtexture assessment and, more generally, for evaluating surface deterioration due to pavement wear and rubber contamination.
Figure 11 shows a typical variation in microtexture across the transverse profile of the runway.
3.2. Microtexture Deterioration Rate
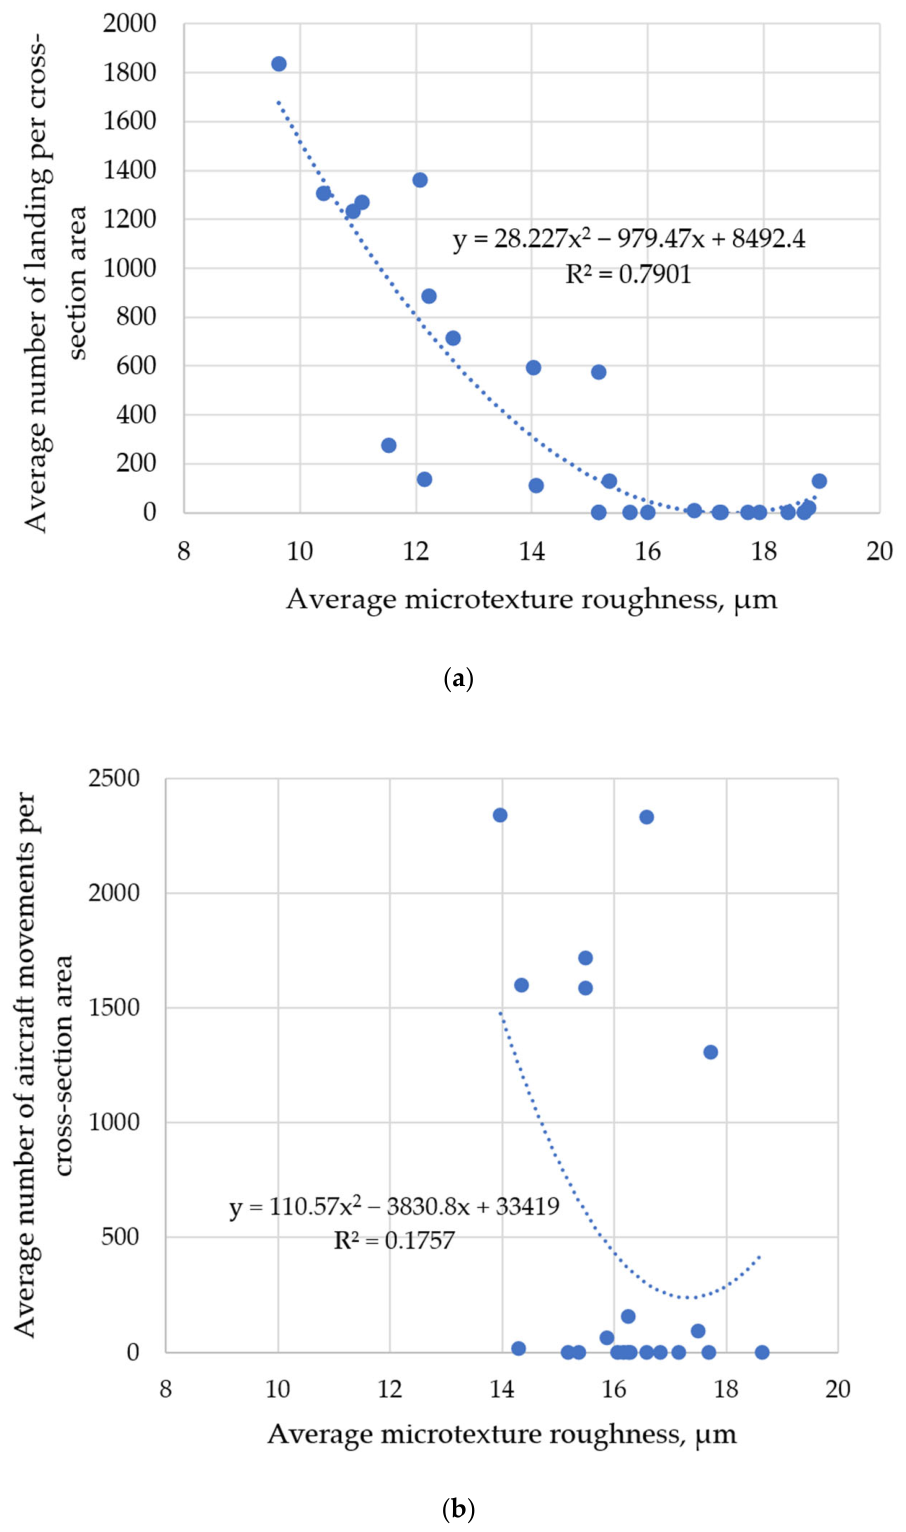
When comparing microtexture in each area with the approximate number of tire contacts calculated using Equations (1)–(3), a relationship was observed for the touchdown zones, and for the middle of the runway, as shown in
Figure 12. A strong correlation existed between the number of contacts and average microtexture roughness in the touchdown zones (R
2 = 0.79). In the middle zones, no significant correlation was observed (R
2 = 0.18). This was attributed to the generally lower microtexture reduction rate in these areas, and the proximity of the exit taxiway, which makes the contact distribution model less valid for the middle of the runway. Field observations confirmed that most aircraft deviate from the runway centreline in the middle zone before entering the exit taxiway, and it was not possible to establish a wandering pattern similar to that observed in the touchdown zone.
Overall, microtexture degradation was nonlinear, approaching an asymptotic value as the surface deteriorates and the microtexture reaches a value around 10–12 μm. These results are consistent with those reported in previous studies [
24].
To assess the robustness of the proposed model for estimating the number of tire contacts and the microtexture deterioration rate, a local (one-at-a-time) sensitivity analysis was performed for the contact evaluation model presented in
Section 2.4 (Equations (1)–(3)), which was used to estimate the microtexture decay rate discussed here.
The main input parameters (standard deviation of the lateral distribution, lateral shift of the rubber track, distance to the rubber track, and effective track width) were individually varied within plausible ranges representative of runway conditions, including both positive and negative extreme variations, in order to assess the robustness of the contact evaluation model. The resulting microtexture deterioration model is expressed as Equation (4).
where
n is the approximate number of tire contacts,
Ra is the average microtexture roughness,
a,
b and
c are polynomial coefficients of the model.
The influence of variations in the input parameters on the model coefficients (
a,
b, and
c), the coefficient of determination (R
2), and the estimated number of contacts required to reduce the average microtexture roughness (
Ra) to 11 µm was evaluated. The results of the analysis are presented in
Appendix A. The results indicate that the model is generally robust with respect to the tire wandering effect.
In general, variations in parameters such as standard deviation (±50%), lateral shift (±200%), and distance to the rubber track (±50%) do not significantly affect the correlation between the number of contacts and average microtexture roughness, the microtexture deterioration model coefficients (Equation (4)), or the approximate number of contacts required to reduce the average microtexture roughness to 11 µm. However, due to the proportional effect of tire width on the estimated number of contacts, variations in this parameter can significantly influence the output.
As this study was based on a case study, the results are most reliably applicable to airports with similar runway surfaces and traffic compositions, primarily consisting of narrow-body passenger aircraft such as the Boeing 737 and the Airbus A321, operating on runways with grooved dense graded asphalt concrete surfaces.
3.3. Aggregate Polishing Under the Aircraft Loading
The results of the aggregate polishing evaluation are presented in
Table 1. A typical reduction of 6.4–14.5% in average aggregate microtexture roughness was observed 3 m from the centreline, compared to the control point, with a less significant reduction in the zone with heavy rubber contamination. Comparing these results with the total average microtexture reduction of 7 μm, it was estimated that approximately 25% of the overall microtexture deterioration is attributable to pavement wear for the studied runway.
The greater reduction observed at the point between the touchdown zone and the middle zone suggests that heavy rubber contamination protects the aggregate microtexture from polishing, which may enhance the effectiveness of rubber removal. Although a limited number of measurements were performed, the obtained values can be used to characterize the surface polishing rate under heavy aircraft loading. It is noted that the polishing is not uniform and occurs only in areas of direct contact between the tire and the aggregate surface. Consequently, it cannot be applied to the surface area already protected by rubber contamination. Therefore, most of the polishing in the touchdown zone occurs during the early stages of roughness deterioration, simultaneously with the initial accumulation of rubber.
The polishing resistance of the runway pavement was not previously evaluated. However, based on the asphalt mixture type and aggregate properties, it was classified as moderate. This assessment reflects the typically low polishing resistance of dense-graded asphalt mixtures [
36] combined with the moderate to high polishing resistance of the trachyte aggregate [
28]. Consequently, the studied runway represents a suitable case for objective estimation of the surface polishing rates.
3.4. Microtexture Recovery During the Rubber Removal and Rejuvenation
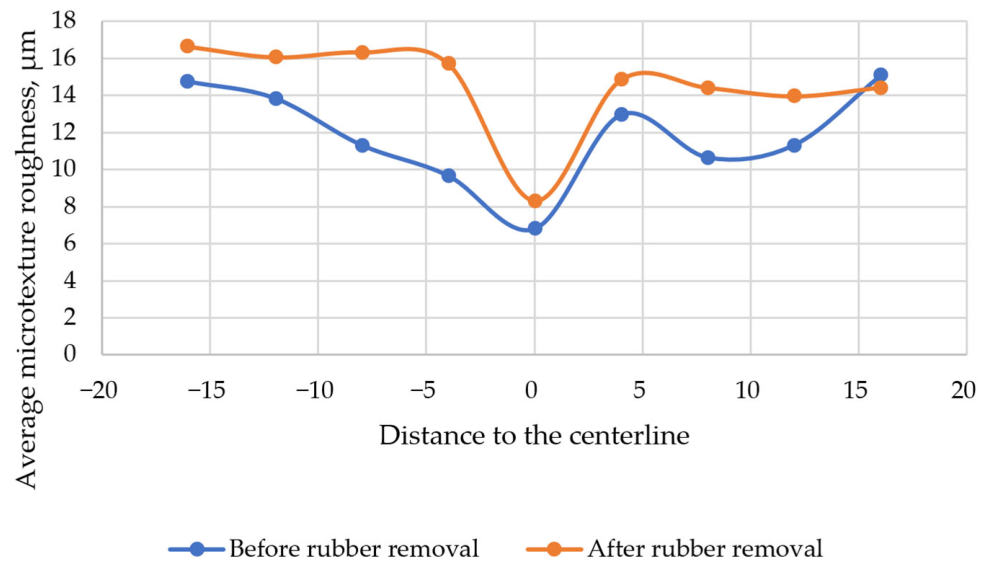
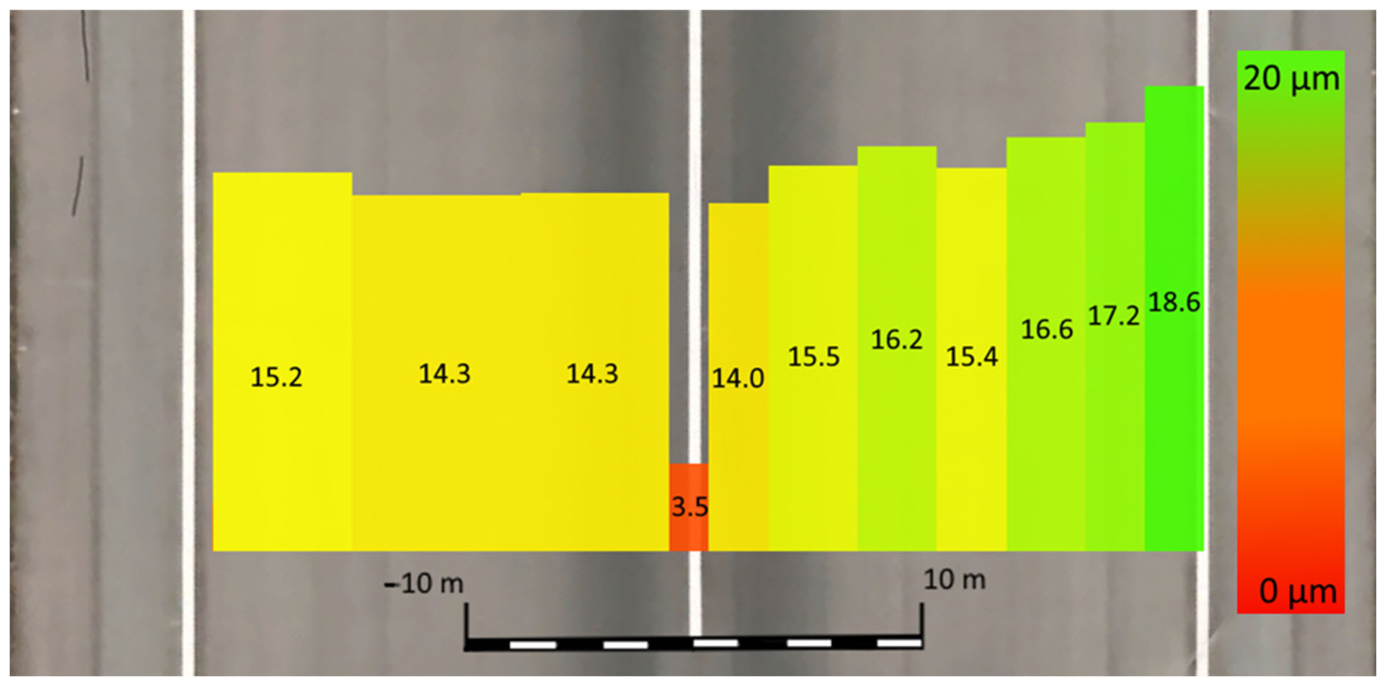
Figure 13 shows the results of microtexture evaluation at a cross-section with rubber removal and at a location 2 m away, without rubber removal. For the purposes of this study, it was assumed that microtexture at both sections was similar prior to the removal. The measurement point at the centreline included results from the runway centreline marking.
According to the measurement results in
Figure 13, rubber removal restored the average microtexture roughness to values of 14–16 μm, which is similar to the average microtexture previously observed closer to the edges of the runway (16–18 μm). After rubber removal, the average microtexture roughness was consistently high across the entire cross-section, suggesting that microtexture restoration is largely independent of prior wear and contamination. These findings correspond to the friction measurement results obtained before and after rubber removal in a previous study on the same runway [
26].
Although aggregate polishing was observed previously, it did not significantly affect microtexture at the touchdown zone following rubber removal. This suggests that the rubber removal treatment also restored the aggregate microtexture, through mechanically aggressive action during the procedure. The present study does not evaluate the long-term durability of this microtexture improvement, although previous friction-based studies indicate that the durability of friction improvement following rubber removal is sufficient to maintain safe runway operation [
26].
Microtexture measurements after the application of pavement rejuvenation showed a temporary increase in microtexture, which then quickly diminished at the touchdown zone, during subsequent aircraft landings (
Table 2). While the primary purpose of rejuvenation is to protect the pavement material, it can increase surface slipperiness, which is mitigated by the application of fine sand. Measurement results indicate that such treatments can be readily removed by aircraft traffic, an effect that should be considered when planning rejuvenation application. Although this effect has been discussed previously, the durability of fine sand coatings has received limited attention [
22,
37].
Although quantitative assessment of the sand coating deterioration rate after the rejuvenation treatment is not possible, due to measurements being limited to a single runway cross-section and a relatively short post-treatment observation period, the results nevertheless indicate rapid deterioration of the sand coating following the treatment. This conclusion is based on the assumption that immediately after application of the sand coating, the microtexture across the runway width was uniform. Although some pre-existing reduction in microtexture closer to the runway centreline is expected due to initial rubber contamination, the application of the polymer layer and subsequent sand coating likely minimized the influence of these differences, making the assumption reasonable within the framework of this study.
3.5. Pavement Life-Cycle in Terms of Surface Microtexture
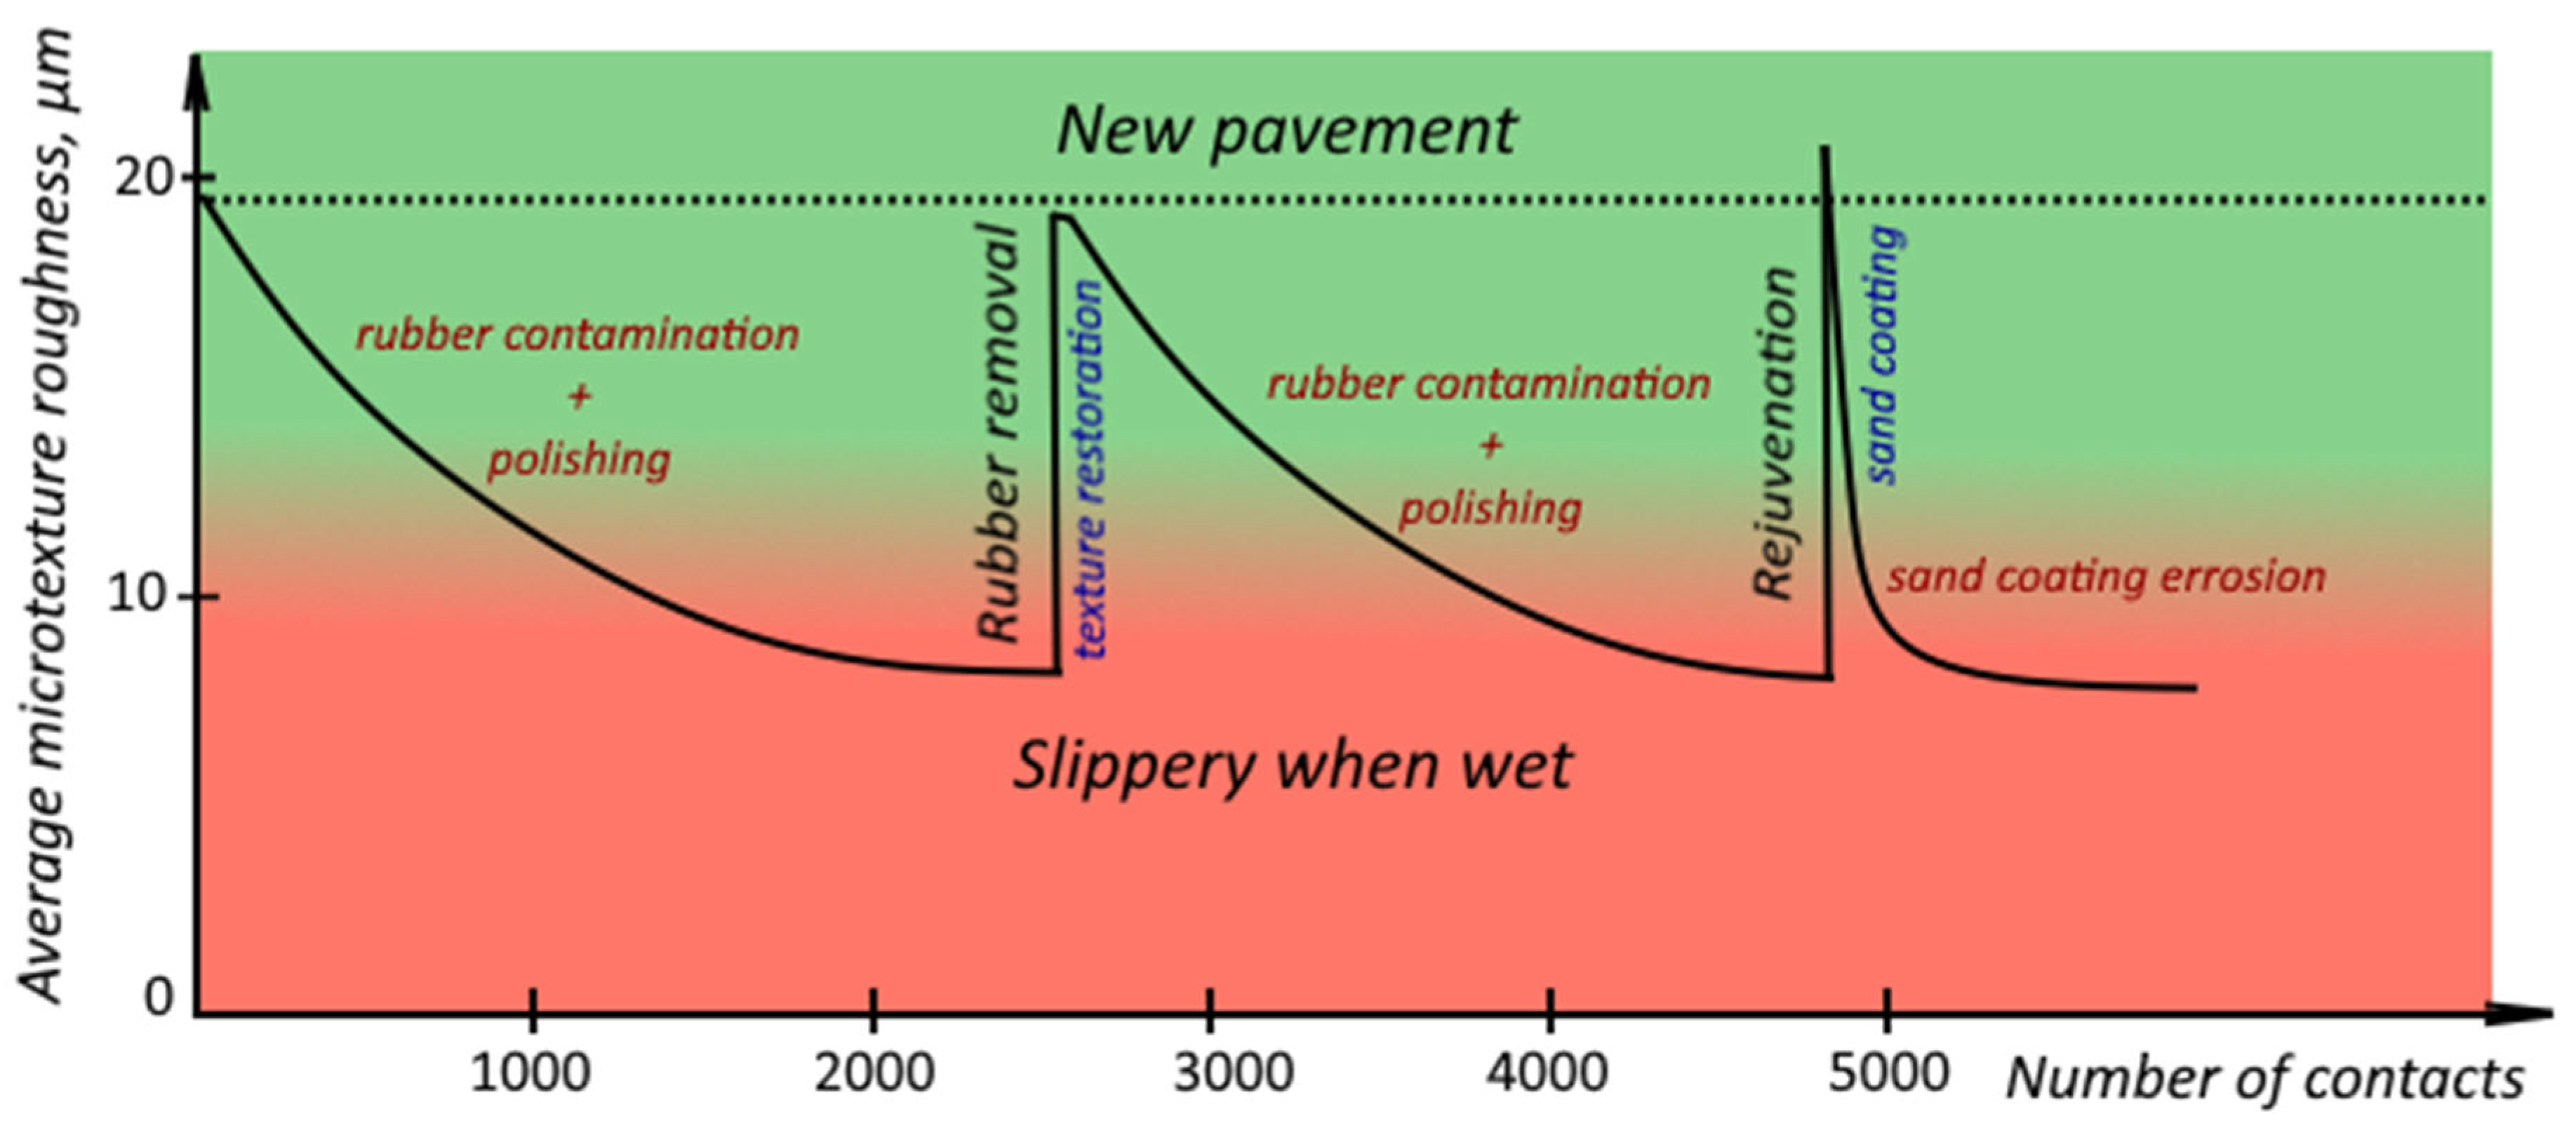
Based on the obtained data, the following trend in microtexture change during runway operation can be identified (
Figure 14). This trend includes periods of microtexture deterioration during normal operation, as well as microtexture recovery phases resulting from rubber removal and rejuvenation treatments. This trend can serve as a guideline for runway friction assessment and maintenance planning with respect to surface microtexture. However, the magnitude of the specific values would be specific to the runway surface and operational conditions, with the value shown applying to the runway studied.
Unworn and uncontaminated asphalt pavement exhibited high microtexture, up to 18 μm in the case of the studied runway. Microtexture is primarily provided by the individual fine aggregate particles and the surface irregularities of the coarse aggregate. During aircraft landings, intense heat and stress in the contact zone cause rubber to build up and polish the microtexture, reducing it at a non-linear rate. Up to 25% of the total microtexture reduction was attributed to coarse aggregate polishing in the case of this runway. This indicates that less polishing-resistant aggregate can increase the overall rate of microtexture reduction, which should be taken into account during maintenance planning and skid-resistance management. However, more resistant aggregate cannot completely prevent microtexture deterioration, as in the case of this runway, most of the degradation is caused by rubber accumulation.
The rate of microtexture reduction slowed as the surface deteriorates. After approximately 1100 tire contacts, the average microtexture roughness drops to 11 μm, indicating heavy rubber contamination. Although it was not possible to establish a minimum average microtexture roughness level from a single runway, the correlation with the British Pendulum Number obtained previously [
29] can be used, with a coefficient of friction of 0.5 serving as an analogue of the maintenance planning level established in international standards [
3,
38]. In this context, an average microtexture roughness of 11 μm can be considered an equivalent threshold, which corresponds to tactile and visual assessments of the studied runway, as well as previously analysed friction measurement results. It is clear, however, that the average microtexture roughness threshold requires precise determination in future studies and value used in this study is preliminary and site-specific.
Microtexture recovery can be achieved through treatments such as rubber removal or as part of surface rejuvenation. Based on the results from the studied airport, rubber removal restored surface microtexture nearly to its original level. Although skid resistance recovery after rubber removal was sufficient, the overall degradation of pavement materials, due to such treatments, which includes ravelling, microcracking, and binder removal, should not be ignored [
20]. Temporary treatments, such as the application of a fine sand layer as part of surface rejuvenation, can increase microtexture to high values, but the durability of such treatments appears to be limited.
4. Conclusions
This study presented the results of microtexture monitoring conducted at different sections of a runway using a laser profilometer. The results included measurements across multiple runway zones, an evaluation of aggregate polishing, and an assessment of the influence of rubber removal and rejuvenation treatments. For the investigated runway, the original dense-graded asphalt exhibited an average microtexture roughness of approximately 18 μm. The microtexture deterioration rate was found to be non-linear, decreasing to approximately 11 μm after roughly 1100 individual tire contacts within the touchdown zone. The deterioration rate in the middle zone could not be clearly established, likely due to the higher variability and uneven traffic distribution associated with the proximity to the exit taxiway. Within the touchdown zone cross-sections, two distinct areas of reduced microtexture were identified along the rubber tracks, and the lowest microtexture values were recorded at the pavement markings. The aggregate polishing analysis indicates that approximately up to 25% of the observed microtexture reduction can be attributed to aggregate polishing. However, in areas with the heaviest rubber contamination, a lower degree of polishing was observed, which may be explained by the protective effect of rubber deposits limiting direct aggregate exposure. Two microtexture restoration methods were evaluated: rubber removal and sand spreading after rejuvenation treatment. Rubber removal restored the pavement microtexture to nearly its original level across the entire cross-section, including partial recovery of polishing effects due to aggressive mechanical action. The application of the fine sand after surface rejuvenation initially increased the microtexture to approximately 22 μm. However, this treatment exhibited rapid microtexture deterioration. The results of this study support the use of microtexture measurements for surface condition assessment alongside the conventional methods of the skid resistance assessment. A consistent trend of microtexture reduction within the touchdown zone was identified, which may serve as a reference for maintenance planning and runway condition evaluation. Future research should include different airports and focus on establishing threshold values for average microtexture roughness to support maintenance decision-making and to improve the prediction of wet-runway slipperiness. In this context, microtexture measurement may provide a cost-effective and flexible alternative for runway surface assessment.