1. Introduction
Ballast is the primary granular component of conventional railway systems, and its structural function is critical to efficient load transmission, track geometry stability, and adequate dynamic performance under repeated traffic. Due to its granular nature, ballast is susceptible to several degradation mechanisms, including permanent strain, particle breakage and rearrangement, abrasion, and fracture. These processes lead to stiffness degradation, differential settlement, and recurrent maintenance requirements [
1,
2].
In urban railway systems, ballast degradation is further intensified by high travel frequency, dynamic effects from stopping and acceleration, and geometric constraints that limit the height of the track support layers [
3,
4]. Unlike high-speed railway lines, where train speed is often the dominant parameter, urban tracks are characterized by axle loads, high-frequency loading, and relatively low confinement. This combination produces complex degradation patterns, in which ballast becomes the governing component controlling track deformation and long-term performance. Experimental and numerical studies have shown that ballast response under cyclic loading is highly sensitive to intrinsic material properties, such as mineralogy, particle angularity, and particle size distribution [
5,
6], as well as to operational variables, including load amplitude, train speed, and lateral confinement [
4,
7]. Despite these advances, traditional design methods are still unable to predict permanent deformation and degradation under repeated loading, primarily because granular materials are strongly nonlinear and loading history-dependent, and because particle breakage plays an explicit role.
Numerical modelling has become a key tool for investigating ballast behavior under cyclic train loading. The Discrete Element Method (DEM) is widely used to simulate ballast at the particle scale level, as grain interactions are explicitly resolved, enabling the analysis of force chains, particle rearrangement, and breakage processes. DEM simulations have successfully reproduced key degradation mechanisms observed in laboratory and field studies, including rapid initial settlement followed by gradual stabilization in ballasted tracks [
8,
9].
Recent advances in DEM-based modelling have further enhanced the understanding of ballast behavior through including more realistic representations of particle breakage, contact behavior, and track–structure interaction. For instance, the micromechanical effects of particle breakage on ballast response, the influence of sleeper movement on degradation mechanisms, and the role of material stiffness and recycled aggregates in track performance have been extensively investigated. In addition, coupled and hybrid formulations have enabled the simulation of vehicle–track interaction and differential settlement under realistic loading conditions. These developments have significantly enhanced the capability of DEM to capture both the macroscopic response and the underlying micromechanical processes governing railway ballast systems [
10,
11,
12,
13,
14,
15]. Although these findings highlight that performance-based design approaches must explicitly incorporate deformation and degradation mechanisms rather than relying solely on conventional stability indicators, there is still a lack of an integrated approach for considering hybrid DEM-FDM for railway ballasted track that can provide performance indicators for safety factors and long-term expected deformations simultaneously.
This study presents a three-dimensional hybrid DEM–FDM numerical framework to simulate the dynamic response of conventional ballasted railway tracks under cyclic loading. The proposed approach combines a continuum-based finite-difference model, used to evaluate global stability indicators such as the safety factor, with a discrete–continuum formulation that explicitly represents ballast micromechanical behavior, including particle rearrangement, deformation accumulation, and breakage. Emphasis is placed on identifying the governing deformation mechanisms and the transitions among behavioral regimes. This early-stage response governs the evolution of permanent deformation and enables identification of the transition to shakedown behavior, widely recognized as a key indicator of long-term performance in granular track systems.
Within this framework, the study focuses on (i) comparing the performance of different ballast materials (basalt, granite, and limestone), (ii) evaluating the influence of ballast layer thickness (0.25, 0.35, and 0.40 m), and (iii) establishing a quantitative relationship between the safety factor and permanent deformation expected during rolling stock operation. By linking traditional stability-based metrics with discontinuous deformation-based performance indicators, a rational basis for performance-oriented design and assessment of railway track systems under cyclic loading is provided.
2. Methodology
In modern rail track design, railway ballast performance under dynamic loading is a key issue, which must be evaluated to properly assess track durability, establish maintenance programs, and ensure safety in both urban and inter-urban railway track systems. The interaction among the rail, sleeper, and ballast layers governs permanent settlement, track geometry stability, and the overall support structural response, particularly under repeated loading from frequent train passages. Ballast exhibits a highly nonlinear mechanical response under repeated train loading. Changes in stiffness and progressive softening depend on loading history, granular geometry arrangement, confinement conditions, and particle degradation. Under cyclic loading, ballast behavior passes through several response stages: shakedown, ratcheting, and plastic collapse. These stages determine whether permanent deformations stabilize or continue accumulating with increasing load cycles. Thus, their characterization is essential for assessing track durability and maintenance requirements.
In conventional practice, the design of the railway track support system is based on an implicit imposed factor of safety, neglecting the importance of properly establishing the expected plastic deformation accumulation, as summarized in
Table 1.
To establish a quantitative relationship between the factor of safety and the permanent strain (ε
p), a numerical investigation was conducted to evaluate the development of permanent deformation within the track support system. A parallel modeling strategy was adopted, combining a hybrid DEM–FDM approach with a conventional continuum model based on the finite difference method, for several rail track support configurations with varying granular layer thicknesses.
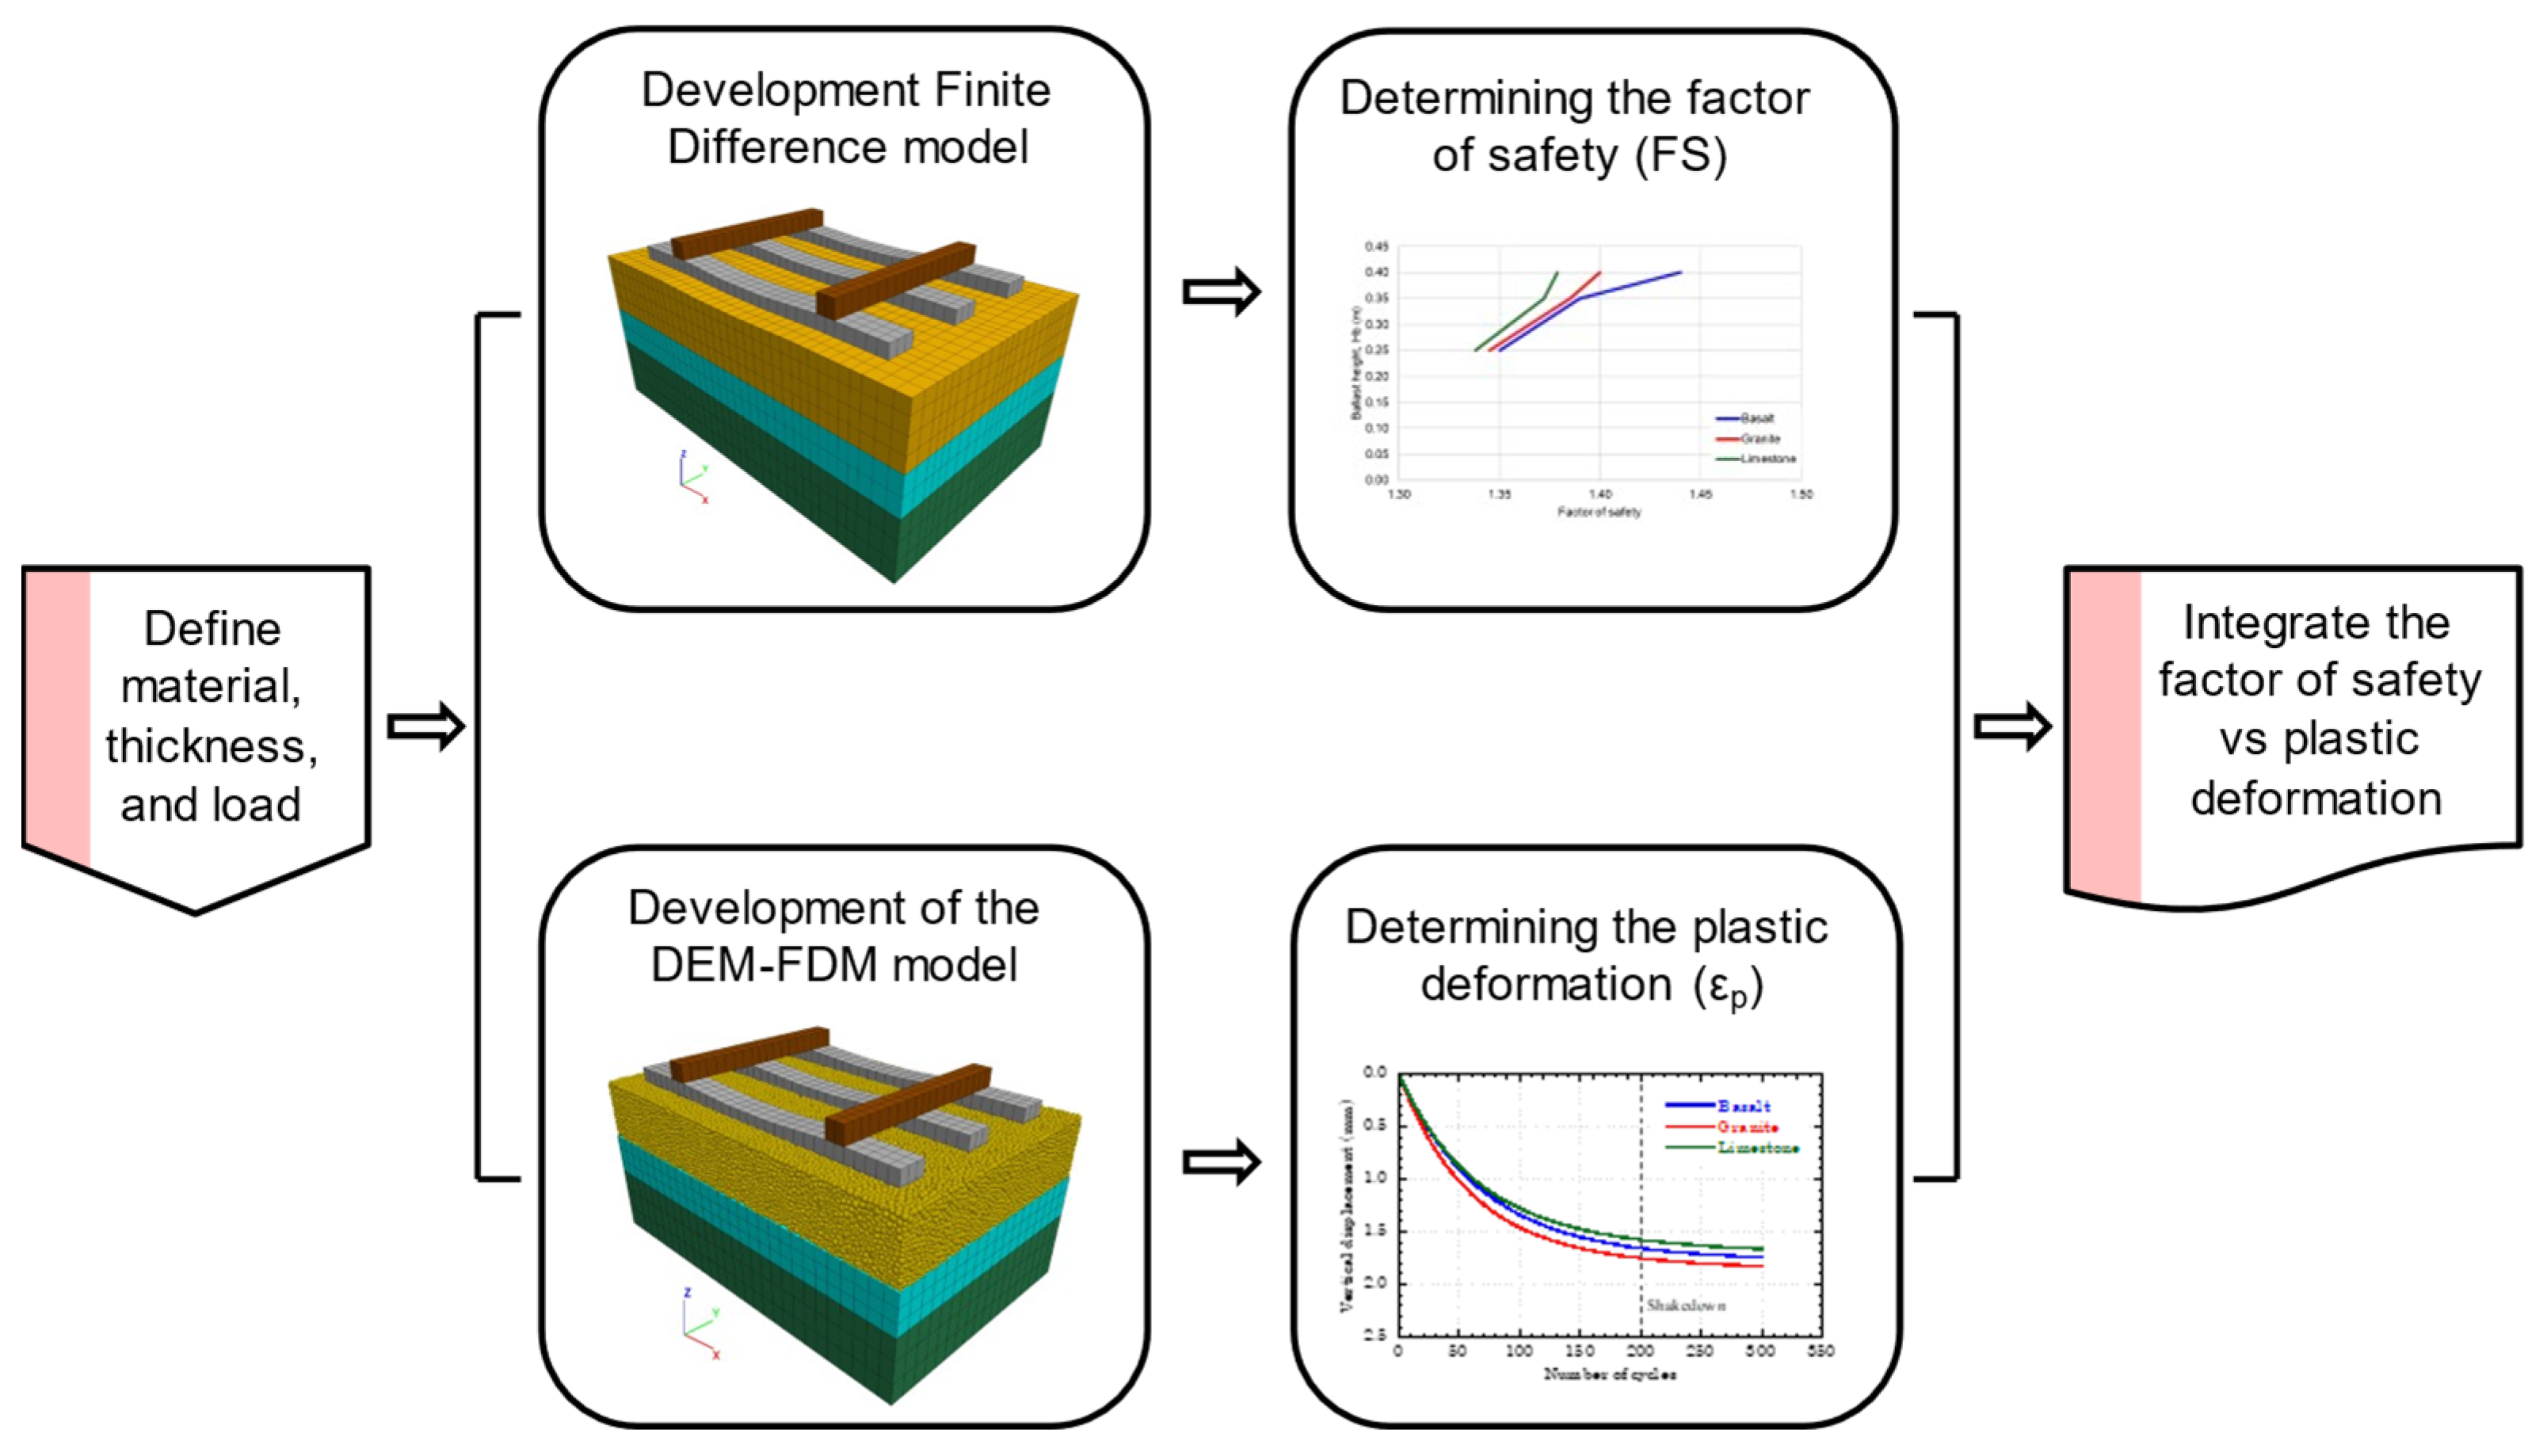
Figure 1 depicts the methodology employed.
3. Numerical Modelling
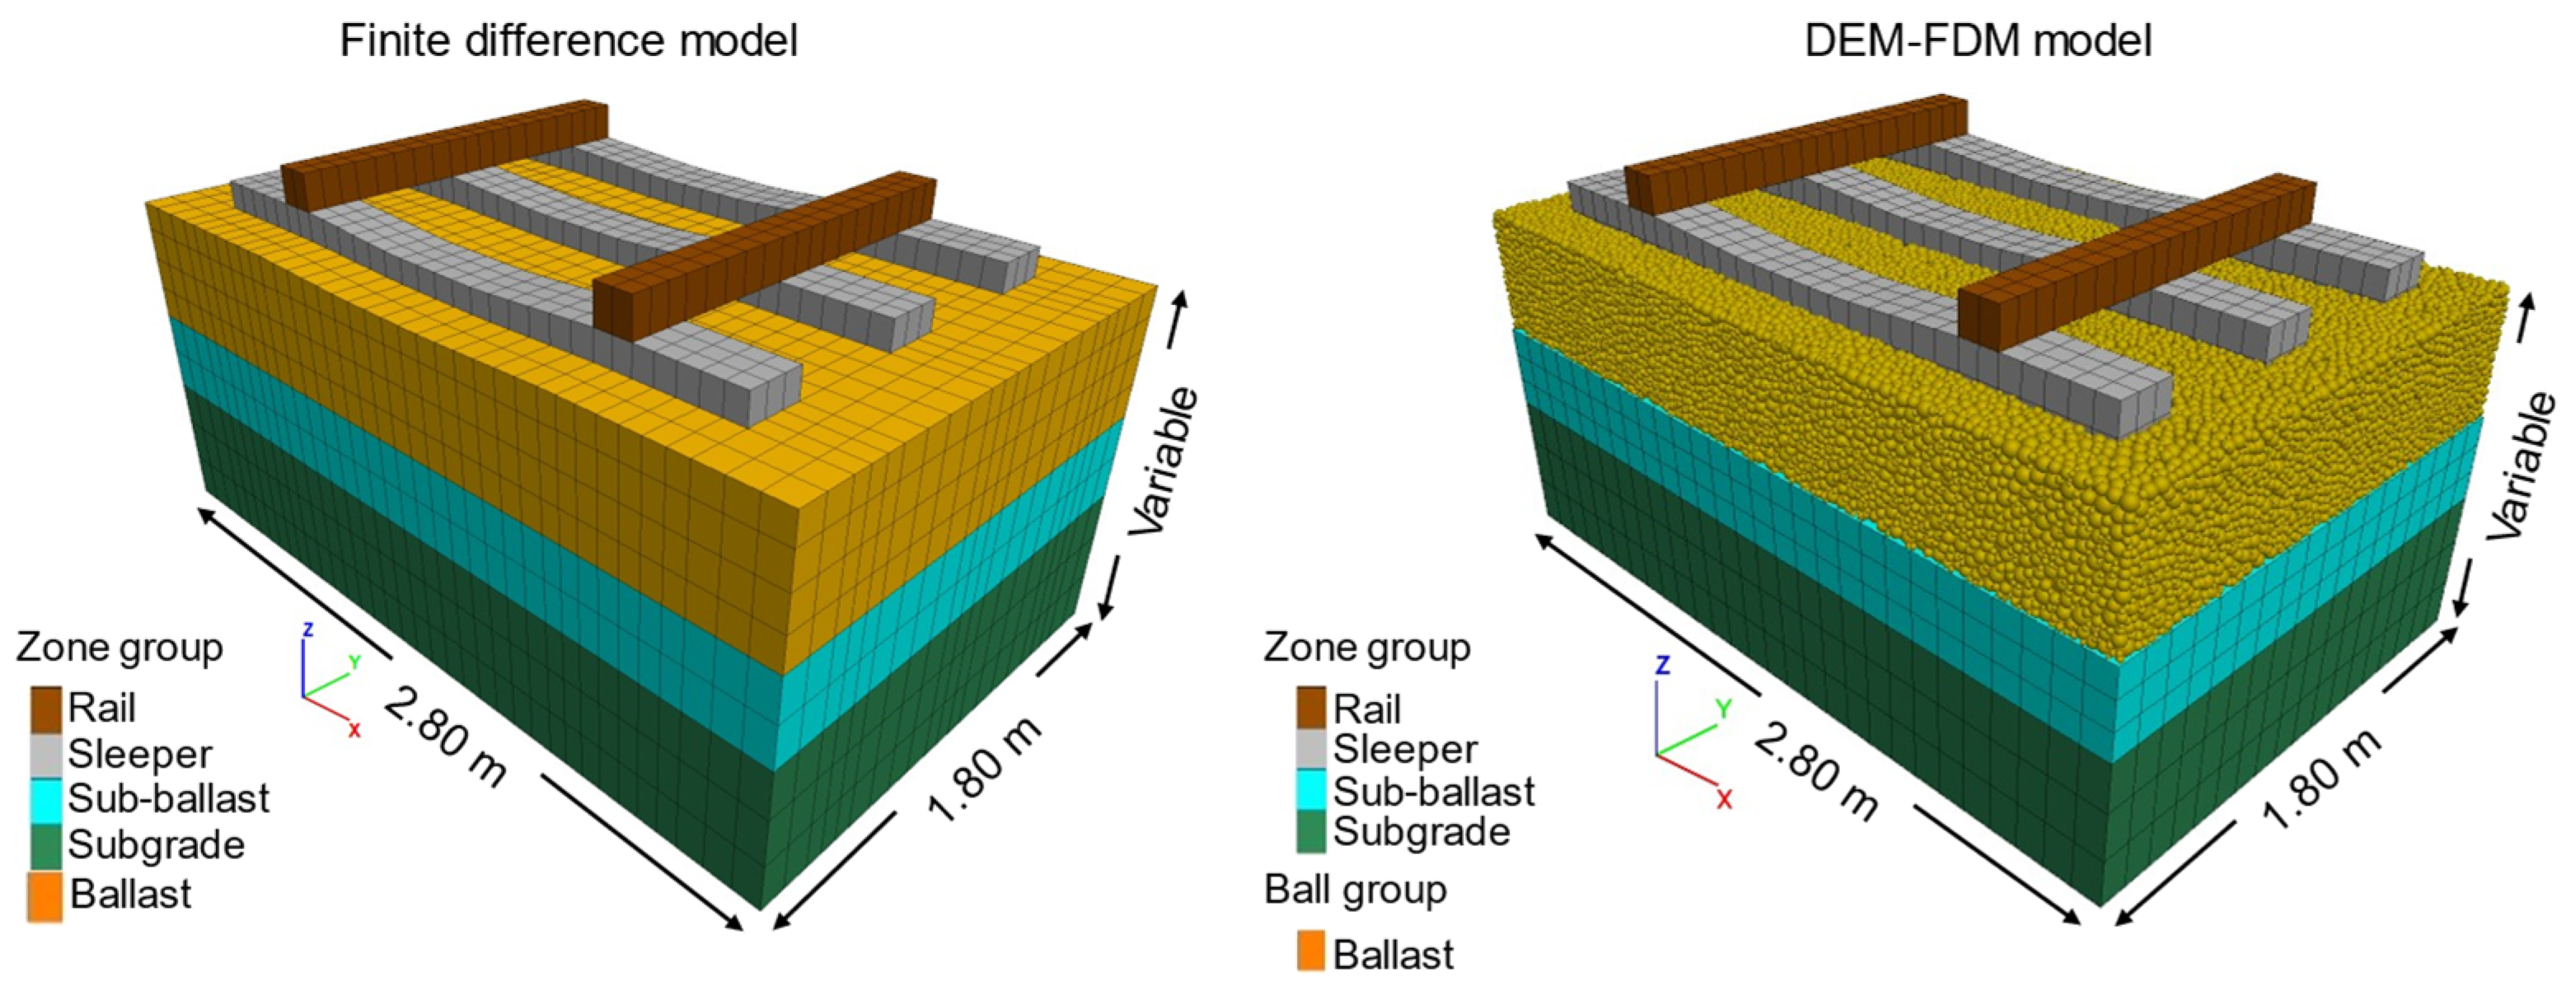
The numerical models implemented in this study, namely the finite difference models (FDM) and the DEM–FDM hybrid models, are schematically illustrated in
Figure 2. The following sections provide a comprehensive description of the modeling criteria adopted for both approaches, including geometric definitions, assigned material properties, boundary conditions, particle generation, calibration within the DEM framework, and the particle breakage criterion used in the hybrid models.
3.1. Hybrid DEM-FDM Model
Three-dimensional coupled numerical models were developed using the finite-difference method (FDM) implemented in FLAC
3D, and the discrete element method (DEM) coded in PFC
3D (Particle Flow Code 3D) [
23]. The contact model parameters used in the coupled analyses were calibrated against triaxial test results reported in technical literature [
24,
25,
26]. The model parameters were established through an iterative procedure where the simulation output was compared with the experimental data, and the error was minimized sequentially, to ensure that the calibrated contact properties provided an adequate representation of ballast mechanical behavior within the coupled DEM–FDM framework.
3.2. Particle Contact Model
For the hybrid model, particle contact was simulated using the linear rolling resistance (RRLM) model, implemented in the discrete element software PFC
3D version 6.0, which extends classical contact formulations to capture dissipative mechanisms associated with relative rotational motion among particles and between particles and boundaries. Although often neglected in simplified modeling approaches, rolling resistance plays a key role in granular materials, where micro-scale surface roughness, irreversible contact deformations, and non-spherical particle geometry generate additional rolling resistance [
27,
28].
The model is formulated within an independent elasto-plastic framework that operates in parallel, and it is weakly coupled to the contact law governing normal and tangential forces [
23]. Its implementation introduces a resisting contact moment
acting at the interaction plane, which opposes the relative rotational displacement
among contacting entities.
Two primary internal variables are defined: the elastic component of the relative rotational displacement,
, and the accumulated plastic component,
. The kinematic relationship is expressed through an additive decomposition as
where
denotes the total incremental relative rotational displacement, computed from the difference in angular velocities,
and
, of the contacting entities (A and B) over a time increment
,
The elastic response of the rolling resistance model is defined through an isotropic rotational stiffness tensor. In its general form, this tensor is represented by a second-order identity tensor scaled by the rolling stiffness parameter
. Thus, the elastic rolling moment is given by
where
is the second-order identity tensor. In the simplified scalar implementation adopted in this study, the rolling moment depends solely on the magnitude of the relative rotational displacement.
3.3. Particle Breakage Criterion
To simulate ballast particle breakage under static and cyclic loading, the non–mass-conservative multigenerational fragmentation criterion proposed by Ciantia et al. [
29] was adopted. This approach combines an elastoplastic breakage criterion based on the theory of Russell and Muir Wood [
30] with a controlled spawning procedure, enabling progressive material degradation to be modeled without prohibitive computational costs.
The implemented criterion establishes that a particle breaks when the mobilized strength,
, exceeds the intrinsic strength of the material
.
where
is derived from the uniaxial compressive
and tensile strengths
of the particle material. The mobilized strength is computed as
where
is the maximum normal contact force,
is the particle radius,
is Poisson’s ratio,
is a microstructural parameter, and
is the contact semi-angle, which in the present model is determined using Hertzian contact theory.
A Weibull-type scaling law was introduced to model the dependence of particle strength on particle size:
where
is the reference crushing strength associated with a characteristic diameter
, and
is the Weibull modulus controlling the sensitivity of strength to particle size [
31].
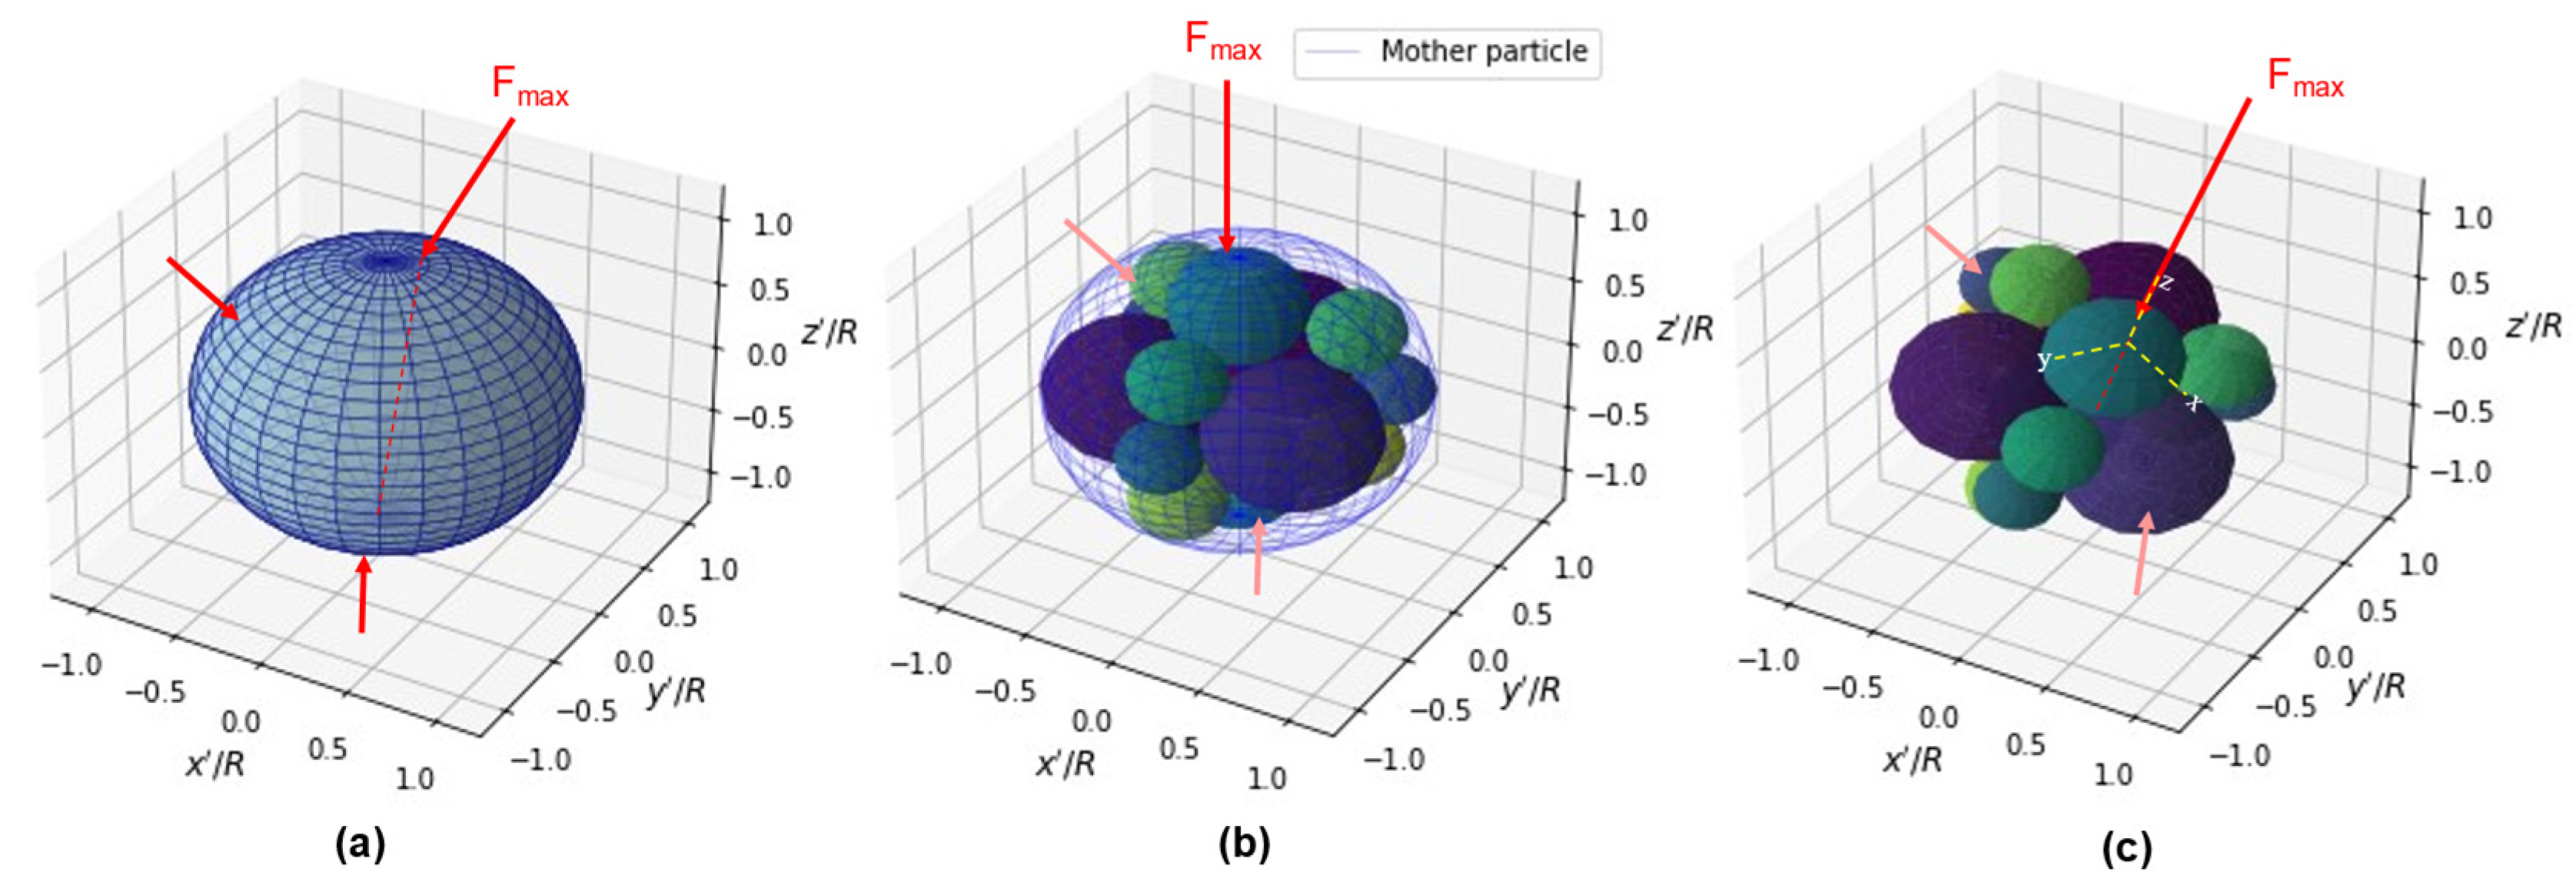
When the breakage criterion is satisfied, the original particle is replaced by a fixed configuration of 14 inscribed, mutually tangent spheres, whose relative positions are rotated to align with the direction of the critical contact force (
Figure 3). This arrangement minimizes volume loss and reproduces fracture patterns similar to those observed experimentally in granular materials subjected to diametral compression.
Unlike other multigenerational approaches, the model does not maintain mass within the mechanical system. Thus, mass loss corresponds to fine particles that do not contribute significantly to force transmission. Nevertheless, for comparison with particle size distribution tests, the excluded mass is redistributed externally according to a fractal distribution with a dimensional alpha of
, as suggested by Einav [
32], and validated by Ciantia et al. [
29]. To control the exponential growth in the number of particles, a fragmentation limit,
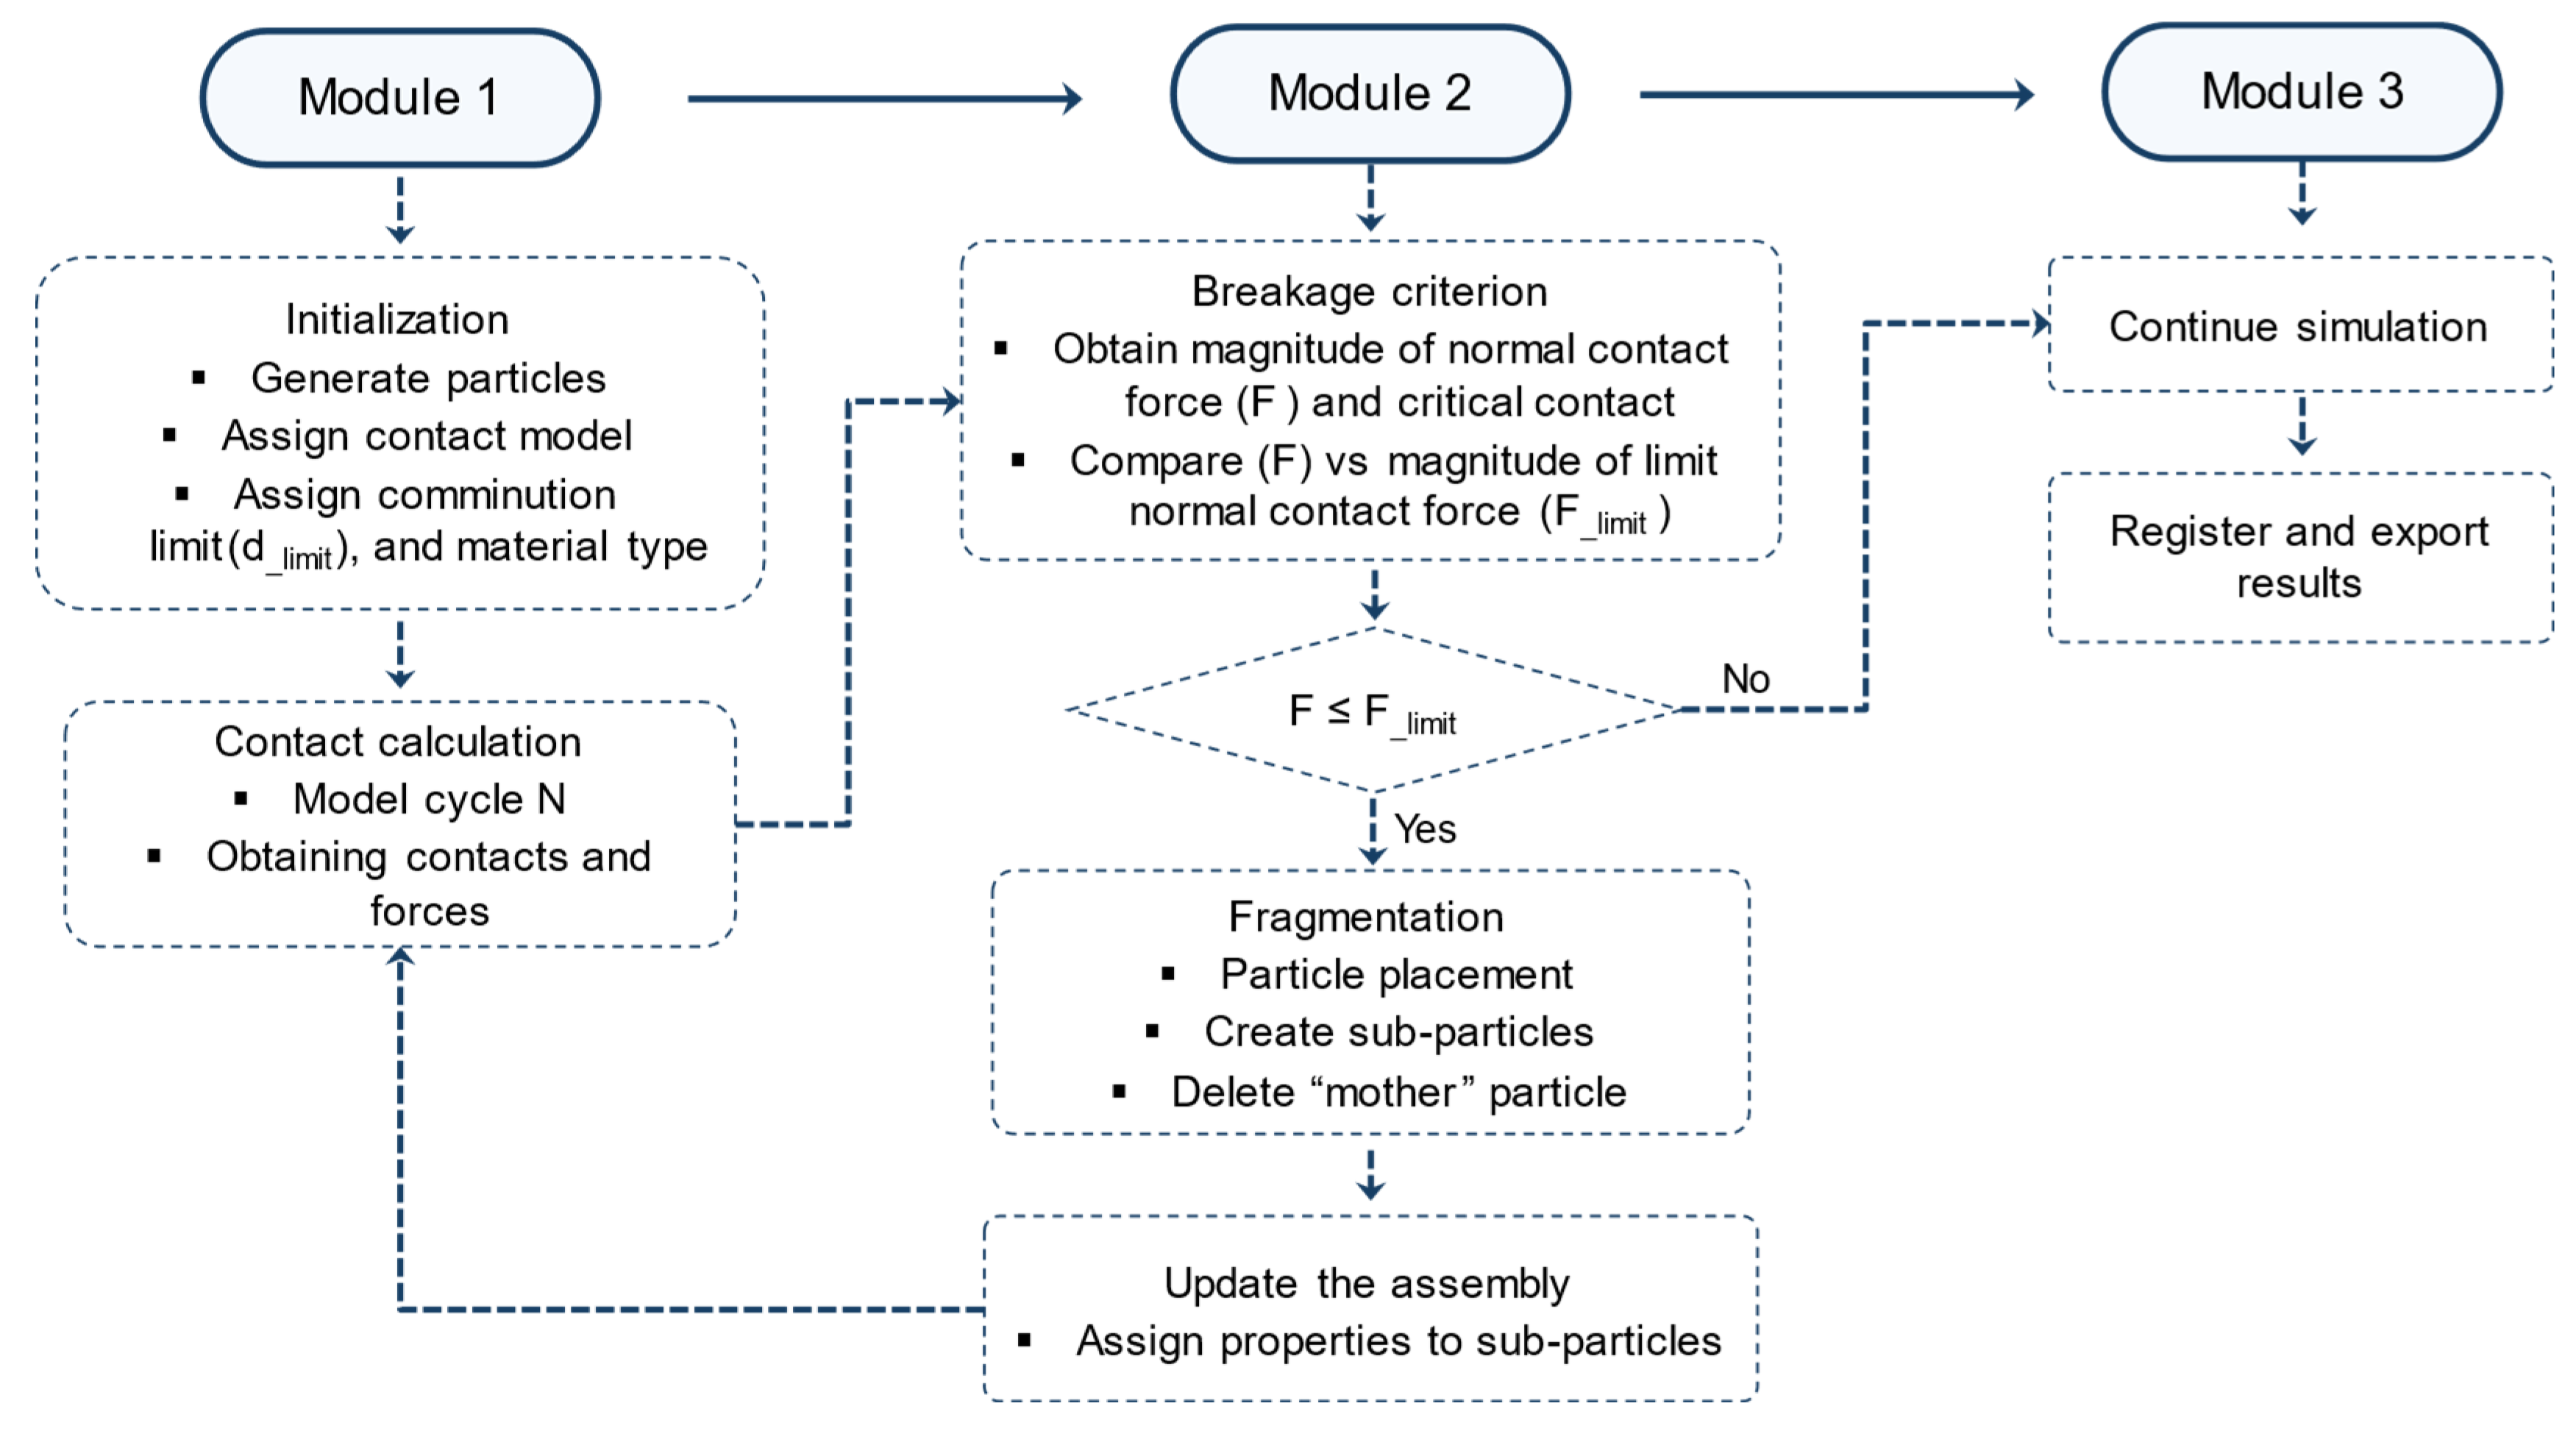
, was defined below which particles are no longer allowed to break. A schematic of the adopted breakage criterion and its implementation in the DEM framework is shown in
Figure 4.
3.4. Numerical Hybrid Modelling Boundary Conditions
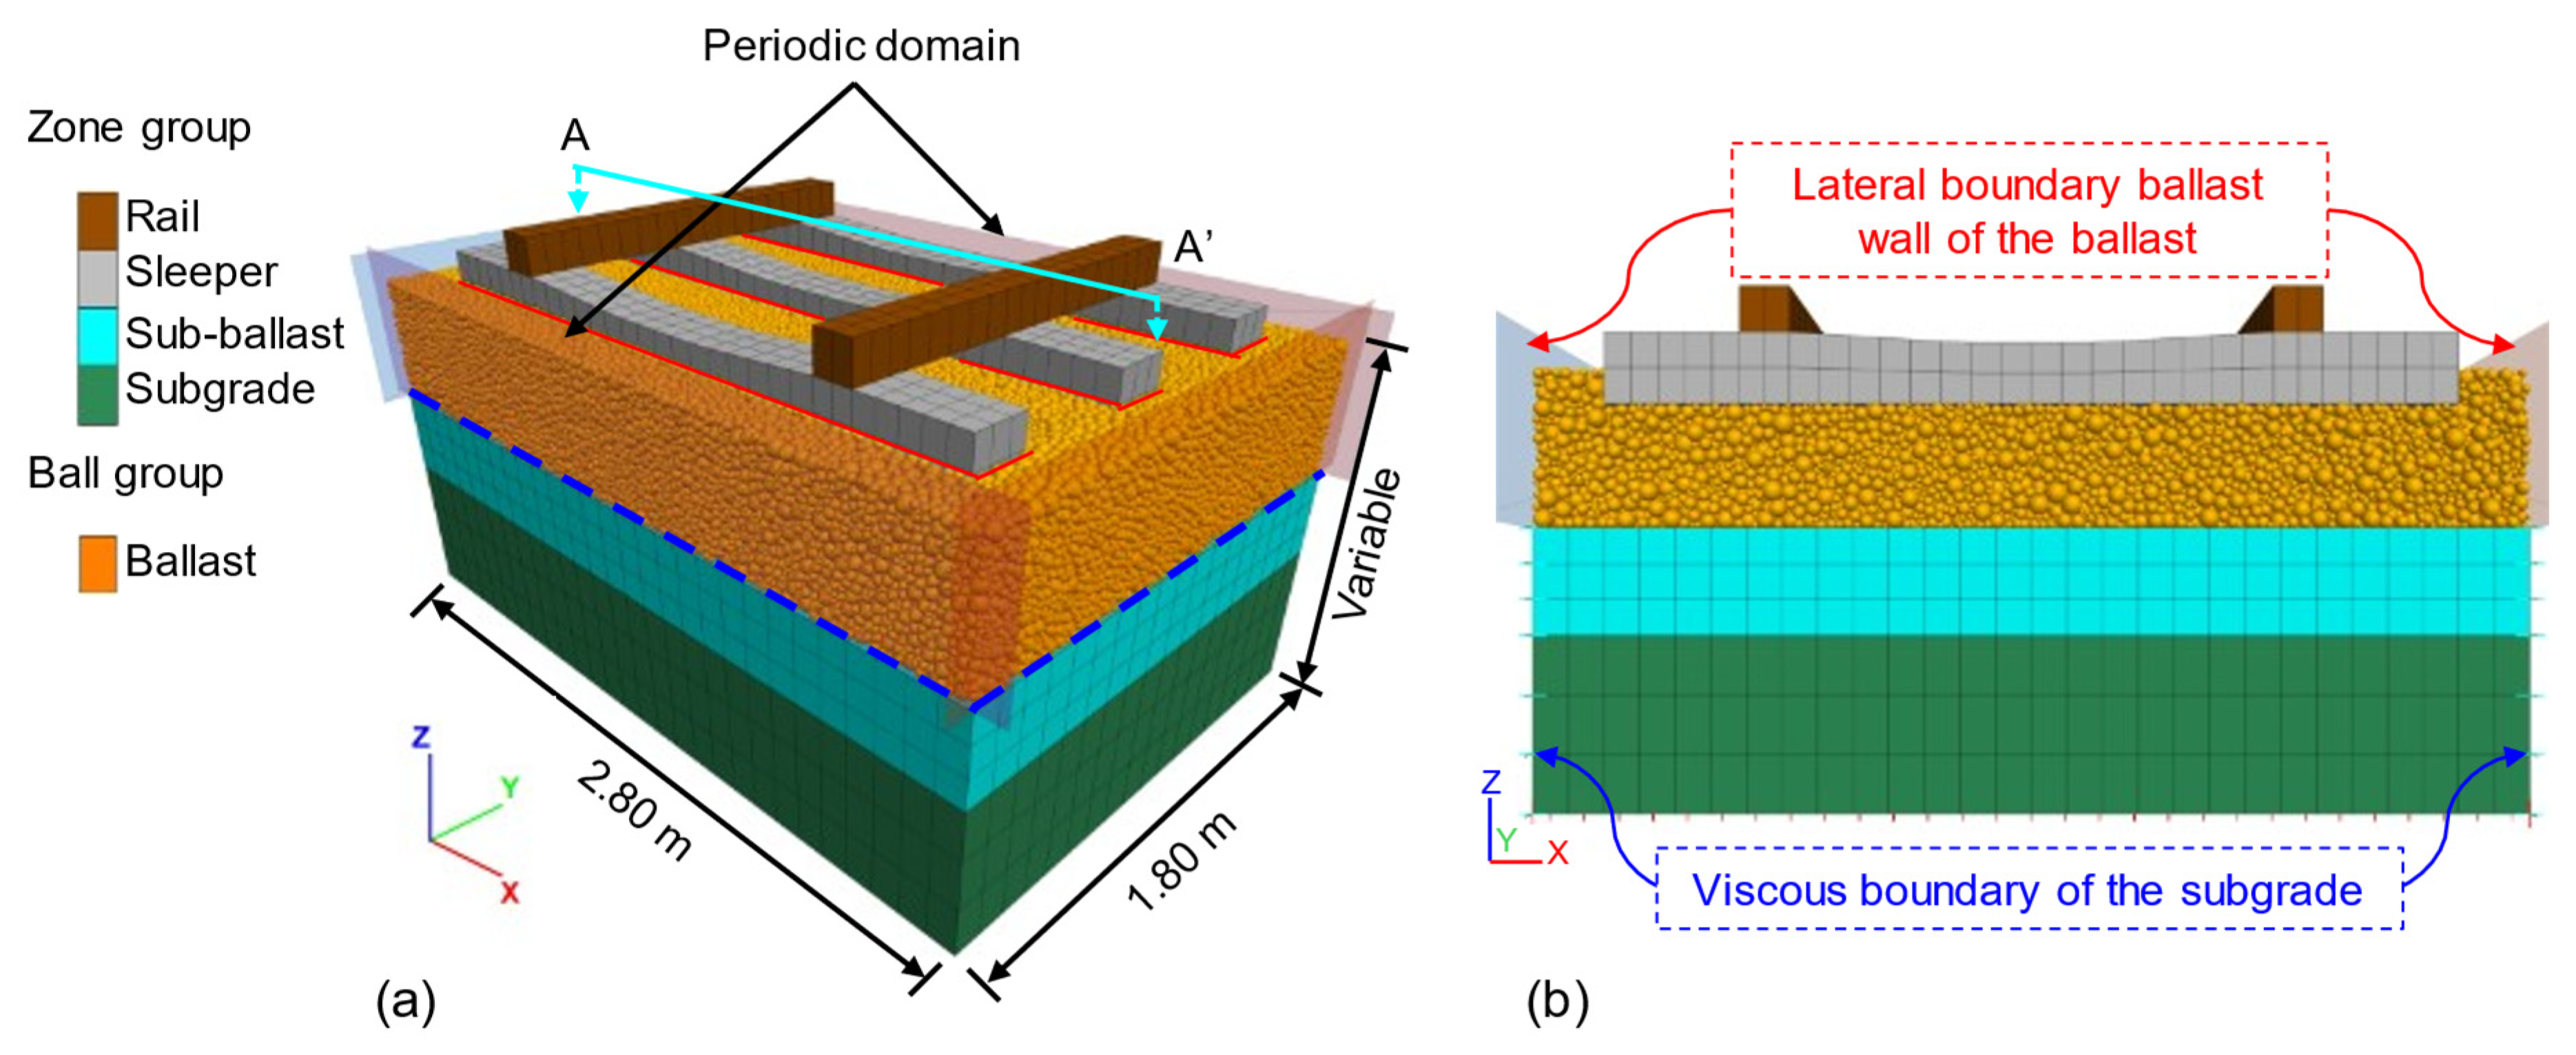
Periodic boundary conditions were applied to the numerical domain to minimize boundary effects. Under this formulation, when a particle centroid crosses a model boundary, it is reintroduced on the opposite side, thereby ensuring continuity of the granular assembly. To maintain consistent contact interactions across boundaries, “ghost” particles are generated, enabling contacts to form as if the domain were spatially continuous. In this way, an infinitely repeating ballast layer is effectively represented, and artificial confinement or stress concentrations at the model boundaries are avoided.
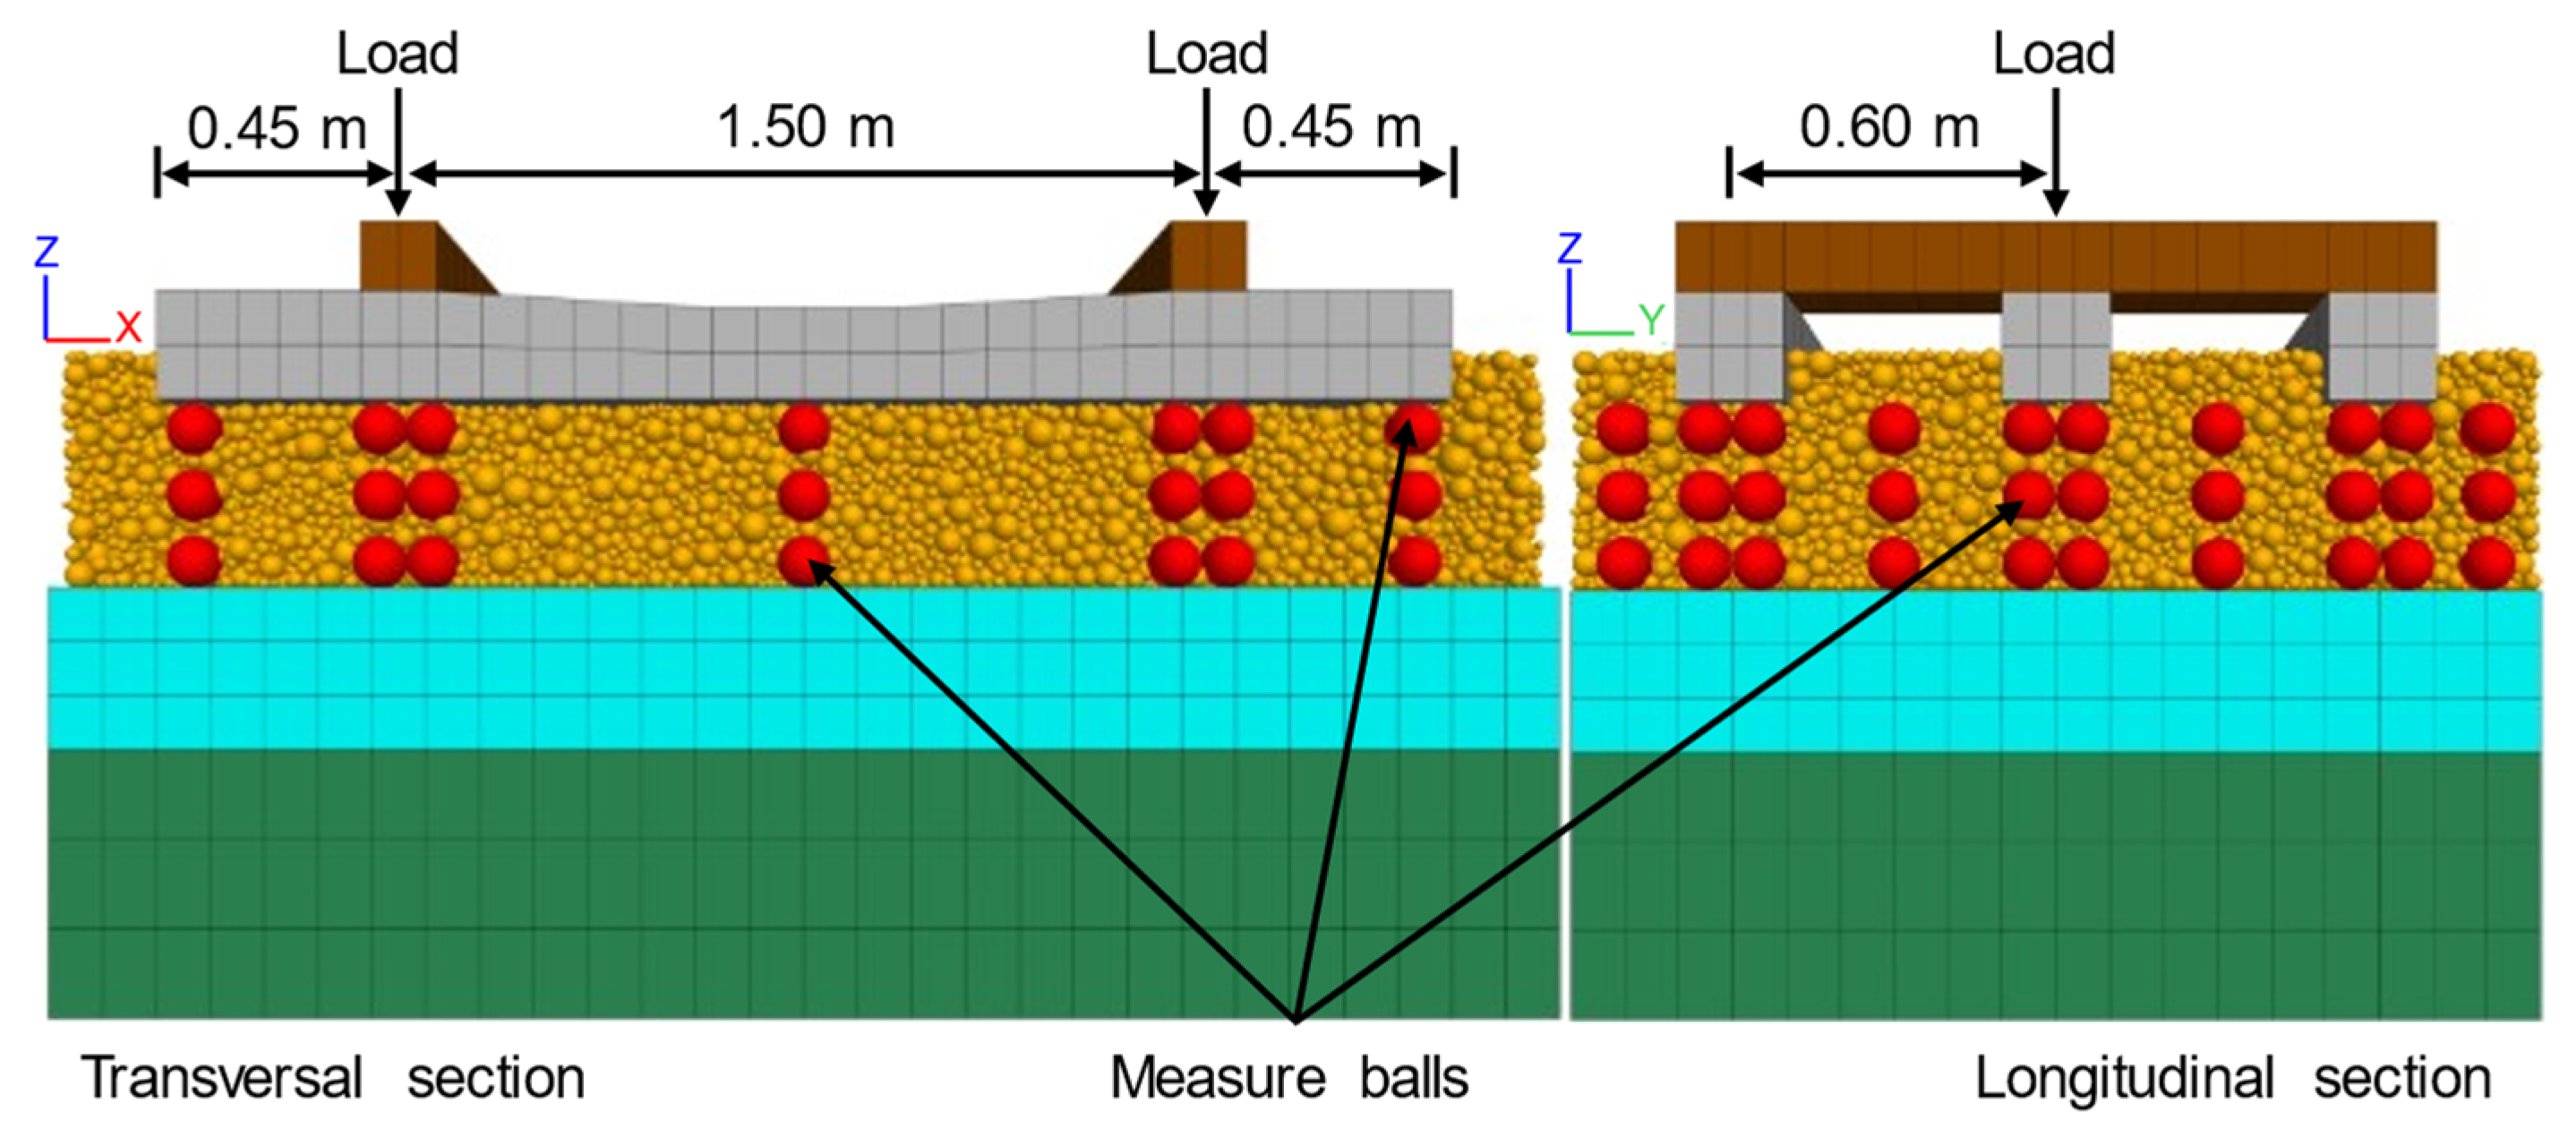
To optimize computational efficiency while maintaining a representative track configuration, three sleepers were modeled spaced 0.60 m each. The model has a longitudinal length of 1.80 m, a transverse width of 2.80 m, and a variable height depending on the selected ballast thickness. This length captures the interaction between adjacent sleepers while ensuring that the mechanical response beneath the central sleeper, where results are obtained, is not affected by boundary conditions. Accordingly, the results are considered representative of an interior section of a ballasted track. The overall model geometry and dimensions are presented in
Figure 5.
The use of simplified boundary conditions is common practice in DEM simulations of railway ballast systems due to computational limitations. Previous studies have shown that, when the focus is placed on vertical response and deformation behavior, the influence of boundary conditions on the global response remains limited [
12]. Consequently, the adopted modelling strategy represents a reasonable compromise between computational efficiency and physical representativeness.
Furthermore, to properly simulate dynamic conditions and to avoid artificial wave reflections at the model boundaries, viscous dashpots were installed around and at the base of the subgrade in both the normal and shear directions. These dashpots act as absorbing boundaries, effectively dissipating incident stress waves and preventing their reflection back into the computational domain.
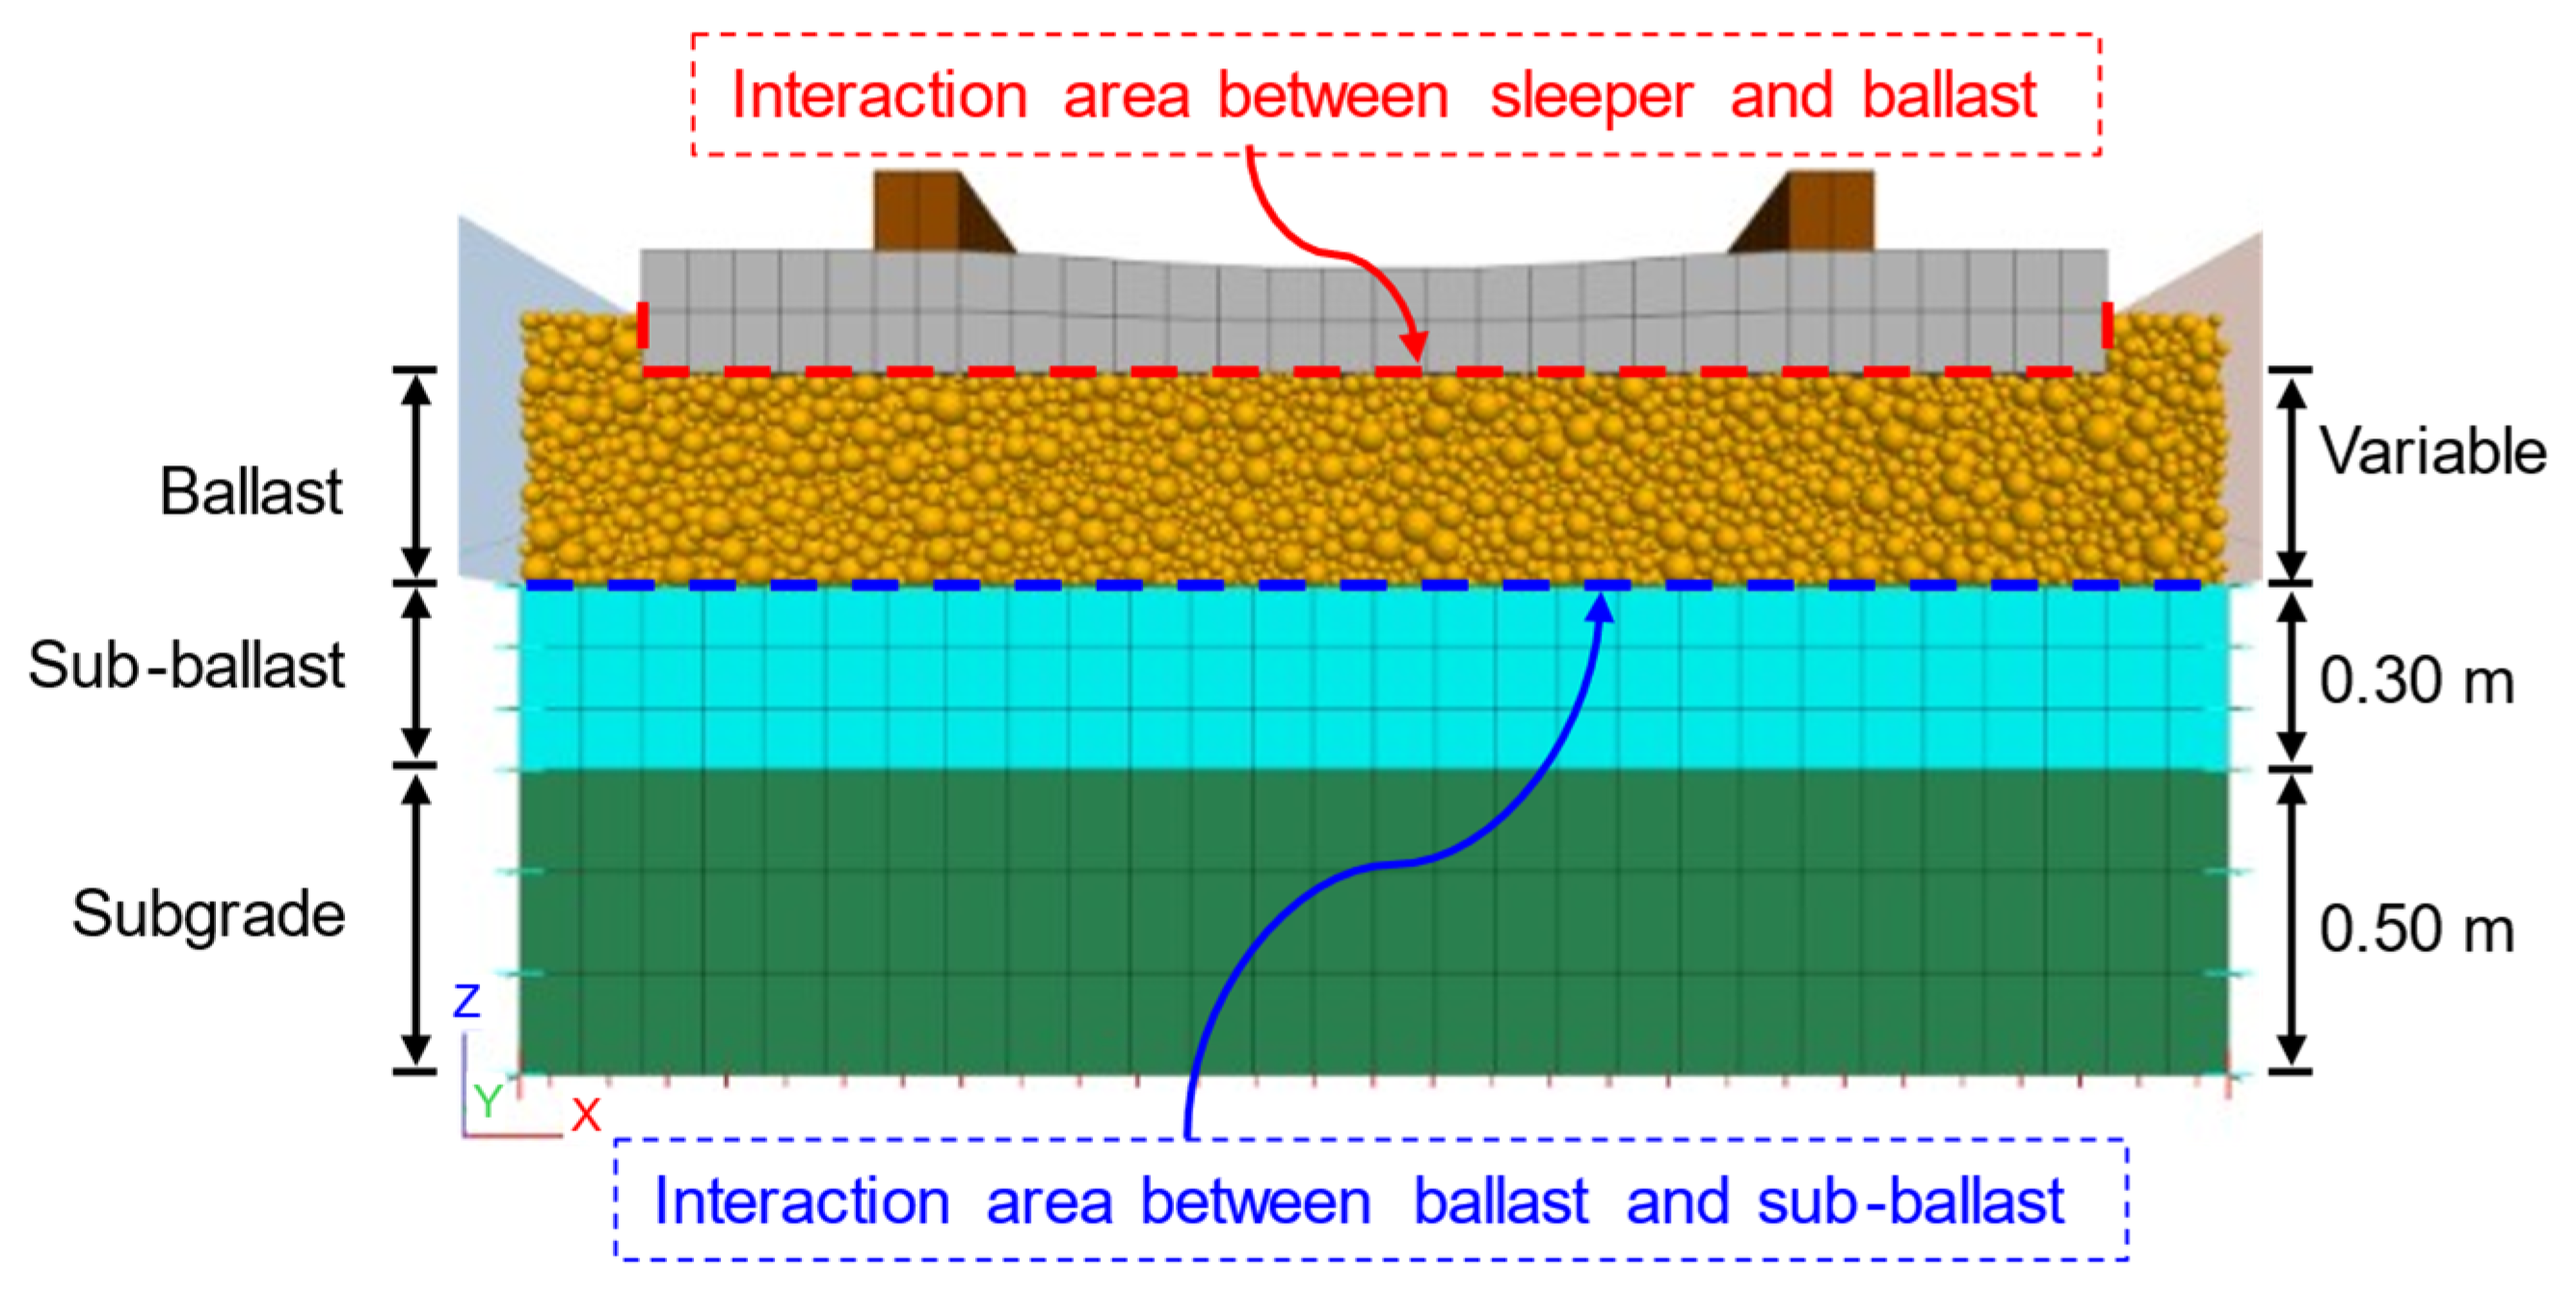
To evaluate the mechanical behavior of all track layers, a hybrid DEM–FDM numerical model was developed, as illustrated in
Figure 6. The subgrade, sub-ballast, sleepers, and rail were modeled using the finite difference method (FDM), whereas the ballast layer was simulated using the discrete element method (DEM). Interactions between ballast particles and the sub-ballast, as well as between ballast and sleepers, were represented through interface elements generated at the contact zones between the continuous and discrete domains.
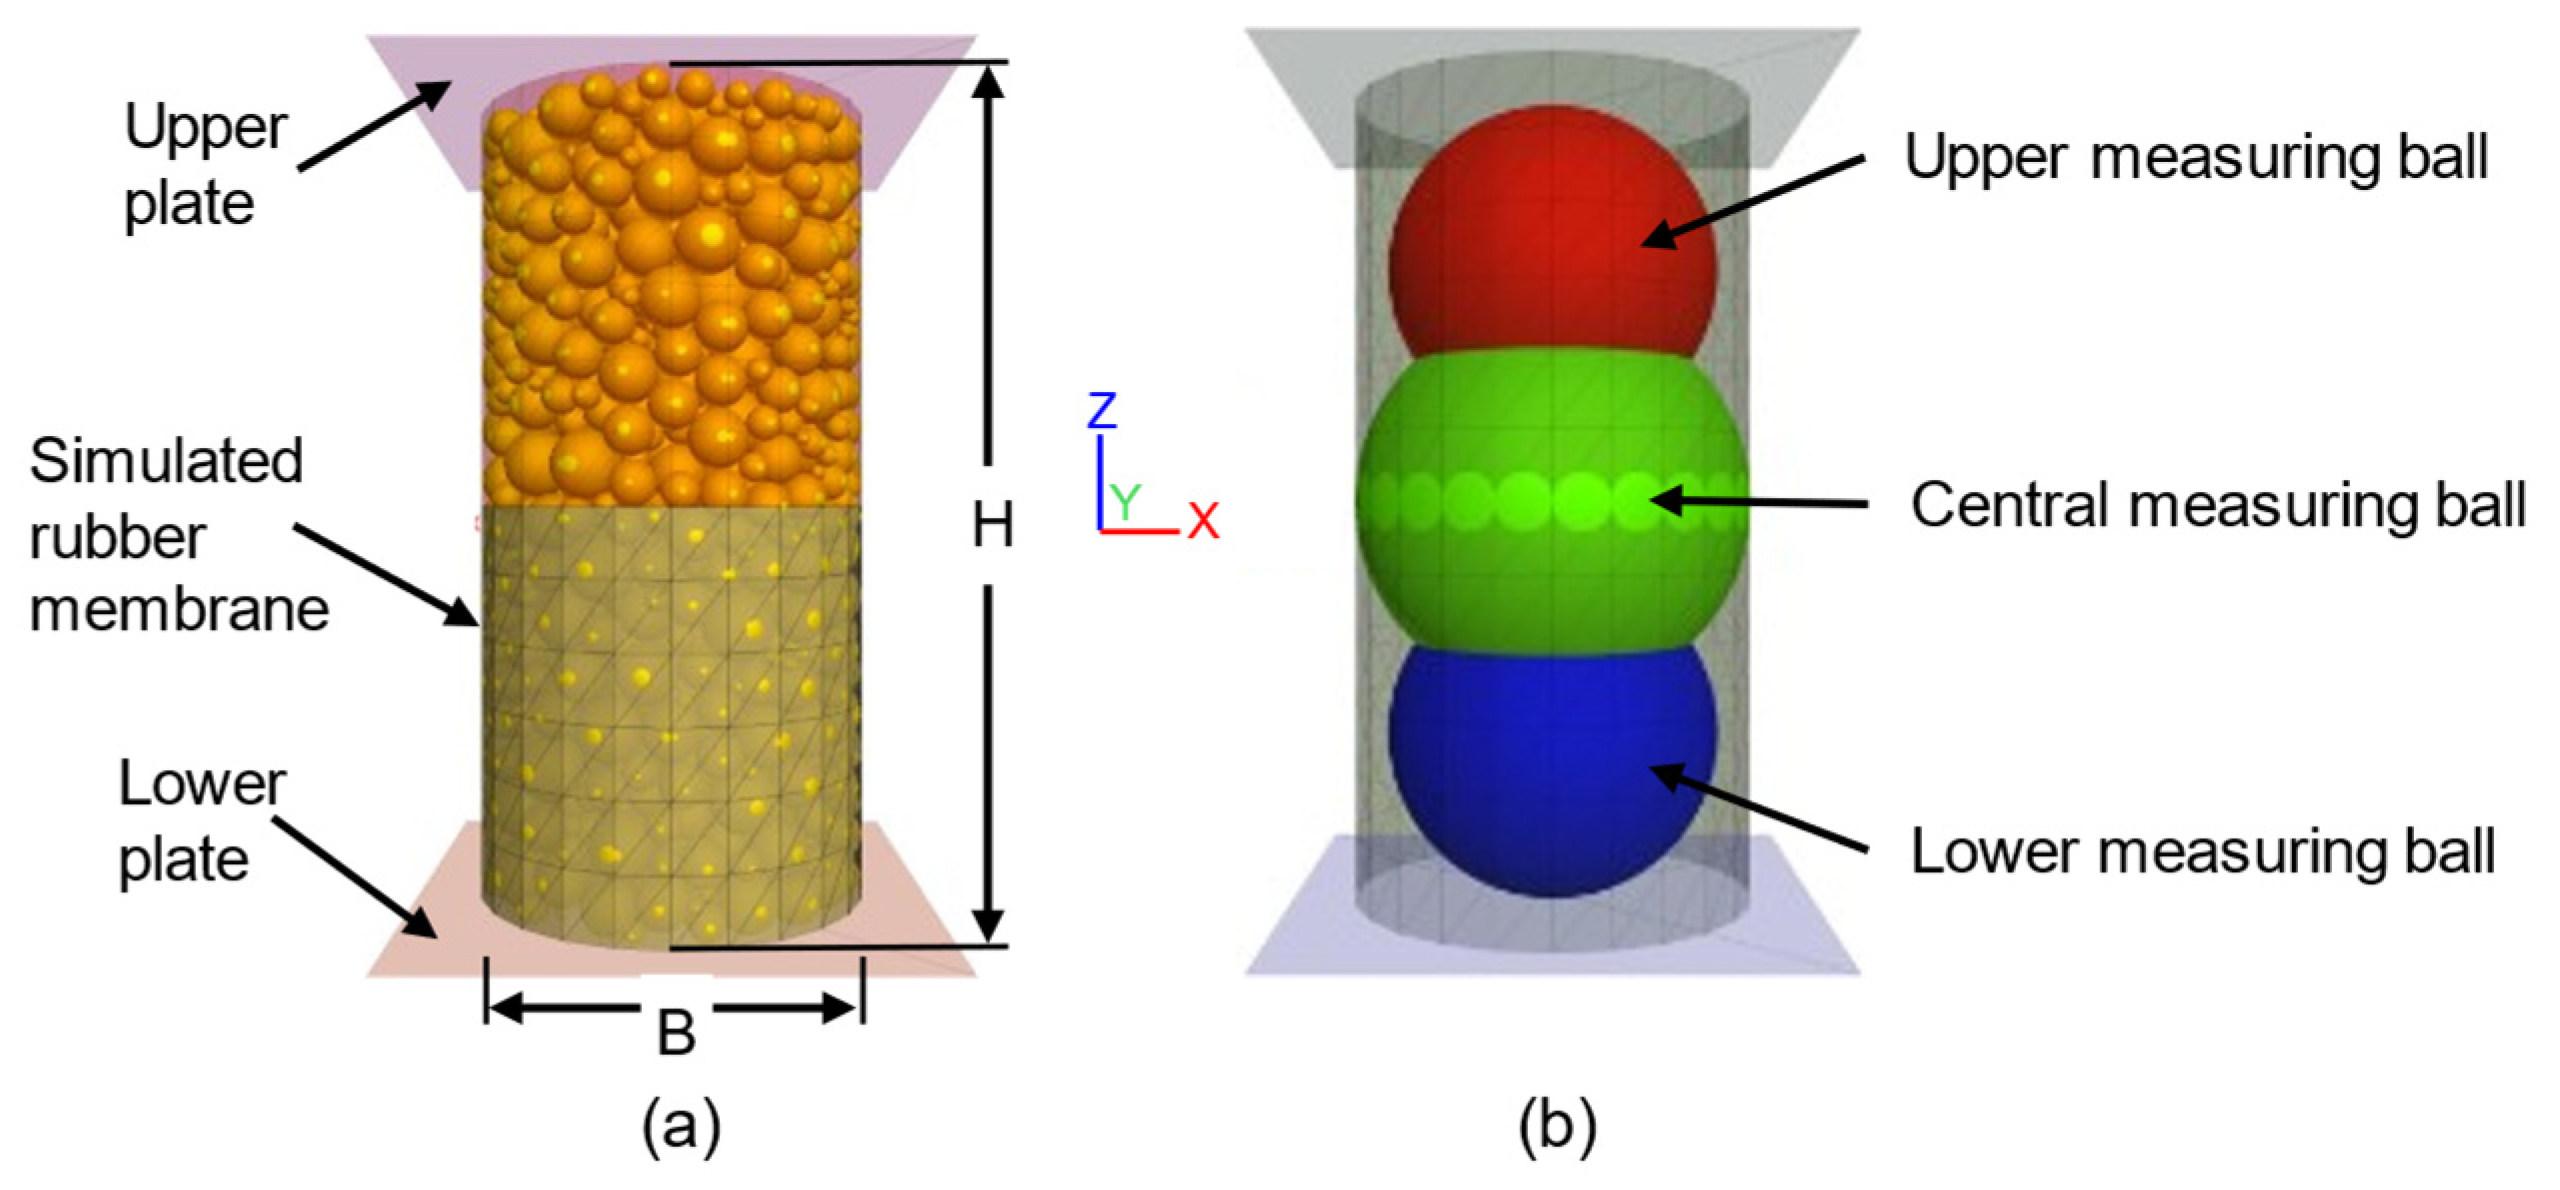
Because ballast aggregates are highly heterogeneous, their mechanical response cannot be fully interpreted using conventional continuum parameters such as stress and strain alone. For this reason, internal responses within the ballast layer were observed using measurement spheres available in PFC
3D [
23]. To obtain stress distributions within the ballast bed, measurement spheres were generated to capture the average stress and strain in the ballast layer, as shown in
Figure 7.
3.5. Model Calibration
The model calibration was based on extensively documented and validated experimental results gathered from the technical literature [
24,
25,
26], derived from carefully selected large-scale triaxial tests. These studies are in good agreement with the recommended properties for materials commonly used in railway track supports (i.e., basalt, granite, and limestone). Thus, these data were deemed appropriate for this initial research phase. While the importance of direct experimental validation is acknowledged, this approach allows for establishing the soundness of the proposed methodology and captures the representative mechanical trends of ballast stress–strain behavior. The properties of the materials evaluated in this study (basalt, granite, and limestone) are summarized in
Table 2.
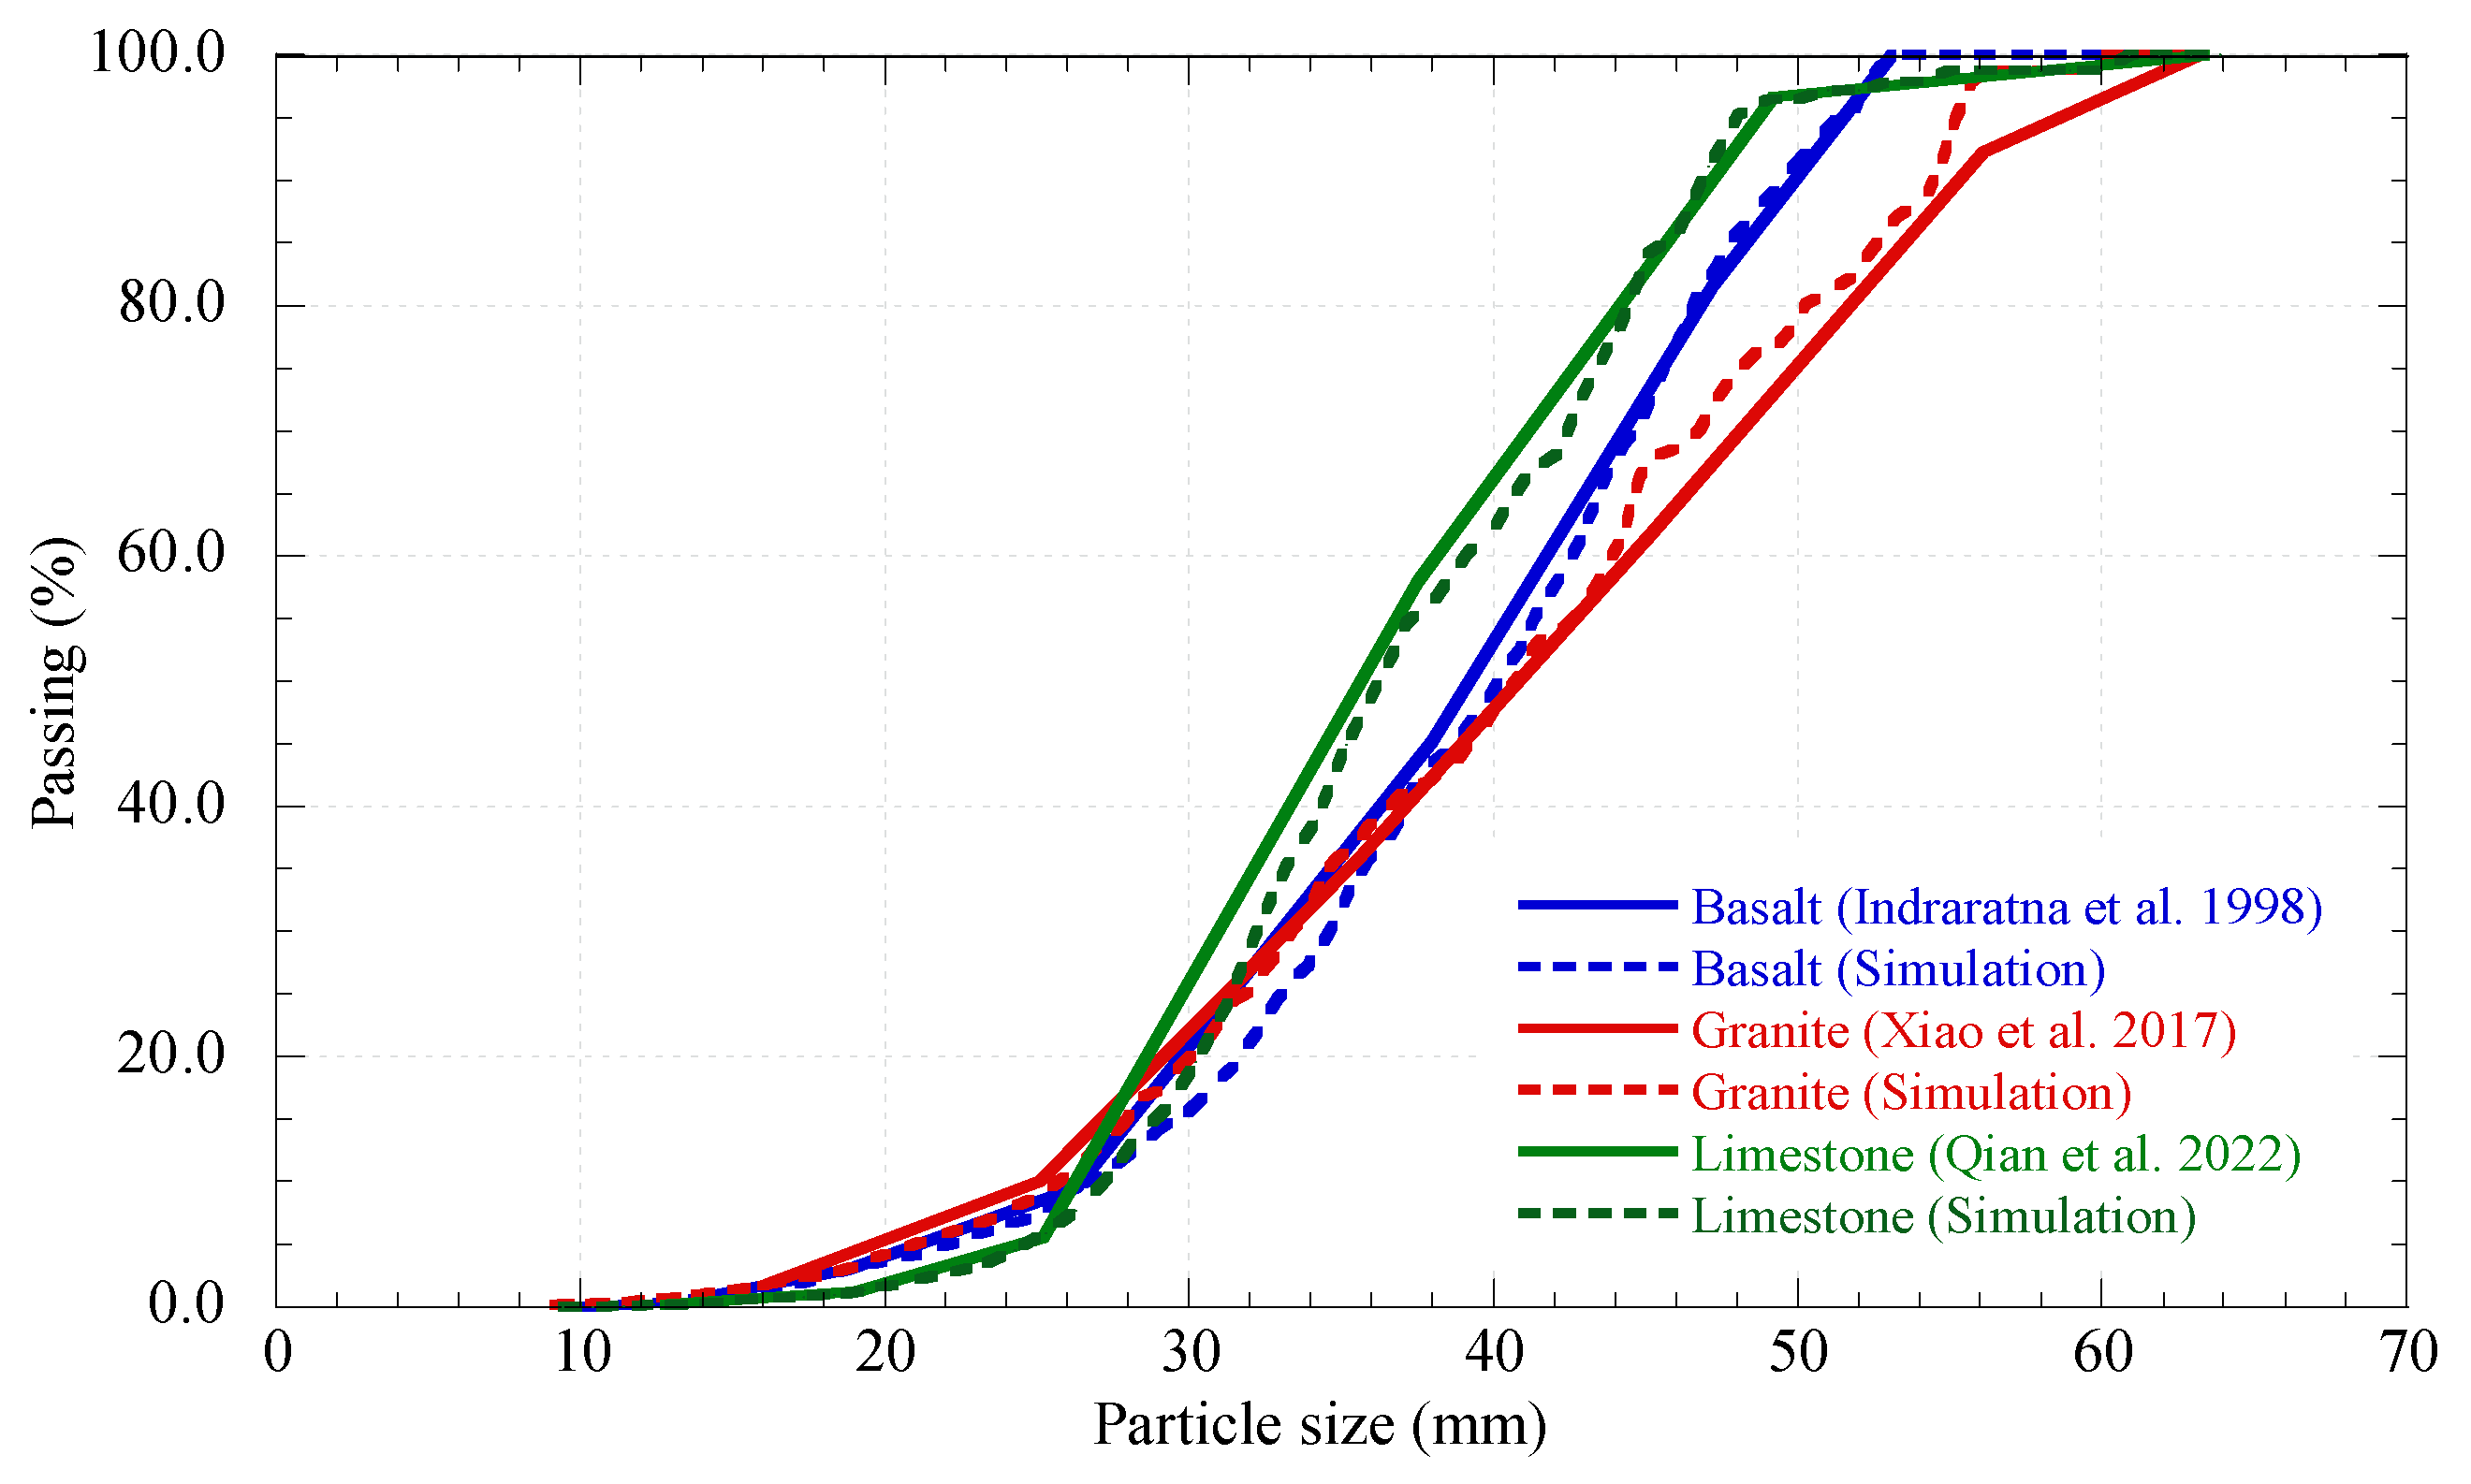
Figure 8 shows the particle-size distribution of each material, determined by sieve analysis in accordance with ASTM C136/C136M-19 [
33]. In the numerical models, ballast particles were randomly generated in the longitudinal and vertical directions within the specified domain, reproducing the target ballast size distribution.
Thus, for calibration purposes, large-scale triaxial tests previously reported by various authors [
24,
25,
26] were reproduced numerically. Each simulation was designed to match the laboratory configurations described in those studies, ensuring that the numerical response could be directly compared with the experimental results.
Triaxial tests were conducted using cylindrical specimens of varying sizes and a grain-size distribution corresponding to previous experimental data reported in Indraratna et al. [
24], Xiao et al. [
25], and Qian et al. [
26]. Each specimen, enclosed by two flat plates and a curved wall (
Figure 9), was created by randomly placing ballast particles and adjusting the friction coefficient to achieve dense or loose packing depending on the case considered. Isotropic confinement was applied using the PFC
3D servo-control algorithm until the target pressure was reached.
After the sample was obtained, a monotonic triaxial test was conducted by controlling axial deformation and maintaining constant lateral pressure. During loading, deviatoric stress and axial deformation were recorded, and measurement spheres were used to assess particle breakage.
Because obtaining DEM simulation parameters directly from experimental results is complex, most researchers have historically determined these parameters using indirect methods described below, which are adopted in this study. In the first stage, a comprehensive literature review was conducted to establish reasonable parameter value ranges.
The calibration was performed using an iterative inverse analysis procedure in which the microscopic parameters (k
n, k
s, μ, μ
r) were systematically adjusted to reproduce the macroscopic response observed in large-scale triaxial tests. A hierarchical calibration sequence was adopted to isolate the influence of each parameter. The normal and shear stiffnesses (k
n and k
s) were first calibrated to match the initial tangent stiffness of the stress–strain curve. The friction coefficient (μ) was subsequently adjusted to reproduce the peak deviatoric strength, while the rolling resistance coefficient (μ
r) was calibrated to capture post-peak softening behavior and residual strength. In addition, the simulated particle breakage index (Bg) was verified to fall within the experimentally reported range for each confinement level, ensuring consistency in both mechanical response and degradation behavior. The final calibrated parameters used in the DEM simulations are summarized in
Table 3.
It is important to note that the adopted calibration strategy is based on previously published experimental data rather than laboratory testing developed during this research. While this approach is widely used in DEM modeling of granular materials, it introduces inherent limitations. In particular, the calibrated parameters represent an equivalent set of micro-mechanical properties capable of reproducing macroscopic behavior observed in the reported tests, rather than unique material constants.
Nevertheless, the selected experimental studies correspond to well-documented large-scale triaxial tests that have been extensively validated in the literature and are representative of typical ballast materials. Therefore, calibration is considered adequate for the purpose of this study, which focuses on the development of a numerical framework and the identification of mechanical trends rather than on site-specific prediction.
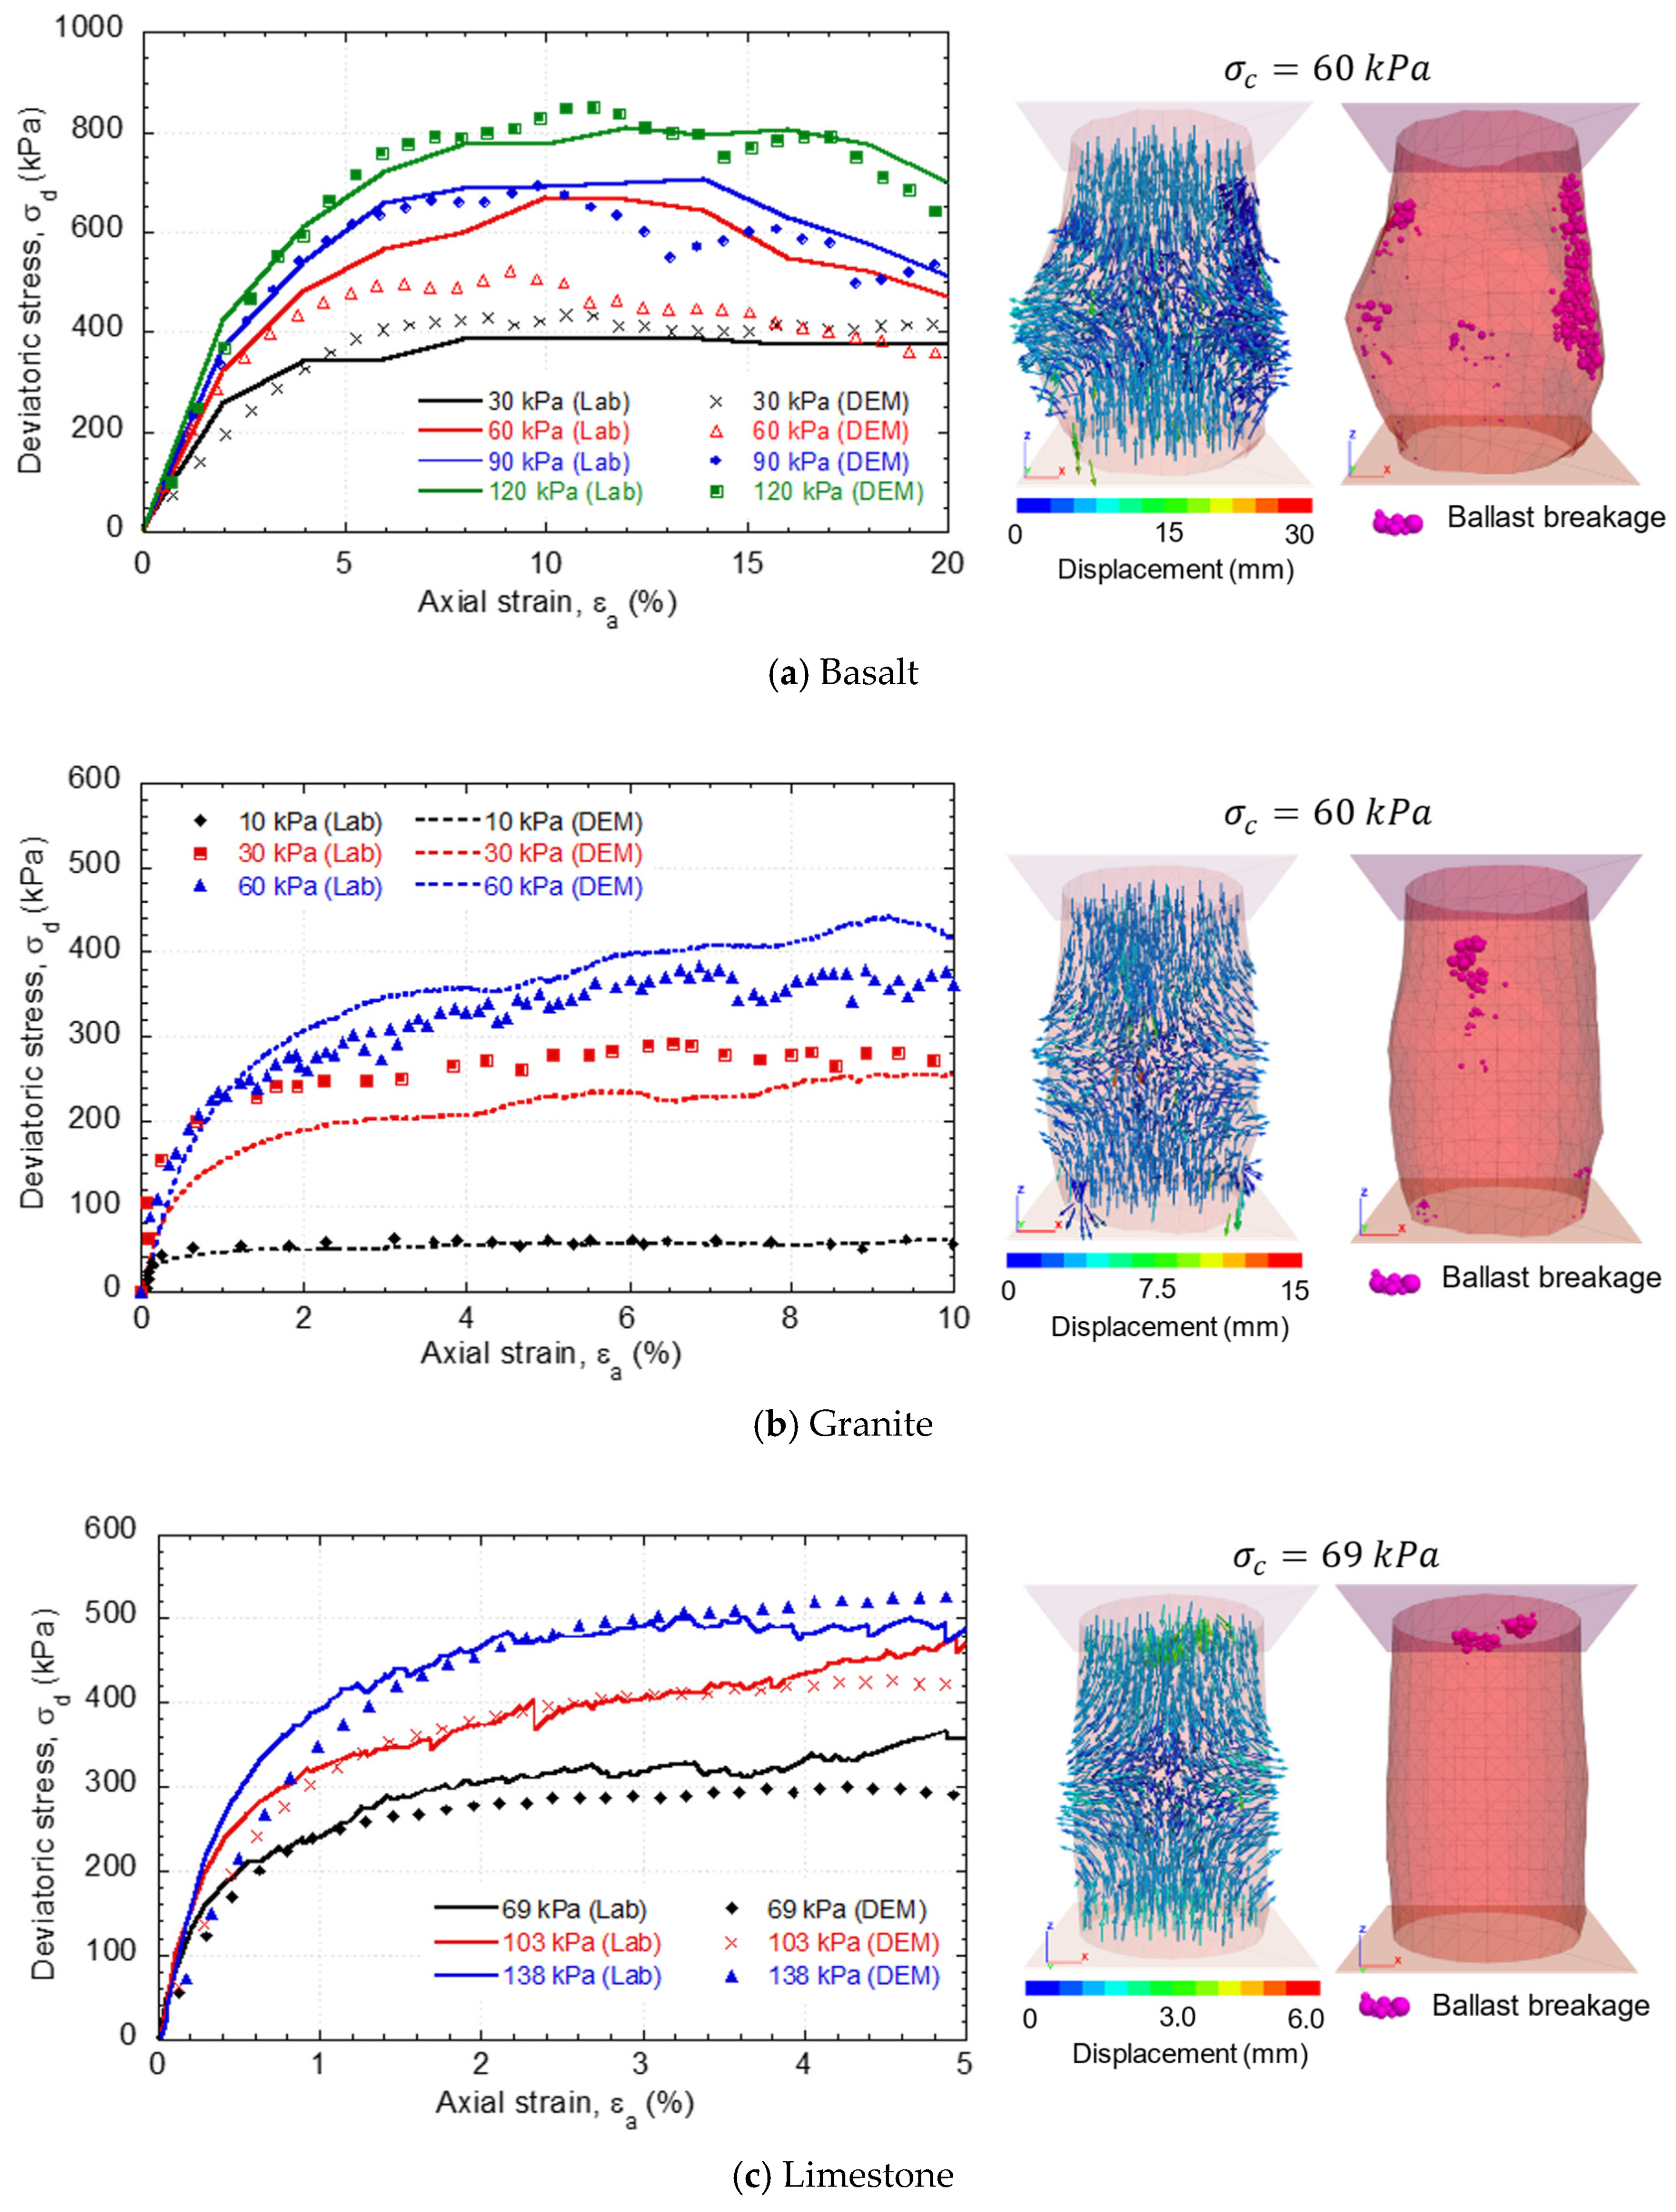
Figure 10 compares the computed and measured responses of the final calibration. The numerical response satisfactorily reproduces the behavior observed in large-scale triaxial tests, demonstrating adequate correspondence between the stress–strain curves across the different confining stress levels.
Based on the model calibration, the normal stiffness (kn) and tangential stiffness (ks) were found to have the greatest influence on the model’s response, as they directly control the initial slope of the stress–strain curve. When these values are high, the material exhibits a brittle behavior, reaching its peak strength too early. Conversely, friction mainly controls the maximum strength of the assembly, while rolling resistance determines the shape of the curve in the post-peak stage, defining the transition between the maximum load state and the residual condition.
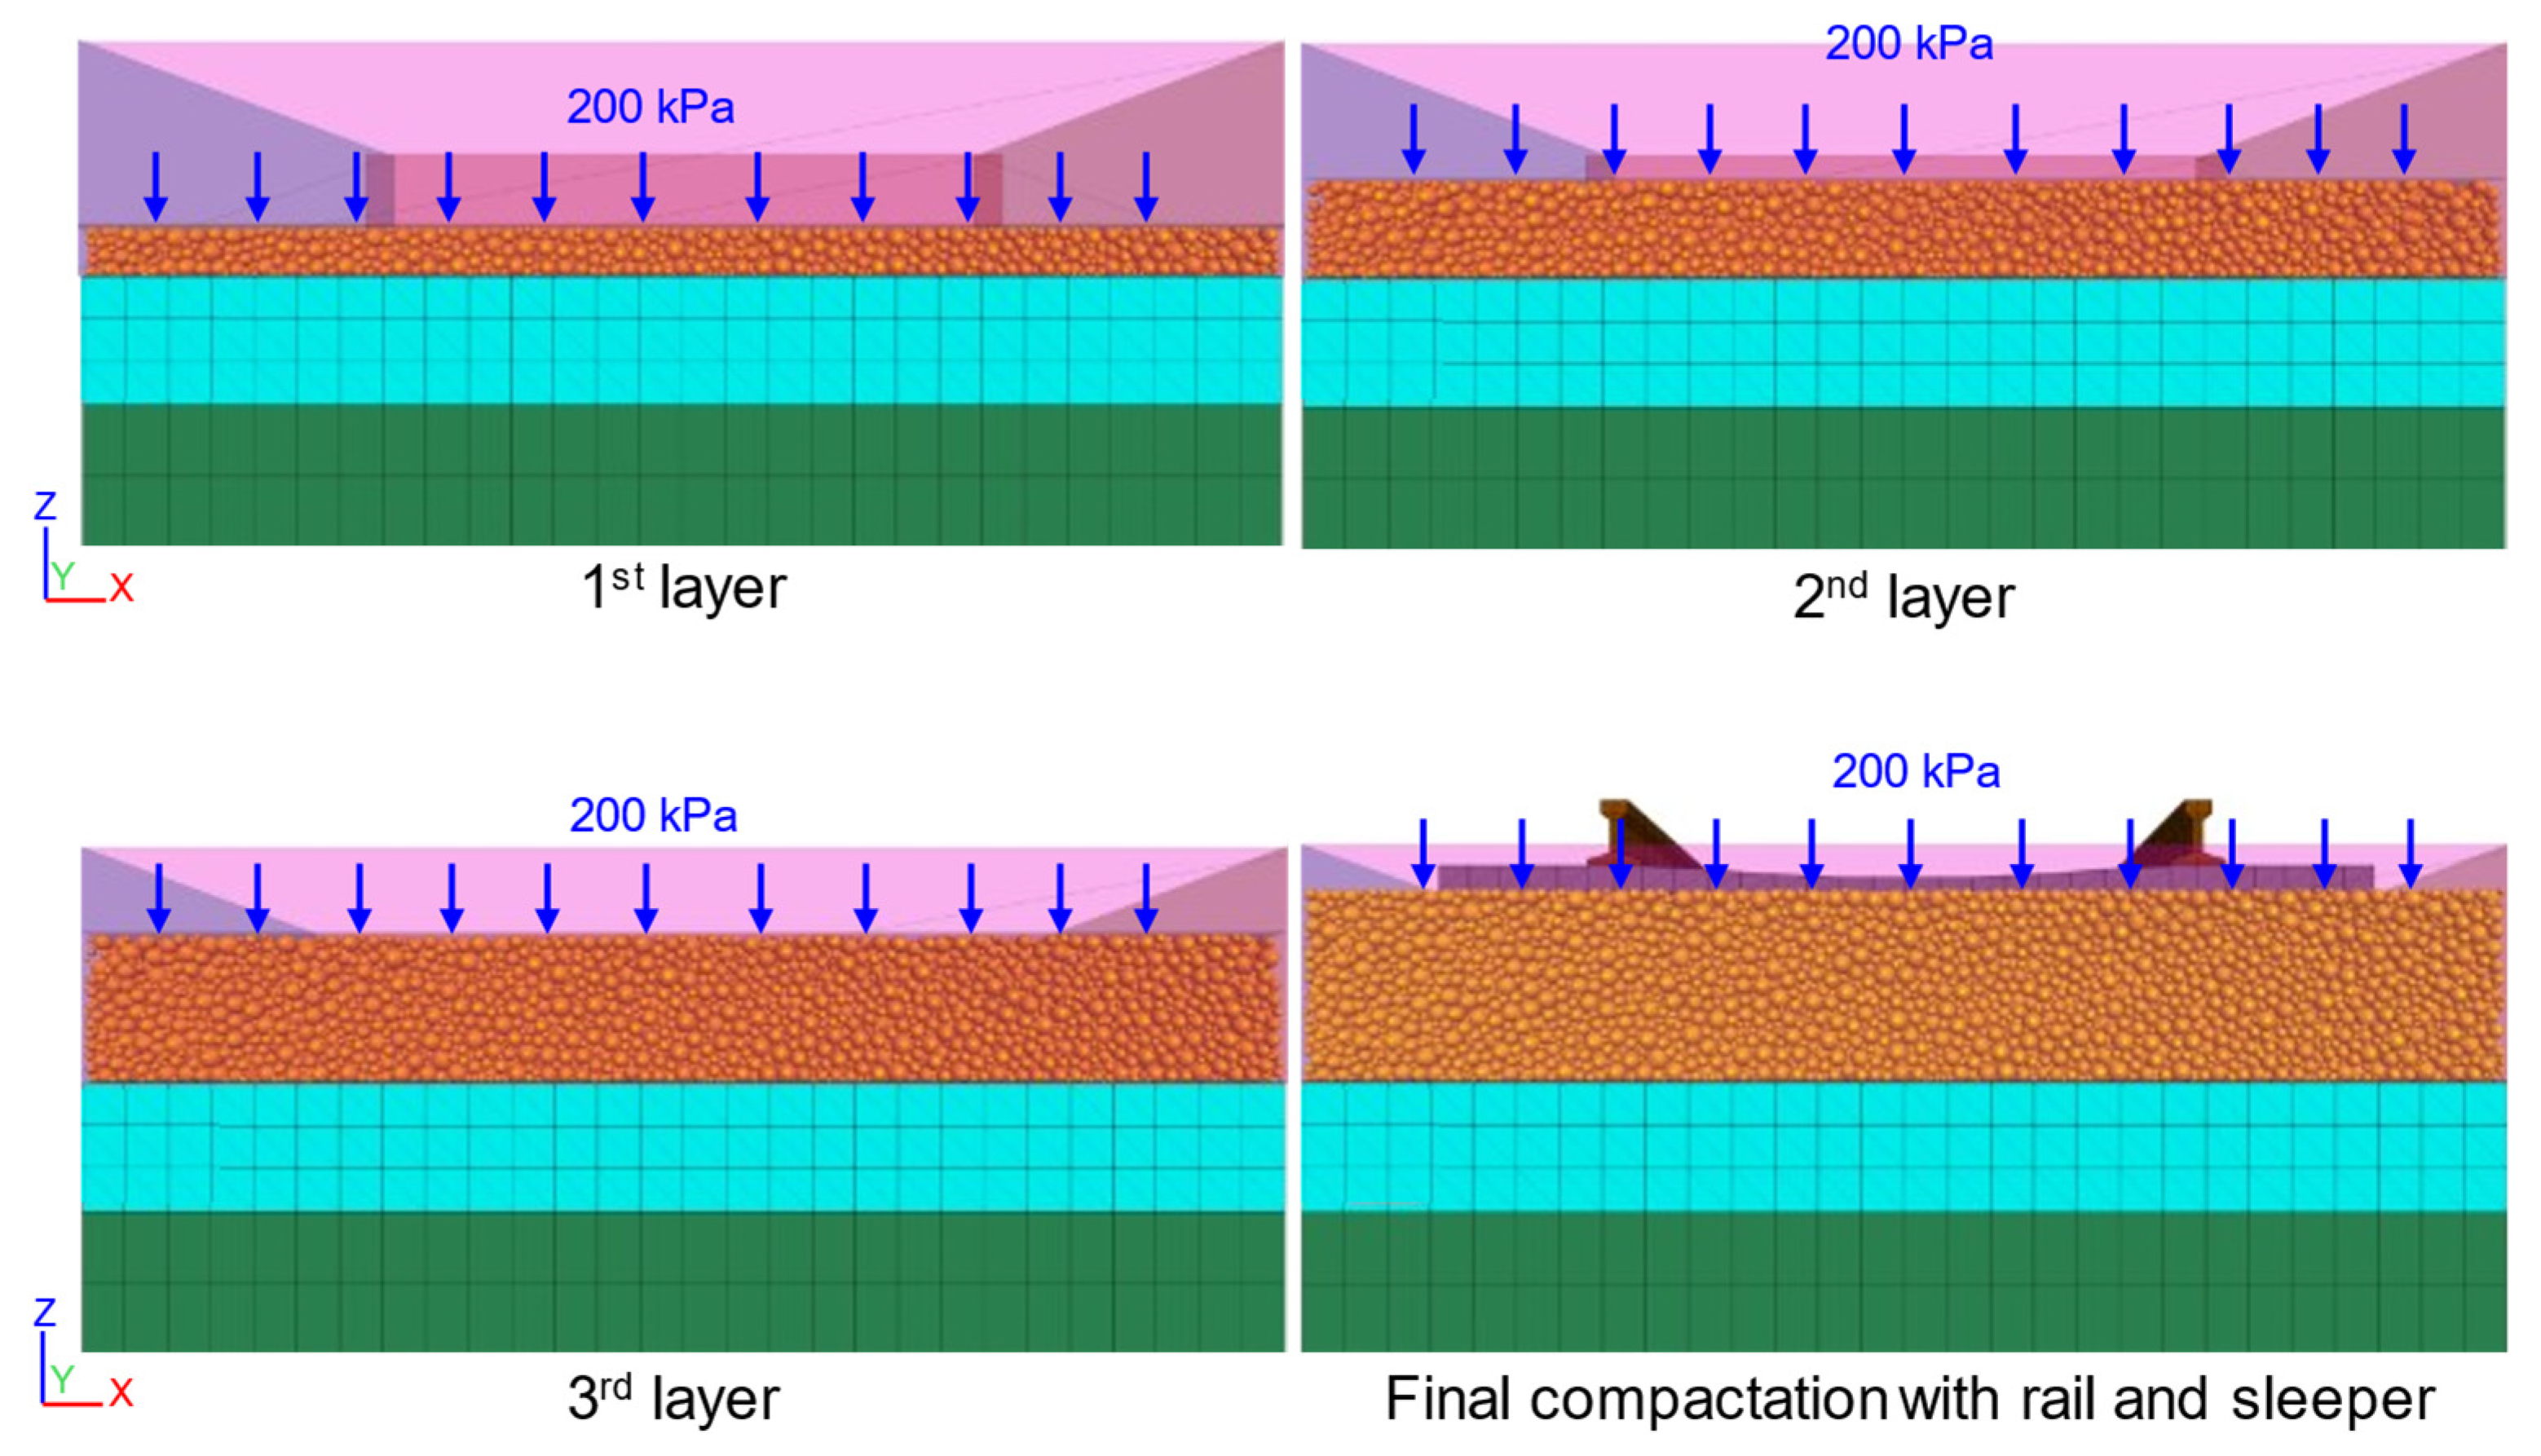
Given the critical importance of ballast compaction conditions in numerical simulations for properly establishing initial stresses, this study adopted a multilayer compaction procedure proposed by various researchers [
8,
34,
35], as illustrated in
Figure 11. The compaction process initiates with three ballast layers, with compaction pressures exceeding 200 kPa applied at each stage. After each compaction iteration, excess particles were removed, and auxiliary surfaces generated. The compaction procedure was subsequently reiterated to ensure adequate particle densification. Ultimately, the sleepers and rails were positioned on the compacted ballast layer, following which the auxiliary surfaces were removed.
Sub-ballast and subgrade were modeled using a perfectly elastoplastic formulation governed by the Mohr–Coulomb yield criterion. At the same time, the rail and sleeper were assumed to behave elastically. The material properties considered in the numerical model are summarized in
Table 4.
3.6. Train Load Considered
To simulate the loads transmitted by the bogie, an axle load of 147.15 kPa (73.58 kPa per wheel) was considered. Additionally, a dynamic impact factor (IF) was incorporated using Equation (7) [
16], which accounts for a percentage increase in vertical load to represent the dynamic effects of wheel-rail irregularities.
With a design speed of 85 km/h (52.8 mph) and a wheel diameter of 0.91 m (35.98 in), an impact factor of 0.48 was obtained. For all cases analyzed, the same wheel load (see
Table 5) was applied to the central sleeper.
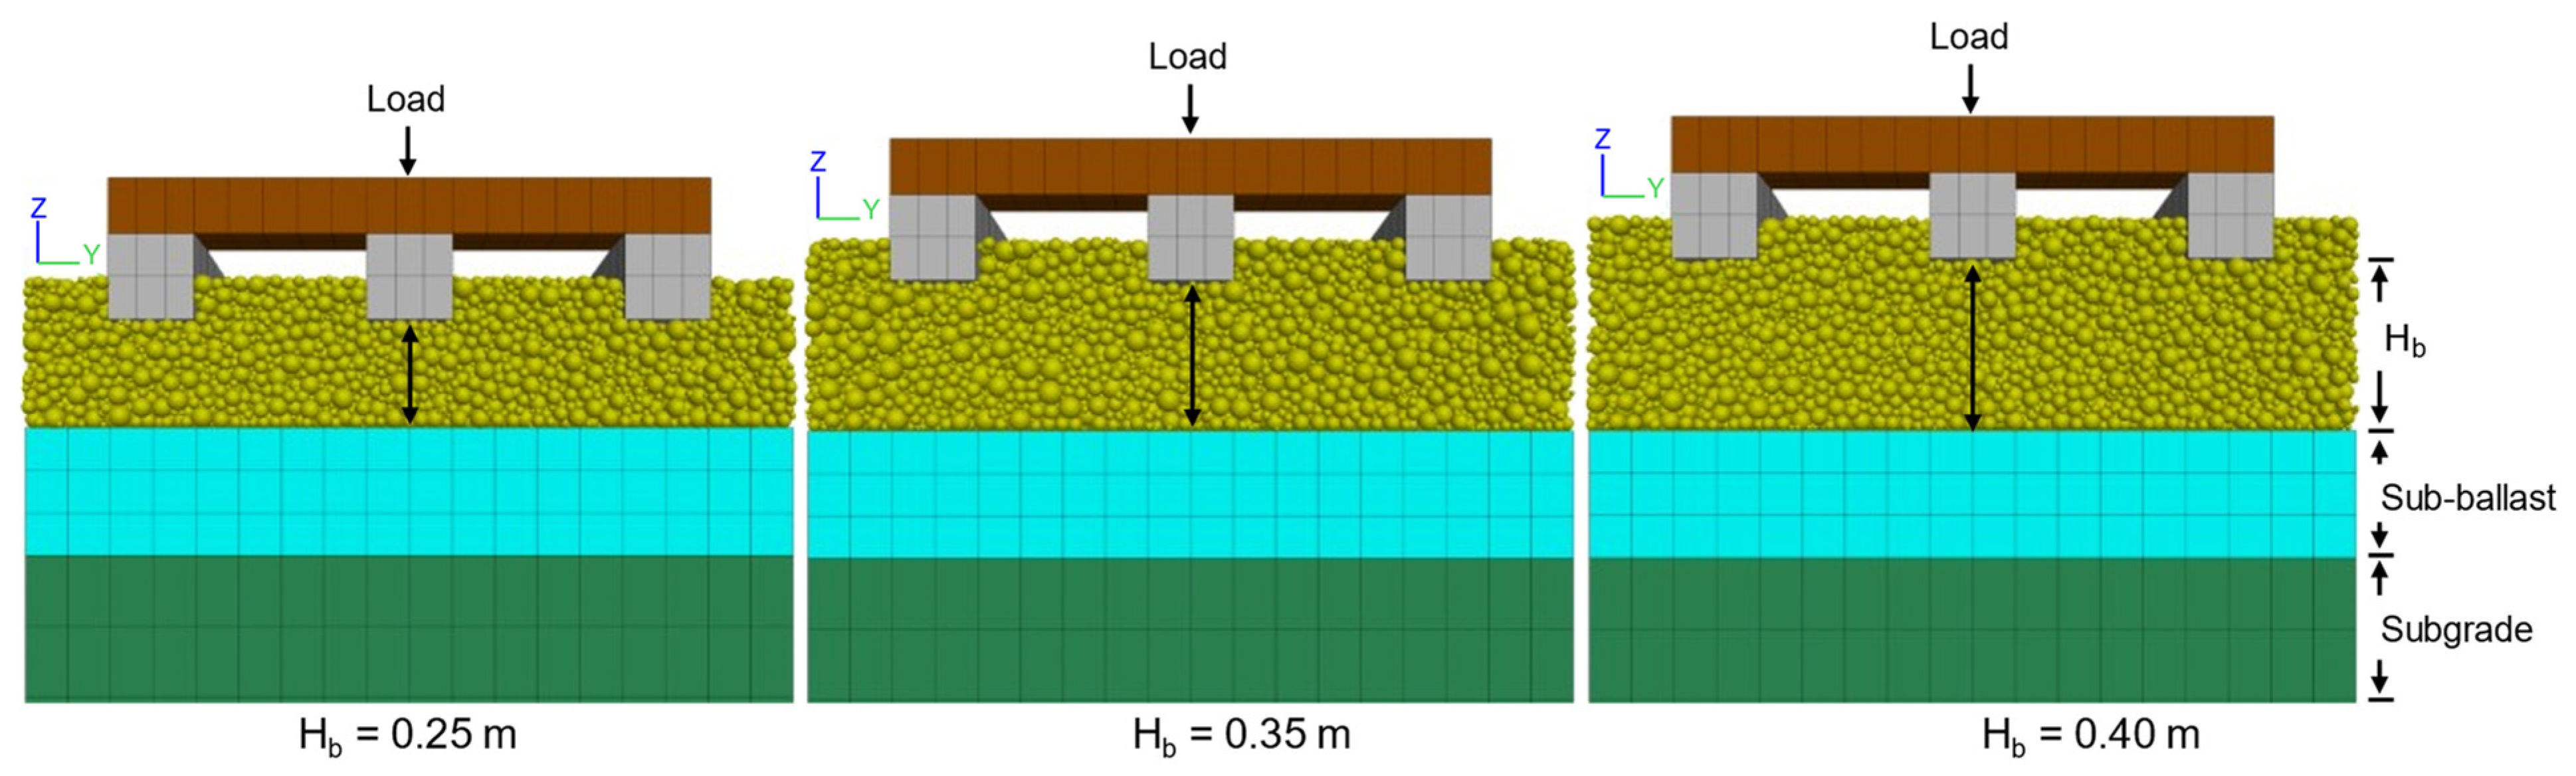
Thus, the cyclic load was applied 300 times at 10 Hz, with a spacing of 2.40 m between axles. The loading and boundary conditions described above were consistently applied to all numerical models included in the parametric analysis. In this study, only the ballast layer height was varied, with values of 0.25 m, 0.35 m, and 0.40 m corresponding to Cases I, II, and III, respectively, as shown in
Figure 12.
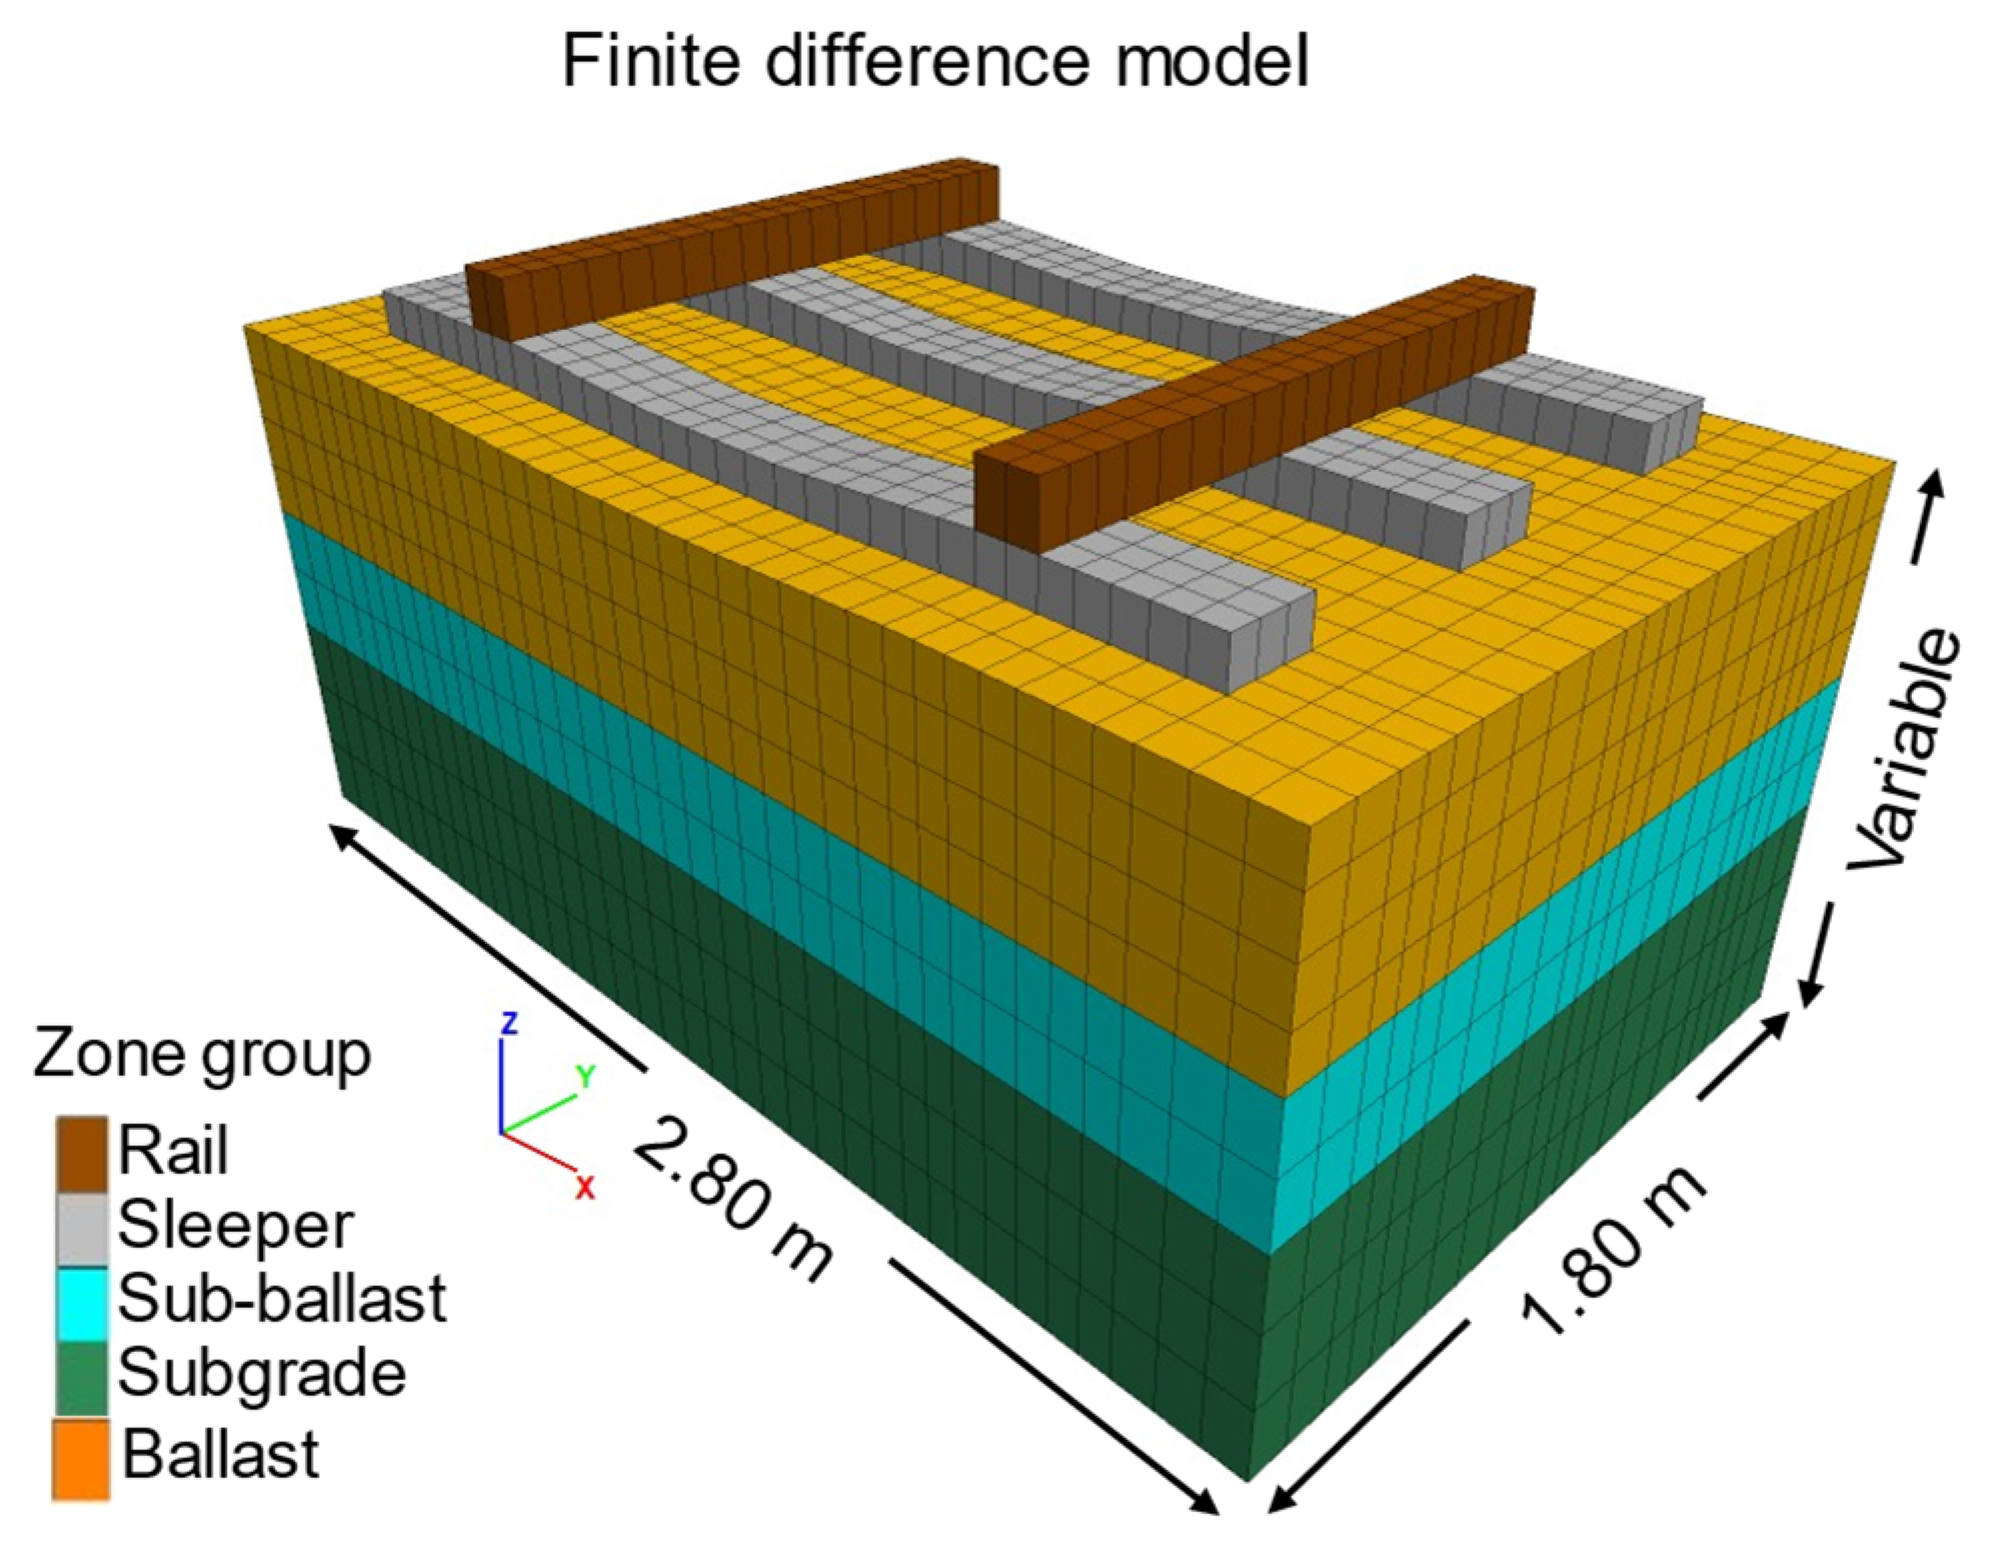
3.7. Finite Differences Model
In parallel with the hybrid models, three-dimensional finite-difference numerical models were developed in FLAC
3D to assess the ballast’s safety factor following a conventional practice-oriented method. The geometric configuration is shown in
Figure 13. To ensure comparability of results, the parametric analyses of the finite difference models faithfully replicated the variables studied in the hybrid models: material types (basalt, granite, limestone), ballast thicknesses, and applied loading conditions. In these models, the behavior of the geomaterials was represented using an elastoplastic constitutive law with a Mohr–Coulomb failure criterion. Although this constitutive model simplifies the stress–strain relationship of geomaterials, it is still widely used in engineering practice. For completeness, a more robust model was used for comparison.
The geotechnical parameters used in this study, such as unit weight, friction angle, Young’s modulus, and Poisson’s ratio, have been derived from experimental data reported in specialized literature, particularly from large-scale triaxial tests conducted with limestone and granite ballast under static and cyclic conditions [
24,
25,
26] and summarized in
Table 6. The unit weight (γ) values were obtained directly from laboratory measurements, while the friction angle (ϕ) was calculated from Mohr-Coulomb envelopes under different confining pressures. It was assumed that cohesion was negligible, given the granular nature of the ballast. Young’s modulus (E) was estimated from the initial slopes of the stress–strain curves, and Poisson’s ratio (υ) was taken from typical values for granular materials under drained conditions. In all cases, consistency has been maintained with the drained and cohesionless behavior characteristic of ballast, ensuring that the parameter selection is supported by widely validated experimental evidence.
4. Results
The overall track response was evaluated based on stress distributions, deformation patterns, ballast breakage, and safety factor values. These results were consistent with typical ranges reported in railway engineering practice and design standards.
Cyclic loading was applied to the central sleeper. Numerical models with this level of detail simulating tens of thousands of load cycles are computationally demanding. Therefore, results for 300 load cycles at 10 Hz, corresponding to a train speed of 85 km/h, are presented only. The focus is placed on the deformation trend and the rate of deformation accumulation. After 300 cycles, the deformation rate became negligible, and the accumulated deformation remained below 0.004 mm/s. Based on these results, the system is interpreted as operating within the shakedown stage under the analyzed conditions. For very long-term performance, the present model may be complemented with simplified approaches or extrapolation schemes; however, the key stage is already identified.
Due to the computational cost of DEM simulations involving particle breakage, it is not feasible to simulate the millions of load cycles encountered during the service life of railway tracks. Instead, the analysis focuses on the early evolution of deformation and on identifying the deformation regime. As further detailed in
Section 4.2, the deformation rate stabilizes after approximately 250 cycles, indicating that the system approaches a shakedown-type response.
4.1. Stress Transmission
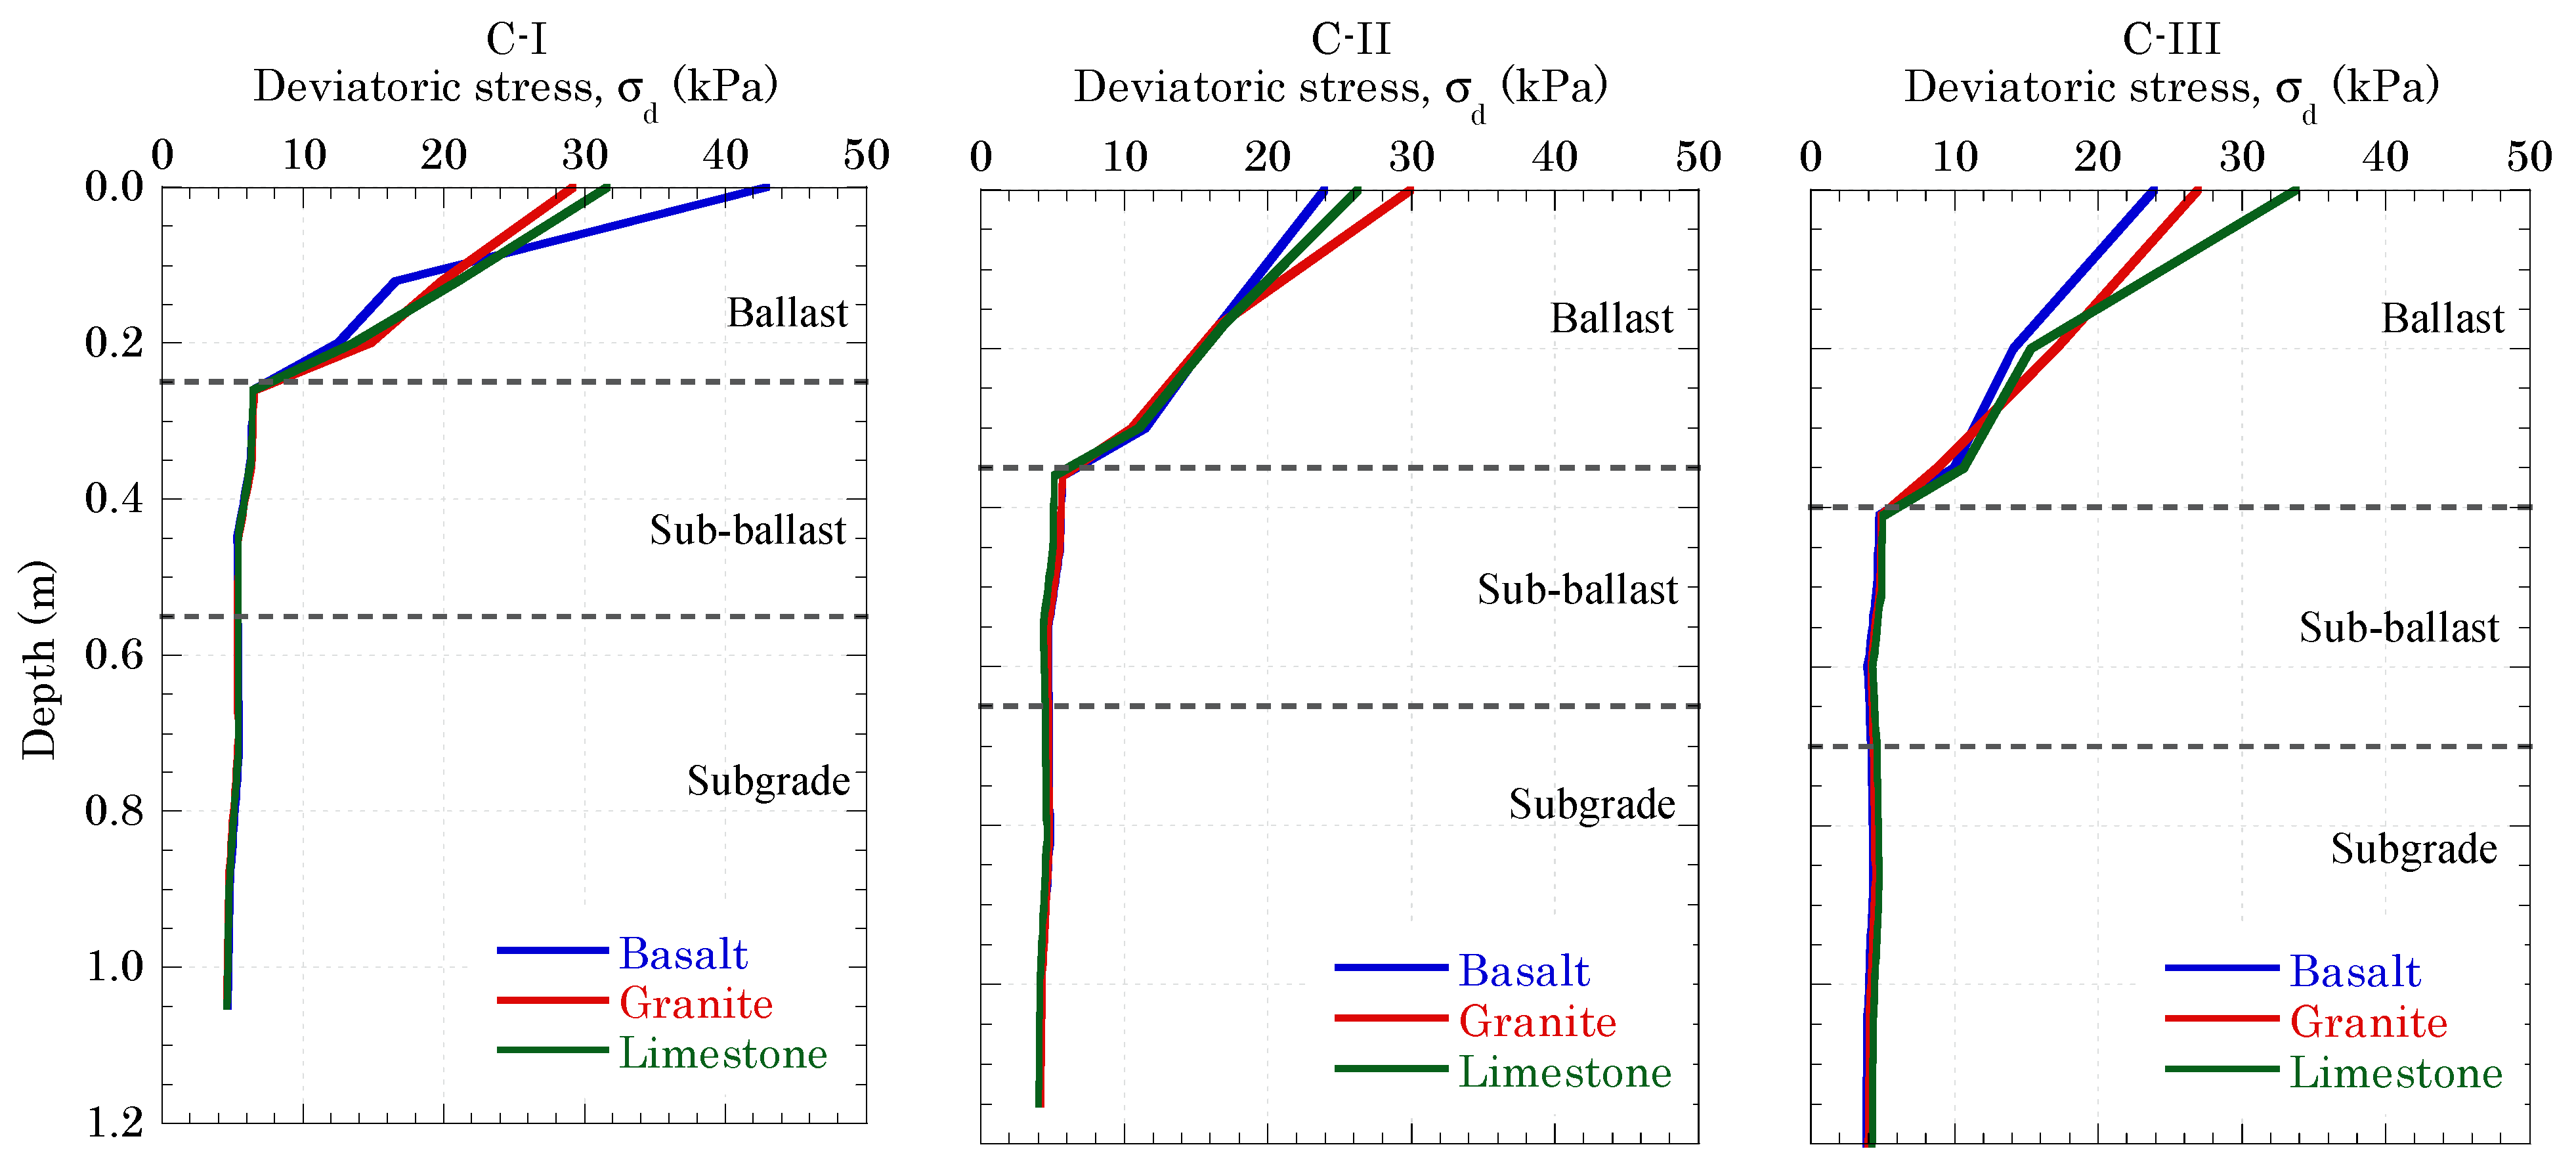
To examine stress transmission through the different layers of the track support system,
Figure 14 presents the stress profiles with depth along the transverse section. Interestingly, high deviatoric stress values, defined as
are observed at the sleeper–ballast interface, which progressively dissipate through the ballast layer. The marked increase in deviatoric stress across all analyzed points highlights its role as the primary factor governing the accumulated permanent strain of the ballast under repeated loading.
The maximum deviatoric stress at the sleeper–ballast interface was evaluated for each material and ballast thickness. As summarized in
Table 7, increasing ballast thickness from 0.25 m to 0.40 m resulted in contrasting responses depending on the material. Basalt exhibited a 21.8% reduction and granite a 7.7% reduction, whereas limestone showed a 6.3% increase.
The reduction observed in basalt and granite is consistent with improved stress distribution resulting from increased layer thickness. In contrast, the increase observed for limestone indicates that stress transmission is governed by different mechanisms. This behavior suggests that, for limestone, increasing ballast thickness does not necessarily lead to effective stress dissipation. Instead, the combined effects of reduced stiffness and progressive particle degradation generate localized stress concentrations, leading to a material-dependent response.
4.2. Characterization of Plastic Deformation
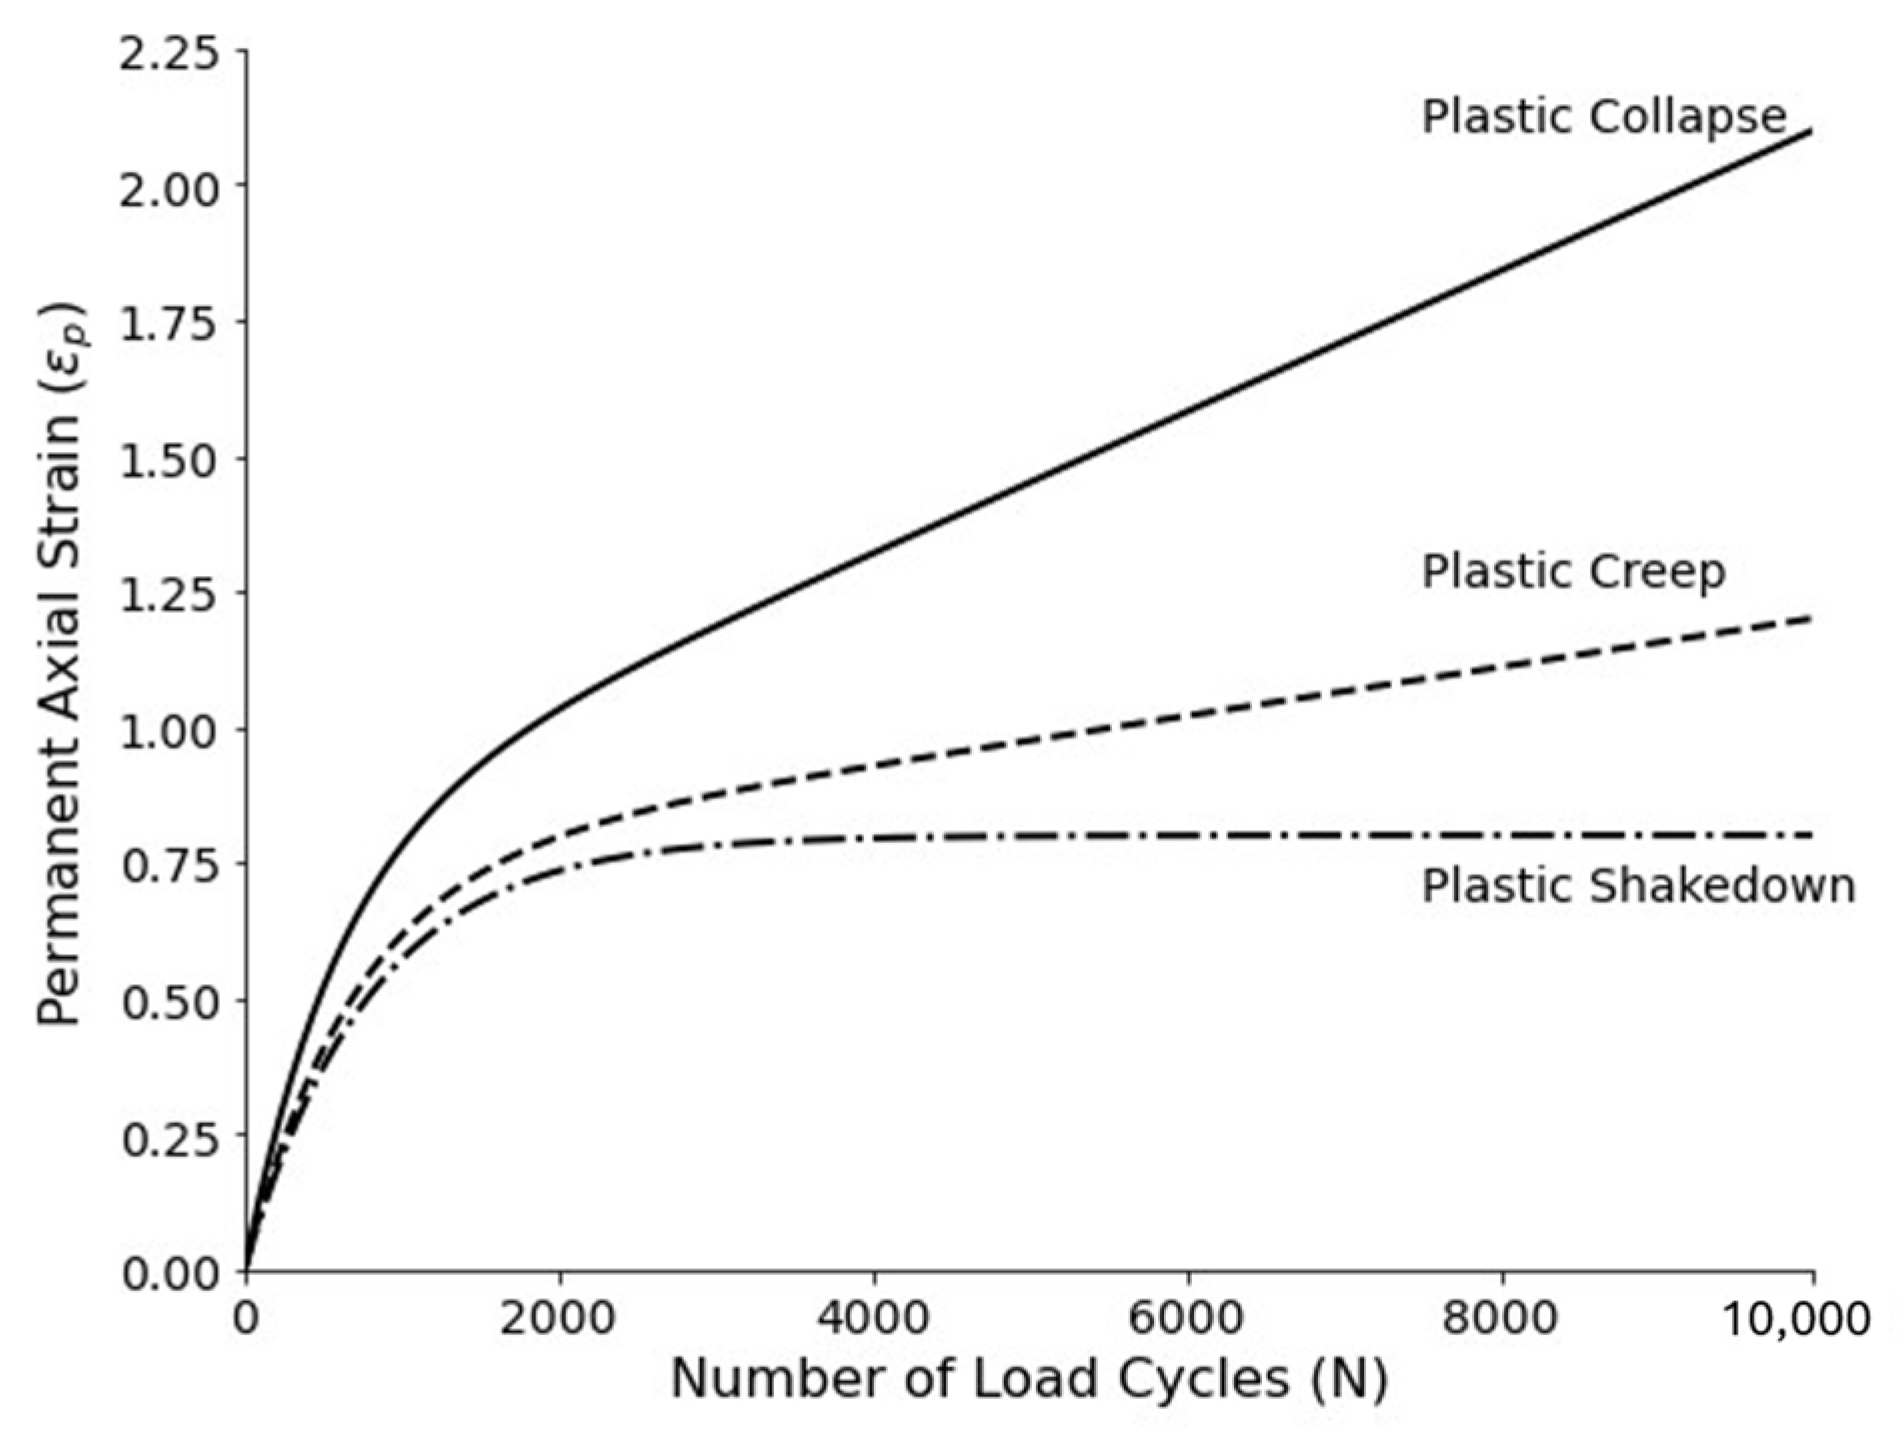
Under repetitive loading, the mechanical behavior of granular materials is characterized by the development of permanent axial deformations. In the initial stages of cyclic loading, these deformations increase rapidly due to the internal reorganization of particles, a phenomenon commonly called “cyclic densification”. After this initial phase, the material’s response is governed by the shakedown regime, which can be classified into three domains: plastic shakedown, where the material reaches a stable state with negligible deformation increments per cycle; plastic creep, in which deformations continue to accumulate progressively but at a reduced rate; and plastic collapse/ratcheting, characterized by unsteady accumulation of deformations leading to rapid failure (
Figure 15). The transition between these regimes is strongly influenced by the confining pressure and the magnitude and frequency of the applied load. Results indicate that increases in deviatoric stress and frequency tend to increase permanent deformations and shift the material response toward more unstable states [
37,
38].
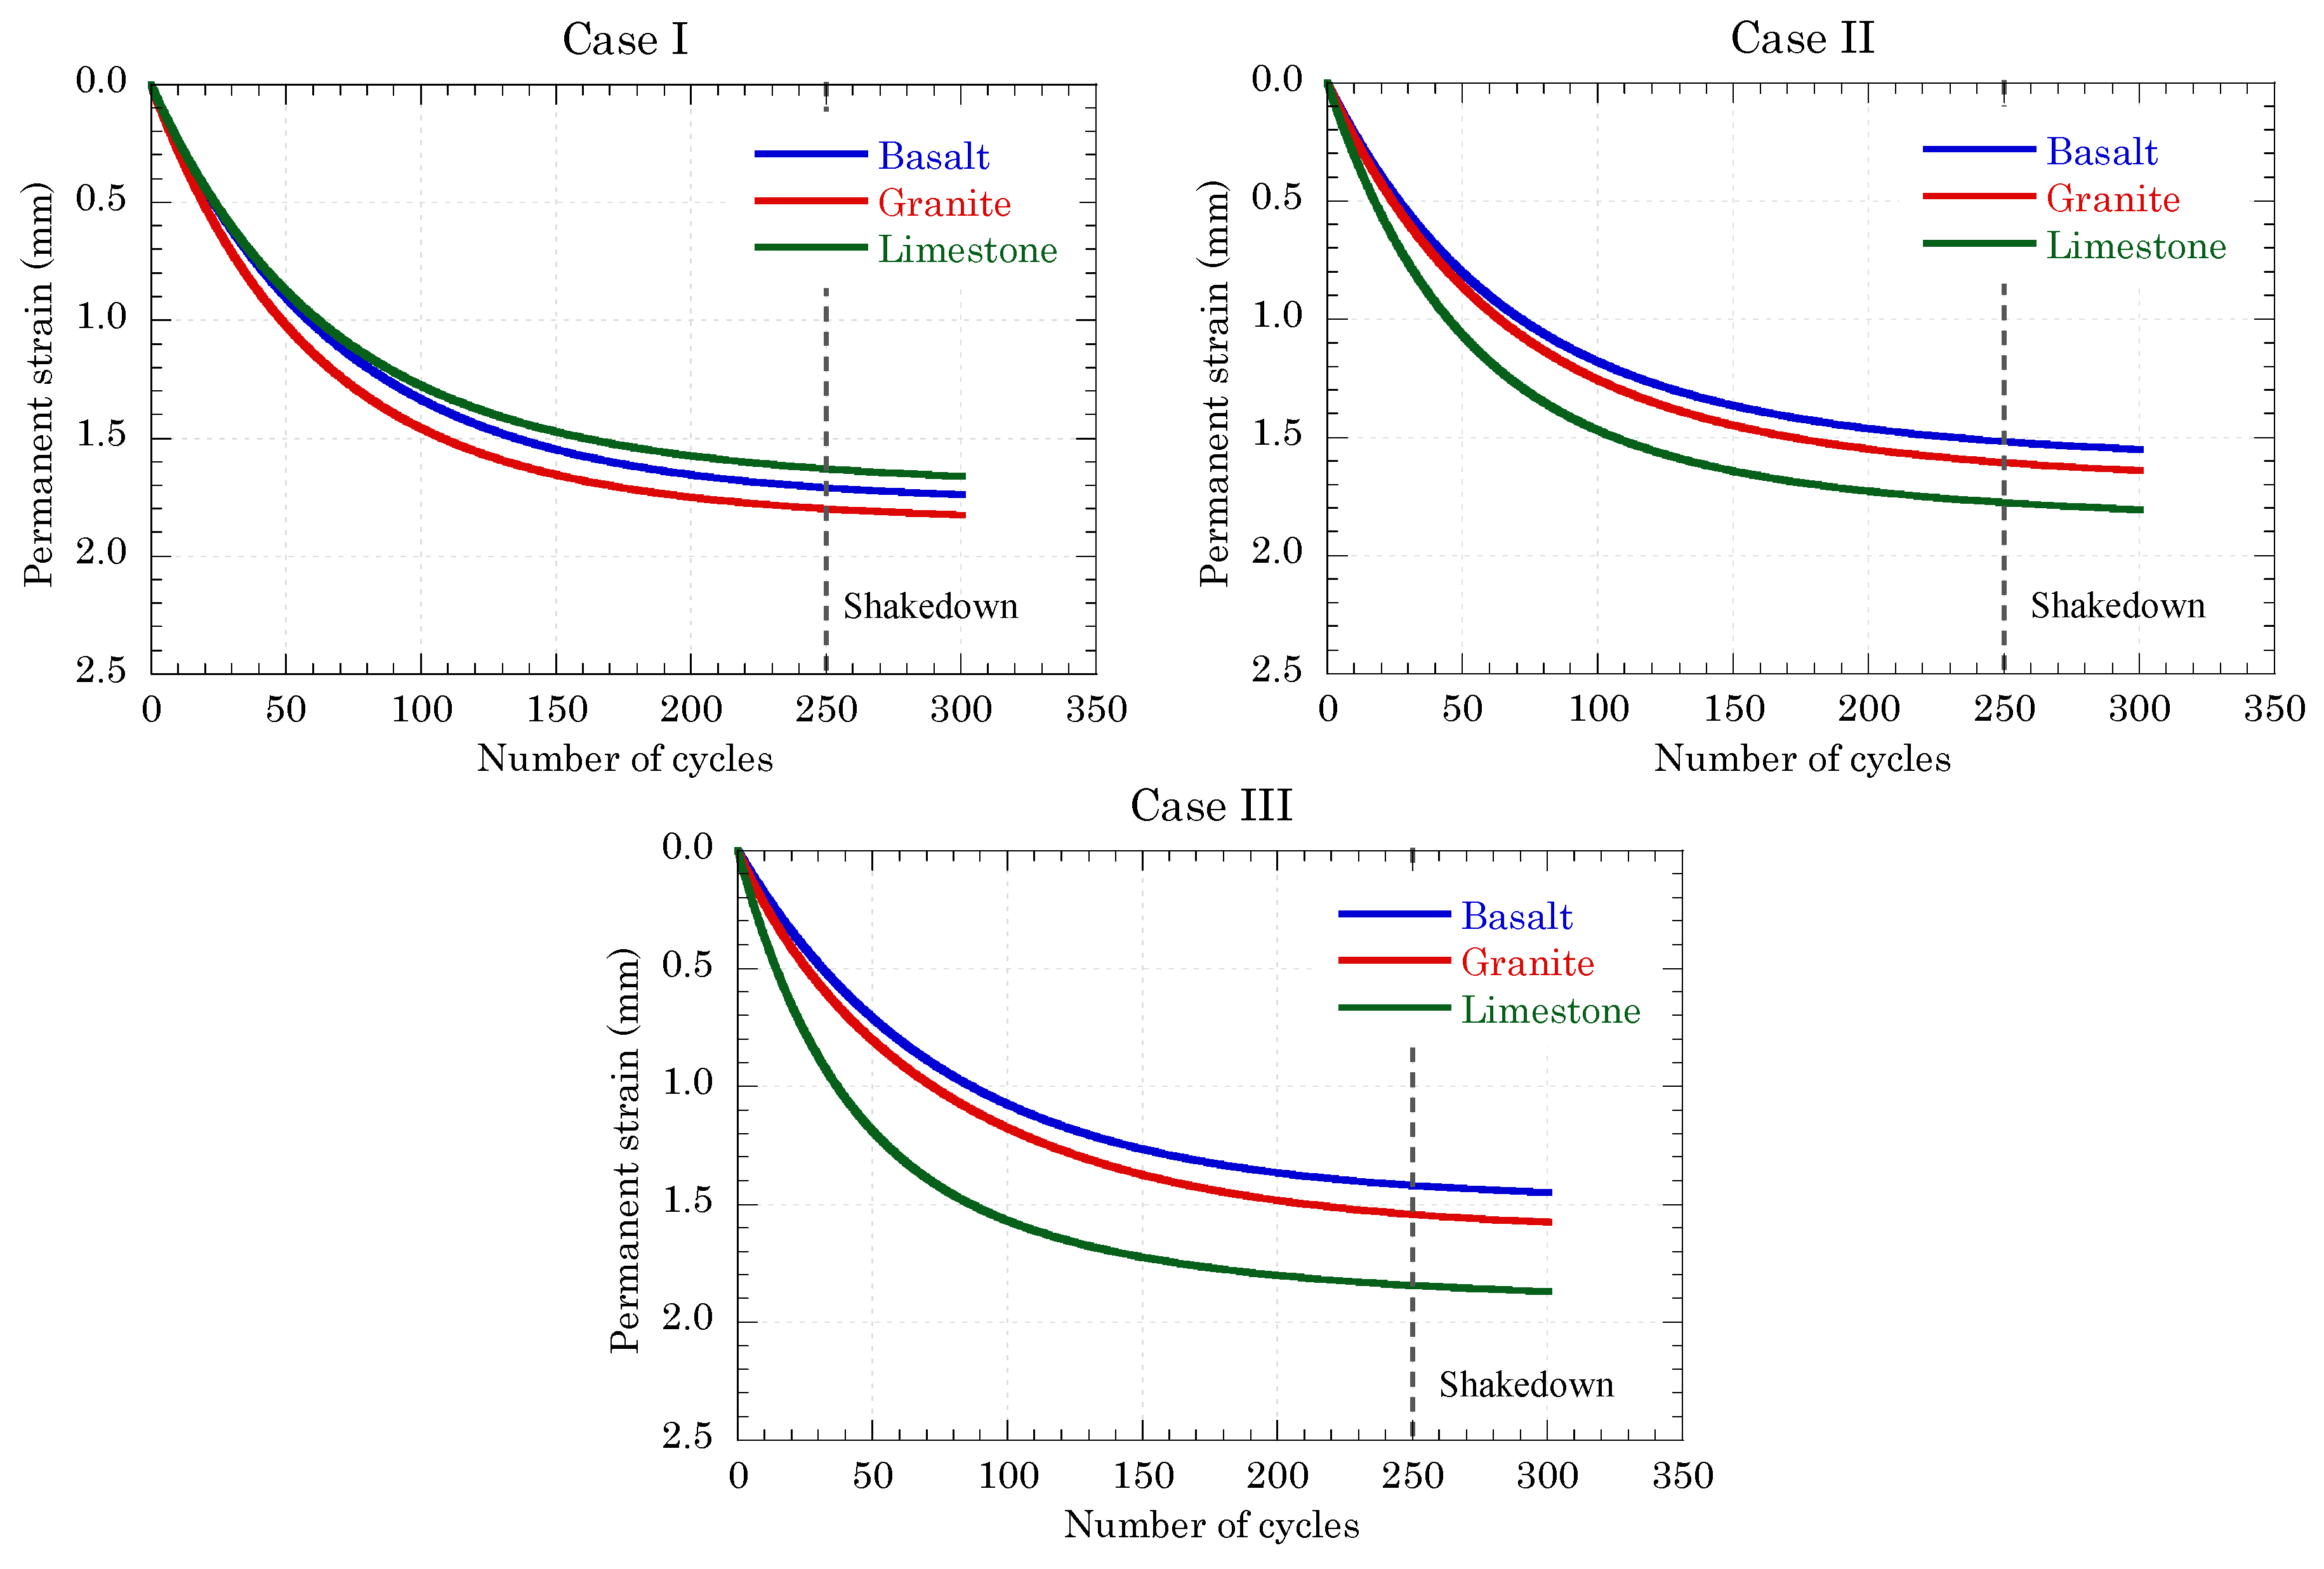
Figure 16 shows the deformation histories as a function of the number of load cycles at the control point located beneath the central sleeper (as indicated in
Figure 12). Permanent strain of the particle assembly increases significantly during the first approximately 250 load cycles. Beyond this stage, the accumulation of permanent strain stabilizes at an approximately constant rate, which is consistent with a shakedown-type response.
These results demonstrate that permanent deformation is strongly influenced by the stress state at the sleeper–ballast interface. While increasing ballast thickness effectively reduces both stress and deformation for competent materials such as basalt and granite, the opposite trend observed for limestone indicates that deformation is governed by a combination of stress concentration and micromechanical degradation processes.
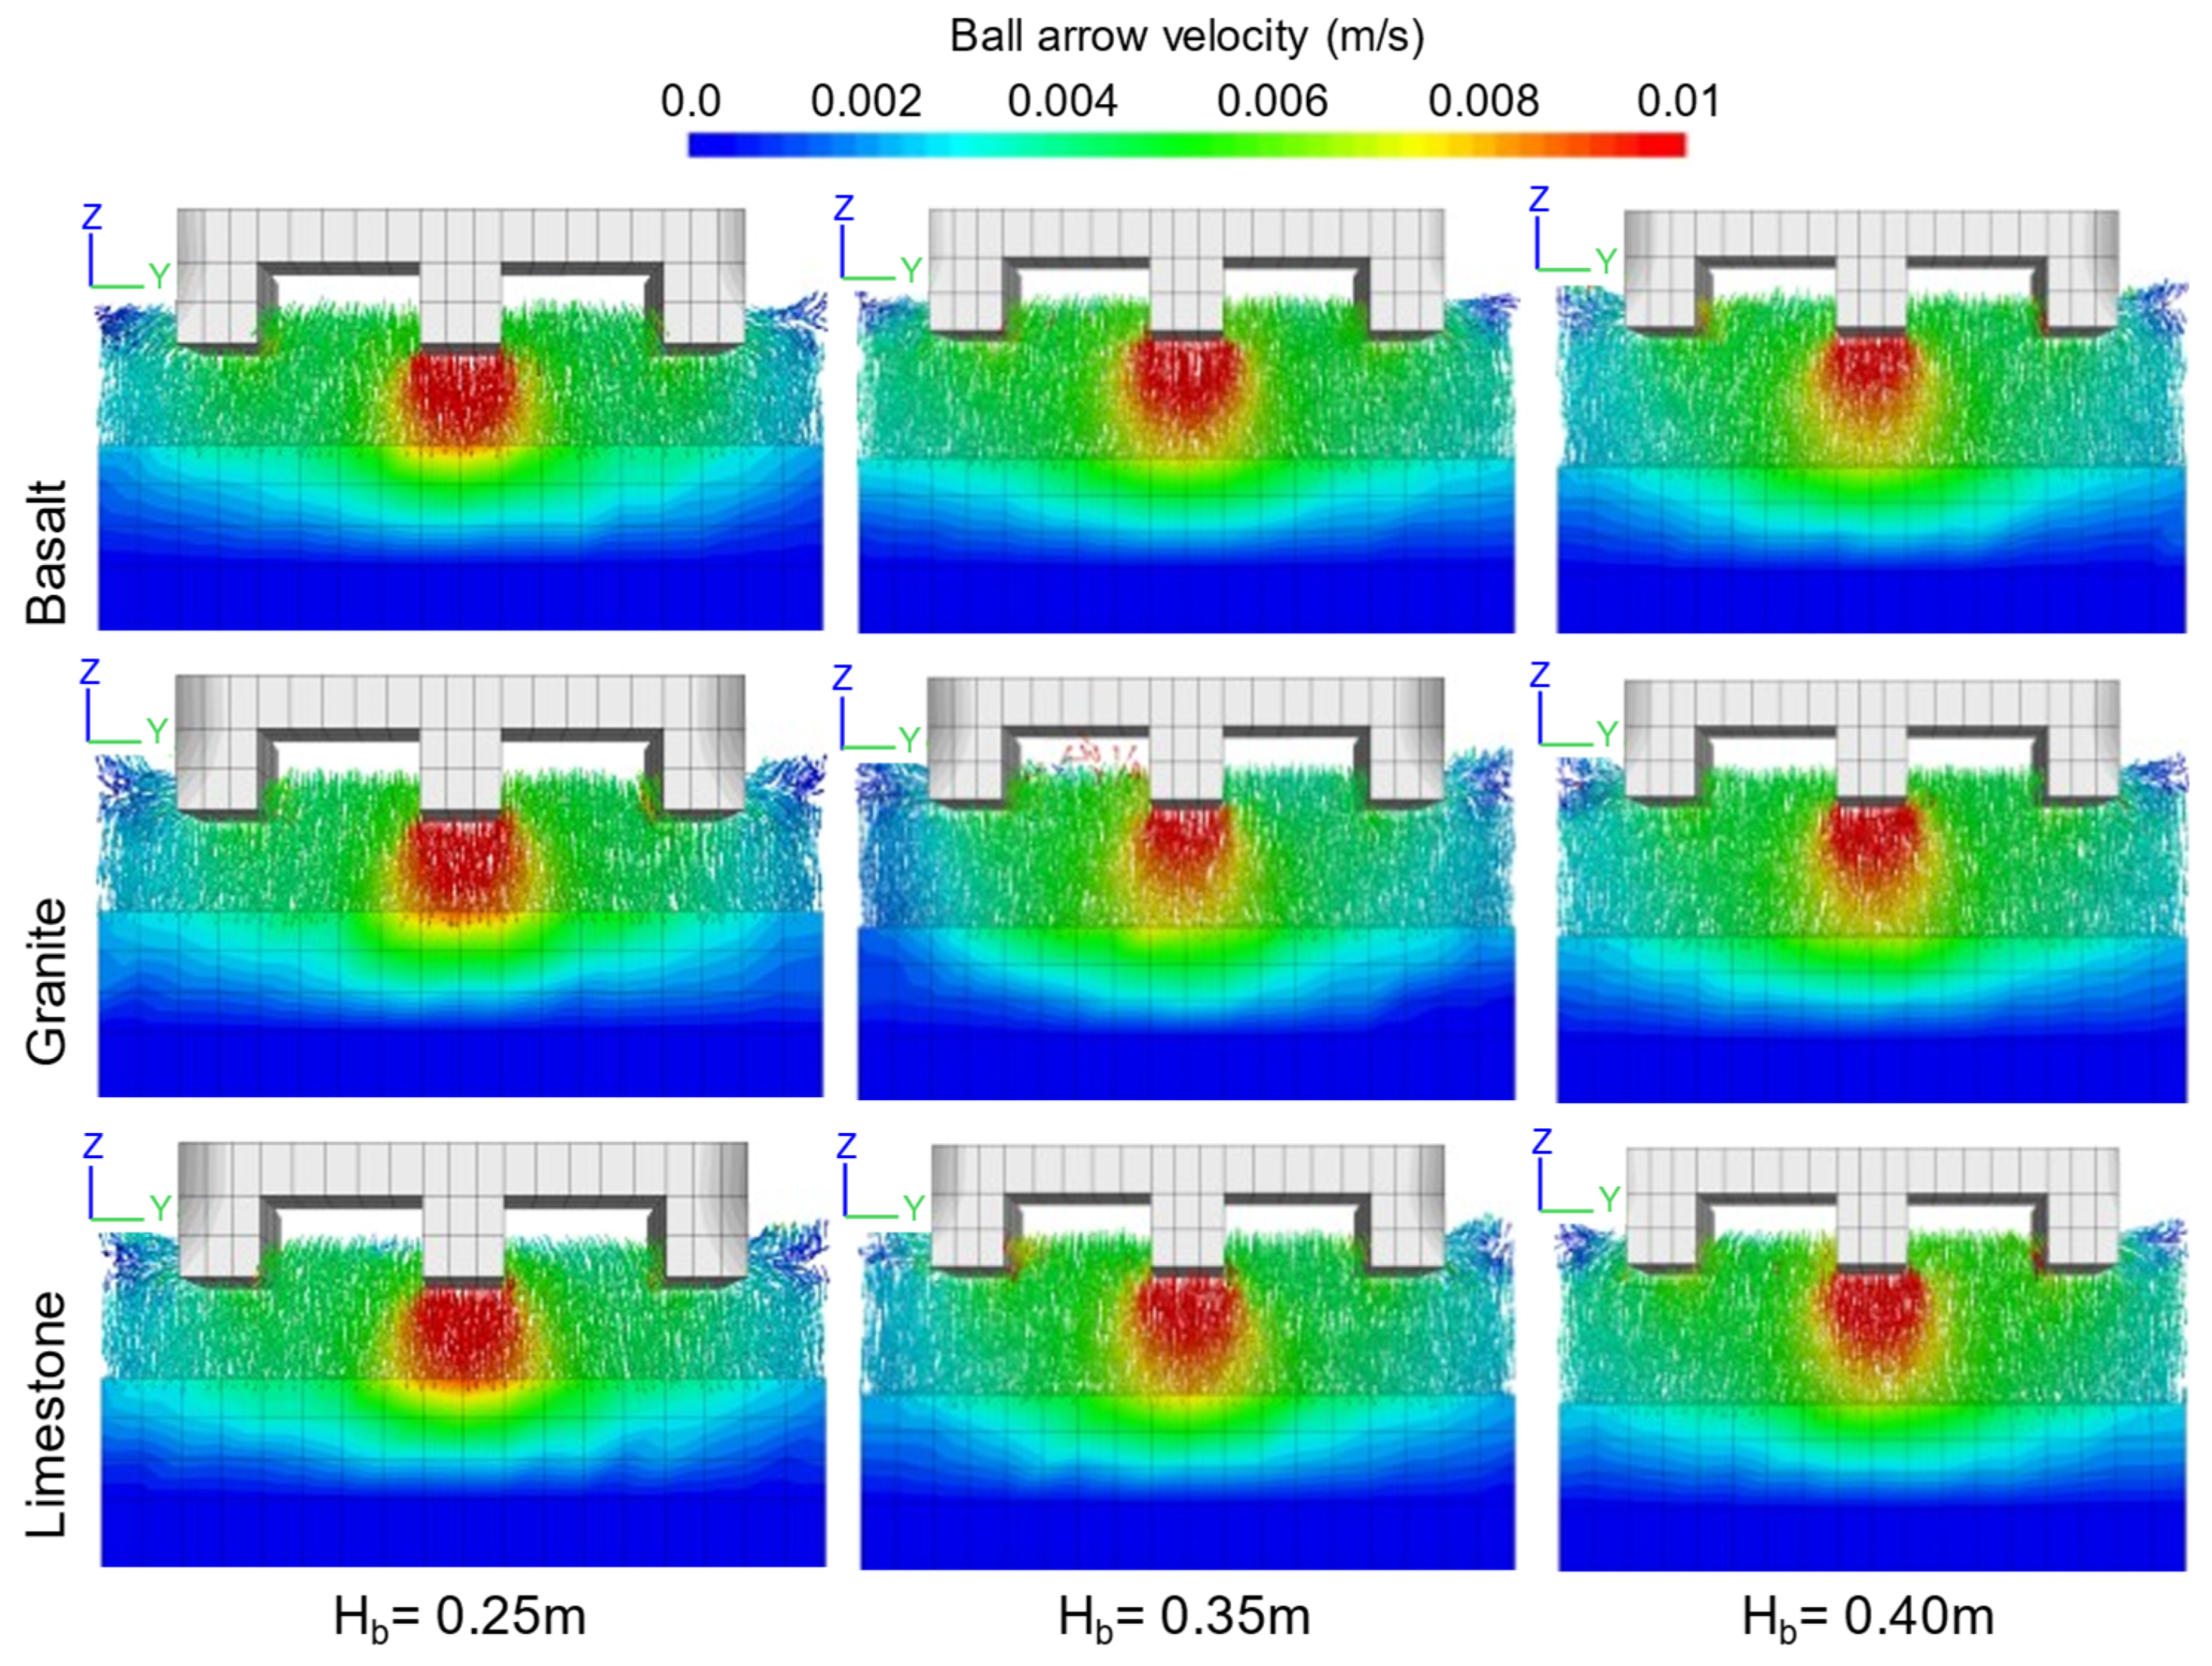
Figure 17 presents the vibration velocities of ballast particles at the end of 300 load cycles. A clear reduction in particle velocity is observed with increasing ballast height, together with a downward shift in the central sleeper. In addition, higher particle velocities are consistently observed for limestone ballast across all analyzed cases.
Higher particle velocities were consistently observed for limestone ballast across all analyzed cases, indicating lower vibration-damping capacity compared to basalt and granite. The reduction in particle velocities with increasing thickness was most pronounced for basalt (25.6%), and least for limestone (16.2%), consistent with the trend observed for reduction.
This behavior reinforces the interpretation that vibration attenuation is closely related to stress transmission and material stiffness. The lower reduction in particle velocity observed for limestone is consistent with its reduced capacity to dissipate energy through stable force transmission networks, further supporting the observed trends in stress concentration and deformation.
4.3. Particle Breakage
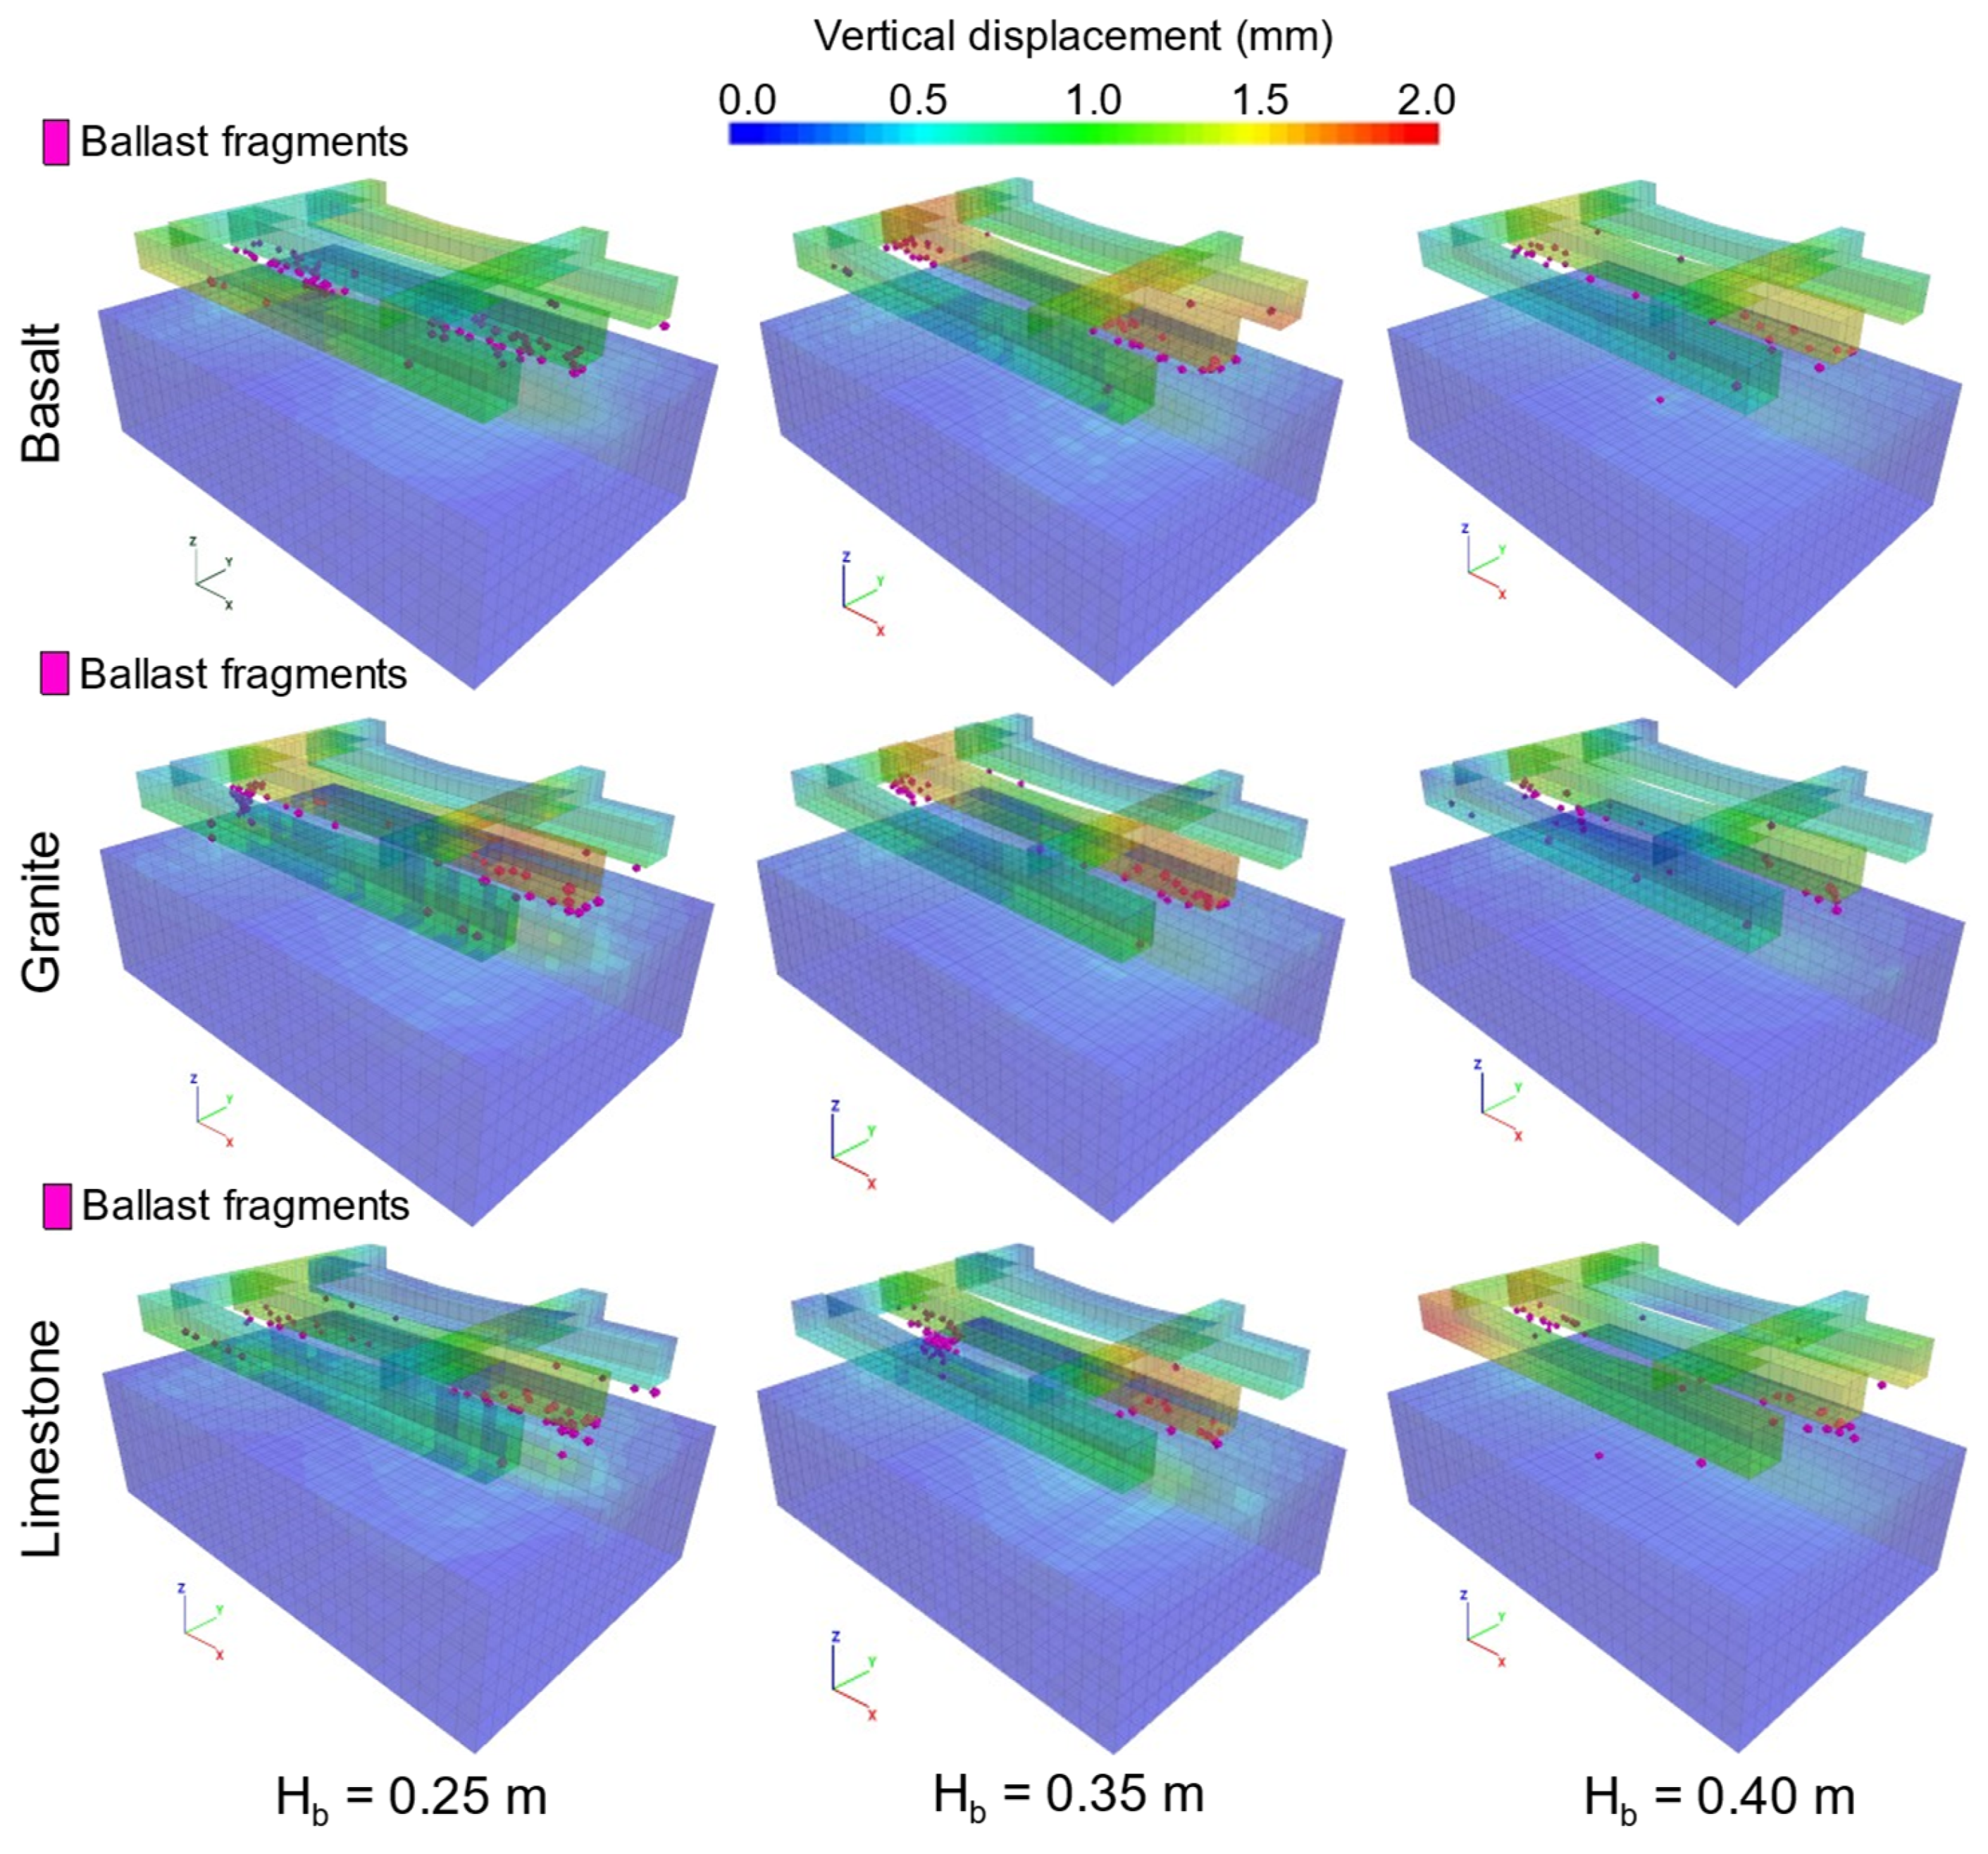
Figure 18 illustrates the spatial distribution of particle breakage for all analyzed cases. The highest levels of particle fragmentation are concentrated at the sleeper–ballast interface, where increased deviatoric stresses lead to higher transmission of shear forces, resulting in elevated breakage indices.
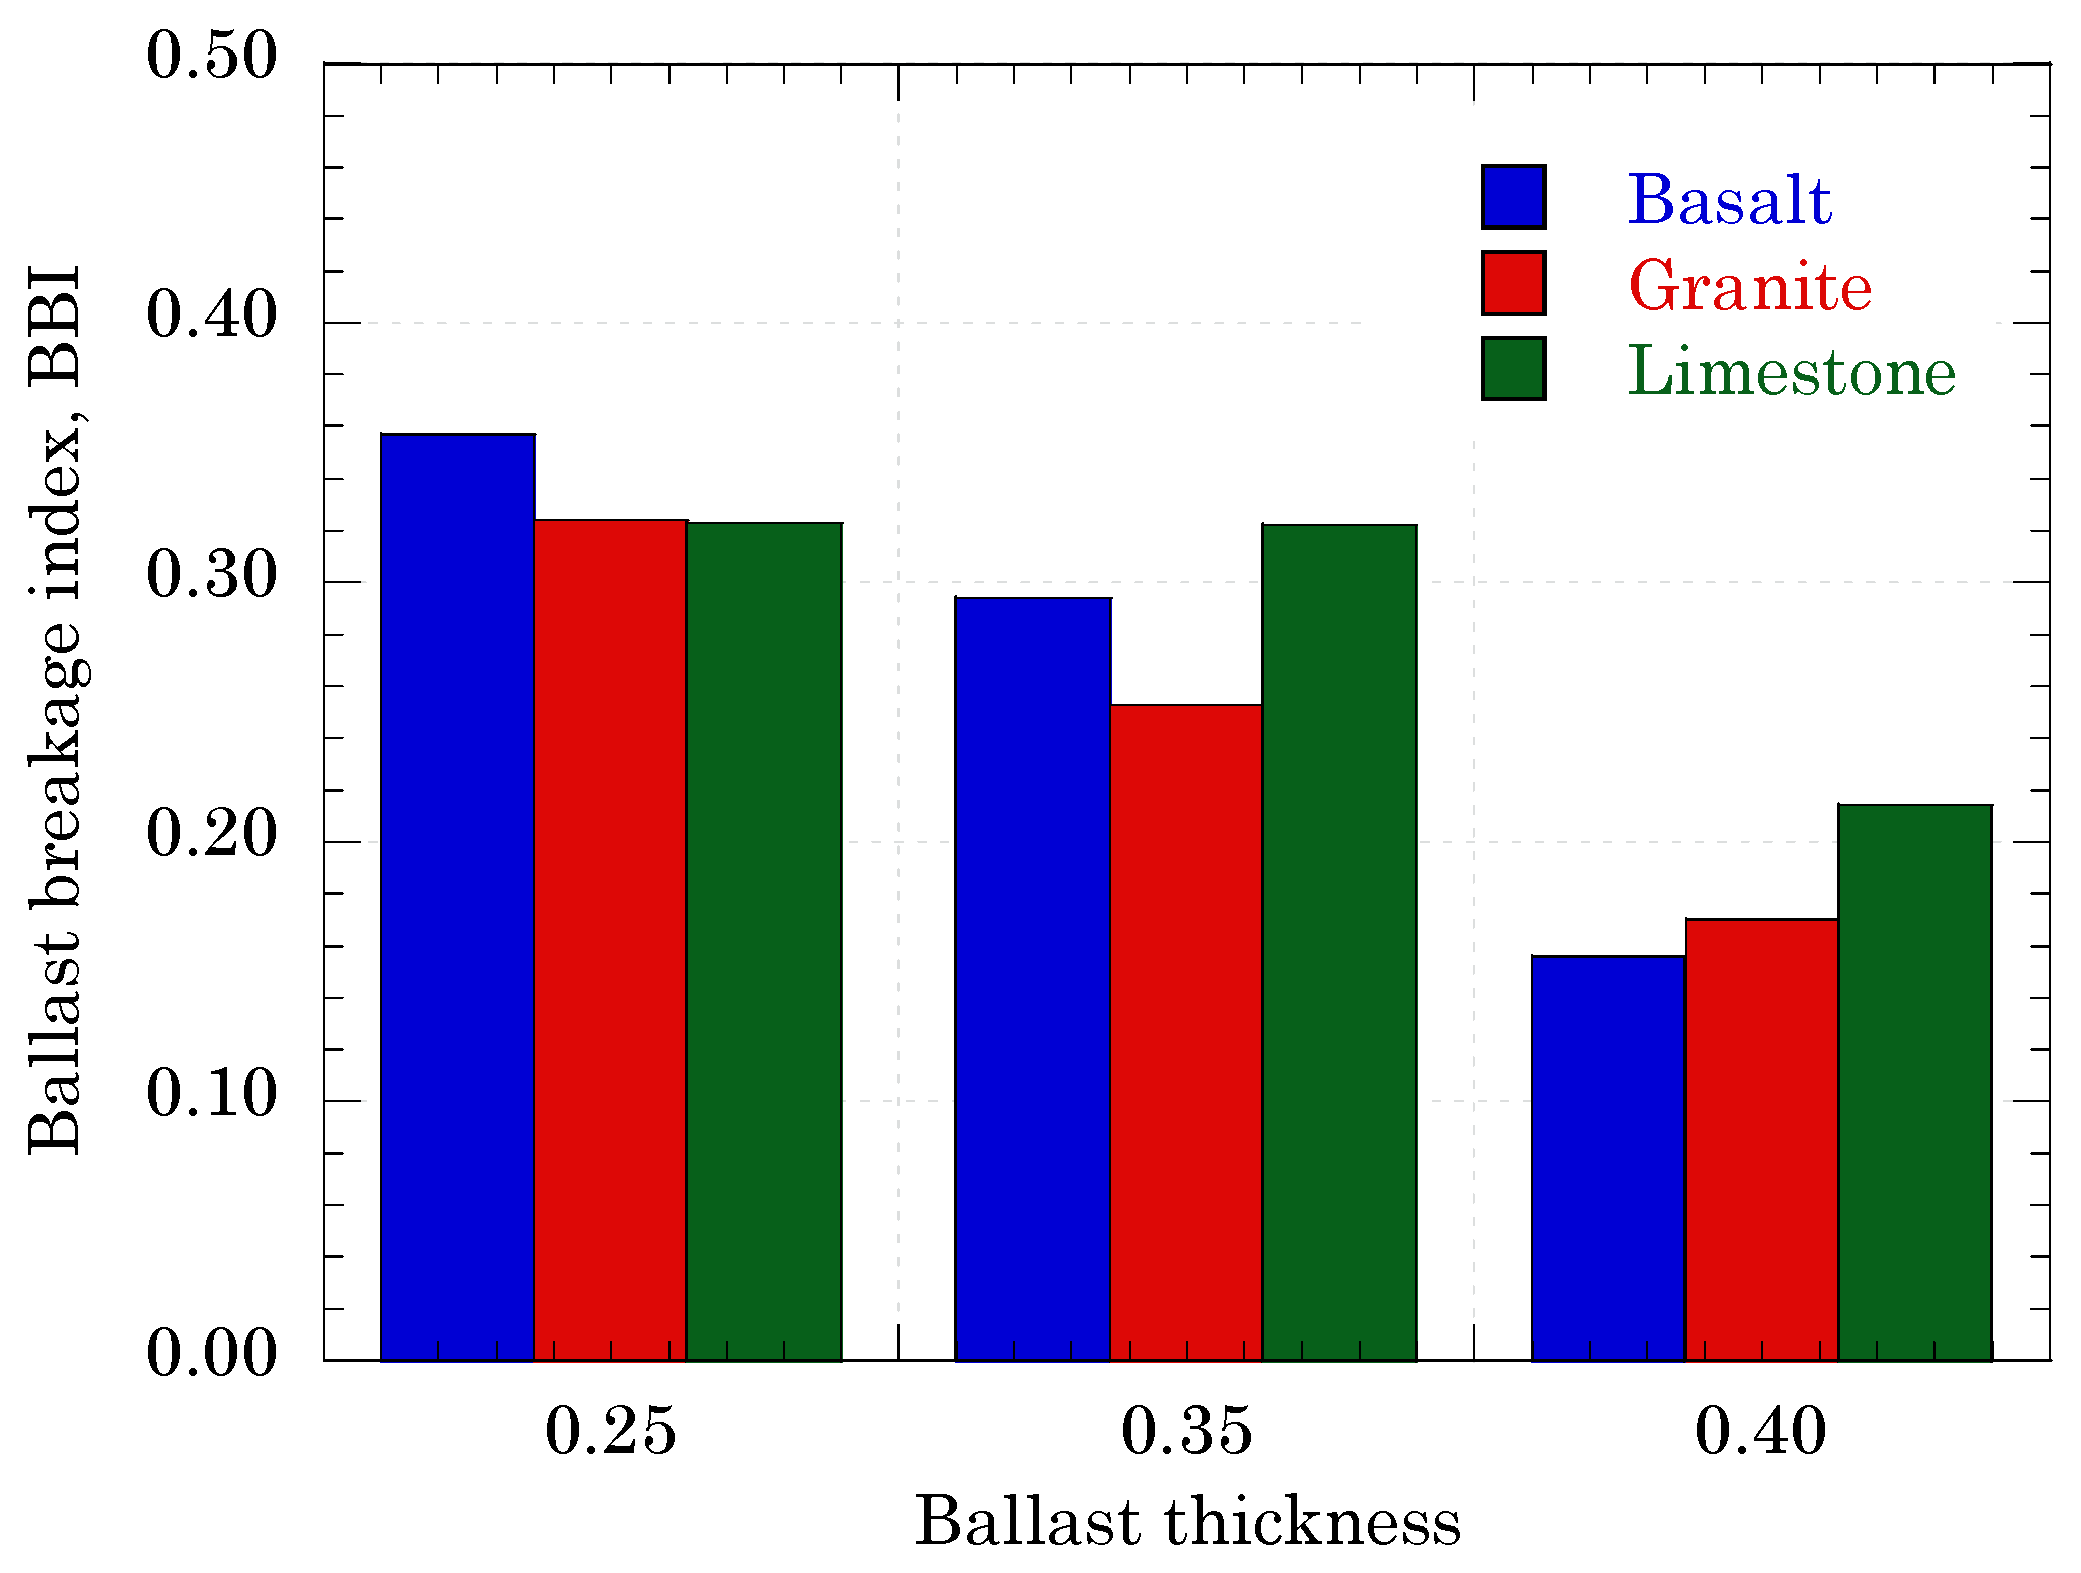
With respect to particle breakage, a progressive reduction in the number of fragments is observed as ballast height increases. The Marsal breakage index (Bg) [
39] exhibits clear reductions with increasing height. The Indraratna breakage index (BBI) [
40] follows a similar trend, although with some differences in relative magnitude. At a ballast height of 0.25 m, basalt exhibits the highest BBI value (0.357), while granite and limestone show nearly identical values (0.324 and 0.323, respectively). At 0.35 m, limestone presents the highest BBI (0.322), followed by basalt (0.294) and granite (0.253). At a height of 0.40 m, the ranking changes, and the overall values decrease to 0.214 (limestone), 0.170 (granite), and 0.156 (basalt), as shown in
Figure 19 and
Figure 20.
The relationship between BBI and was examined separately for each material group. For basalt and granite, a reduction in deviatoric stress was associated with reductions in the breakage index. For limestone, however, the increase in from 31.65 kPa to 33.76 kPa was accompanied by a substantial decrease in BBI from 0.323 to 0.214. This effect between stress magnitude and breakage suggests that the fragmentation mechanism in limestone is governed not only by the magnitude of applied stresses but also by the cumulative effects of particle rearrangement and the progressive degradation of particle strength during cyclic loading. The initial fragmentation of weaker particles may lead to a more compact, interlocked assembly, paradoxically reducing further breakage while increasing stress concentrations at the interface.
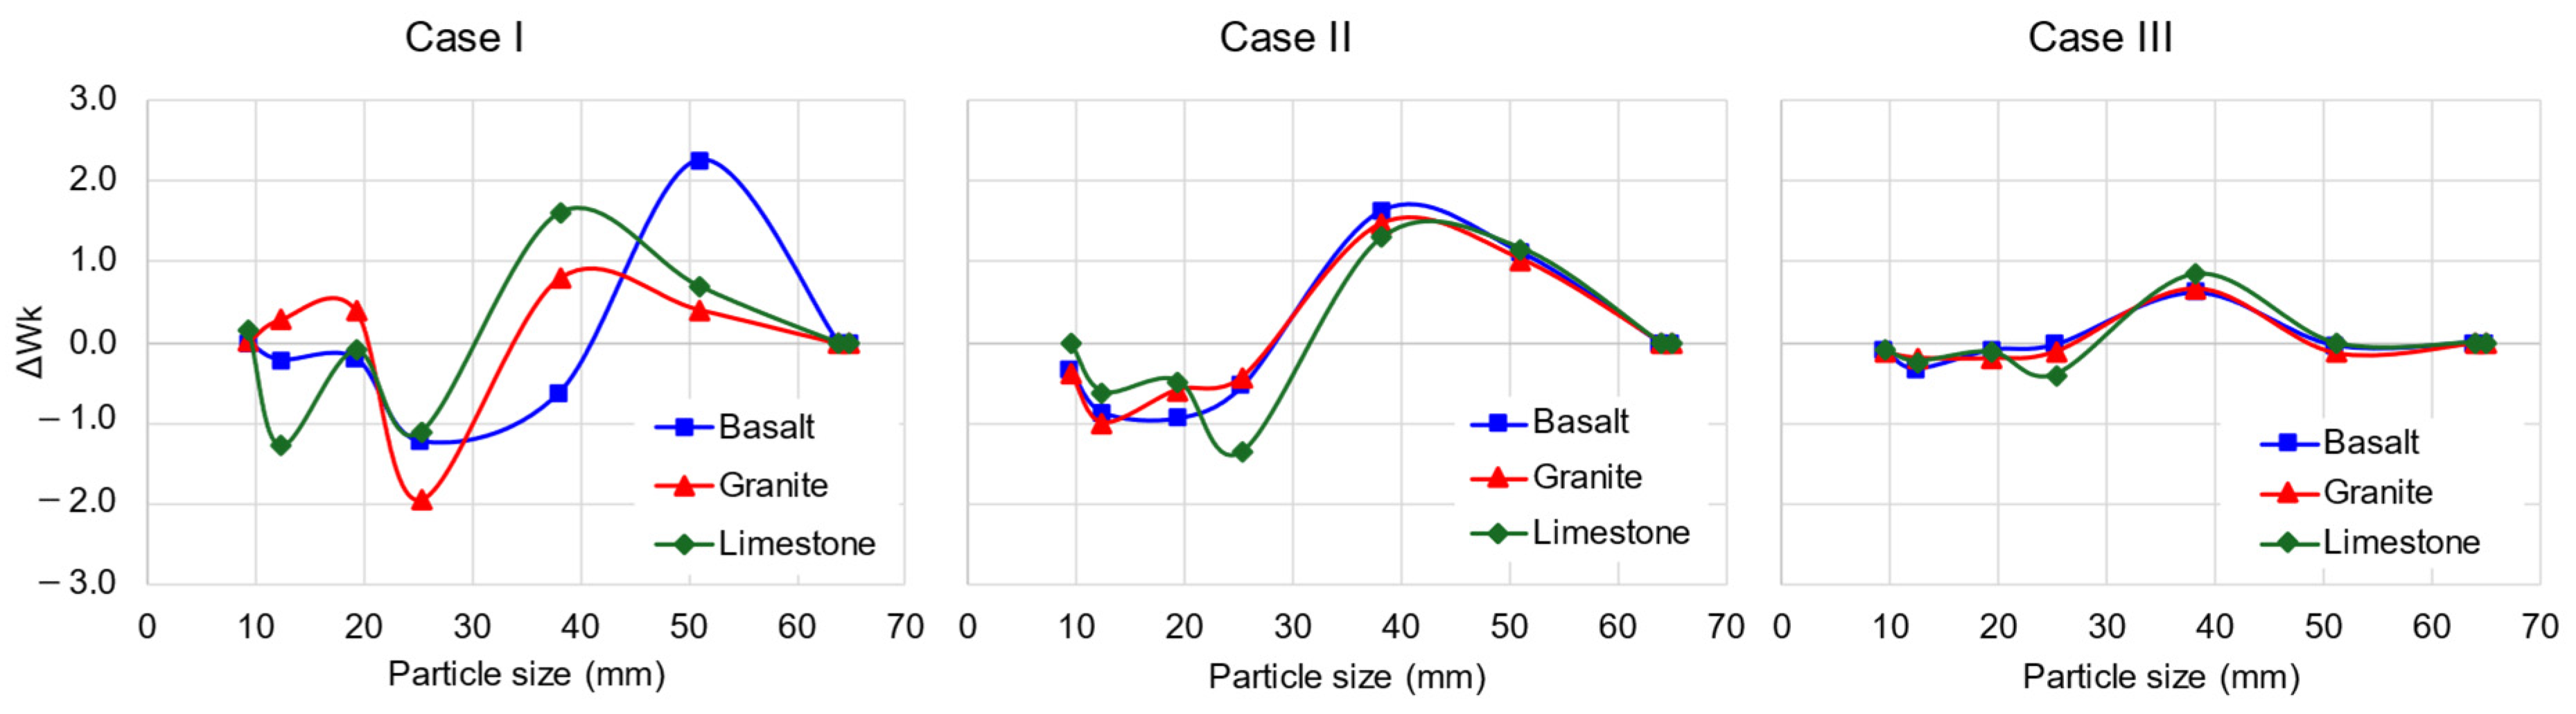
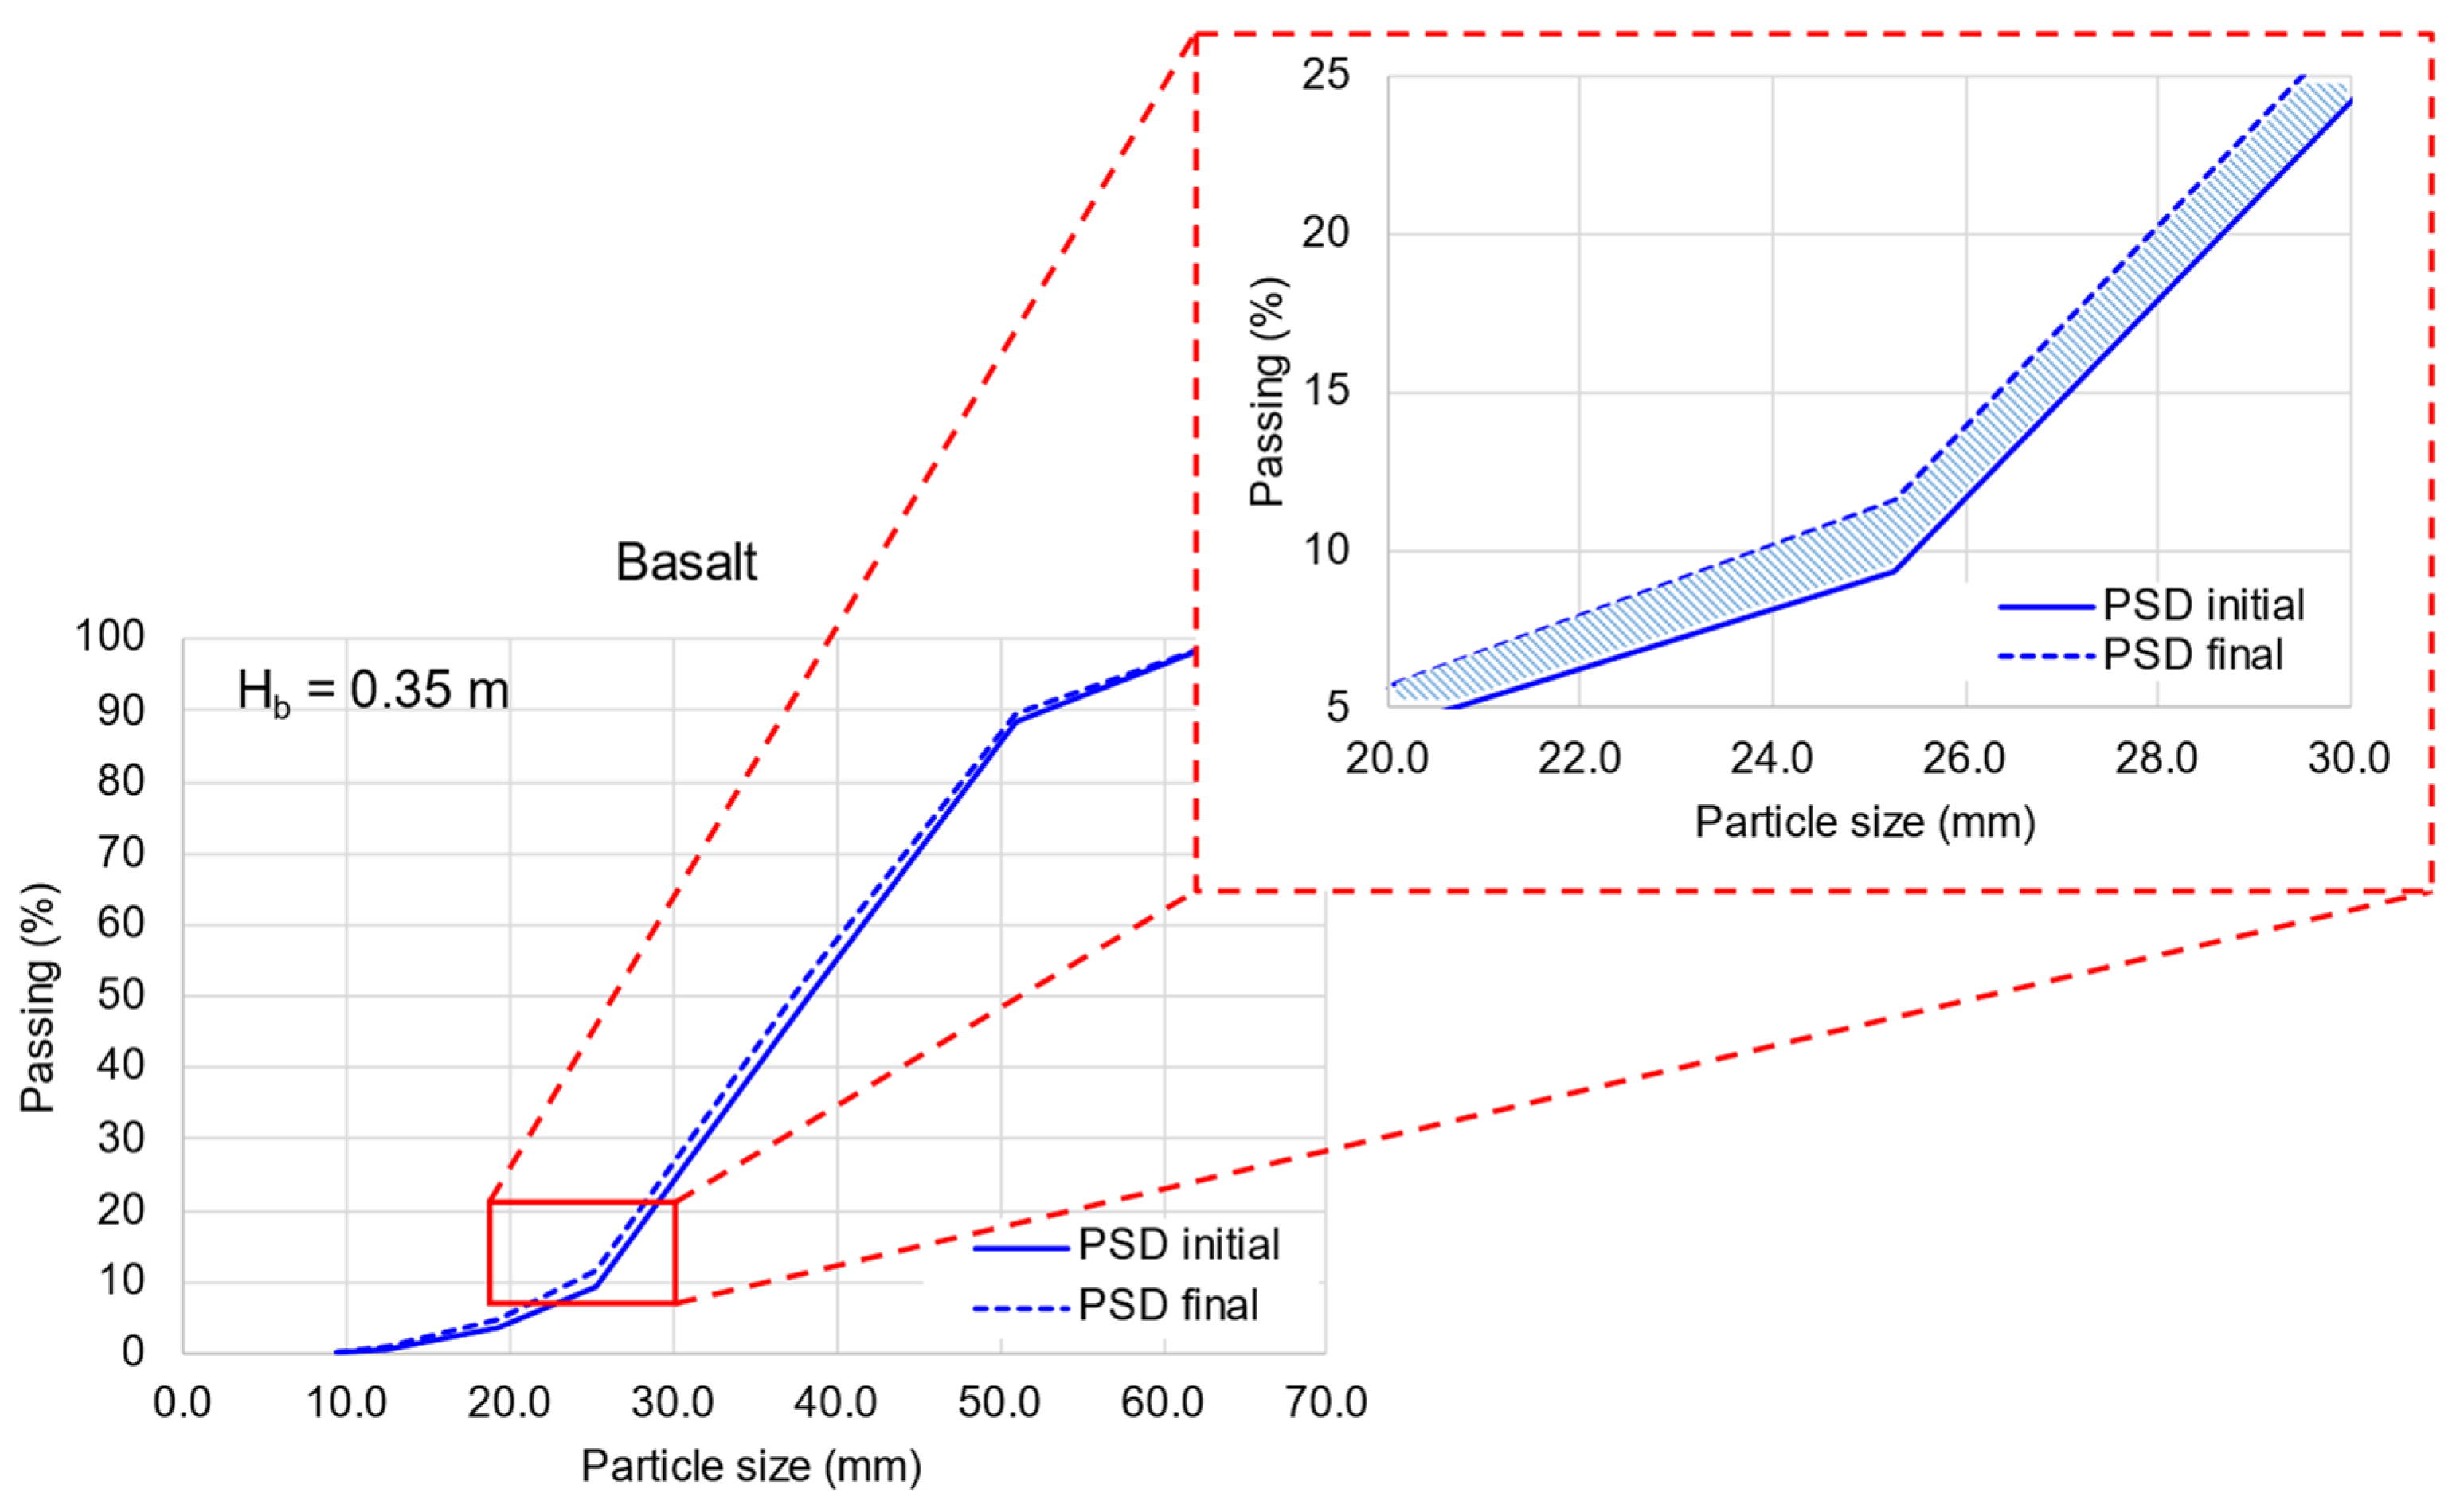
Figure 21 shows the evolution of the particle size distribution (PSD) of basalt under cyclic loading for a ballast thickness of 35 cm (Case II). An increase in the proportion of smaller fragments is observed, particularly within the 20–40 mm size range, while the grading curves preserve their overall shape. This shift in the distribution toward smaller particle sizes is a direct consequence of the progressive fragmentation of larger particles, which yield finer size fractions.
4.4. Factor of Safety Sub-Ballast
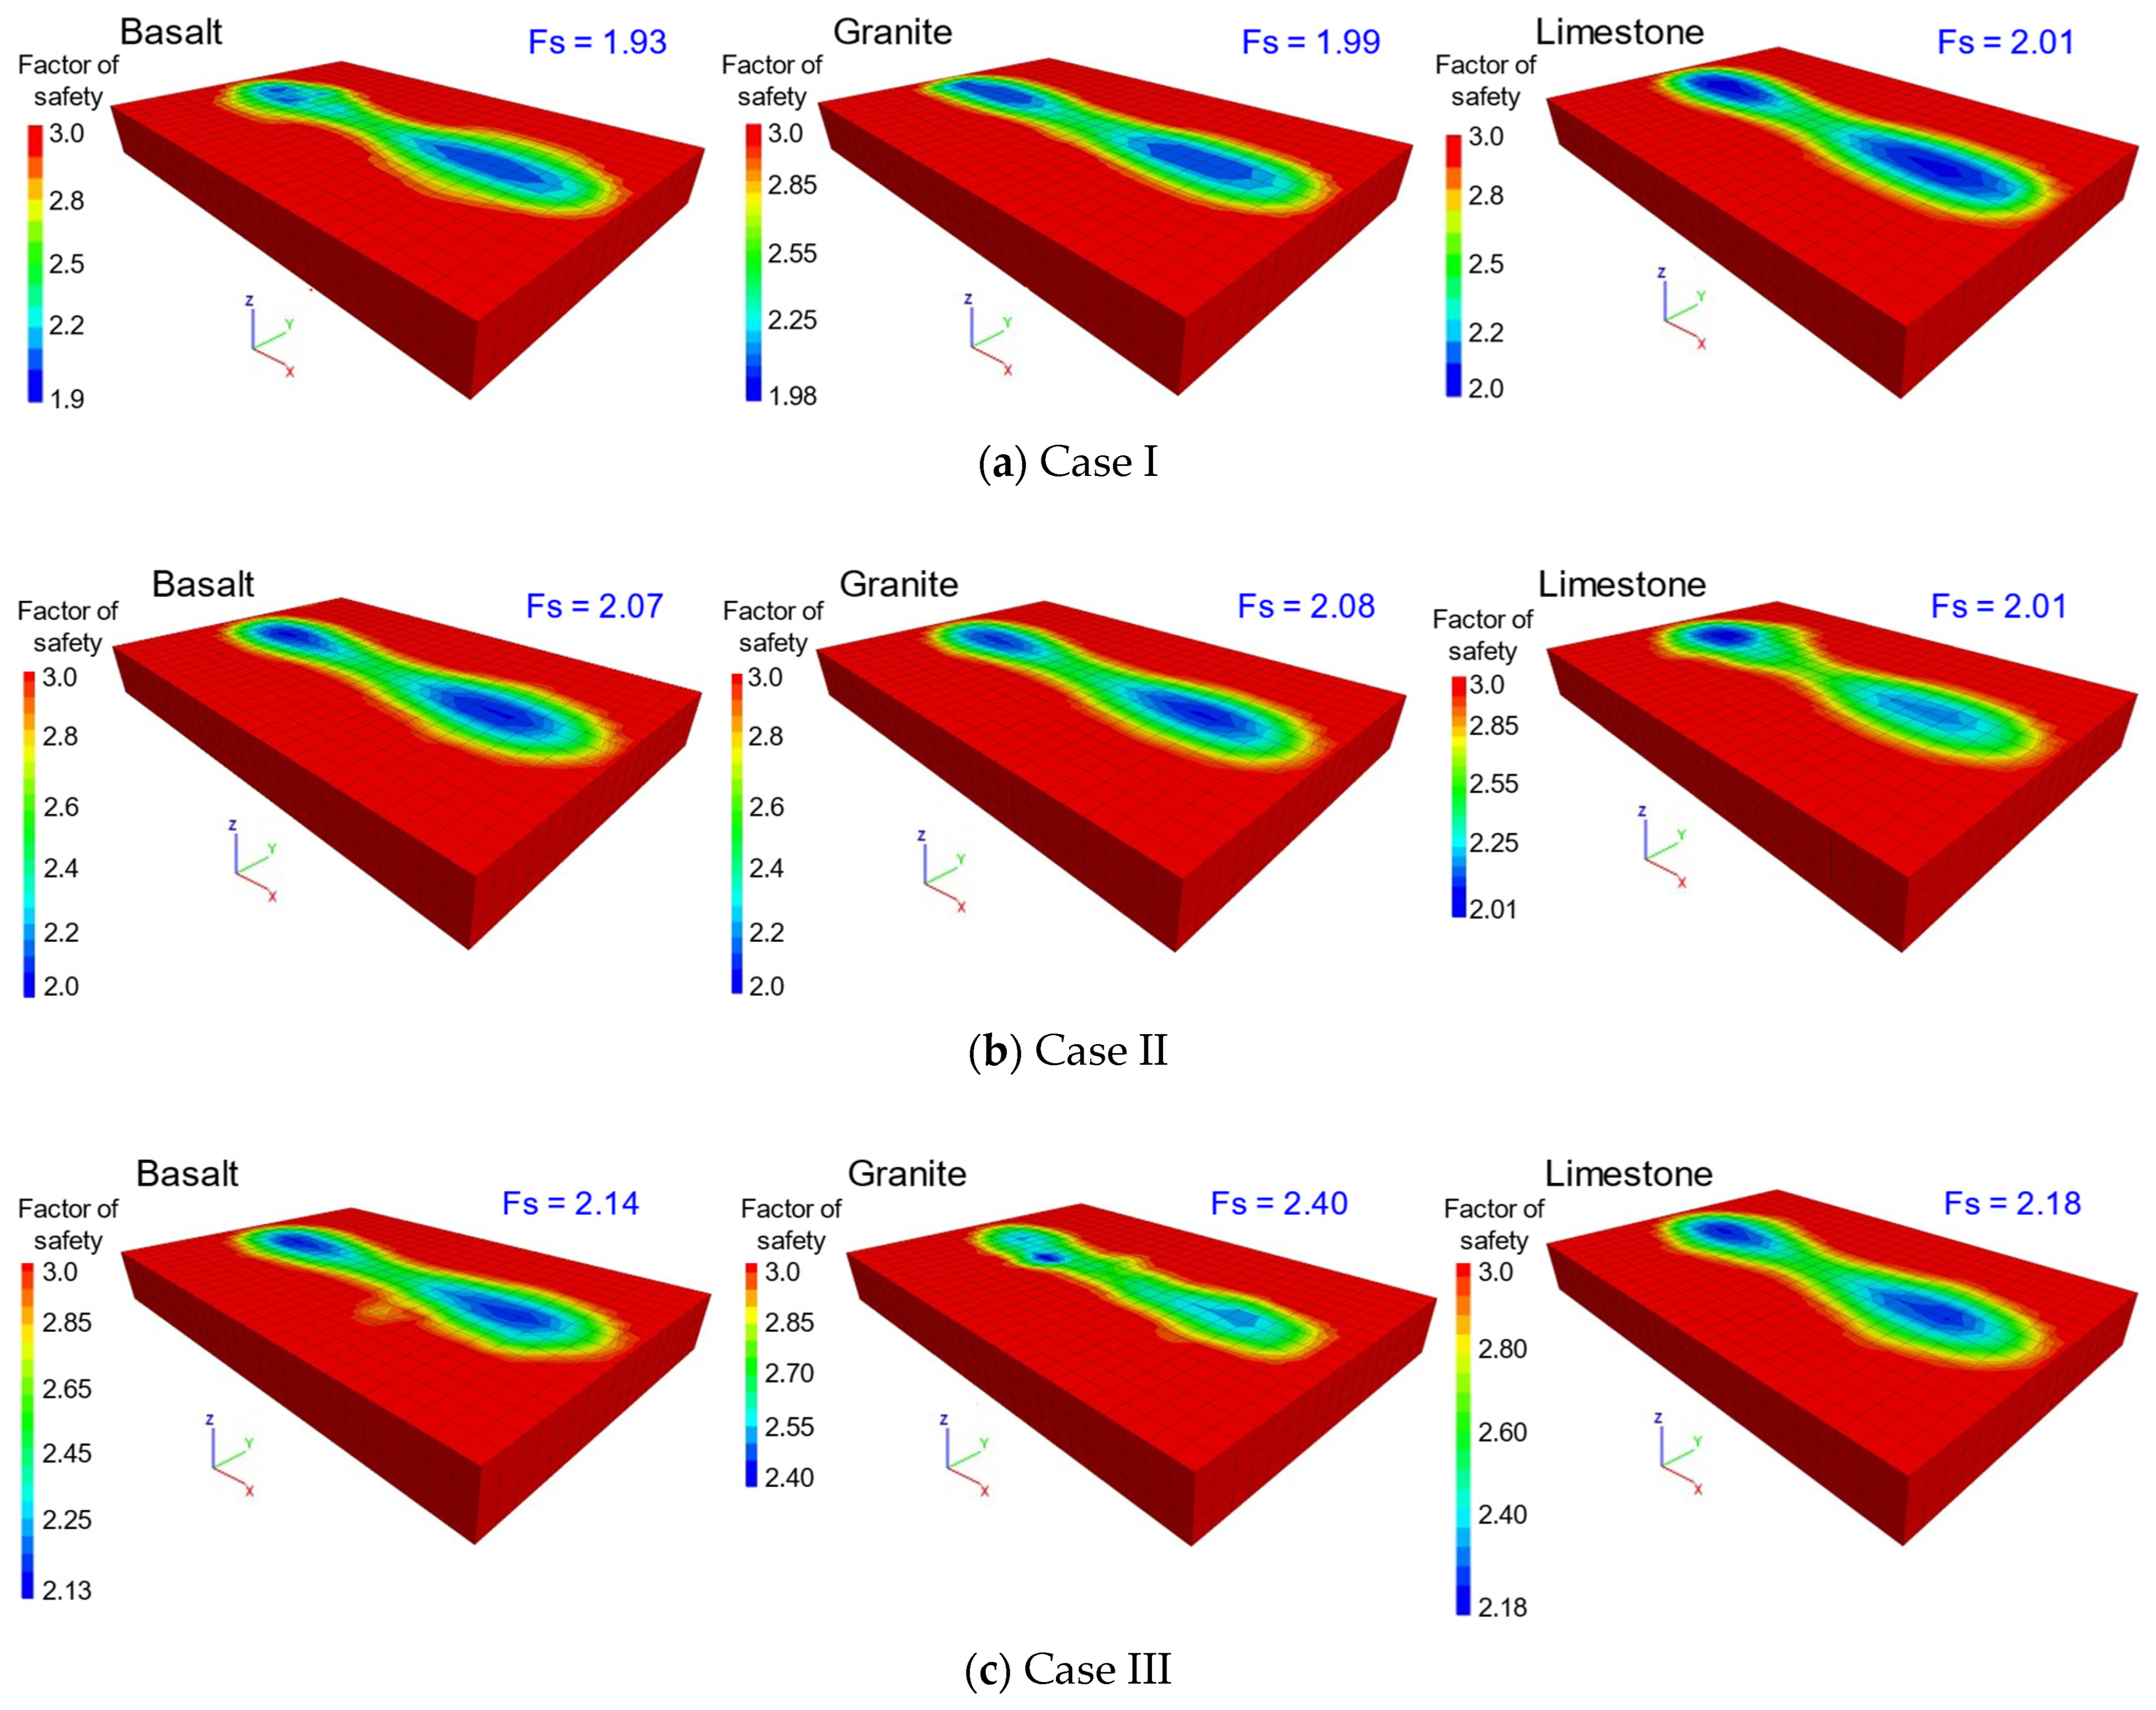
The factor of safety (FS) at the sub-ballast layer increases with increasing ballast thickness, as depicted in
Figure 22. The factor of safety was computed with the Expression (8). This trend is directly related to the progressive reduction in stress and displacements. For a thickness of 0.25 m, the FS values are less than 2.0 (a reference established by AREMA [
16]), while for 0.35 m, a slightly higher value is obtained. The 0.40 m thickness provides the highest factor of safety for the three materials, with an FS of 2.40 for granite.
where
= strength stress;
= octahedral shear stress,
,
,
= principal stress;
= cohesion;
= average effective stress;
= friction angle.
These results highlight that the factor of safety reflects the system’s stability but does not fully capture the effects of micromechanical degradation. In particular, for limestone ballast, the increase in FS with thickness does not correspond to improved deformation performance, indicating a decoupling between stability and deformation. This suggests that for limestone, the relationship between stress reduction and stability improvement is not linear, likely due to the competing effects of particle degradation and rearrangement. This finding underscores that stability-based indicators alone may be insufficient for evaluating the performance of granular materials under cyclic loading.
5. Ballast Performance Assessment
This section introduces a novel approach that relates the conventional factor of safety obtained for rail track support to the expected permanent strain. Beginning with the continuous models, the ballast safety factor was calculated using Expression (8) for the corresponding material. However, because continuous models cannot adequately represent the accumulation of permanent deformations in granular materials, these safety factors were compared with the permanent strains obtained from hybrid DEM–FDMs for the same digital twin.
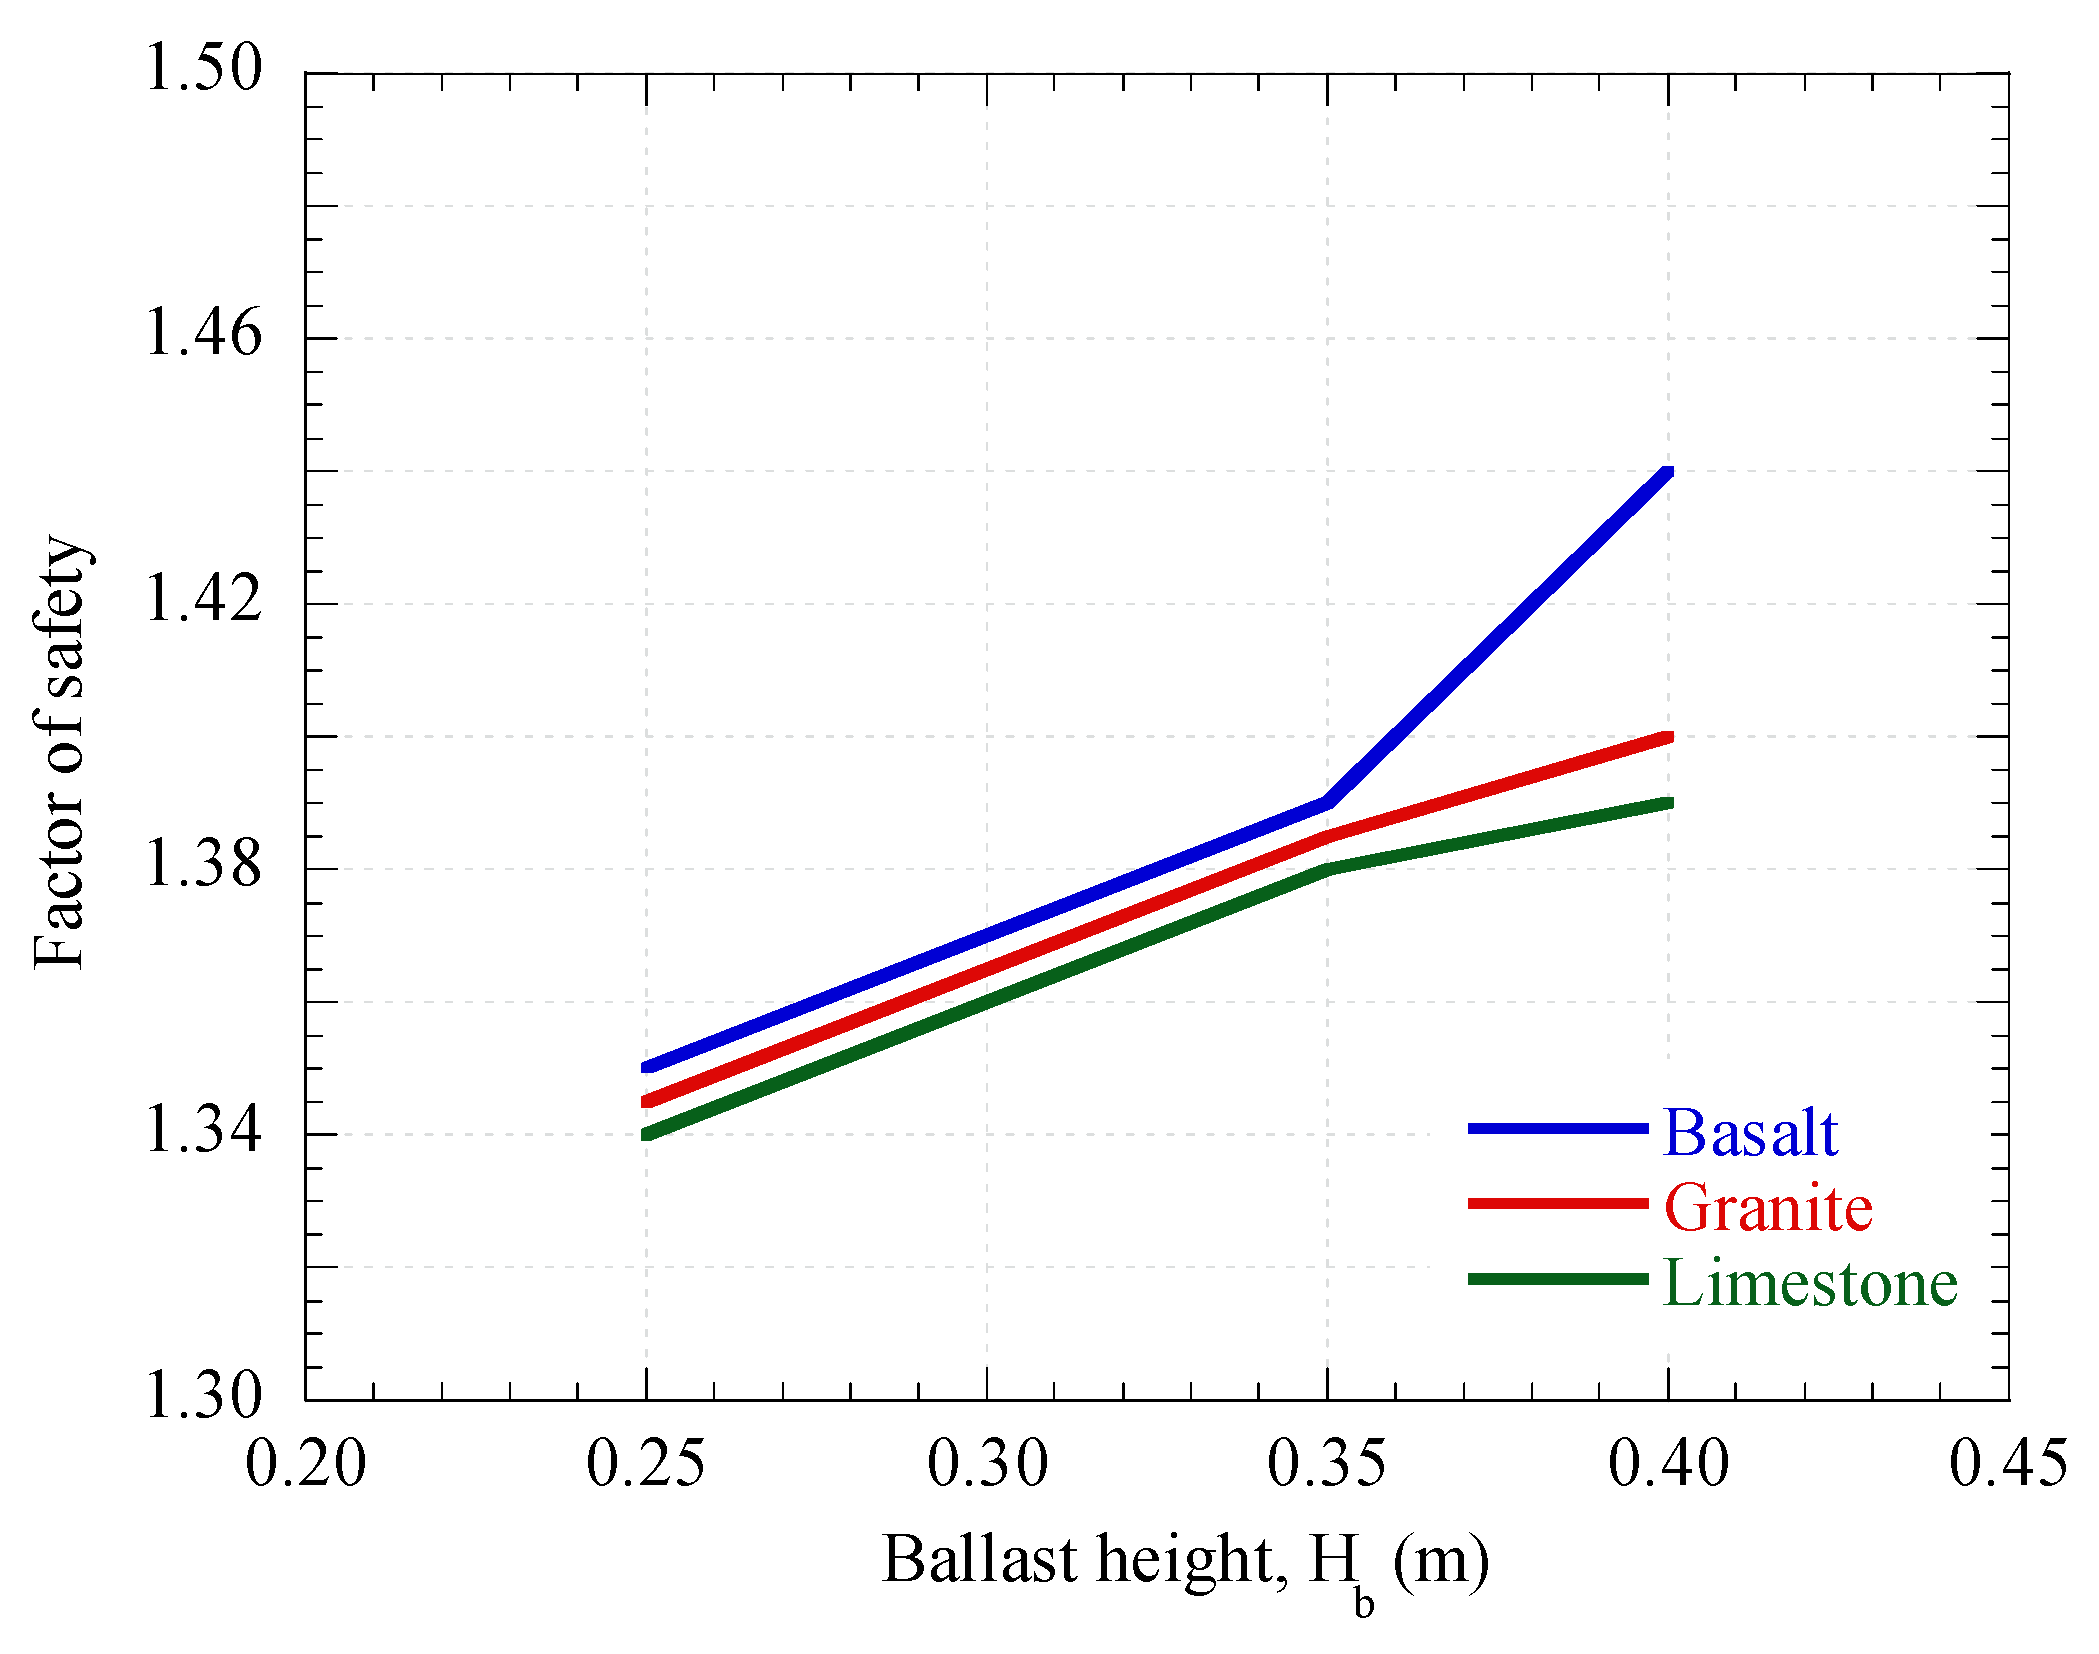
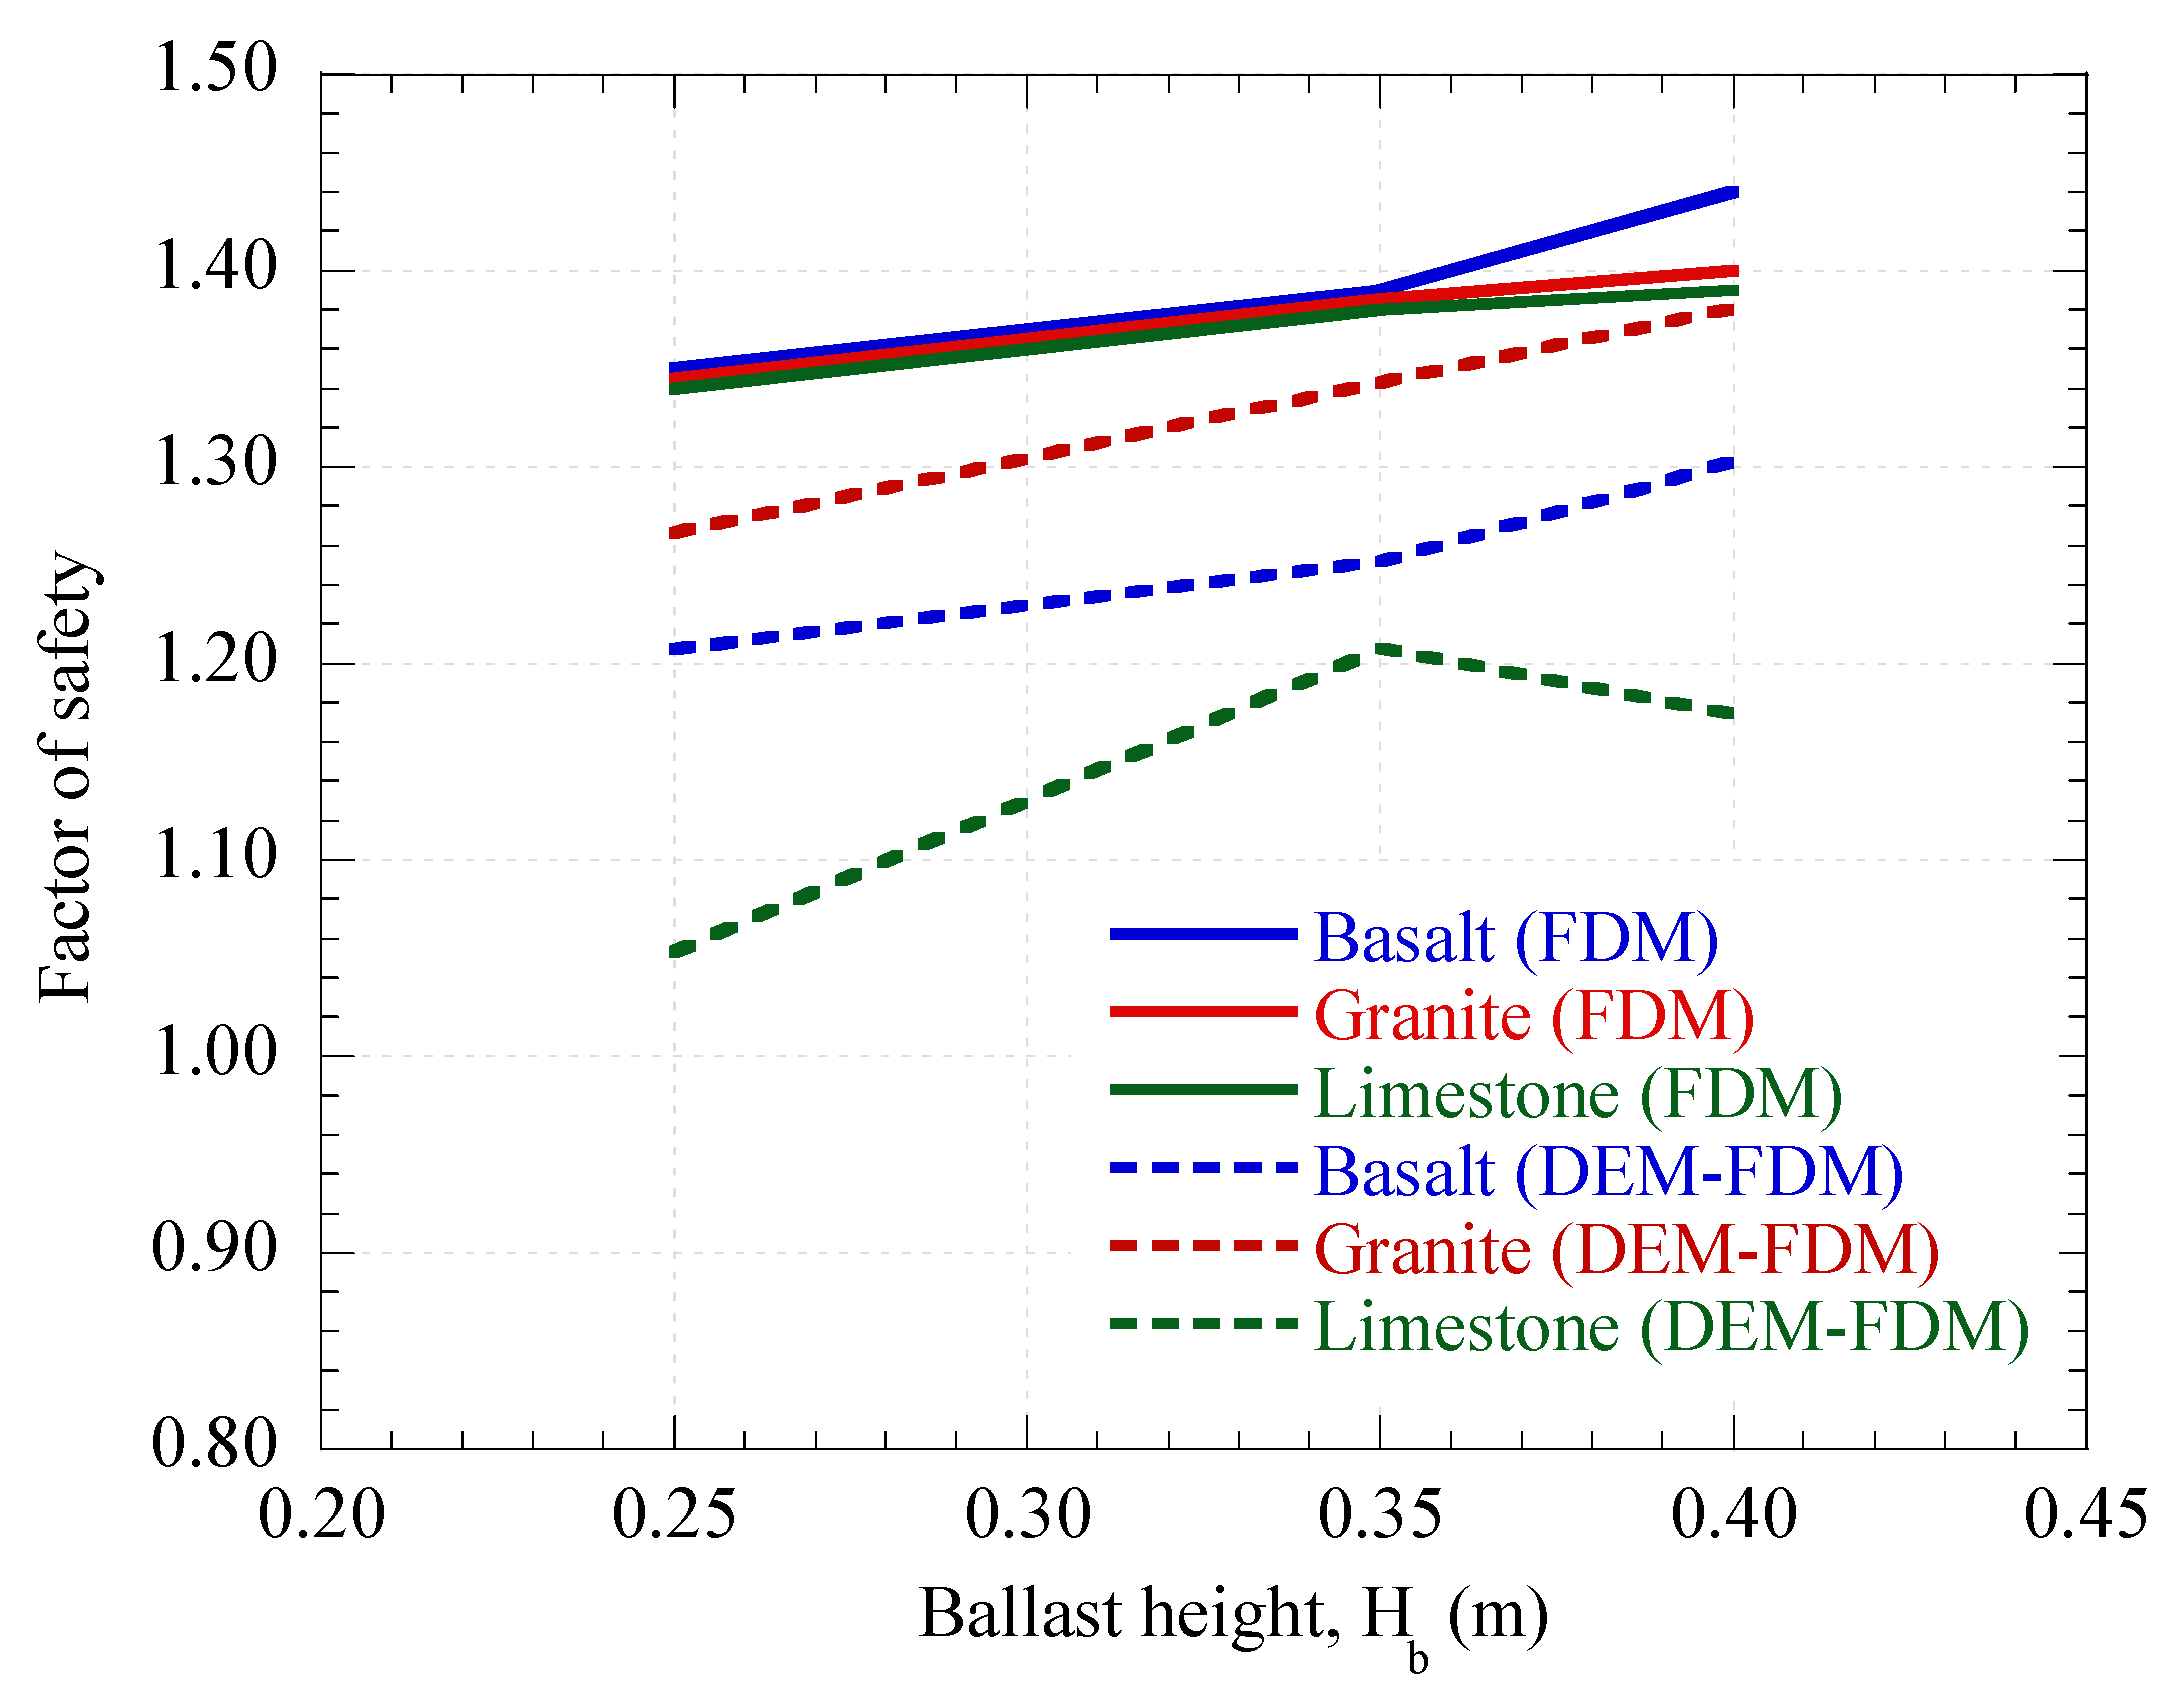
First, the influence of ballast layer thickness on each material type was analyzed and compared with the safety factor calculated using conventional continuous models. The results, shown in
Figure 23, demonstrate similar behavior across all materials: the safety factor increases with ballast thickness. However, the FS values for limestone ballast are consistently lower, primarily because of its lower mechanical competence compared with basalt and granite.
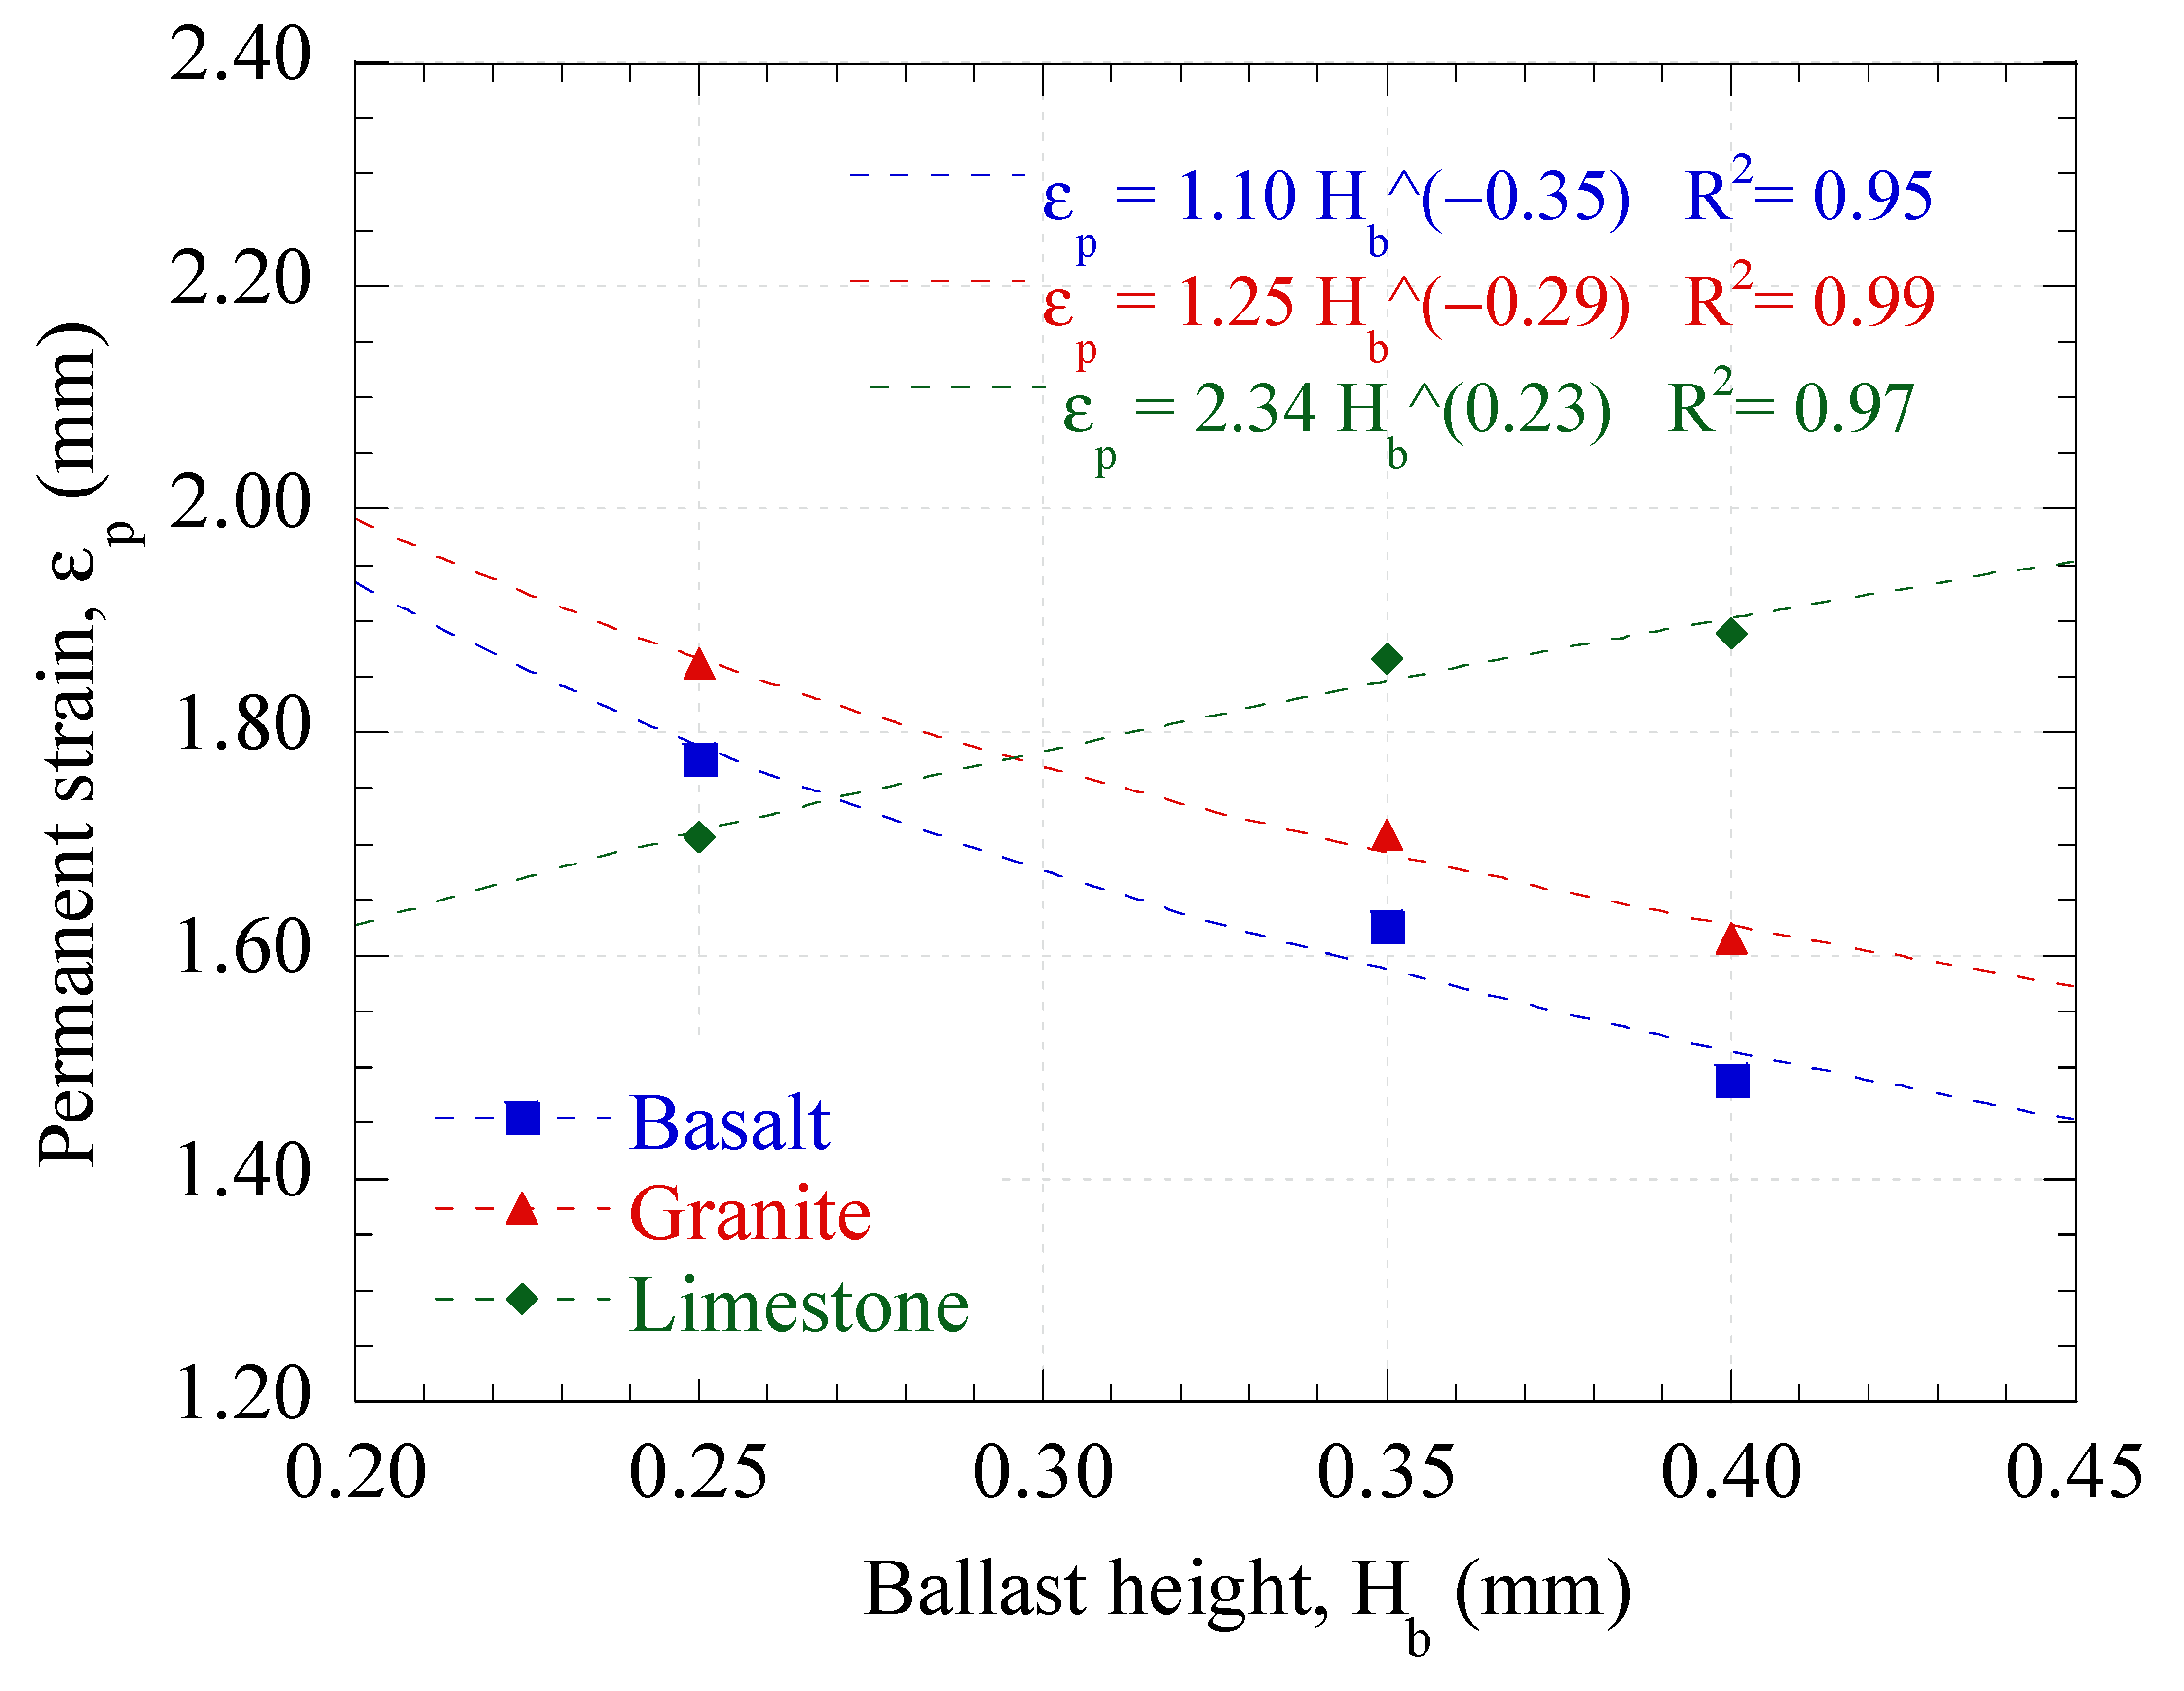
Subsequently, the combined influence of layer thickness and material type on the permanent deformations obtained from the hybrid models was evaluated, as shown in
Figure 24. A similar trend is observed between basalt and granite, with deformation decreasing with increasing thickness. In contrast, the behavior of limestone ballast differs significantly: increasing thickness leads to greater permanent deformation, an effect associated with increased particle breakage and granular degradation, as also reported by other research [
41,
42,
43].
The anomalous behavior observed for limestone, in which increasing ballast thickness results in greater permanent deformation, can be explained by the combined influence of material strength and micromechanical degradation processes. Limestone has lower intrinsic strength than basalt and granite, making it more susceptible to particle breakage under cyclic loading.
As ballast thickness increases, the volume of material subjected to high deviatoric stresses beneath the sleeper also increases, leading to more particle interactions and breakage events. Unlike more resistant materials, where additional thickness promotes stress redistribution and reduces deformation, the increased mass of weaker limestone particles contributes to a more extensive degradation process. The resulting particle breakage generates finer fragments that reduce interlocking, facilitate particle rearrangement, and increase the compressibility of the granular assembly. This process leads to higher rates of permanent deformation accumulation despite the apparent improvement in global stability indicators.
These findings are consistent with experimental observations reported in the literature, which show that limestone ballast exhibits greater susceptibility to degradation and difficulty maintaining shakedown conditions under cyclic loading [
43]. This behavior indicates that ballast performance is not solely determined by stress reduction but also by the material’s susceptibility to degradation.
Finally, a direct comparison was made between accumulated permanent strain and the safety factor to establish a relationship between them, as it is shown in
Figure 25.
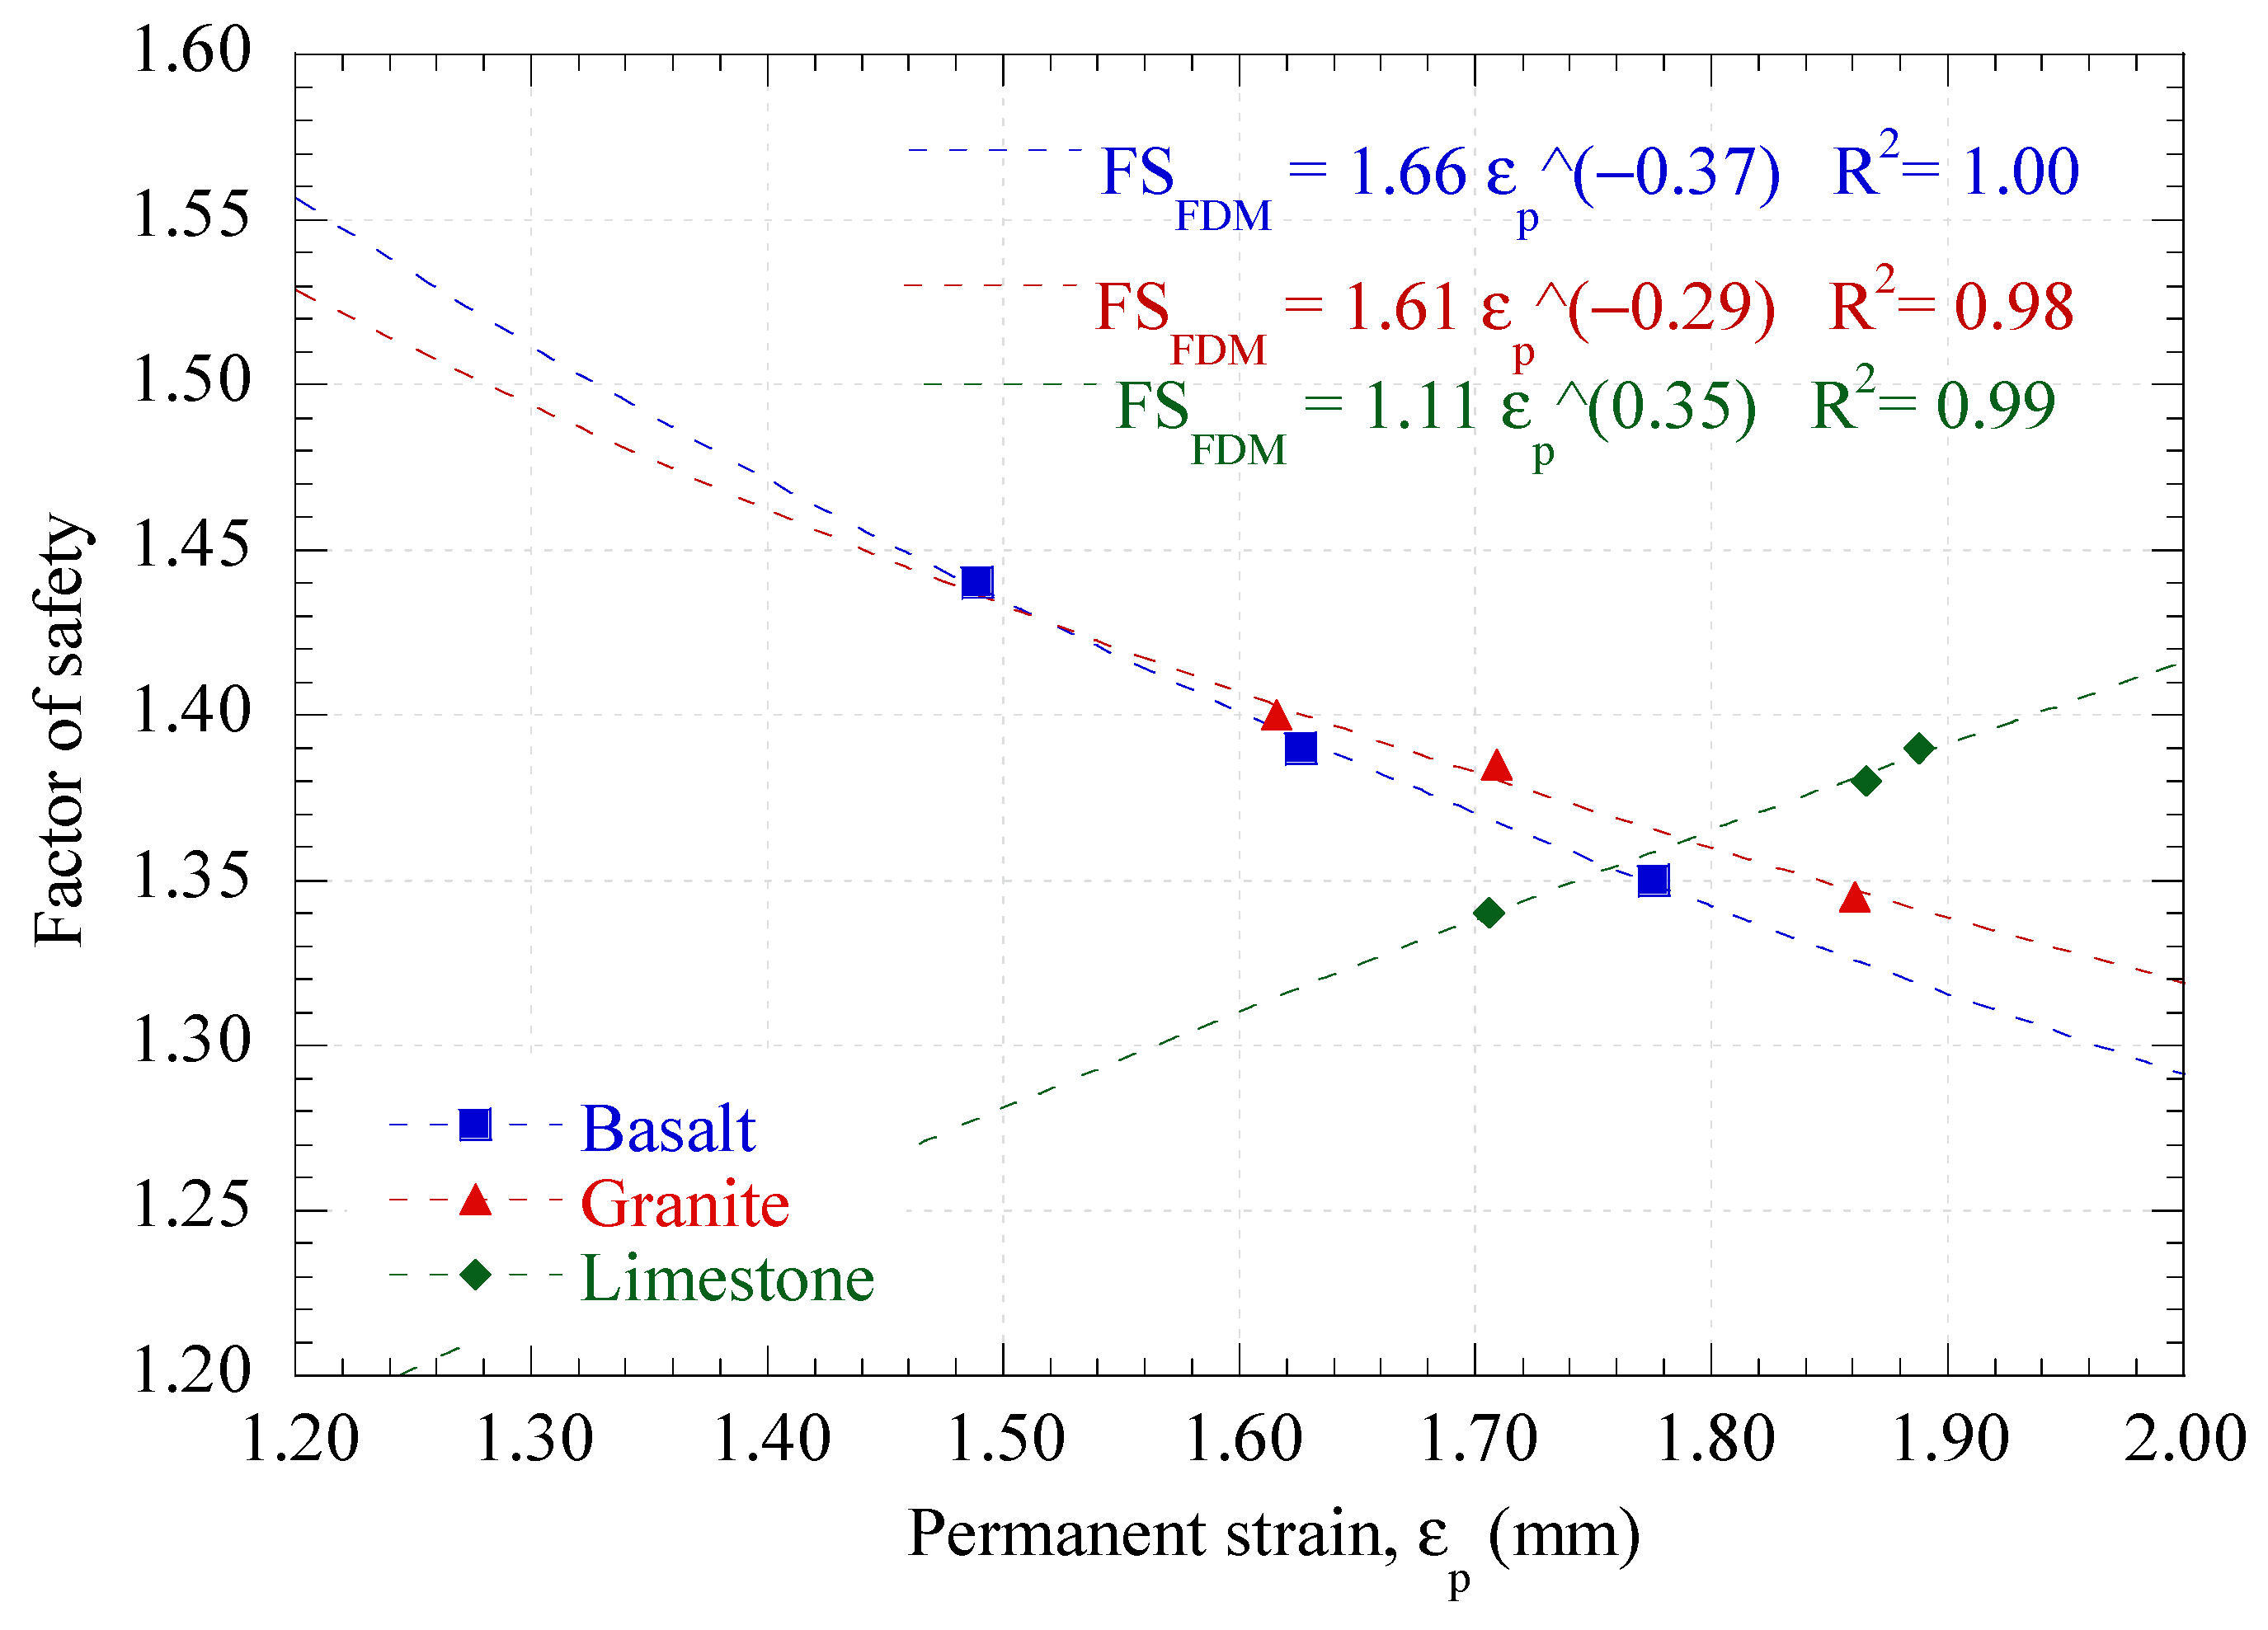
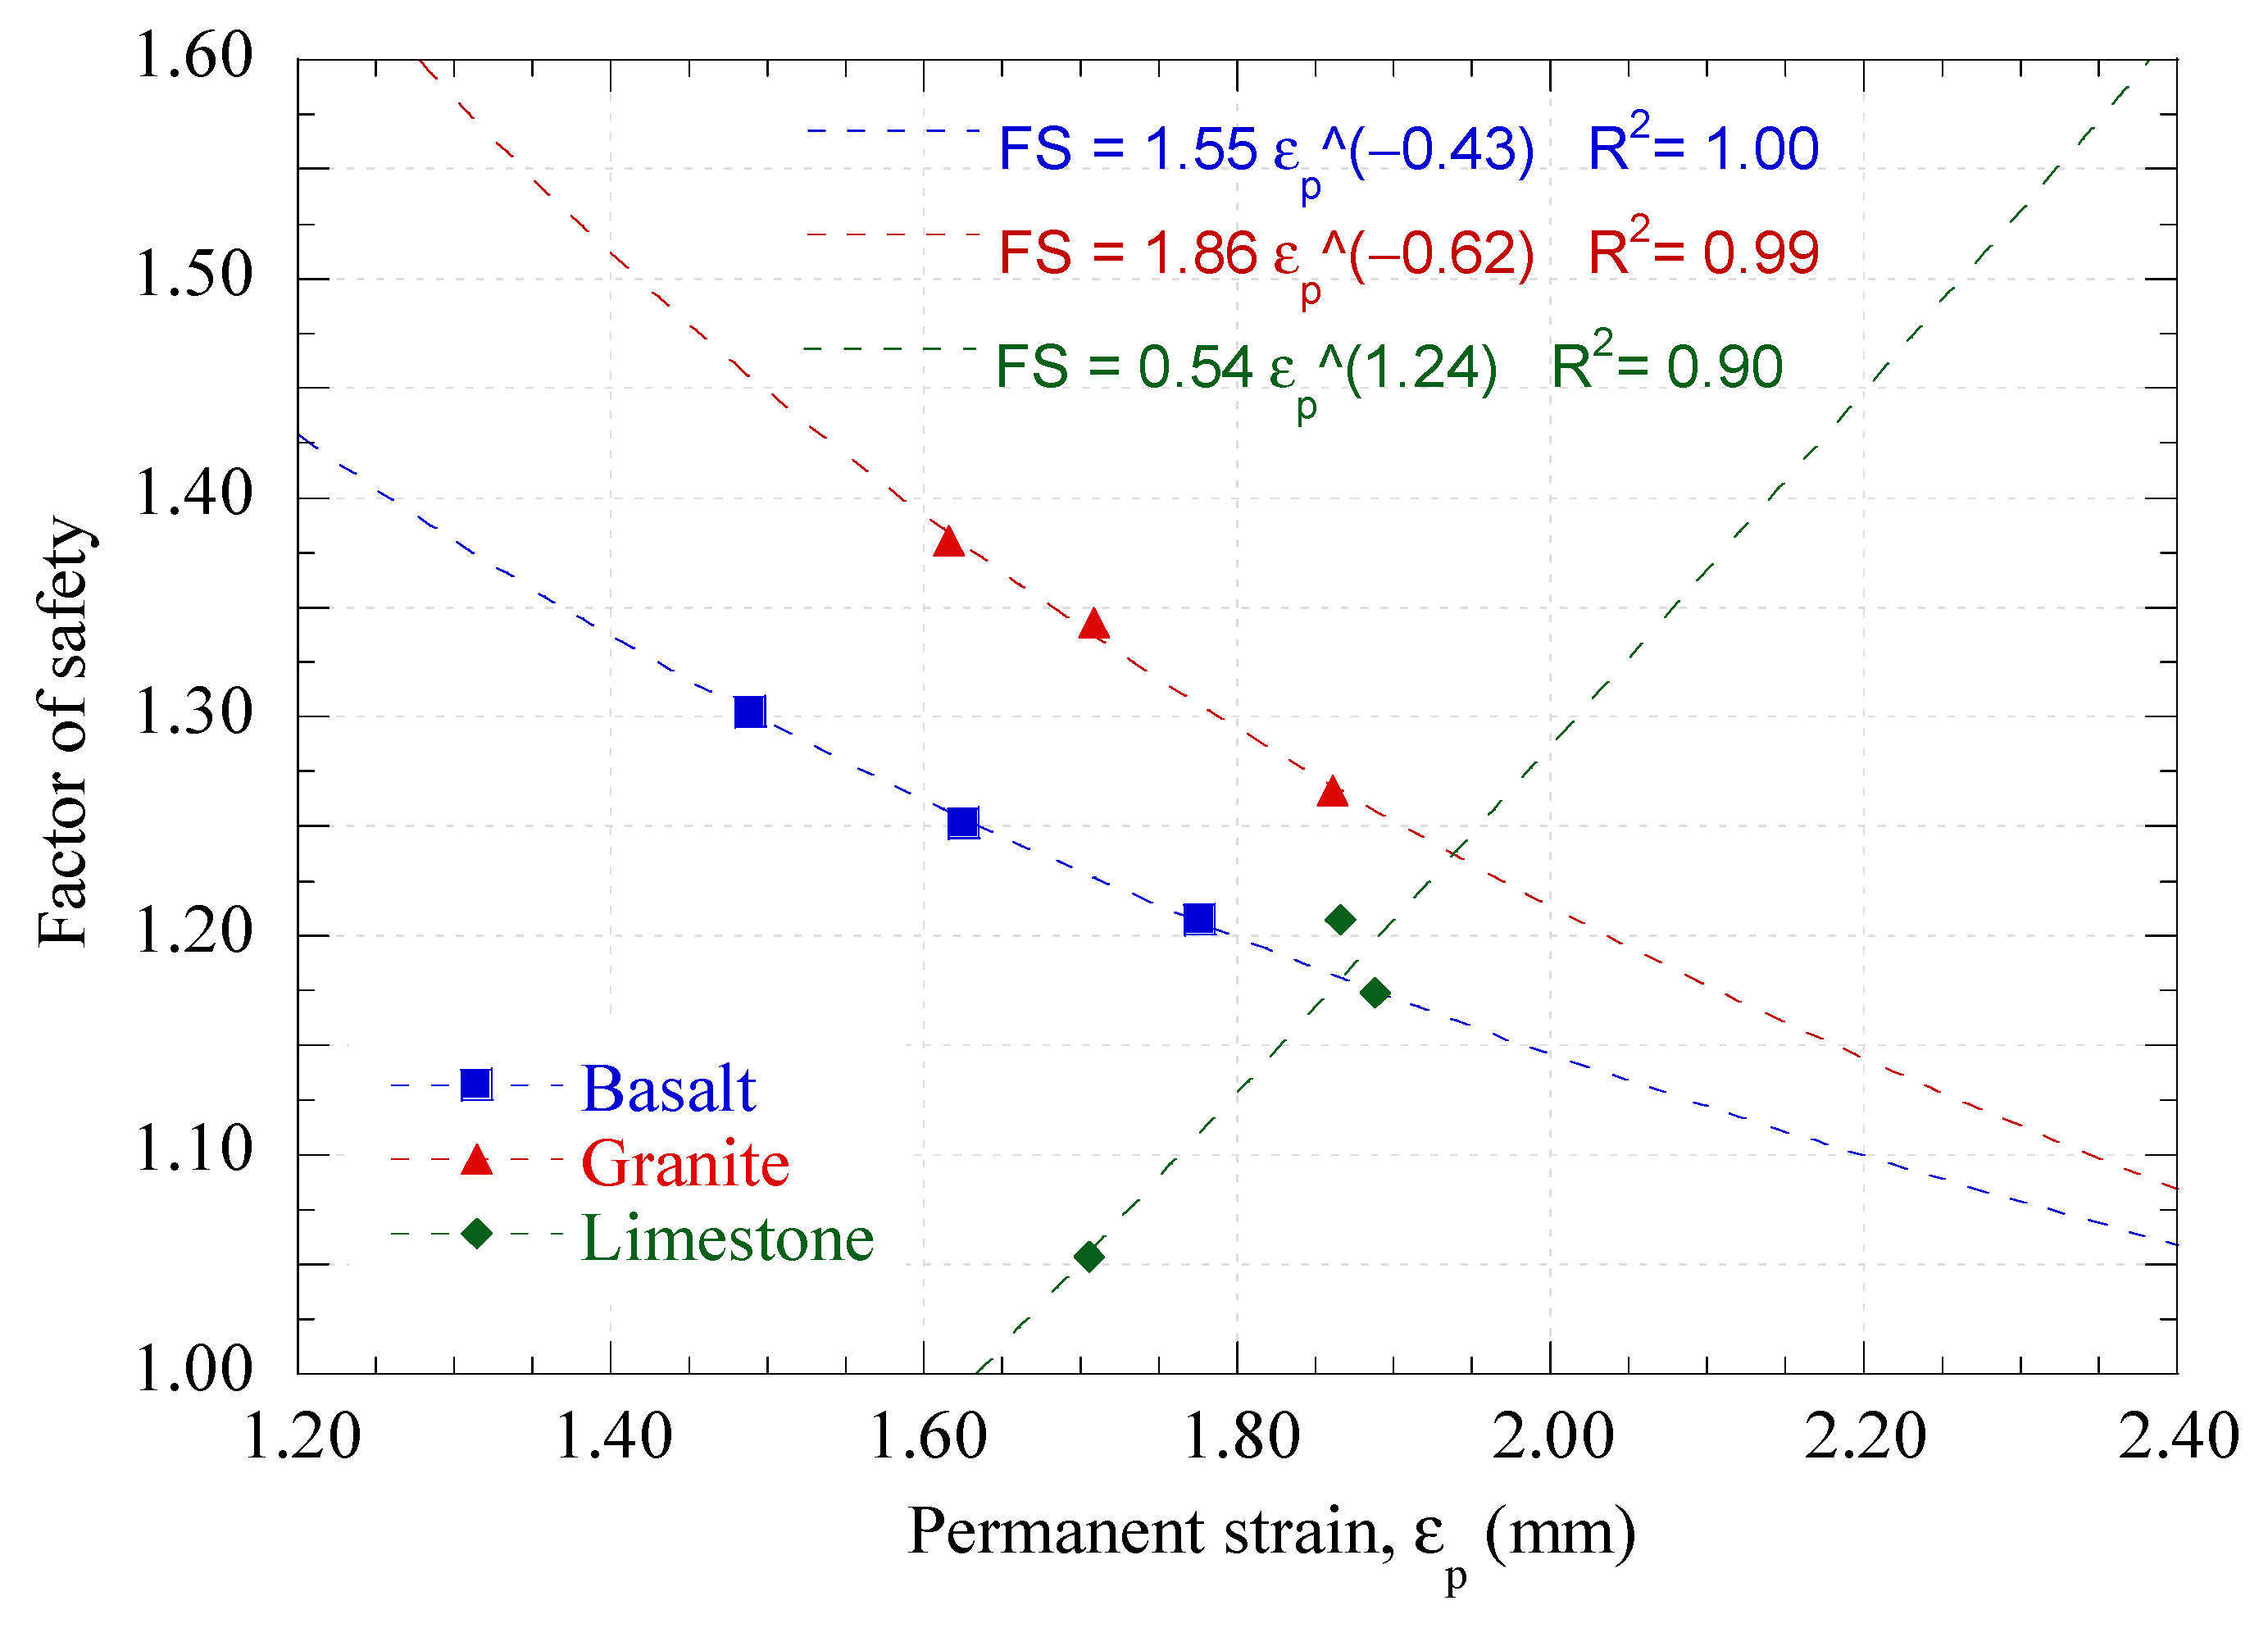
Results gathered from the simulations allowed the development of empirical correlations between two key performance variables: the safety factor obtained from the continuous model (
) and permanent strain (
). The fitted curves, expressed as
, where
and
are parameters that depend on the type of material, lead to the following equations:
The equations for basalt and granite indicate that an increase in permanent deformation is associated with a reduction in safety factor, FS. This behavior is typical of granular materials that, after deforming plastically, exhibit a progressive loss of shear strength until reaching a residual strength.
The limestone equation shows an opposite trend: the FS increases with deformation. This confirms a change in the dominant mechanism, associated with particle degradation and breakage, as well as with the reorganization and compaction of angular limestone particles under cyclic loading. Thus, in this case, failure occurs due to excessive deformation, independent of the factor of safety.
The modeling approaches can affect the computed performance indicators: the factor of safety (FS) obtained from finite-difference models (FDM) shows an apparent increase in strength due to macroscopic densification but does not capture the internal mechanisms of granular degradation. The hybrid DEM–FDM simulations, which explicitly represent the granular nature of ballast, show that particle fragmentation and reordering lead to irreversible, cumulative deformation. Thus, the apparent contradiction between a rising FS and larger deformations is not an inconsistency but rather the result of different physical mechanisms in each model, highlighting the need for performance-based assessment approaches that explicitly incorporate granular damage and deformation accumulation.
The safety factors (FS) of the hybrid models were determined using the same formulation described in Equations (8)–(11). Since discrete media do not explicitly define macroscopic cohesion (c) or friction angle (ϕ), cohesion was assumed to be zero, and the macroscopic friction angle was obtained from numerical triaxial tests performed on the calibrated DEM specimen. The stress tensor was computed for each measurement sphere, enabling evaluation of the local stress state.
Figure 26 presents the FS obtained with the hybrid model as a function of permanent strain, while
Figure 27 shows all the FS for the evaluated thicknesses.
A systematic difference is observed between the modeling approaches: the hybrid DEM–FDM model consistently predicts lower FS values than the continuous FDM model, indicating that the latter tends to overestimate stability. The magnitude of the discrepancy depends on the material; limestone shows the greatest differences (up to approximately 22%), basalt exhibits intermediate values (8–10%), and granite displays nearly convergent results at higher ballast heights.
These differences are associated with micromechanical behavior. The hybrid model captures local stress redistributions and progressive failure mechanisms, while the continuous model smooths the stress field, which can hide local instabilities. Consequently, the hybrid approach provides more conservative estimates, particularly near critical conditions (FS ≈ 1.0–1.2), highlighting the importance of incorporating micromechanical effects in marginal stability analysis.
Given that continuum FDM/FEM models remain the standard tool in engineering practice due to their computational efficiency, the results of this study support the introduction of a material-dependent correction factor to account for microstructural degradation effects captured by DEM simulations.
The corrected safety factor may be estimated as
where
represents a micromechanical reduction factor calibrated against DEM–FDM simulations, associated with plastic deformation mainly due to particle rupture, particle rotation, and force transmission (i.e., all the micromechanical interactions).
Table 8 presents the safety and influence factors obtained from degradation. For the analyzed range (ballast height 0.25–0.40 m and permanent strains 1.5–1.9 mm), the following values are recommended:
for basalt, granite, and limestone.
These values provide a conservative yet practical adjustment for force chain and particle breakage mechanisms not represented in continuum formulations. The correction preserves the efficiency of conventional numerical approaches while improving the reliability of stability predictions for crushable granular materials.
The proposed correction factors are valid within the investigated geometric and loading conditions and should be recalibrated if material grading, loading regime, or confinement conditions differ significantly.
Having established the micromechanical correction and the strain–safety relationship, a performance-based design criterion can be formulated.
Deformation-Based Performance Criterion
While the micromechanical correction factor improves the predictive capability of conventional safety factors, stability alone does not guarantee acceptable long-term performance in granular materials subjected to cyclic loading. Therefore, a performance-based threshold was introduced by defining an optimal safety factor, , associated with the onset of plastic shakedown.
The empirical relationship obtained from the numerical simulations is expressed as
and incorporating the micromechanical correction factor:
The optimal safety factor was defined as the onset of plastic shakedown, corresponding to the condition in which the incremental rate of permanent strain accumulation with respect to the number of load cycles becomes negligible, i.e., .
Rather than being assumed a priori,
was obtained directly from the permanent deformation evolution curves derived from the hybrid DEM–FDM simulations. Specifically, the onset of plastic shakedown was identified in
Figure 16 as the deformation state at which the permanent strain–cycle curve approaches a horizontal asymptote, indicating stabilization of strain accumulation under cyclic loading.
The safety factor corresponding to this stabilized deformation state was subsequently extracted from the DEM–FDM simulations. Therefore, is numerically derived and physically linked to the micromechanical stabilization of particle rearrangement and degradation processes. The resulting material-specific values were 1.30 for basalt, 1.35 for granite, and 1.20 for limestone.
The performance-based design criterion was therefore established as
Substituting Equation (17) into Equation (18) and replacing
using Equation (16) allows the requirement to be expressed directly in terms of permanent strain:
Therefore, the traditional stability-based verification is reformulated into a deformation-controlled performance requirement directly linked to long-term serviceability. The design requirement is therefore reformulated directly in terms of allowable permanent strain.
The allowable permanent strain is thus given by
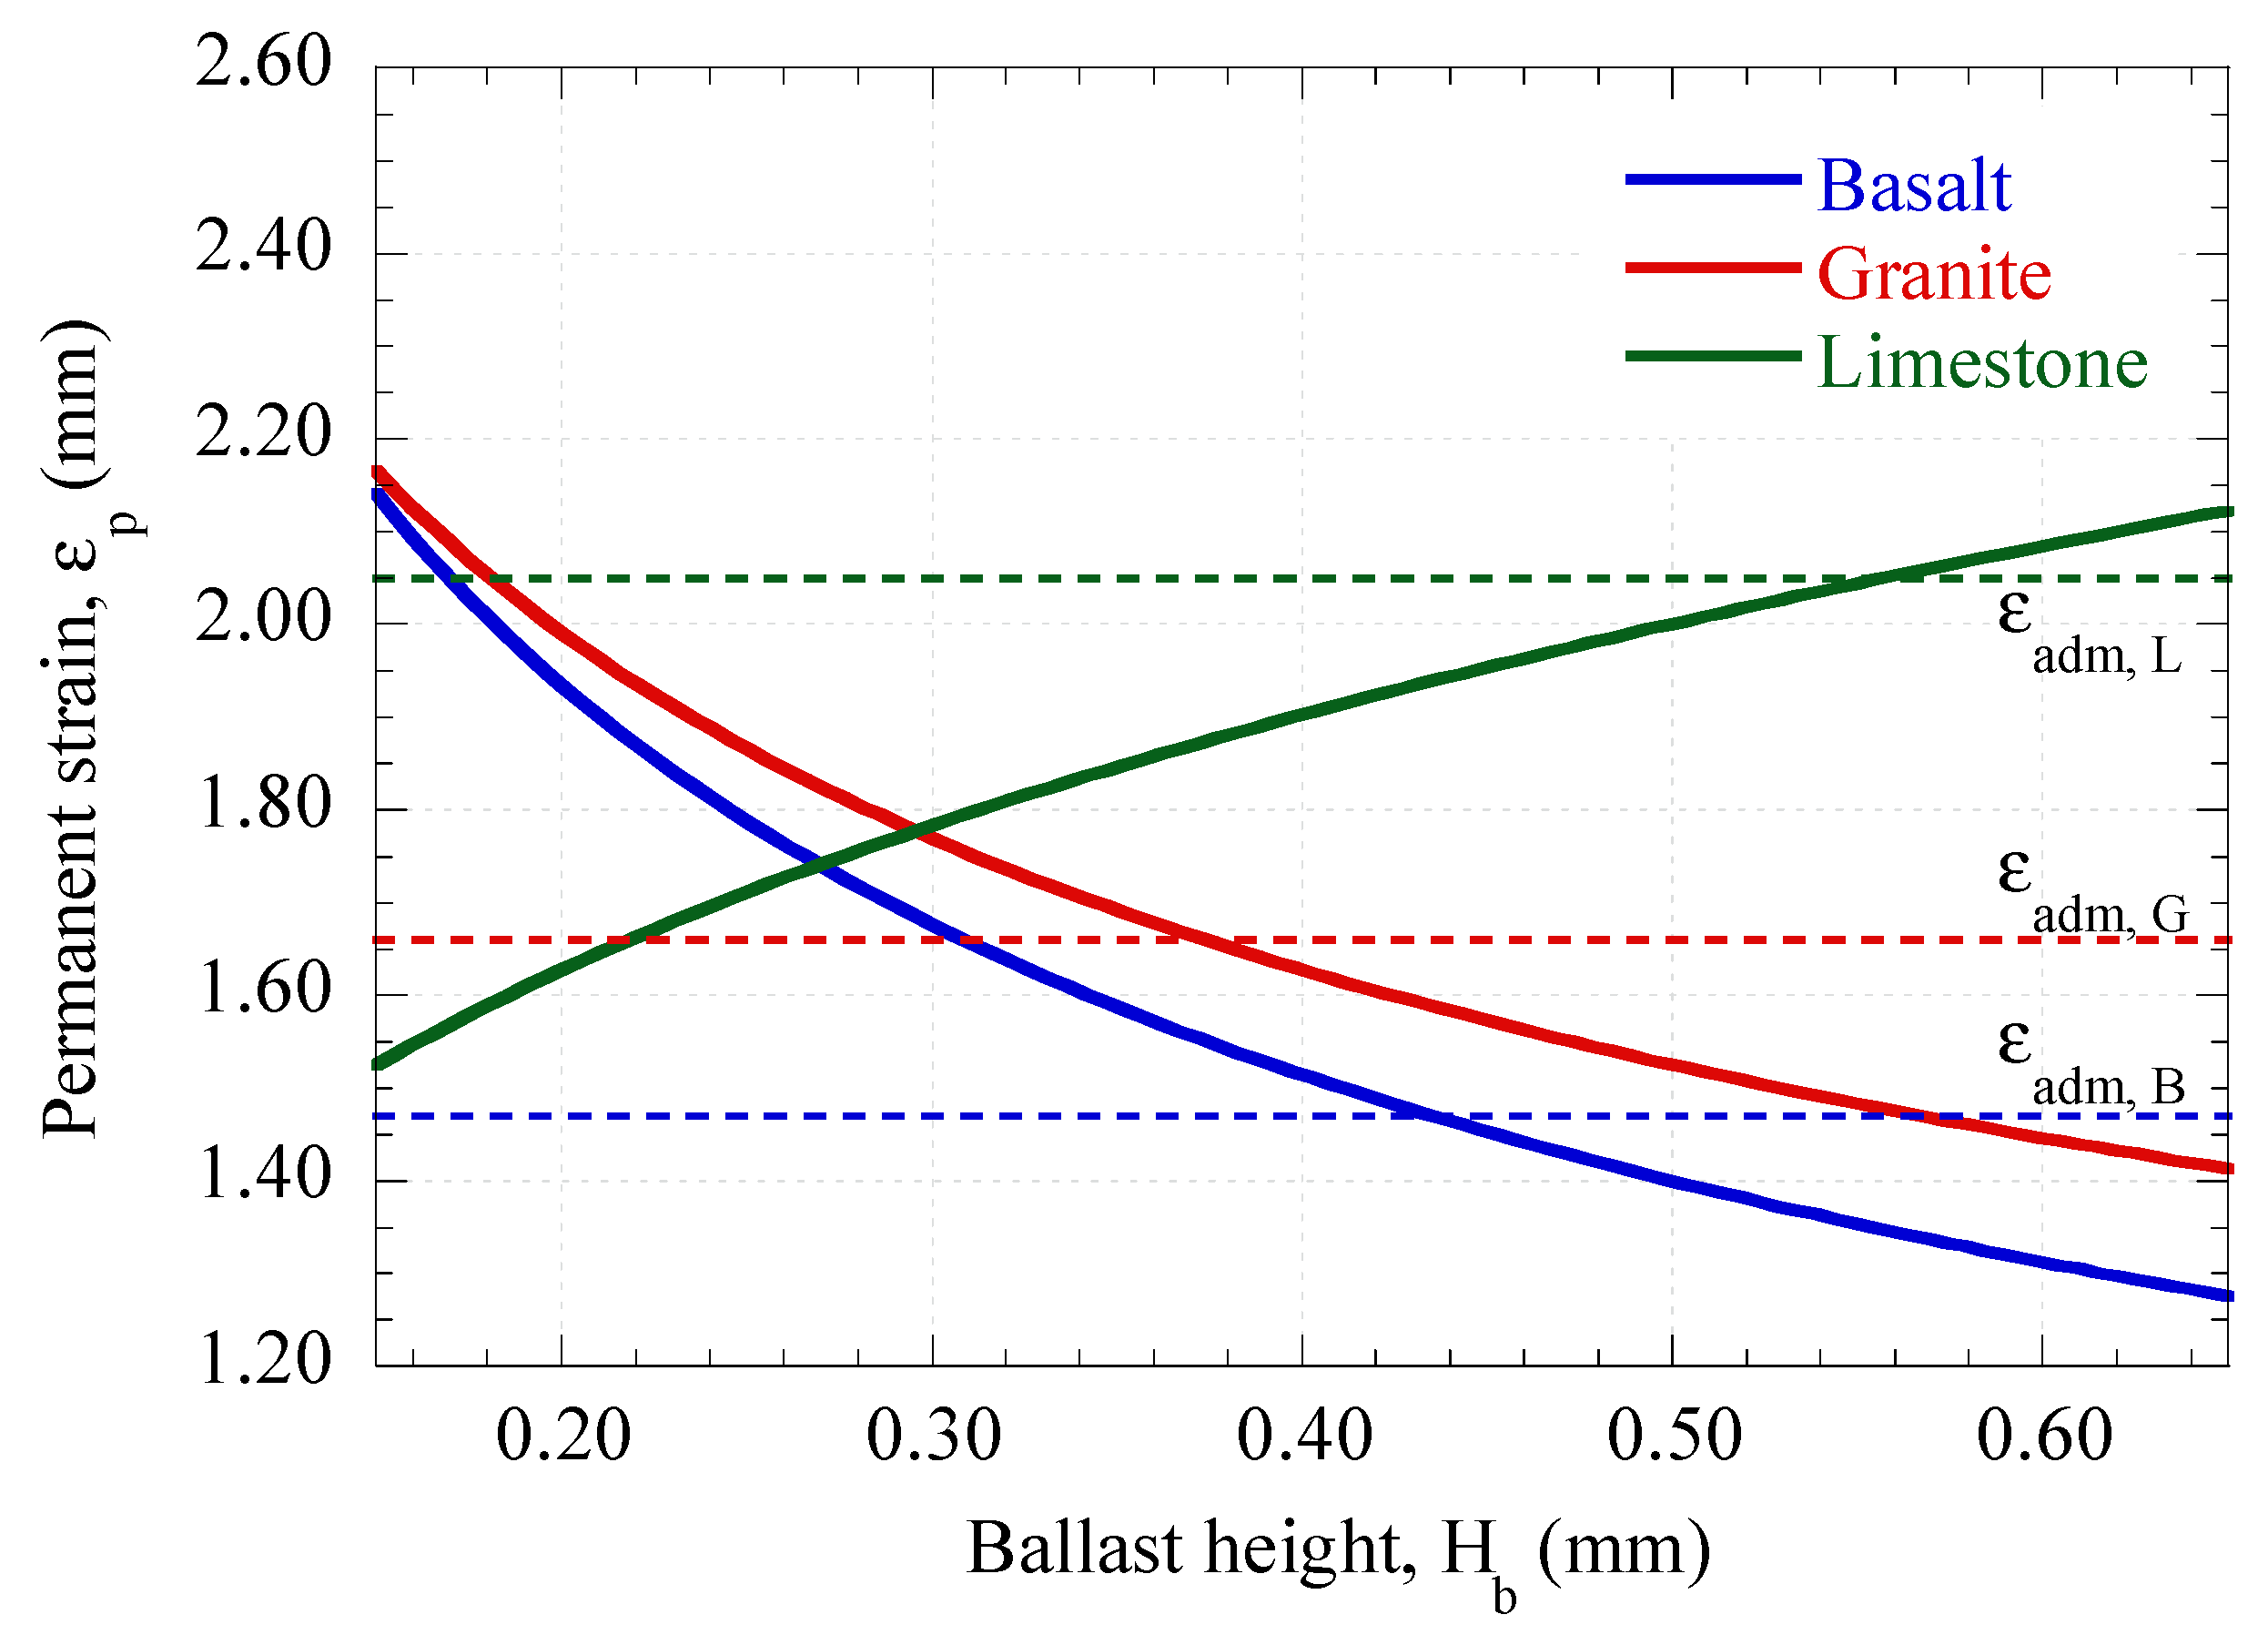
Substituting the calibrated material parameters and the corresponding values into Equation (21) yields admissible permanent strains of 1.47 mm for basalt, 1.66 mm for granite, and 2.05 mm for limestone. These values represent the maximum allowable permanent deformation compatible with shakedown-based performance under the investigated loading conditions.
Finally, the relationship between permanent strain and ballast thickness was expressed as
Combining Equations (21) and (22), the minimum required ballast thickness to satisfy the shakedown-based criterion is
Using the proposed methodology, deformation-controlled ballast design charts were derived.
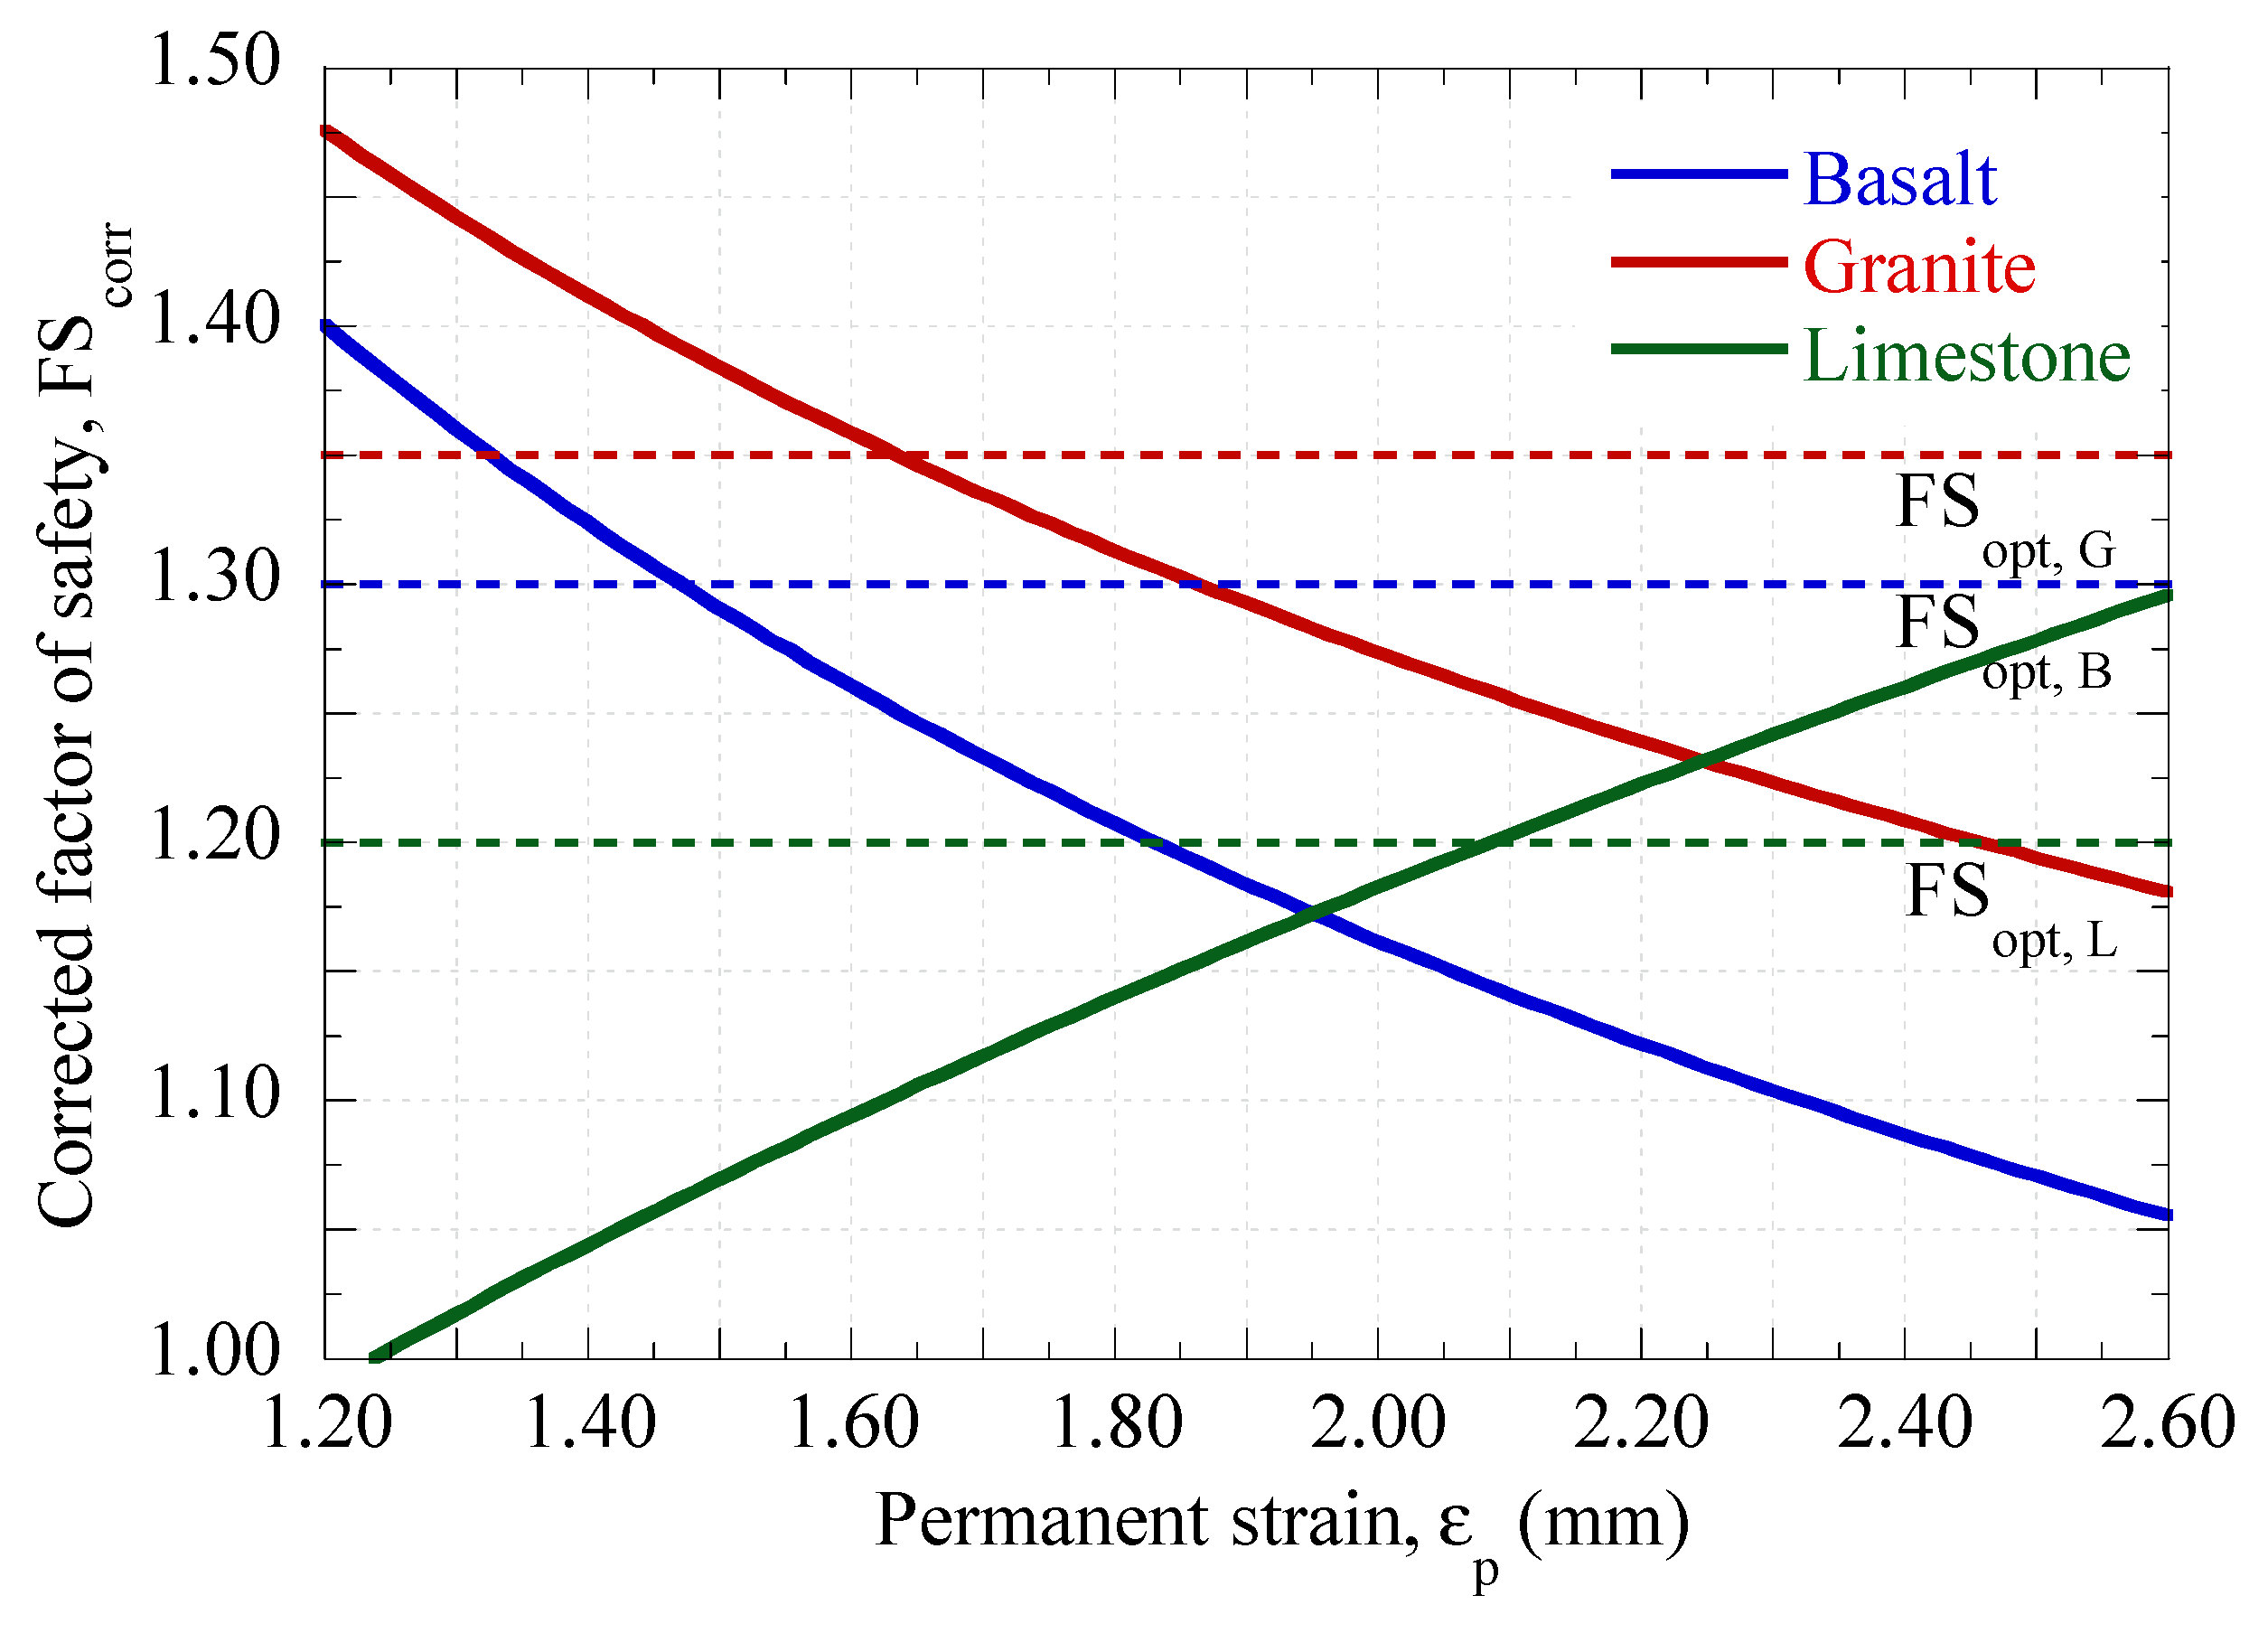
Figure 28 presents the corrected safety factor
as a function of permanent strain, including the target stability thresholds
determined for each evaluated material. These curves define the admissible deformation domain associated with the onset of plastic shakedown and provide a direct graphical verification of the performance-based criterion.
Figure 29 illustrates the relationship between permanent strain and ballast layer thickness. From this relationship, the minimum required ballast thickness can be determined to ensure compliance with the admissible permanent strain limits related to the corresponding
. Consequently, the design requirement is reformulated from a purely stability-based check into a deformation-controlled thickness selection procedure.
Therefore, the curves shown in
Figure 28 can be analytically reproduced using the following material-specific expressions for the corrected safety factor:
Similarly, the relationships shown in
Figure 29 are described by the following permanent strain–thickness correlations:
Table 9 summarizes the application of the proposed deformation-controlled methodology to the evaluated configurations. Only granite with a ballast thickness of 0.40 m satisfies stability, deformation, and minimum thickness criteria simultaneously. Basalt exhibits marginal stability at 0.40 m but does not meet the minimum thickness requirement. Limestone requires a significantly greater thickness (0.56 m) to ensure operation within the shakedown regime.
The final design and verification procedure integrates numerical simulation results, micromechanical correction, and deformation-based performance limits into a unified framework.
The complete procedure can be summarized as follows:
Obtain the safety factor from FDM simulations:
- 2.
Micromechanical correction
Incorporate particle-scale effects through:
where
is the material-dependent correction coefficient.
- 3.
Determination of admissible permanent strain
From the strain–safety correlation:
where
and
are regression parameters material dependent.
- 4.
Minimum required ballast thickness
Using the strain–thickness relationship:
- 5.
Final Verification Criteria
A ballast layer satisfies the shakedown-controlled condition when
These three conditions define a deformation-controlled stability domain, ensuring compliance with the stability safety factor simultaneously.
6. Discussion
This study provides relevant insights into the mechanical behavior of ballasted railway systems under cyclic loading, particularly regarding the interactions among deformation accumulation, particle breakage, and global stability indicators. A clear distinction is observed between the responses predicted by continuum FDMs and those obtained from hybrid DEM–FDM simulations. While the FDM approach suggests an apparent increase in system stability with increasing ballast thickness, the DEM–FDM results indicate that this trend is strongly governed by micromechanical processes such as particle rearrangement and fragmentation. This discrepancy highlights a fundamental limitation of continuum approaches, which smooth out stress fields and cannot explicitly capture localized degradation mechanisms.
The identification of a shakedown-type response after approximately 250 load cycles is consistent with theoretical and experimental findings for granular materials, in which the transition from rapid densification to a stabilized deformation regime is controlled by particle rearrangement and energy dissipation mechanisms. Although the number of simulated cycles remains limited, the observed stabilization of the deformation rate is a reliable indicator of long-term behavior.
A particularly relevant outcome of this study is the anomalous response observed for limestone ballast. Unlike basalt and granite, limestone shows an increase in both deviatoric stress at the sleeper–ballast interface and permanent deformation with increasing ballast thickness. This behavior indicates a transition from a stress-controlled regime to a degradation-controlled regime, in which micromechanical processes dominate the overall response.
Although particle breakage decreases at larger thicknesses, this reduction is accompanied by prior fragmentation and the formation of a denser, more heterogeneous structure. This condition promotes localized stress concentrations and reduces the efficiency of stress dissipation, ultimately leading to increased deformation. As a result, the beneficial effects of stress redistribution, typically associated with increased ballast thickness, are offset by degradation mechanisms.
This finding demonstrates that traditional design approaches based solely on stress levels or safety factors may be insufficient when degradation mechanisms become dominant. In this context, the proposed empirical relationships between the factor of safety and permanent strain represent a significant contribution, as they establish a direct link between conventional stability-based parameters and performance-based indicators. These relationships further highlight that stability and deformation are not necessarily correlated in granular systems subjected to cyclic loading and should therefore be evaluated simultaneously in track design and performance assessment.
The applicability of the proposed correlations depends on the conditions and assumptions under which they were derived. Thus, the proposed equations are valid for the specific parameter range of the model: ballast heights between 0.25 and 0.40 m, the type of applied load, and the range of permanent strains studied (approximately 1.5 to 1.9 mm). Critical factors such as moisture, fine contamination, abrasion-induced degradation under cyclic loads, and the presence of sub-ballast or sub-grade of varying quality are not explicitly incorporated into the correlations. The adjusted potential relationship may not hold its shape outside the analyzed range, especially for limestone, whose positive exponent (b = +0.29) likely represents only the initial phase of compaction. It is expected that, at greater deformations, a peak in strength will be reached, followed by a degradation phase, a pattern not captured by the current data.
The validation of the present study is primarily focused on material behavior, as assessed through triaxial testing, whereas the response of the complete track system has not yet been directly validated against field measurements or physical model experiments.
Future work will focus on validating the full hybrid track model. This is expected to involve comparisons between numerical predictions (e.g., settlements, stress distributions) and data from well-instrumented laboratory track models (e.g., full-scale test boxes) and from monitored sections of operational railway lines.
It is also emphasized that the proposed methodology constitutes a robust tool for comparative analyses, such as evaluating the influence of different materials or ballast thicknesses, even in the absence of full-system validation. The systematic differences identified between materials provide meaningful and reliable insights for design purposes, although the absolute response values would benefit from further calibration against full-scale systems performance.
7. Conclusions
A novel hybrid DEM–FDM approach is proposed to conduct performance assessment of rail track support systems. This approach combines conventional continuum modeling, based on the finite difference method, with discrete advance simulation to establish a quantitative relationship between safety factors (FS) and accumulated permanent strain (εp).
The results demonstrate that ballast thickness and material type significantly influence stress transmission, particle breakage, and permanent deformation. High deviatoric stresses are concentrated at the sleeper–ballast interface and decrease with depth, explaining the higher levels of particle breakage observed in this region. Increasing ballast thickness generally reduces stress concentration and particle degradation; however, the magnitude of this effect is strongly material-dependent.
For competent materials such as basalt and granite, increasing ballast thickness reduces both particle breakage and permanent deformation, thereby improving performance. In contrast, limestone exhibits distinct behavior, characterized by increased deformation and stress concentration with increasing thickness, despite reduced breakage at greater thickness. This response reflects the dominant role of micromechanical degradation and highlights the transition from a stress-controlled to a degradation-controlled regime.
A relationship between the FS obtained through continuous models and accumulated permanent strain was established from the hybrid simulations, developing material-specific empirical correlations of the form . For basalt and granite ballast, an inverse relationship between safety factor and accumulated permanent deformations was observed, indicating that greater stability is achieved by reducing permanent deformation due to cyclic loading. In contrast, limestone showed a different trend, suggesting that higher stability margins do not necessarily imply reduced permanent deformation, likely because it is more susceptible to particle breakage.
The comparison between continuum and hybrid simulations revealed a systematic overestimation of stability in terms of factors of safety when using conventional FDMs. This difference was quantified employing a material-dependent micromechanical influence factor, , defined as the ratio of the hybrid to the continuum safety factor. Within the investigated range, recommended correction values are for basalt, for granite, and for limestone. Incorporating this factor allows the adjustment of conventional continuum-based safety factors as follows .
This correction provides a practical means to implicitly account for degradation and particle breakage mechanisms without requiring detailed DEM simulations in engineering practice. The proposed influence factor, therefore, bridges advanced micromechanical modeling and standard design procedures, improving the reliability of stability assessments in railway systems. However, stability alone does not guarantee satisfactory long-term performance under cyclic loading. To address this limitation, a deformation-based performance criterion was introduced by defining an optimal safety factor, , associated with the onset of plastic shakedown. This threshold was identified as the point where the incremental rate of permanent strain accumulation becomes negligible. The resulting values were 1.30 for basalt, 1.35 for granite, and 1.20 for limestone.
By combining the empirical stability–deformation relationship with the micromechanical correction factor, the design requirement can be reformulated directly in terms of allowable permanent strain. This leads to a material-dependent admissible strain limit, , from which the minimum required ballast thickness can be derived through the established strain–thickness relationship. Consequently, the minimum ballast height ensuring shakedown-controlled performance can be determined analytically.
This framework enhances the traditional safety-factor-based design approach into an integrated stability–deformation design methodology. Rather than prescribing thickness solely from stress-based criteria, the proposed approach enables the explicit control of long-term permanent deformation while implicitly accounting for micromechanical degradation mechanisms.
Although the correlations and correction factors are limited to the modeled geometric and loading conditions and do not explicitly account for fouling, moisture, long-term abrasion, or subgrade variability, the results demonstrate the potential of hybrid numerical modeling to support more rational, material-sensitive, and performance-oriented railway design and maintenance strategies. Future research will extend this framework to incorporate subgrade response, long-term cyclic degradation mechanisms, and field-calibrated dynamic loading scenarios, enabling a more comprehensive evaluation of track performance under evolving operational demands.