Article

Deterioration Modeling of Pavement Performance in Cold Regions Using Probabilistic Machine Learning Method

1
Department of Civil and Environmental Engineering, Penn State, University Park, State College, PA 16802, USA
2
School of Transportation, Southeast University, Nanjing 211189, China
3
Municipal Highway, Port, and Transport Management Center Jinhua Municipal Bureau of Transport, Jinhua 321000, China
*
Author to whom correspondence should be addressed.
Infrastructures 2025, 10(8), 212; https://doi.org/10.3390/infrastructures10080212
Submission received: 10 July 2025 / Revised: 3 August 2025 / Accepted: 12 August 2025 / Published: 14 August 2025

Abstract

Accurate and reliable modeling of pavement deterioration is critical for effective infrastructure management. This study proposes a probabilistic machine learning framework using Bayesian-optimized Natural Gradient Boosting (BO-NGBoost) to predict the International Roughness Index (IRI) of asphalt pavements in cold climates. A dataset only for cold regions was constructed from the Long-Term Pavement Performance (LTPP) database, integrating multiple variables related to climate, structure, materials, traffic, and constructions. The BO-NGBoost model was evaluated against conventional deterministic models, including artificial neural networks, random forest, and XGBoost. Results show that BO-NGBoost achieved the highest predictive accuracy (R2 = 0.897, RMSE = 0.184, MAE = 0.107) while also providing uncertainty quantification for risk-based maintenance planning. BO-NGBoost effectively captures long-term deterioration trends and reflects increasing uncertainty with pavement age. SHAP analysis reveals that initial IRI, pavement age, layer thicknesses, and precipitation are key factors, with freeze–thaw cycles and moisture infiltration driving faster degradation in cold climates. This research contributes a scalable and interpretable framework that advances pavement deterioration modeling from deterministic to probabilistic paradigms and provides practical value for more uncertainty-aware infrastructure decision-making.

1. Introduction

In cold regions, road infrastructure is exposed over long periods to complex and highly variable climatic conditions, such as frequent freeze and thaw cycles, substantial snowfall, and repeated de-icing operations [1]. These factors act together to complicate the deterioration process of pavement structures [2,3]. Compared to pavements in temperate climates, those in cold regions are subject to greater environmental stress throughout their service life [4], and their deterioration patterns tend to be more nonlinear and uncertain. In addition, pavement performance is affected by numerous factors [5,6], including traffic loading, structural characteristics such as layer thickness and material type, as well as environmental variables like temperature, snowfall, and the application of de-icing chemicals. Many of these factors change over time, which further increases the complexity of modeling pavement deterioration in cold climates.
Over the past decades, various modeling approaches have been proposed to characterize pavement performance deterioration, aiming to support service life prediction and maintenance planning [7]. Among these, empirical regression models were among the earliest and most widely adopted methods. A representative example is the Pavement Serviceability Index (PSI) formulated by the American Association of State Highway and Transportation Officials (AASHTO), which relates pavement condition to service age based on data from the AASHO Road Test [8]. These models are built on statistical fitting of historical survey data and are generally simple in form and easy to interpret [9]. However, they often fail to capture the complex interactions among multiple influencing factors. Another commonly used approach is the Markov process model, which represents pavement deterioration as a probabilistic transition between discrete condition states over time [10]. This method is well-suited for condition-based decision-making but relies heavily on the assumption of stable transition probabilities, which may not hold across different regions or pavement types.
In recent years, the capacity to collect pavement asset data has improved substantially using technologies such as pavement inspection vehicles, embedded sensors, and remote sensing systems. As a result, an increasing amount of pavement performance data are now available, and the modeling task has taken on characteristics of high dimensionality and large sample size. These developments have supported the growing use of machine learning methods in pavement deterioration modeling [11,12]. Compared to traditional statistical approaches, machine learning techniques are better suited to capturing nonlinear relationships, learning relevant features from data, and performing effectively in high-dimensional environments [13,14,15]. For example, artificial neural networks (ANNs) have been applied to model the evolution of performance indicators such as the International Roughness Index (IRI) [16,17] or Pavement Condition Index (PCI) [18] over time or under traffic loading conditions. Random forest (RF) models have demonstrated stability and accuracy in handling multi-source datasets due to their ensemble structure [19]. Gradient boosting algorithms [20], including XGBoost [21], have become widely used in pavement condition prediction because of their strong generalization ability. In addition, several studies have investigated the use of deep learning techniques such as convolutional neural networks [22] and long short-term memory models [23] for tasks related to pavement image analysis and dynamic performance modeling.
Despite the significant improvements in prediction accuracy achieved by these models, most existing studies remain focused on deterministic modeling, which produces only point estimates without quantifying uncertainty. However, uncertainty plays a critical role in real-world maintenance decision-making. Even under identical conditions in terms of pavement age, structural design, and climate, substantial variations in pavement performance can still occur. These discrepancies may be caused by material inconsistencies, variations in construction quality, or external disturbances such as extreme weather events. If uncertainty is not accounted for, models may lead to premature or delayed maintenance actions, resulting in wasted resources or increased risk of service disruptions. To address this issue, probabilistic deterioration modeling has gained growing attention [24,25]. Such models can provide not only expected values of performance indicators but also confidence intervals or full probability distributions. These outputs are essential for supporting risk-informed pavement asset management strategies [26]. Especially under budget constraints, decision-makers can use failure probability or performance confidence levels to prioritize interventions more effectively. The application of Bayesian approaches and probabilistic prediction models has slowly found its way into pavement performance modeling. For instance, GPR has been used to model the time-dependent changes in the condition of pavements with confidence interval estimates for the future [27,28]. Natural Gradient Boosting (NGBoost) is a probabilistic machine learning algorithm that extends traditional gradient boosting by modeling not only the point estimate of the target variable but also its full conditional distribution, enabling quantification of uncertainty in predictions [29]. Unlike conventional models that produce single-value outputs, NGBoost predicts both the mean and variance, making it particularly suitable for applications involving risk assessment and variability. Recent studies have demonstrated its effectiveness in civil engineering such as bridge structural response [30], pavement rutting prediction [31], and concrete-steel bond failure [32]. Effective hyperparameter tuning is essential for optimizing machine learning model performance. However, conventional approaches like grid search, random search, and metaheuristic algorithms often face challenges such as high computational demands, low efficiency, algorithmic complexity, and slow convergence rates [33,34]. In contrast, Bayesian Optimization (BO) can efficiently and intelligently explore the hyperparameter space. It uses a tree-structured Parzen estimator which can achieve adaptive sampling and pruning and dynamic search space adjustment [35]. Therefore, BO-NGBoost combines the predictive power of NGBoost with the global search capability of Bayesian Optimization, resulting in a robust and well-calibrated predictive framework. Key advantages of this approach include its ability to handle non-linear relationships, generate interpretable uncertainty estimates, and automatically optimize model parameters.
This study aims to develop a pavement deterioration model for cold-region roads based on NGBoost with Bayesian optimization (BO-NGBoost), with the goal of achieving accurate and reliable performance prediction. Specifically, the research will:
(1)
Construct a specific dataset for cold-region pavement performance, integrating various features related to traffic, structural design, and environmental conditions.
(2)
Apply Bayesian optimization to automatically select the hyperparameters of the NGBoost model and improve its predictive capability.
(3)
Compare the proposed approach with commonly used deterministic machine learning models, including ANN, RF, and XGBoost, in terms of both accuracy and uncertainty estimation.
The objective of this study is to support a shift in cold-region pavement deterioration modeling from deterministic prediction toward probabilistic decision support, thereby contributing theoretical insights and technical tools for future risk-informed pavement asset management.

2. Methodology

2.1. Data Collection and Preparation

To support the investigation, we collected data from the Long-Term Pavement Performance (LTPP) InfoPave database [36], a comprehensive and publicly accessible source of pavement performance data across North America. Our data collection followed a set of defined assumptions to control for variability and isolate key factors affecting deterioration. First, we focused exclusively on asphalt pavements, as asphalt and concrete deteriorate under different mechanisms and combining them could introduce inconsistencies. Second, we limited our dataset to cold climate regions, including Dry, Freeze and Wet, Freeze. Third, we selected only newly constructed pavements that had not undergone any maintenance activities during the observation period. This allows us to observe the natural deterioration curve without external interventions, making it easier to model deterioration as a function of traffic and environmental exposure. These controlled conditions provide a cleaner dataset that is more suitable for deterioration modeling in cold region pavements.
Table 1 presents the variables selected from the LTPP InfoPave database for use in this study, categorized into climate, structure, material, traffic, construction, and performance output. The selection of these variables is grounded in previous literature on flexible pavement performance modeling, where factors such as age, structural thickness, climate conditions, and traffic load are consistently identified as key predictors of deterioration. Specifically, climate-related variables include maximum and minimum air temperatures (Tmax and Tmin) and annual precipitation (Pp), which influence moisture infiltration, freeze–thaw cycles, and aging of pavement materials [37]. Structural parameters such as asphalt layer thickness (AT) and base layer thickness (BT) define the pavement’s load distribution capacity; BT values are limited to unbound granular layers, excluding chemically treated bases. Material-related variables include average asphalt content (AC) and bulk specific gravity (BSG). Asphalt content plays a critical role in pavement performance because it governs both the chemical compatibility and the mechanical adhesion within the mixture. First, the right amount of asphalt binder ensures optimal compatibility with various additives so that they disperse evenly and enhance durability [38]. Second, sufficient binder content is essential to promote strong adhesion between the asphalt and the mineral aggregates, preventing issues such as raveling, stripping, and premature cracking [39]. The traffic factor, ESAL, represents the estimated annual equivalent single axle load, which is a primary driver of mechanical wear. Construction inputs include initial IRI (IRI0) and pavement age, both essential for establishing baseline and temporal deterioration trends. The output variable is the measured IRI at each inspection year, a widely used indicator of ride quality and surface conditions. These variables are representative and well-aligned with established deterioration modeling frameworks, allowing for reliable training and testing of AI-based models The standard scaler normalization was used to all continuous input variables prior to model training.

2.2. Model Development

Figure 1 shows the steps for developing the deterioration model in infrastructure management. The experimental design of this study follows a structured five-step process adapted from Labi [40], aimed at predicting the deterioration of asphalt pavement by modeling the changes in International Roughness Index (IRI) over time. The first step defines the objective, which is to explore how artificial intelligence can be applied to IRI prediction and to understand the challenges involved. In this step, we also identified IRI as the dependent variable and selected a set of independent variables representing key influencing factors, including climate, structure, material properties, traffic load, and construction characteristics. The second step involves specifying the modeling technique, where we apply AI-based methods to capture complex relationships among variables. The third step focuses on collecting and processing relevant data from the LTPP InfoPave database, applying key assumptions such as selecting only asphalt pavements in a single climate region and excluding sections with maintenance to ensure data consistency. In the fourth step, the model is calibrated and evaluated using performance metrics to assess prediction accuracy. Finally, the fifth step involves validating the model with unseen data to confirm its generalization capability. This systematic experimental design ensures the reliability and scientific rigor of our investigation.
In this study, we employed machine learning models to predict the deterioration of asphalt pavement, using IRI as the pavement performance indicator. The models are grouped into two main categories: deterministic models and probabilistic models. Deterministic models generate single-point predictions for IRI and include algorithms such as Random Forest, XGBoost, and Artificial Neural Networks (ANN). Random Forest constructs multiple decision trees using different data subsets and averages their outputs to produce a final prediction. XGBoost, a gradient boosting technique, builds trees sequentially, where each new tree aims to correct the errors of the previous ones. ANN uses multiple layers of interconnected neurons to capture nonlinear and complex relationships between inputs and the output variable. In contrast, our probabilistic modeling approach leverages NGBoost (Natural Gradient Boosting), which provides not just point estimates but full probability distributions for predictions.
As shown in Figure 2, NGBoost first follows the traditional gradient boosting framework but further optimizes the natural gradient to estimate both the mean and variance of the predicted IRI. NGBoost differs fundamentally from traditional gradient boosting methods in both its objective and optimization approach. While conventional gradient boosting algorithms focus on predicting a single point estimate, NGBoost is designed to predict a full probability distribution over the target. This enables it to provide not only point predictions but also uncertainty quantification, which is especially valuable for risk-informed decision-making. Another key difference lies in the optimization process. NGBoost leverages natural gradients rather than standard gradients to update model parameters. Natural gradients take into account the underlying geometry of the probability space, leading to more stable and efficient convergence when learning distribution parameters. This probabilistic framework allows NGBoost to directly model heteroscedasticity and other forms of data variability that traditional boosting models typically cannot capture. As a result, NGBoost is particularly suitable for applications that require both high accuracy and interpretable measures of predictive uncertainty.
NGBoost is built upon the gradient boosting framework, where the model learns the θ parameters of a specified probability distribution P(y|x,θ) rather than predicting a single point estimate. The objective function is based on the negative log-likelihood of the chosen distribution, as shown in Equation (1).
L = i = 1 n log P y i x i , θ i
where θi is iteratively updated through additive weak learners using natural gradients for improved convergence stability.
In this study, BO through Optuna was employed to efficiently search for the optimal hyperparameters, including learning rate, number of estimators, and base learner parameters. The objective function for optimization is defined as the 5-fold cross-validated negative mean squared error as shown in Equation (2).
O b j = 1 K k = 1 K M S E k
where K is the number of folds.
Tree-structured Parzen Estimator (TPE) was used to model the likelihood of achieving good versus poor outcomes based on past trials. Let l(x) and g(x) be the probability densities of the good and bad hyperparameter configurations based on a threshold. The TPE-based acquisition function is defined by maximizing the ratio in Equation (3).
x n e x t = arg max l x g x
where l(x) models the parameters leading to better-than-threshold scores; g(x) models the parameters with worse scores.
In this study, Bayesian Optimization was implemented using the Optuna framework to systematically tune the hyperparameters. A total of 200 optimization trials were conducted. The search space included both general NGBoost parameters and those specific to different types of base learners. For the NGBoost core settings, the learning rate ranged from 0.001 to 0.3 (log-scaled), the number of estimators ranged from 100 to 2000, and both column subsampling and mini-batch fraction varied from 0.3 to 1.0. In addition, a convergence tolerance parameter was tuned between 10-6 and 10-3. For the base learner, the search was performed across three types: decision tree, ridge regression, and random forest. Each base learner type had its own associated parameter space. For instance, the tree-based learner included maximum depth (2–12), minimum samples per split (2–20), and minimum samples per leaf (1–10), while ridge regression tuned the regularization coefficient, and random forest adjusted the number of trees and their depth. Furthermore, different probability distributions (Normal, LogNormal, Exponential, and Laplace) were explored. Model performance in each trial was evaluated using five-fold cross-validation, and the negative mean squared error was used as the optimization objective. The TPE sampler and median pruner were used to guide and accelerate the search process.
The alignment of variables by location and inspection date was conducted to ensure that each sample represented a complete snapshot of pavement condition and influencing factors at a specific time and place. Specifically, pavement performance data (IRI measurements) were aligned with corresponding structural, material, traffic, and climate variables based on section ID and inspection date.
In the LTPP dataset, some challenges were encountered, including irregular inspection intervals and occasional unavailability of data for specific pavement sections. These issues resulted in missing values within the dataset. Following established recommendations in the literature [41], missing values were removed directly when they constituted a small proportion of the dataset (less than 5%). In our case, the proportion of missing values remained below this threshold, making direct removal a statistically acceptable approach. After aligning all variables by their corresponding locations and inspection dates, we compiled a final dataset consisting of 5692 samples.
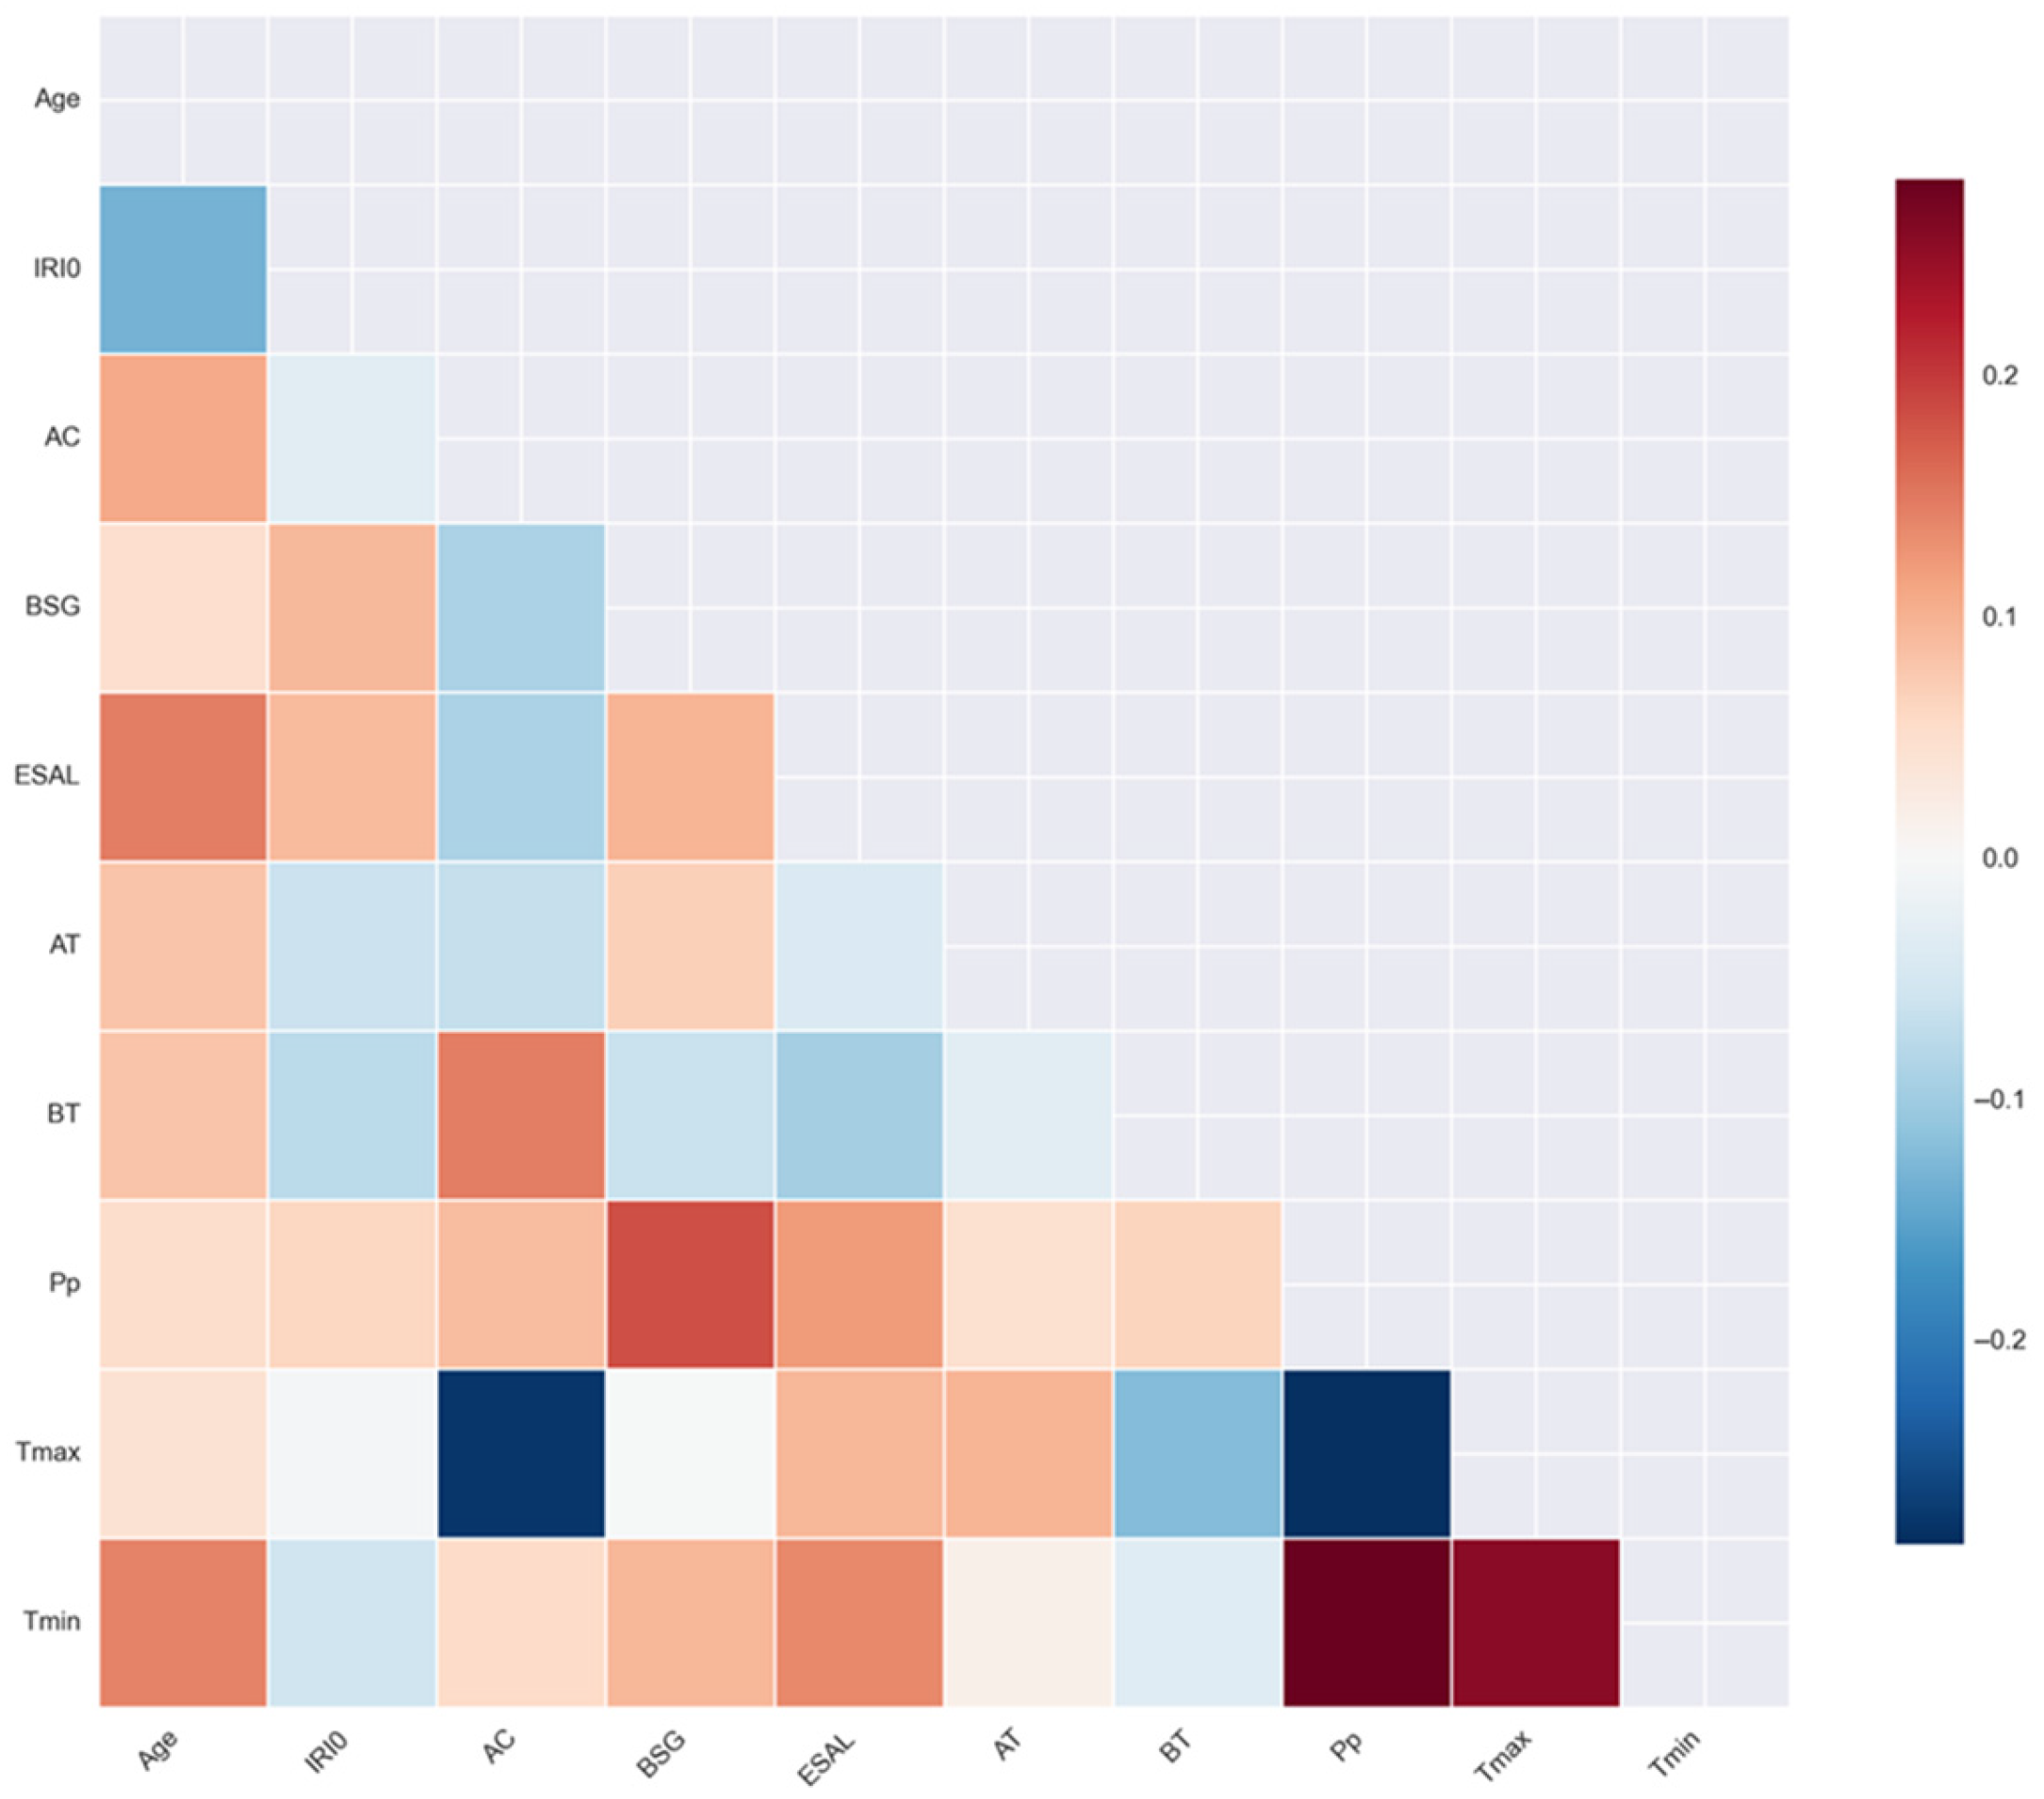
To ensure the quality of the input features and identify any potential multicollinearity issues, we performed a Pearson correlation analysis on the ten selected variables. As illustrated in Figure 3, none of the feature pairs exhibited a strong correlation that would exceed a common threshold for collinearity concerns (typically |r| > 0.7). This result indicates that the input variables are relatively independent of each other. Therefore, we retained all 10 features for use in the subsequent machine learning models without requiring dimensionality reduction, variable elimination, or feature combination.
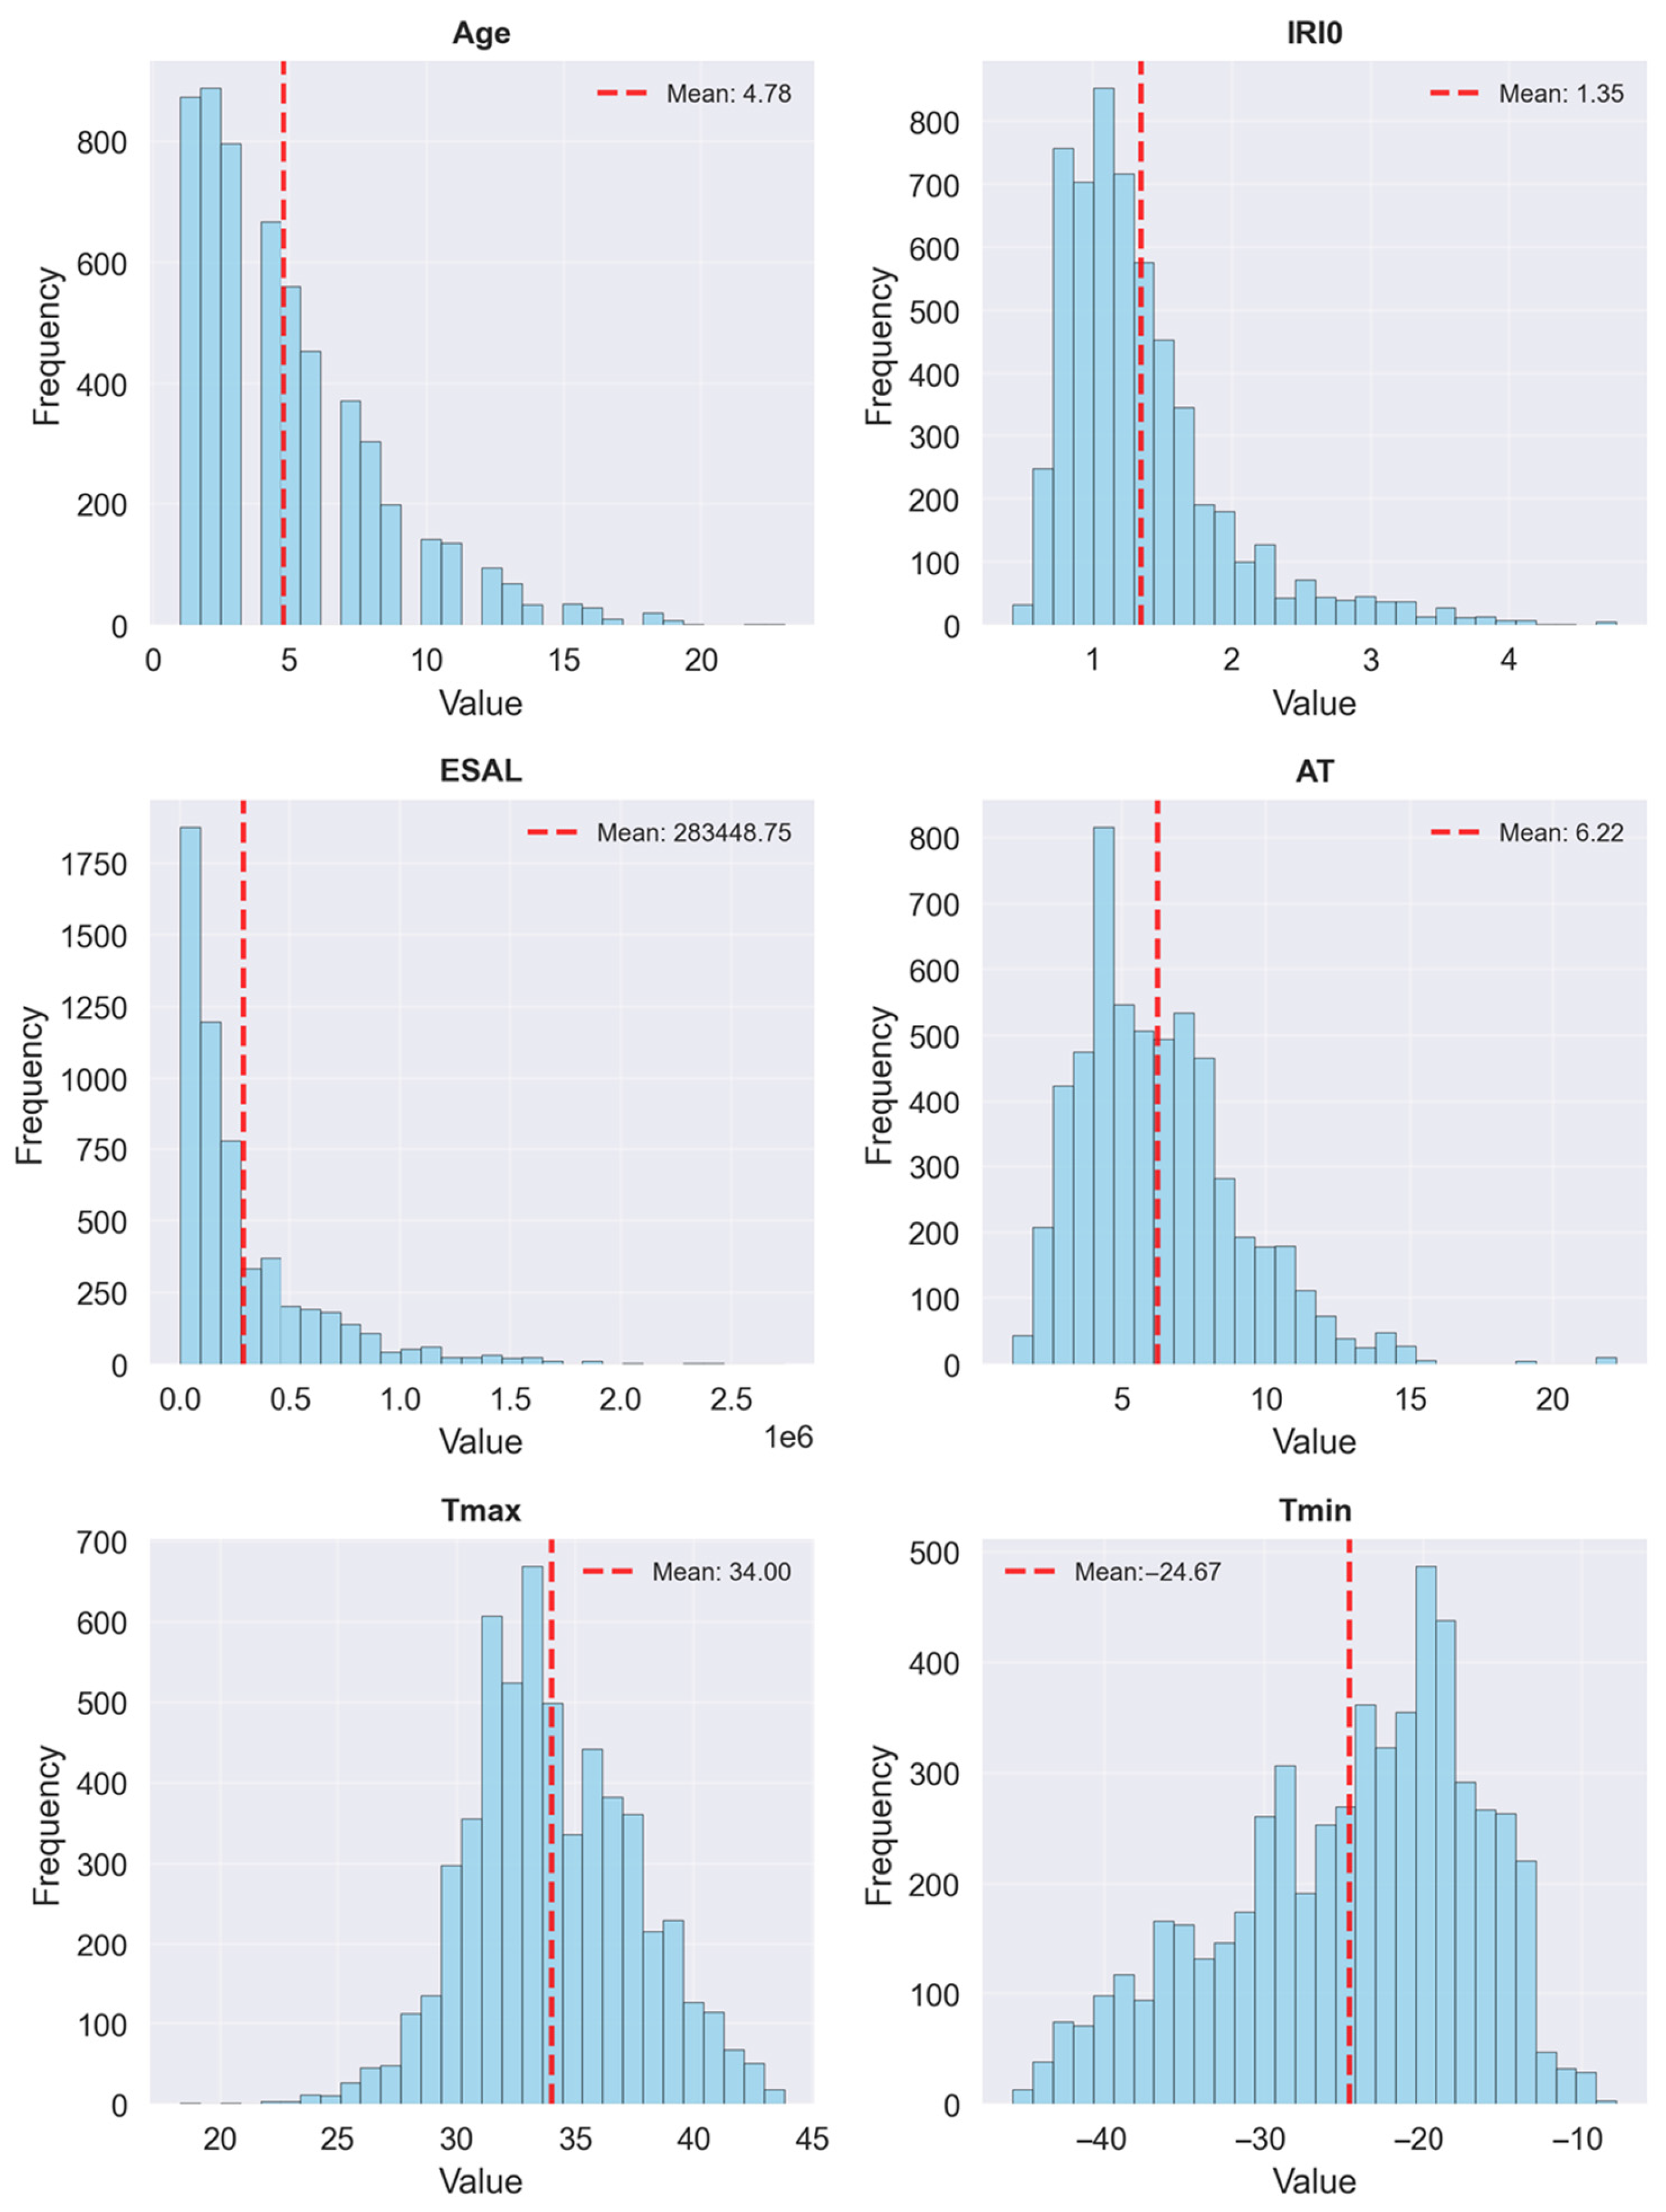
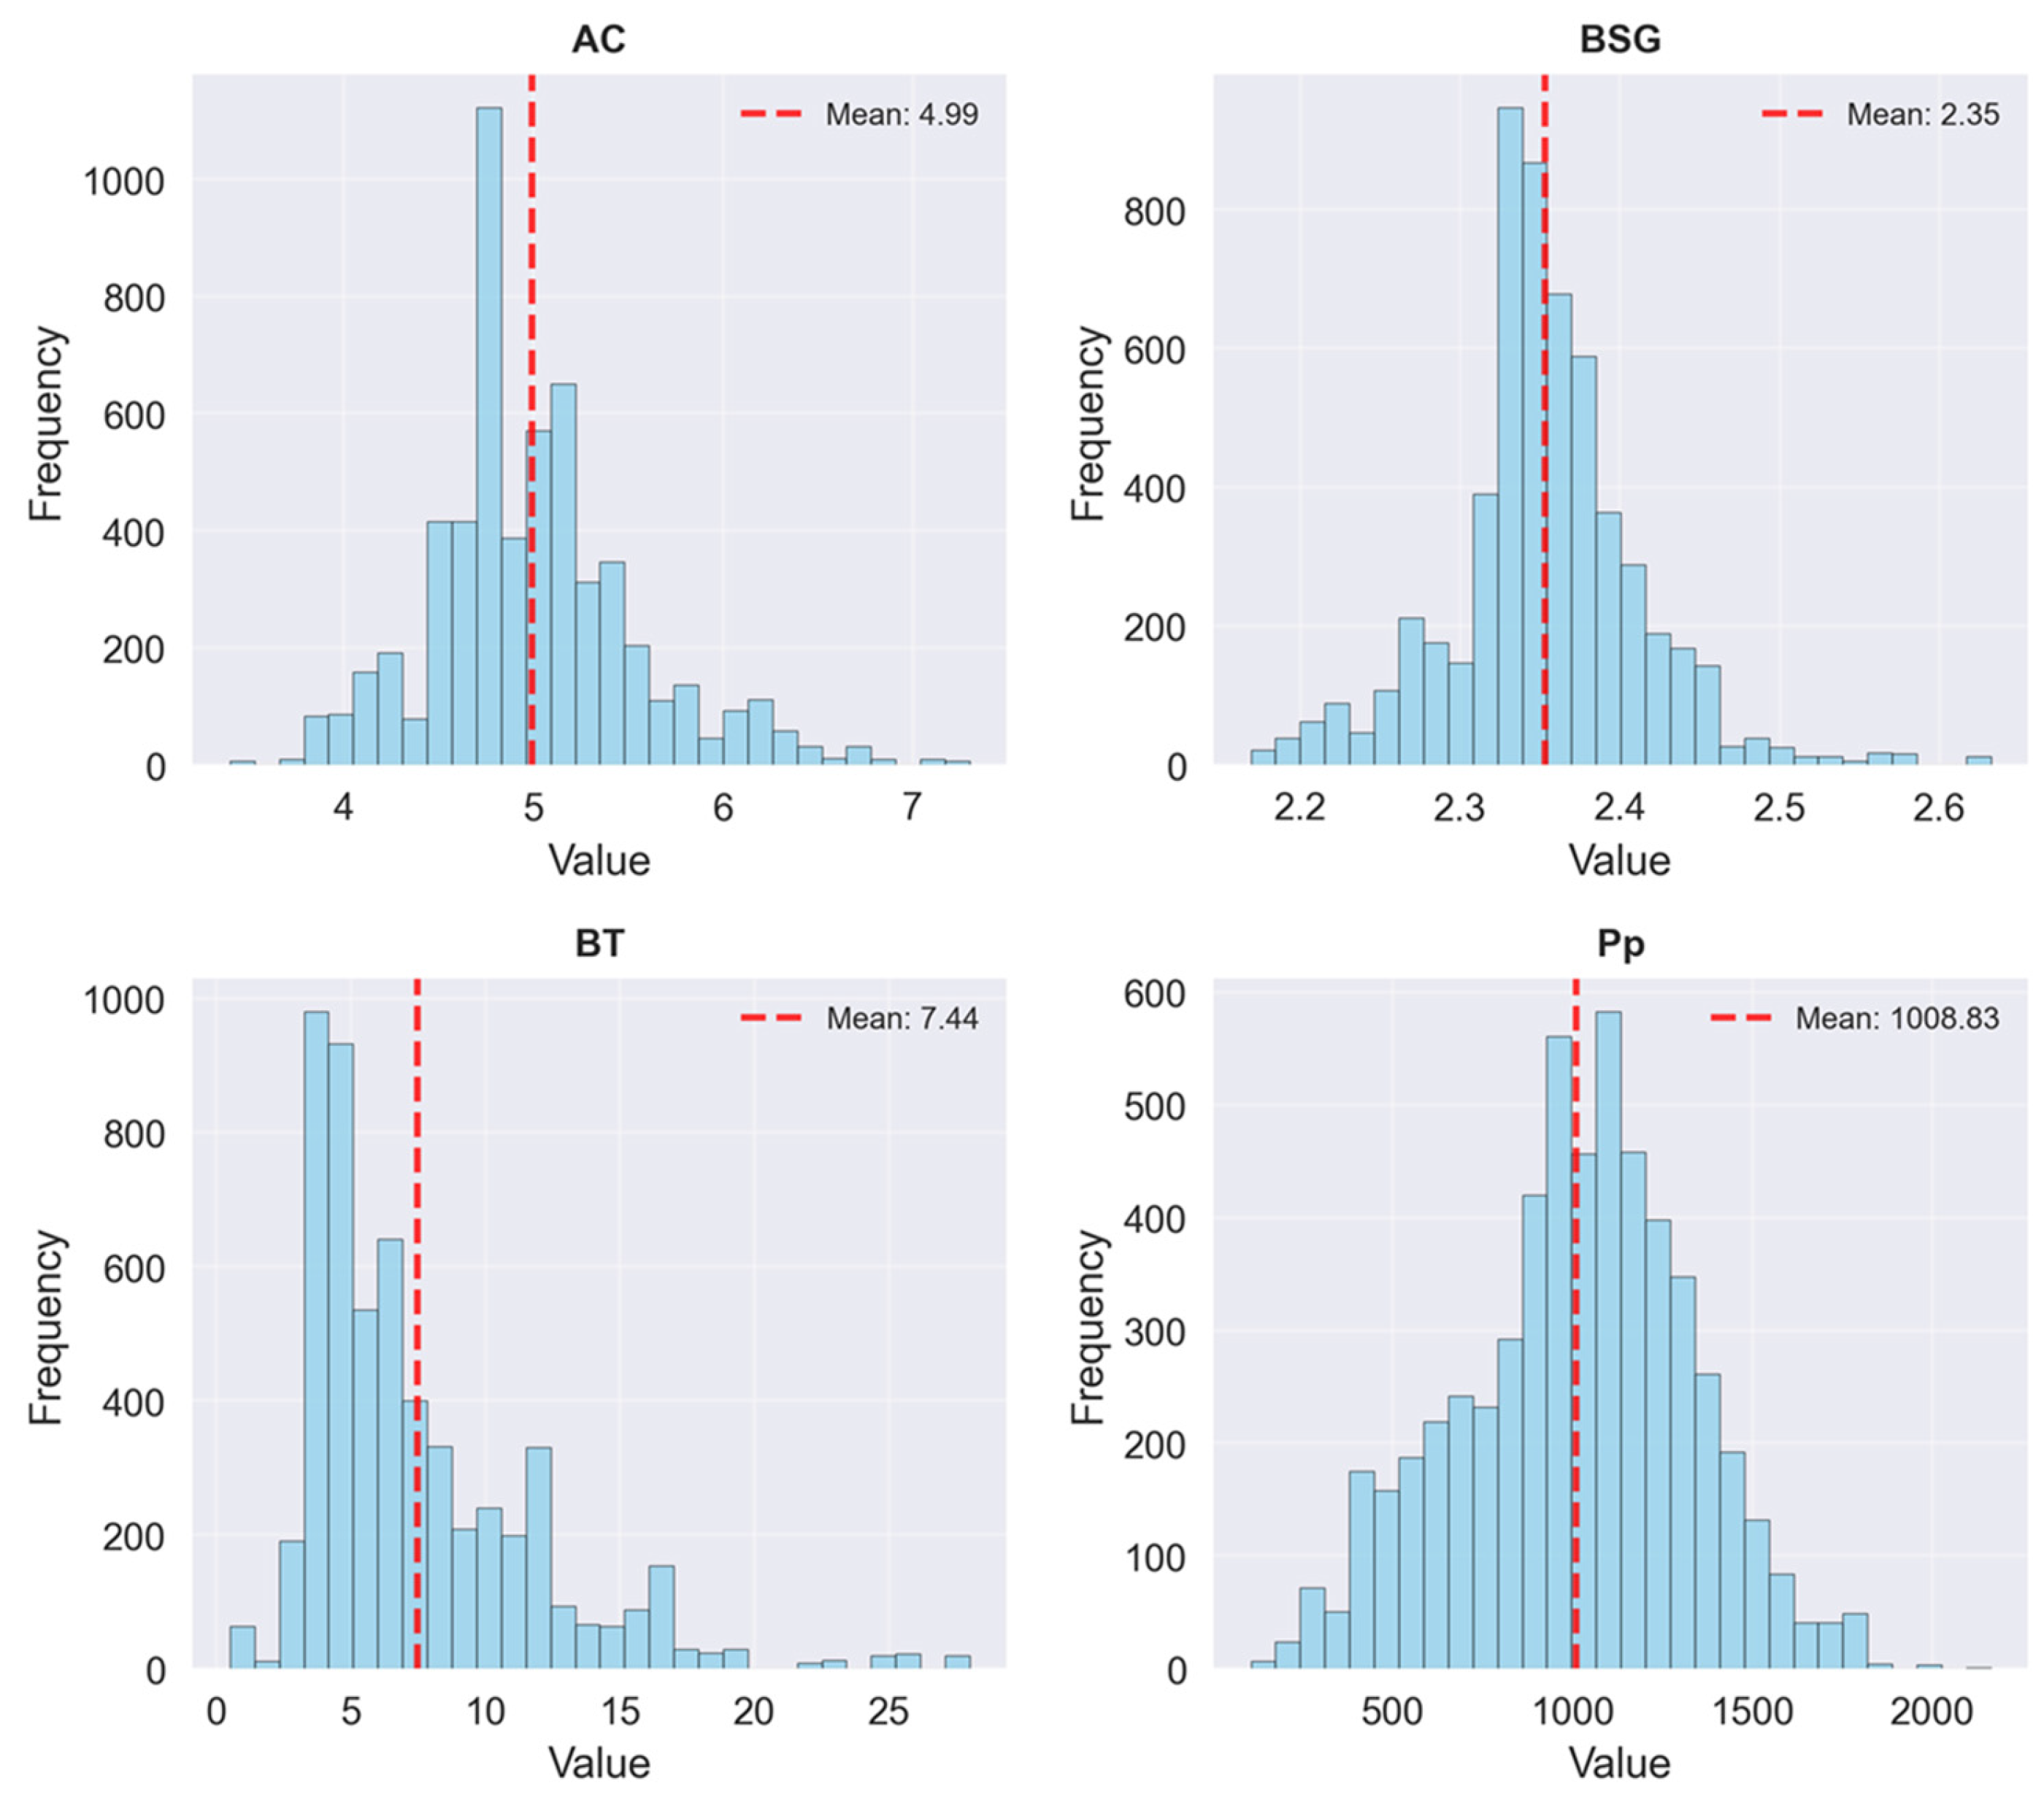
To better understand the distribution of input variables in the dataset, we visualized the frequency histograms for all ten features used in the modeling process. As shown in Figure 4, each histogram displays the range and frequency of observed values for a given variable, along with the mean value indicated by a red dashed line. The distribution characteristics of the input variables used in the pavement deterioration model exhibit diverse patterns, reflecting the heterogeneity of the dataset. Variables such as Age, IRI0, ESAL, and BT display positively skewed distributions, with most values concentrated on the lower end and a long tail extending toward higher values, indicating that most pavements are relatively young and lightly loaded, while a small portion has experienced significantly greater aging or loading. In contrast, variables like Tmax, Tmin, Pp, AT, and AC are approximately normally distributed, centered around their respective means, which suggests a balanced range of climatic and structural conditions across the dataset. Tmin in particular shows a slight left skew, consistent with cold-region climates. The BSG and AC variables are tightly clustered with low variability, while IRI0 and ESAL show greater dispersion, suggesting more variability in initial roughness and traffic loading.
To calibrate and evaluate the machine learning models, we applied a 5-fold cross-validation method. First, the full dataset was split into two parts: 80% was used for training and 20% was reserved as testing data. The training data were further divided into five equal folds. In each iteration of the cross-validation process, one fold served as the validation set while the remaining four were used for training. This procedure was repeated five times so that each fold was used as a validation set exactly once. After completing all iterations, the model parameters that produced the highest R2 and the lowest root mean square error (RMSE) and mean absolute error (MAE) across the validation sets were selected as the optimal parameters. This method ensures that the testing data remains completely unseen throughout the training and validation process, resulting in a more reliable and unbiased evaluation of the model’s performance. Additionally, using cross-validation helps reduce the variance associated with random data splitting, leading to more stable and generalizable models.

3. Results and Analysis

3.1. Model Performance Evaluation

After training the machine learning models, we evaluated their performance using three standard metrics. These metrics help assess how well the model predictions match the observed data, how large the prediction errors are on average, and how consistent the predictions are in terms of absolute accuracy. According to the results shown in Table 2, XGBoost performed the best among the deterministic models, achieving an R2 value of 0.904 along with the lowest RMSE and MAE values in its group. In the category of probabilistic models, BO-NGBoost achieved an even higher R2 value of 0.908, along with the lowest overall RMSE of 0.153 and MAE of 0.099. This indicates that BO-NGBoost not only provides accurate predictions but also better captures variability and uncertainty in the data compared to other models.
To better illustrate the novelty and comparative value of the proposed BO-NGBoost framework, Table 3 summarizes recent studies on IRI prediction using various machine learning methods. The table contrasts datasets, input variables, and modeling approaches and their respective advantages and limitations. Unlike previous models that focus mainly on deterministic outputs, our model uniquely incorporates uncertainty quantification, which is essential for risk-informed decision-making in pavement management. Additionally, while many existing models rely heavily on distress data or maintenance histories, this study demonstrates high predictive accuracy (R2test = 0.897) using a clean, maintenance-free cold-region dataset and interpretable input variables. This comparative analysis highlights how the proposed method balances predictive performance, interpretability, and practical utility, offering added value over prior works.
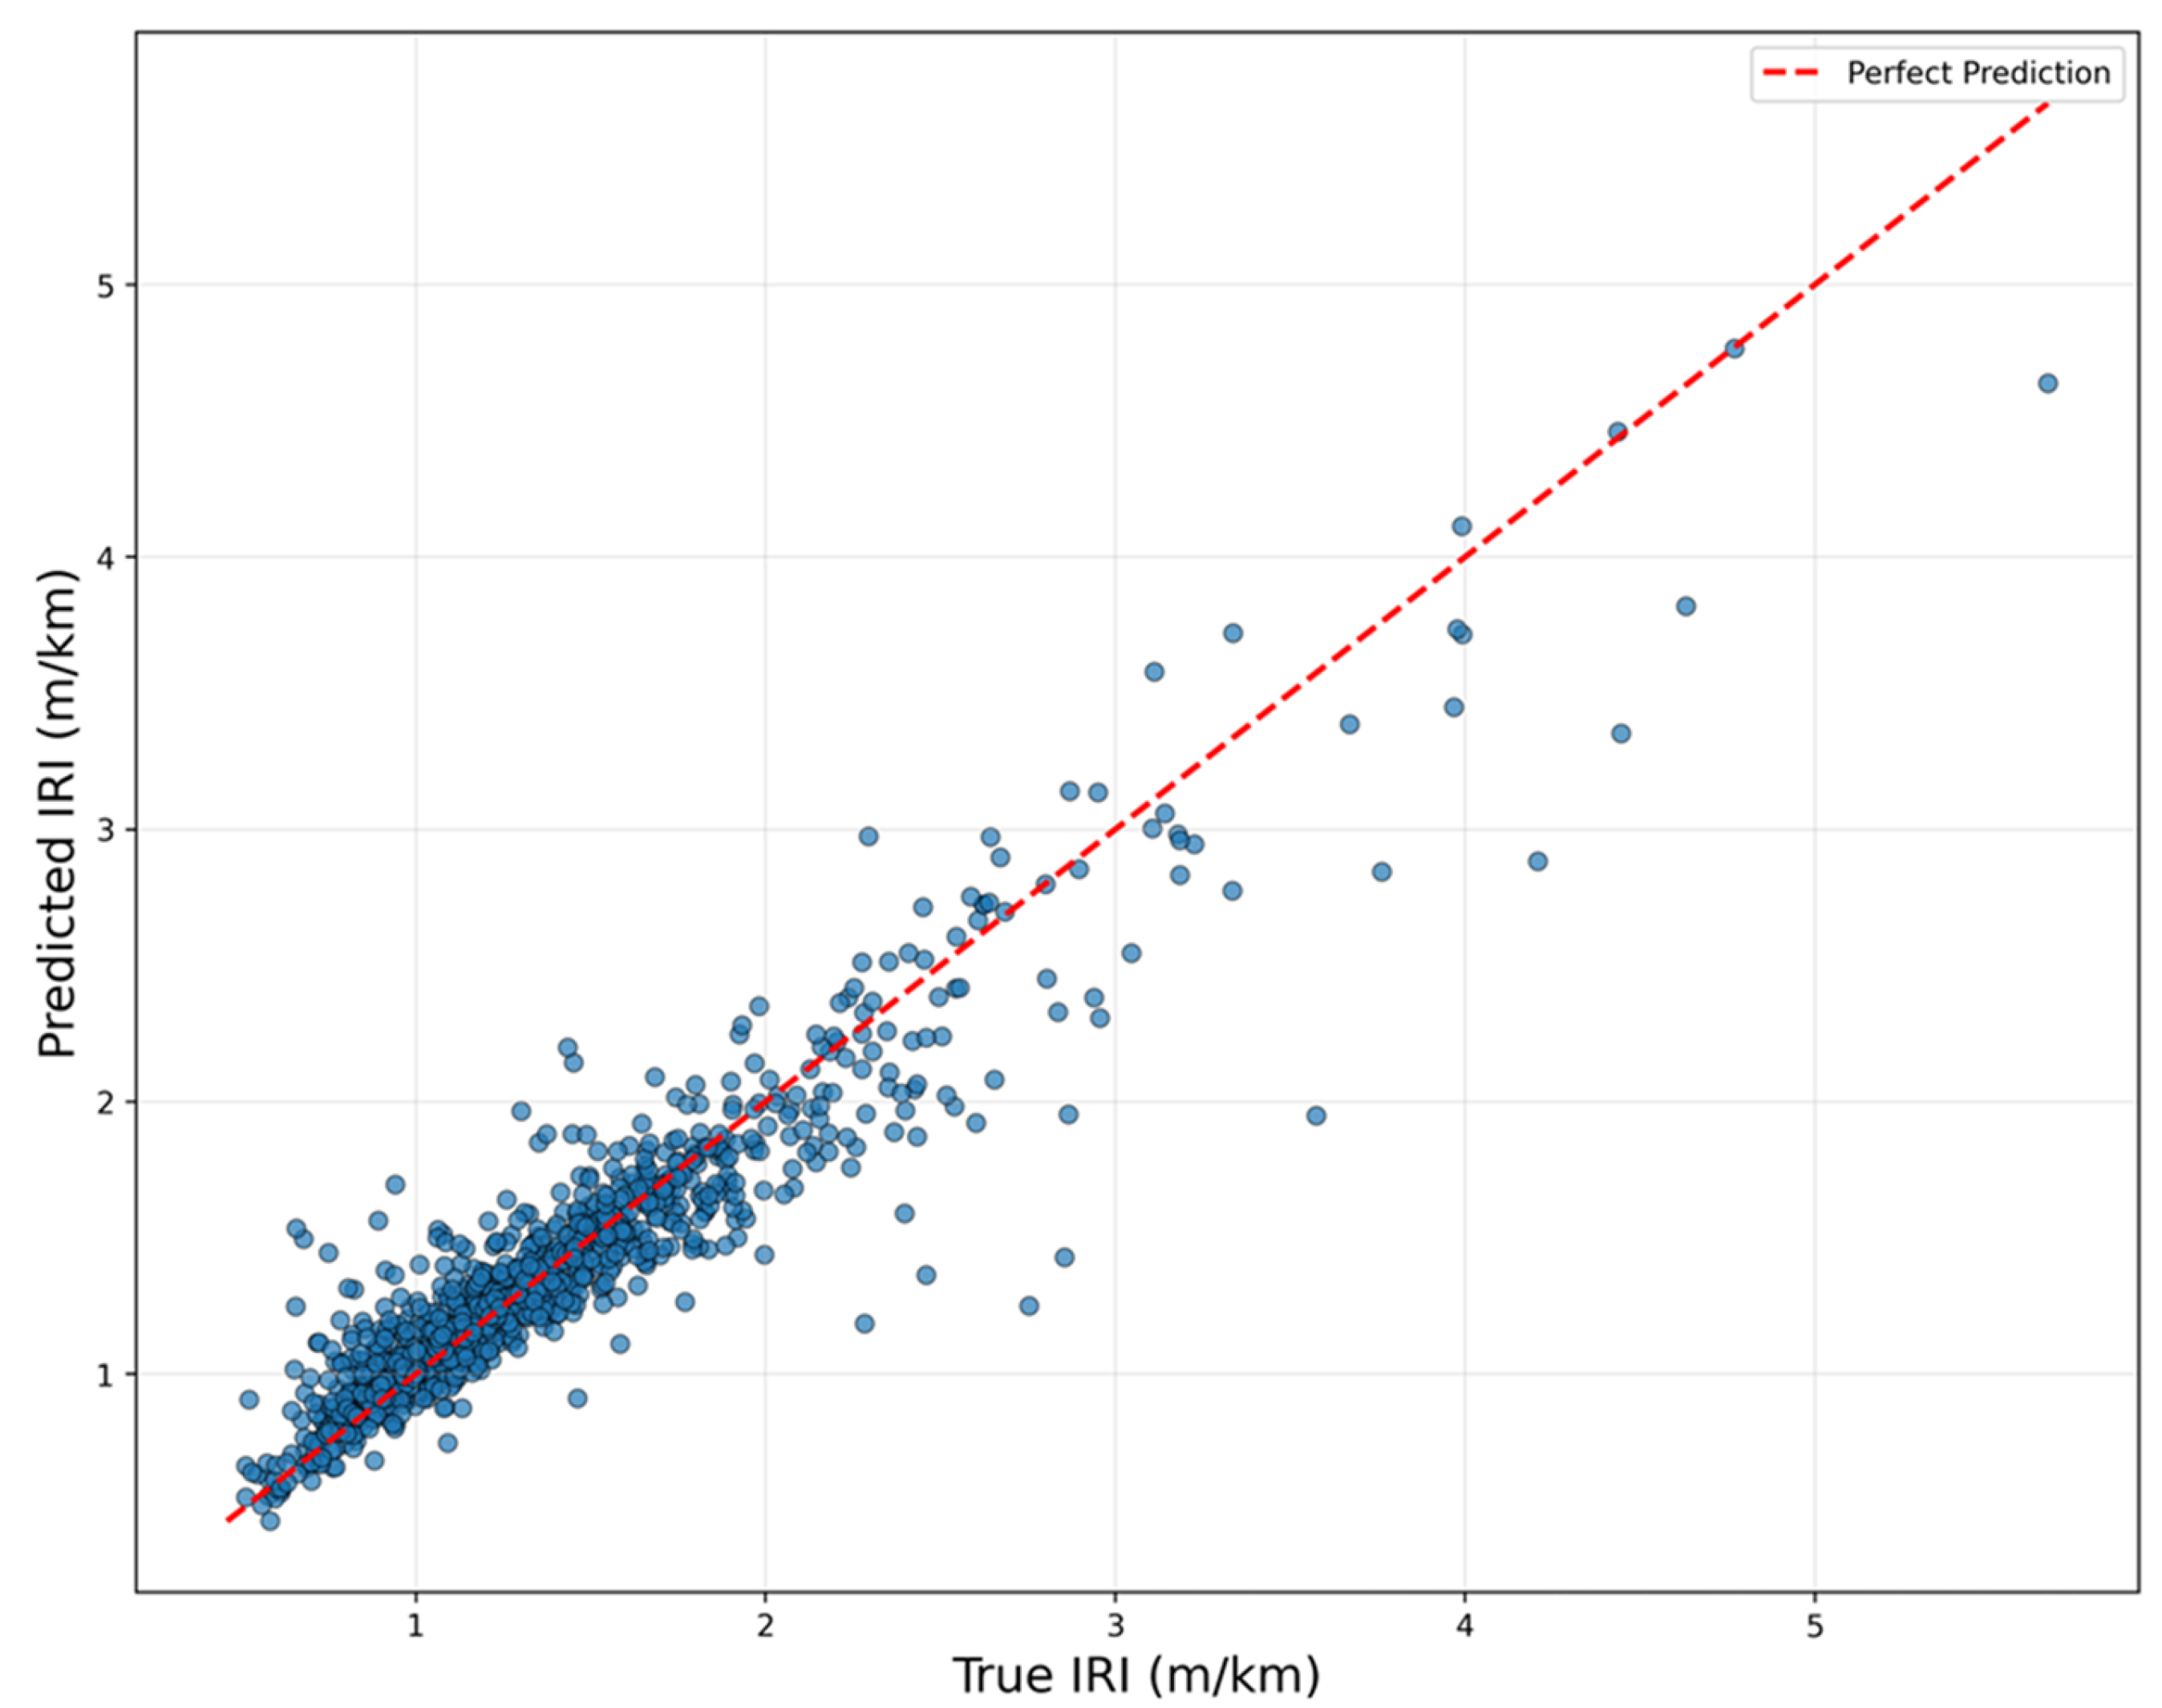
Figure 5 illustrates the performance of the XGBoost model in predicting IRI by comparing its predictions to the actual measured values. The red dashed line indicates the ideal scenario where predicted and true values are equal. Most of the points are closely grouped around this line, indicating strong predictive accuracy, especially in the lower to mid-range IRI values (between 1.0 and 2.5 m/km), indicating that the model performs well in this common range. As IRI values increase beyond 3.0 m/km, the spread around the reference line becomes slightly wider, suggesting a modest decline in predictive accuracy for higher IRI values. This is potentially due to fewer training samples in this range or increased variability in road surface conditions. The overall alignment with the reference line demonstrates that the model captures the underlying relationship between features and the target variable effectively, with strong predictive accuracy across most of the value range.
Figure 6a shows the prediction results from the BO-NGBoost model. Each green dot represents a test sample, with the predicted IRI value plotted against the true IRI value. The red dashed line indicates perfect prediction, where predicted and true values are equal. A key feature of this plot is the inclusion of 95% prediction intervals, shown as vertical bars around each point. These intervals reflect the model’s confidence in its predictions. Narrow intervals mean the model is more certain about the result, while wider intervals suggest more uncertainty. Most predictions lie close to the red line and have reasonably tight intervals, especially in the lower to middle IRI range. As the true IRI increases, both the spread of points and the width of the intervals grow slightly, showing more variability and reduced certainty for higher values. Therefore, the BO-NGBoost can not only predict IRI values accurately but also quantify how confident it is in each prediction.
As shown in Figure 6b, the NGBoost model provides not only point predictions of IRI over time but also corresponding predictive uncertainty bounds. The uncertainty band becomes wider with increasing pavement age. There are several underlying reasons for the observed increase in uncertainty for older pavements. First, as pavements age, the influence of cumulative environmental stresses (such as freeze–thaw cycles, moisture infiltration, and temperature extremes) and traffic loading becomes more obvious and heterogeneous. These processes introduce greater variability in deterioration patterns, which the model expresses through wider prediction intervals. Second, the data distribution of pavement age in the dataset is skewed with fewer observations for pavements older than 15 years. This characteristic reduces the confidence in model predictions at the tail end of the age spectrum. Third, aging amplifies the interaction effects between multiple factors (e.g., layer thickness, climate, and initial condition), further increasing the spread of possible IRI outcomes. Rather than being a limitation, this growing uncertainty highlights the strength of the NGBoost model in realistically reflecting the variability inherent in long-term pavement performance. By explicitly quantifying uncertainty, the model supports more informed, risk-aware decision-making in maintenance planning and asset management. This aspect represents a key advantage over traditional deterministic models, which cannot represent confidence levels or potential variation in predictions over time.

3.2. Interpretation of ML Model

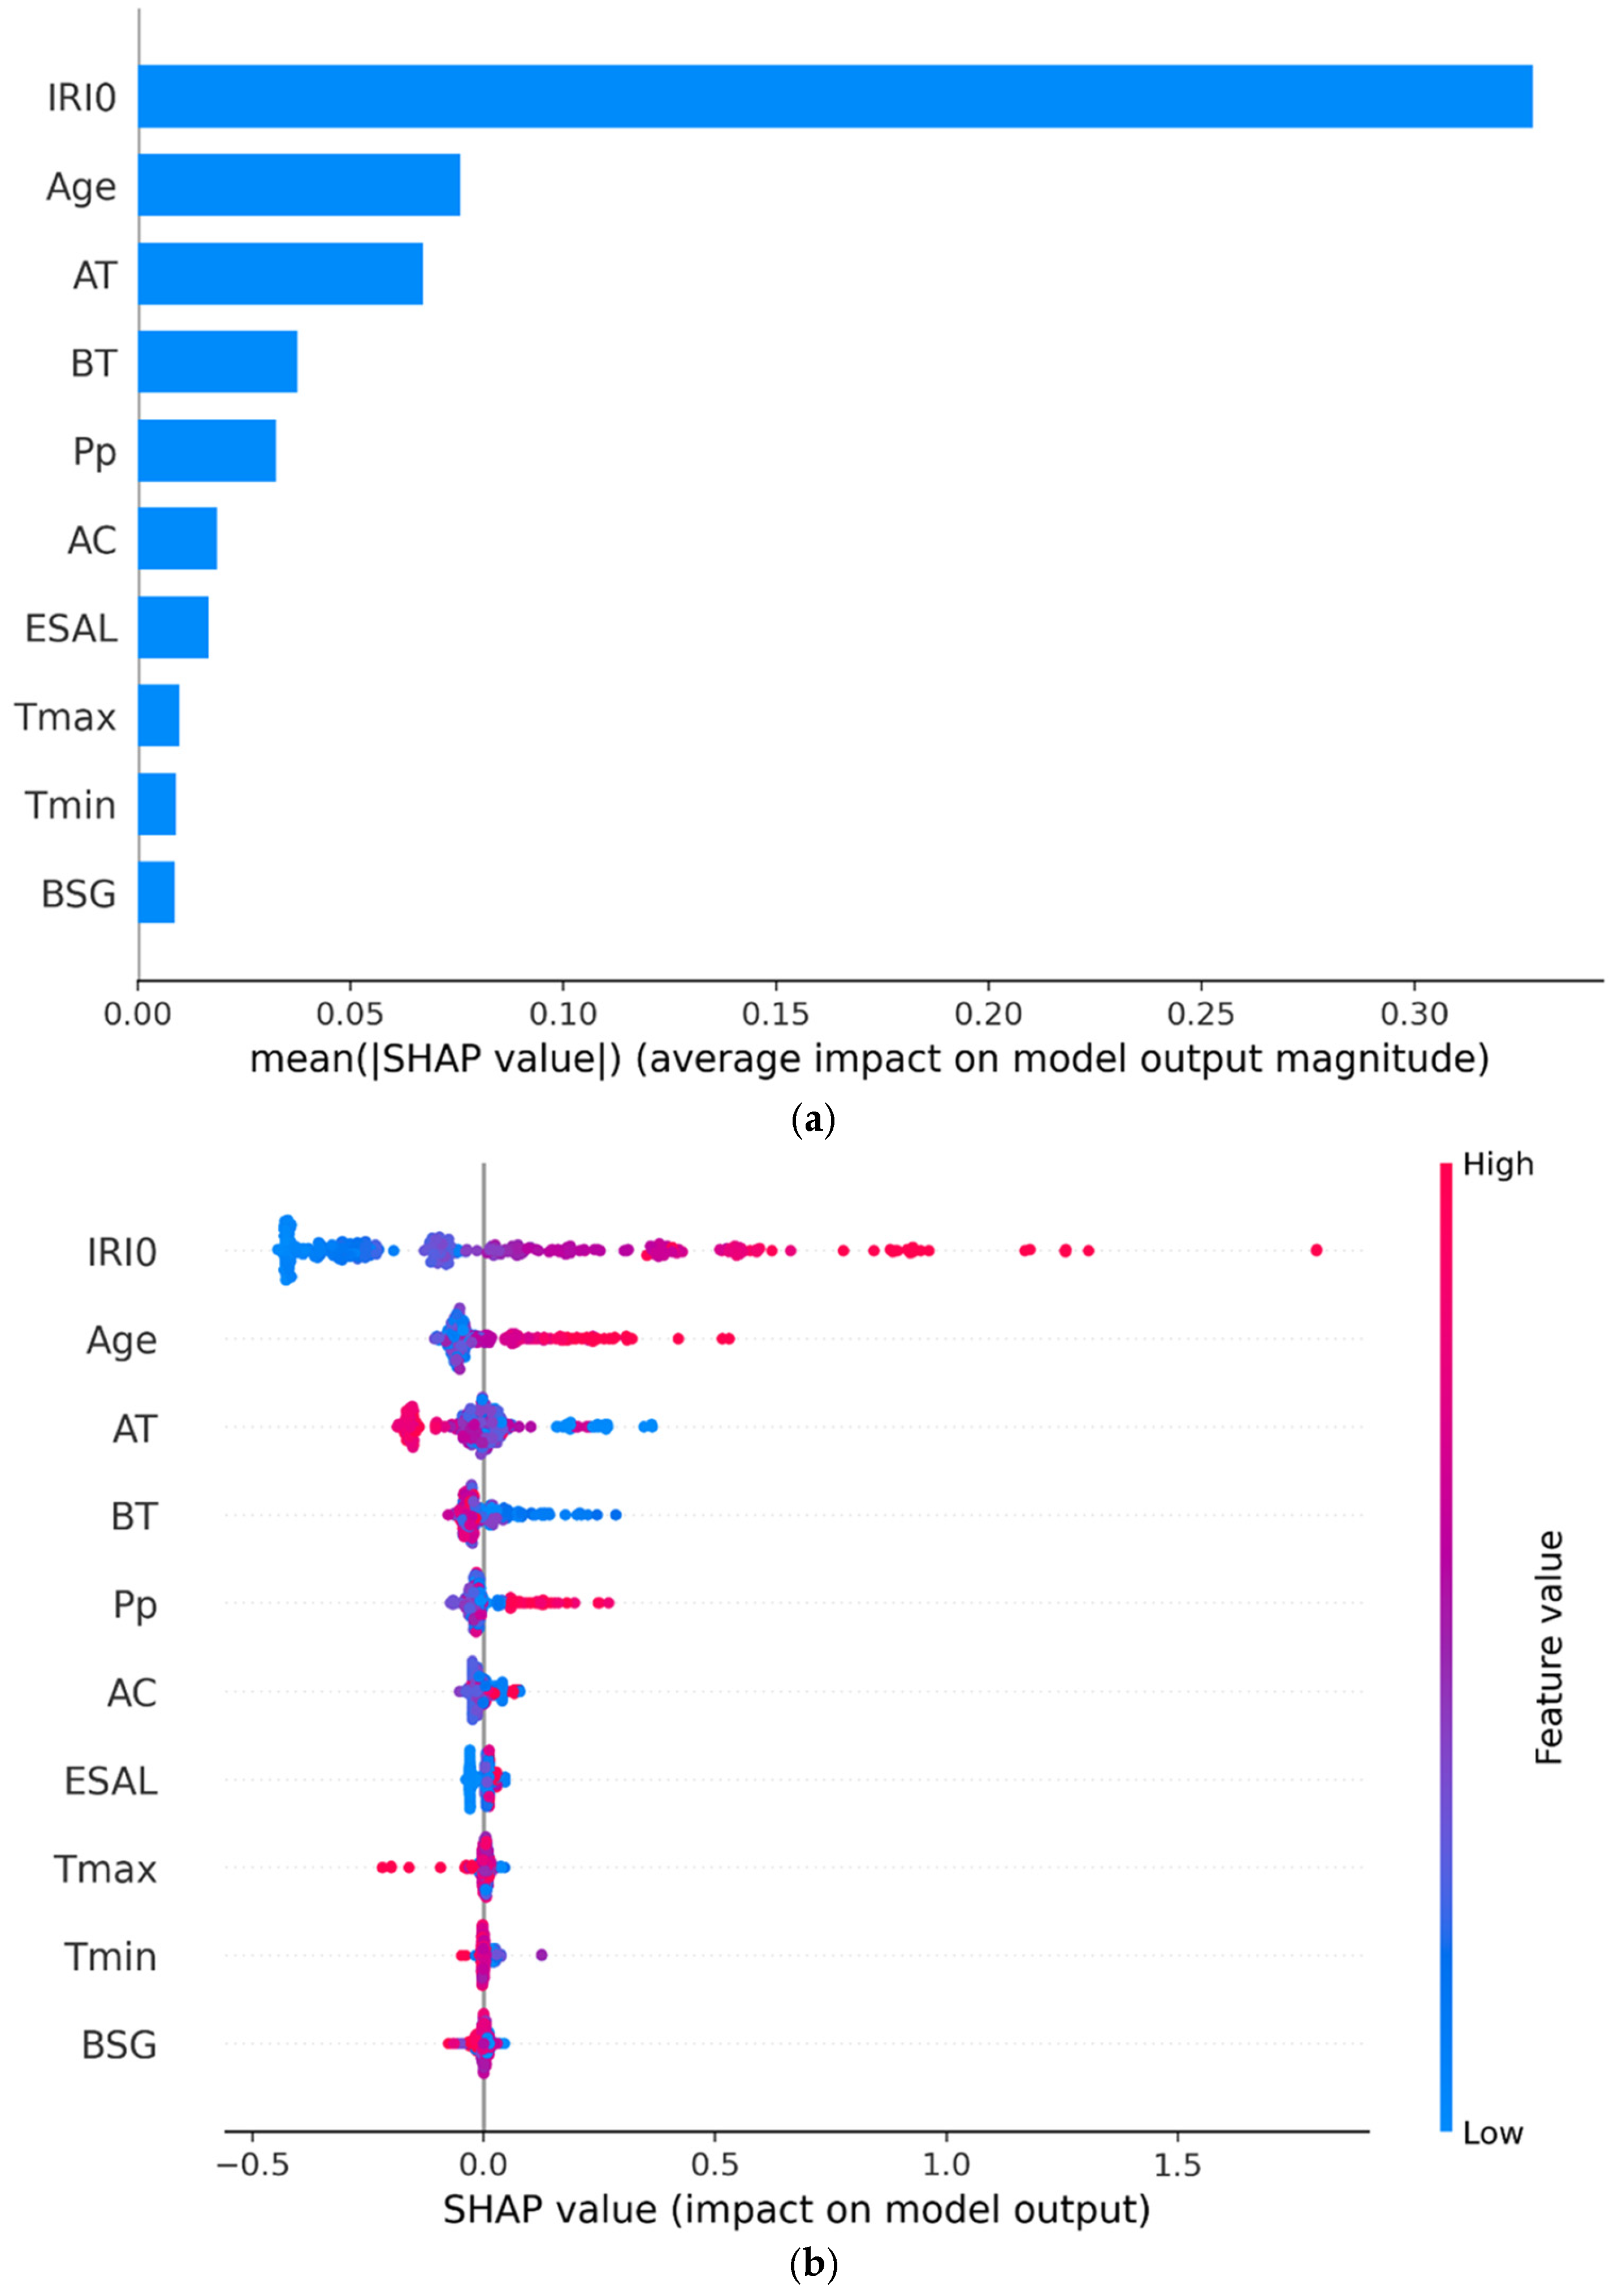
To interpret the machine learning model and better understand how each input feature contributes to the predictions, we used SHAP values, which stand for Shapley Additive Explanations [45]. SHAP values provide a consistent and interpretable measure of feature importance by quantifying the average impact of each feature on the model output. The bar chart in Figure 7a shows the ranked importance of the input variables based on their mean absolute SHAP values. From top to bottom, the most influential feature is the initial IRI value, followed by pavement age, asphalt layer thickness, base layer thickness, and precipitation. This ranking indicates that initial pavement conditions and age are primary drivers of IRI deterioration, while structural and environmental factors also play meaningful roles.
Figure 7b provides a SHAP summary plot that breaks down how individual feature values influence the overall predictions, both in magnitude and direction. Each dot represents a single prediction instance, with its position along the x-axis indicating the impact of that feature (SHAP value) on the predicted IRI. Red dots indicate higher feature values, while blue dots represent lower ones.
From the plot, IRI0 has the strongest influence, with high values (red) consistently pushing the prediction higher, confirming that rougher starting conditions lead to faster pavement deterioration. Age also shows a clear positive effect, indicating older pavements tend to have higher predicted IRI values. This aligns well with engineering knowledge that pavement roughness increases with time. AT and BT exhibit mostly negative SHAP values for higher values, indicating that thicker pavement layers help reduce IRI growth, contributing to better structural performance.
For cold region pavements, several climate-related and structural variables play a distinct role in deterioration behavior. While Tmin appears to have moderate impact in the SHAP plot, its effect in cold regions is often indirect but significant. Lower Tmin values are occasionally associated with higher SHAP values, suggesting that extremely low temperatures may contribute to increased IRI. This is consistent with freeze–thaw cycles, which lead to cracking and surface damage, especially when combined with moisture. Pp (especially in the form of snow and ice) increases moisture infiltration and accelerates base and subgrade weakening when it freezes and thaws. The SHAP plot shows that higher precipitation values (red) generally increase predicted IRI, reinforcing the known vulnerability of cold region pavements to moisture-induced damage.
Other variables like AC, ESAL, and temperature extremes show smaller but still noticeable effects. For instance, lower Tmax occasionally pushes predictions upward, suggesting that extreme heat may not be a dominant factor in this dataset. This plot not only confirms that the model behaves in ways that align with physical understanding but also shows which inputs are most influential in prediction. This level of interpretability is crucial for gaining trust in model outputs and guiding data-driven decisions in pavement management and design.

3.3. Limitations and Recommendations

Despite growing interest in applying probabilistic machine learning models to pavement deterioration prediction, several critical limitations remain that hinder their widespread and reliable application in practice.
One of the primary challenges lies in the strong data dependency of these models. Probabilistic ML approaches, such as NGBoost or Bayesian neural networks, rely heavily on the quality, completeness, and consistency of input data to generate meaningful predictive distributions. However, pavement performance datasets are often plagued by inconsistencies, ranging from differing data collection standards and equipment calibrations to inconsistent labeling and missing values. These issues are amplified in national or multi-regional datasets, where variations in climate, construction practices, and maintenance policies can introduce systematic bias that compromises model generalizability.
Another major limitation is the substantial reduction in usable data when combining multiple variables across time and space. Probabilistic models often require clean and continuous input to estimate uncertainty effectively, but real-world pavement data are frequently sparse, incomplete, or unevenly distributed. As a result, data preprocessing steps such as filtering, imputation, or resampling may reduce the dataset to a size that limits the model’s learning capacity, especially when modeling long-term deterioration trends where continuity and temporal resolution are essential.
Also, limited spatial and temporal coverage remains a persistent issue. In many cases, probabilistic models trained in specific regions or short observation windows fail to perform well when applied to underrepresented conditions or extended forecasting horizons. The resulting uncertainty intervals, while informative, may be unreliable or overly broad in these cases, reducing the practical utility of such models for proactive asset management.
To address the current limitations of probabilistic machine learning models in pavement deterioration modeling, future research should focus on several key areas. First, developing domain-aware probabilistic frameworks that integrate physical principles and empirical deterioration laws can help ground model predictions in engineering reality, improving both accuracy and generalizability. Additionally, enhancing model transferability through region-specific domain adaptation or transfer learning techniques can mitigate the impact of regional data imbalance and enable broader application. We should also pay attention to the missing data problems and the noise associated with it. For instance, dealing with probabilistic imputation and uncertainty-aware training where predictions are reliable in real-world scenarios. Further minimizing bias and enhancing reproducibility can be achieved by standardizing data collection and preprocessing across multiple studies.
Since traditional performance metrics are not sufficient for evaluating probabilistic models, future work should include tools and criteria for assessing the quality of uncertainty estimates, such as sharpness and calibration. Lastly, expanding interpretability techniques to explain not only feature influence but also sources of uncertainty will be essential for building trust and transparency in model outputs.

4. Conclusions

This study presents a novel probabilistic pavement deterioration modeling framework for cold-region asphalt pavements by integrating Bayesian-optimized Natural Gradient Boosting (BO-NGBoost). The proposed approach not only achieves high predictive accuracy but also offers quantifiable uncertainty estimates, enabling a more informed and risk-aware approach to pavement maintenance and rehabilitation planning. The key findings and contributions of this research are summarized below:
(1)
The BO-NGBoost model outperformed traditional machine learning algorithms (ANN, RF, and XGBoost), achieving an R2 of 0.897, RMSE of 0.184, and MAE of 0.107, effectively capturing IRI growth pattern under cold-region climatic conditions.
(2)
Unlike conventional models that provide only point predictions, BO-NGBoost provides probabilistic predictions with uncertainty bounds. These bounds widen with pavement age, capturing the increasing variability in long-term deterioration due to cumulative damage, data variability, and environmental heterogeneity.
(3)
To enhance interpretability, SHAP analysis was employed. It identified initial IRI, pavement age, layer thicknesses, and precipitation as key contributors. Higher initial IRI and older pavement will lead to faster deterioration, while a thicker asphalt layer and base layer can help mitigate it.
(4)
Pavements in cold regions deteriorate rapidly due to freeze–thaw cycles and moisture infiltration. Low temperatures combined with high precipitation accelerate cracking and structural weakening, leading to higher surface roughness over time.
This study pioneers the integration of BO-NGBoost for cold-region pavement deterioration modeling. It shifts the current practice from deterministic to probabilistic prediction by capturing uncertainty and enabling risk-informed decision-making. Practically, the model can provide transportation agencies with a data-driven tool that not only predicts pavement roughness with high accuracy but also provides confidence of those predictions, allowing for more resilient and cost-effective maintenance planning in cold regions. Future work will focus on extending the regional adaptability and validating the model using independent field datasets to further enhance its generalizability.

Author Contributions

Conceptualization, Z.L. and X.G.; methodology, Z.L.; software, Z.L.; validation, Z.L., X.G. and W.W.; formal analysis, Z.L. and X.G.; investigation, Z.L. and W.W.; resources, Z.L.; data curation, Z.L.; writing—original draft preparation, Z.L.; writing—review and editing, Z.L.; visualization, Z.L.; supervision, Z.L. All authors have read and agreed to the published version of the manuscript.

Funding

This research received no external funding.

Data Availability Statement

The data presented in this study are available in LTPP InfoPave at https://infopave.fhwa.dot.gov (accessed on 10 July 2025).

Conflicts of Interest

The authors declare no conflicts of interest.

References

  1. de Abreu, V.H.S.; Santos, A.S.; Monteiro, T.G.M. Climate Change Impacts on the Road Transport Infrastructure: A Systematic Review on Adaptation Measures. Sustainability 2022, 14, 8864. [Google Scholar] [CrossRef]
  2. Doll, C.; Trinks, C.; Sedlacek, N.; Pelikan, V.; Comes, T.; Schultmann, F. Adapting rail and road networks to weather extremes: Case studies for southern Germany and Austria. Nat. Hazards 2014, 72, 63–85. [Google Scholar] [CrossRef]
  3. Cui, B.; Wang, H. Predicting Asphalt Pavement Deterioration Under Climate Change Uncertainty Using Bayesian Neural Network. IEEE Trans. Intell. Transp. Syst. 2025, 26, 785–797. [Google Scholar] [CrossRef]
  4. Vignisdottir, H.R.; Ebrahimi, B.; Booto, G.K.; O’Born, R.; Brattebø, H.; Wallbaum, H.; Bohne, R.A. A review of environmental impacts of winter road maintenance. Cold Reg. Sci. Technol. 2019, 158, 143–153. [Google Scholar] [CrossRef]
  5. Hinkka, V.; Pilli-Sihvola, E.; Mantsinen, H.; Leviäkangas, P.; Aapaoja, A.; Hautala, R. Integrated winter road maintenance management—New directions for cold regions research. Cold Reg. Sci. Technol. 2016, 121, 108–117. [Google Scholar] [CrossRef]
  6. Cui, B.; Gu, X.; Hu, D.; Dong, Q. A multiphysics evaluation of the rejuvenator effects on aged asphalt using molecular dynamics simulations. J. Clean. Prod. 2020, 259, 120629. [Google Scholar] [CrossRef]
  7. Mills, L.N.O.; Attoh-Okine, N.O.; McNeil, S. Developing Pavement Performance Models for Delaware. Transp. Res. Rec. 2012, 2304, 97–103. [Google Scholar] [CrossRef]
  8. Morehouse, T.A. The 1962 Highway Act: A study in artful interpretation. J. Am. Inst. Plan. 1969, 35, 160–168. [Google Scholar] [CrossRef]
  9. Hajek, J.J.; Bradbury, A. Pavement Performance Modeling Using Canadian Strategic Highway Research Program Bayesian Statistical Methodology. Transp. Res. Rec. 1996, 1524, 160–170. [Google Scholar] [CrossRef]
  10. Li, N.; Haas, R.; Xie, W.C. Development of a new asphalt pavement performance prediction model. Can. J. Civ. Eng. 1997, 24, 547–559. [Google Scholar] [CrossRef]
  11. Heidari, M.J.; Najafi, A.; Alavi, S. Pavement deterioration modeling for forest roads based on logistic regression and artificial neural networks. Croat. J. For. Eng. J. Theory Appl. For. Eng. 2018, 39, 271–287. [Google Scholar]
  12. Liu, Z.; Shen, S.; Yu, S.; Jahangiri, B.; Mensching, D.J.; Haghshenas, H.F. Development of field compaction curves for asphalt mixtures based on laboratory workability tests and machine learning modeling. Constr. Build. Mater. 2025, 479, 141520. [Google Scholar] [CrossRef]
  13. Piryonesi, S.M.; El-Diraby, T.E. Using Machine Learning to Examine Impact of Type of Performance Indicator on Flexible Pavement Deterioration Modeling. J. Infrastruct. Syst. 2021, 27, 04021005. [Google Scholar] [CrossRef]
  14. Choi, S.; Do, M. Development of the Road Pavement Deterioration Model Based on the Deep Learning Method. Electronics 2020, 9, 3. [Google Scholar] [CrossRef]
  15. Liu, Z.; Wang, S.; Gu, X.; Dong, Q. Non-destructive testing and intelligent evaluation of road structural conditions using GPR and FWD. J. Traffic Transp. Eng. 2025, 12, 462–476. [Google Scholar] [CrossRef]
  16. Kaloop, M.R.; El-Badawy, S.M.; Hu, J.W.; Abd El-Hakim, R.T. International Roughness Index prediction for flexible pavements using novel machine learning techniques. Eng. Appl. Artif. Intell. 2023, 122, 106007. [Google Scholar] [CrossRef]
  17. Pérez-Acebo, H.; Isasa, M.; Gurrutxaga, I.; García, H.; Insausti, A. International Roughness Index (IRI) prediction models for freeways. Transp. Res. Procedia 2023, 71, 292–299. [Google Scholar] [CrossRef]
  18. Elhadidy, A.A.; El-Badawy, S.M.; Elbeltagi, E.E. A simplified pavement condition index regression model for pavement evaluation. Int. J. Pavement Eng. 2021, 22, 643–652. [Google Scholar] [CrossRef]
  19. Luo, X.; Wang, F.; Bhandari, S.; Wang, N.; Qiu, X. Effectiveness evaluation and influencing factor analysis of pavement seal coat treatments using random forests. Constr. Build. Mater. 2021, 282, 122688. [Google Scholar] [CrossRef]
  20. Guo, R.; Fu, D.; Sollazzo, G. An ensemble learning model for asphalt pavement performance prediction based on gradient boosting decision tree. Int. J. Pavement Eng. 2022, 23, 3633–3646. [Google Scholar] [CrossRef]
  21. Wang, C.; Xiao, W.; Liu, J. Developing an improved extreme gradient boosting model for predicting the international roughness index of rigid pavement. Constr. Build. Mater. 2023, 408, 133523. [Google Scholar] [CrossRef]
  22. Liu, Z.; Gu, X.; Chen, J.; Wang, D.; Chen, Y.; Wang, L. Automatic recognition of pavement cracks from combined GPR B-scan and C-scan images using multiscale feature fusion deep neural networks. Autom. Constr. 2023, 146, 104698. [Google Scholar] [CrossRef]
  23. Deng, Y.; Shi, X. Short-Term Predictions of Asphalt Pavement Rutting Using Deep-Learning Models. J. Transp. Eng. Part B Pavements 2024, 150, 04024004. [Google Scholar] [CrossRef]
  24. Yamany, M.S.; Abraham, D.M. Hybrid Approach to Incorporate Preventive Maintenance Effectiveness into Probabilistic Pavement Performance Models. J. Transp. Eng. Part B Pavements 2021, 147, 04020077. [Google Scholar] [CrossRef]
  25. Xiao, F.; Chen, X.; Cheng, J.; Yang, S.; Ma, Y. Establishment of probabilistic prediction models for pavement deterioration based on Bayesian neural network. Int. J. Pavement Eng. 2023, 24, 2076854. [Google Scholar] [CrossRef]
  26. Nicolosi, V.; Augeri, M.; D’Apuzzo, M.; Evangelisti, A.; Santilli, D. A Probabilistic Approach to the Evaluation of Seismic Resilience in Road Asset Management. Int. J. Disaster Risk Sci. 2022, 13, 114–124. [Google Scholar] [CrossRef]
  27. Alnaqbi, A.J.; Zeiada, W.; Al-Khateeb, G.; Abttan, A.; Abuzwidah, M. Predictive models for flexible pavement fatigue cracking based on machine learning. Transp. Eng. 2024, 16, 100243. [Google Scholar] [CrossRef]
  28. Liu, Z.; Wang, S.; Gu, X.; Wang, D.; Dong, Q.; Cui, B. Intelligent Assessment of Pavement Structural Conditions: A Novel FeMViT Classification Network for GPR Images. IEEE Trans. Intell. Transp. Syst. 2024, 25, 13511–13523. [Google Scholar] [CrossRef]
  29. Duan, T.; Anand, A.; Ding, D.Y.; Thai, K.K.; Basu, S.; Ng, A.; Schuler, A. Ngboost: Natural gradient boosting for probabilistic prediction. In Proceedings of the International Conference on Machine Learning, Online, 13–18 July 2020; Curran Associates, Inc.: Red Hook, NY, USA, 2021; pp. 2690–2700. [Google Scholar]
  30. Chen, S.-Z.; Feng, D.-C.; Wang, W.-J.; Taciroglu, E. Probabilistic Machine-Learning Methods for Performance Prediction of Structure and Infrastructures through Natural Gradient Boosting. J. Struct. Eng. 2022, 148, 04022096. [Google Scholar] [CrossRef]
  31. Zhou, Z.; Cao, J.; Shi, X.; Zhang, W.; Huang, W. Probabilistic rutting model using NGBoost and SHAP: Incorporating other performance indicators. Constr. Build. Mater. 2024, 438, 137052. [Google Scholar] [CrossRef]
  32. Mei, Y.; Sun, Y.; Li, F.; Xu, X.; Zhang, A.; Shen, J. Probabilistic prediction model of steel to concrete bond failure under high temperature by machine learning. Eng. Fail. Anal. 2022, 142, 106786. [Google Scholar] [CrossRef]
  33. Chen, Y.; Khandelwal, M.; Onifade, M.; Zhou, J.; Ismail Lawal, A.; Oluwaseyi Bada, S.; Genc, B. Predicting the hardgrove grindability index using interpretable decision tree-based machine learning models. Fuel 2025, 384, 133953. [Google Scholar] [CrossRef]
  34. Shekhar, S.; Bansode, A.; Salim, A. A comparative study of hyper-parameter optimization tools. In Proceedings of the 2021 IEEE Asia-Pacific Conference on Computer Science and Data Engineering (CSDE), Brisbane, Australia, 8–10 December 2021; pp. 1–6. [Google Scholar]
  35. Watanabe, S. Tree-structured parzen estimator: Understanding its algorithm components and their roles for better empirical performance. arXiv 2023, arXiv:2304.11127. [Google Scholar] [CrossRef]
  36. Li, M.; Dai, Q.; Su, P.; You, Z.; Ma, Y. Surface layer modulus prediction of asphalt pavement based on LTPP database and machine learning for Mechanical-Empirical rehabilitation design applications. Constr. Build. Mater. 2022, 344, 128303. [Google Scholar] [CrossRef]
  37. Cui, B.; Wang, H. Oxidative aging mechanism of asphalt binder using experiment-derived average molecular model and ReaxFF molecular dynamics simulation. Fuel 2023, 345, 128192. [Google Scholar] [CrossRef]
  38. Cui, B.; Wang, H. Compatibility analysis of waste polymer recycling in asphalt binder using molecular descriptor and graph neural network. Resour. Conserv. Recycl. 2025, 212, 107950. [Google Scholar] [CrossRef]
  39. Cui, B.; Wang, H. Molecular modeling of asphalt-aggregate debonding potential under moisture environment and interface defect. Appl. Surf. Sci. 2022, 606, 154858. [Google Scholar] [CrossRef]
  40. Labi, S. Introduction to Civil Engineering Systems: A Systems Perspective to the Development of Civil Engineering Facilities; John Wiley & Sons: Hoboken, NJ, USA, 2014. [Google Scholar]
  41. Little, R.J.; Rubin, D.B. Statistical Analysis with Missing Data; John Wiley & Sons: Hoboken, NJ, USA, 2019. [Google Scholar]
  42. Gong, H.; Sun, Y.; Shu, X.; Huang, B. Use of random forests regression for predicting IRI of asphalt pavements. Constr. Build. Mater. 2018, 189, 890–897. [Google Scholar] [CrossRef]
  43. Sharma, A.; Sachdeva, S.N.; Aggarwal, P. Predicting IRI Using Machine Learning Techniques. Int. J. Pavement Res. Technol. 2023, 16, 128–137. [Google Scholar] [CrossRef]
  44. Zhang, T.; Smith, A.; Zhai, H.; Lu, Y. LSTM+MA: A Time-Series Model for Predicting Pavement IRI. Infrastructures 2025, 10, 10. [Google Scholar] [CrossRef]
  45. Nohara, Y.; Matsumoto, K.; Soejima, H.; Nakashima, N. Explanation of machine learning models using improved shapley additive explanation. Comput. Methods Programs Biomed. 2022, 214, 106584. [Google Scholar] [CrossRef]
Figure 1. The process of constructing the deterioration modeling.
Infrastructures 10 00212 g001
Figure 2. Architecture of BO-NGBoost.
Infrastructures 10 00212 g002
Figure 3. Correlation matrix between all input variables.
Infrastructures 10 00212 g003
Figure 4. Visualization of all input variables distributions used in this case study.
Infrastructures 10 00212 g004aInfrastructures 10 00212 g004b
Figure 5. Prediction performance of XGBoost model.
Infrastructures 10 00212 g005
Figure 6. Prediction performance of BO-NGBoost model (a) predicted vs. true values on test data; (b) predicted IRI deterioration curve.
Infrastructures 10 00212 g006
Figure 7. Interpretation of machine learning models using SHAP values (a) average impact of model output magnitude; (b) beeswarm plot of impact on model output.
Infrastructures 10 00212 g007
Table 1. Summary of data collected from LTPP database.
CategoryLabelVariablesDescriptions
ClimateTmaxMaximum temperature (°C)The maximum air temperature
TminMinimum temperature (°C)The minimum air temperature
PpPrecipitation (mm)Annual water equivalent of total surface precipitation for each inspection year
StructureATThickness of AC layer (inch)Representative thickness for AC layer in a section
BTThickness of base layer (inch)Representative thickness for unbound base layer in a section
MaterialACAverage Asphalt Content (%)Mean asphalt content (% by weight of total mixture)
BSGBulk specific gravityBulk specific gravity of the asphalt bound layer
TrafficESALAnnual generic equivalent single axle loadEstimated annual truck generic equivalent single axle load
ConstructionIRI0Initial IRI (m/km)Initial IRI after first installation
AgeAge (year)Pavement age (year)
Output IRIMeasured IRI (m/km)Measured IRI value at inspection year
Table 2. Comparison of different ML performance on this dataset.
CategoryML ModelR2testRMSEMAE
Deterministic modelANN0.8470.3150.132
Random Forest0.8640.2110.118
XGBoost0.8700.2070.116
Probabilistic modelBO-NGBoost0.8970.1840.107
Table 3. Comparison of IRI prediction models using different machine learning methods.
StudyDatasetModelStrengths and Limitations
This study
  • LTPP database (5692 samples)
  • Cold climate regions
  • Inputs: structure, material, traffic, age, IRI0, climate
BO-NGBoost (R2test = 0.897)
  • Can quantify uncertainty
  • Good model interpretability
  • Do not consider effects of maintenance activities
Gong et al. [42]
  • LTPP database (11,715 samples)
  • Inputs: structure, pavement distress, IRI0, age, traffic, climate
Random forest (R2test = 0.974)
  • High accuracy
  • Good model interpretability
  • Need various types of distress data as inputs
  • Cannot quantify uncertainty
Choi and Do [14]
  • Korean National Highway (1880 samples)
  • Inputs: traffic, deicing agent, climate, equipment
Recurrent neural network (R2test = 0.873)
  • Time-series prediction for crack, rutting depth, and IRI
  • Do not consider variables related to pavement structure and maintenance
  • Cannot quantify uncertainty
Sharma, A. et al. [43]
  • LTPP database (211 sections)
  • Warm climate regions
  • Inputs: structure, cracking, age, IRI0, traffic, climate
Gradient boosting machine (R2test = 0.866)
  • Good model interpretability
  • Need cracking data as inputs
  • Cannot quantify uncertainty
Zhang et al. [44]
  • LTPP database (25,167 samples)
  • Inputs: traffic, maintenance, IRI0, Age, pavement distress, climate
Long short-term memory (R2test = 0.965)
  • Time-series prediction
  • High accuracy
  • Lack model interpretability
  • Cannot quantify uncertainty
Disclaimer/Publisher’s Note: The statements, opinions and data contained in all publications are solely those of the individual author(s) and contributor(s) and not of MDPI and/or the editor(s). MDPI and/or the editor(s) disclaim responsibility for any injury to people or property resulting from any ideas, methods, instructions or products referred to in the content.