1. Introduction
With the development of tunnel construction engineering technology, extra-long tunnels have been widely applied in highway transportation systems [
1,
2,
3]. As an important component of the overall design of extra-long highway tunnels, the tunnel ventilation system generally adopts the longitudinal ventilation mode with air shafts for supply and exhaust when the total tunnel length exceeds 5000 m [
4]. As a key facility connecting the tunnel and the ventilation shaft, the connecting channel has been the subject of extensive research by relevant scholars. This is aimed at reducing the impact of connecting channel construction on the tunnel and surrounding strata, ensuring construction safety, and improving construction efficiency.
When the geological conditions are favorable, the connection channel is mostly excavated using the drill-blast method. With the characteristics of simple construction and strong adaptability, the drill-blast method has been widely applied in such fields as underground mineral mining and rock tunnel excavation [
5,
6,
7,
8]. Yang et al. [
9] optimized the blasting construction scheme and analyzed the impact of different blasting positions on the tunnel in response to the adverse effects of Connection Channel blasting construction on the tunnel structure. Bai et al. [
10] used FLAC3D and DEM methods, respectively, to simulate the tunnel blasting excavation process and evaluated the high-risk construction sections of the tunnel. Xie et al. [
11] carried out phase space reconstruction on the vibration response time series of existing tunnels under the influence of different blasting actions based on chaos theory and analyzed the chaotic characteristics of tunnel blasting vibration response signals. Zhou et al. [
12] conducted extensive investigations into the statistical data of working face collapse accidents in rock tunnels using the drill-blast method from the literature, providing new theoretical foundations and technical means for safety risk analysis and control in rock tunnel construction. However, most existing studies on drilling and blasting excavation directly apply the blasting parameters of the main tunnel, ignoring the unique structural characteristics of connecting tunnels, such as “small cross-section, large curvature, and strong constraint”. This leads to deviations of designs (including charge amount and hole network parameters) from actual needs. Meanwhile, on-site blasting monitoring data are mostly used to verify model results and rarely used for dynamically revising blasting parameters, resulting in insufficient practicality of optimization schemes.
In addition, the drill-blast excavation methods for tunnels and connection channels can also be divided into full-face excavation, bench method excavation, etc. [
13,
14,
15,
16], and the connection channel causes significant disturbance to the surrounding strata during the excavation process. To minimize the impact of the construction process on adjacent buildings and the ground surface of the strata, relevant scholars have carried out extensive research on the stability of surrounding rock [
17,
18,
19] and on this basis, conducted studies on the optimization of construction parameters for tunnels and connection channels: Zhou et al. [
20] optimized the slurry ratio for freezing hole drilling under water-rich sandy cobble strata conditions using single-factor tests and orthogonal tests. He et al. [
21,
22] analyzed the impact of different construction parameters on the construction process based on indoor tunneling tests. Xie et al. [
23], taking practical projects as examples, carried out optimization analysis of construction parameters using FLAC3D software (FLAC3D version 5.0.)through test correlation and field monitoring results. Wei et al. [
24] established the correlation between tunneling construction parameters and soil displacement and further revealed the influence of the construction process on the development law of soil displacement. But existing studies on construction parameters of connecting tunnels mainly focus on the shield tunnel field, and there is basically no systematic analysis on construction parameters of connecting tunnels in extra-long highway tunnels. Therefore, relevant personnel mainly rely on empirical methods for parameter design in the construction of complex connecting tunnels in extra-long highway tunnels, which makes it difficult to guarantee engineering quality and results in relatively low construction efficiency.
In summary, existing scholars’ research on the control of construction parameters for tunnels and connecting tunnels is relatively limited in scope. Meanwhile, there are few studies on the construction parameters of highway connecting tunnels [
25,
26,
27], and the influence characteristics of connecting tunnel construction parameters on surrounding strata and existing structures have not been systematically analyzed. Relevant research results and conclusions have limited guiding significance for construction projects involving complex connecting tunnels in extra-long highway tunnels. Based on existing research, this paper investigates the impact of different construction parameter controls on existing main tunnels during the construction of connecting tunnels through methods such as on-site monitoring and numerical simulation. It conducts in-depth analysis on the excavation step and blasting parameters of connecting tunnels, optimizes construction excavation methods and schemes, and thus achieves the safe and efficient construction of connecting tunnels between extra-long highway tunnels and complex air shaft systems.
2. General Description of the Project
2.1. Project Background
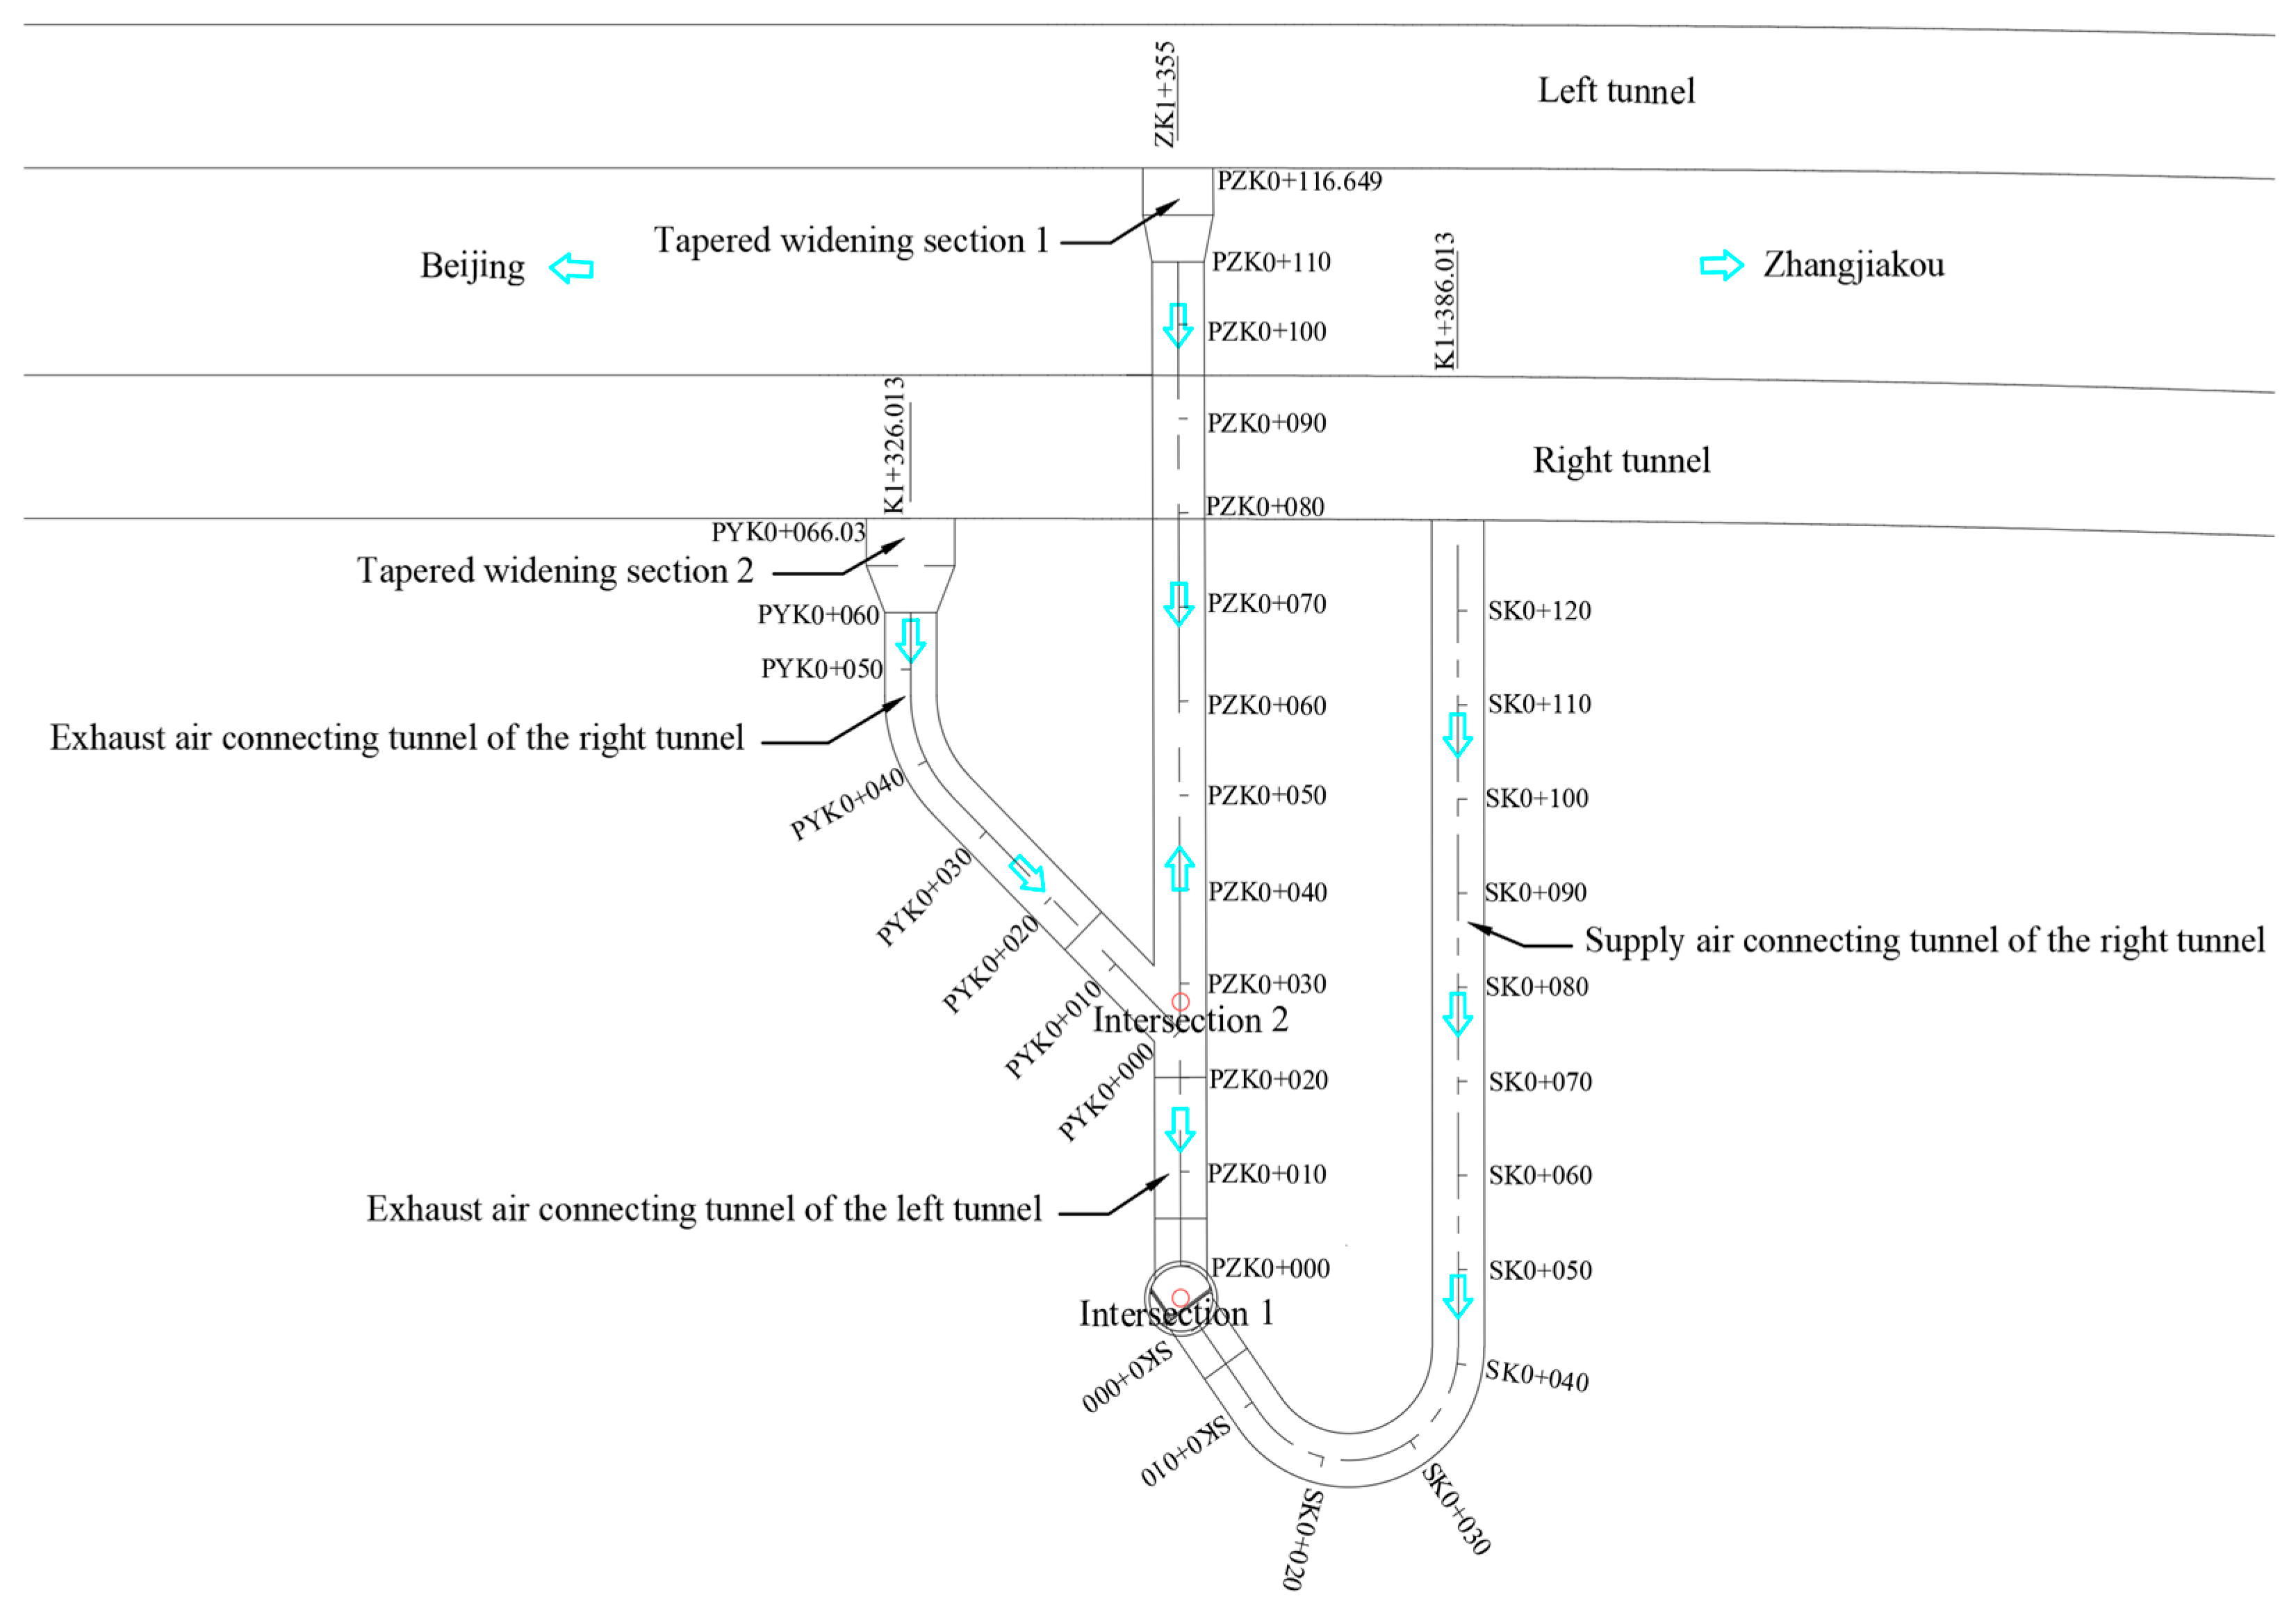
This project is based on the Xiaolongmen Extra-long Tunnel of the Beijing–Zhangjiakou Expressway in China. The tunnel has a total length of 6.4 km and adopts a longitudinal segmented ventilation design. To meet the requirements of tunnel ventilation and smoke exhaust under fire emergency conditions, a ventilation shaft needs to be set up at about 95 m to the right of K1+362.013 in the right tunnel. Underground supply and exhaust air connecting tunnels should be constructed to connect with the main tunnel. The right tunnel is equipped with one supply air duct and one exhaust air duct, respectively, while the left tunnel is only provided with an exhaust air duct. The positional relationship of relevant underground facilities is shown in
Figure 1. The total length of the underground supply and exhaust air connecting tunnels connecting with the main tunnel is 312.323 m. The underground connecting tunnel has 2 intersections and 2 transition widening sections. Since the connecting tunnel cannot be constructed in parallel, the construction period is long, and the construction technology and procedures are complex.
To shorten the construction period, the construction plan on site specifies that the main tunnel and the ventilation shaft should be excavated simultaneously first. After the construction of the main tunnel is completed, the lining support at the corresponding position inside the main tunnel will be dismantled for the construction of connecting tunnels. Specifically, the exhaust and supply air connecting tunnels of the right tunnel will be constructed simultaneously first. After the excavation of the right tunnel’s exhaust air connecting tunnel is completed, the excavation of the left tunnel’s exhaust air connecting tunnel will be carried out from both ends of Intersection 2. Therefore, the construction process of connecting tunnels has a significant impact on stratum disturbance and the main tunnel. Furthermore, during the construction of the left tunnel’s exhaust air connecting tunnel, it needs to cross above the right tunnel with a minimum clear distance of only about 5 m. The disturbance control of the main tunnel lining during the construction of the overcrossing section is also a key technical challenge in this project.
2.2. Field Monitoring Deployment
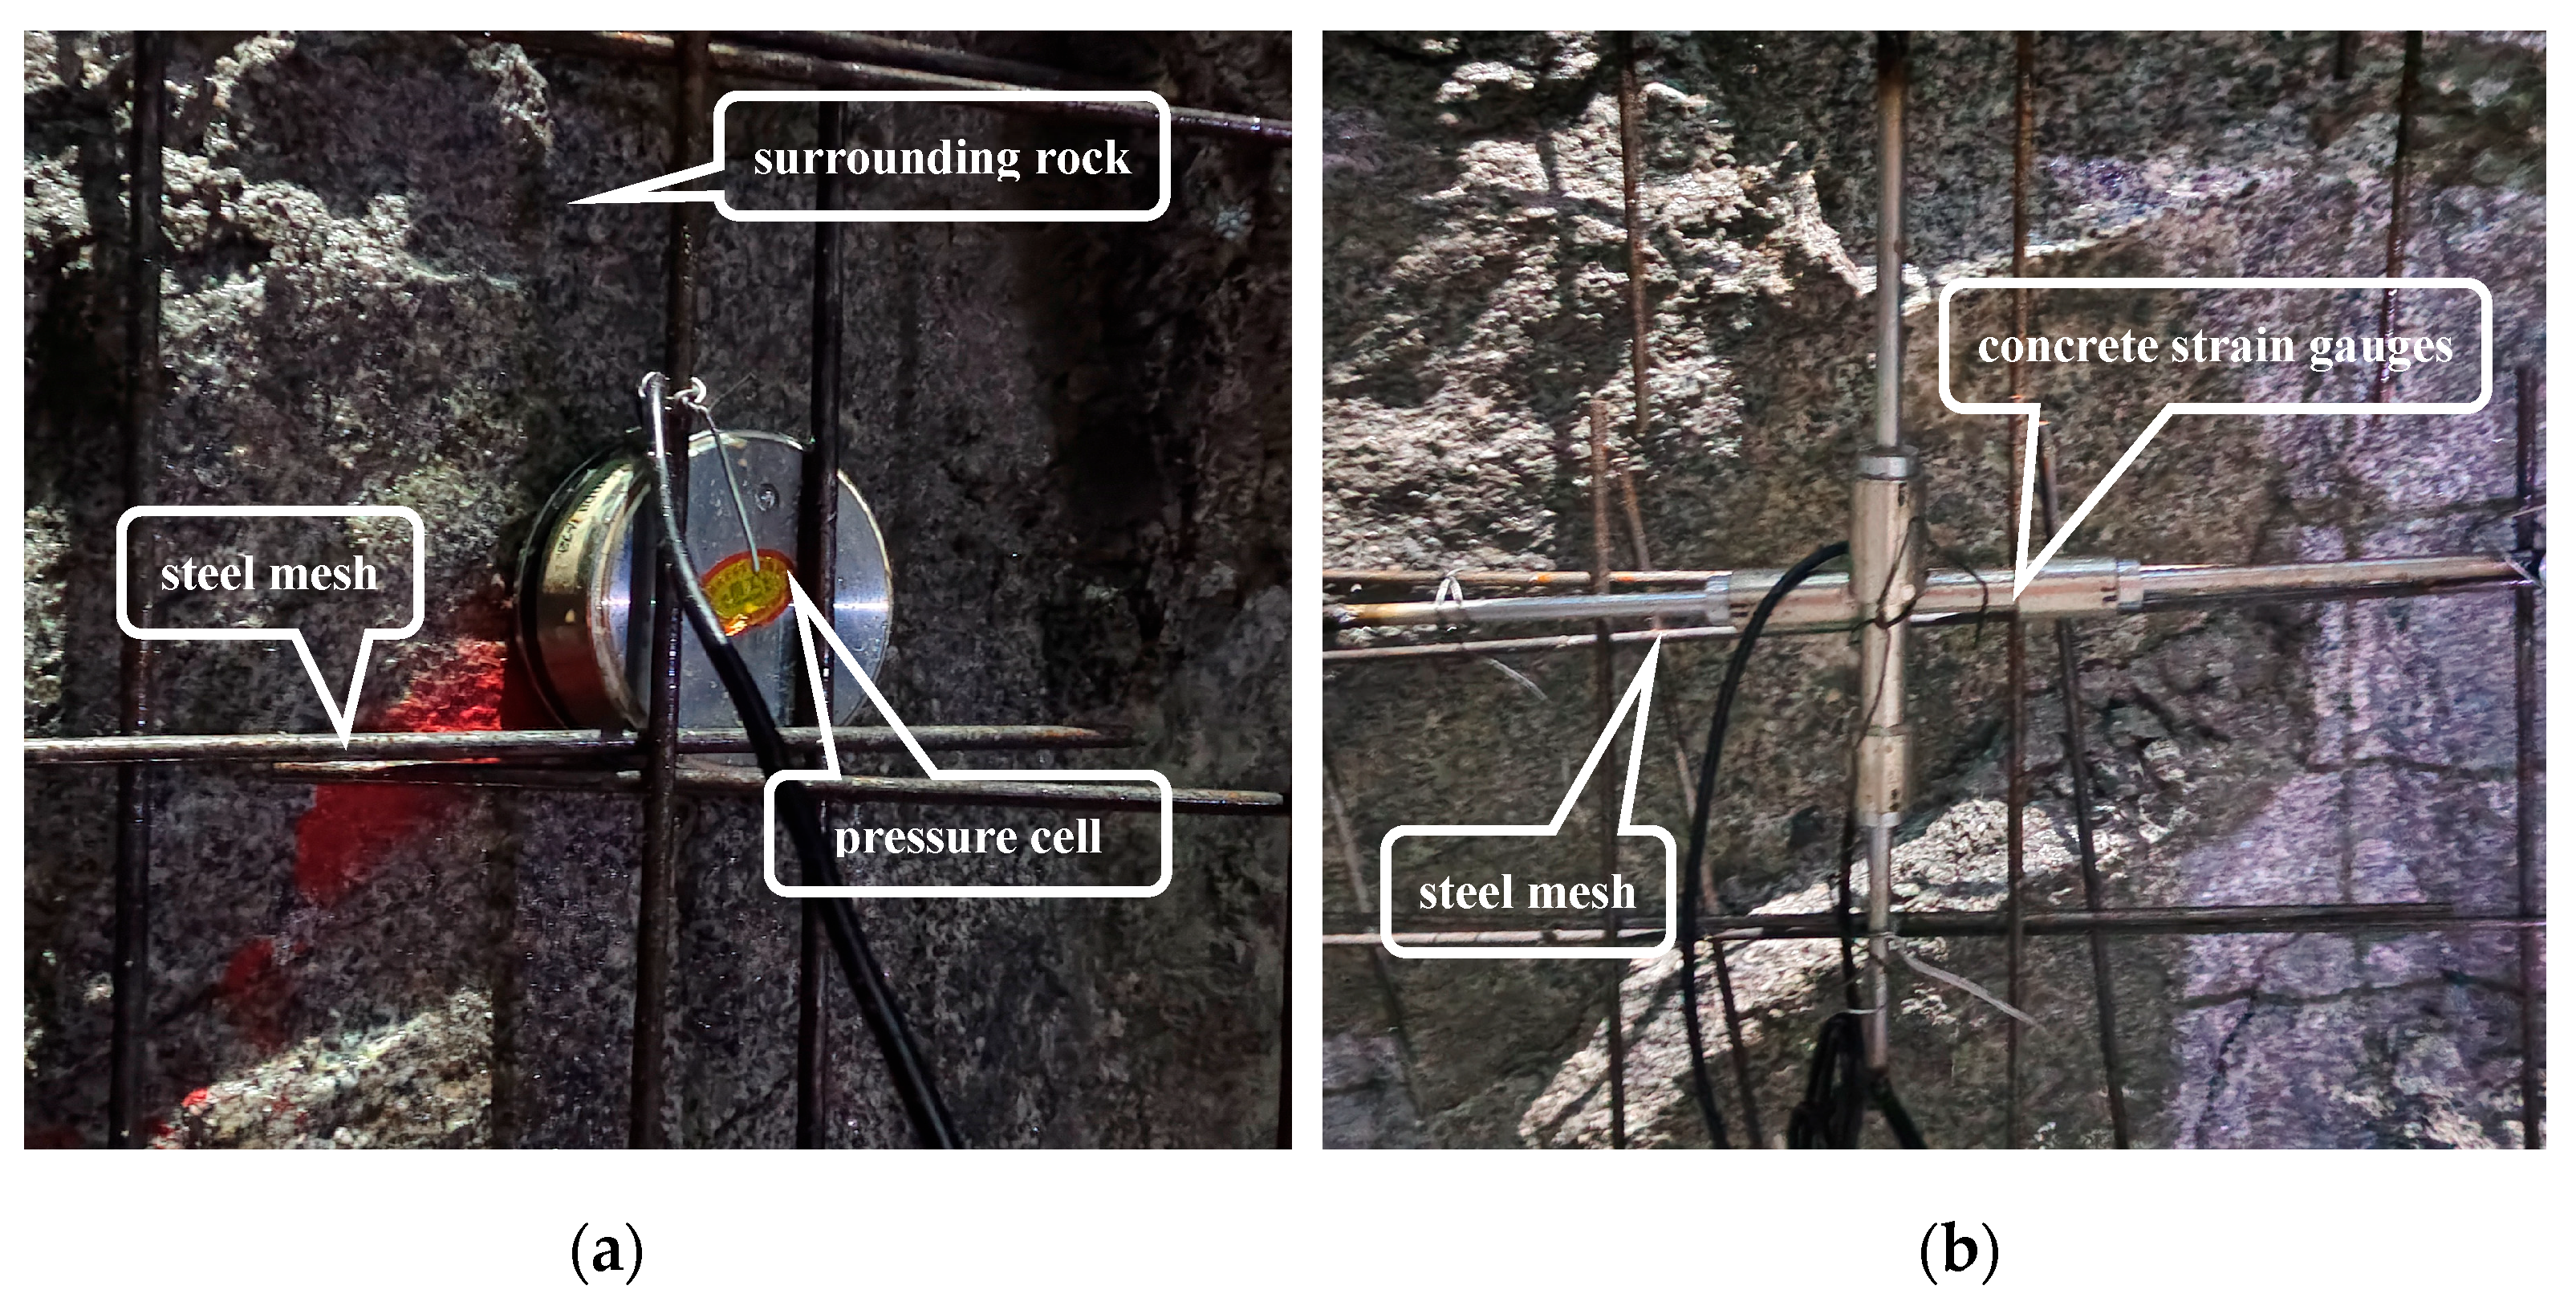
To ensure construction safety, the stress variation in the surrounding rock around the connecting tunnels and concrete strain should be monitored during the construction. One test section is, respectively, selected in the exhaust air connecting tunnel and supply air connecting tunnel of the right tunnel, namely the right exhaust test section and right supply test section. The mileage post of the right exhaust test section is PYK0+060, as shown in
Figure 2a. A total of seven measuring points are selected in this section, with an interval of 25 degrees between adjacent points. Each measuring point is equipped with one double membrane pressure cell and two concrete strain gauges, which are used to monitor the stress variation in the surrounding rock of the connecting tunnel and the strain of the primary lining concrete, respectively. The mileage post of the right supply test section is SK0+120. Similarly, seven measuring points are selected with an interval of 20° between adjacent points. The installation rules for double membrane pressure cells and concrete strain gauges are the same as those for the previously described test section (as shown in
Figure 2b). As shown in
Figure 3, the double membrane pressure cells are tightly attached to the surrounding rock and fixed with steel brackets to monitor the rock pressure. The concrete strain gauges are arranged in a cross shape and fixed on the steel reinforcement mesh to monitor the concrete strain in different directions. The measuring range of the pressure cells used is 1.5 MPa, and the tensile and compressive strain ranges of the concrete strain gauges are 1200 με and 800 με, respectively.
2.3. Mechanical Properties Test of Granite
According to the engineering geological survey and drilling results, the lithology of the stratum where the main tunnel and each exhaust air connecting tunnel are located is mainly Yanshanian granodiorite. This rock stratum has a medium-coarse-grained structure and massive tectonics, with well-developed joint fissures. Its main components are feldspar, quartz, and hornblende. The core is columnar or long columnar, with joint lengths of 15–30 cm and a maximum length of about 50 cm, locally fragmented. The characteristic value of stratum bearing capacity is fa0 = 1800 kPa, the surrounding rock grade is Grade III, and the surrounding rock has good stability. Furthermore, the connecting tunnel is located at a stratum depth of approximately 400 m, with the lateral pressure coefficient K0 usually ranging from 0.5 to 2.0, and the surrounding rock pressure of the stratum around the connecting tunnel being approximately 8–15 MPa.
To analyze the failure modes of the surrounding rock during the excavation of the connecting tunnel, a granite triaxial compression test was conducted (as shown in
Figure 4). The relevant test results can also provide a theoretical basis for subsequent numerical modeling. After drilling and sampling rock layers at the construction site, standard cylindrical granite specimens with a height of 100 mm and a diameter of 50 mm were prepared. After the test, relevant data were extracted to plot the stress–strain curves of the granite specimens under indoor triaxial compression tests. Based on the test results, the specimen mainly exhibited elastic deformation before compressive yielding, and its yield strength was close to the ultimate strength. When the confining pressure was within 5 MPa, the specimen showed a brief steep stress drop immediately after reaching the ultimate strength, indicating brittle failure at this stage. Thereafter, the stress–strain curve changed in a gentler trend until another steep stress drop occurred, leading to complete failure. When the confining pressure is above 7.5 MPa, the specimen does not exhibit a particularly significant steep stress drop after reaching the ultimate strength. The stress–strain curve changes gently, and the specimen gradually softens. In this project, the stratum where the main tunnel and connecting tunnels are located is relatively deep, with a large surrounding confining pressure (above 10 MPa). When the confining pressure is greater than 10 MPa, the yield strength of the surrounding rock should be greater than 240 MPa, indicating good stability of the surrounding rock.
4. Optimization of Construction Sequence Parameters
4.1. Optimization of Excavation Step Distance for Section Excavation
To explore the optimal excavation step distance during construction, three step distances of 2 m, 3 m, and 4 m were set based on the on-site construction design for numerical simulation analysis. The simulated excavation sequence of the connecting tunnels is consistent with the actual construction. The right exhaust test section and right supply test section were selected as representative sections.
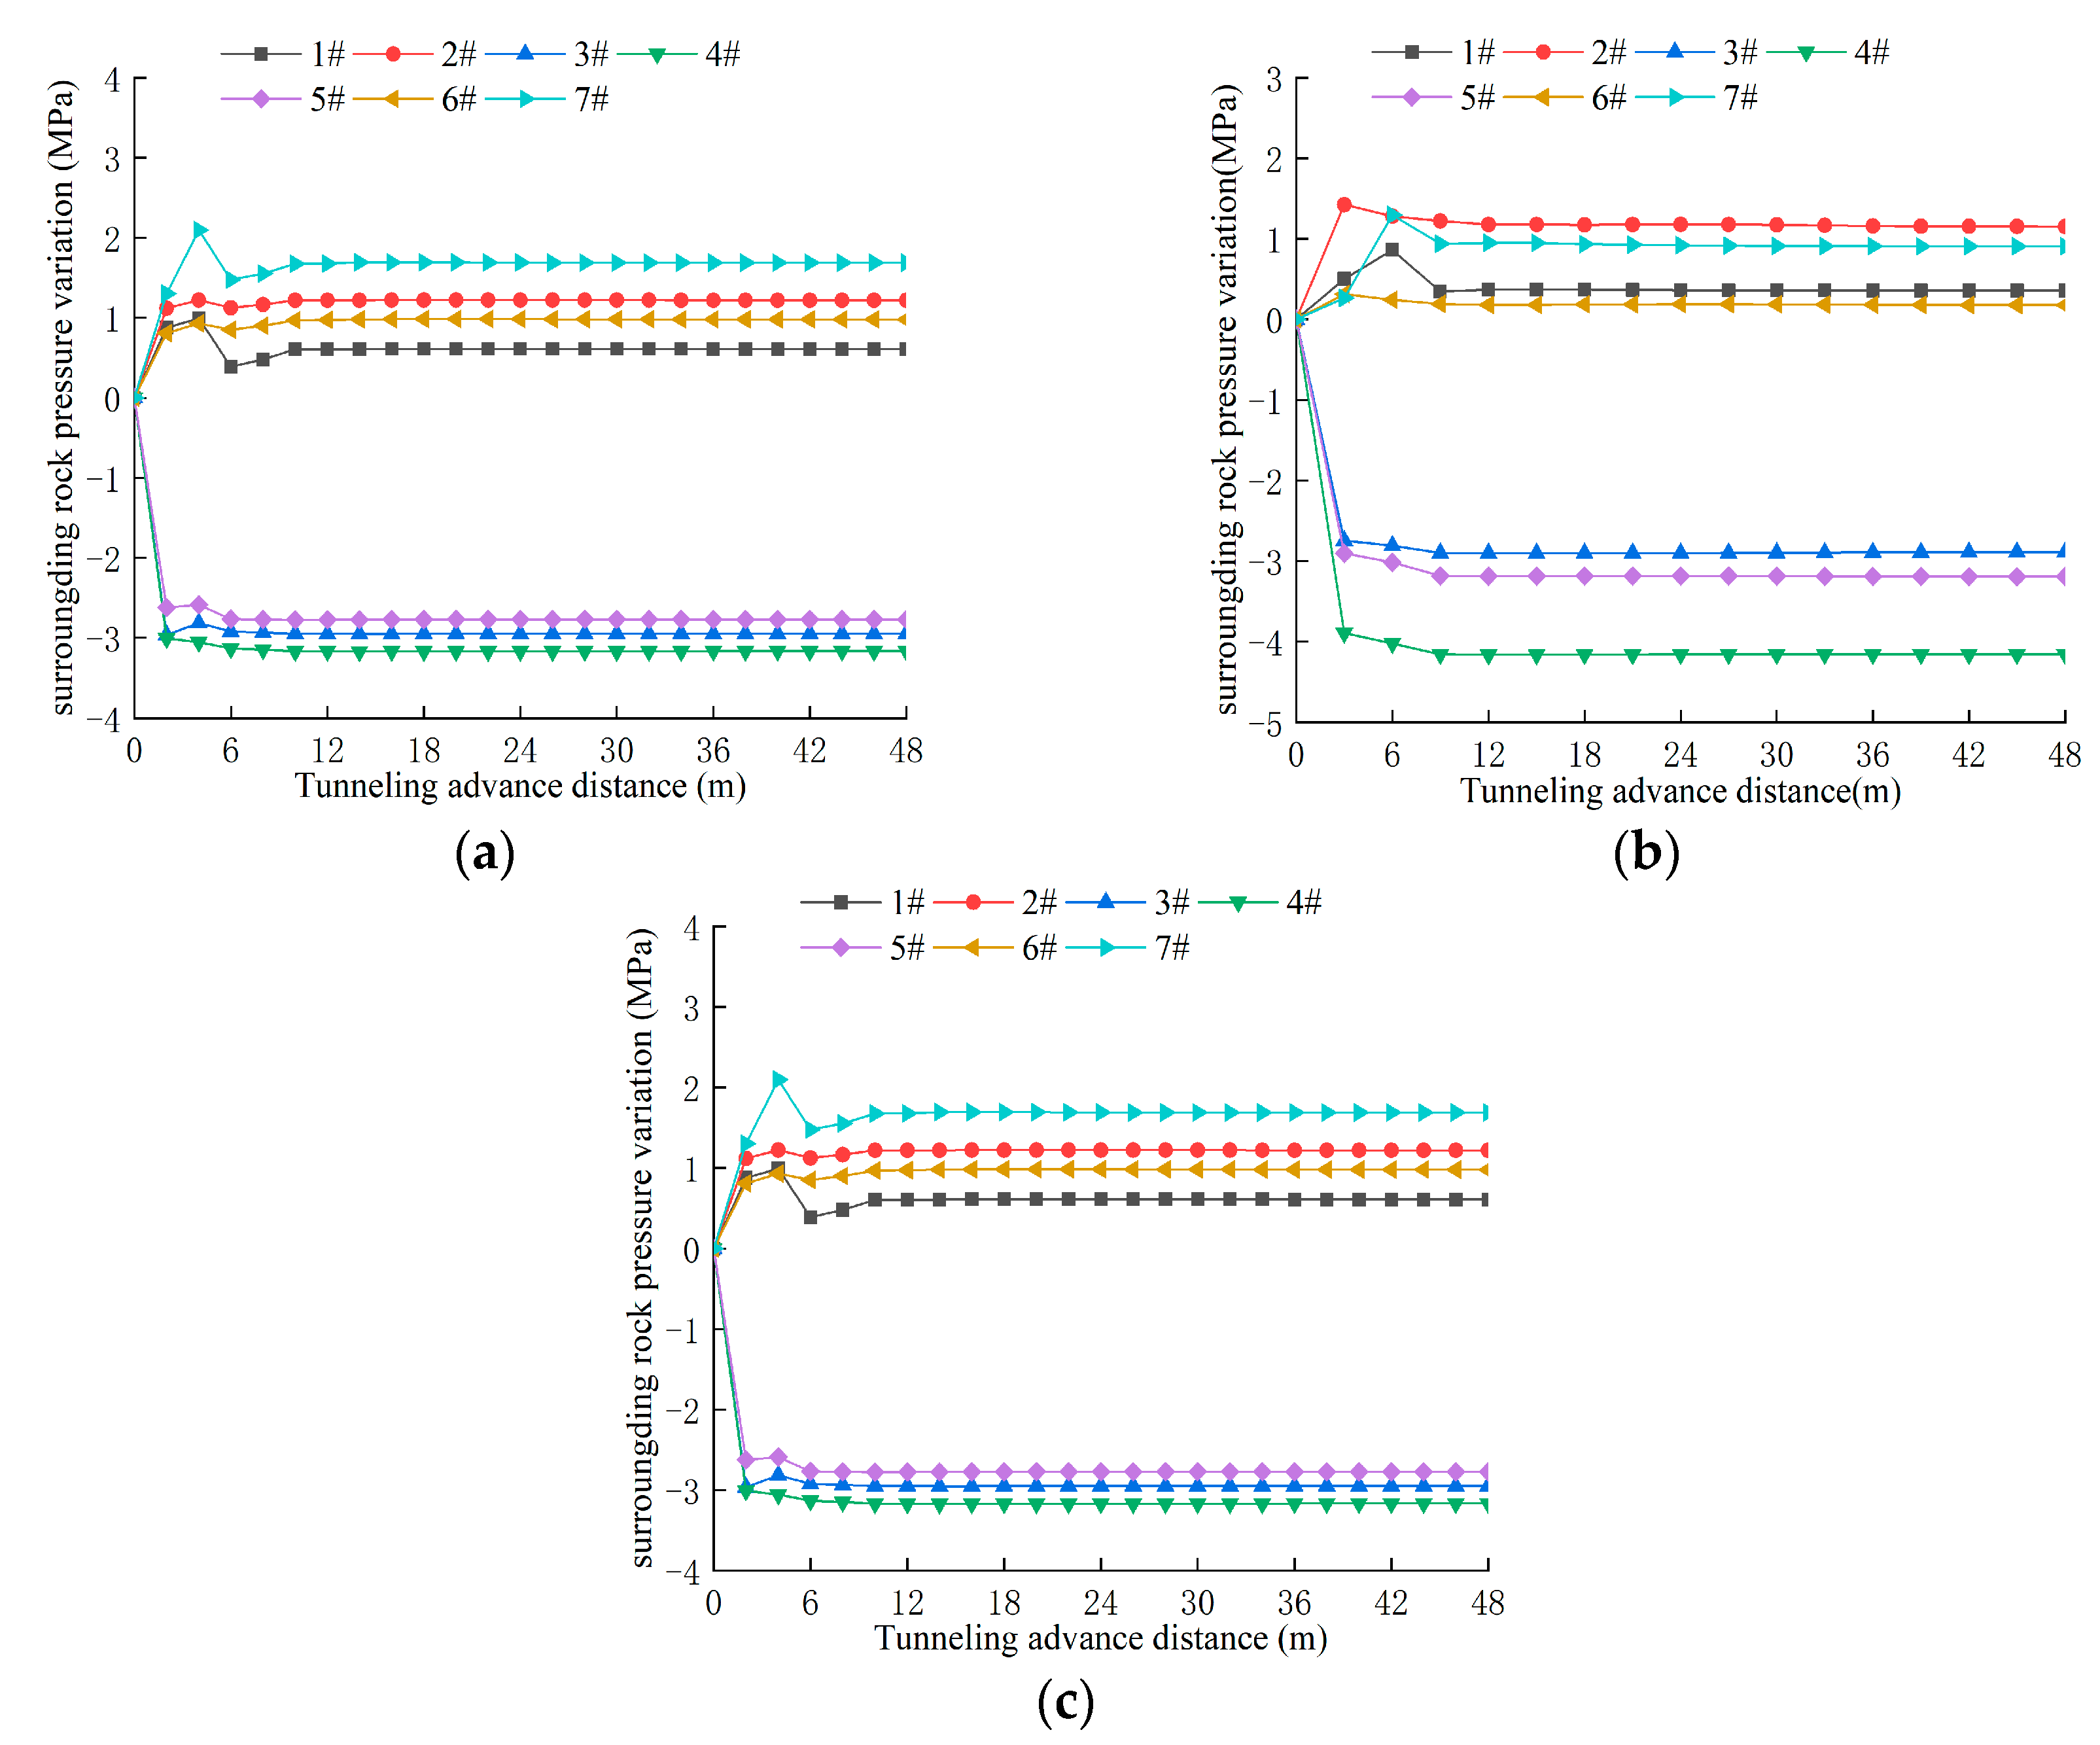
Figure 8 and
Figure 9 show the surrounding rock stress variation results at each measuring point of the corresponding sections under different construction step distances. Analysis of the data curves reveals that after the excavation of the connecting tunnels, the surrounding rock stress at the top of the test section decreases rapidly, with the extreme point of stress reduction located at the center of the section top. The surrounding rock stress on both sides increases rapidly, and the stress variation on both sides exhibits non-uniform distribution. When the excavation step distance is 2 m, the surrounding rock stress distribution at the top of the section is relatively uniform. The smaller the excavation step distance, the more uniform the stress distribution at the top of the test section. As the excavation step distance increases, stress concentration occurs at the central position of the section top. The larger the excavation step distance, the greater the extreme value of surrounding rock stress variation at the central top position. For the simulated construction with the three set excavation step distances, the surrounding rock stress shows larger fluctuations at the initial stage of section excavation. The surrounding rock stress basically remains unchanged after 4 excavation rounds. When the connecting tunnel section is excavated, the maximum influence range on the stratum along the tunneling direction is about 4D (D represents the excavation step distance).
As shown in
Figure 8 and
Figure 9, the variation patterns of surrounding rock stress around the right exhaust test section and right supply test section are similar during the construction and excavation process. Therefore, the right exhaust test section is selected as the representative section. As shown in
Figure 10, the deformation development process of the primary lining concrete during numerical simulation excavation of the section under different working conditions is presented. Combined with the results of surrounding rock stress variation, the deformation of the primary lining concrete after the excavation of connecting tunnels can be roughly divided into three stages.
In the first stage, the primary lining concrete has not fully solidified to develop effective strength, so the deformation is relatively large. When the top of the lining is under pressure, the vertical inner diameter decreases while the horizontal inner diameter increases. Thus, at the initial stage of section excavation, the stress at the measuring points on the lining top decreases, and the stress at the measuring points on both sides increases. During the second stage, the primary lining concrete starts to consolidate and shrink. The top of the lining continues to undergo settlement deformation under pressure, while the concrete on both sides of the lining shrinks inward, leading to a decrease in stress at the measuring points on both sides. During the third stage, after the primary lining concrete is fully solidified, no further deformation occurs. The surrounding rock stress around the excavation section gradually stabilizes, and meanwhile, the lining deformation reaches its maximum value.
Based on the above analysis, it can be seen that after the excavation of the connecting tunnel, the initial support is mainly subjected to downward soil stress from the top center. The larger the excavation step, the more obvious the stress concentration phenomenon at the central point of the top of the connecting tunnel’s excavation working face; at the same time, the greater the deformation of the initial support of the connecting tunnel, the greater the confining pressure borne at the arch crown of the initial support, with the increase in excavation distance. When the excavation step is controlled within the range of 2–3 m, the confining pressure distribution on the excavation working face of the connecting tunnel is relatively uniform, with no obvious stress concentration phenomenon, and the deformation of the initial support is small. Therefore, it is preliminarily concluded that for Class III surrounding rock excavated using the full-face method, the excavation step should be optimally controlled within the range of 2–3 m.
4.2. Optimization of Blasting Excavation Construction Parameters
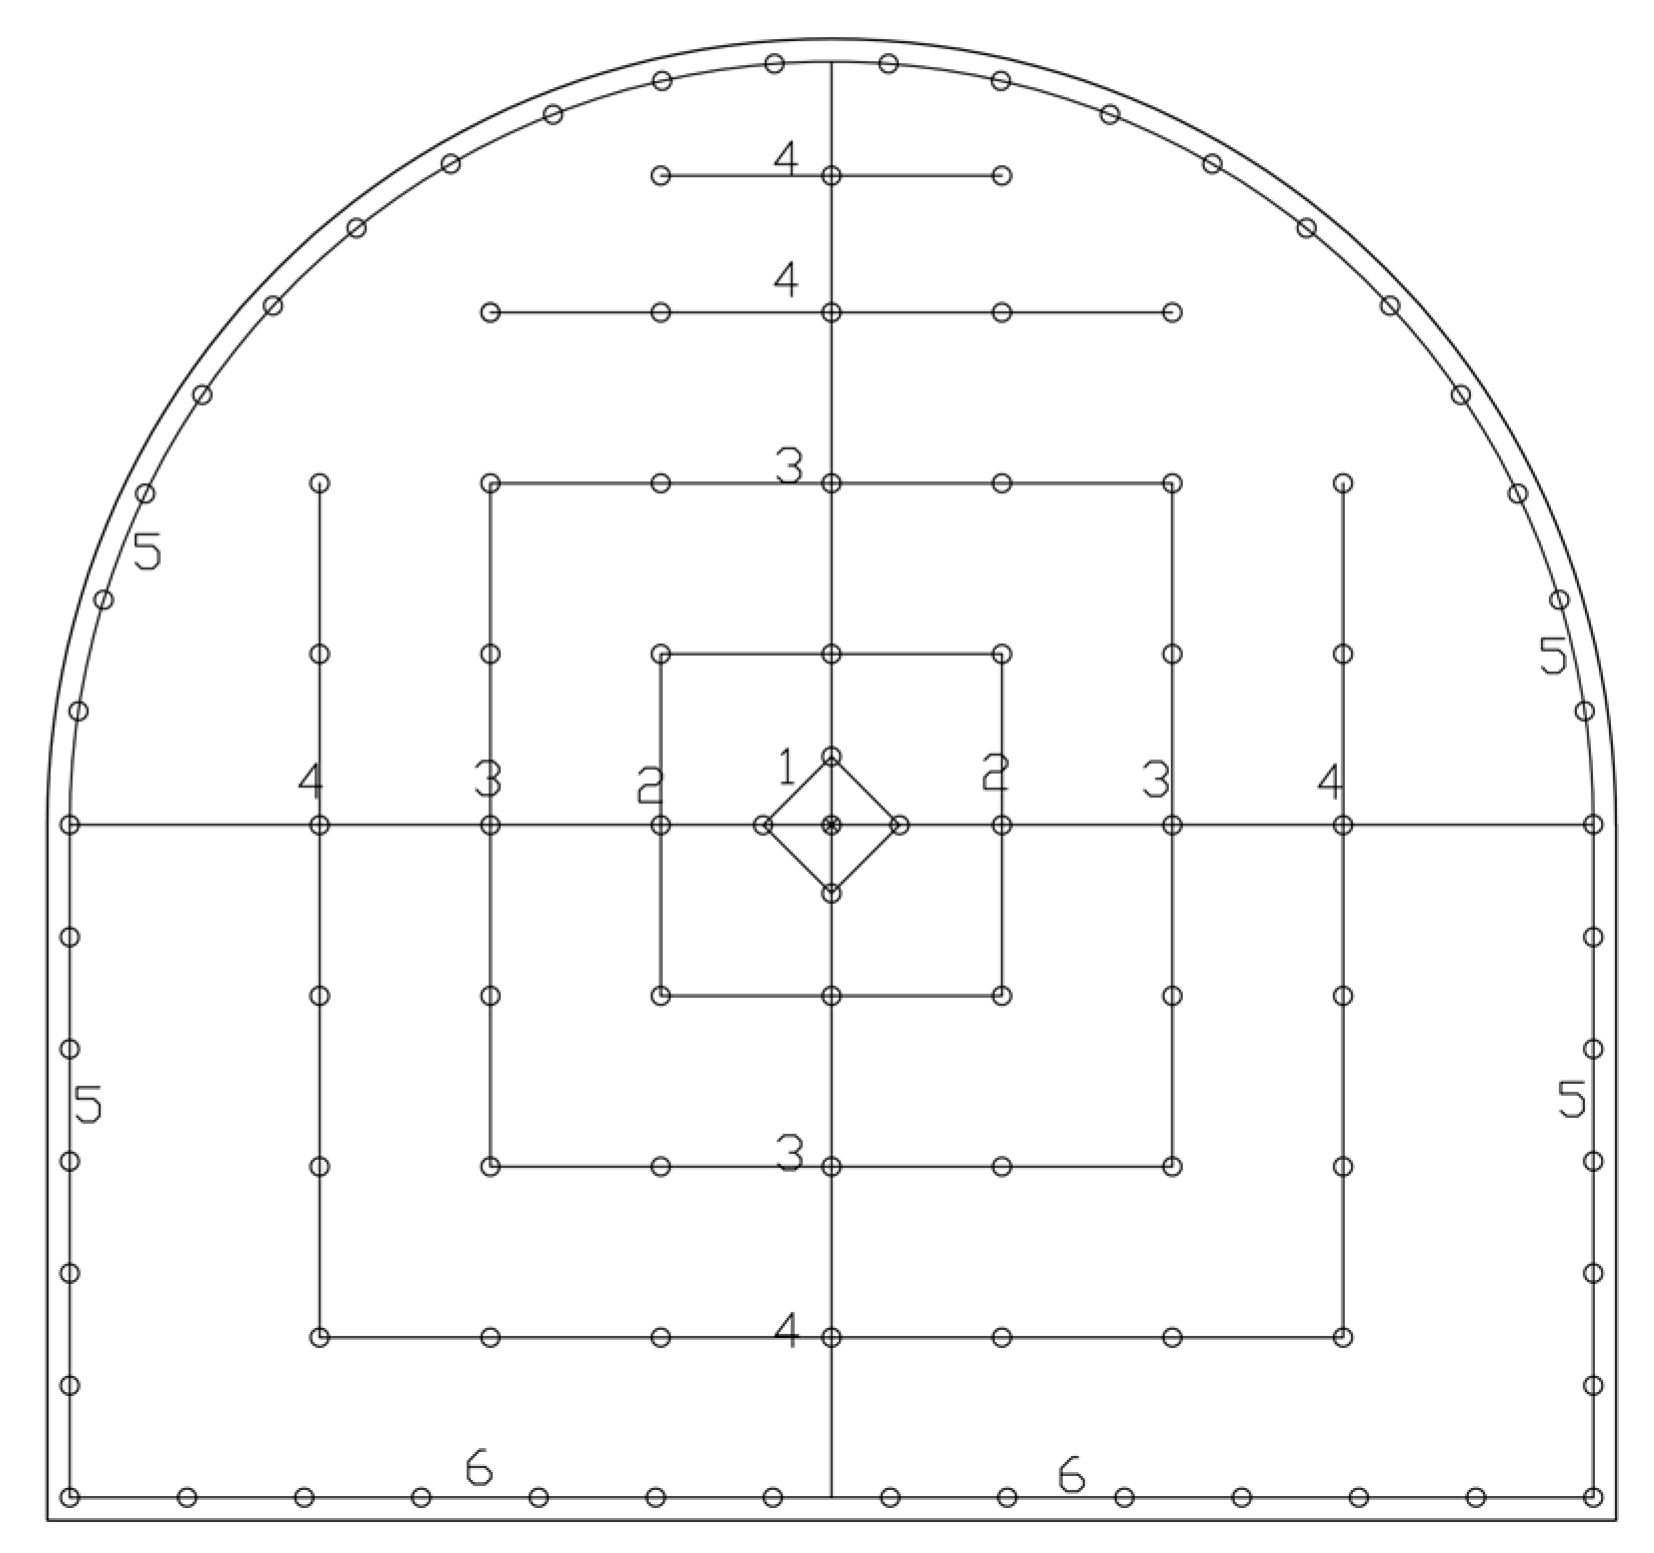
Taking the section at mileage post PYK0+060 as an example, the blasting design for this section is shown in
Figure 11, and the relevant blasting parameters are listed in
Table 2. Blasting dynamic loads are applied through numerical simulation software on this section to simulate the blasting effect, with three different working conditions of blasting dynamic loads set up. To ensure construction safety, the particle vibration velocity of the secondary lining of the main tunnel caused by blasting construction in the connecting tunnel should be controlled within 5 cm/s. The calculation formula for the safe distance of blasting vibration is as follows:
where
R is the permissible safety distance for blasting vibration;
Q is the charge amount: for simultaneous blasting, it refers to the total charge; for delayed blasting, it refers to the maximum charge amount per segment;
V is permissible particle vibration velocity at the geological point of the protected object;
K and
α are coefficients and attenuation indices related to topographic and geological conditions between the blasting point and protected objects.
K is mainly related to the topography and lithology between the blasting point and monitoring points: hard rocks usually take values of 50–150, while soft rocks can reach 250–350.
α is affected by geological conditions: hard rocks generally take values of 1.3–1.5, and soft rocks generally take values of 1.8–2.0.
The section blasting method and maximum initiating charge of the explosive can be determined through the calculation formula for the safety distance of blasting vibration. According to the on-site rock layer sampling test, the rock firmness coefficient f is 8–10, belonging to hard rock. Therefore, when calculating the minimum allowable safety for blasting vibration,
K = 50 and
α = 1.5. At this time, numerical simulation software is used to simulate the blasting dynamic loads with different maximum charge amounts, analyzing the effects of blasting dynamic loads on the main tunnel under different working conditions. The blasting parameters for different working conditions are shown in
Table 3.
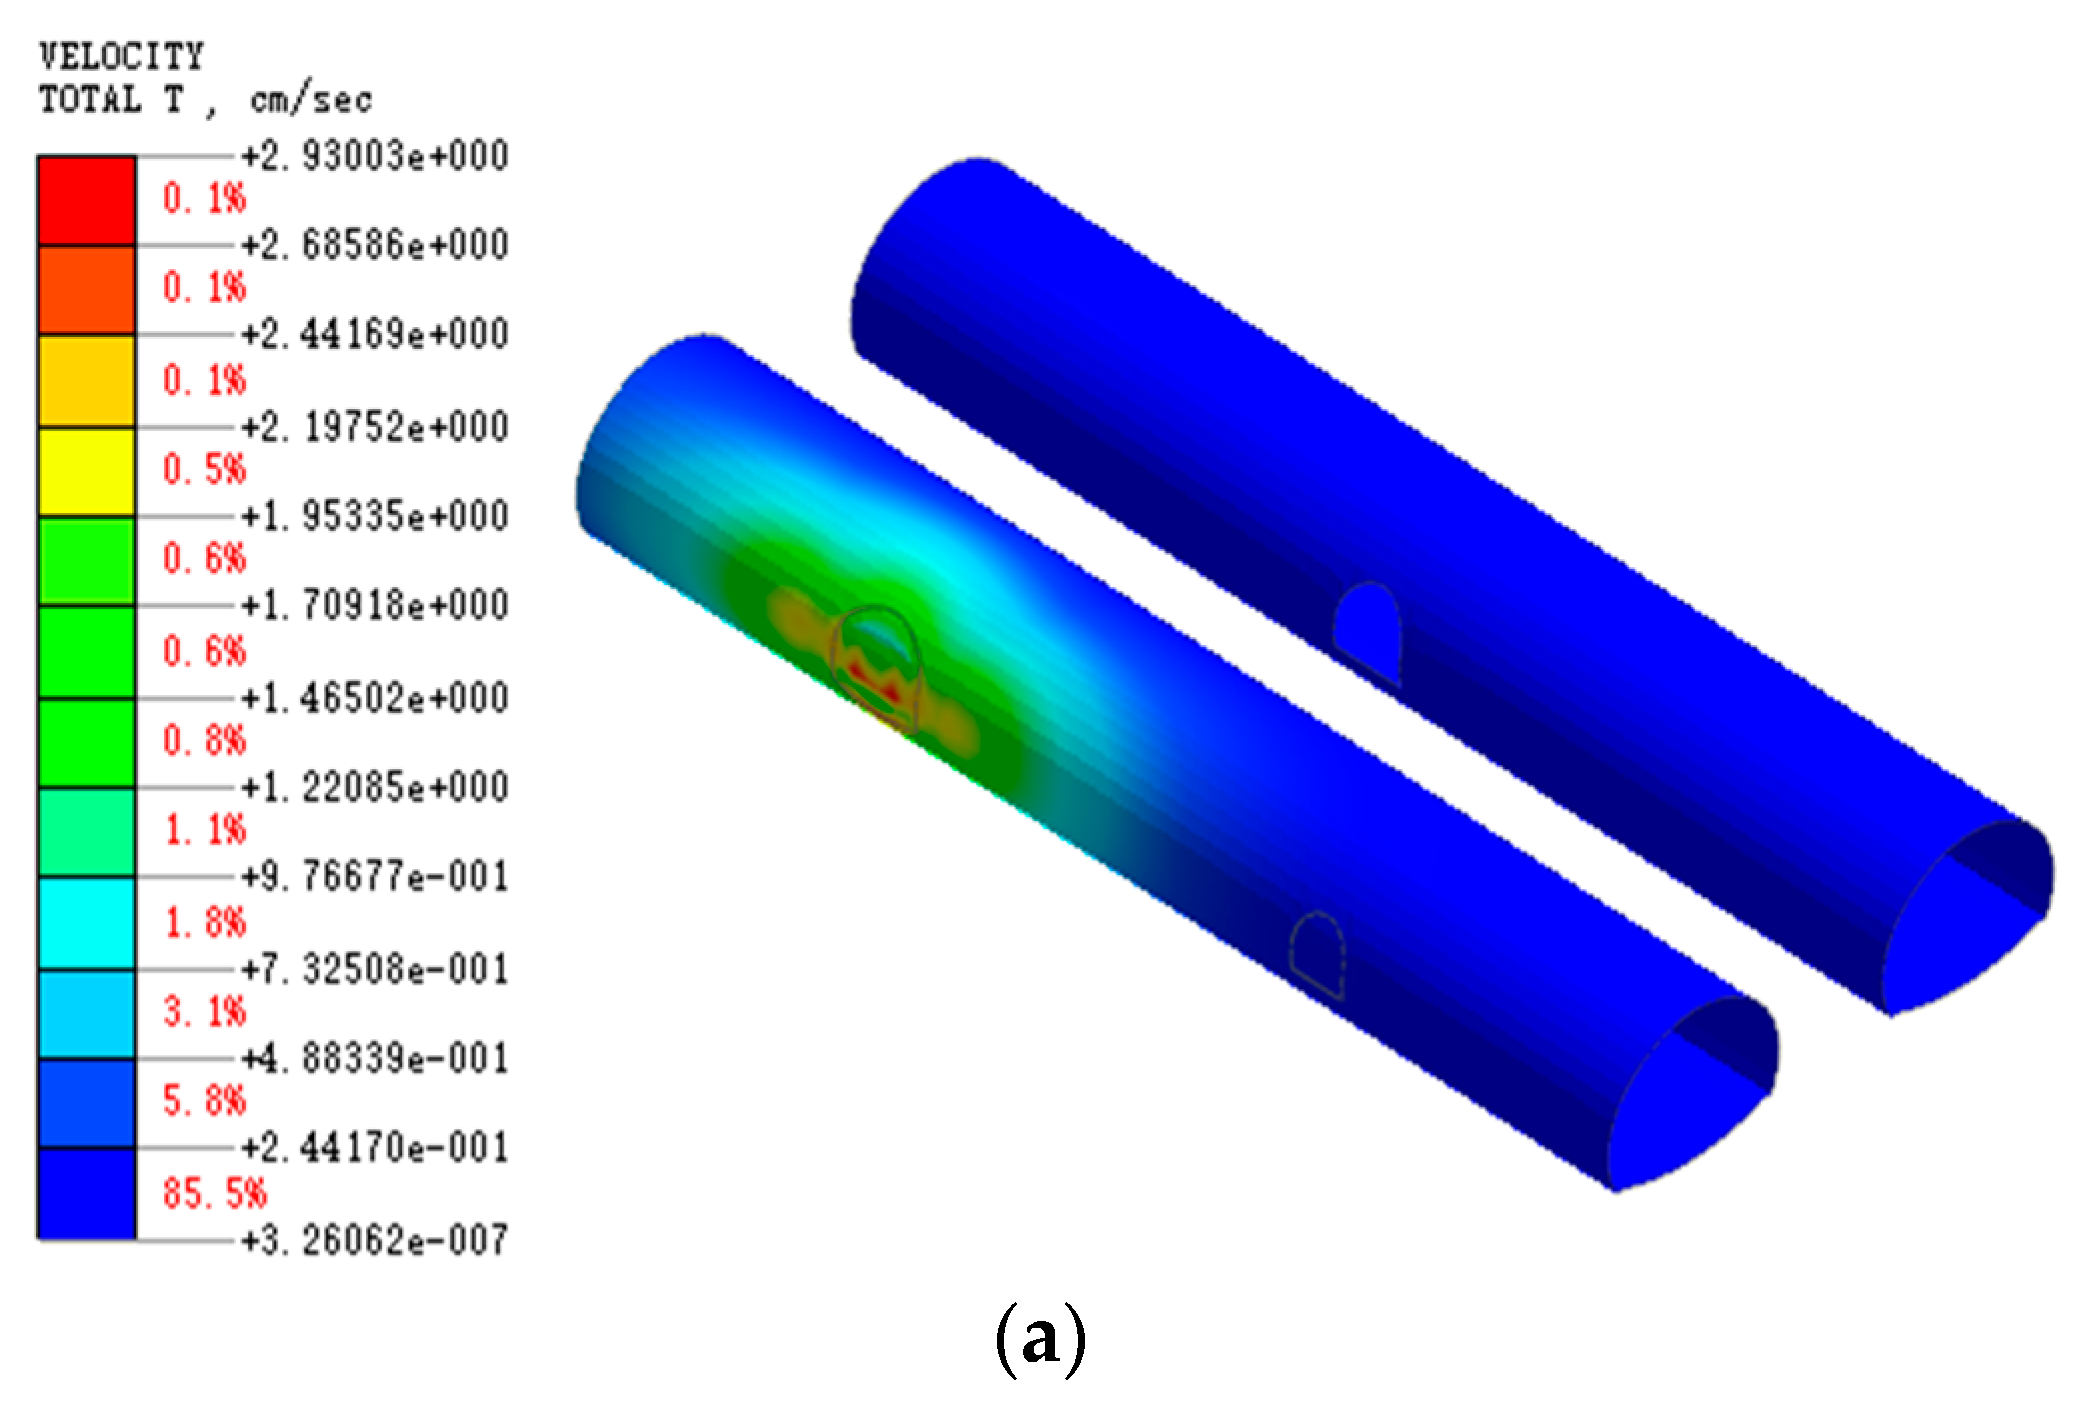
Figure 12 shows the numerical simulation results of particle vibration velocity for the secondary lining of the main tunnel under different working conditions. The maximum particle vibration velocities of the main tunnel’s secondary lining in working condition 1 and working condition 2 are 2.9 cm/s and 4.3 cm/s, respectively, both complying with relevant code requirements. However, the maximum particle vibration velocity in working condition 3 exceeds the limit specified in the code. Moreover, the influence range of blasting dynamic loads in working condition 2 is significantly smaller than that in working condition 1. Therefore, the influence range of connecting tunnel blasting excavation on the main tunnel is related not only to the maximum charge amount but also to the charge diameter and borehole diameter.
When the explosive in the borehole adopts decoupled charging, the ratio of borehole diameter to charge diameter can be increased, using the air gap to buffer the energy generated by the explosion. Combined with the optimization analysis results of the section excavation step distance in the previous text, the blasting construction scheme for the section of the right line exhaust connecting tunnel is now optimized. The optimized blasting parameters are shown in
Table 4. The optimized blasting scheme adopts the single-hole single-segment initiation mode, with the maximum charge amount per hole increased to 3 kg and the excavation step distance increased to 3.0 m. Numerical simulation verifies that the optimized blasting parameters have increased the blast hole depth and charge per hole while appropriately reducing the number of blast holes in a single section. Compared with the pre-optimization blasting scheme, the new blasting scheme features a larger initiating charge per hole, a longer excavation step, and thus higher construction efficiency.
4.3. Micro-Disturbance Construction Control for Crossover Section
During the excavation of the left-line exhaust connecting passage, it needs to overpass the right tunnel of the main tunnel before connecting with the left tunnel. The minimum clear distance between the overpass section of the connecting passage and the top of the secondary lining of the right tunnel is only 5 m, and the total length of the construction section covering the overpass part of the connecting passage and the adjacent main tunnel is approximately 30 m. The on-site construction scheme is designed to adopt the full-face blasting method for excavation, with an advance of 1 m per cycle.
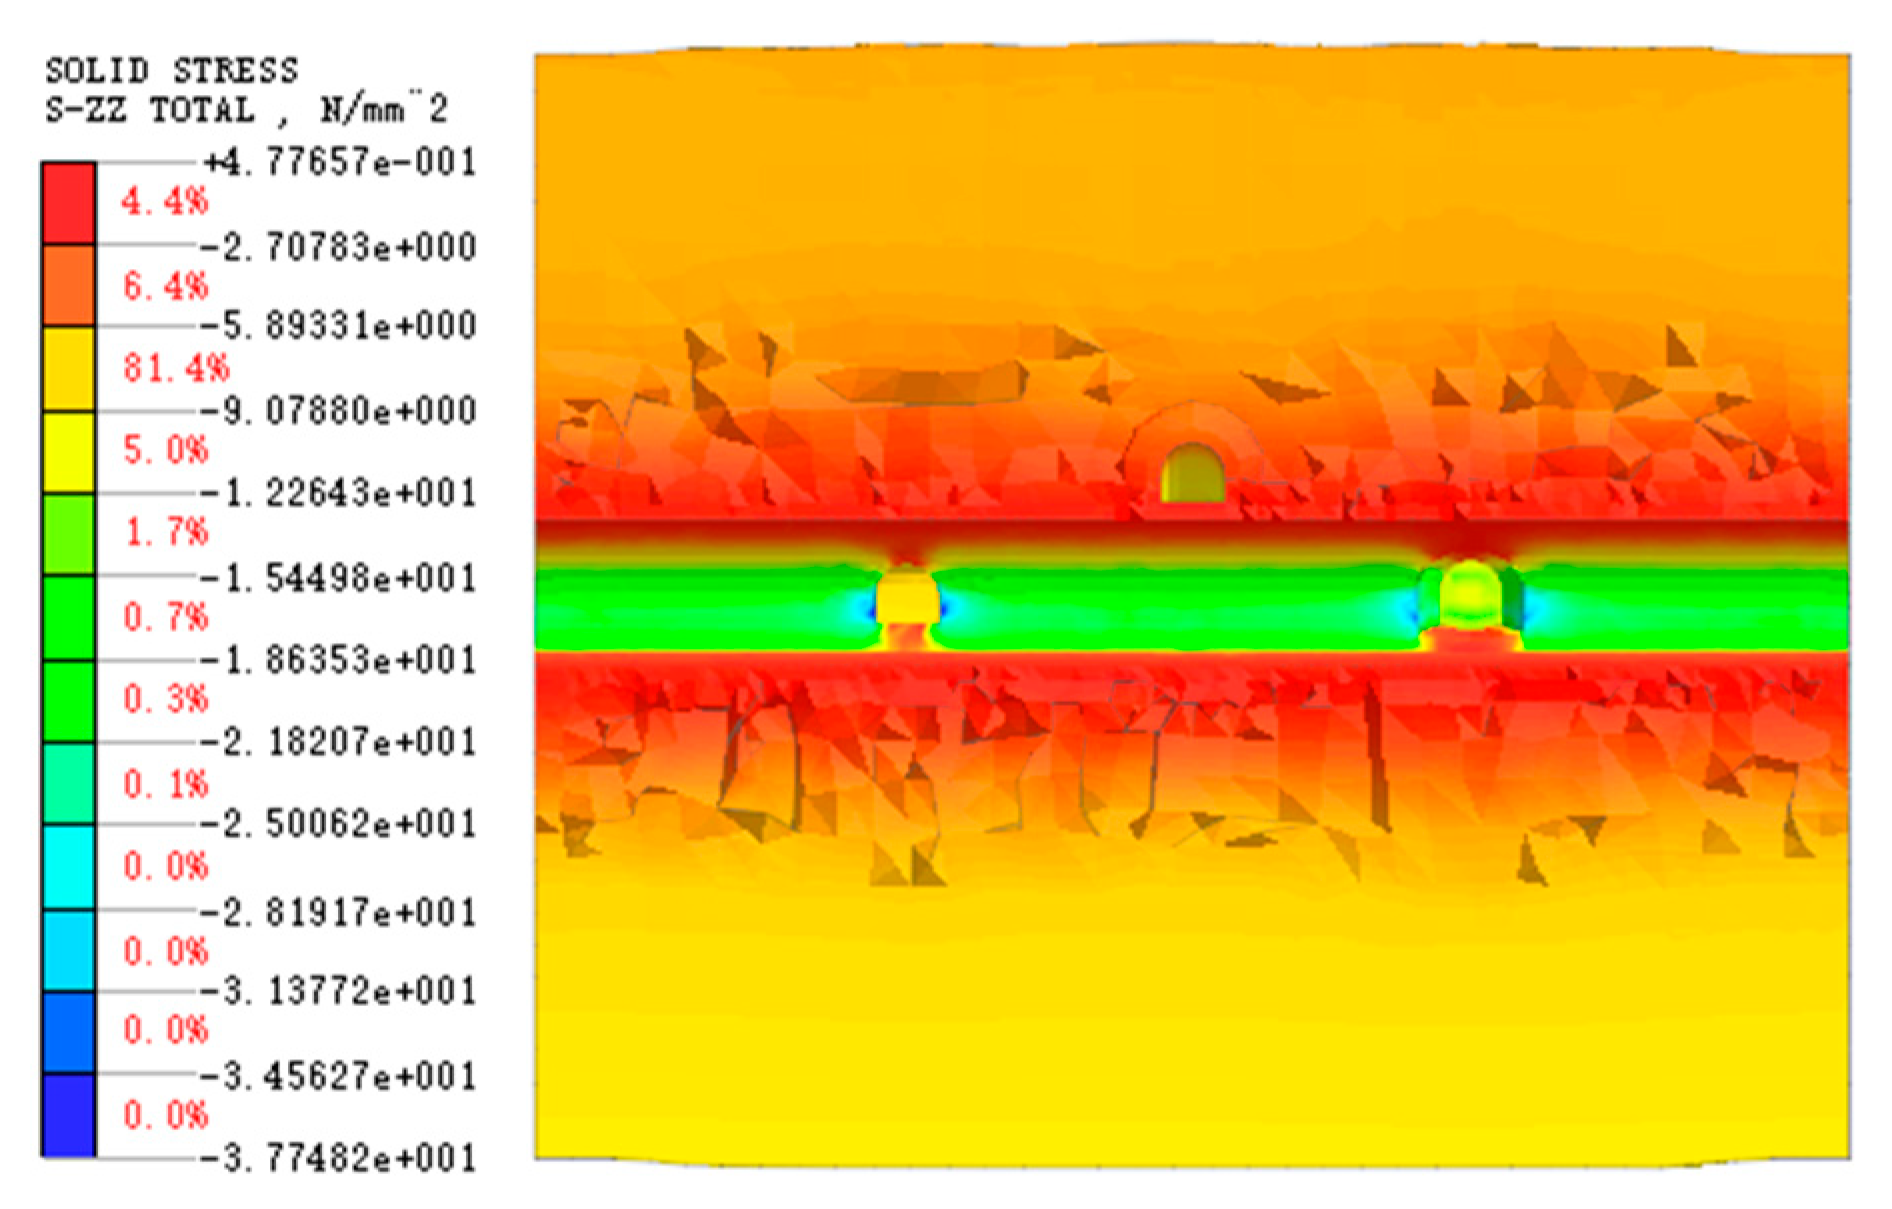
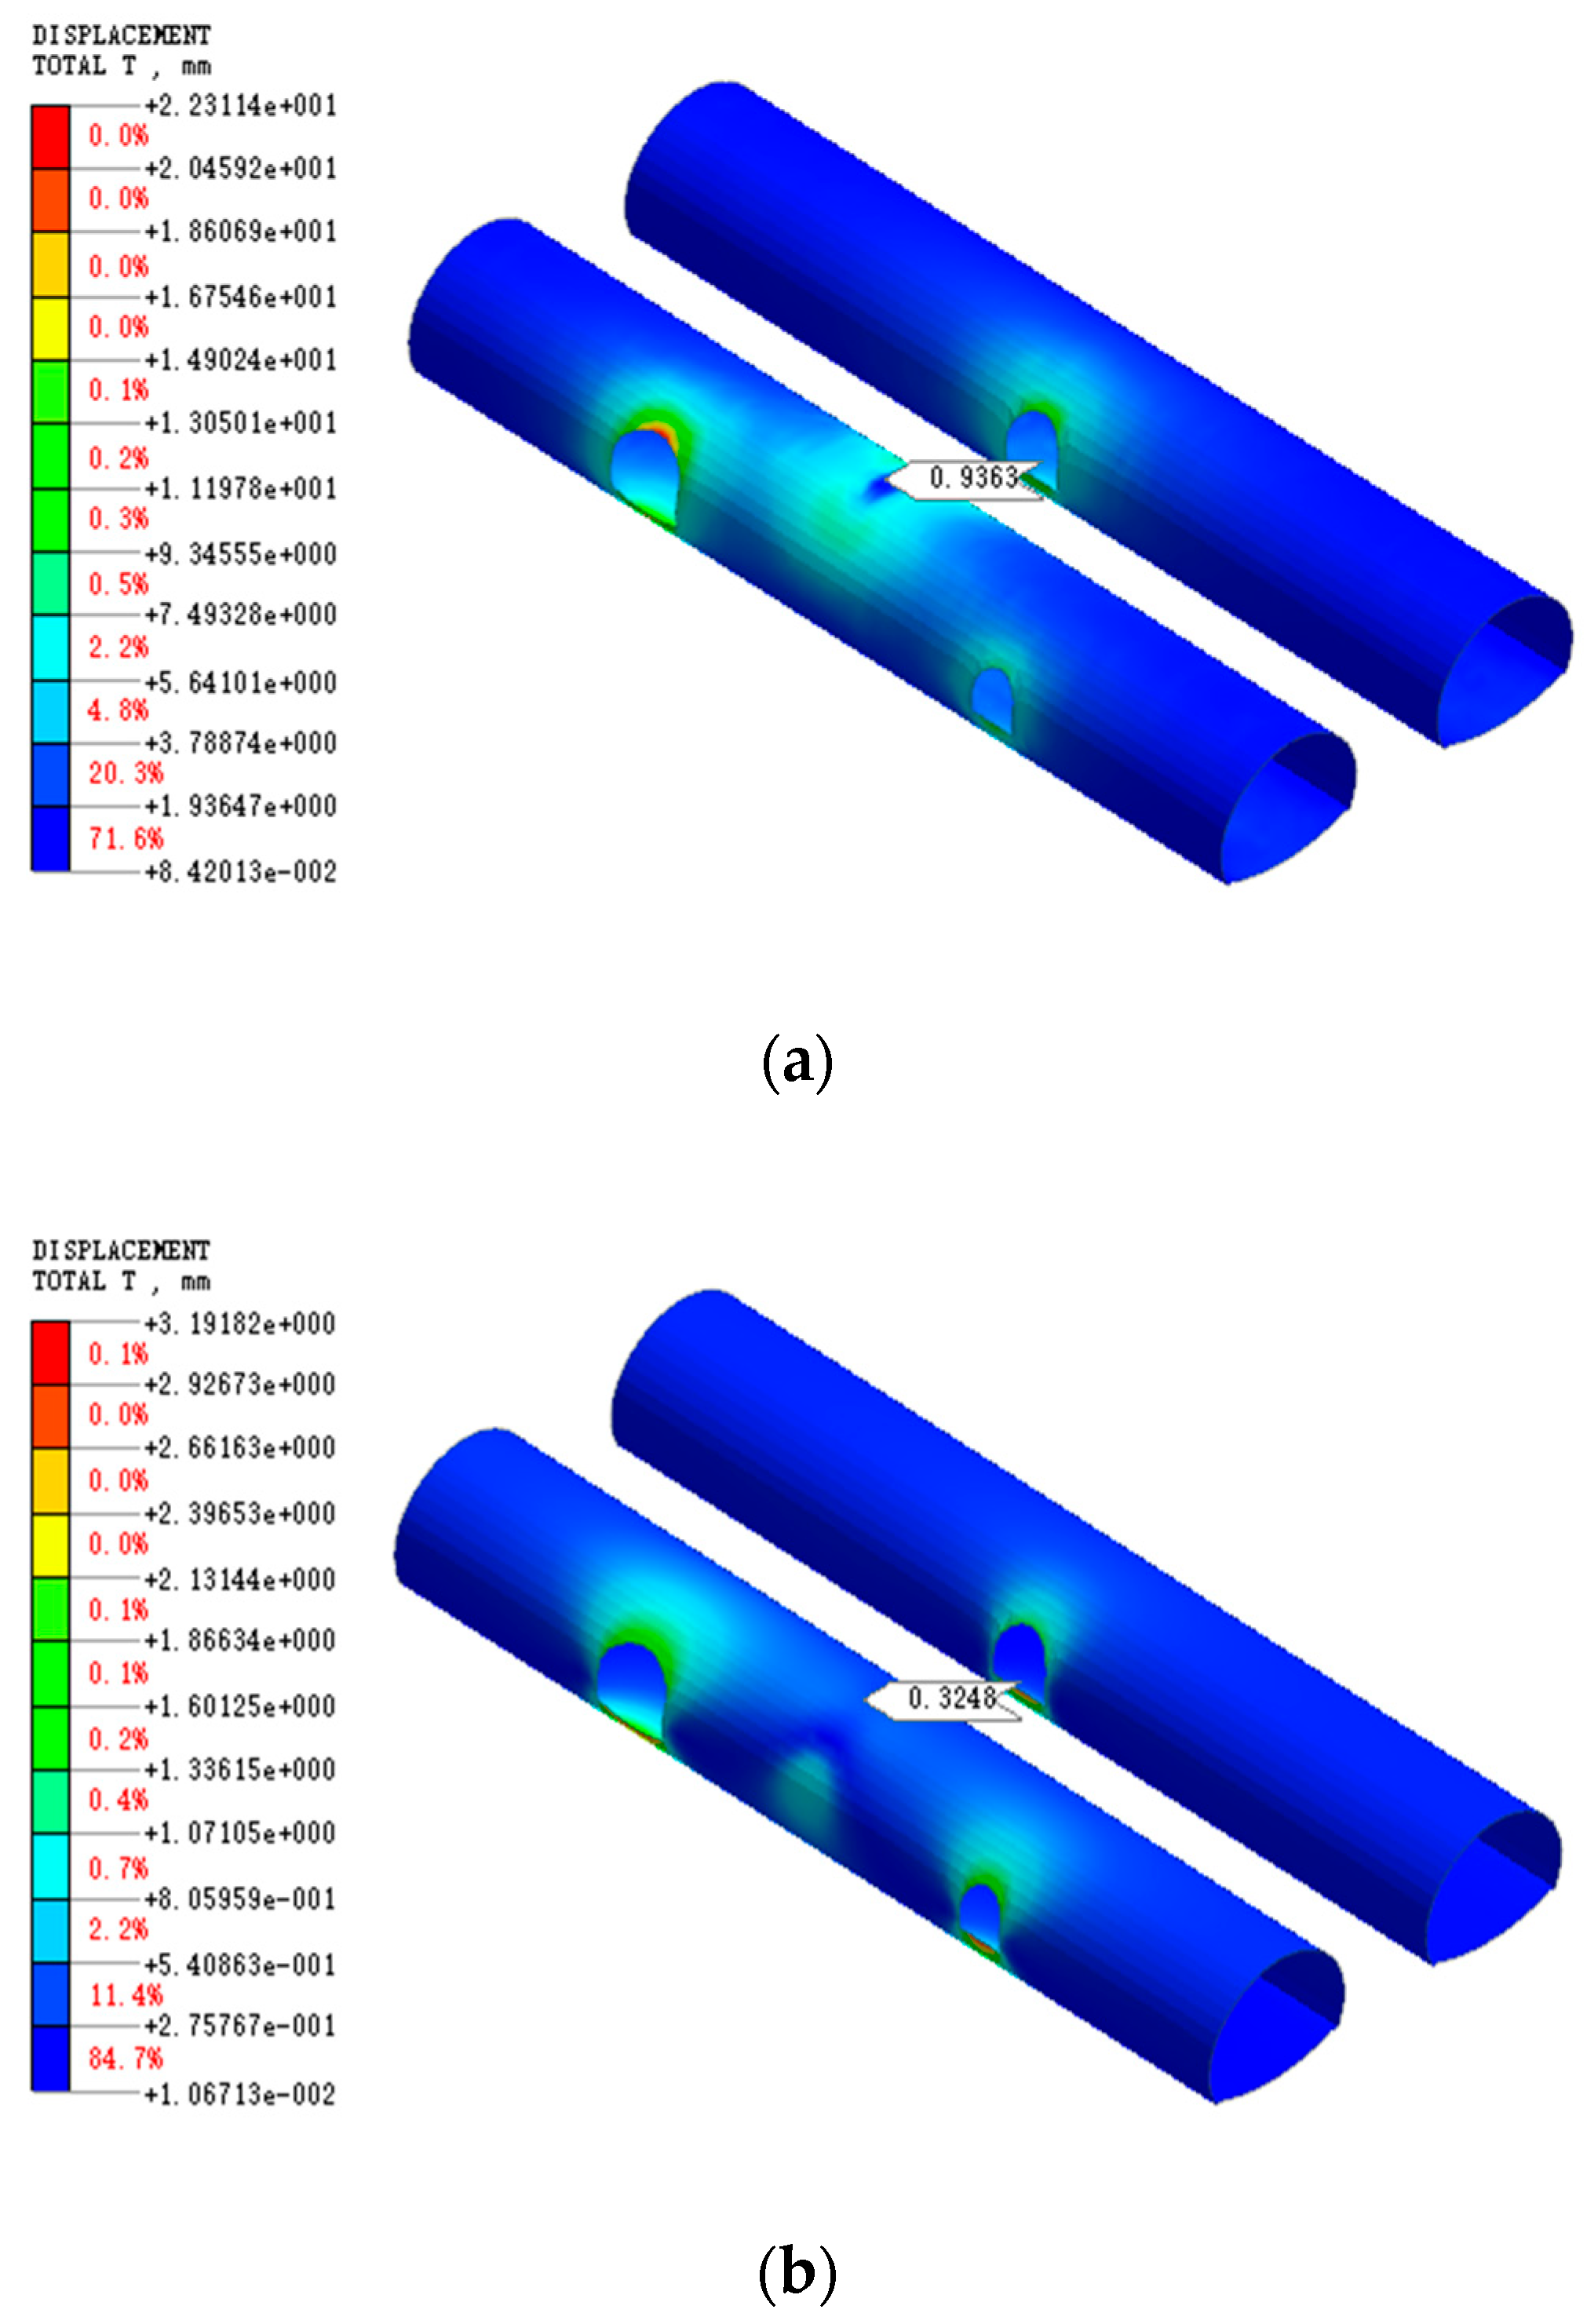
Figure 13a shows the numerical simulation of the secondary lining deformation of the main tunnel after the full-face construction of the overpass section of the connecting passage. At this point, the maximum deformation of the secondary lining at the position (on the top of the right tunnel) with the minimum clear distance from the connecting passage is approximately 0.9 mm, but the maximum cumulative deformation of the main tunnel’s secondary lining reaches about 15 mm. Therefore, the adoption of the full-face method for the overpass section of the connecting passage causes significant disturbance to the main tunnel.
To reduce the impact on the main tunnel during the construction of the connecting passage, the overpass section of the connecting passage is planned to adopt upper and lower bench methods for excavation, with an advance of 0.6 m per cycle. Meanwhile, to ensure that construction schedule requirements are met, the left-line exhaust connecting passage will be constructed simultaneously from Junction 2 and the corresponding position of the left tunnel. Taking the section of the left-line exhaust connecting passage with a slope of −87% as an example, when using upper and lower bench methods for excavation, the upper bench height is 3.45 m, and the lower bench height is 3.05 m, with a single advance of 0.6 m and three consecutive advance cycles (as shown in
Figure 14).
After analyzing the deformation of the secondary lining of the main tunnel during the construction of the left-line exhaust connecting passage using numerical simulation software, it is concluded that the maximum deformation of the secondary lining at the position (on the top of the right tunnel) with the minimum clear distance from the connecting passage is only approximately 0.3 mm (as shown in
Figure 13b), which meets the requirements of relevant construction specifications. Therefore, compared with full-face excavation, the method of simultaneous excavation from both ends of the connecting passage using upper and lower bench methods not only reduces the impact on the secondary lining of the existing main tunnel during the construction of the overpass section of the connecting passage but also effectively improves construction efficiency.
5. Conclusions
Based on the Xiaolongmen Tunnel Project in China, this study systematically investigated the impact of various construction parameters on the construction process of complex connecting tunnels in extra-long highways using methods such as on-site monitoring and numerical simulation. It analyzed the influence of excavation steps in connecting tunnel construction on surrounding rock and deformation of initial support, filling the gap in research on optimization of construction parameters for connecting tunnels in extra-long highways, and providing a theoretical basis for the construction of actual projects. Moreover, by combining on-site blasting construction schemes, numerical simulation was used to optimize blasting construction parameters and schemes, and the feasibility of the new scheme was verified through on-site construction, ensuring its practicality. The main conclusions of the study are as follows:
- (1)
After the excavation of the connecting tunnel, the surrounding rock stress at the top of the tunnel face decreases rapidly, with the extreme value point of stress reduction located at the center of the section top. However, the surrounding rock stress on both sides increases rapidly, showing uneven distribution. The greater the excavation step distance, the greater the extreme value of surrounding rock stress variation at the center of the section top.
- (2)
For Class III surrounding rock excavated using the full-face blasting method, the maximum influence range of working face excavation on the stratum along the tunneling direction is approximately 4D (where D represents the excavation step). Meanwhile, the larger the excavation step, the more obvious the stress concentration phenomenon at the central point of the working face arch crown, and the excavation step should be optimally controlled within the range of 2–3 m.
- (3)
The deformation of primary lining concrete after connecting tunnel excavation can be roughly divided into three stages: In the first stage, when the primary lining concrete has not yet solidified, the concrete deformation is large, and the surrounding rock stress changes significantly. In the second stage, the primary lining concrete begins to consolidate and shrink: the top of the lining undergoes settlement deformation under compression, while both sides deform with inward contraction. In the third stage, the state of the lining and surrounding rock basically tends to stabilize.
- (4)
The influence range of blasting dynamic loads is affected by multiple factors. When the explosive in the borehole is charged in a decoupled manner, the ratio of borehole diameter to charge diameter can be increased, using the air gap to buffer the energy generated by the explosion. By adjusting the decoupling coefficient of borehole diameter to charge diameter and appropriately increasing the maximum initiation charge amount, the blasting scheme can be optimized to improve construction efficiency.


