1. Introduction
The assessment of the post-tensioning (PT) systems in reinforced concrete bridges has become a matter of growing concern in recent years for both infrastructure managers and the scientific community. Assessing these systems poses complex challenges that are not easy to address, as they include the inherent difficulty of detecting hidden defects due to the nature of PT technology itself, and the large number of bridges requiring assessment. To fully understand these challenges, it is important to consider the characteristics of PT systems and their historical development.
Post-tensioning is a technique for prestressing concrete where high-strength steel wires or strands are tensioned after the concrete has been cast and has gained sufficient strength. These steel elements are housed in ducts, which can be made of corrugated galvanized steel or high-density polyethylene (HDPE). Strands or wires are anchored at the ends and, together with the ducts and anchorage devices, form what is known as a tendon. Depending on the location of the tendons, PT systems are classified as internal, where tendons are embedded within the concrete section, or external, where they are placed outside the concrete and anchored externally. In some cases, both methods may be used in combination. Once tensioned, the ducts are injected with a cementitious grout, which bonds the steel to the surrounding concrete and protects it from corrosion by nature of its high pH environment. The high alkalinity forms a passive oxide film on the steel that protects it from corrosion in the absence of chlorides. Chloride intrusion can break down this film, leading to pitting corrosion of the strands. Voids within the ducts end up as collection points for moisture and water, creating starting conditions for the electrochemical corrosion process. These voids can be formed by inadequate filling of the duct or from water separation (bleeding) from the grout prior to setting [
1]. Grout defects can lead to steel corrosion, which, over time, can significantly reduce the effective cross-section of the tendon, potentially leading to the loss of prestress or sudden brittle failure, with severe implications for structural integrity.
The aforementioned degradation phenomena can be ascribed both to the intrinsic aging of materials over time and to deficiencies or negligence during the manufacturing and installation processes. During the post-World War II (WW II) mass production of PT bridges, materials and design methodologies lacked the level of standardization and comprehensive understanding that current engineering practice demands. The primary focus at the time was on achieving adequate structural capacity and exploiting the advantages of this emerging technology, with limited attention paid to long-term durability and the critical importance of systematic maintenance. As a result, although this structural typology now comprises the majority of European infrastructure assets, a significant portion of these prestressed concrete structures, decades after their construction and often at the end of their service life, show significant signs of deterioration, seriously affecting safety and functionality.
Awareness of the risks associated with PT systems has been heightened by several catastrophic bridge collapses in recent years, both in Italy and internationally. A particularly impactful case was the 2018 collapse of the Morandi Bridge (Polcevera Viaduct) in Genoa, which drew global attention. Built in the 1960s, the structure suffered from early signs of deterioration that were not adequately addressed. Besides the lack of maintenance over the years, one of the main technical issues involved poor grouting near the upper part of the stay-cable system, which led to strand corrosion and, ultimately, a sudden failure. Unfortunately, this was not an isolated incident, similar failures have occurred in Italy [
2] and worldwide [
3]. The Genoa disaster served as a turning point, prompting authorities to adopt a more proactive and precautionary approach to bridge management, especially for PT systems known to be vulnerable without proper maintenance.
In this context, the Italian Ministry of Infrastructure and Transport issued the Guidelines for the Risk Classification, Monitoring, and Evaluation of Existing Bridges (LLGG2020) [
4]. These Guidelines promote a progressively detailed approach, ranging from visual inspections to more advanced investigations, known as Special Inspections (SI) Guidelines for PT bridges, currently under development in draft form [
5]. The procedures for conducting SI remain loosely defined. While the SI Guidelines [
5] suggest potential survey and testing methods, they lack precise instructions, and the techniques commonly used for reinforced concrete structures are often inadequate for detecting hidden defects in PT systems. This necessitates the adoption of non-destructive testing (NDT) methods, especially in large networks where invasive inspections are impractical.
Moreover, given the vast scale of the infrastructure network and the limited resources available to oversight agencies, it is not feasible to fully assess or rehabilitate all bridges simultaneously. Prioritization and optimization have become essential requirements for the effective management of PT bridges. Consequently, the selection of the most appropriate NDT methods for the assessment of a bridge or a stock of bridges represents a critical step in the diagnostic process.
In the field of infrastructure management, multi-criteria decision-making (MCDM) has emerged as a valuable decision-support tool that integrates various technical data with stakeholder values. Over the years, a wide range of MCDM methods and tools have been developed. MCDM methods typically follow a common mathematical structure: each alternative is evaluated against a set of criteria, with scores assigned and weighted according to the relative importance of each criterion. These weighted scores are then aggregated to generate the overall ranking or score [
6]. The main differences between techniques lie in the specific methods used to assign and combine the criteria values. According to several review papers, the most commonly used MCDM methods in the field of infrastructure assessment are the weighted sum model (WSM), weighted product model (WPM), analytical hierarchy process (AHP), ELECTRE, PROMETHEE, TOPSIS, and VIKOR. Each of these methods has its own strengths and limitations [
6,
7]. Most of them can become time-consuming as the number of criteria and alternatives increases, and they are often complex to implement, especially without the support of specialized software [
8]. On the other hand, the WSM stands out for its simplicity, intuitiveness, and proven effectiveness when compared with more advanced methods [
9]. The main advantages of using the WSM can be summarized in three key aspects. First, its simplicity makes it easily accessible even to those without specialized training in MCDM techniques. Second, its transparency helps users understand the decision-making process, fostering trust and consensus. Third, its flexibility enables adaptation to a wide range of operational contexts and decision-maker needs. This adaptability promotes critical awareness, as users are actively involved in tailoring the model rather than passively receiving outcomes. This approach encourages the development of customized scenarios, enabling the decision-maker to explore different solutions, reflect on priorities, and adjust the weighting of criteria according to the specific context.
Building on this foundation, this paper proposes a decision-making framework based on WSM to support the selection of appropriate NDT methods for the assessment of post-tensioned (PT) bridges. This approach allows multiple evaluation categories to be considered, such as detection accuracy, ease of use, cost, and impact on traffic, with the goal of supporting infrastructure managers in designing effective, tailored testing plans, whether for individual bridges or entire networks, and ensure the safe management of these critical assets. The current implementation of the framework is specifically focused on existing structures with internal PT systems, which represent the vast majority of PT bridges in Italy. This focus reflects the historical context: internal PT was widely adopted during the post-World War II reconstruction period and thus characterizes most of the national bridge stock in need of assessment today. In contrast, external PT has been predominantly employed in more recent constructions or as part of strengthening and rehabilitation interventions and may be considered in future extensions of the framework.
The novelty of this framework lies in its tailored application of the WSM to the field of PT bridge assessment. A similar approach was proposed by reference [
10]. However, a distinctive feature is the use of a simplified three-level qualitative scoring scale (as opposed to the ten-level scale used in [
10]) to better reflect the level of precision typically available in infrastructure inspections. This reduced scale helps prevent arbitrary or unreliable assignments and allows for effective differentiation of the alternatives’ performance relative to the criteria while maintaining clarity and reliability in the assessment.
The paper is structured as follows.
Section 2 reviews the NDT methods currently available for assessing internal PT systems, including their operational principles, applications, advantages, and limitations.
Section 3 outlines the multiphase approach required by the Italian Guidelines for SI.
Section 4 presents the WSM implemented to rank the NDT techniques.
Section 5 presents a case study for the application of the method proposed in the preceding section. Finally,
Section 6 outlines the main conclusions derived from the study.
2. State of the Art of NDT Methods for Internal PT System Assessment
This section presents a survey of current NDT techniques for assessing defects in the internal PT system and estimating the residual prestress. Some of these tests require minimal intervention in the structure and are considered non-destructive because the affected areas are small relative to the overall dimensions of the structural element and can be repaired after testing with negligible impact on the structure.
2.1. Visual Testing
Visual testing (VT) is the initial step in evaluating the structural conditions of post-tensioned concrete bridges [
11]. It involves careful on-site observation of post-tensioned concrete elements to identify visible defects and assess the general state of deterioration. Through VT, it is possible to identify both clear defects and warning defects (Annex 7 of the SI Guidelines [
5]) in the internal PT system. Warning defects may suggest ongoing deterioration within PT elements and may indicate the presence of hidden or more severe underlying issues. These warning defects include unsealed anchorage zones, detached bearing pads at the anchorage ends, cracks on the bulb’s lower surface, exposed or visible ducts, moisture infiltration from inside the structure, exposed or corroded reinforcement at the anchorage points, and transverse cracks. When tendons are unfortunately exposed, clear defects could be observed as well, such as degraded ducts and corroded strands, a reduction in the cross-sectional area of the prestressing tendons, and leakage of the anchorage bars. VT is particularly useful for inspecting accessible anchorage zones, especially when end caps can be removed. However, its application is often limited by poor accessibility and the time required. VT is not capable of pinpointing defects in the early stages of deterioration, as visible signs typically appear only when damage has significantly progressed. Although preliminary, these observations are crucial for guiding further investigations and selecting appropriate NDT methods.
2.2. Borescope
The borescope (Bor) is an optical device used to perform visual inspection in hard-to-reach or inaccessible areas of the internal PT systems. It consists of a rigid or flexible tube equipped with an eyepiece or camera on one end and an illumination system on the other. The device is inserted into pre-drilled boreholes to inspect the condition of strands and grout within the duct areas that are otherwise impossible to observe directly from the outside of the concrete element. Because it provides an accurate representation of what is occurring within the ducts, the borescope is especially valuable for confirming findings from other NDT methods [
12].
Despite its effectiveness, the borescope offers only a localized view, limited to areas where voids are already suspected, and may not provide a complete assessment of the entire system, particularly in congested regions where visibility is restricted.
2.3. Ground-Penetrating Radar
Ground-penetrating radar (GPR) operates by transmitting electromagnetic waves from an antenna into a material. When these waves encounter an interface between materials with differing dielectric constants, part of the energy is reflected back to the surface, while the remainder continues to propagate. The greater the difference in dielectric constants, the stronger the reflected signal; conversely, a smaller difference results in weaker reflections and deeper wave penetration.
Due to the large difference between the dielectric constant of concrete and that of steel, GPR is very sensitive to the presence of metals in concrete, so the scan obtained from GPR clearly shows the location of metal ducts in a bright hyperbolic shape. GPR is unable to locate the HDPE duct layout itself, only the reflection created by the wires/strands within the HDPE duct. As a result, the final picture is less defined, making it necessary for the output to be analyzed by an expert. Moreover, in case of HDPE ducts, GPR can detect voids [
13], while for metal ducts, GPR is not able to detect voids because the high dielectric constant of the steel ducts does not allow the microwaves to transmit through the surface of the duct and reach the voids [
14]. Reinforcement congestion affects GPR’s ability to accurately locate ducts due to the presence of steel, which significantly reflects electromagnetic waves [
10].
2.4. Magnetic Flux Leakage
The magnetic flux leakage (MFL) technique operates by magnetizing ferromagnetic materials through the application of an external magnetic field [
15]. Due to the high magnetic permeability of steel, the induced magnetic flux preferentially travels through the material, following a path of least reluctance compared to surrounding non-magnetic media such as air or concrete. The presence of a geometric discontinuity, such as corrosion-induced metal loss, cross-sectional reduction, or strand breakage, disrupts the flux path, causing magnetic flux leakage. This is detected by magnetic sensors positioned near the surface, enabling the identification of defects.
According to a position paper [
16] of the German Society for Non-Destructive Testing, the MFL method presents certain limitations influenced by multiple factors, including the quantity and condition of prestressing steel, the thickness of concrete cover, the presence and configuration of conventional reinforcement, the strength of the applied magnetic field, and sensor resolution. The detection of wire fractures relies on interpreting characteristic magnetic signals; however, increased conventional reinforcement, particularly transverse elements like rebars, can obscure these signals. To address this, advanced filtering and selective magnetization techniques are employed to suppress interference from non-prestressed steel. Signal strength also diminishes with tendon depth, necessitating prior assessment of tendon location and test accuracy. MFL is effective for concrete covers up to 30 cm, with reliable signal detection up to 20 cm depth, enabling the identification of damage significant to structural integrity. Field studies have demonstrated MFL’s reliability, especially when combined with radar and enhanced data processing, achieving detection accuracies of 70–80%. Practical applications show high sensitivity in lightly reinforced or individually anchored systems, whereas bundled tendon configurations typically require a cross-sectional loss of 20–25% for reliable detection, with laboratory evidence indicating a detection threshold from 15%.
2.5. Impact Echo
The impact echo (IE) technique entails the application of a localized mechanical impulse on the surface of the tested element, typically using a steel ball or an instrumented impulse hammer, to generate low-frequency, high-energy stress waves that propagate through the material. A displacement transducer or accelerometer is positioned near the impact point to capture the reflected waveforms originating from internal anomalies and material discontinuities. Analysis of the time-domain and frequency-domain of these reflections enables the identification of internal defects, including voids, water infiltration, and inadequate grout filling. The use of IE for the detection of grouting deficiencies in PT ducts is recommended by the SI Guidelines [
5], and the technique is also standardized by FHWA [
17].
Experimental investigations conducted on full-scale post-tensioned girders [
18,
19] have demonstrated that IE is effective in localizing defect zones, but its accuracy in characterizing the defect type and severity is suboptimal. Reference [
19] evaluates an average error of 33% in estimating the severity of grout defects, a 50% error in identifying water infiltration in both metal and HDPE ducts, and a 65% error in voids.
2.6. Ultrasonic Techniques
Ultrasonic techniques include all methods that involve ultrasound (or ultrasonic) waves, which are acoustic waves with frequencies over 20 kHz. The principle behind these techniques is the same. When, during their propagation into a material, ultrasonic waves encounter areas with changes in impedance due to defects or discontinuities, some of the waves’ energy is reflected (echo) and measured by a sensor (s). By measuring the time between the emission and reception of the waves (time of flight) and the frequency/amplitude characteristics of the reflected waves, the location of defects or discontinuities can be determined.
The primary differences between the techniques lie in how the sensors are used. In the ultrasonic pulse echo or ultrasonic echo (UPE/USE) technique, a single transducer emits ultrasonic pulses from a single angle and measures the reflected pulses. The transducer is moved over the specimen’s surface to monitor the internal conditions. In the ultrasonic pulse velocity (UPV) method, two transducers are employed: one to emit the ultrasonic pulses and the other to record the reflected pulses. In ultrasonic tomography (UST), ultrasonic waves are emitted from multiple angles into the tested element, and data are collected from these various directions.
In one study [
19], USE was reported to identify the location of two-thirds of the water infiltration defects and one-third of the voids and compromised grout in internal ducts, with a precision less than 40% and without providing any metrics about the severity of such defects.
The compact and easy-to-handle nature of the UST device makes it suitable for conducting testing on-site or in real-world conditions. Although some researchers [
19] argued that the UST technique was ineffective in detecting grout defects in internal ducts, recent findings [
20] showed otherwise. In a laboratory campaign, UST was demonstrated to be able to identify voids larger than 30 cm with 95% confidence and 90% probability when the ducts’ depth was less than 15 cm. According to [
5], UST provides reliable results when the ducts are metallic, while HDPE ducts are generally recognized by the instrument as voids. The concrete cover influences the results of the UST, and as the thickness of the cover increases, the results become less reliable [
20]. Moreover, the inspector’s skill and experience play a fundamental role in adjusting the settings and correctly interpreting the results.
2.7. X-Ray Radiography
X-ray radiography (XRR) is a technique that produces a 2D image of an object by projecting high-energy beams of electromagnetic radiation (typically x-rays or gamma-rays). The rays penetrating the concrete are attenuated to a degree depending on the density and thickness of the element. The amount of radiation that penetrates the object determines the contrast of the image. In the case of a reinforced concrete structure, reinforcing bars will appear as lighter images against a darker background, provided that the concrete is homogeneous. The presence of pores or voids will be shown as darker spots or areas within the image.
XRR can locate metal ducts and detect voids of a given size more easily in homogeneous concrete with small aggregates than in heterogeneous concrete with large aggregates. Homogeneous concrete with small aggregates behaves almost like a uniform medium. The consistent density yields a clean, high-contrast image in which voids of a given size stand out clearly against the background. Non-homogeneous concrete with large aggregates introduces multiple, random-density variations that act as “parasitic reflections.” These create noise and reduce contrast, making it much harder to distinguish voids with dimensions comparable to or smaller than those of the aggregates [
21].
However, dense rebar can make it difficult to identify voids due to the higher density ratio between an air-filled void and the concrete/steel combination [
21]. Generally, this method is not very widespread in practical contexts because of the heavy and complicated equipment, poor suitability in some environments, need to access high voltage, and risks posed by X-rays to people (the method requires special protection for the operators, skilled personnel, traffic must be interrupted, etc.).
2.8. Open-Circuit Potential and Linear Polarization Resistance
The open-circuit potential (OCP) is the potential that exists in an open circuit when there is no current flowing between the metal and its surrounding electrolyte with respect to a reference electrode. The OCP is considered the same as the corrosion potential (or rest potential or equilibrium potential) because no external factors like current are disturbing the equilibrium potential. To perform the measurement, an electrical connection to the steel duct and ionic contact with the surface of a cementitious material are required. The steel element is the working electrode connected to a high-input impedance voltmeter, and an external reference electrode (copper/copper-sulphate reference electrode—CSE) is moved across the element surface to provide a map of potentials. According to ASTM C876 [
22], an OCP more electronegative than −0.35 VCSE generally indicates a corrosion probability of over 90%.
In the linear polarization resistance (LPR) test, the steel polarization resistance is used to estimate the corrosion rate through the Stern–Geary relationship , where B is a constant depending on the anodic and cathodic Tafel slopes. In the LPR test, three electrodes are necessary: in addition to the working electrode in contact with the steel duct and the reference electrode in contact to the element surface, a third electrode in ionic contact with the surface of the element is necessary to induce polarization between the working electrode and the reference electrode. The steel’s polarization resistance is estimated by dividing the change in potential by the change in current.
OCP and LPR tests can assist in distinguishing between active and passive corrosion states of steel strands within grout, so they are useful to identify affected volumes. However, they are not able to measure the corrosion rate and may not always identify pitting corrosion [
23].
2.9. Stress-Release Methods
Different from the previous techniques that aim at detecting or quantifying defects in the components of the PT system, stress-release methods are focused on quantifying the amount of prestress in concrete. Such methods include the drilled hole method (or stress-release coring), the saw-cut method, the flat-jack test, and the exposed strand method. These techniques estimate the in situ prestress by measuring the stress relieved through the mechanical interruption of structural continuity. The first three tests offer the advantage of being performed directly on the external concrete surface of the structural element, without exposing tendons. In contrast, the exposed strand method requires duct opening to access the strand directly.
The drilled hole method was originally standardized for steel components in mechanical and aeronautical applications [
24]. Several researchers [
25,
26] have adapted the method for concrete structures, where the small hole sizes used for steel are unsuitable due to the heterogeneous nature of concrete. However, in post-tensioned beams with parabolic cable layouts, limited concrete cover often prevents effective application of the method. To overcome these limitations, Kukay (2008) [
27] proposed the saw-cut method, which involves isolating a small block of concrete through transverse cuts and measuring the relieved strain using strain gauges bonded to the concrete surface. Although the technique is simple to perform in situ and cost-effective, its effectiveness is still under investigation due to the challenge of fully isolating the concrete block, as the cut depth must be limited to avoid damaging the tendons [
28,
29,
30]. Recent research [
31] has contributed to its validation on four full-scale prestressed concrete elements, showing good agreement with analytical and numerical predictions. Using parallel cuts 6 cm apart and 3 cm deep, the method underestimated the actual prestress by about 10%, with a coefficient of variation (CoV) of 21%, confirming its potential as a practical and reliable in situ technique.
The flat-jack test is widely used in masonry structural assessments [
32,
33], for which it is regulated by American standards (ASTM) [
34] and RILEM recommendations [
35]. However, there is a significant gap in research regarding its application to reinforced and prestressed concrete structures, with only a few references available [
36,
37]. This gap has been addressed by a recent study [
38], which investigated the use of the flat-jack test to estimate residual prestress in post-tensioned concrete elements. Tests on three concrete slabs using different flat-jack sizes and gauge lengths showed promising results, with accuracy errors below 15% and repeatability (CoV) around 40–45%. These findings support the potential of the method, although further validation is needed.
The exposed strand method [
39] differs from the other tests, as it is performed on the strand rather than the concrete. It estimates the prestressing force by comparing the load-displacement curve of the strand to a calibration diagram. Although the procedure appears simple, its accuracy strongly depends on factors such as strand geometry and exposed length. This method is more invasive than the others, and there are no recent references in the literature, with the last reported applications dating back to 1998 [
39].
2.10. X-Ray Diffraction
Like the exposed strand method, X-ray diffraction (XRD) [
40] requires the exposure of the strand, but it operates on a fundamentally different physical principle. In this approach, X-rays are directed at the strand wire to measure strain within the steel’s crystal lattice, enabling stress estimation based on the material composition and its elastic properties. XRD is commonly used in materials engineering to analyze crystalline structure. Recently, interest has grown in applying this technique to post-tensioned cables, with some studies [
41,
42] demonstrating reliable results for this application. Reference [
40] reported errors of approximately ±10% for typical working loads (60% of the yielding strength) and ±30% for lower working loads. However, the method is complex and time-consuming, both in terms of on-site execution and post-processing. In fact, XRD measurements are highly localized to a single point on the wire surface, so a finite element model is required to scale from the wire to the strand level and to estimate the overall tension in the tendon.
To summarize the information presented in this section,
Table 1 provides a comparative overview of the applicability of each NDT method in detecting specific types of defects in internal PT systems. The table is organized by type of duct (metallic or HDPE) and defect (void, corrosion, and prestress loss), indicating for each case whether testing methods are applicable (√) or not (×).
3. Multiphase Analysis
The SI Guidelines [
5] propose a multiphase process, as schematically shown in
Figure 1, to progressively enhance the understanding of the condition of the PT system and support the planning of targeted interventions.
Phase 0 focuses on deepening the understanding of the structure through a comprehensive historical–critical analysis of existing design and construction documentation, combined with the assessment of current defects in post-tensioned elements according to Level 2 of the Italian Guidelines LLGG2020 [
4]. This phase involves locating the tendons and verifying their actual positioning against the original design layout, formulating the basis for determining the number of tendons to be investigated in Phase 1 (preliminary testing). The required number of inspections is estimated by considering the structure’s geometric and typological characteristics, the definition of tendon populations (i.e., groups of tendons that are homogeneous in type, geometry, and length), the severity of defects, and the presence of structurally critical elements, as recommended in FHWA-HRT-13-028 [
44]. In the case of heterogeneous tendon configurations, the sampling strategy is applied independently to each identified subgroup to ensure statistical representativeness across the bridge. In the case of heterogeneous bridge populations, this classification is essential to ensure that each homogeneous population is adequately represented in the inspection plan. The sampling strategy is then applied independently to each population, allowing the calculated sample size to reflect variability across different tendon configurations and critical structural zones.
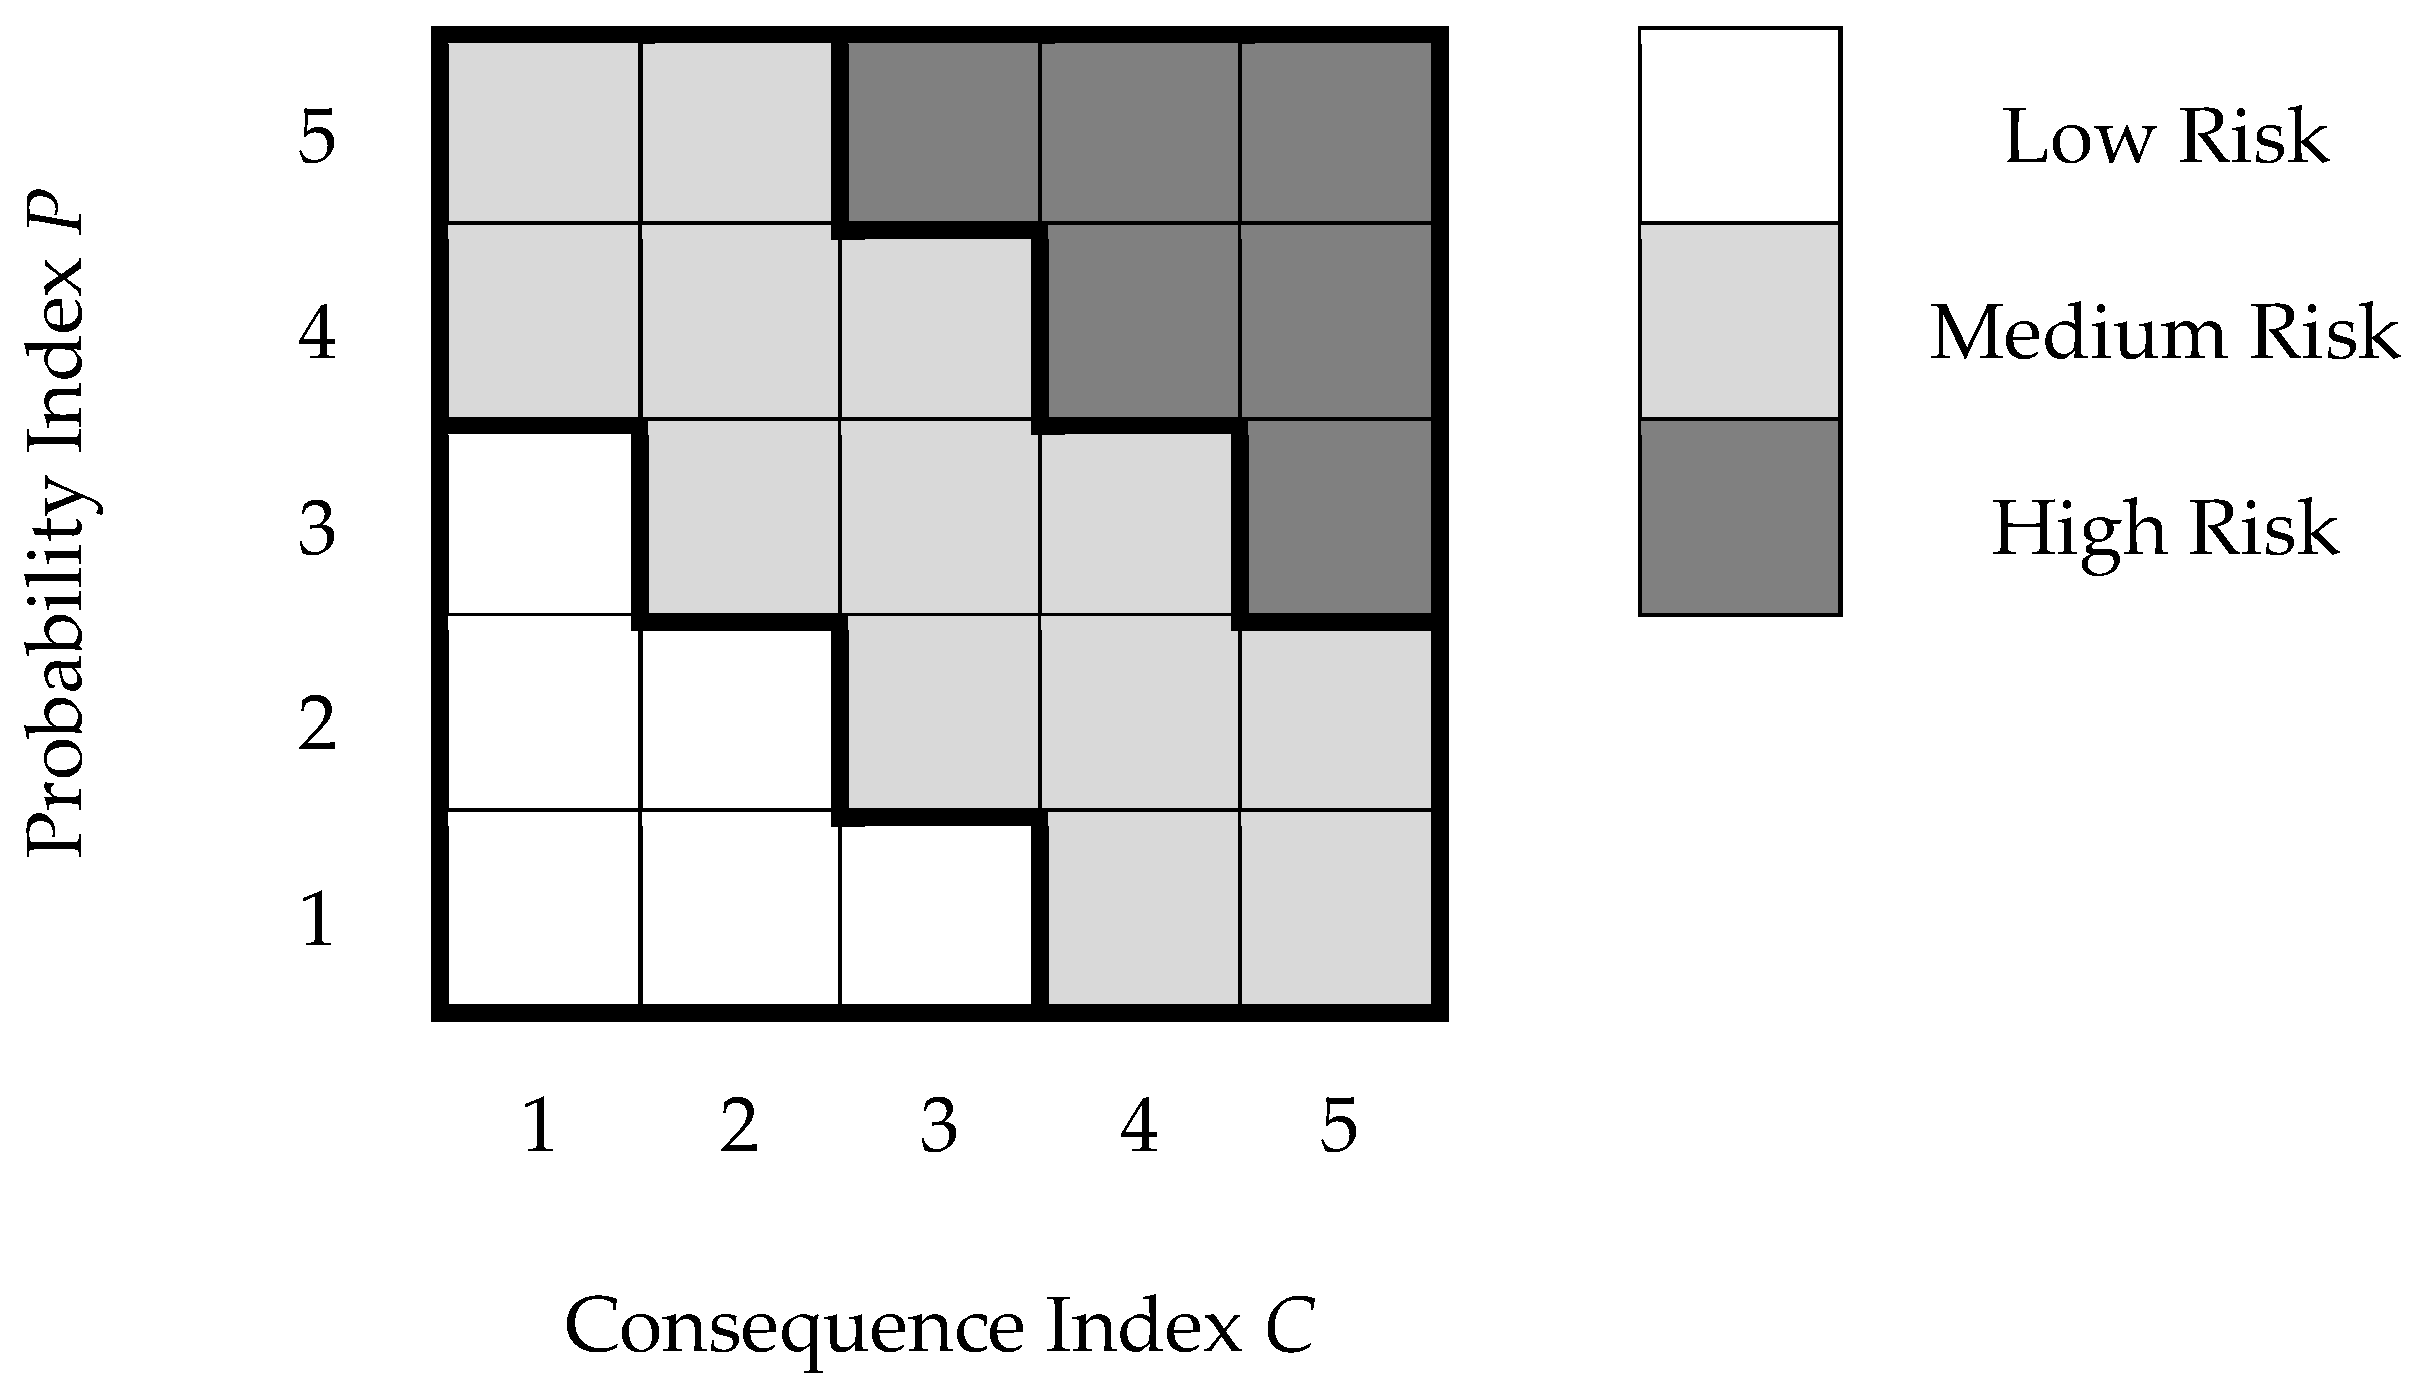
A fundamental step in this phase is the identification of all attributes of the prestressing system that may be vulnerable to deterioration or represent a potential structural hazard. These attributes, closely linked to construction techniques, detailing practices, and materials, can generally be retrieved through historical–critical analysis of available design and construction documentation. Finally, the number of tendons to be investigated is calculated based on two factors: the risk class (
R) and the impact level, where the risk class results from the combination of the probability index (
P) and the consequence index (
C), as in
Figure 2. Specifically, the probability index represents the likelihood of defects occurring within the duct system based on available inspection data, historical information, and environmental exposure. The consequence index, on the other hand, reflects the potential structural impact of tendon failure, considering factors such as redundancy, load distribution, and location within the structure. The risk matrix shown in
Figure 2 has been directly adapted from CS 465 [
45], which was developed through expert consensus and reflects a validated framework used in current engineering practice. Although no additional empirical validation has been conducted as part of this study, the adoption of this matrix ensures methodological consistency with established guidance.
Once the risk class has been determined and the impact level of the investigations has been established, it becomes possible to identify the maximum percentage of tendons potentially affected by defects within the group selected for testing. The impact level of the investigation is a qualitative parameter that guides the choice of tests to be carried out; if the level is considered low, it is necessary to employ only non-destructive or semi-destructive tests. Consequently, the minimum number of samples to be tested is calculated based on the total number of tendons within a given population and the estimated percentage of defective tendons, assuming a confidence level of 75% for these preliminary analyses, as suggested by FHWA [
44], which specifically addresses sampling strategies for post-tensioned tendon inspections. This confidence level is proposed for initial screening phases, where the goal is to obtain a practical balance between reliability and inspection effort, particularly when dealing with large populations of tendons and limited resources. To the number thus obtained, if there are clearly visible defects that could compromise the PT system, the tendons affected by such defects must be added. Once the number of tendons to be investigated for each population is defined, it becomes necessary to identify the specific tendons and the corresponding areas along them where the tests will be conducted. According to the draft SI Guidelines [
5] in line with CS 465 [
45], this selection process begins by identifying the most deteriorated deck spans based on the defectiveness assessed according to LLGG2020 [
4]. Among these, the beams showing the greatest concentration of issues are selected. Within each individual beam, tendon selection is then directed toward those showing the highest potential for voids. Once the tendons have been identified, the final step in Phase 0 involves defining the critical zones where the investigations will be focused. By the end of Phase 0, both the number of tendons to be investigated during Phase 1 and the specific areas of interest are clearly identified. Phase 1 is an operational phase during which the beam is prepared for the execution of tests aimed at locating and quantifying active defects and voids within the ducts. If such voids are found, a preliminary evaluation of the probability of corrosion is carried out. For this phase, test methods are selected (among those outlined in
Section 2) capable of identifying grout voids and estimating the likelihood of corrosion, with an explanation provided of the functioning principles behind each method. The proposed methodology in the following section considers both the accuracy of the individual tests and the broader management considerations of the infrastructure.
Phases 0 and 1 are mandatory for all bridges, irrespective of the extent of defects observed. Subsequent phases involve increasingly detailed evaluations, depending on the extent and seriousness of the identified issues.
4. Ranking Method
Building on the principles outlined in the introduction, this section presents the methodological framework developed for selecting the most suitable NDT methods for assessing post-tensioned (PT) bridges. The approach is based on the WSM, chosen for its simplicity, transparency, and adaptability, and integrates both technical and practical performance categories. A key feature of the proposed method is the adoption of a simplified three-level scoring scale, designed to align with the qualitative nature of available data and ensure robust, context-sensitive decision-making [
10].
4.1. Weighted Sum Model
In order to rank the NDT methods, a WSM is developed, which assigns an overall score to each NDT method based on its performance across selected evaluation categories: accuracy, ease of use, cost, and traffic impact. A specific weight is assigned to each category, reflecting its relative importance in the decision-making process. To ensure a practical and repeatable assessment, each performance index is assigned a discrete score corresponding to three qualitative levels: low (0.2), medium (0.5), and high (1.0). This tripartite scale balances ease of application with sufficient resolution for meaningful differentiation. By limiting the number of categories, the method reduces evaluator subjectivity while maintaining technical relevance. Similar scoring schemes have been adopted in several guidelines and manuals for structural and bridge inspection [
4,
46], reinforcing the robustness and familiarity of this approach in professional practice. The individual scores obtained by a method for each category are then multiplied by the corresponding weights, and the results are summed to yield a single aggregated score. This approach allows for a quantitative comparison of different NDT methods tailored to the specific deterioration condition being investigated. In other words, for any given damage scenario, the procedure calculates an overall performance score for each available method, enabling a systematic and objective ranking. Mathematically, the score for method
j (denoted as
SAj) is expressed as
where
aj,i is the individual score of method j for performance category
i and
wi is the weight for the
ith category.
4.2. Performance Categories
The chosen criteria reflect four key performance categories that are widely considered by end-users to be the most significant when assessing and comparing NDT techniques for evaluating post-tensioned concrete bridges. Each category can be further divided into subcategories, which together provide a comprehensive picture of a method’s overall performance in relation to the specific aspect being considered. A detailed description of these categories is presented in the following sections.
4.2.1. Accuracy
Accuracy refers to the degree to which an NDT method is able to provide metrics that reflect the actual condition of the structure, often referred to as the “ground truth.”
In the present context, accuracy is evaluated based on how effectively a given NDT technique can identify the location of a defect or assess the extent or severity of the associated damage.
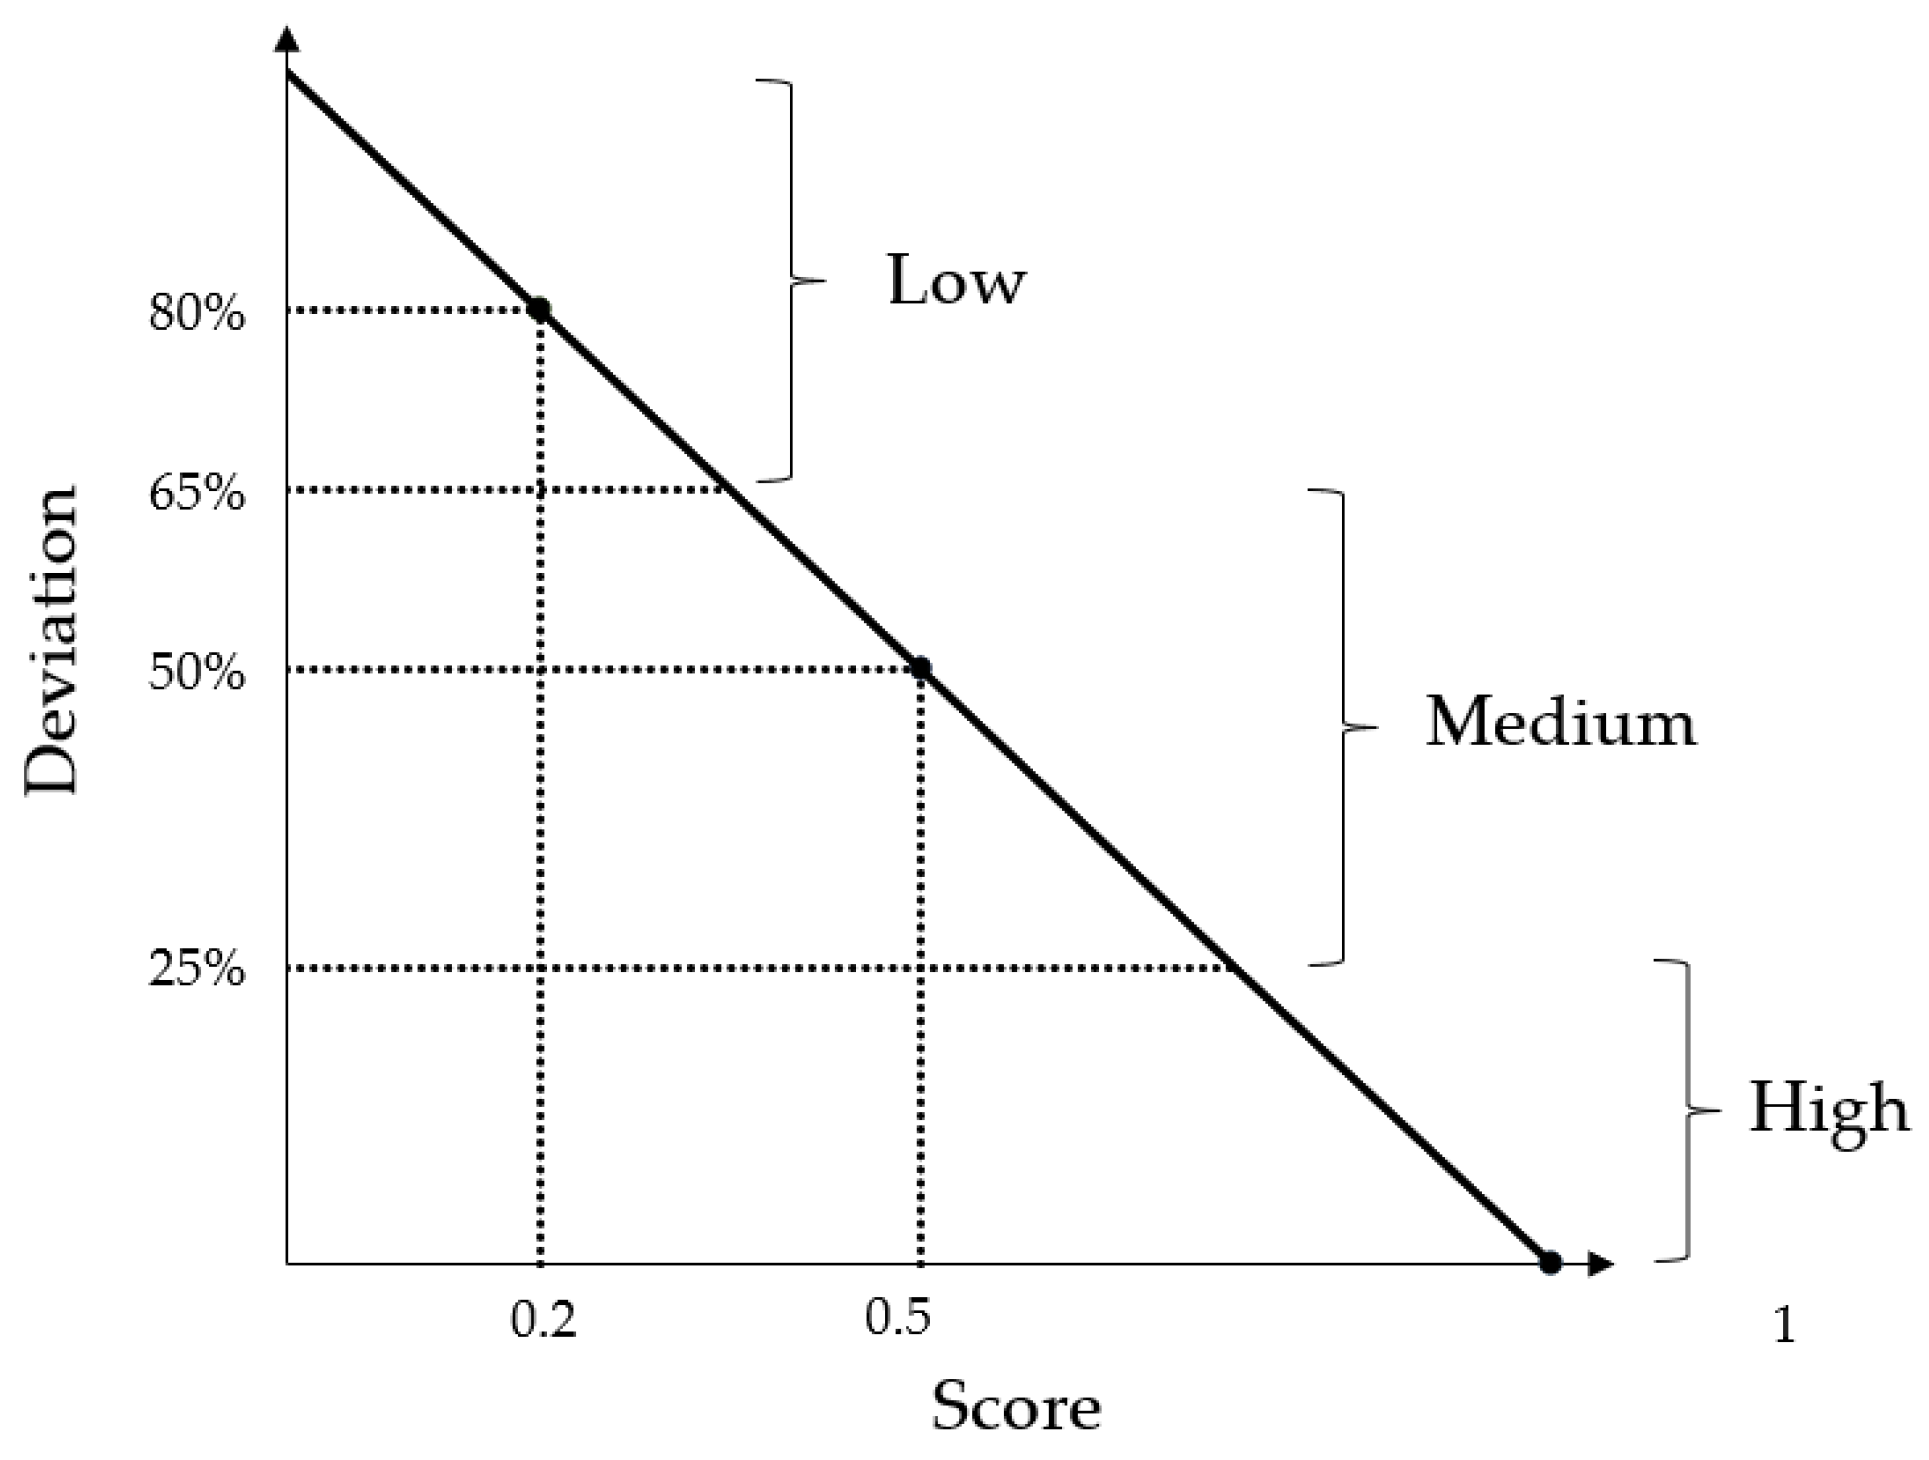
Accuracy is categorized into three distinct discrete ranges, depending on the deviation (ε) between the measurement output and the ground truth, each corresponding to a specific qualitative score (
Table 2). The rationale for the definition of the three ranges is illustrated in
Figure 3.
Depending on the nature of the defect under investigation, a particular method may be capable of performing only one of the two functions, locating the defect or estimating its severity, or both of them. In the latter case, the resulting scores for localization and severity assessment will be combined to yield a single final accuracy rating.
4.2.2. Ease of Use
Ease of use is a critical performance characteristic that directly affects measurement operations. It also influences the end-user who relies on the data, as increased uncertainty can compromise the quality of data acquisition. Furthermore, the bridge owner or operator may be impacted due to potential cost increases associated with the method’s complexity.
The ease of use of an NDT technique is assessed considering four factors: power demand, personnel demand, calibration, and data processing. Power demand and personnel requirements are largely determined by the specific characteristics of the testing equipment. Specifically, power demand is evaluated based on the type of energy required by the instruments, ranging from low-voltage battery power to high-voltage direct power. Personnel demand considers both the number of people necessary for transporting and setting up the equipment and the number of people needed on-site for testing.
In contrast, calibration and data processing have a wider influence on the quality of the results, as these factors may involve different levels of expertise and training or complex post-processing tasks, especially in the case of indirect methods. The calibration factor is rated according to the needs of the equipment, with some instruments requiring detailed on-site calibration involving lengthy procedures or consideration of the specific properties of the bridge’s materials, while others may only need simple self-calibration. Data processing is rated based on the complexity of the procedures and required skills.
The scores for power demand, personnel demand, calibration, and data processing are all presented in
Table 3. These scores were defined through structured consultations with technical experts and Italian laboratories regularly involved in field inspections of prestressed concrete structures. These laboratories provided practical insights based on operational experience with a wide range of NDT methods, including challenges encountered during equipment calibration, on-site adjustments, and data interpretation procedures. While the assessment remains qualitative, the scoring reflects actual operational feedback grounded in real-world experience, ensuring realistic and field-based comparability between methods. The ease-of-use score is calculated as the average of the four subcategory scores, providing a composite metric that reflects the overall practicality and user-friendliness of the method under real-world conditions. This approach allows the ranking to account for both technical complexity and field deployability, as experienced in actual inspection campaigns.
In some cases, weighting factors can be applied to the individual subcategories to adjust the final score according to the specific needs and context of the investigation. For example, in a scenario where time efficiency is of particular importance, the power demand or personnel requirements might be given a higher weight. Similarly, if the precision of calibration or the complexity of data processing is a critical consideration, those aspects could be prioritized. These adjustments allow the scoring system to be tailored to the unique demands of different applications, offering a more flexible and precise evaluation of the NDT technique’s ease of use.
4.2.3. Traffic Impact
Traffic impact is a crucial consideration for road infrastructure managers, as it quantifies the degree of disruption that inspection activities may cause to the normal traffic flow across a bridge. In the current framework, traffic impact is assessed through two key parameters: roadway occupancy and inspection duration (
Table 4), both defined on a per-span basis and calibrated to reflect typical field conditions. These parameters were established based on structured interviews with experienced infrastructure managers from public agencies and concessionaires responsible for the planning and execution of bridge inspections. While no full-scale field trials were conducted specifically for this study, the scoring system draws from real-world experience and established practices observed in recent inspection campaigns. This empirical input enhances the practical robustness of the classification.
Roadway occupancy distinguishes between NDT methods that can be conducted entirely from underneath the bridge or within the emergency lane, thereby causing negligible or little disruption, and those that require partial or full lane closures.
Inspection duration refers not only the execution time of the test itself but also the setup and dismantling of equipment. Longer durations generally result in more extended traffic interference and higher indirect costs.
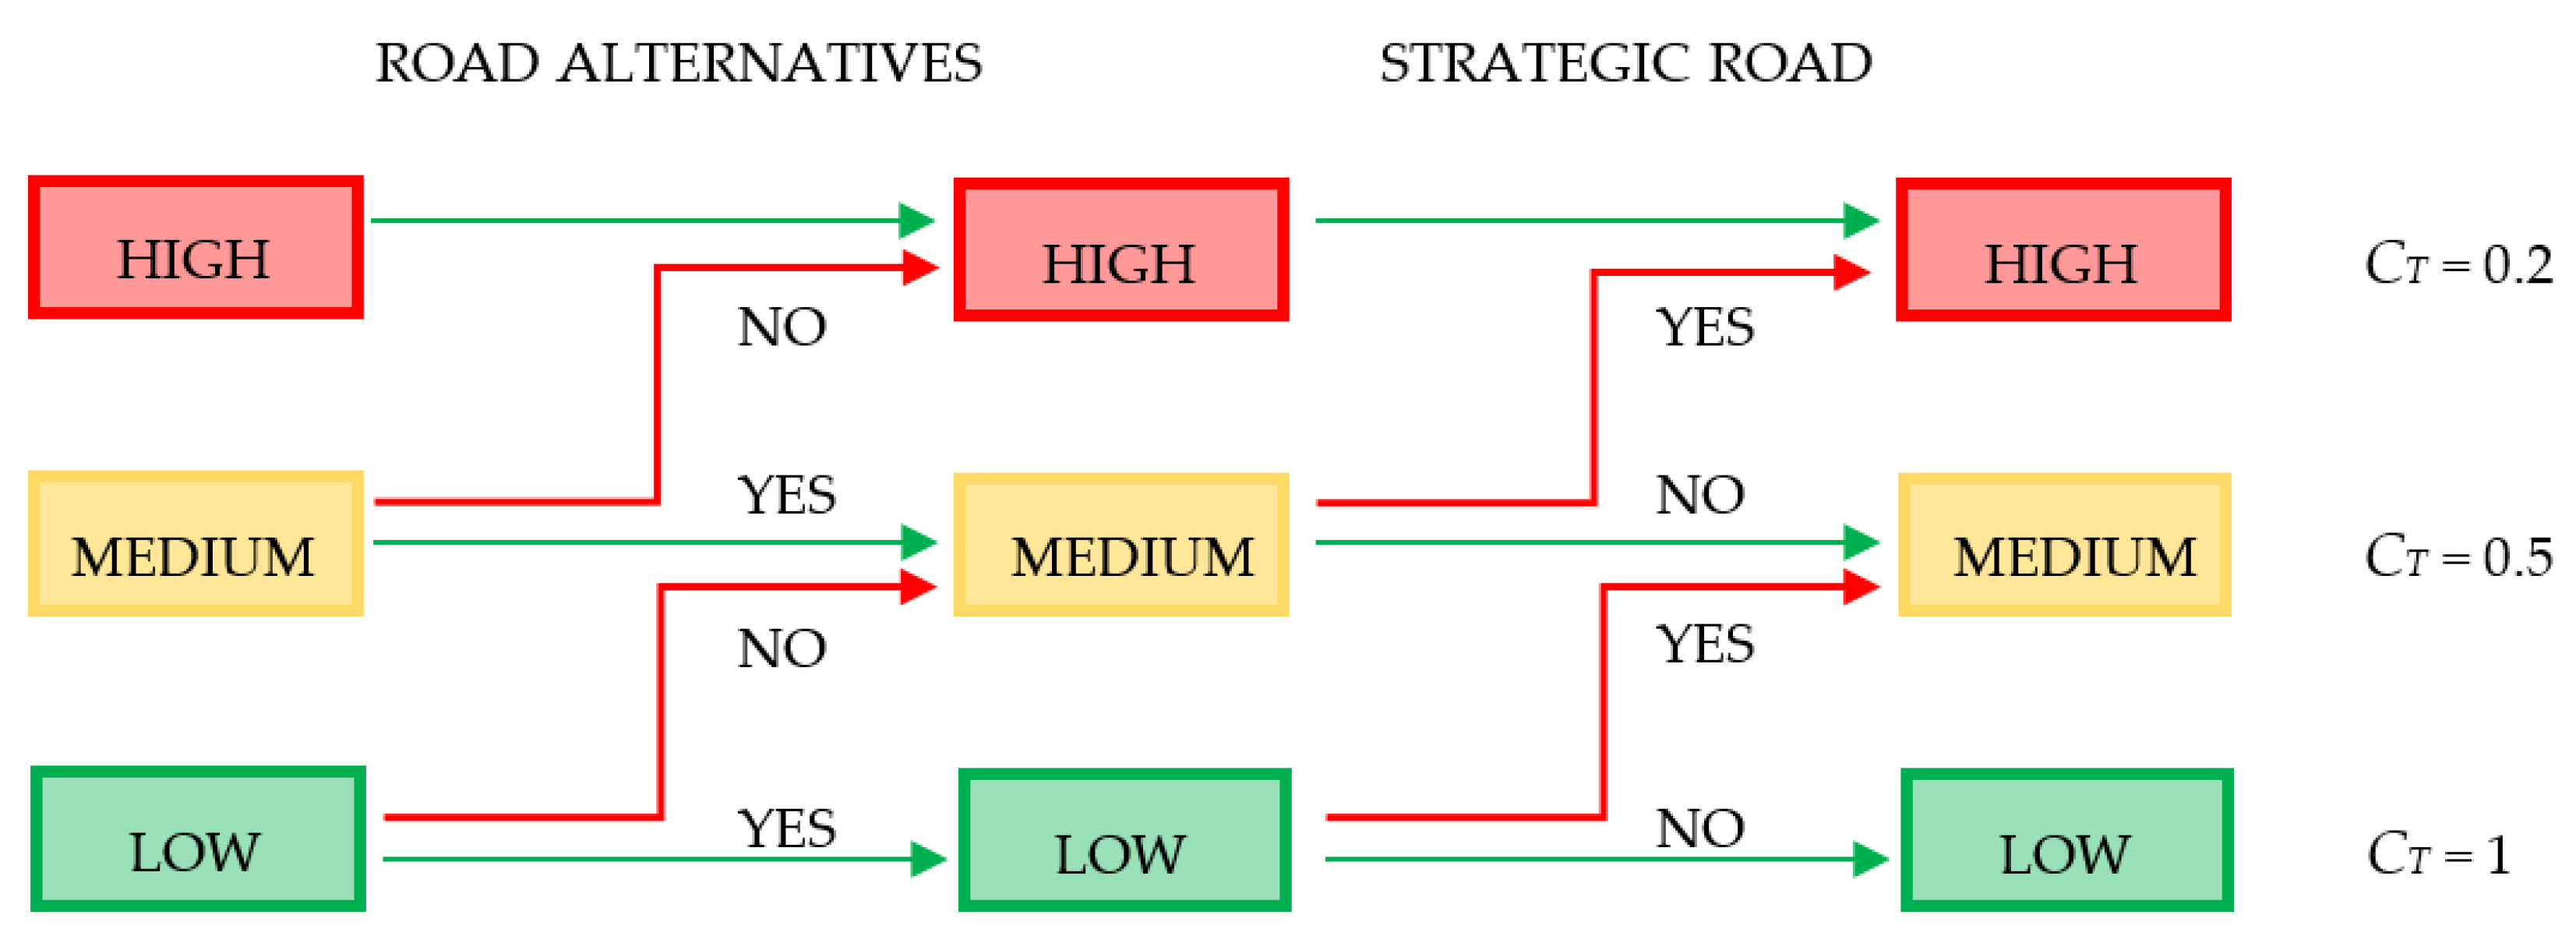
The relative importance of traffic disruption also depends on the strategic role of the bridge in the road network. This is typically characterized by the average daily traffic (ADT) and the availability of alternative routes. To account for this, the average score of the two subcategories (occupancy and duration) is multiplied by a traffic coefficient (
CT), which adjusts the impact score based on ADT. The base traffic class coefficient,
CT,0, is assigned as a function of ADT values, as shown in
Table 5.
In situations where no viable alternative routes are available to accommodate diverted traffic during the inspection, the traffic class is increased by one level. If detour options are available, the initial classification is maintained.
Another important consideration is the strategic relevance of the bridge. Structures deemed critical for emergency access or civil protection, such as those required for response operations following seismic events, are considered strategic. For such bridges, the traffic class is also increased by one level to reflect their importance within the network.
The overall procedure, including the adjustment of the traffic coefficient based on these contextual factors, is illustrated in
Figure 4, which visually summarizes how the final traffic parameter is assigned according to the bridge’s classification.
By considering both the impact score and the traffic coefficient, the overall score for traffic impact can be determined as their arithmetic mean.
4.2.4. Cost
This category reflects the overall financial burden associated with performing the inspection, which is ultimately borne by the client. It includes all relevant expenses tied to the use of a specific NDT method, such as the purchase or rental of the equipment; labor costs; supplementary expenses such as training, equipment setup, and dismantling; and any other logistical requirements that may arise during the inspection process.
To enable consistent comparison across different NDT methods, the cost of each technique (
Ci) is evaluated relative to the average cost (
Cavg) of all methods applicable to same type of deterioration. This relative normalization mitigates the influence of market variability and project-specific cost structures, which can differ substantially across contracts and contexts. Cost is considered in two components: equipment cost and labor cost, which can vary significantly depending on the complexity of the method and the required expertise. Importantly, this analysis excludes costs related to access arrangements (e.g., scaffolding or platforms) to focus solely on the intrinsic cost of the testing method. A ±25% deviation threshold around the average cost is used to define cost-effectiveness levels. This range reflects typical variability observed in recent procurement data and technical offers from certified inspection providers. It also allows for approximate but informative cost comparisons in the early planning phase, when detailed cost breakdowns may not yet be available. The resulting cost score is assigned using the criteria described in
Table 6 and contributes to the overall performance assessment.
4.3. Weight Factors
As described in Equation (1), the process of combining the individual scores associated with a specific NDT technique across the four evaluation categories involves the use of weighting factors. These weights serve to adjust the influence of each criterion, allowing the final assessment to reflect the priorities of different decision-making contexts defined by the end-user. This flexible approach ensures that the evaluation method remains adaptable to various practical needs encountered during bridge inspections.
Table 7 presents a set of recommended weighting factors tailored to three common decision scenarios: the accuracy-oriented Scenario, the cost-oriented scenario, and the impact-oriented scenario. The weighting factors assigned to each performance index were defined following consultations with domain experts and discussions with relevant stakeholders involved in bridge management and inspection. This participatory approach ensured that the selected weights reflect practical priorities and field experience while also aligning with current inspection practices. The use of expert-informed weights enhances the robustness and applicability of the proposed ranking method across real-world scenarios.
The framework is designed to allow for the flexible modification of the weights assigned to the various performance categories, enabling end-users to tailor the decision-making process to context-specific constraints and priorities. For example, if access is severely limited or specialized operators are unavailable, a higher weight can be assigned to ease of use or lower personnel demand, directly influencing the ranking of candidate NDT methods.
For the formulation of new decision scenarios, the assignment of weights should be guided by expert judgment and context-specific practical considerations. However, to ensure internal consistency and comparability across different applications, the authors propose the following general recommendations, informed by sensitivity analyses (an example will be provided in
Section 5). The driving category (i.e., the primary decision criterion) should typically be assigned a weight in the range of 0.5 to 0.7, while the accuracy category—when not serving as the main driver—should receive a default weight of 0.2. To maintain meaningful contribution, a minimum recommended weight of 0.05 is suggested for any evaluation category; categories assigned lower values may be considered for exclusion due to their limited relevance in the specific decision-making context.
The accuracy-oriented scenario places the greatest emphasis on the accuracy of the method, making it particularly suitable in cases where a highly precise assessment is required. This often applies to the inspection of a single structure, especially when potential defects or deterioration are already suspected or partially identified and a detailed diagnostic is crucial for decision-making.
The cost-oriented scenario, in contrast, gives more weight to the economic aspect of the evaluation. It is particularly relevant when inspecting a large number of bridges within a network, where resource allocation and the optimization of inspection costs become primary concerns.
Finally, the impact-oriented scenario prioritizes the minimization of service disruption and user discomfort, making it ideal for road networks characterized by high traffic density. In such contexts, the ability to conduct inspections with minimal interference to traffic flow is a key requirement. On the other hand, in cases in which none of the operations interfere with traffic or all the operations can be performed under the bridge, the weight must be considered equal to zero.
This structured and scenario-driven approach enhances the applicability of the method across different operational contexts, ensuring that the evaluation criteria align with the overarching goals of the inspection campaign. Moreover, it allows for the creation of customized scenarios that take into account the practical constraints specific to the site or the local market conditions.
It is worth noting that the proposed methodology is currently based on a single-objective approach applied iteratively for each specific defect type (e.g., voids, corrosion, or prestress loss). For each defect, the weighted sum method (WSM) is used to rank only the NDT techniques that are capable of detecting that particular condition. This results in a tailored ranking of the most suitable methods for each individual assessment objective.
When multiple types of defects need to be assessed simultaneously, the methodology is applied separately for each defect. The resulting rankings can then be used to identify an optimal set of NDT methods that collectively address the full spectrum of diagnostic needs. While the current framework does not integrate results from multiple NDTs directly, it is structured to support such combined use by guiding selection based on overlapping capabilities and practical constraints. Further integration strategies, including result fusion or adaptive weighting, may be explored in future developments of the framework.
5. Case Study
The method outlined in the previous section was applied to a real-world case study. The selected bridge was chosen for two reasons: data availability and representativeness. First, the structure had been recently inspected by the authors, providing full access to detailed documentation, visual records, and preliminary diagnostic results, an essential condition for applying and validating the proposed framework in a realistic setting. More importantly, the bridge is characteristic of the Italian post-tensioned bridge stock, particularly in terms of structural typology, construction period (post-WWII to 1980s), and prestressing layout, and it embodies common features and challenges observed in many existing PT bridges in Italy. As such, it serves as a meaningful and representative testbed for evaluating the framework’s practical applicability and diagnostic decision-making process.
As a first step, visual inspections were carried out on the structure in accordance with LLGG2020 [
4] in order to evaluate the condition and defectiveness of its PT elements. Subsequently, the number and location of test points were determined based on the proposed SI Guidelines [
5]. Finally, considering that the bridge belongs to a non-strategic provincial road with no available alternative routes, the proposed methodology was adopted to define the most suitable testing approach for detecting voids in the ducts, corrosion, and residual tension considering three proposed scenarios: an accuracy-driven scenario, a cost-driven scenario, and an impact-driven scenario.
5.1. Bridge Description
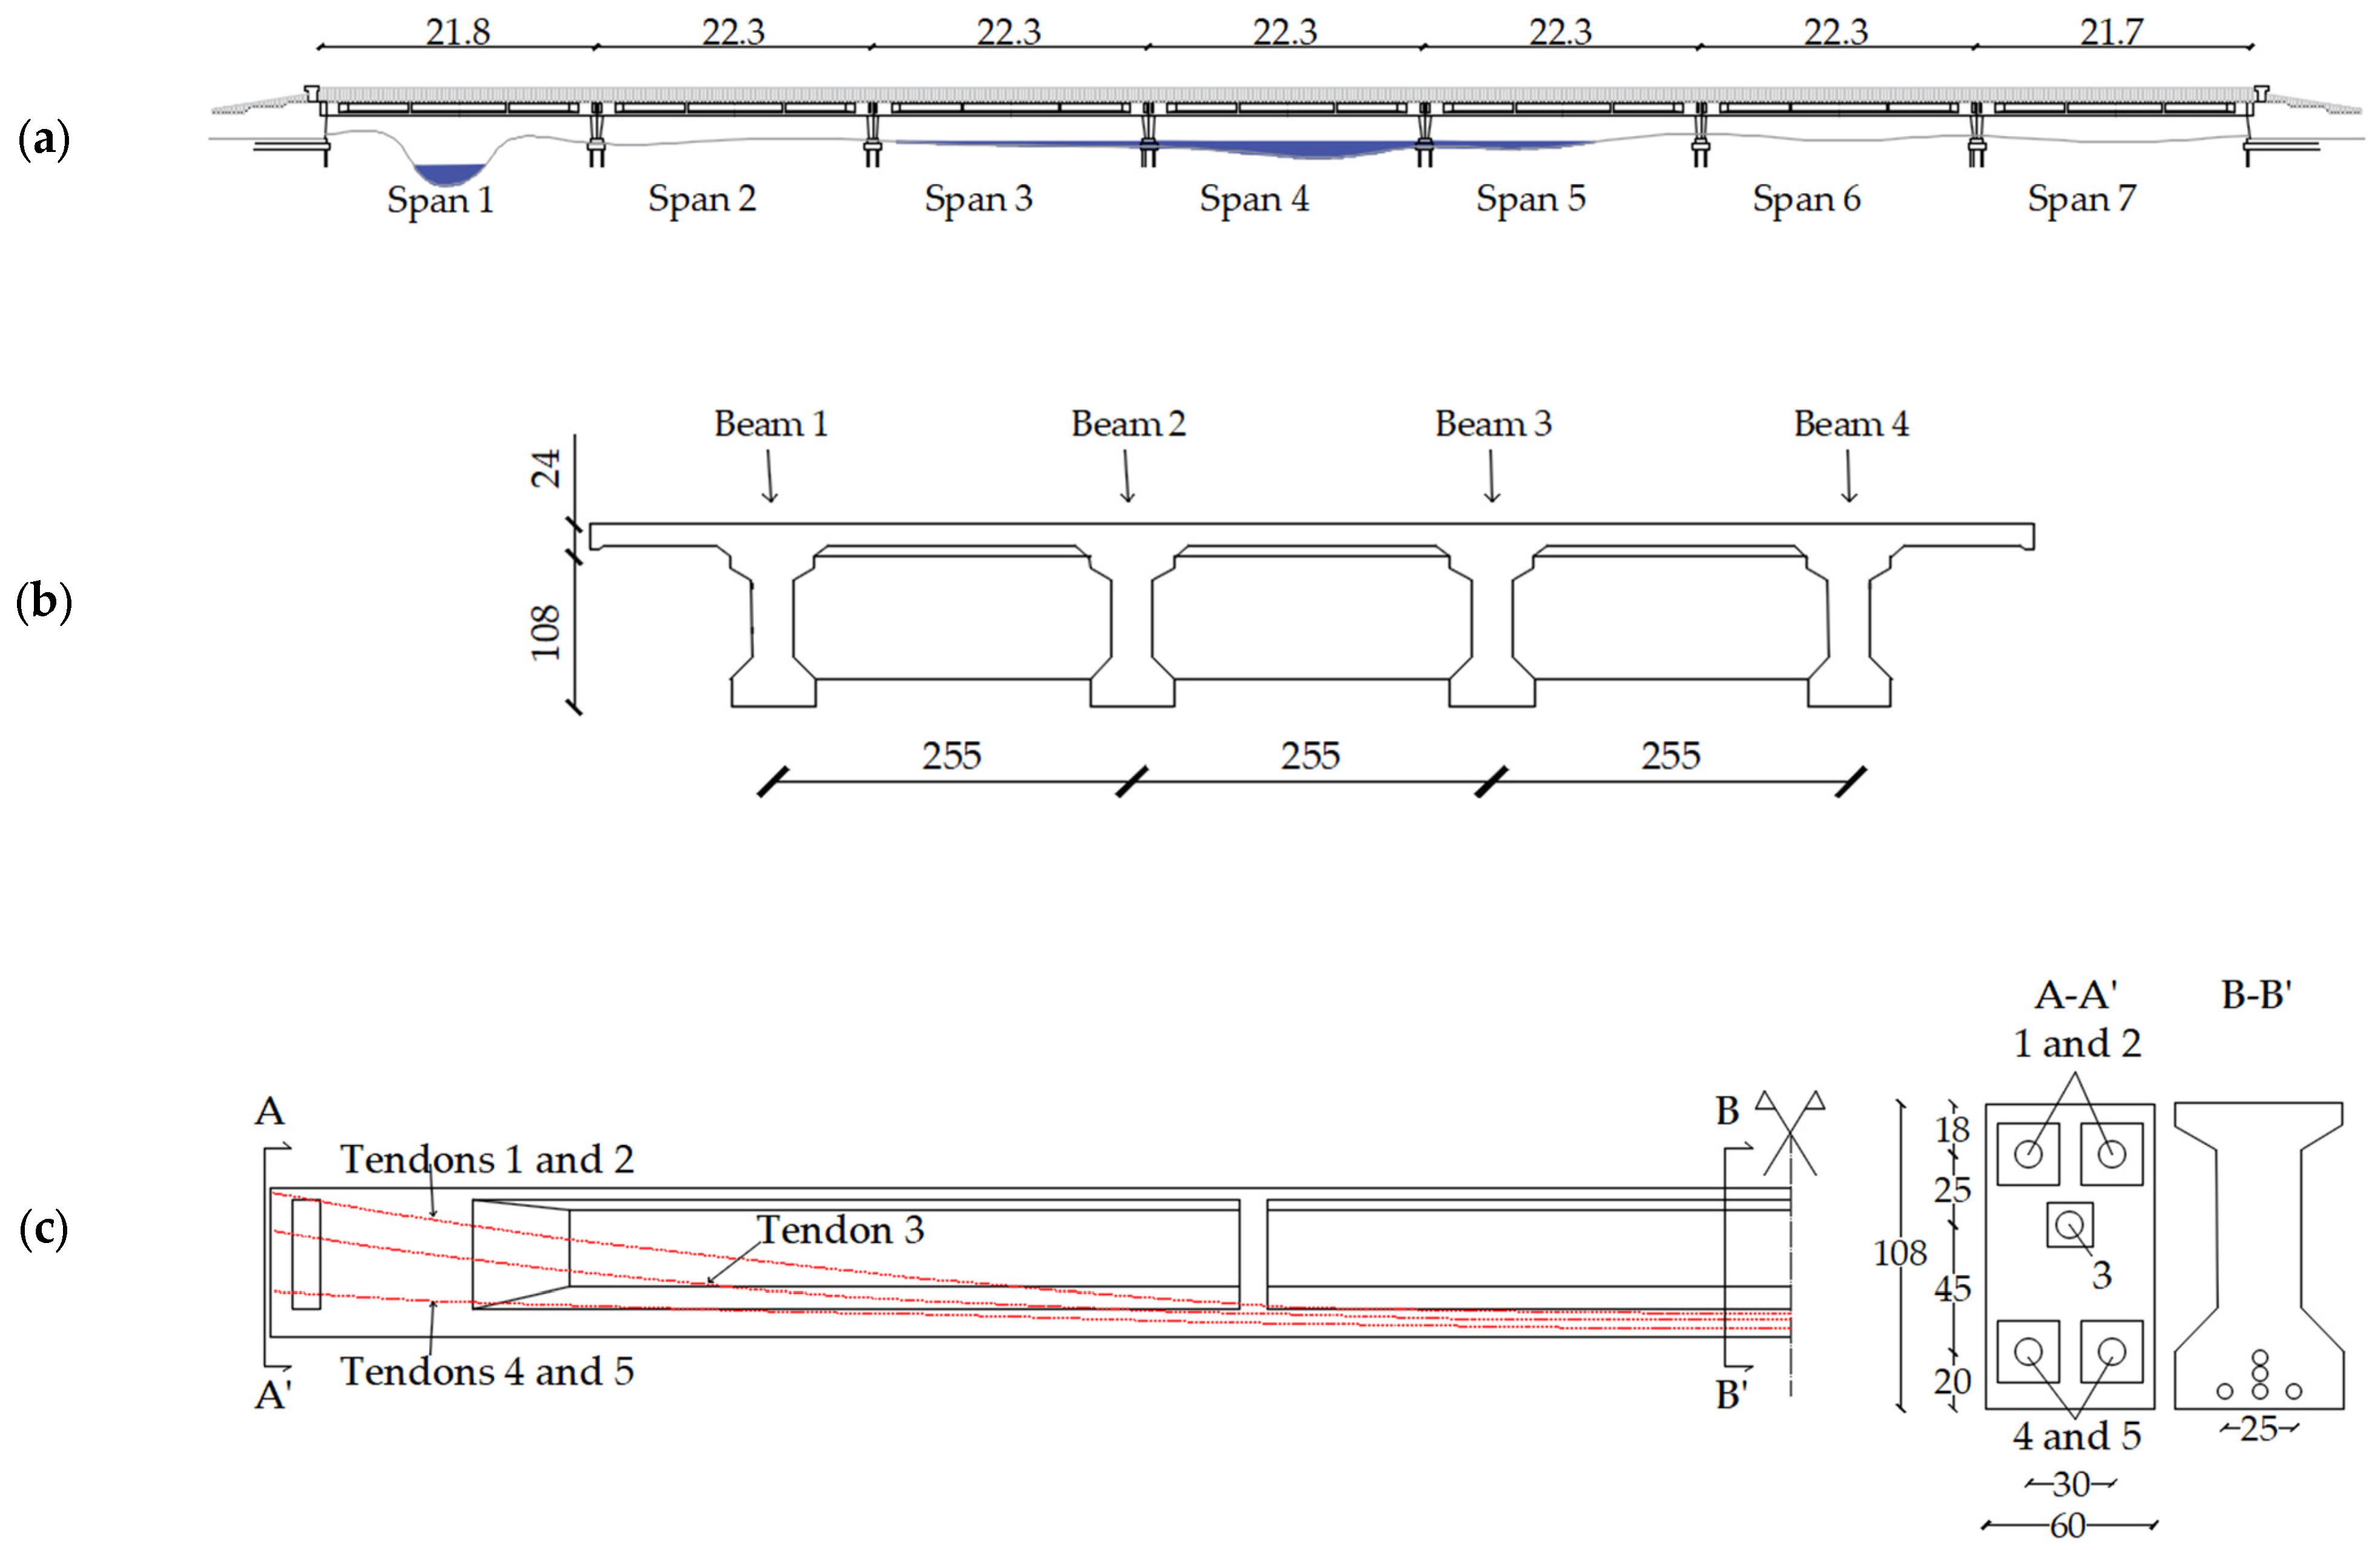
The structure consists of seven straight-axis spans with simply supported girder decks. The average span length is 22.1 m, with a maximum span of 22.3 m, resulting in a total bridge length (abutment to abutment) of 155.2 m, as in
Figure 5a. Each of the seven decks comprises four prestressed concrete beams spaced at 2.55 m center-to-center, shown in
Figure 5b, for which the tendon layout is known, as in
Figure 5c. The decks also include four prestressed transverse elements, two end diaphragms, two intermediate crossbeams, and a reinforced concrete slab.
The prestressed concrete beams are post-tensioned with unbonded tendons: the external beams contain five tendons with 42 strands of ϕ5 mm each (42ϕ5), while the internal beams have four 42ϕ5 tendons and one tendon with a different section (13ϕ5), which corresponds to tendon 3 in
Figure 5c. The crossbeams are also post-tensioned with unbonded tendons, each incorporating two straight 26ϕ5 tendons. The decks are supported by six single-shaft hollow polygonal-section reinforced concrete piers, approximately 2.80 m in height, and two thin-walled reinforced concrete abutments with buttresses. The bridge spans a river along spans 3, 4, and 5.
5.2. Identification of Tendons Subject to Special Inspection
In accordance with the methodology outlined in
Section 3, following the completion of the historical–critical analysis and the inspection activities in compliance with LLGG2020 [
4], distinct tendons populations are identified based on variations in type, geometry, and length. For each identified population, the risk class and the inspection impact level are independently assessed by determining the probability index (
P) and the consequence index (
C). This process enables the definition of the number of tendons to be investigated within each specific population.
Three distinct populations of post-tensioned tendons are identified: the first population includes the 42ϕ5 tendons located in the lateral and central beams (126 tendons); the second comprises the 13ϕ5 tendons found in the central beams (14 tendons); and the third consists of the 26ϕ5 tendons placed in the crossbeams (56 tendons).
Table 8 summarizes the parameters considered in Phase 0 to identify the minimum number of samples to be tested. Based on the structure’s attributes and the results of visual inspections, the probability index,
P, and the consequence index,
C, are defined, leading to the risk class,
R, according to the matrix in
Figure 2. By preliminarily setting a medium impact level for the investigations, the maximum percentage of tendons potentially affected by defects within the group selected for testing is determined. Given the maximum percentage of defective tendons and the number of tendons in each population, the minimum number of samples to be tested can be determined, assuming a 75% confidence level for the preliminary analysis.
Once the number of tendons to be tested is defined, the most deteriorated deck spans are selected, the beams with the highest concentration of issues are identified, and the tendons most likely to contain voids are chosen for investigation. Phase 0 concludes with the definition of both the tendons to be investigated and the critical zones along them. To proceed from Phase 0 to Phase 1, it is necessary to select the void detection methodology from those presented in
Section 2.
5.3. Selection of a Non-Destructive Technique
In this section, the proposed method is applied to select the most suitable testing technique for detecting the possible presence of voids in ducts, corrosion, and residual tension. As outlined in
Section 2, the available testing methods for void detection include impact echo (IE), ultrasonic echo (USE), ultrasonic tomography (UST), and X-ray radiography (XRR). For the detection and evaluation of corrosion and corrosion potential, the techniques considered are magnetic flux leakage (MFL), linear polarization resistance (LPR), and open-circuit potential (OCP). Meanwhile, the assessment of residual prestress is performed using the saw-cut method (SCM), flat-jack test (FJT), and X-ray diffraction (XRD).
Table 9 provides a summary of the attribute scores for each performance category of the selected testing methods. As discussed in
Section 4, the ranking regarding accuracy, ease of use, and cost is generally intrinsic to the testing method, whereas impact must be assessed in the context of the specific structure. In fact, roadway occupancy depends on what the bridge crosses, and the duration of the test is influenced by the number of measurements required and the speed at which equipment can be moved from one testing point to another.
Based on the three scenarios outlined in
Table 6, the most suitable testing method for each case can be identified by applying the corresponding weights to the performance categories.
Table 10 presents the weighted scores for each category across the scenarios, highlighting the top two methods in each case.
For the detection of voids, in the accuracy-driven scenario, UST emerges as the most appropriate method, closely followed by XRR. In the cost-driven scenario, these are replaced by USE and IE, respectively. For the impact-driven scenario, the most suitable techniques are the ultrasonic methods, with UST ranked first and USE second. Notably, the impact-driven scenario generally yields lower overall scores. This is primarily due to the presence of a river beneath the structure, which naturally results in greater impact. In the case study presented, UST consistently emerged as one of the most effective methods, particularly in accuracy and impact-driven scenarios. Conversely, in cost-sensitive contexts, simpler and more accessible methods such as USE and IE prove to be more viable, offering a reasonable balance between performance and affordability.
Regarding corrosion and residual prestress, even though fewer test methods are compared, it is observed that for corrosion, the most accurate method, LPR, proves to be the best choice in both the accuracy-driven and impact-driven scenarios, while in the cost-driven scenario, OCP emerges as the optimal method. For residual prestress, XRD, which offers the highest accuracy, is the preferred choice in the accuracy-driven scenario but is replaced by FJT in the other two scenarios, as the latter is both faster and more cost-effective.
The results also highlight that traffic impact plays a pivotal role in reducing the total score of otherwise effective methods. This was evident in the impact-driven scenario, where lower overall scores were observed due to contextual constraints, which inherently increased the inspection’s traffic disruption. This finding emphasizes the importance of integrating environmental and logistical factors into the selection framework.
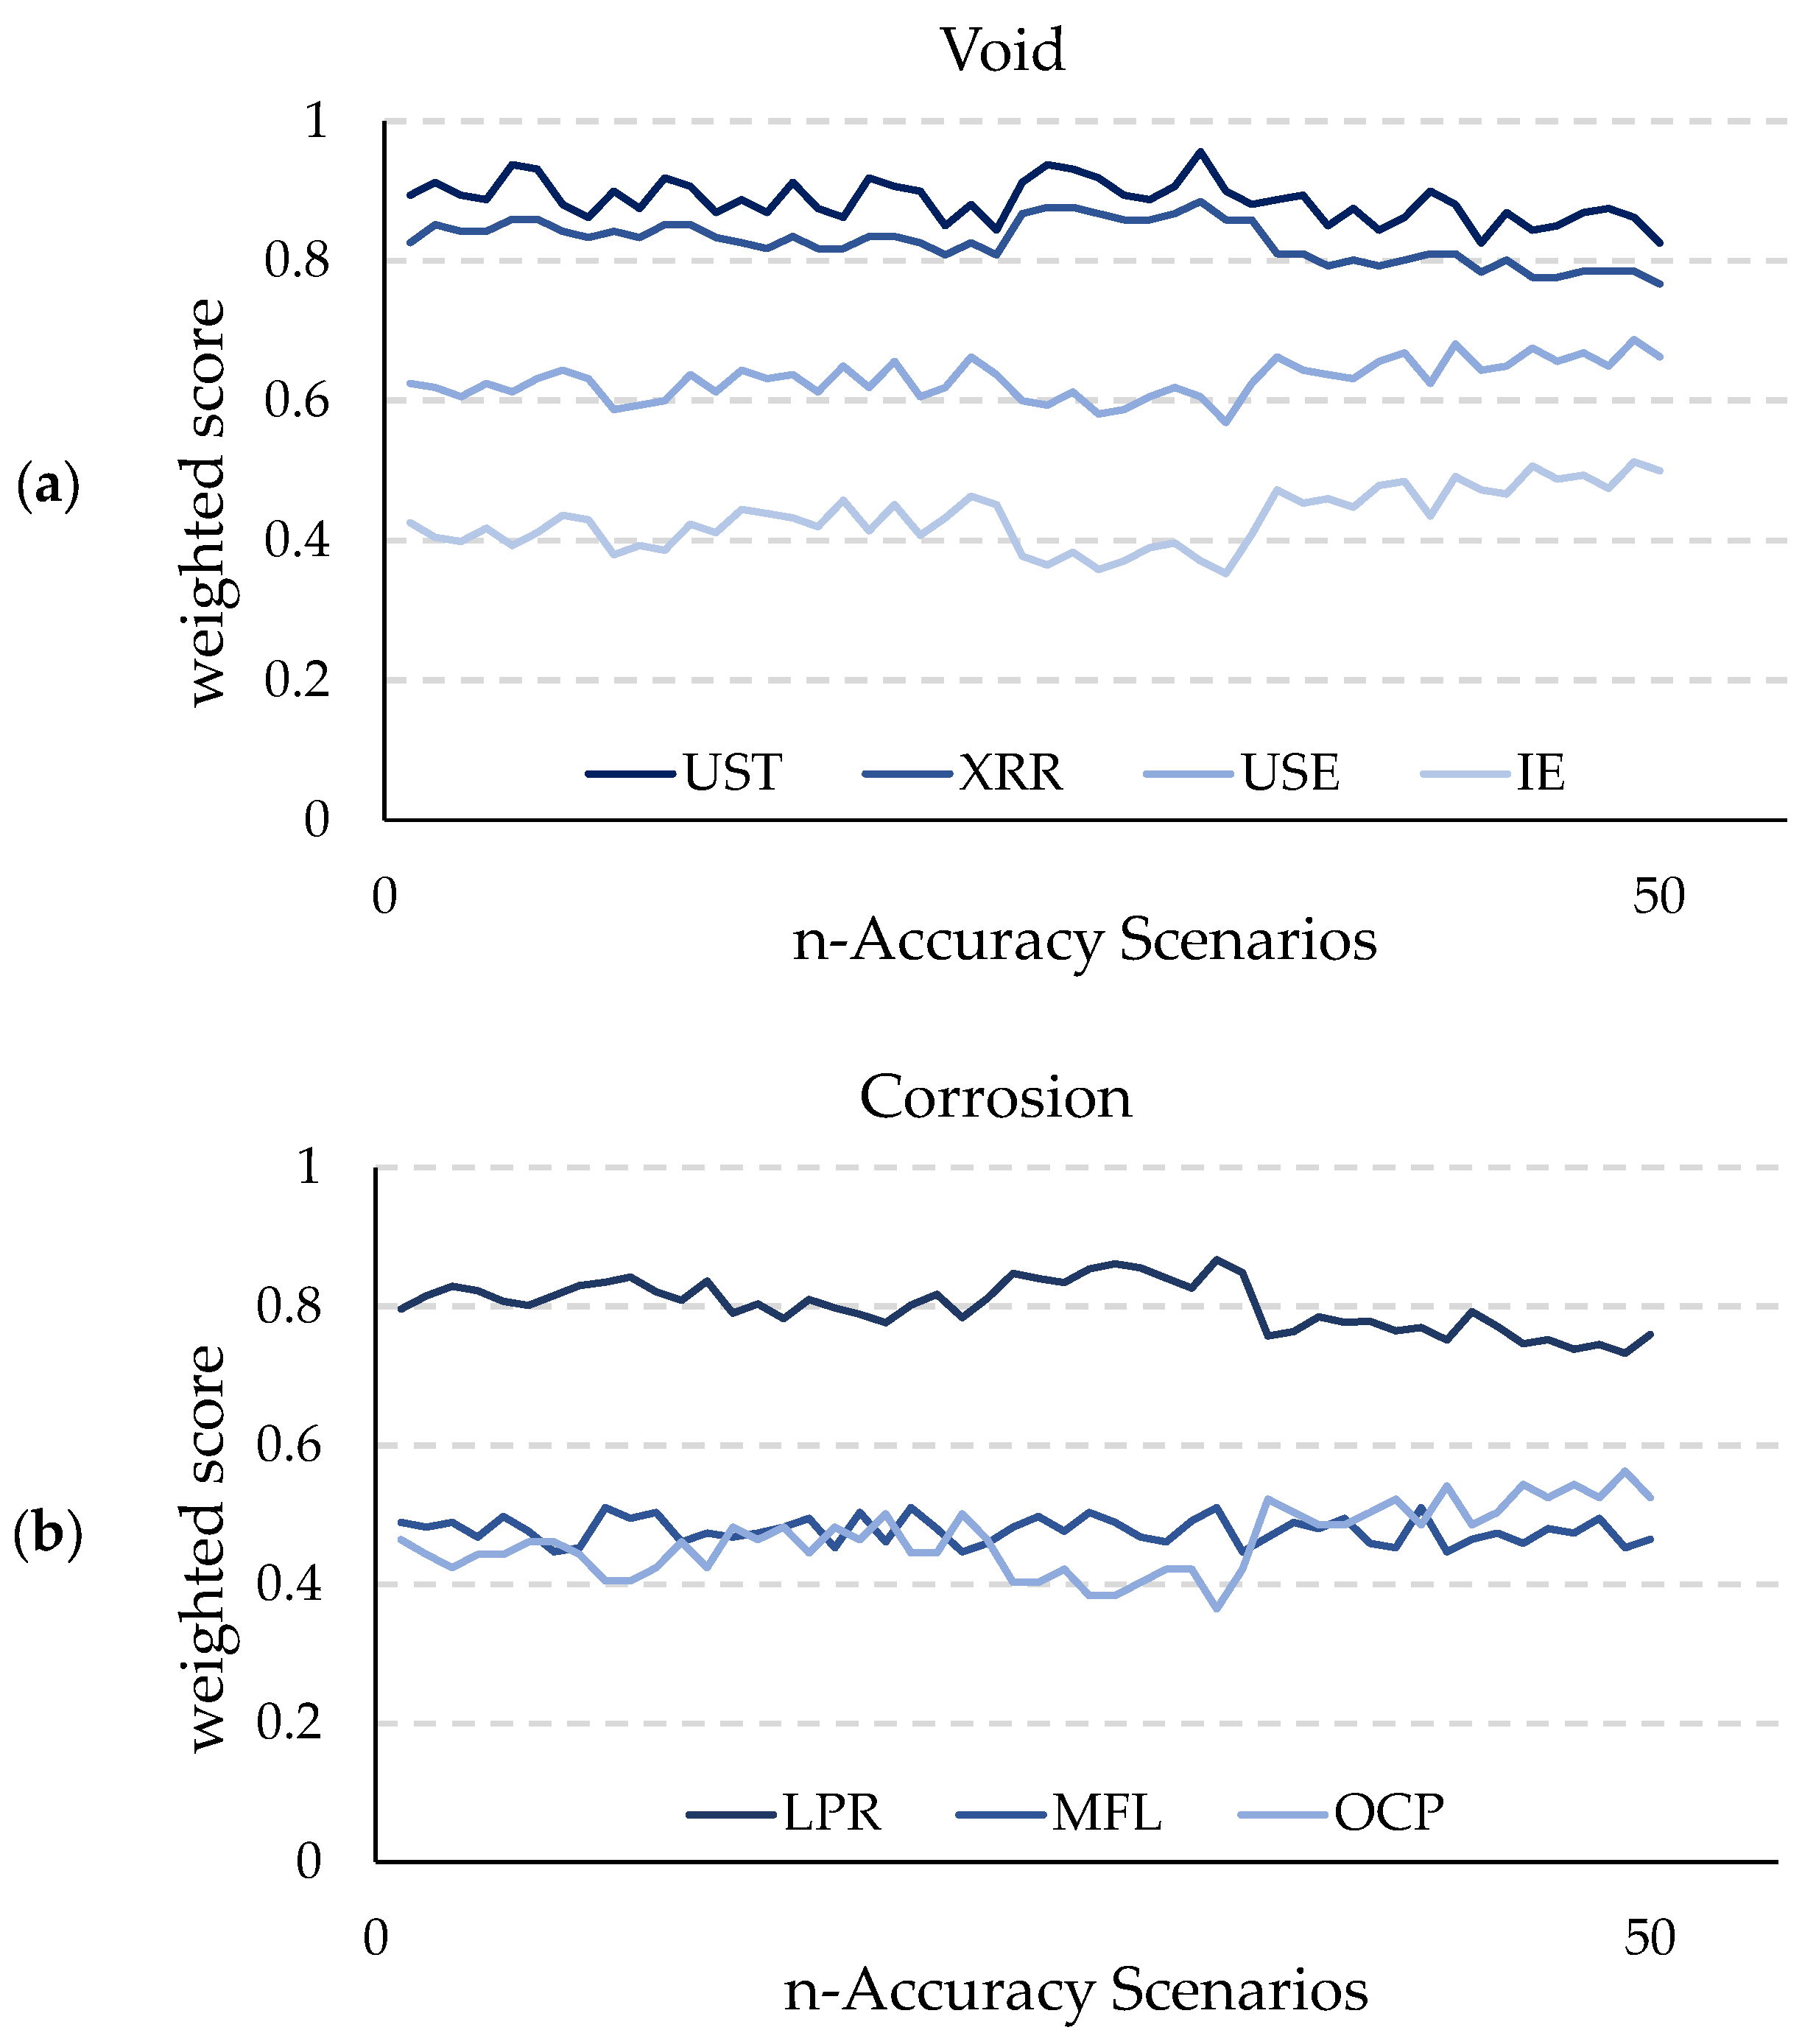
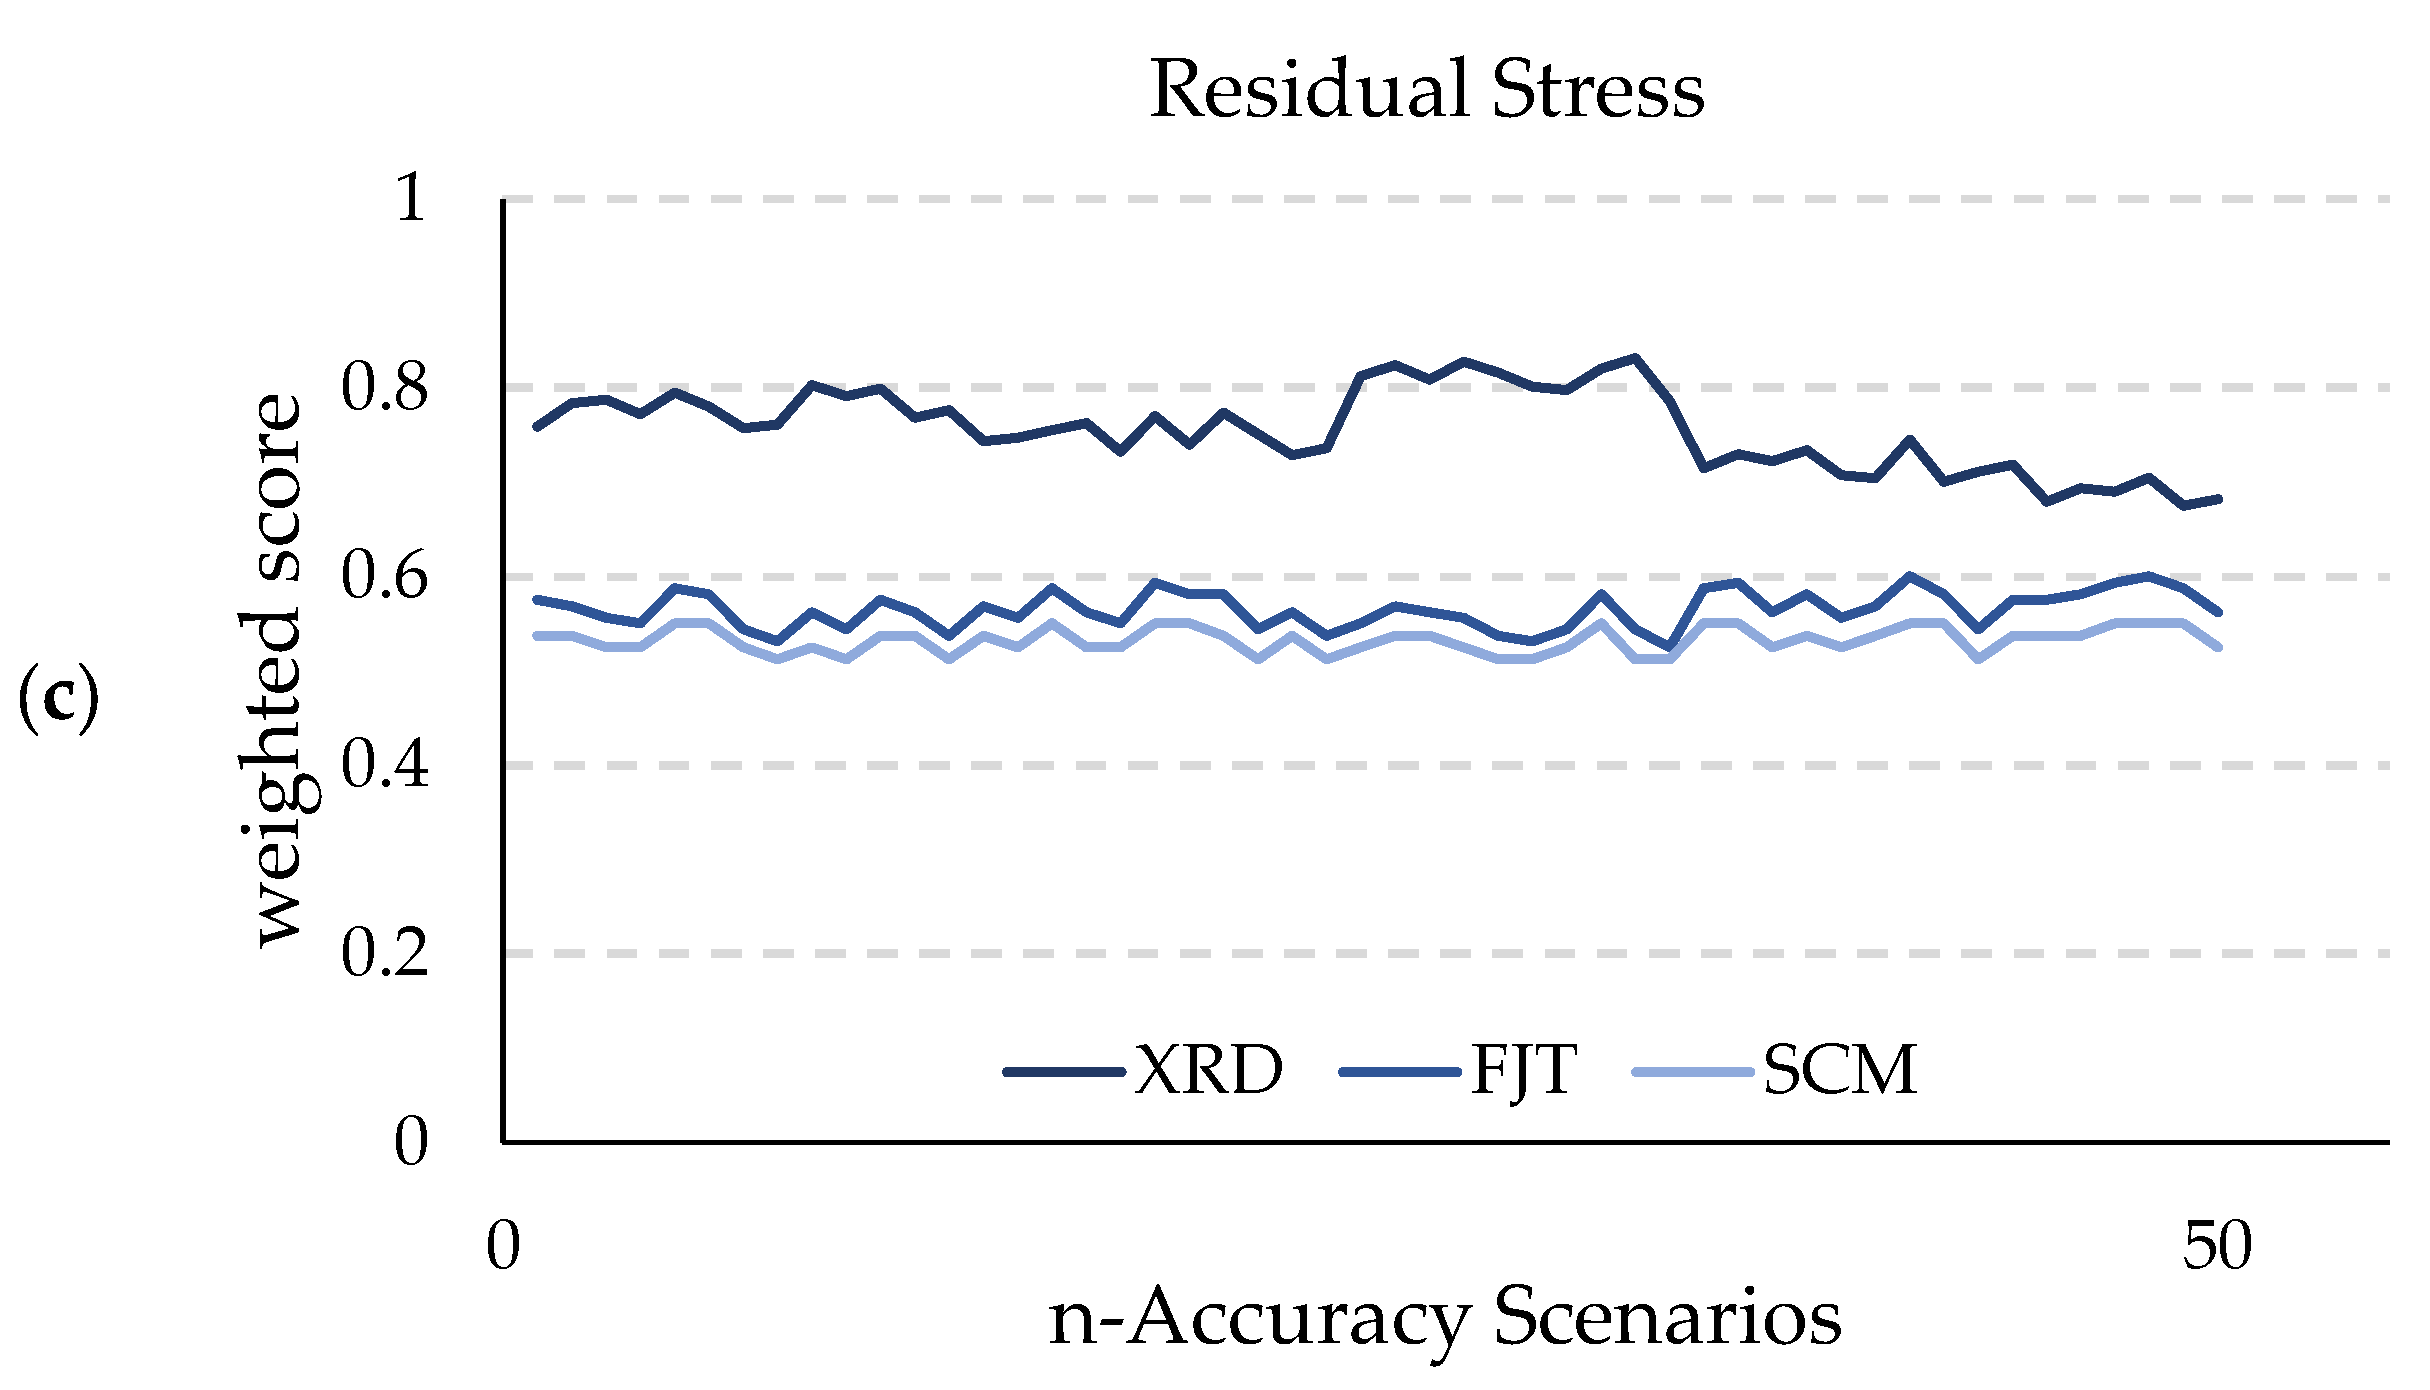
To assess the robustness of the proposed methodology, a sensitivity analysis was conducted on the accuracy-driven scenario by systematically varying the assigned weight factors. Specifically, 50 combinations of weight configurations were generated by applying variations of ±0.1 to the accuracy category in increments of 0.05 while proportionally adjusting the weights of the remaining categories. In all cases, the weights of non-priority categories were capped at a maximum of 0.2 to preserve the scenario’s focus on accuracy.
The results of the sensitivity analysis are reported in
Figure 6. The maximum score variation observed was approximately 10% for the OCP method, while all other methods showed variations between 3% and 9%. Importantly, the ranking stability of the top-performing NDT methods across the different defects remained largely unaffected. Specifically, the following results were observed:
Void detection: UST consistently ranked as the top method in all 50 scenarios, with no change in ranking order across the evaluated configurations.
Corrosion assessment: LPR maintained the highest score in all cases. The second position alternated between MFL (30 scenarios) and OCP (20 scenarios), indicating minor sensitivity in mid-ranking positions but overall robustness in identifying the optimal technique.
Residual prestress: XRD remained the highest-ranked method in all scenarios, with no variation in ranking, confirming the stability of the outcome.
These results demonstrate that the methodology is robust to moderate changes in attribute weightings, and the final selection of optimal NDT methods is not significantly affected by such variations.
Finally, while the proposed model offers a structured approach to support decision-making, it remains adaptable. The scalability of the proposed method is supported by its modular structure, low computational complexity, and scenario-based flexibility, which allow it to be readily adapted to varying operational contexts, including large bridge inventories.
While the present study focuses on a single case study to demonstrate methodological applicability, the framework was intentionally designed to be scalable: it enables infrastructure managers to define project-specific scenarios through the adjustment of weights, criteria, and evaluation categories based on available resources, risk priorities, and network characteristics. Moreover, the scoring system relies on discrete, expert-informed inputs that can be consistently applied across multiple structures without requiring detailed modeling or calibration for each asset.
Although full-scale implementation across a network is outside the scope of this paper, we note that the simplicity and adaptability of the framework align well with existing asset management practices, and we plan to explore broader validation across multiple bridges in future work.


