Article

Research on the Dynamic Response of the Catenary of the Co-Located Railway for Conventional/High Speed Trains in High-Wind Area

1
Urumqi High-Speed Railway Infrastructure Section of China Railway Urumqi Group Co., Ltd., Urumqi 830000, China
2
Railway Science and Technology Research and Development Center, China Academy of Railway Sciences Group Co., Ltd., Beijing 100080, China
3
Tieke Shuzhi Transportation Technology (Chengdu) Co., Ltd., Chengdu 610036, China
4
Track, Communication & Signaling Inspection Institute, China Railway Urumqi Group Co., Ltd., Urumqi 830000, China
*
Author to whom correspondence should be addressed.
Infrastructures 2025, 10(7), 182; https://doi.org/10.3390/infrastructures10070182
Submission received: 13 May 2025 / Revised: 21 June 2025 / Accepted: 24 June 2025 / Published: 11 July 2025
(This article belongs to the Special Issue The Resilience of Railway Networks: Enhancing Safety and Robustness)

Abstract

To establish a theoretical foundation for assessing the dynamic performance of high-speed train catenary systems in wind-prone regions, this study develops a coupled pantograph–catenary model using ANSYS(2022R1) APDL. The dynamic responses of conventional high-speed pantographs traversing both mainline and transition sections are analyzed under varying operational conditions. The key findings reveal that an elevated rated tension in the contact wire and messenger wire reduces the pantograph lift in wind areas with no crosswind compared to non-wind areas, with an average lift reduction of 8.52% and diminished standard deviation, indicating enhanced system stability. Under a 20 m/s crosswind, both tested pantograph designs maintain contact force and dynamic lift within permissible thresholds, while significant catenary undulations predominantly occur at mid-span locations. Active control strategies preserve the static lift force but induce pantograph flattening under compression, reducing aerodynamic drag and resulting in smaller contact force fluctuations relative to normal-speed sections. In contrast, passive control increases static lift, thereby causing greater fluctuations in contact force compared to baseline conditions. The superior performance of active control is attributed to its avoidance of static lift amplification, which dominates the dynamic response in passive systems.

1. Introduction

High-speed trains predominantly utilize electric traction, with the required electrical energy supplied through the pantograph–catenary system. Research indicates that over 95% of the power supply system’s reliability hinges on the catenary’s performance [1]. Consequently, maintaining reliable contact in the pantograph–catenary interface is critical for ensuring efficient energy transmission. At high speeds, the interaction between the pantograph and catenary forms a coupled vibration system, where the dynamic performance of this system becomes a decisive factor in current collection quality. This has prompted extensive scholarly investigations into dynamic simulation and testing methodologies for pantograph–catenary systems [2,3,4]. Notably, Collina et al. [5] employed a penalty function-based approach to accurately model pantograph–catenary constraints across a broad frequency range, offering significant technical support for stabilizing current collection. Furthermore, the high-speed airflow-induced aerodynamic forces substantially influence both pantograph–catenary dynamics and pantograph quality [6]. Li Ruiping et al. [7] investigated the aerodynamic effects of pantographs on high-speed trains traversing tunnels and their subsequent impact on pantograph–catenary dynamic performance. Poetsch et al. [8] emphasized the need to simultaneously consider the influence of both high-speed airflow and natural crosswinds on pantograph–catenary current collection during train operation. Pombo et al. [9] further highlighted that variations in the pantograph lifting force in crosswind environments significantly affect current collection quality. Based on these findings, many studies have analyzed the wind-induced vibration response of catenary systems under lateral natural wind loads and examined current-related effects on both pantograph and catenary performance. Notably, Li Ruiping et al. [10] developed a spatiotemporally correlated pulsating wind field model for catenary systems using the AR (Auto-Regressive) method, incorporating the structural characteristics of catenaries. From the simulated wind speed time history, they derived the wind loads acting on the catenary and established a three-dimensional finite element model. This enabled comprehensive investigation of the modal properties, static wind deflection, and dynamic wind vibration responses, complemented by spectral analysis of the displacement responses. Zhao Fei et al. [11] developed a pantograph–catenary system model using finite element software, enabling comprehensive simulation of the system’s dynamic performance under random wind field conditions. This integrated modeling approach facilitates subsequent investigations into optimal structural parameter coordination for pantograph–catenary systems operating in stochastic wind environments. Hu Xiaolei et al. [12] evaluated the dynamic performance of the Beijing–Shanghai high-speed railway catenary system by employing two key metrics—(1) dynamic detection defects and (2) dynamic performance indicators—analyzed in conjunction with operational data from onboard catenary monitoring devices. Sun Liang et al. [13] demonstrated the technical feasibility of high-speed rail express delivery services under specific operational conditions, providing valuable insights for future site selection of high-speed freight EMU applications and the modernization of conventional railway freight facilities.
In summary, while existing research has predominantly examined the dynamic responses of either individual high-speed trains or conventional trains under various speed conditions, studies investigating dynamic behavior under mixed high-speed and conventional line operations remain relatively limited. To address this gap, this study develops a pantograph–catenary system finite element model, specifically focusing on shared-line conditions between high-speed and conventional railways. The model analyzes dynamic responses during train transitions between mainline and transition sections under these shared operational conditions. Furthermore, the study investigates variation patterns in pantograph–catenary system dynamics under crosswind conditions, providing critical theoretical foundations for the safety assessment of mixed high-speed operations in high-wind regions such as the Lanzhou–Xinjiang line.

2. Materials and Methods

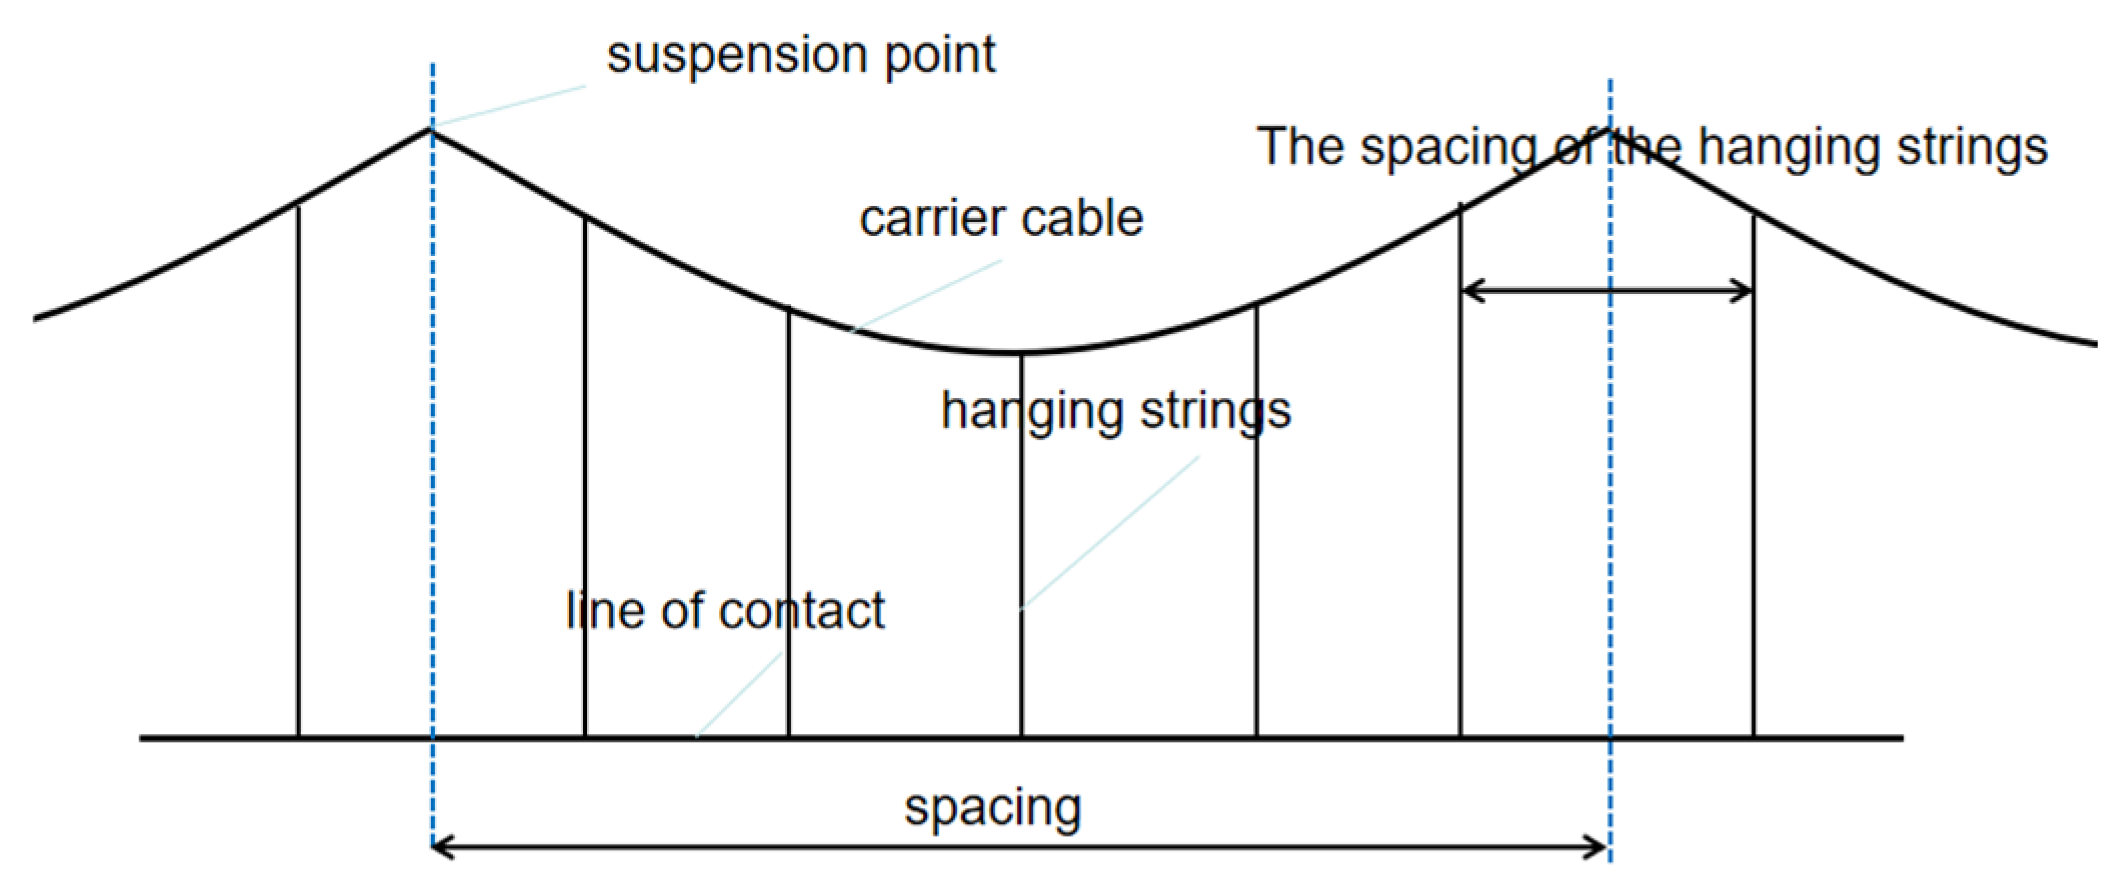
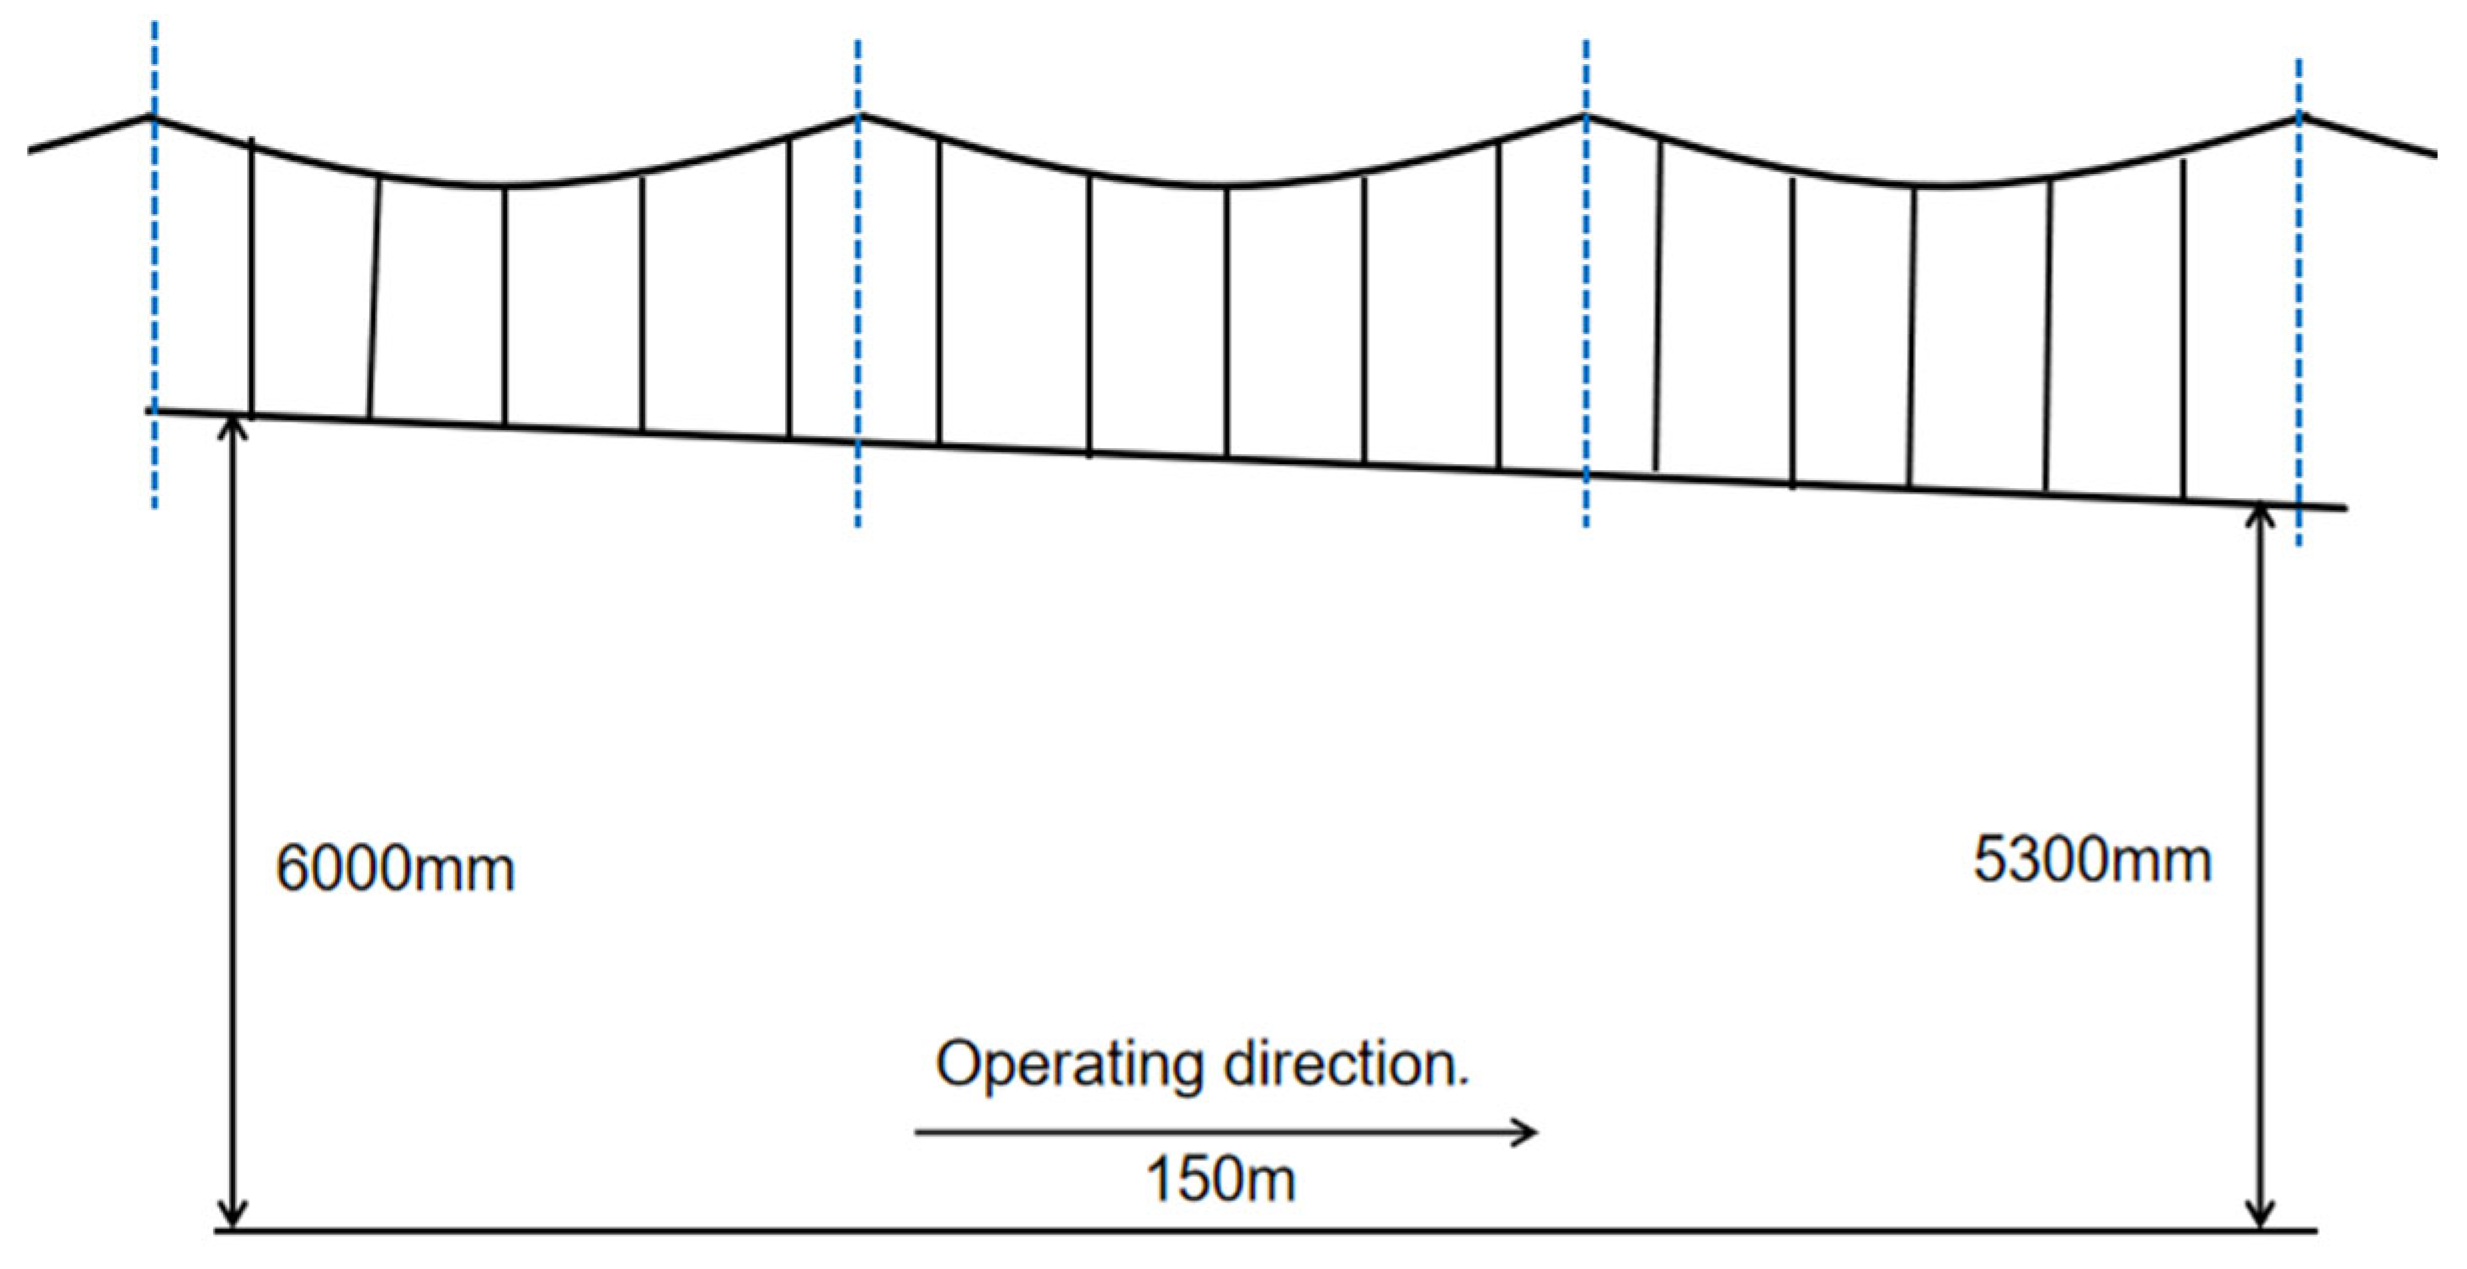
2.1. Catenary Modeling

The catenary system can be characterized as a complex chord structure. During high-speed train operation, the conductors exhibit multi-directional movement, though vertical displacements dominate over lateral and longitudinal motions. To facilitate finite element modeling of this system, appropriate simplifications and assumptions are implemented in accordance with the research objectives.
Key modeling approaches include the following:
(1)
The catenary, messenger cables, and support structures (pillars and cantilevers) are idealized as tensioned Euler beams with bending stiffness and uniformly distributed mass.
(2)
Suspension cables, positioners, and droppers are modeled as spring-damper elements.
(3)
Suspension cable endpoints are treated as concentrated mass points.
Correspondingly, the finite element implementation employs the following:
(1)
BEAM188 elements for contact wires and messenger cables.
(2)
COMBIN14 elements for elastic components (e.g., droppers).
(3)
MASS21 elements for concentrated masses (e.g., suspension clamps and positioning devices).
Following the element type selection, appropriate boundary conditions are applied to the catenary model through the following constraint implementations:
(1)
Support Constraints: The messenger cable supports are fully constrained in all displacement degrees of freedom (DOFs), effectively creating fixed boundary conditions at these locations.
(2)
Contact Wire Positioning Constraints: At contact wire positioning points, three critical DOFs are constrained:
(i)
Translational displacements along the following directions:
The longitudinal direction (x-axis, parallel to train motion).
The lateral direction (z-axis, perpendicular to track).
(ii)
Rotational displacement about the vertical axis (y-axis).
These constraints prevent spurious displacements and rotations at contact wire terminations, thereby enhancing system stability and operational reliability.
(3)
Positioning Clamp Constraints: Similar DOF restrictions are applied at positioning clamp bases to ensure structural stability throughout the catenary system.
Based on the preceding modeling methodology, the system’s dynamic characteristics are described through three fundamental matrices: the concentrated mass matrix Mc, damping matrix Cc, and global stiffness matrix Kc. The governing vibration equation for the catenary system is expressed as Equation (1).
M c + q ¨ c + C c q ˙ c + K c q c = F m
where qc is the global generalized displacement vector; Fm is the external excitation vector.
The Lanzhou–Xinjiang passenger-dedicated line employs a simple chain suspension configuration throughout its entire length, as shown in Figure 1. Accordingly, this study develops a 10-span simple chain suspension catenary model using ANSYS(2022R1) APDL. The model parameters are summarized in Table 1. To facilitate comparative analysis, two distinct catenary models are implemented: one representing wind-affected areas and the other non-wind areas.

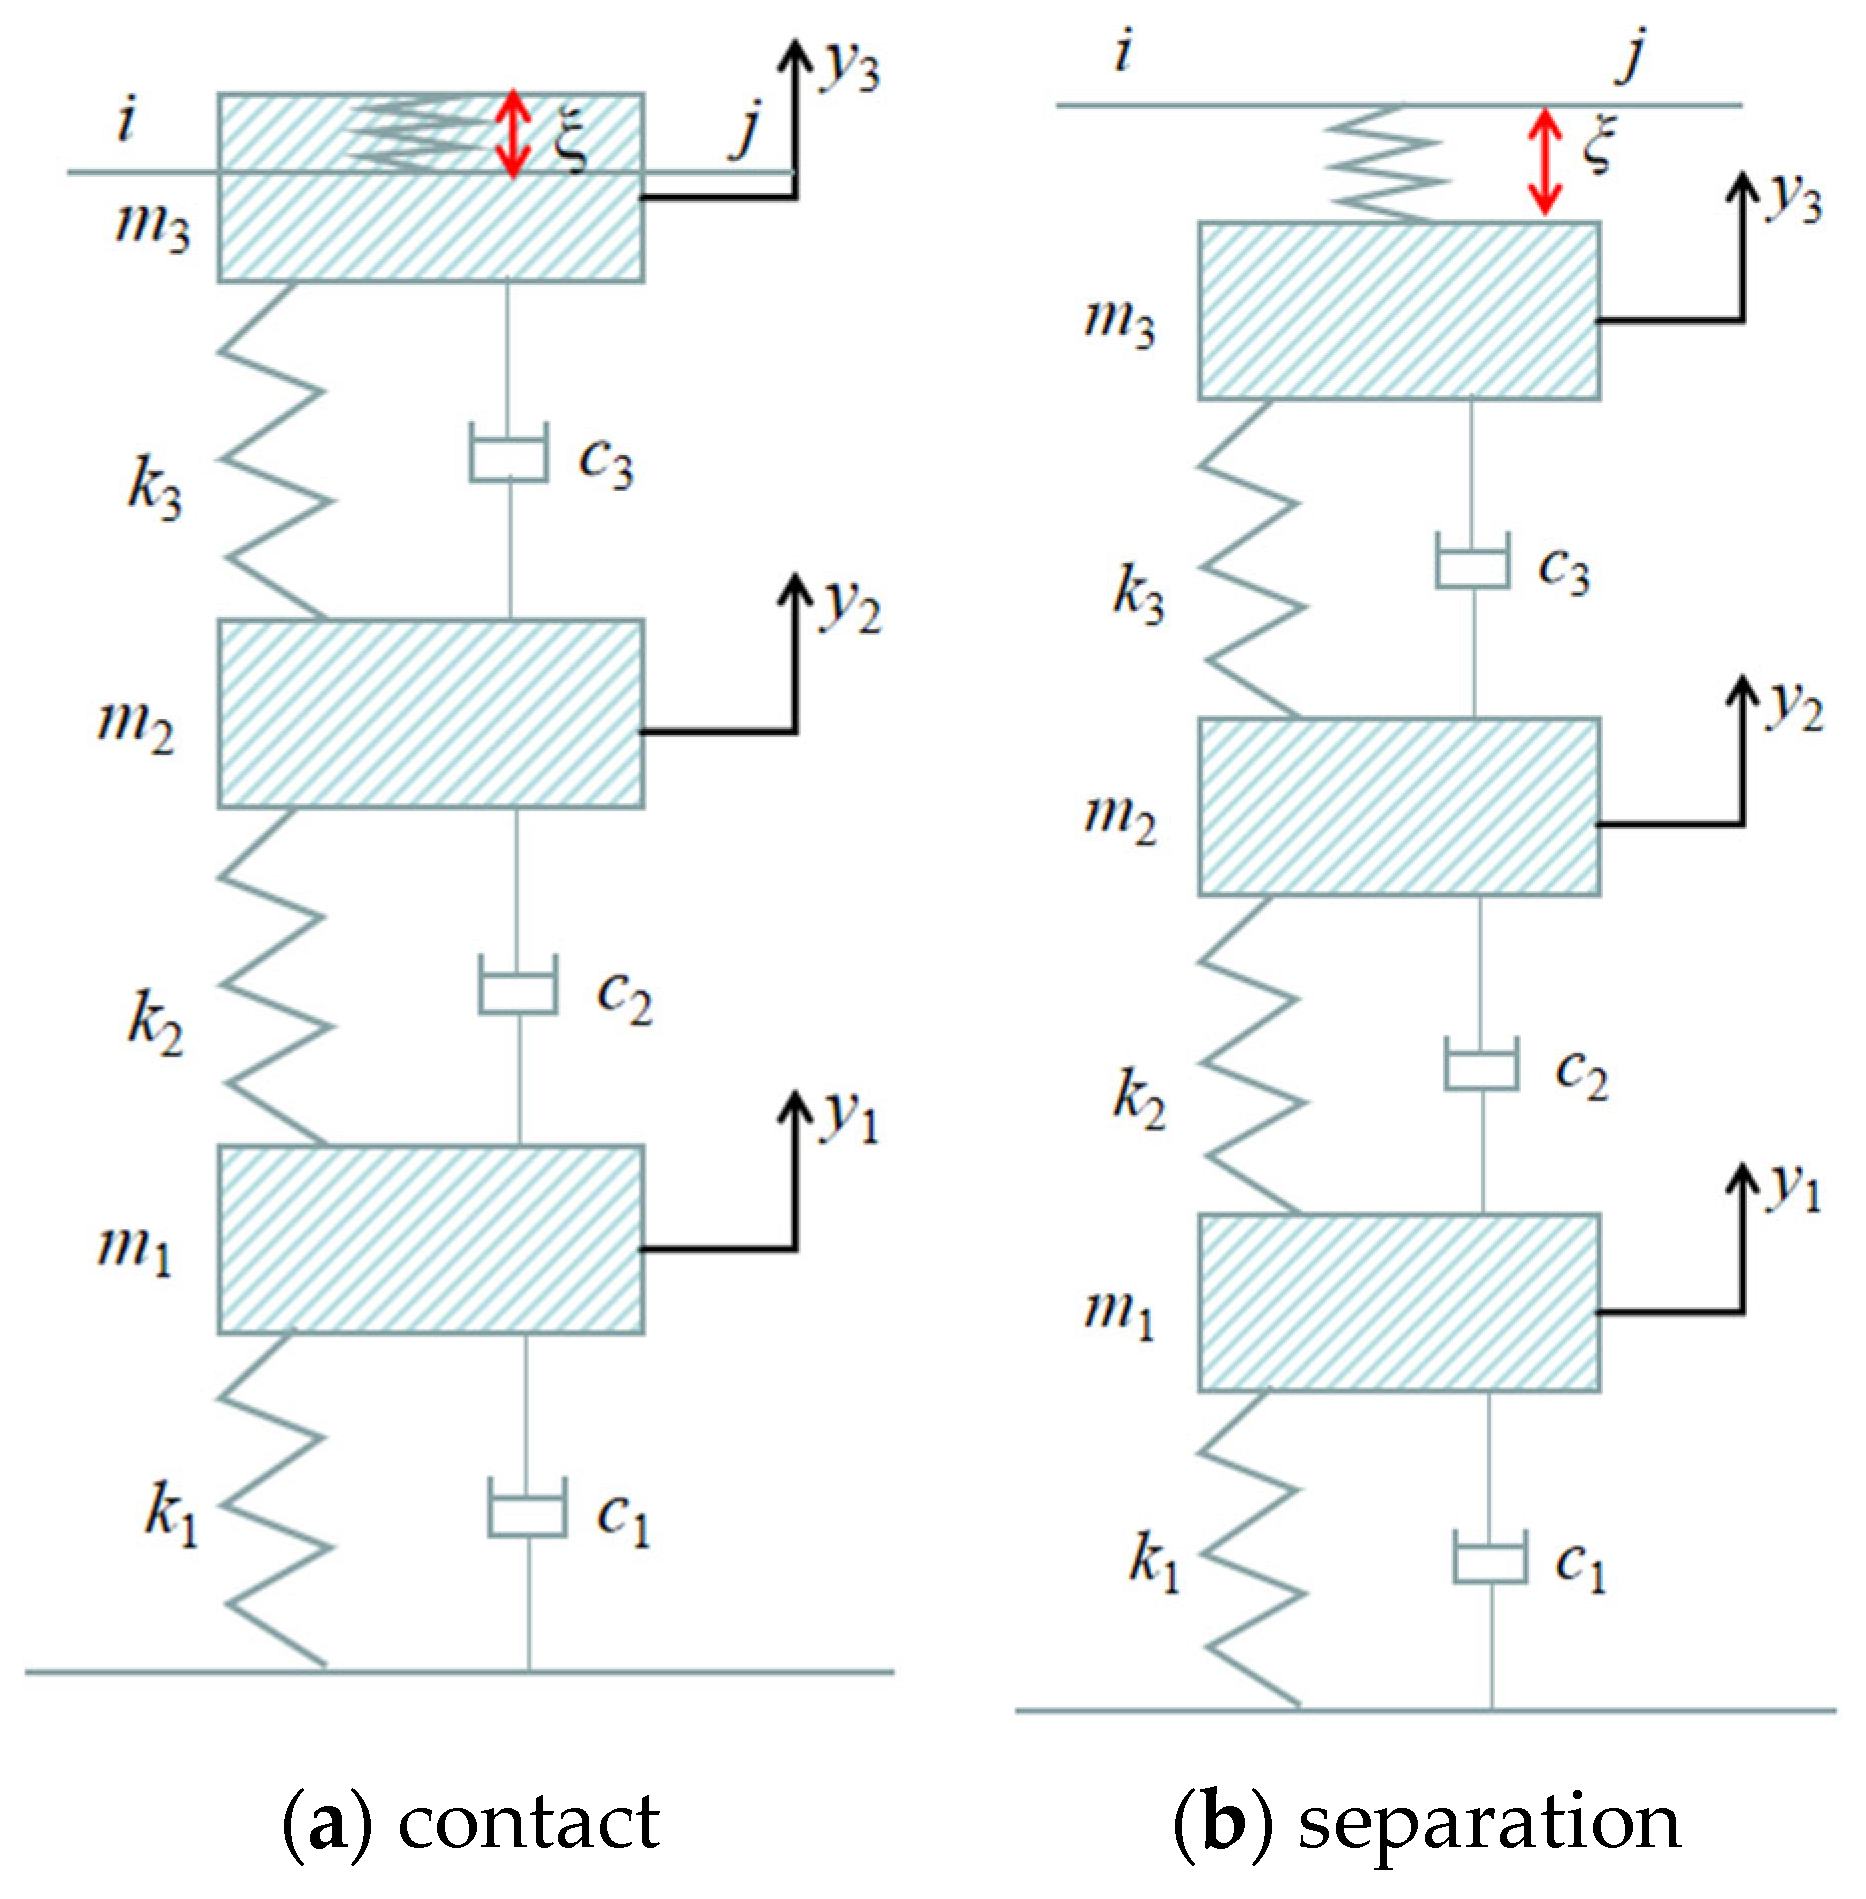
2.2. Pantograph Modeling

The pantograph is a current collection device installed on the vehicle roof, responsible for transmitting the electrical energy from the catenary to the train to ensure the stable vehicle operation. The classic pantograph models include the mass block model, the multi-body dynamics model, the rigid–flexible coupling model, etc. In this paper, the widely used three-mass block mode with superior accuracy is selected. The pantograph head, the upper arm rod, and the lower arm rod are simplified as concentrated mass particles, connected via spring damping units, as shown in Figure 2. In the figure, m3, m2, and m1 are the equivalent masses of the pantograph head, the upper arm rod, and the lower arm rod, respectively; c3, c2, and c1 are the equivalent dampers of the pantograph head, the upper arm rod, and the lower arm rod; k3, k2, and k1 are the equivalent stiffness of the pantograph head, the upper arm rod, and the lower arm rod, respectively; f2 is the contact force between the pantograph and the catenary; f1 is the static contact force; y3, y2, and y1 represent the vertical displacements of the pantograph head, upper arm rod, and lower arm rod, respectively.
Given that the research subject of this paper being the Lanzhou–Xinjiang high-speed railway, two pantograph models are established: one for conventional speed and one for high speed. The model parameters are shown in Table 2.

2.3. Pantograph–Catenary Coupling Contact Model

The development of an accurate pantograph–catenary coupling model and selection of an appropriate contact algorithm are critical for dynamic simulation. This study employs the penalty function method to characterize the contact interaction between the pantograph head (mass point m3) and catenary element i-j, as illustrated in Figure 3. The vertical penetration displacement (ξ) serves as the contact criterion: positive ξ values indicate contact engagement, while negative values signify separation. The resulting contact force is computed as a function of penetration stiffness and displacement, expressed mathematically in Equation (2).
f c ( t ) = k c ξ ( t ) ξ ( t ) 0 0 ξ ( t ) < 0
where t represents time; Kc stands for the stiffness of the catenary.

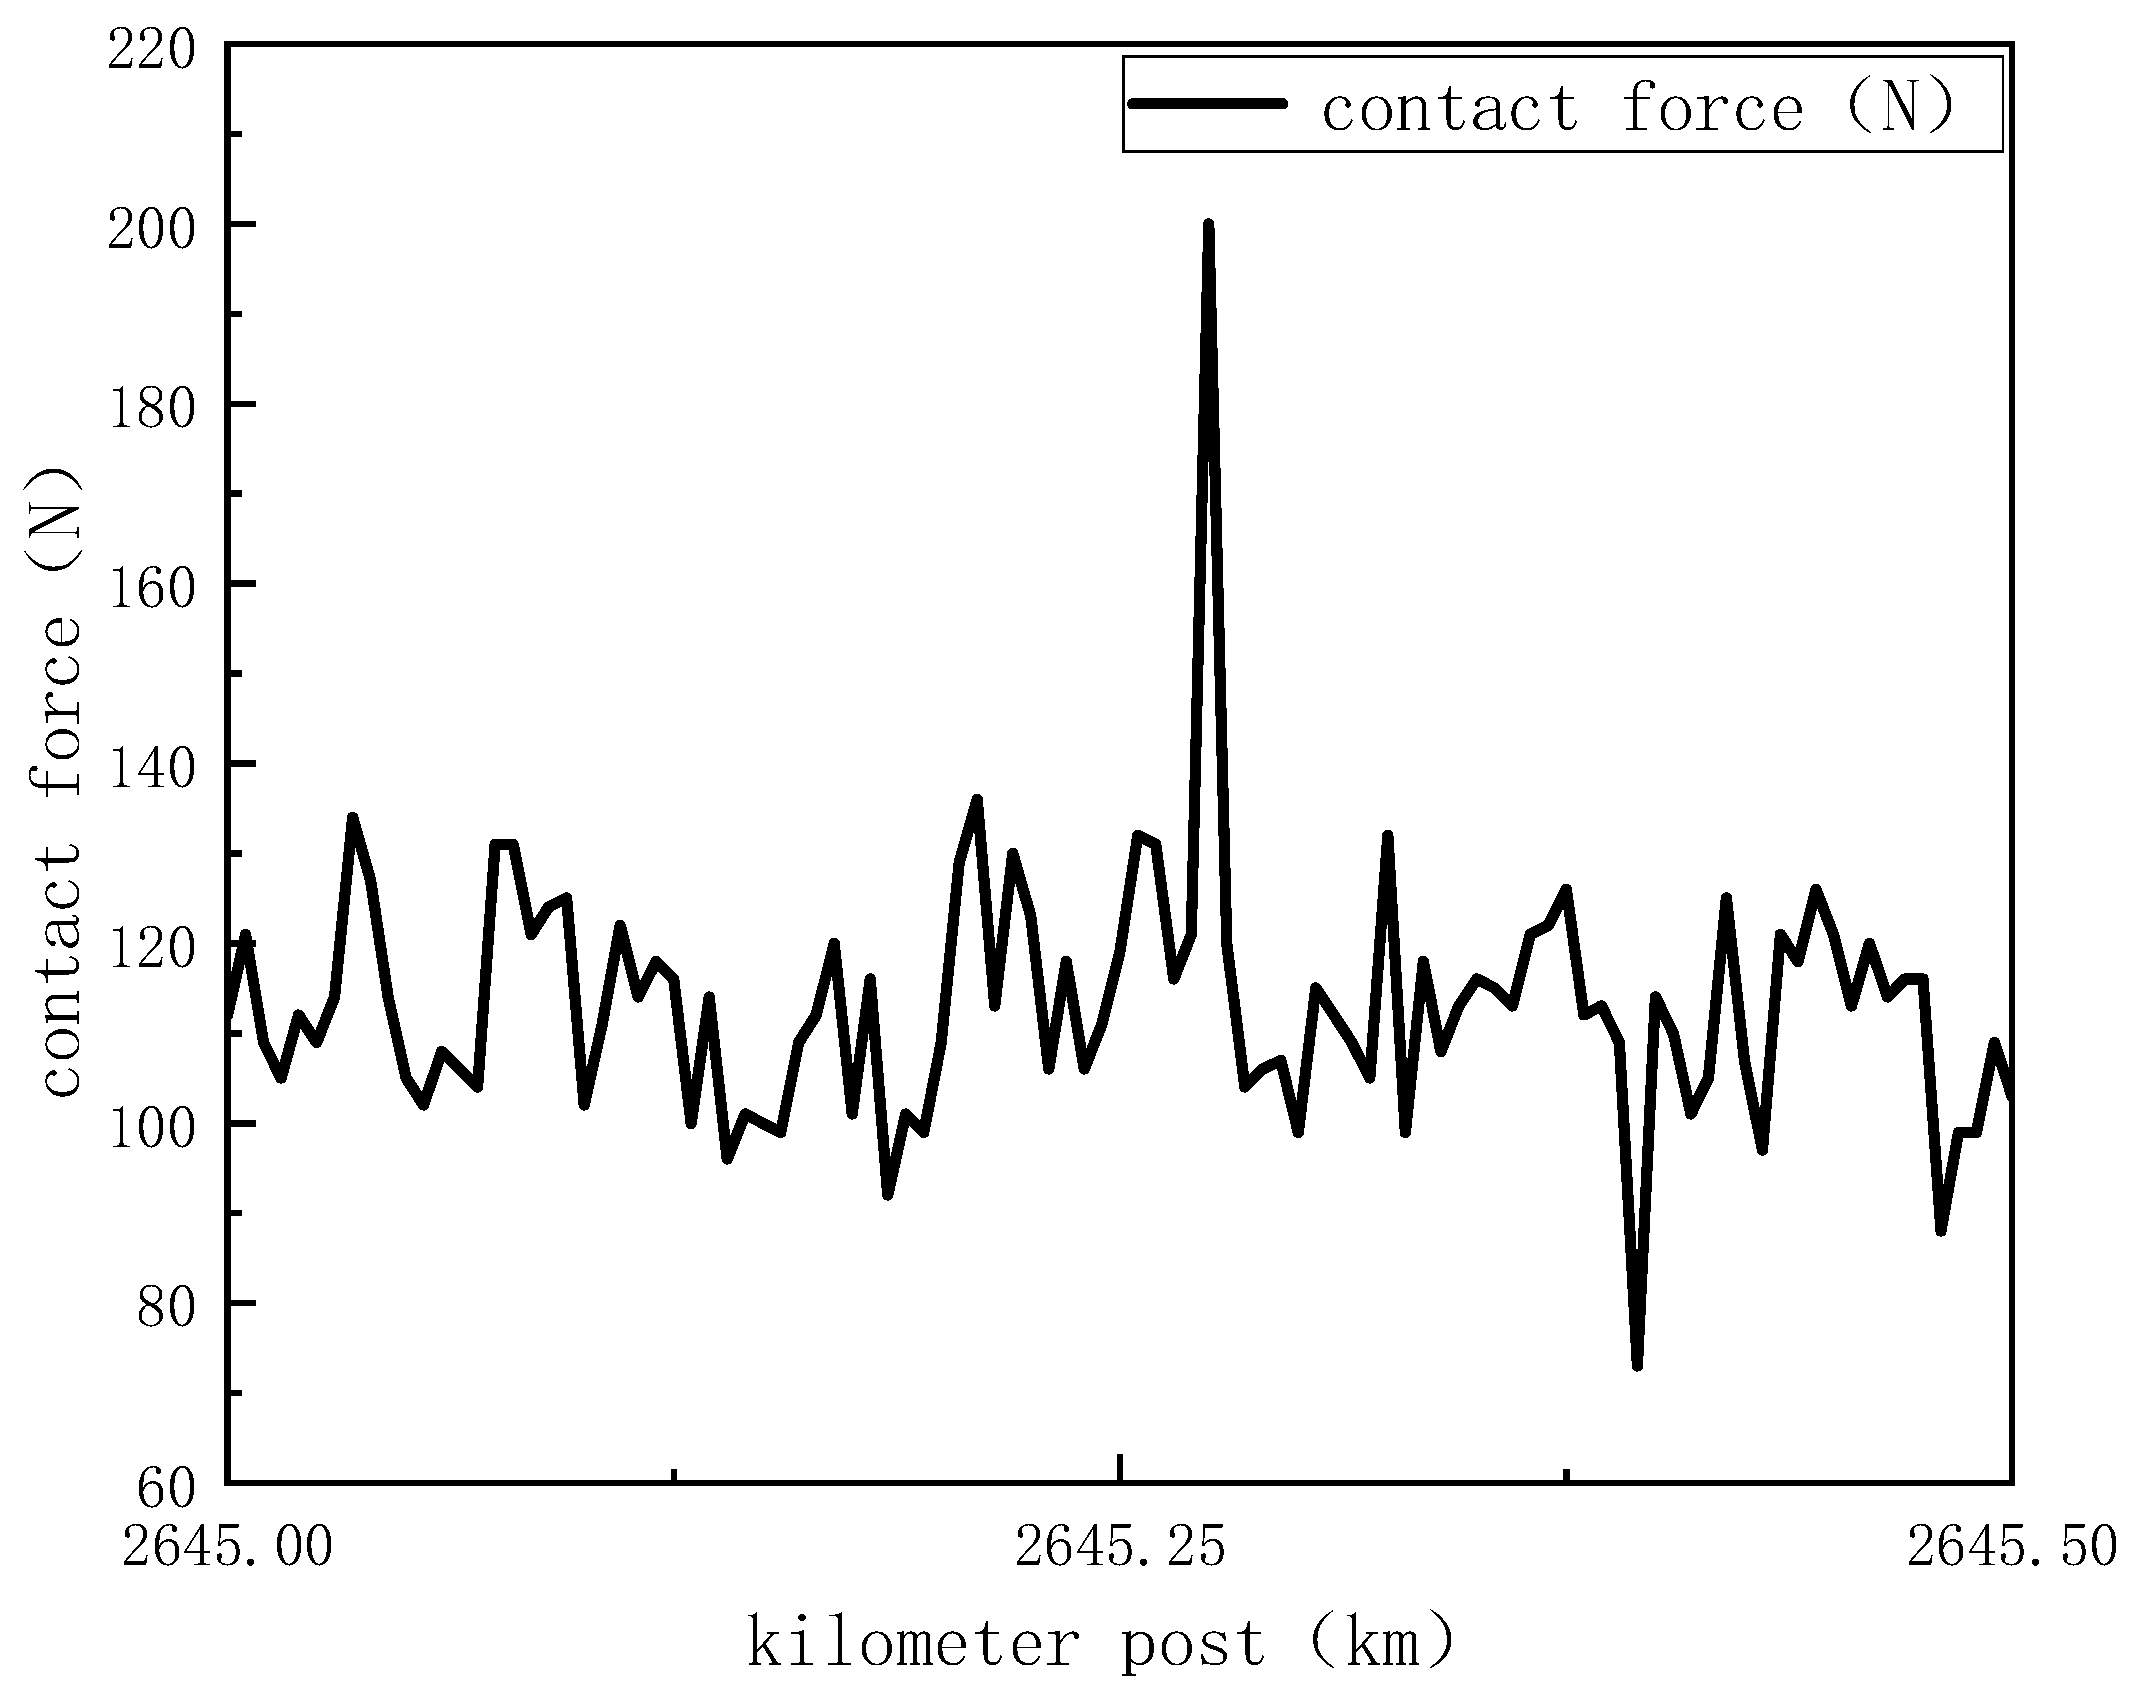
2.4. Model Verification

To validate the simulation model’s reliability, this study employs the DSA380 high-speed pantograph–catenary coupling model. The simulated contact force at 250 km/h is systematically compared with field-measured data from an operational railway line. Both datasets undergo identical low-pass filtering (0–20 Hz cutoff frequency) to ensure consistent signal processing and eliminate high-frequency artifacts. The experimental contact force measurements are presented in Figure 4 for direct visual comparison.
A comparative analysis of the experimental data (Figure 4) and simulation results (Table 3) reveals that the pantograph–catenary contact force discrepancy remains within 5%, demonstrating the model’s validity and reliability.

3. Result Analysis

This study investigates the dynamic response of the pantograph–catenary system in the high-wind region of the Lanzhou–Xinjiang railway to assess operational stability under three distinct conditions: (1) non-wind areas, (2) wind-affected areas without crosswinds, (3) wind-affected areas with 20 m/s crosswinds, considering both mainline and transition sections. To ensure simulation accuracy and mitigate boundary effects [15], the analysis focuses on the mid-span region of the catenary, where comprehensive statistical evaluation is performed.
In accordance with the “Railway Technical Management Regulations”, speed restrictions are imposed on electric multiple unit (EMU) trains based on ambient wind speed thresholds: (1) normal operation permitted at ≤15 m/s, (2) speed limited to ≤300 km/h at ≤20 m/s, (3) ≤200 km/h at ≤25 m/s, (4) ≤120 km/h at ≤30 m/s, (5) complete prohibition of entry when exceeding 30 m/s. This study examines dynamic pantograph responses for the Lanzhou–Xinjiang line’s shared high-speed corridor, where the maximum operational speed is 250 km/h. The environmental wind speed is set at 20 m/s (Beaufort scale level 8), with transverse wind forces calculated using Equation (3).
P = 1 2 ρ υ 2 F = P A
where ρ represents the flux density; v represents the wind speed and the lateral wind speed experienced by the catenary; P represents the wind pressure; A represents the contact area, and the windward area of the catenary; F represents the wind load, which is the wind load applied to the catenary.

3.1. Evaluation Criteria

To assess the compliance of the pantograph–catenary system’s dynamic response under shared high-speed railway line conditions, this study evaluates key parameters against the specifications stipulated in TB10009-2016 “Code for Design of Railway Electric Traction Power Supply” [16] and other relevant standards. The analysis focuses on two critical performance metrics—(1) dynamic contact force and (2) vertical displacement (dynamic lift)—both of which must remain within prescribed operational limits as detailed in Table 4.

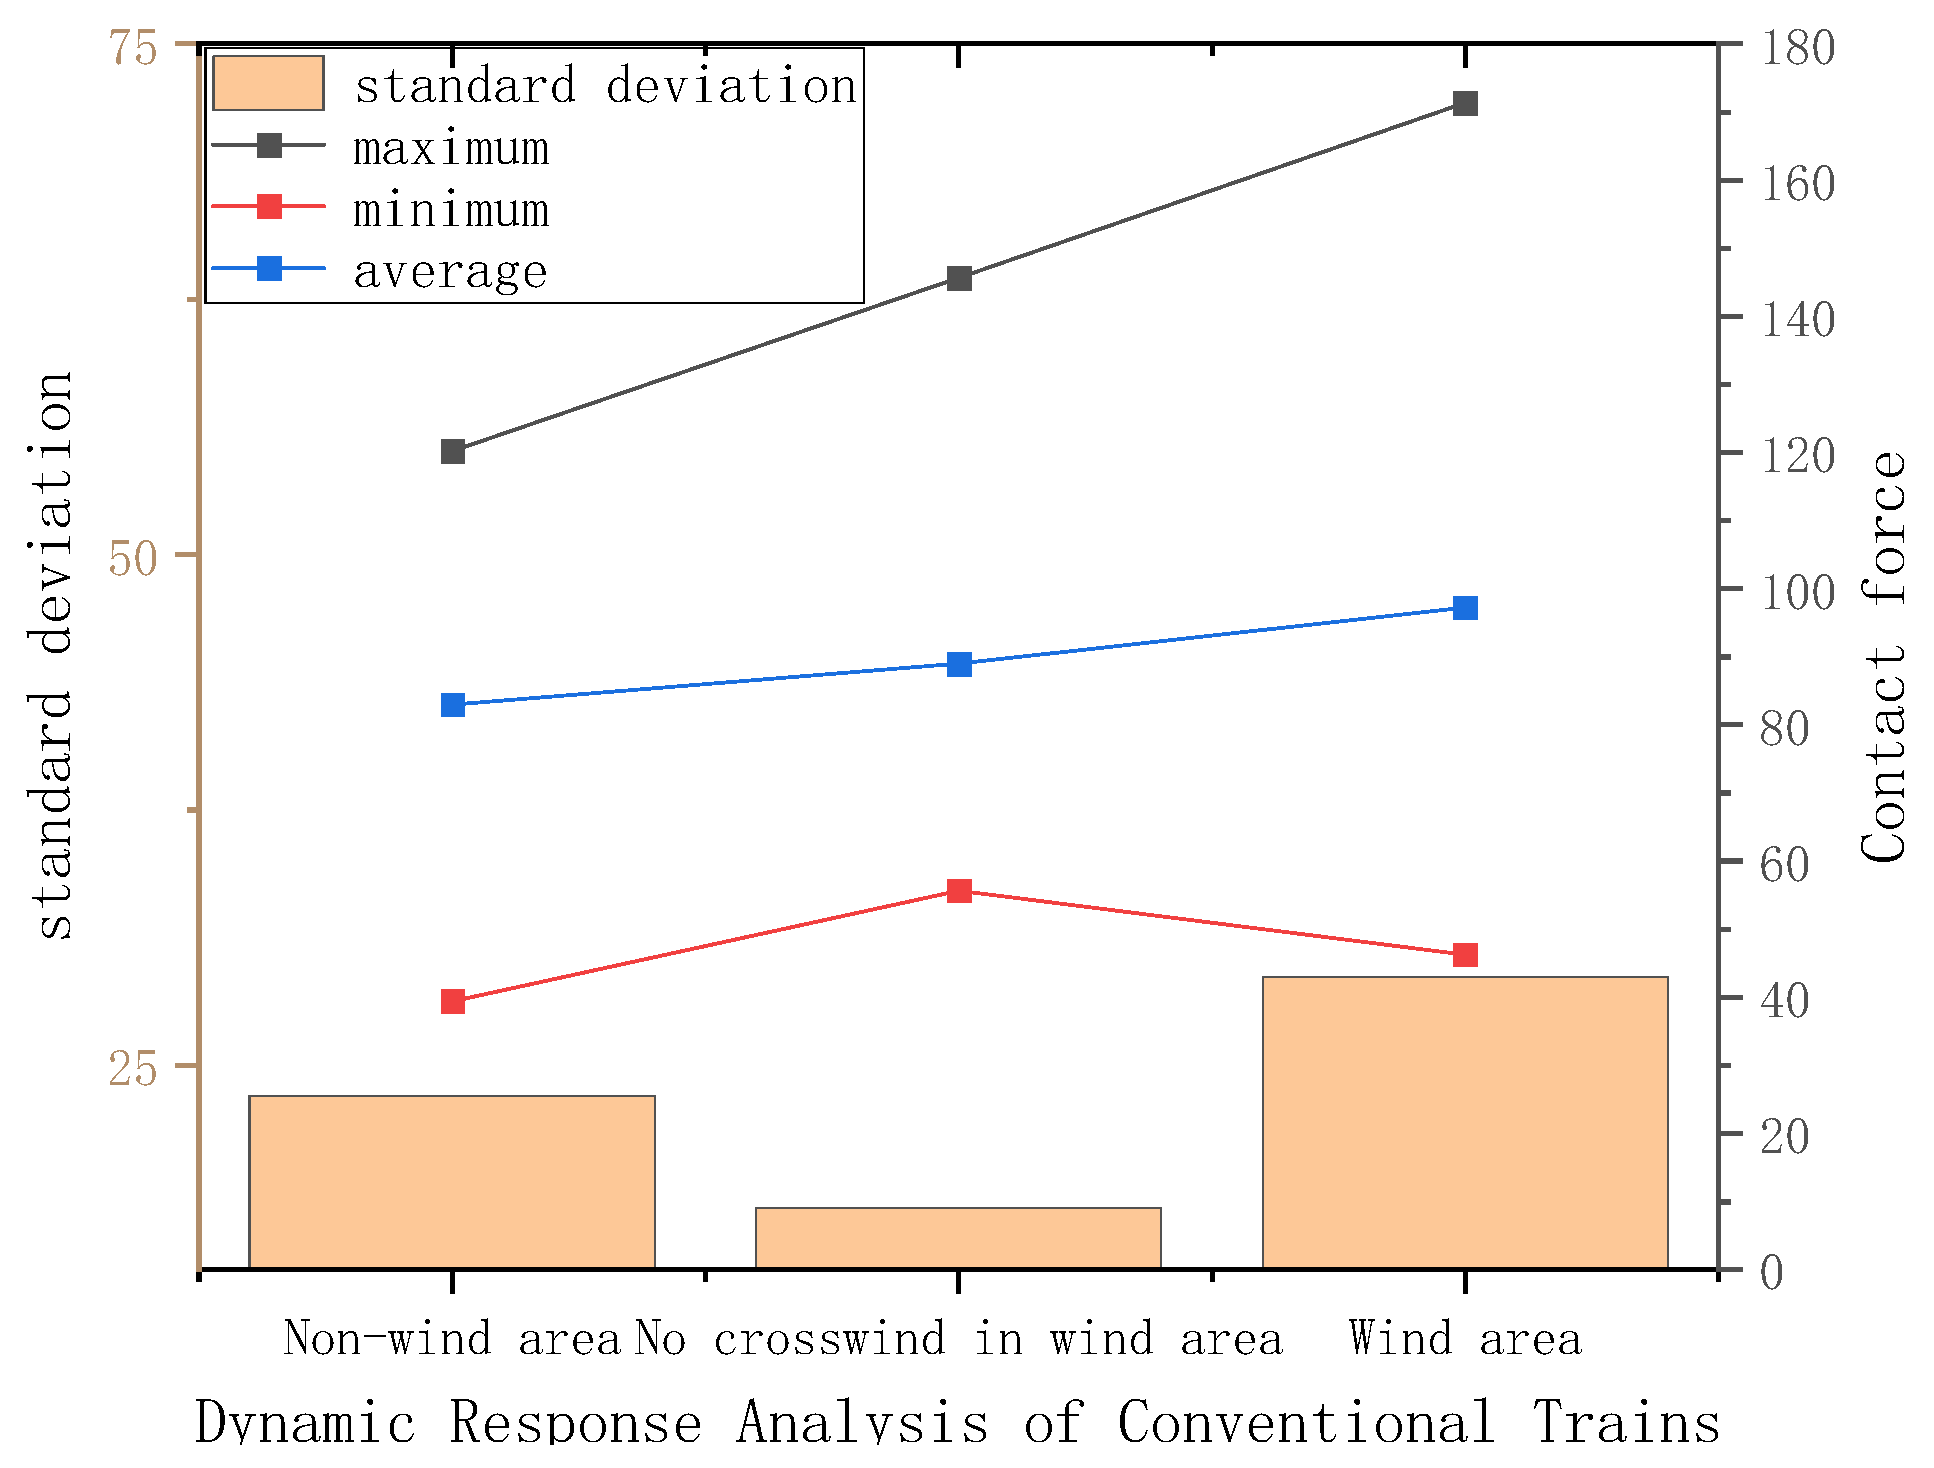
3.2. Dynamic Response Analysis of Pantograph–Catenary in the Mainline Section

This study investigates the dynamic response of the pantograph–catenary system in mainline sections by establishing coupled models for two distinct configurations: (1) the Tsg15B conventional pantograph operating at 160 km/h and (2) the DSA380 high-speed pantograph at 250 km/h. The analysis encompasses three environmental conditions: non-wind zones, wind zones without crosswinds, and wind zones with crosswinds. The resulting pantograph–catenary contact force data are systematically presented in Table 5 and Table 6, with corresponding dynamic characteristics illustrated in Figure 5.
As demonstrated in Table 4 and Table 5 and Figure 5, the dynamic contact force characteristics of both Tsg15B conventional (160 km/h) and DSA380 high-speed (250 km/h) pantographs exhibit significant regional variations: (1) In non-wind areas, the mean and maximum contact forces are 18–22% lower than in wind-affected areas, with 30–35% reductions in standard deviation, demonstrating that increased catenary and messenger cable tension enhances system stability. (2) Under 20 m/s crosswinds, the maximum contact forces increase by 19.71% (Tsg15B) and 7.54% (DSA380) relative to wind zones without crosswinds, with corresponding 12–15% rises in mean values and standard deviations. Despite these amplified oscillations, all measured parameters remain within the prescribed operational limits specified in TB10009-2016.
The dynamic lifting amounts of the catenary for conventional and high-speed trains are shown in Table 7 and Table 8.
As shown in Table 7 and Table 8, the lift of the pantograph in mainline wind zones is systematically reduced compared to non-wind zones, with maximum lift decreasing by 5.57% (Tsg15B conventional pantograph) and 18.78% (DSA380 high-speed pantograph). These results confirm that controlled increases in catenary and messenger cable tension significantly enhance system stability. Under 20 m/s crosswind conditions, both pantograph types exhibit pronounced lift amplification—maximum increases of 26.93% (Tsg15B) and 38.99% (DSA380)—with peak displacements reaching 79.78 mm. Despite these intensified oscillations, all values remain within the 85 mm operational safety limit specified in EN 50367 [17], ensuring compliance with electrification system requirements.
In summary, both conventional-speed and high-speed operations in shared-line configurations demonstrate a compliant dynamic performance, with all measured contact forces and vertical displacements (dynamic lift) remaining within the prescribed limits of EN 50367 and TB10009-2016. These results confirm that the pantograph–catenary system satisfies all operational requirements for mixed-speed railway corridors under the investigated conditions.

3.3. Dynamic Response Analysis of Pantograph–Catenary in the Transition Section

The transition between conventional (6000 mm guide height) and high-speed (5300 mm guide height) catenary systems (Figure 6) necessitates specialized pantograph control strategies during track-switching operations. Two distinct control methodologies are implemented:
(1)
Active control
While modifying the height of the pantograph, the airbag pressure is adjusted to maintain a constant static upward force.
(2)
Passive control
The pantograph structure is mechanically deformed by external catenary forces, simultaneously altering its operating height while increasing the static uplift force.
These adaptive mechanisms ensure seamless compliance with differing operational height requirements across railway network segments.
(1)
Active control of pantograph
Under active control conditions, Table 9 and Table 10 present the dynamic response characteristics of the pantograph–catenary coupling system during transitional operations from conventional-speed to high-speed line segments.
A summary of the data in Table 9 and Table 10 is shown in Figure 7.
As shown in Figure 6, when the train passes through the transition section under active control, the contact force in the wind area increases compared to that in the non-wind area, while the standard deviation of the contact force decreases and the lifting amount also decreases. This indicates that the increase in the rated tension of the catenary system in the wind area improves the stability of the pantograph–catenary system. Under the effect of crosswind, the contact force of the pantograph–catenary increases by 17.67% compared with the maximum value under the condition of no crosswind in the wind area. Both the standard deviation of the contact force and the lifting amount increase significantly, and the vibration of the catenary intensifies.
Comparative analysis reveals significant reductions in dynamic response during transitional operations under active control versus mainline sections. Specifically, the maximum contact force decreases by 5.51% (non-wind area), 1.81% (wind area without crosswind), and 3.49% (wind area with crosswind), while the mean dynamic lift shows reductions of 6.05%, 9.52%, and 7.73%, respectively. These improvements in system vibration characteristics primarily result from active control mechanisms that maintain a constant static uplift force. This coordinated adaptation effectively attenuates coupled pantograph–catenary vibrations, demonstrating the efficacy of active control strategies in transitional railway segments.
(2)
Passive control of pantograph
Under passive control conditions, the pantograph undergoes forced height adjustment, resulting in direction-dependent variations in contact force characteristics. To systematically evaluate these effects, Table 11 and Table 12 present comprehensive statistical analyses of the pantograph–catenary coupling response during transitional operations from conventional-speed to high-speed lines in non-wind areas, comparing both open and closed configuration operations.
As shown in Table 11 and Table 12, compared to open configuration operation, closed configuration operation exhibits a 4.11% increase in maximum contact force and a 15.51% greater average dynamic lift, accompanied by more pronounced pantograph–catenary vibrations. These effects primarily result from passive control mechanisms: forced compression reduces the working height, modifies the windward area of pantograph components, and decreases aerodynamic resistance at lower operational heights. Furthermore, open configuration operation demonstrates a more substantial reduction in the aerodynamic resistance transfer coefficient for each component compared to closed configuration operation, leading to diminished aerodynamic lift forces and consequently reduced dynamic responses.
Comparative analysis demonstrates that under passive control, the pantograph–catenary system exhibits increased dynamic responses relative to mainline operation: the maximum contact force rises by 2.43% (open configuration operation) and 6.63% (closed configuration operation), while the average dynamic lift increases by 5.97% and 22.40%, respectively. These amplified responses primarily result from passive pantograph deformation, which elevates static uplift force and consequently intensifies system vibrations. Notably, the static uplift force exerts a more substantial influence on dynamic response than aerodynamic modifications induced by working height variations.
(3)
Crosswind conditions in the wind zone under pantograph passive control
When the pantograph adopts passive control, the pantograph–catenary coupling response data of the train passing through the transition section from the conventional speed line to the high-speed line under the crosswind condition in the wind zone during open configuration operation and closed configuration operation are statistically analyzed in Table 13 and Table 14, respectively.
It can be seen from Table 13 and Table 14, compared to open configuration operation, closed configuration operation exhibits a 12.07% increase in the maximum pantograph–catenary contact force and a 6.35% rise in average dynamic lift, indicating enhanced system vibrations. Relative to mainline crosswind conditions, passive control operations show contact force variations of +4.49% (open configuration operation) and +17.11% (closed configuration operation), with dynamic lift changes of −3.54% and +2.59%, respectively. These differential responses stem from distinct control mechanisms: passive control combines pantograph compression and shape modification with increased static uplift force, whereas active control maintains constant uplift force during compression. The results demonstrate the dominant influence of static uplift force in pantograph–catenary coupling dynamics.
Under passive control conditions during transitional operations, the time-history responses of the pantograph–catenary contact force and vertical displacement are shown in Figure 8 and Figure 9.
As shown in Figure 7 and Figure 8, when the train operates at a constant speed of 160 km/h along the catenary, the dynamic response exhibits periodic variations synchronized with the span length. The vertical displacement (lift) at the mid-span slightly exceeds that at the positioning points, with the most significant oscillations predominantly occurring in the central span region.

4. Discussion

To summarize, during the transition through the non-wind area, the dynamic response of the pantograph–catenary system with the active control pantograph is significantly lower than that observed in the linear section. This indicates that the active control mechanism effectively minimizes the dynamic response in non-wind conditions, improving system stability. In contrast, the dynamic response of the pantograph–catenary system with the passive control exhibits a higher dynamic response than the mainline section, with more pronounced during closed configuration operation as opposed to open configuration operation. This indicates that under certain conditions, passive control may not be effective in reducing dynamic forces.
Under crosswind conditions in the transition section, the dynamic response of the actively controlled pantograph catenary system is significantly reduced compared to mainline operation, although the effectiveness of this improvement is slightly reduced compared to non-wind conditions. These results demonstrate that while active control continues to mitigate dynamic interactions in wind-affected zones, its vibration suppression capability experiences measurable attenuation under aerodynamic loading.
Meanwhile, the pantograph–catenary dynamic response with the passive control pantograph is greater than that in the mainline section, and the variation in dynamic response is more pronounced compared to the non-wind area. Similar to non-wind conditions, the dynamic response is also more obvious during closed configuration operation, further highlighting the challenges posed by passive control in maintaining system stability under such circumstances.
Notwithstanding these differential dynamic responses, evaluation against established pantograph–catenary performance criteria confirms that all operational conditions maintain contact forces and vertical displacements within prescribed standard limits. This confirms that the pantograph–catenary system’s dynamic response fully meets the necessary collinear requirements, maintaining system safety and operational efficiency across all conditions.

5. Conclusions

(1)
Both the conventional Tsg15B and high-speed DSA380 pantograph systems demonstrate a compliant performance in wind-affected zones, with all measured contact forces and vertical displacements remaining within the established operational limits. These results confirm that the dynamic responses of both pantograph types satisfy the essential requirements for colinear operation.
(2)
Due to the increase in the rated tension of the catenary and the load-bearing cable, the vertical displacement in the wind zone without crosswind conditions is lower than that in the non-wind zone. The average vertical displacement is reduced by 8.52%, and the standard deviation is significantly reduced, which improves the stability of the pantograph system.
(3)
Under the action of a crosswind of 20 m/s, the vibration of the overhead contact system is significant, and the maximum contact force of the high-speed train pantograph is 279.23 N. However, the pantograph still meets the requirements for safe operation. In the closed configuration operation of the pantograph, the contact force and dynamic vertical displacement of the pantograph are greater than those in the open configuration operation, and the points with large fluctuations in the catenary mainly occur in the mid-span.
(4)
Under active control, the dynamic response of the high-speed mainline is lower than that of the conventional mainline, while the opposite trend is observed under passive control.

Author Contributions

Conceptualization, G.L. and Y.G.; methodology, H.L.; software, E.C.; validation, B.G., H.L. and E.C.; investigation, J.M.; resources, G.L.; data curation, B.G. and H.L.; writing—original draft preparation, E.C.; writing—review and editing, J.M.; project administration, Y.G.; funding acquisition, G.L. All authors have read and agreed to the published version of the manuscript.

Funding

This research received no external funding.

Data Availability Statement

Data is unavailable due to privacy restrictions.

Conflicts of Interest

Authors Guanghui Li, Yongzhi Gou and Binqian Guo were employed by the company Urumqi High-Speed Railway Infrastructure Section of China Railway Urumqi Group Co., Ltd.; author Hongmei Li was employed by the company Railway Science and Technology Research and Development Center, China Academy of Railway Sciences Group Co., Ltd.; author Enfan Cao was employed by the company Tieke Shuzhi Transportation Technology (Chengdu) Co., Ltd.; author Junjie Ma was employed by the company Track, Communication & Signaling Inspection Institute, China Railway Urumqi Group Co., Ltd. Authors declare no conflicts of interest.

References

  1. Liu, S.; Zhu, X. Research on Health Status Assessment of Highspeed Railway Catenaries Based on Gray Clustering and Combination Assigning Method. J. China Railw. Soc. 2016, 38, 57–63. [Google Scholar] [CrossRef]
  2. Wu, T.X.; Brennan, M.J. Basic analytical study of pantograph-catenary system dynamics. Veh. Syst. Dyn. 1998, 30, 443–456. [Google Scholar] [CrossRef]
  3. Zhang, W.H.; Mei, G.M.; Wu, X.J.; Shen, Z. Hybrid simulation of dynamics for the pantograph-catenary system. Veh. Syst. Dyn. 2002, 38, 393–414. [Google Scholar] [CrossRef]
  4. Kerstin, S.; Wolfgang, E.; Michael, K.; Willett, S.; Jenzer, M.; Willett, T. An approach to continuous on-site monitoring of contact forces in pantographs by a fiber optic sensing system. Opt. Lasers Eng. 2013, 51, 172–179. [Google Scholar]
  5. Collina, A.; Bruni, S. Numerical simulation of pantograph-overhead equipment interaction. Veh. Syst. Dyn. 2002, 38, 261–291. [Google Scholar] [CrossRef]
  6. Bocciolone, M.; Resta, F.; Rocchi, D.; Tosi, A.; Collina, A. Pantograph aerodynamic effects on the pantograph-catenary interaction. Veh. Syst. Dyn. 2006, 44, 560–570. [Google Scholar] [CrossRef]
  7. LI, R.; Zhou, N. Influence of high-speed trains passing through tunnel on pantograph-catenary dynamic behaviors. J. Vib. Shock 2013, 32, 33–37. [Google Scholar]
  8. Poetsch, G.; Evans, J.; Meisinger, R.; Kortüm, W.; Baldauf, W.; Veilt, A.; Wallaschek, J. Pantograph/catenary dynamics and control. Veh. Syst. Dyn. 1997, 28, 393–414. [Google Scholar] [CrossRef]
  9. Pombo, J.; Ambrósio, J.; Pereira, M.; Rauter, F.; Collina, A.; Facchinetti, A. Influence of the aerodynamic forces on the pantograph-catenary system for high speed trains. Veh. Syst. Dyn. 2009, 47, 1327–1347. [Google Scholar] [CrossRef]
  10. Li, R.; Zhou, N. Fluctuating wind field and wind induced vibration response of contact network based on AR model. J. Traffic Transp. Eng. 2013, 13, 56–62. [Google Scholar]
  11. Zhao, F.; Liu, Z. Simulation Study on Influence of Stochastic Wind Field to Dynamic Behavior of Pantograph-catenary System. J. China Railw. Soc. 2012, 34, 36–42. [Google Scholar]
  12. Hu, X.; Wang, H. Dynamic Inspection Evaluation and Warning Methods of the OcS on Beijing-Shanghai HSR. Chinarailway 2024, 5, 25–32. [Google Scholar] [CrossRef]
  13. Sun, L.; Song, W. Adaptability of Existing Freight Facilities Serving High Speed Freight EMUs. Chinarailway 2023, 4, 56–62. [Google Scholar] [CrossRef]
  14. Guan, J.; Wu, J. Building and confirmation for dynamic simulation model of pantograph and catenary. J. Rail Way Sci. Eng. 2017, 14, 2444–2451. [Google Scholar]
  15. Chen, X.; Zhang, X. Research on Dynamie Current Collection Characteristies of High-Speed Railway Double-Pantograph-Catenary System Under Environmental Wind. J. Vib. Meas. Diagn. 2024, 44, 320–329 + 411–412. [Google Scholar]
  16. TB 10009-2016 [S]; Code for Design of Railway Traction Power Supply. China Railway Publishing House: Beijing, China, 2016.
  17. EN 50367:2020/A1:2022; European Standard Railway Applications. Fixed Installations and Rolling Stock. Criteria to Achieve Technical Compatibility Between Pantographs and Overhead Contact Line. CENELEC: Brussels, Belgium, 2022.
Figure 1. Simple chain-type suspension model.
Infrastructures 10 00182 g001
Figure 2. Three-mass block model of pantograph.
Infrastructures 10 00182 g002
Figure 3. Schematic diagram of pantograph–catenary contact point.
Infrastructures 10 00182 g003
Figure 4. Measured data of pantograph–catenary contact force.
Infrastructures 10 00182 g004
Figure 5. Pantograph–catenary contact force under various working conditions.
Infrastructures 10 00182 g005
Figure 6. Transition diagram.
Infrastructures 10 00182 g006
Figure 7. The change in contact force of conventional trains.
Infrastructures 10 00182 g007
Figure 8. Time history diagram of pantograph–catenary contact force.
Infrastructures 10 00182 g008
Figure 9. The timeline of dynamic lifting of the catenary.
Infrastructures 10 00182 g009
Table 1. Catenary model parameters.
FormArguments
Span length50 m
Stagger±200 mm
Dropper clearance5/8/8/8/8/8/5 m
Catenary parameters150 mm2 copper alloy wire
Cable parameters120 mm2 copper alloy stranded wire
Rated working tension of the catenary28.5 Kn (wind area); 25 kN (Non-wind area)
Rated working tension of the load-bearing cable21 kN (wind area); 20 kN (Non-wind area)
The overhead catenary is elevated6000 mm (conventional speed); 5300 mm (high speed)
Table 2. Pantograph parameters [14].
Pantographm1/kgm2/kgm3/kgk1/(N·m−1)k2/(N·m−1)k3/(N·m−1)c1/(N·s·m−1)c2/(N·s·m−1)c3/(N·s·m−1)
Tsg15B23185.3393960000.10.10.1
DSA3805.87.126.00.0114,10094307000
Table 3. Contact force.
ArgumentsContact Force
Simulation ResultMeasured DataRelative Error
Maximum contact force Fmax/N192.64200.00−3.68%
Minimum contact force Fmin/N65.3068.00−3.97%
Average contact force Fm/N120.02114.924.43%
Table 4. Dynamic performance index of catenary–pantograph interaction.
Speed v (km/h)120160200250300350
Average contact force Fm (N)60 < Fm ≤ 0.00047 × v2 + 90≤0.00097 × v2 + 70
Maximum contact force Fmax (N)300350
Minimum contact force Fmin (N)00
maximum standard deviation σmax (N)0.3Fm
Maximum lifting capacity (mm)120150
Table 5. Tsg15B statistical results of contact force of normal-speed pantograph.
Name of ParameterNon-Wind AreaWind Area with No CrosswindWind Area with Crosswind
Maximum contact force Fmax/N127.23148.32177.56
Minimum contact force Fmin/N44.9760.2750.22
Average contact force Fm/N90.5492.6294.63
maximum standard deviation σ/N28.3326.2330.27
Table 6. Statistical results of contact force of DSA380 high-speed pantograph.
Name of ParameterNon-Wind AreaWind Area with No CrosswindWind Area with Crosswind
Maximum contact force Fmax/N192.64259.65279.23
Minimum contact force Fmin/N65.3075.4367.57
Average contact force Fm/N120.02142.01158.01
maximum standard deviation σ/N31.4727.2739.01
Table 7. Statistical results of the lifting amount of Tsg15B conventional-speed pantograph.
Name of ParameterNon-Wind AreaWind Area with No CrosswindWind Area with Crosswind
Maximum lifting capacity/mm44.7142.2253.59
Minimum lifting amount/mm10.7413.5715.01
Average lifting amount/mm22.6321.6529.37
Table 8. Statistical results of the dynamic lift of the DSA380 high-speed pantograph.
Name of ParameterNon-Wind AreaWind Area with No CrosswindWind Area with Crosswind
Maximum lifting capacity/mm70.6757.4079.78
Minimum lifting amount/mm24.2018.0023.76
Average lifting amount/mm44.0934.1249.64
Table 9. Statistical results of pantograph–catenary contact force of normal-speed pantograph under active control.
Name of ParameterNon-Wind AreaWind Area with No CrosswindWind Area with Crosswind
Maximum contact force Fmax/N120.22145.63171.36
Minimum contact force Fmin/N39.3855.6746.24
Average contact force Fm/N83.0189.0392.26
maximum standard deviation σ/N23.5118.0229.31
Table 10. Statistical results of the lifting amount of the normal-speed pantograph–catenary under active control.
Maximum Lifting Capacity/mmMaximum Lifting Capacity/mmMaximum Lifting Capacity/mmMaximum Lifting Capacity/mm
Maximum lifting capacity/mm40.9839.3249.28
Minimum lifting amount/mm11.9310.2714.26
Average lifting amount/mm21.2619.5927.10
Table 11. Statistical results of the contact force of the conventional pantograph–catenary in the non-wind area under passive control.
Name of Parameter160 km/h
Tsg15B Pantograph (Open Configuration Operation)
160 km/h
Tsg15B Pantograph (Closed Configuration Operation)
Maximum contact force Fmax/N130.32135.67
Minimum contact force Fmin/N48.3252.68
Average contact force Fm/N91.2792.53
Table 12. Statistical results of the lifting amount of the conventional pantograph–catenary in the non-wind area under passive control.
Maximum Lifting Capacity/mm160 km/h
Tsg15B Pantograph (Open Configuration Operation)
160 km/h
Tsg15B Pantograph (Closed Configuration Operation)
Maximum lifting capacity/mm43.0446.13
Minimum lifting amount/mm14.7318.89
Average lifting amount/mm23.9827.70
Table 13. There are statistical results of the contact force of the crosswind constant-speed pantograph–catenary in the passive control downwind area.
Name of Parameter160 km/h
Tsg15B Pantograph (Open Configuration Operation)
160 km/h
Tsg15B Pantograph (Closed Configuration Operation)
Maximum contact force Fmax/N185.54207.94
Minimum contact force Fmin/N52.7270.32
Average contact force Fm/N98.42102.67
maximum standard deviation σ/N33.1033.32
Table 14. There are statistical results of the lift of the crosswind constant-speed pantograph–catenary in the passive control downwind area.
Maximum Lifting Capacity/mm160 km/h
Tsg15B Pantograph (Open Configuration Operation)
160 km/h
Tsg15B Pantograph (Closed Configuration Operation)
Maximum lifting capacity/mm51.2755.12
Minimum lifting amount/mm15.2317.34
Average lifting amount/mm28.3330.13
Disclaimer/Publisher’s Note: The statements, opinions and data contained in all publications are solely those of the individual author(s) and contributor(s) and not of MDPI and/or the editor(s). MDPI and/or the editor(s) disclaim responsibility for any injury to people or property resulting from any ideas, methods, instructions or products referred to in the content.

