1. Introduction
Global challenges like climate change and the reliance of many nations on imported fossil fuels highlight the critical need for sustainable transportation. Among various modes, rail and shipping stand out for their significantly lower carbon dioxide emissions per ton-kilometer of transported cargo. Consequently, rail transport is recognized as an environmentally sound system capable of moving large volumes of goods efficiently, cost-effectively, and safely over medium to long distances. Its importance is therefore expected to grow in the future [
1].
The effectiveness of rail transport services is intrinsically linked to the quality of both the transport infrastructure and the rolling stock, including its maintenance and operational practices. Notably, substandard or improperly utilized rolling stock can directly compromise the integrity of railway lines. This underscores the vested interest of railway line operators in continuously monitoring the condition of rolling stock as it traverses the tracks.
Various sensing systems, often integrated with the railway track and operating on mechanical, electrical, or optical principles [
2,
3,
4], are being developed to monitor train movement and condition [
5,
6,
7,
8,
9]. These systems provide crucial data for real-time operation and help identify problematic rolling stock that could damage the tracks. While traditional methods like acoustic and visual inspection are still in use, they are increasingly being automated. Analyzing acoustic measurements and track vibrations, for example, can diagnose vehicle and track health, as well as indicate changes in wheel-to-track load [
10,
11].
One critical parameter affecting both vehicle and track integrity is the weight of moving trains, particularly freight. Static weighing is rarely performed before trains enter the main infrastructure due to it being time-consuming and expensive. This has spurred interest in dynamic weighing systems, or “weight-in-motion” (WIM) technologies. Early WIM systems utilized strain gauges attached to the rail [
12]. Other intrusive methods involved installing sensors like quartz force sensors directly into the track [
13]. Monitoring of railway traffic parameters frequently employs piezoelectric sensors. The dynamic loading and vibrations induced by a passing train are effectively detected by piezoelectric sensors integrated into the rails or sleepers, generating a proportional electrical signal [
2]. These sensors exhibit high sensitivity to subtle pressure and vibration changes, facilitating comprehensive analysis. A key benefit is their passive operation; they do not require external power, thereby simplifying installation and deployment. However, accurate data acquisition is contingent upon meticulous installation and routine calibration. Moreover, environmental vibrations and noise inherent to railway operations can introduce signal interference, demanding advanced data processing. Interestingly, weight can also be estimated from wheel angular speed and train velocity [
14,
15]. Optical fiber-based systems are a particularly promising alternative due to their immunity to electromagnetic interference. These sensors can be attached to the side or bottom of the rail [
5,
16], or even secured with detachable clamps or magnets.
Fiber Bragg gratings (FBGs) are currently the most common optical systems for railway vehicle weighing due to their established technology, relatively simple application, the capacity for quasi-distributed sensing via integration of multiple FBGs into a single optical fiber, and the absence of a power requirement at the sensing point [
17,
18,
19]. Their principle relies on measuring a Bragg wavelength shift caused by changes in the sensing fiber’s length as the rail bends under a passing vehicle. FBGs are additionally applied in structural health monitoring [
20] and vibration analysis for bridges [
21] and tunnels. However, FBG systems can be complex and costly due to the sophisticated equipment needed for wavelength monitoring and the production of individual gratings.
Sensors in real-world settings pick up noisy signals, especially at higher speeds. This often leads researchers to focus on static or low-speed measurements for weight determination, though they may later validate their methods for faster conditions [
22].
This paper proposes a novel approach to determine the weight exerted by individual wheels of a passing train set. Our method analyzes the phase change in an interference signal, which directly correlates with the length change of a sensing optical fiber within an optical sensor. This sensor functions as a low-finesse Fabry–Perot interferometer and is strategically glued to the rail foot between two sleepers. As a train passes, the rail deforms, altering the sensing fiber’s length and consequently the phase of the interference signal. This system offers significant advantages, including sensor simplicity, straightforward signal evaluation, ultra-high sensitivity and resolution, inherent immunity to temperature–strain cross-sensitivity, proven robustness in challenging environments, and the ability to simultaneously acquire data on axle loads, axle count, train speed, and potential defects in the motion system. Therefore, our proposed optical fiber sensor system presents a compelling and effective alternative to existing FBG-based solutions.
2. Signal from the Sensor and Rail Bending
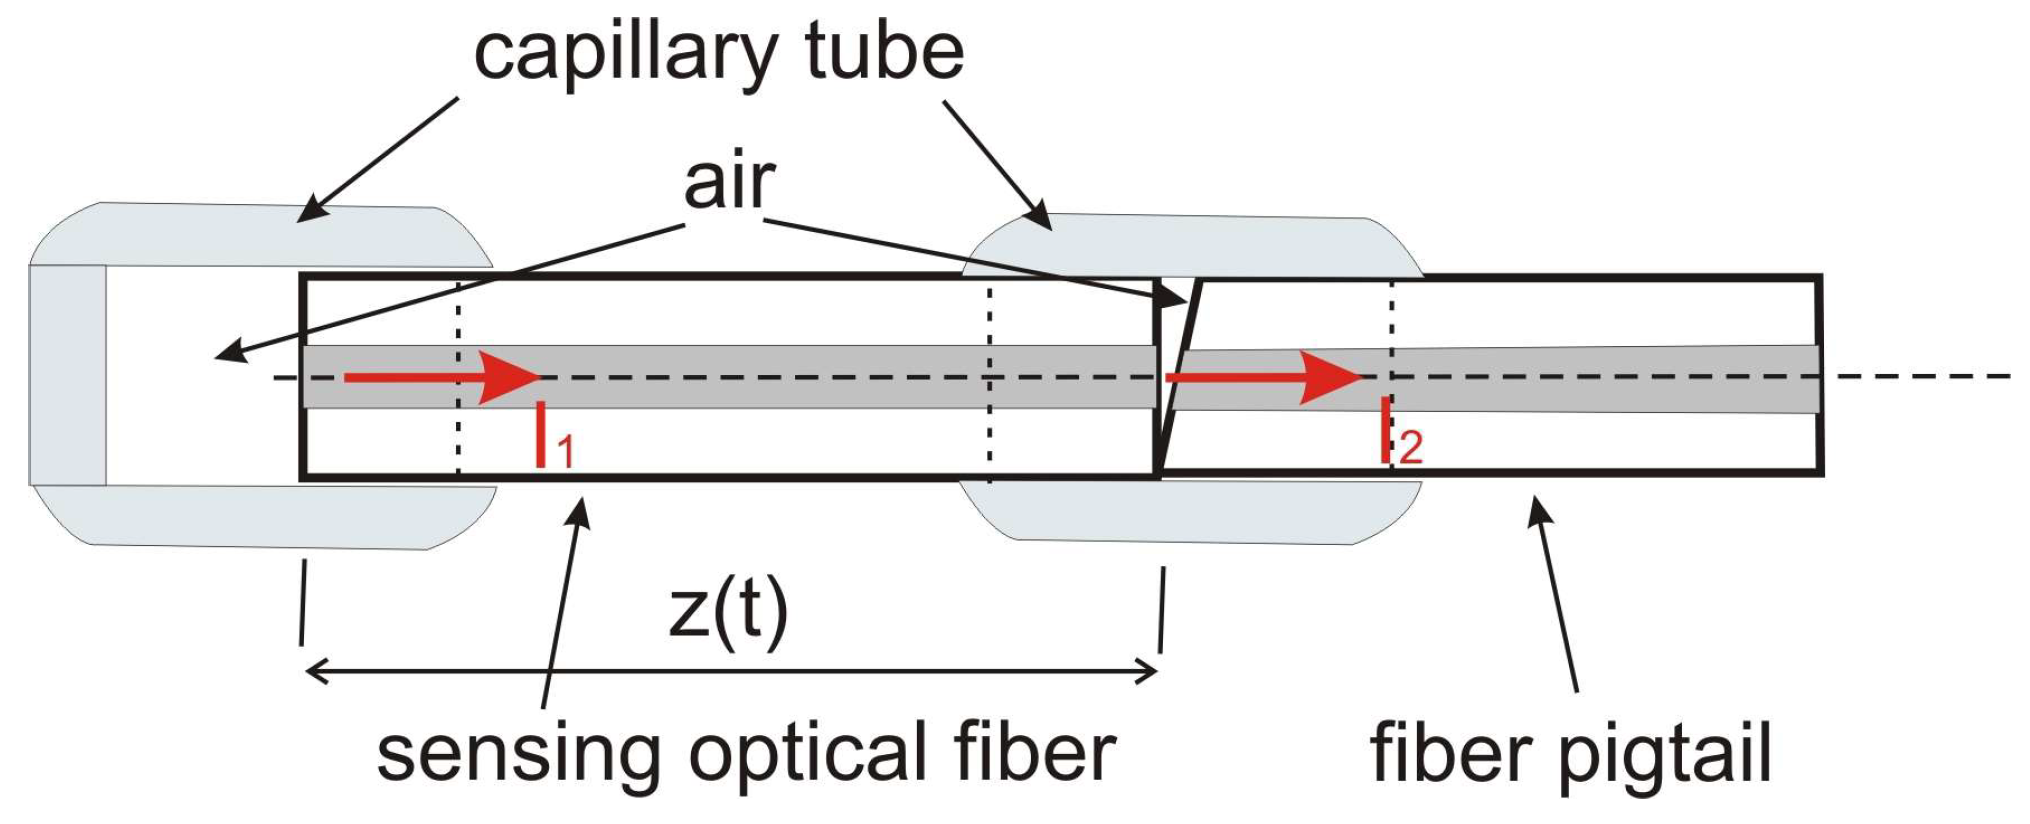
The developed optical fiber system for monitoring the dynamic operation of rolling stock comprises an optical fiber sensor, a Safibra OFLS-6-DFB-1550 laser diode operating at a wavelength of 1550 nm (Safibra s.r.o., Ricany, Czech Republic), a CIR-3-P-1550-900-1-1-FA circulator (Thorlabs Inc., Newton, NJ, USA), a Thorlabs PDA10CS-EC photodetector (Thorlabs Inc., Newton, NJ, USA), a PicoScope 5444B oscilloscope(Pico Technology, St Neots, UK), and a remote server for data storage, processing, and distribution. The sensing component of this system is based on the Fabry–Perot interferometer, where a conventional single-mode optical fiber functions as the Fabry–Perot cavity (
Figure 1). The sensor’s sensitive optical fiber is integrated into an aluminum support element (
Figure 2), which is then securely bonded to the rail’s foot between two sleepers (
Figure 3) using an MS polymer-based adhesive.
With its end faces perpendicular to the fiber axis and surrounded by air, the sensing optical fiber reflects approximately 4 percent of the incident optical radiation. This configuration allows the fiber to operate as a low-finesse Fabry–Perot interferometer. For an interferometer functioning in the optical fiber’s single-mode regime, the monochromatic optical signal in the time domain, arising from the interference of the two beams reflected from the fiber ends, can be expressed as
where
I1 and
I2 are intensities of interfering beams,
β is the propagation constant of the fundamental mode of the optical fiber,
t is time, and
z is the length of the fiber.
The bending of the rail causes an extension of the sensing optical fiber affixed to its foot. Assuming this extension is small, the quantities
I1,
I2, and
β in (1) may be treated as constant. Consequently, the interference term
Iint(
t) of the signal
I(
t) can be expressed as
where
K is a constant and
is the time change of the phase of the interference signal. Given the considered assumptions,
is determined solely by the instantaneous length of the sensing optical fiber.
Significant vibrations lead to substantial noise in the signal, which complicates the accurate determination of the signal resulting from rail bending. Based on our observations, pronounced vibrations (which appear as elevated noise levels in our signal) correlate directly with higher wear in rolling stock. For this reason, our current investigation concentrates on low-speed scenarios, where vibration-induced noise attributable to suboptimal rolling stock technical conditions is negligible.
The interference signal from the optical fiber sensor, depicting its time dependence during a train’s passage, is shown in
Figure 4. The sensor effectively captured rail deformation caused by the train, which was moving at 15.47 km/h. Notably, the train set consisted of a locomotive pushing four wagons.
The time-dependent signal data was specifically obtained during a measurement campaign dedicated to determining the number of train axles. Comprehensive details regarding this campaign can be found in our previous publication [
23]. The ambient temperature during this particular measurement was 24 °C. Even though temperature variations led to changes in the optical sensing fiber’s length, because we analyzed interference in the time domain, their effect was limited to a shift in the initial phase of the signal.
Analysis of the interference signal’s phase change, predicated on the assumption that the rail undergoes convex deformation beneath the wheel, reveals that as the train traverses the sensor, the rail between its wheels exhibits both convex and concave bending. The temporal evolution of this phase change,
(
t), was obtained through phase demodulation. This
(
t) signal, which correlates with the
Iint(
t) signal depicted in
Figure 4, is displayed in
Figure 5.
Based on the phase change
(
t) analysis of the moving train set,
Figure 6 schematically depicts the convex and concave rail deformation sites observed under two wagons.
As depicted in
Figure 6, the rail exhibits characteristic deformations: a convex bend directly beneath the wagon wheels, a concave bend within each railway bogie (between two wheels), another concave bend occurring between adjacent bogies, and further concave bends at the train set’s leading and trailing ends. This deformation pattern propagates along the rail as a traveling wave, a direct consequence of the train set’s motion. The magnitudes of these localized convex and concave bends are contingent upon the forces transmitted by individual wheels to the track and the deformational characteristics of the railway superstructure. Assuming consistent deformational properties of the railway superstructure within a chosen section of the track, the extent of individual rail bends will solely correlate with the forces (or weights) exerted by the respective wheels. Thus, the rail bending observed during the passage of a train set offers a viable means for determining individual wheel weights.
3. Rail Deformation Model
Our subsequent analysis will be confined to the deformation of the rail and the sensing optical fiber during the traverse of a railway bogie. The passage of a bogie induces bending in the optical fiber, which, in turn, alters its length. Simultaneously, the rail undergoes vertical deformation, manifesting as both convex and concave deflections.
A maximal convex bend is observed when one of the bogie’s wheels is situated directly above the sensor fiber’s centroid (
Figure 7a). Conversely, a maximal concave bend occurs when the bogie’s wheels are symmetrical to the sensor fiber’s centroid (
Figure 7b). The peak extension of the optical fiber during a convex bend is individually dependent on the gravitational forces
F1 and
F2, which are exerted perpendicularly to the rail directly above the sensor’s center and are a consequence of the wheel loads
m1 and
m2 on the railway bogie. Similarly, the optical fiber’s maximum length during a concave bend is governed by the gravitational forces
F1 and
F2, corresponding to the masses
m1 and
m2, spatially distributed around the sensor fiber.
The extension of the optical fiber, caused by the train wheels during both convex and concave rail deformations, leads to a corresponding phase shift in the interference signal. Furthermore, we hypothesize that the time-varying phase change attributed to a single wheel’s passage can be modeled using a Gaussian function. Consequently, the temporal evolution of the interference signal phase,
φconvex, at a convex bend, induced by the railway bogie wheels traversing the sensor fiber, can be mathematically formulated as
In this context, n ∈ {1,2}, where n signifies the index of the railway bogie wheel. t denotes time, and mn represents the mass (weight) of the n-th railway bogie wheel. v is the speed of the railway bogie. An quantifies the maximum phase for the n-th wheel, correlating with the peak extension of the sensing optical fiber at the rail’s convex bend, which is induced by the weight mn of the traversing wheel. Bn is the parameter that specifies the temporal point at which the maximal convex bends of the sensing optical fiber manifest upon the wheel’s passage over the sensor. Cn defines the temporal extent of the convex bend occurrence, with this parameter being dependent on the wheel speed. Importantly, parameters An and Cn remain constant for a given train wheel load and a consistent train speed.
Proceeding under these established assumptions, the temporal variation in the sensor optical fiber’s phase at the concave bend, attributed to the railway bogie’s traversal of the sensor fiber, can be formulated by the relation
In this context, the parameter Ab signifies the maximum phase associated with the peak extension of the optical fiber during the rail’s concave deformation, induced by the railway bogie’s traversal. Bb specifies the temporal instant of the maximum concave rail bend, while Cb quantifies the temporal extent of the concave bend’s occurrence.
Under these assumptions, the time dependence of phase
Φ(
t) in (2) for the passage of a railway bogie can be expressed as
where
φ0 is the phase constant.
4. Results and Discussion
We utilized the described physical–mathematical model of rail deformation, which accounts for the intensity of the interference signal in the time domain, to simulate our real measured data. The sensing element employed was an optical fiber Fabry–Perot sensor, as detailed in reference [
6]. This sensor detected the passage of the train set’s left side, comprising a locomotive and four wagons. Prior to the test, the individual wheel weights of the train set were statically measured using a Transporta Praha scale, designed for rolling stock wheel and axle load assessment (a location other than the one used for the experiment). The weights obtained from this static measurement are presented in
Table 1. During the interference signal acquisition with the optical fiber Fabry–Perot sensor, the train was moving at a speed of 15.47 km/h.
Figure 8a,
Figure 9a,
Figure 10a and
Figure 11a display the measured and calculated
Iint(
t) time dependencies. These calculations were performed using Equations (2) and (5) for the first, third, fifth, and seventh railway bogies, respectively, counting from the end of the train set (which was configured with the locomotive pushing the wagons). As is evident from these figures, there is good agreement between the measured and calculated dependencies.
An examination of the dependencies presented in
Figure 8b,
Figure 9b,
Figure 10b and
Figure 11b reveals that the phase change of the interference signal, quantified by
φconcave, exerts a negligible influence on the peak amplitudes of the
φconvex,n function. Across all simulations, the contribution of the
φconcave functions to the maxima of the
φconvex,n functions consistently remained below 1.3% of the maximum
φconvex,n value. Consequently, their contribution to the determination of maximum
An values was disregarded.
Considering that the
An values of the
φconvex,n functions are contingent upon the force (weight) exerted by each wheel of the train set, and assuming that the rail’s deformation during the train’s passage occurs strictly within elastic limits, the
An values will exhibit direct proportionality to the weight
mn. From this premise, it follows that for the accurate determination of an individual train wheel’s weight, it is sufficient to evaluate only the maximum phase change at the rail’s convex bend. The weight per wheel can subsequently be expressed by the relation
where
Kp is the proportionality constant.
Table 1 displays the
An (Gaussian peak) values obtained by comparing the experimental and theoretical
Iint(
t) interference signal dependencies for the individual wheels of the train set’s railway bogies. Additionally, this table provides the weights subsequently determined using relation (6). The proportionality constant,
Kp, used in these weight calculations was established with the aid of static weighting values.
The individual weights obtained from static scales were divided by their respective
An values, which we determined. Recognizing that the individual proportionality constants exhibited variations across different wheels, we established the overall proportionality constant,
Kp, via arithmetic averaging. The calculated
Kp value, employed for determining weights from the measured
An values, is 680 kg/rad. The weights thus calculated are presented in
Table 1.
To facilitate a direct comparison between static weights and those calculated using relation (6), the weights are presented in a bar graph (
Figure 12).
The most substantial percentage deviation between our calculated weight values and those obtained via static scales is observed for the first wheel of the fifth bogie (corresponding to the ninth wheel in
Figure 12). Static measurements indicate that the weights for the 9th and 10th wheels are virtually identical. Nevertheless, equivalent wheel loads should theoretically result in commensurate rail bending, which would be reflected by comparable
An values detected by the fiber optic sensor. The measured phase change (
An Gaussian peak) for the 10th wheel, however, deviates by 3 rad, being greater than that for the 9th wheel (
Figure 10). As we are unaware of any underlying physical mechanism that could account for such a considerable phase difference with the employed measurement methodology, given the almost identical loads on the 9th and 10th wheels, we postulate that the static scale data, specifically for the 9th wheel of the train set, is anomalous.
5. Conclusions
We utilized a Fabry–Perot interferometric system to measure the weight of a moving train. As train wheels traverse the track, they induce both convex and concave bending, leading to a change in the length of the sensing optical fiber. This length alteration, in turn, manifests as a phase change in the interference signal. The change in fiber length caused by track bending during a bogie’s passage was accurately described using a physical–mathematical model based on three Gaussian functions.
This model enabled us to determine the proportionality constant, Kp, which establishes the relationship between the maximum phase value of the interference signal for individual wheel passages and the corresponding wheel load. As Kp is influenced by various track and rolling stock parameters, it is imperative to determine this constant for a given sensor installation before its practical application.
We have successfully demonstrated this using data from low-speed train operations, where the influence of dynamic vibrations and noise is significantly reduced. Our results confirm reliable performance for speeds up to 20 km/h. It is important to note that the precision of phase determination can be influenced by increased vibration and noise at higher speeds. However, for instances involving low wear of rolling stock, the system’s applicability could extend to higher speeds. Therefore, the presented data evaluation technique offers a viable solution for weighing on railway tracks serving industrial facilities.
Author Contributions
Conceptualization, D.K. and I.M.; methodology, I.M. and D.K.; software, I.M.; validation, D.K., I.M., and P.C.; investigation, D.K. and I.M.; writing—original draft preparation, D.K.; writing—review and editing, I.M. and P.C.; visualization, I.M.; funding acquisition, I.M. All authors have read and agreed to the published version of the manuscript.
Funding
This research was partly funded by the EU NextGenerationEU through the Recovery and Resilience Plan for Slovakia [project number 09I05-03-V02-00009], and the Slovak National Grant Agency [grant number VEGA 1/0223/23].
Data Availability Statement
The data presented in this study are available on request from the corresponding author.
Conflicts of Interest
The authors declare no conflicts of interest.
References
- Costa, B.J.A.; Martins, R.; Santos, M.; Felgueiras, C.; Calçada, R. Weighing-in-motion wireless system for sustainable railway transport. Energy Procedia 2017, 136, 408–413. [Google Scholar] [CrossRef]
- Sekuła, K.; Kołakowski, P. Piezo-based weigh-in-motion system for the railway transport. Struct. Control. Health Monit. 2012, 19, 199–215. [Google Scholar] [CrossRef]
- Kouroussis, G.; Kinet, D.; Mendoza, E.; Dupuy, J.; Moeyaert, V.; Caucheteur, C. Edge-filter technique and dominant frequency analysis for high-speed railway monitoring with fiber Bragg gratings. Smart Mater. Struct. 2016, 25, 075029. [Google Scholar] [CrossRef]
- Hodge, V.J.; O’Keefe, S.; Weeks, M.; Moulds, A. Wireless sensor networks for condition monitoring in the railway industry: A survey. IEEE Trans. Intell. Transp. Syst. 2015, 16, 1088–1106. [Google Scholar] [CrossRef]
- Wei, C.L.; Lai, C.C.; Liu, S.Y.; Chung, W.H.; Ho, T.K.; Tam, H.Y.; Ho, S.L.; McCusker, A.; Kam, J.; Lee, K.Y. A fiber Bragg grating sensor system for train axle counting. IEEE Sens. J. 2010, 10, 1905–1912. [Google Scholar] [CrossRef]
- Martincek, I.; Kacik, D.; Horak, J. Interferometric optical fiber sensor for monitoring of dynamic railway traffic. Opt. Laser Technol. 2021, 140, 107069. [Google Scholar] [CrossRef]
- Kerrouche, A.; Najeh, T.; Jaen-Sola, P. Experimental strain measurement approach using fiber bragg grating sensors for monitoring of railway switches and crossings. Sensors 2021, 21, 3639. [Google Scholar] [CrossRef] [PubMed]
- Mishra, S.; Sharan, P.; Saara, K. Real time implementation of fiber Bragg grating sensor in monitoring flat wheel detection for railways. Eng. Fail. Anal. 2022, 138, 106376. [Google Scholar] [CrossRef]
- Magalhaes, J.; Jorge, T.; Silva, R.; Guedes, A.; Ribeiro, D.; Meixedo, A.; Mosleh, A.; Vale, C.; Montenegro, P.; Cury, A. A strategy for out-of-roudness damage wheels identification in railway vehicles based on sparse autoencoders. Railw. Eng. Sci. 2024, 32, 421–443. [Google Scholar] [CrossRef]
- Kaniar, L.; Zvolensky, P.; Barta, D.; Bavlna, L.; Mikolajcik, M.; Drozdziel, P. Diagnostics of electric motor of locomotive series 757. Diagnostyka 2016, 17, 95–101. [Google Scholar]
- Milne, D.R.M.; Le Pen, L.M.; Thompson, D.J.; Powrie, W. Properties of train load frequencies and their applications. J. Sound Vib. 2017, 397, 123–140. [Google Scholar] [CrossRef]
- Johansson, A.; Nielsen, J.C.O. Out-of-round railway wheels—Wheel-rail contact forces and track response derived from field tests and numerical simulations. Proc. Inst. Mech. Eng. Part F J. Rail Rapid Transit 2003, 217, 135–146. [Google Scholar] [CrossRef]
- Available online: https://kistler.cdn.celum.cloud/SAPCommerce_Download_original/003-573e.pdf (accessed on 1 May 2025).
- Onat, A.; Kazaalp, B.T. A novel methodology for dynamic weigh in motion system for railway vehicles with traction. IEEE Trans. Vehic. Technol. 2019, 68, 10545–10558. [Google Scholar] [CrossRef]
- Du, C.; Dutta, S.; Kurup, P.; Yu, T.; Wang, X. A review of railway infrastructure monitoring using fiber optic sensors. Sens. Actuators A Phys. 2020, 303, 111728. [Google Scholar] [CrossRef]
- Kacik, D.; Martincek, I.; Tarjanyi, N.; Goraus, M. Railway Monitoring System Using Optical Fiber Fabry-Pérot Interferometer. In Proceedings of the Optical Sensing and Detection VII, Strasbourg, France, 3–7 April 2022. [Google Scholar] [CrossRef]
- Kouroussis, G.; Kinet, D.; Moeyaert, V.; Dupuy, J.; Caucheteur, C. Railway structure monitoring solutions using fibre Bragg grating sensors. Int. J. Rail Transp. 2016, 4, 135–150. [Google Scholar] [CrossRef]
- Allotta, B.; D’Adamio, P.; Meli, E.; Pugi, L. Development of a new time domain-based algorithm for train detection and axle counting. Veh. Syst. Dyn. 2015, 53, 1850–1875. [Google Scholar] [CrossRef]
- Filograno, M.L.; Rodriguez-Barrios, A.; Corredera, P.; Martin-Lopez, S.; Rodriguez-Plaza, M.; Andres-Alguacil, A.; Gonzalez-Herraez, M. Real-time monitoring of railway traffic using fiber Bragg gratings. In Proceedings of the Fourth European Workshop on Optical Fibre Sensors, Porto, Portugal, 8–10 September 2010; p. 76533M. [Google Scholar] [CrossRef]
- Li, S.; Chen, S. Structural health monitoring of maglev guideway PC girders with distributed long-gauge FBG sensors. Struct. Control. Health Monit. 2018, 25, e2046. [Google Scholar] [CrossRef]
- Chen, S.-Z.; Wu, G.; Feng, D.-C.; Zhang, L. Development of a Bridge Weigh-in-Motion System Based on Long-Gauge Fiber Bragg Grating Sensors. J. Bridge Eng. 2018, 23, 04018063. [Google Scholar] [CrossRef]
- Denisenko, M.A.; Isaeva, A.S.; Sinyukin, A.S.; Kovalev, A.V. A method for measuring the mass of a railroad car using artificial neural network. Infrastructures 2024, 9, 31. [Google Scholar] [CrossRef]
- Kacik, D.; Martincek, I.; Maciak, J.; Goraus, M. Fabry-Pérot Interferometer monitoring system for counting train axle. IEEE Trans. Instrum. Meas. 2022, 71, 7005409. [Google Scholar] [CrossRef]
| Disclaimer/Publisher’s Note: The statements, opinions and data contained in all publications are solely those of the individual author(s) and contributor(s) and not of MDPI and/or the editor(s). MDPI and/or the editor(s) disclaim responsibility for any injury to people or property resulting from any ideas, methods, instructions or products referred to in the content. |
© 2025 by the authors. Licensee MDPI, Basel, Switzerland. This article is an open access article distributed under the terms and conditions of the Creative Commons Attribution (CC BY) license (https://creativecommons.org/licenses/by/4.0/).


