Article

Crash Severity in Collisions with Roadside Light Poles: Highlighting the Potential of Passive Safe Pole Solutions

by
Višnja Tkalčević Lakušić
1,
Marija Ferko
2,* and
Darko Babić
2
1
University of Zagreb, Faculty of Civil Engineering, Kačićeva 26, HR-10000 Zagreb, Croatia
2
University of Zagreb, Faculty of Transport and Traffic Sciences, Vukelićeva 4, HR-10000 Zagreb, Croatia
*
Author to whom correspondence should be addressed.
Infrastructures 2025, 10(7), 163; https://doi.org/10.3390/infrastructures10070163
Submission received: 31 May 2025 / Revised: 16 June 2025 / Accepted: 26 June 2025 / Published: 30 June 2025
(This article belongs to the Special Issue Sustainable Road Design and Traffic Management)

Abstract

This paper investigates crash severity in single-vehicle road crashes involving collisions with roadside light poles in Croatia. Due to the absence of detailed object-type classifications in the official crash database, media reports were used to identify relevant incidents in combination with the official state database, resulting in 38 crashes identified between 2016 and March 2025. Descriptive analysis and crosstabulation were applied to explore patterns in crash outcomes. A CHAID decision tree analysis was then applied in an exploratory capacity to highlight possible predictors of injury or fatal outcomes, acknowledging the limitations of the small sample size. Results showed that the speed limit was the only variable significantly associated with crash severity, with all crashes above 50 km/h resulting in injuries or fatalities. The findings highlight the importance of speed management and support the potential for implementing passively safe poles to reduce the consequences of such crashes. The study also discusses the performance of different pole types in line with EN 12767:2019, defines risk zones, and proposes solutions for the example locations. The results offer future research implications and valuable insights for road safety improvement, especially in areas with frequent pole collisions.

1. Introduction

1.1. Overview of Road Safety Indicators

The consequences of road crashes present a global problem. According to the World Health Organization (WHO), around 1.19 million people die in road crashes worldwide each year, and 20 to 50 million people are injured, some of whom become permanently disabled [1]. More than half of all road traffic deaths occur among vulnerable road users, such as pedestrians, cyclists, and motorcyclists. Also, road traffic injuries are the leading cause of death for children and young people aged 5 to 29 and the 12th leading cause of death when all ages are considered.
Apart from personal tragedies, road crashes also cause significant costs to society, including the costs for emergency services, medical care, insurance, etc. For most countries, these costs amount to 1–3% of their gross domestic product (GDP), while in some countries, they reach up to 6% of their GDP [1]. Many people die in road crashes during their most productive years. Around 69% of fatal traffic accident victims are people aged 18 to 59, while 23% are aged 60 and older.
According to [2], 20,400 people died in road crashes in the European Union countries in 2023, representing a 1% decrease compared to the previous year. Although the long-term trend shows a decrease of 10% compared to 2019, when 22,800 people died, the current rate of decline is insufficient to achieve the required 4.5% annual reduction needed to achieve the EU’s goal of halving road fatalities by 2030. The latest data on traffic fatalities in the EU are encouraging but still unfavorable. In 2024, 19,800 people died in road crashes in EU countries, making a 3% decrease compared to the previous year [3].
From 2012 to 2022, the total fatalities in such road crashes decreased by approximately 11% [2], but the proportion of single-vehicle crash fatalities relative to all road crashes increased from 30% to 35% [4].
Single-vehicle road crashes include collisions with fixed and non-fixed objects and animals (collisions with pedestrians and parked vehicles are not included). They also imply road crashes where vehicles run off the road or overturn [4]. Many of these road crashes involve vehicles crashing into fixed roadside objects. According to statistics, 20% of all fatal road crashes are caused by such road crashes [5]. Road crashes with fixed roadside objects account for approximately 8% of all road crashes in Croatia [6]. For example, in 2023, there were 3022 such accidents, making up 8.7% of the total road crashes that year. Between 2013 and 2023, a total of 22,211 such crashes occurred, resulting in 142 fatalities and 3824 injuries.
In road crashes involving vehicle collisions with fixed objects, about half of the fatalities happen at night, often with drivers under the influence of alcohol. Fatigue, inattention, poor visibility, and excessive speed are also considered to be causes of road crashes with fixed objects. For example, an increase in average driving speed by just 1% results in a 4% higher risk of a fatal crash and a 3% higher risk of a severe crash outcome [7].
When considering the objects that vehicles most often hit, according to statistics, these are trees (44%), utility poles (12%), and guardrails (10%), as shown in Figure 1 [5].

1.2. Research Background on Roadside Poles and Their Impact on Road Traffic Safety

Considering previously mentioned road crashes and their consequences, roadside poles represent hazardous road elements that should be protected to prevent vehicle collisions. The potential issue was recognized as important early on, and the foundations were laid for developing passively safe infrastructure [8,9,10]. Consequently, several researches have been conducted to determine which types of poles present the greatest risk to traffic safety and to assess the severity of crashes involving fixed roadside objects [11,12].
The latest research on the severity of roadside poles in run-off crashes, conducted in Belgium in 2024, demonstrated that high energy absorbing (HE) passively safe poles, compliant with EN 12,767 standards, significantly reduce injury severity in such crashes, reinforcing the importance of implementing forgiving roadsides [13]. Similarly, a study presented at the 2nd International Conference on Road and Rail Infrastructure analyzed the behavior of passively safe roadside poles during vehicle collisions, highlighting their energy-absorbing properties and their potential to enhance passenger [14].
Using finite element analysis, a study from 2023 examined street poles reinforced with tire-derived material (TDM) [15]. The findings indicated that TDM reinforcements could absorb approximately 28% of a vehicle’s kinetic energy at higher collision speeds, potentially reducing both occupant injuries and pole damage. This complements earlier research emphasizing the benefits of energy-absorbing roadside structures in mitigating crash severity. A simulation-based study using ANSYS Workbench software (student version) examined frontal crashes of light vehicles into traffic light poles, revealing that as the collision speed increases, so do the deformation and stress on the vehicle [16]. The findings emphasize the need to consider impact speed and material characteristics carefully when designing roadside infrastructure.
The study by Holdridge, Shankar, and Ulfarsson (2005) analyzed in-service crash data to assess how various roadside features influence injury severity in single-vehicle crashes [17]. This study emphasizes that rigid poles and tree stumps present a substantial risk for high-severity outcomes in roadside crashes, underscoring the importance of shielding such objects or replacing them with passively safe alternatives. The authors advocate for design improvements and targeted upgrades of high-risk features such as guardrail leading ends and exposed poles to reduce crash severity and enhance roadside safety. Further, a study analyzed motorcycle collisions with roadside objects (such as guardrails, trees, utility poles, and signs) in the United States to assess fatality risk [18]. Using data from FARS and GES (2004–2008), the authors found that collisions with roadside objects carry significantly higher fatality risks than ground collisions. For instance, motorcycle-tree crashes were almost 15 times more likely to be fatal compared to crashes involving only the ground, and utility poles were among the most harmful objects involved.
Collisions with rigid roadside objects such as lighting poles are a frequent contributor to severe and fatal road crashes. Analysis from the RISER project showed that most poles involved in crashes were not passively safe, and many were located within the clear zone without adequate protection [19]. The study emphasized the importance of replacing conventional poles with energy-absorbing or breakaway designs and improving their placement to mitigate crash severity.
A finite element analysis study demonstrated that aluminum traffic light poles embedded in soil offer safety advantages over steel poles during vehicle impacts, as they absorb collision energy more gradually and reduce vehicle deformation. Additionally, clayey soil provided slightly more resistance than sandy soil, and greater embedment depth improved vehicle deceleration characteristics [20]. A 2021 study utilized advanced finite element analysis to simulate vehicle collisions with lighting poles following EN 12767 [21]. The authors emphasized the critical role of model parameters, such as soil type, mesh density, and friction, in predicting occupant safety levels. Their findings highlighted how variations in these factors significantly affect the calculated ASI and THIV values, demonstrating that careful model calibration is essential for reliable evaluation of passive safety performance in lighting poles.
Despite ongoing research on the impact of roadside poles on traffic safety, existing studies remain limited in scope and number. While some research has addressed the mechanical behavior of poles during impact, only a few studies have focused explicitly on crash severity outcomes, contributing factors, and identifying high-risk areas for pole-related collisions. Many investigations are restricted to controlled environments or simplified simulations, often neglecting the complexity of real-world traffic conditions and infrastructure variability. This lack of comprehensive evaluation highlights a significant gap in the literature, emphasizing the need for further multidisciplinary research to assess the risks associated with different pole types, investigate crash dynamics in diverse contexts, and explore practical design improvements that enhance roadside safety.

1.3. Aims and Objectives

This study addresses the current literature gap regarding the safety implications of collisions with conventional roadside poles, such as metal, concrete, and wood structures. While most previous research has focused on either general fixed-object crashes or specific passive safety solutions, localized empirical analyses of crashes involving standard, non-energy-absorbing poles remain limited. By examining crash severity in these real-world collisions, this study offers new insight into the consequences of outdated pole infrastructure. It builds a foundation for evidence-based promoting EN 12767-compliant, passively safe solutions.
The research in this paper aims to analyze road crashes in which vehicles hit roadside lighting poles in the Republic of Croatia. Since road crash statistics in Croatia, unlike in some other countries, do not specify the type of fixed object in vehicle crashes (such as trees, lighting poles, traffic lights, poles of traffic signs, guardrails, buildings, etc.), official data on the number and characteristics of such accidents are not available [22]. Therefore, one of the objectives of this research is to analyze road crashes in Croatia involving collisions with public lighting poles and to identify specific high-risk zones for such accidents. Given the frequency and consequences of these incidents, besides getting the exploratory insights, another goal is to explore the potential for implementing measures and error-forgiving infrastructure in high-risk areas to mitigate the negative impact of vehicle collisions with poles through passively safe poles. Apart from that, and the limited research on that topic, this paper could be used for future research, and improvements focused on the possible measures to avoid road crashes by prediction factors.

2. Data Collection and Analysis

In the official national crash database, pole crashes are not separately labeled, making it difficult to extract relevant cases. For this reason, a media-based search was conducted to identify crashes involving collisions with roadside poles. Through this approach, a total of 41 such crashes were identified across Croatia between 2016 and the end of March 2025.
Media captions and compared articles were carefully reviewed, and available data were extracted (for example, location, crash description, date and time, vehicle types, consequences). Given that these are not official crash data, based on the extracted parameters, a cross-comparison with the national crash database was conducted to determine the correct data.
By cross-referencing these incidents with the official records from the Ministry of the Interior, it was possible to obtain official data (containing crash time, location, crash severity, vehicle type, visibility conditions, number of vehicles involved, road environment (e.g., settlement area or not, speed limit) and road geometry (e.g., curve, intersection, straight section)) for 38 crashes involving direct impacts with roadside poles. We could not connect three crashes with police data, so they were omitted from the sample. This refined sample formed the basis for further analysis.
Although impact speed data were unavailable for this study, posted speed limits were used as a contextual indicator of driving speed. National traffic statistics partially support this approach. According to official data, in the past five years, inappropriate or excessive speed has been identified as a lead contributing factor in approximately 23% of all crashes in Croatia and 34% of crashes involving injured or fatally injured persons [6]. These figures underline the relevance of speed-related factors in crash severity and support the assumption that areas with higher speed limits are likely associated with greater crash consequences.
Furthermore, according to national statistics [6], in 2023, over 263,000 traffic violations were related to speeding, marking a 5.1% increase from the previous year. Notably, most of these offenses occurred within settlements, particularly in the 10–30 km/h range over the limit, which accounted for more than 170,000 violations. Speeding outside settlements also increased, especially exceeding the limit by more than 50 km/h, which rose by 22% compared to 2022. These trends confirm that inappropriate speed remains a persistent traffic safety issue and underline the relevance of speed-related variables in crash risk analysis, even when impact speeds are not directly available.
While it is acknowledged that drivers may travel below or above the posted limits, the posted speed limit remains a meaningful contextual variable in infrastructure risk assessments and speed-related crash analysis. This is supported by a study in which interview data indicated that 61.1% of respondents were satisfied with the current speed limit, 1.9% preferred a lower limit, and 37.0% favored a higher one [23]. It is also reasonable to assume that roads with higher posted speed limits generally correlate with higher average travel speeds, and this is consistent with the observed increase in crash severity at such locations. This limitation has been considered when interpreting the findings.
The first step in the analysis involved the exploration of descriptive statistics to gain insight into the sample’s distribution across key variables, such as vehicle type, speed limit, and crash consequences. Given the relatively small sample size and the categorical nature of most variables, crosstabulation was selected as the primary method for identifying relationships between crash severity (material damage vs. injury/fatal outcome) and potential contributing factors. Crosstabulation is particularly useful for small samples because it enables simple, interpretable comparisons without relying on strong distributional assumptions.
A classification tree analysis using the CHAID (Chi-squared Automatic Interaction Detection) algorithm was implemented to complement this approach and explore potential interactions between variables in a more structured way. CHAID is a non-parametric method suitable for categorically dependent variables and smaller datasets [24,25]. It identifies the most significant predictors by recursively splitting the data based on chi-square statistics, thus producing an intuitive decision-tree structure that helps uncover patterns related to crash severity.
Due to the small sample size, the CHAID decision tree method was implemented primarily as an exploratory technique to identify potential relationships between contextual factors and crash outcomes. Rather than aiming for predictive accuracy, the analysis was intended to support pattern discovery and inform future research directions where larger and more representative datasets may be available.
This two-step approach allowed for a broad overview and a deeper examination of the data, helping to clarify the role of key contextual factors in crashes involving collisions with roadside poles.

3. Results and Discussion

This chapter presents the results of the analysis, a discussion of the results, and potential solutions that could mitigate the consequences of pole crashes. The primary focus is passively safe poles, their characteristics, the pole materials, and possible applications.

3.1. Discussion of Analysis Results and Limitations

A total of 38 pole-impact crashes were identified for this analysis through a combination of media reports and police database searches, covering the period from 2016 to 2025. All crashes in this analysis involved conventional roadside poles made of metal, wood, or concrete, none designed as passive-safe structures.
Most crashes (94.7%) involve a single vehicle, with passenger cars being the predominant vehicle type (84.2%). Powered two-wheelers (PTWs) and cargo vehicles were involved in 7.9% of crashes each. Most crashes occurred during nighttime (62.2%), while 37.8% occurred during the day. A substantial proportion (89.5%) occurred within settlement areas. Regarding road geometry, 50.0% of crashes occurred in curves, 30.6% on straight road sections, and 19.4% at intersections.
Weekday crashes accounted for 60.5% of the sample, while 39.5% occurred during weekends. Most crashes (78.9%) were registered in speed zones limited to 50 km/h. Crashes in areas with speed limits of up to 40 km/h accounted for 7.9%, and those in zones exceeding 50 km/h made up 13.2%.
As for crash outcomes, 65.8% of cases resulted in injury or fatal consequences, while 34.2% involved only material damage.
Table 1 shows an overview of potential variables, with the binary crash consequence variable as a dependent one. For analysis, the outcome variable was recoded into a binary format, distinguishing between crashes that resulted in injury or fatal outcomes and those involving material damage only. This binary classification was applied due to the limited sample size and the distribution of cases across the three original outcome categories, which posed challenges for reliable modeling using ordinal regression or decision trees with multiple branches. Similarly, the speed limit variable was grouped into ≤40 km/h, 50 km/h, and >50 km/h. This grouping was based on both the distribution of data and practical road classification standards while ensuring a sufficient number of cases per group to allow for valid statistical comparisons.
Crosstabulation analysis explored potential associations between crash consequences and various contextual factors. This method is suitable for examining relationships between categorical variables. It is particularly appropriate in studies with small sample sizes, where more complex modeling approaches may be limited by statistical power [26].
With crosstabulation, we investigated whether the distribution of crash outcomes (material damage vs. injury/fatal) differed across categories such as vehicle type, visibility conditions, settlement type, road geometry, weekend occurrence, and grouped speed limits. Chi-square tests were used to assess the statistical significance of observed associations, and measures of effect size (Phi and Cramer’s V) were included to evaluate the strength of relationships.
The results of the crosstabulation analyses are summarized in Table 2. Among the examined variables, only speed limit showed a statistically significant association with crash consequences in pole-impact crashes (χ2(2) = 8.98, p = 0.015). All other variables, including visibility conditions, road section type, location within a settlement, vehicle type, weekend occurrence, and crash circumstances, were not significantly related to the severity of pole crashes.
This result suggests that the speed limit may be an important contextual factor in whether pole crashes result in injury or fatality; however, caution is warranted given the sample size and other limitations. In contrast, the lack of statistically significant associations for the remaining variables may reflect the limited sample size and potentially weaker or indirect influence of these factors on injury outcomes in pole collisions. Additionally, the unbalanced distribution of cases across categories likely reduced the ability to detect more subtle effects.
Given these findings, speed limit was retained as a potential predictor variable in further analyses, particularly in the classification tree modeling (CHAID), which explored whether the severity of pole-impact crashes could be predicted based on posted speed limits.
As shown in Table 3, the results indicate a differentiation in crash severity based on posted speed limits. Crashes occurring in areas with a speed limit of ≤40 km/h resulted exclusively in material damage, while those in zones above 50 km/h were consistently associated with injuries or fatalities. Crashes at 50 km/h showed a mixed pattern, suggesting a transitional threshold. This pattern highlights the importance of speed as a determinant of injury risk in pole-impact crashes. Also, this differentiation underscores the relevance of posted speed limits in crash severity [17] and aligns with existing findings that link higher speed zones with increased risk in fixed-object impacts [27].
To further explore the relationship between speed limits and crash outcomes in pole collisions, a CHAID (Chi-squared Automatic Interaction Detection) decision tree analysis was conducted. The binary variable representing crash consequence (material damage vs. injury or fatal outcome) was used as the dependent variable, while the categorized speed limit variable served as the sole predictor. This method was selected for its suitability in identifying interactions between categorical variables and its ability to produce interpretable, rule-based models that segment the dataset based on statistically significant differences.
The CHAID tree was grown using default parameters with minor adjustments to match the data constraints. The maximum tree depth was set to 3, while the minimum number of cases in parent and child nodes was 5 and 2, respectively. The Pearson chi-square statistic was used for evaluating splits, and Bonferroni-adjusted p-values (α = 0.05) were applied to reduce the likelihood of Type I error due to multiple testing. No validation sample was specified due to the small sample size, and all available cases were used in model building.
The resulting classification tree, shown in Figure 2, included only one predictor, producing a significant split (adjusted p = 0.037, χ2 = 6.264, df = 1). The first node (Node 0) contained all 38 cases, with 34.2% involving only material damage and 65.8% resulting in injury or fatal outcomes. The tree was then split into two terminal nodes based on the speed limit group. Crashes that occurred at or below 40 km/h (Node 2) were exclusively material damage crashes (100%), while crashes at 50 km/h or higher (Node 1) were associated with more severe outcomes—only 28.6% resulted in material damage, and the remaining 71.4% led to injury or death. These results provide evidence for prioritizing the application of passive safe infrastructure on roads where the speed limit exceeds 40 km/h.
The model achieved an overall classification accuracy of 73.7%, correctly classifying all injury/fatal cases but only 23.1% of material damage cases. The risk estimate, which reflects the proportion of misclassified cases, was 0.263 with a standard error of 0.071. These results are consistent with the crosstab analysis and indicate a potential association between speed limit zones and crash severity in pole collisions. However, the findings should be interpreted with caution due to limited data.
The use of CHAID decision tree analysis in this study offered several advantages. First and foremost, the method provides an intuitive and visually interpretable model structure, which is particularly useful when communicating findings to scientific and professional audiences. CHAID is designed to handle categorical predictors and outcomes effectively, making it an appropriate choice for this dataset, which involved grouped speed limits and a binary outcome. It also allows for automatic detection of the most statistically relevant splits without requiring assumptions about linearity or normality, which is especially beneficial when working with relatively small and non-parametric samples. Another strength of the CHAID method lies in its capacity to reveal interaction effects and segment the data into homogeneous subgroups. In this analysis, CHAID successfully identified a speed threshold (≤40 km/h vs. >40 km/h) that separated low-severity from high-severity pole crashes. While the CHAID model identified a potential speed threshold associated with differences in crash severity, this finding requires confirmation in larger, more representative datasets.
However, several limitations must be acknowledged. The most important is the small sample size (N = 38), which restricts the statistical power of the model and increases the risk of overfitting. Although CHAID identified a significant split, the reliability and generalizability of the findings may be limited. Additionally, due to the small number of cases, only a single predictor (speed limit) was included in the final tree, preventing exploration of potentially meaningful interactions with other variables such as vehicle type, visibility, or road section. Also, there is the potential selection bias introduced by relying on media reports to identify pole crash cases. Severe crashes are more likely to be reported in the media, whereas minor incidents involving material damage may be underrepresented. While this may skew the sample toward higher-severity cases, it is important to note that collisions with roadside poles often result in vehicle immobilization and significant public visibility, increasing the likelihood of media coverage, regardless of the driver’s/passenger’s consequences.
Another limitation is the imbalance in outcome distribution. While CHAID correctly classified all injury/fatal cases, the model struggled to accurately classify material damage cases, leading to low sensitivity in that category. On the other hand, enhancing road safety predominantly focuses on eliminating severe injuries and fatalities, which confirms the usefulness of this model.
Several categorical variables in the dataset include fewer than five observations per group, weakening the robustness of statistical associations and contributing to unstable CHAID splits. Given the limited sample size, the CHAID analysis was applied primarily as an exploratory tool to identify preliminary patterns rather than construct a robust predictive model. Consequently, the findings should be interpreted as hypothesis-generating and indicative of potential trends, rather than as definitive conclusions. While exploratory, the results indicate that CHAID may be useful in future research with larger datasets for generating hypotheses about relevant crash risk factors and supporting data-driven safety assessments.
The fact that speed stands out as an influential factor shows that measures to increase safety should first of all be applied on roads with higher speed limits or conditions on the road such that vehicles move fast. It is certainly not always possible to decrease risk by reducing speed limits, especially on roads outside settlements or rural areas where it is more difficult to “control” drivers.
For future research, in addition to a larger sample size, it may be beneficial to incorporate crash impact speed or actual traffic flow speeds rather than relying solely on posted speed limits. By measuring the speed of the traffic flow at specific crash-prone locations, insights into the real needs could be obtained, rather than relying only on the posted speed limit. This can also be used for proactive action, rather than just acting retroactively. This would allow a more accurate assessment of the relationship between speed and crash severity in pole-impact crashes
The limited sample size in this study restricts the generalizability of results, as already stated. Future research should expand data sources by integrating IoT-based traffic monitoring, crowdsourced incident platforms, or detailed police reconstruction data. Additionally, spatial analysis techniques such as kernel density estimation and spatial autocorrelation could offer valuable insights into the clustering of pole crashes and regional crash risk patterns.
Although the sample size limits the generalizability of the results, this study provides a methodological framework for analyzing pole-impact crashes by identifying existing data limitations, proposing improvements in crash data collection practices, and outlining an exploratory approach for detecting influential factors. This framework lays the groundwork for future studies on pole-impact crashes, particularly those based on larger, more systematic datasets.

3.2. Passively Safe Road Infrastructure

Passively safe road infrastructure is designed to minimize injury severity in a collision [28]. Unlike conventional roadside elements, passively safe structures, such as breakaway or energy-absorbing poles, are designed to deform, yield, or detach upon impact, thereby reducing the forces transferred to vehicle occupants. These features are critical in improving outcomes in single-vehicle crashes, particularly those involving fixed objects like poles or signposts. Increasing the use of such infrastructure is considered an effective strategy for enhancing road safety, especially in areas with a high risk of run-off-road incidents. In this section, a review of passive safe infrastructure based on EN 12767 is made in order to detect application potentials and provide recommendations.
In the European Union, support structures such as light poles must comply with EN 40 and be tested according to EN 12767:2019—Passive Safety of Support Structures for Road Equipment—Requirements and Test Methods [29]. The EN 12767:2019 standard sets out criteria for passive safety and defines performance requirements for structures like lighting poles, road signs, traffic lights, and other roadside components. The goal is to reduce the severity of injuries in the event of a crash involving these elements. According to the CEN/CENELEC Regulations, the CEN members are bound to implement EN 12767:2019 as a national standard by June 2025 (all EU members). However, that does not imply that it is obligatory to apply the national standard in practice.
Compared to the previous version (EN 12767:2007) [30], which relied on vehicle impact speed, energy absorption, and occupant safety level, the 2019 revision introduced additional parameters such as the backfill type of the column’s foundation, collapse mode, direction class, and risk of roof indentation. It also replaced the older three-part designation (e.g., 100-NE-3) with a more detailed seven-part classification format (e.g., 100-NE-B-R-SE-MD-0). Structures not tested or not meeting the criteria are classed as 0. Table 4 presents the meaning of the designation codes used under EN 12767:2019 standard.
The speed class indicates the speed used during full-scale crash tests and can be 50, 70, or 100 km/h. All poles must also be tested at a 35 km/h low-speed impact. The energy absorption category is divided into high energy absorbing (HE), low energy absorbing (LE), and non-energy absorbing (NE) poles, depending on how much energy is dissipated during a crash. The classification is based on the difference between the vehicle’s impact and exit speeds.
The occupant safety level, marked with letters from A to E, reflects the level of safety for vehicle occupants based on the Acceleration Severity Index (ASI) and Theoretical Head Impact Velocity (THIV). ASI measures deceleration forces affecting passengers, while THIV estimates the velocity at which a hypothetical occupant would strike the vehicle interior. Lower ASI and THIV values indicate higher safety.
The backfill type of the foundation influences the pole’s behavior during impact and includes three classes: standard soil (S), rigid (R), and non-standard (X). The collapse mode describes whether the pole separates from the foundation during impact: no separation (NS) or separation (SE). Direction class defines how pole performance changes with vehicle impact angle, categorized as single-directional (SD), bi-directional (BD), or multi-directional (MD).
Finally, the risk of roof indentation distinguishes between Class 0 (indentation < 102 mm) and Class 1 (indentation ≥ 102 mm), indicating whether the pole could pose a threat to occupants by intruding into the passenger compartment.
Non-energy absorbing (NE) poles remain rigid during impact and typically shear near the base, separating from the foundation and falling behind the vehicle (Figure 3a). Their primary advantage is allowing the vehicle to move post-impact, reducing damage and passenger injury. However, this behavior risks secondary crashes due to the falling pole or the vehicle’s continued motion. NE poles are thus recommended for high-speed rural roads with minimal roadside hazards or vulnerable road users. However, they are unsuitable for urban areas where secondary collisions pose a greater risk [31]. High energy absorbing (HE) poles plastically deform upon impact, bending around the front and underside of the vehicle while remaining anchored to the foundation (Figure 3b). This progressive deformation significantly reduces vehicle speed, lowering the risk of secondary collisions with roadside objects or other road users. While HE poles may result in higher forces transmitted to vehicle occupants, especially at higher speeds, these injuries are generally less severe than those resulting from crashes with conventional rigid poles. HE poles best suit low-speed areas with high pedestrian activity or complex roadside environments. Low energy absorbing (LE) poles exhibit characteristics of both NE and HE poles. They deform around the vehicle similarly to HE poles but detach from the foundation like NE poles (Figure 3c). This allows for moderate deceleration and reduced vehicle damage. LE poles are considered appropriate for a wide range of road environments, including urban roads and areas with moderate speed limits, where a balance between vehicle occupant protection and risk to other road users is needed.
In addition to primary risks for vehicle occupants, crashes involving lighting poles can pose secondary hazards with potentially severe consequences for other road users. This may occur if the pole or its fragments fall onto the roadway after impact, creating unexpected obstacles and increasing the likelihood of further collisions. The danger is especially relevant at night when visibility is reduced, and debris may be less noticeable. However, the existing literature does not report cases where fragments from passively safe poles have caused problems in countries with widespread implementation of such infrastructure [32]. Another concern arises with non-energy absorbing (NE) poles, where the vehicle may continue moving after impact, increasing the risk of secondary collisions with other road users or roadside objects.
To mitigate these risks, selecting passively safe poles should consider the collapse mechanism of the pole, the safety of both vehicle occupants and other road users, local speed limits, the presence of roadside infrastructure, and potential vehicle damage. Properly implementing passively safe poles can significantly reduce crash severity, particularly in locations with a high likelihood of secondary impacts.
Their use is recommended on all roads outside urban areas where the posted speed exceeds 50 km/h, and road barriers do not protect poles. Additionally, they are suitable for urban roads and all roundabouts where the speed limit exceeds 30 km/h, especially in cases where lateral skidding may lead to pole impact or poles are placed within the working width of roadside barriers [33].
Where passively safe poles are not feasible, critical locations (especially near pedestrian crossings, cycling paths, and densely trafficked urban areas) should be protected by adequately installed safety barriers.
Passively safe poles are typically made from steel, aluminum, or composite materials. The choice depends on road type, local conditions, costs, aesthetics, and safety requirements. Steel is the most commonly used material due to its affordability, durability, fatigue resistance, and recyclability [34]. Anti-corrosion protection is crucial, as structural weakening due to corrosion could compromise crash performance. An innovative alternative is Magnelis® steel, a hot-dip galvanized product with 3.5% aluminum and 3% magnesium, which with zinc offers a superior corrosion resistance and self-healing properties [35]. It provides a service life of up to 25 years, making it a cost-effective substitute for more expensive materials like stainless steel or aluminum.
Aluminum poles are about one-third lighter than steel, reducing transport and installation costs [36]. Their service life is approximately 50 years, and they are naturally corrosion-resistant due to a protective aluminum oxide layer. This makes them particularly suitable for coastal regions [37]. Aluminum is also fully recyclable, adding to its sustainability.
Composite poles, while the most expensive option, offer significant advantages, including high tensile strength, low weight, fire resistance, and excellent electrical insulation. They do not absorb water or conduct salt, making them highly resistant to corrosion and ideal for extreme environments (e.g., hurricanes and wildfires) [38]. They require no maintenance or hazardous coatings and have an expected service life of up to 80 years [39].
The material has a direct impact on energy absorption and crash performance. A study involving vehicle crashes at 37 km/h into concrete, steel, and aluminum poles showed that concrete poles produced the highest G-forces, followed by steel [3]. In contrast, aluminum poles exhibited lower, more uniform G-force values, which favor passenger safety. Vehicles impacting steel poles decelerated rapidly, causing high occupant loads and substantial vehicle damage. In contrast, aluminum poles absorbed energy more gradually, reducing injury severity and vehicle damage. Although not included in the G-force comparison, composite poles are expected to outperform all other materials in energy absorption. Due to their lightweight nature, they often remain upright after a crash, reducing the risk of secondary collisions. Their non-conductive properties also enhance passenger safety in case of electrical failure. While initial costs are higher, composites offer long-term savings through durability and enhanced safety [38].

3.3. Detection of Risk Zones and Proposal of Passively Safe Columns

Risk zone analysis identifies and assesses potentially hazardous roadside locations where poles are exposed to a high risk of vehicle impacts. This type of analysis supports the proposal of countermeasures to improve road safety, particularly through implementing passively safe lighting poles. Furthermore, it provides a foundation for future research and infrastructure improvements.
Although the current study was limited by sample size and spatial data availability, future research could benefit from incorporating spatial analysis techniques such as Geographically Weighted Regression (GWR) [40], which can help quantify localized crash risk patterns and improve the identification of high-risk zones. Although full integration with smart infrastructure and detailed spatial risk models remains a long-term goal, such interdisciplinary approaches represent a promising direction for increasing the real-world impact of passive safe infrastructure.
In this study, the identification of risk zones was primarily based on the posted speed limit, which emerged as the only statistically significant factor in the analysis. Other infrastructure characteristics, such as curve radius, pole offset from the roadway, and absence of protective barriers, were considered qualitatively to support contextual interpretation but were not included in the quantitative classification due to data limitations. The mapped locations reflect actual crash sites and serve as preliminary risk indicators. These zones should be considered exploratory and subject to future refinement through analyses based on larger, more comprehensive datasets.
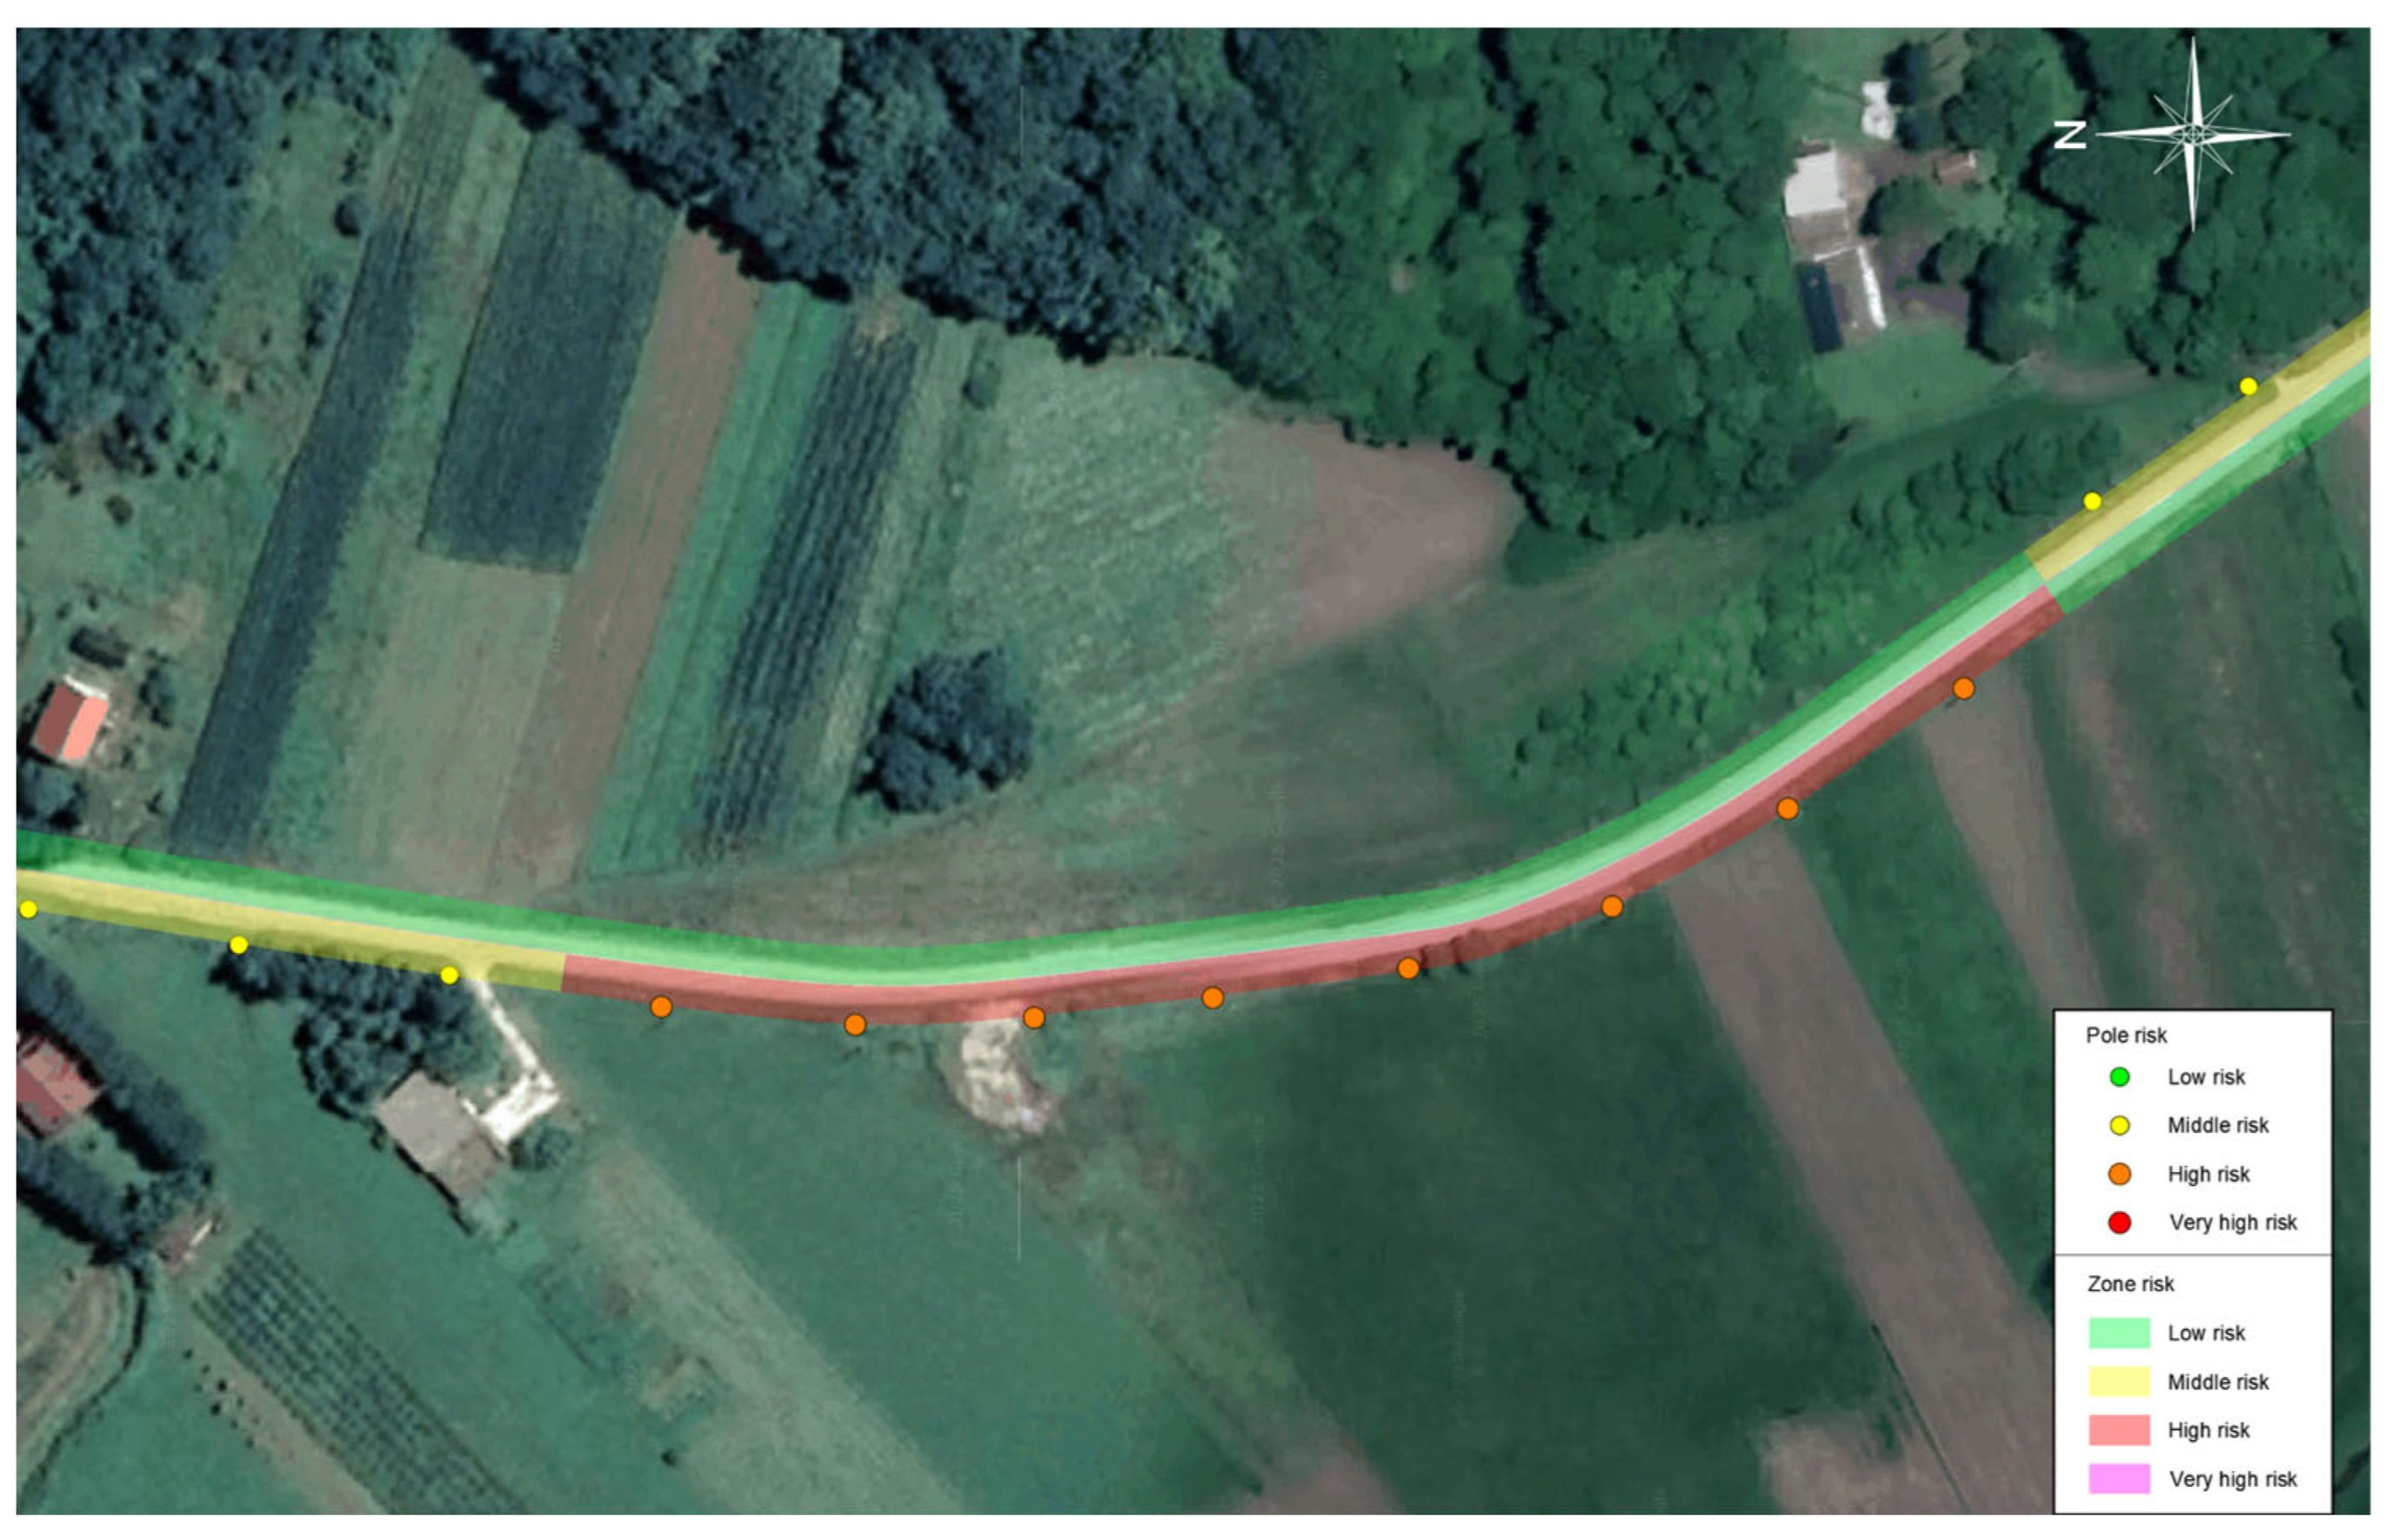
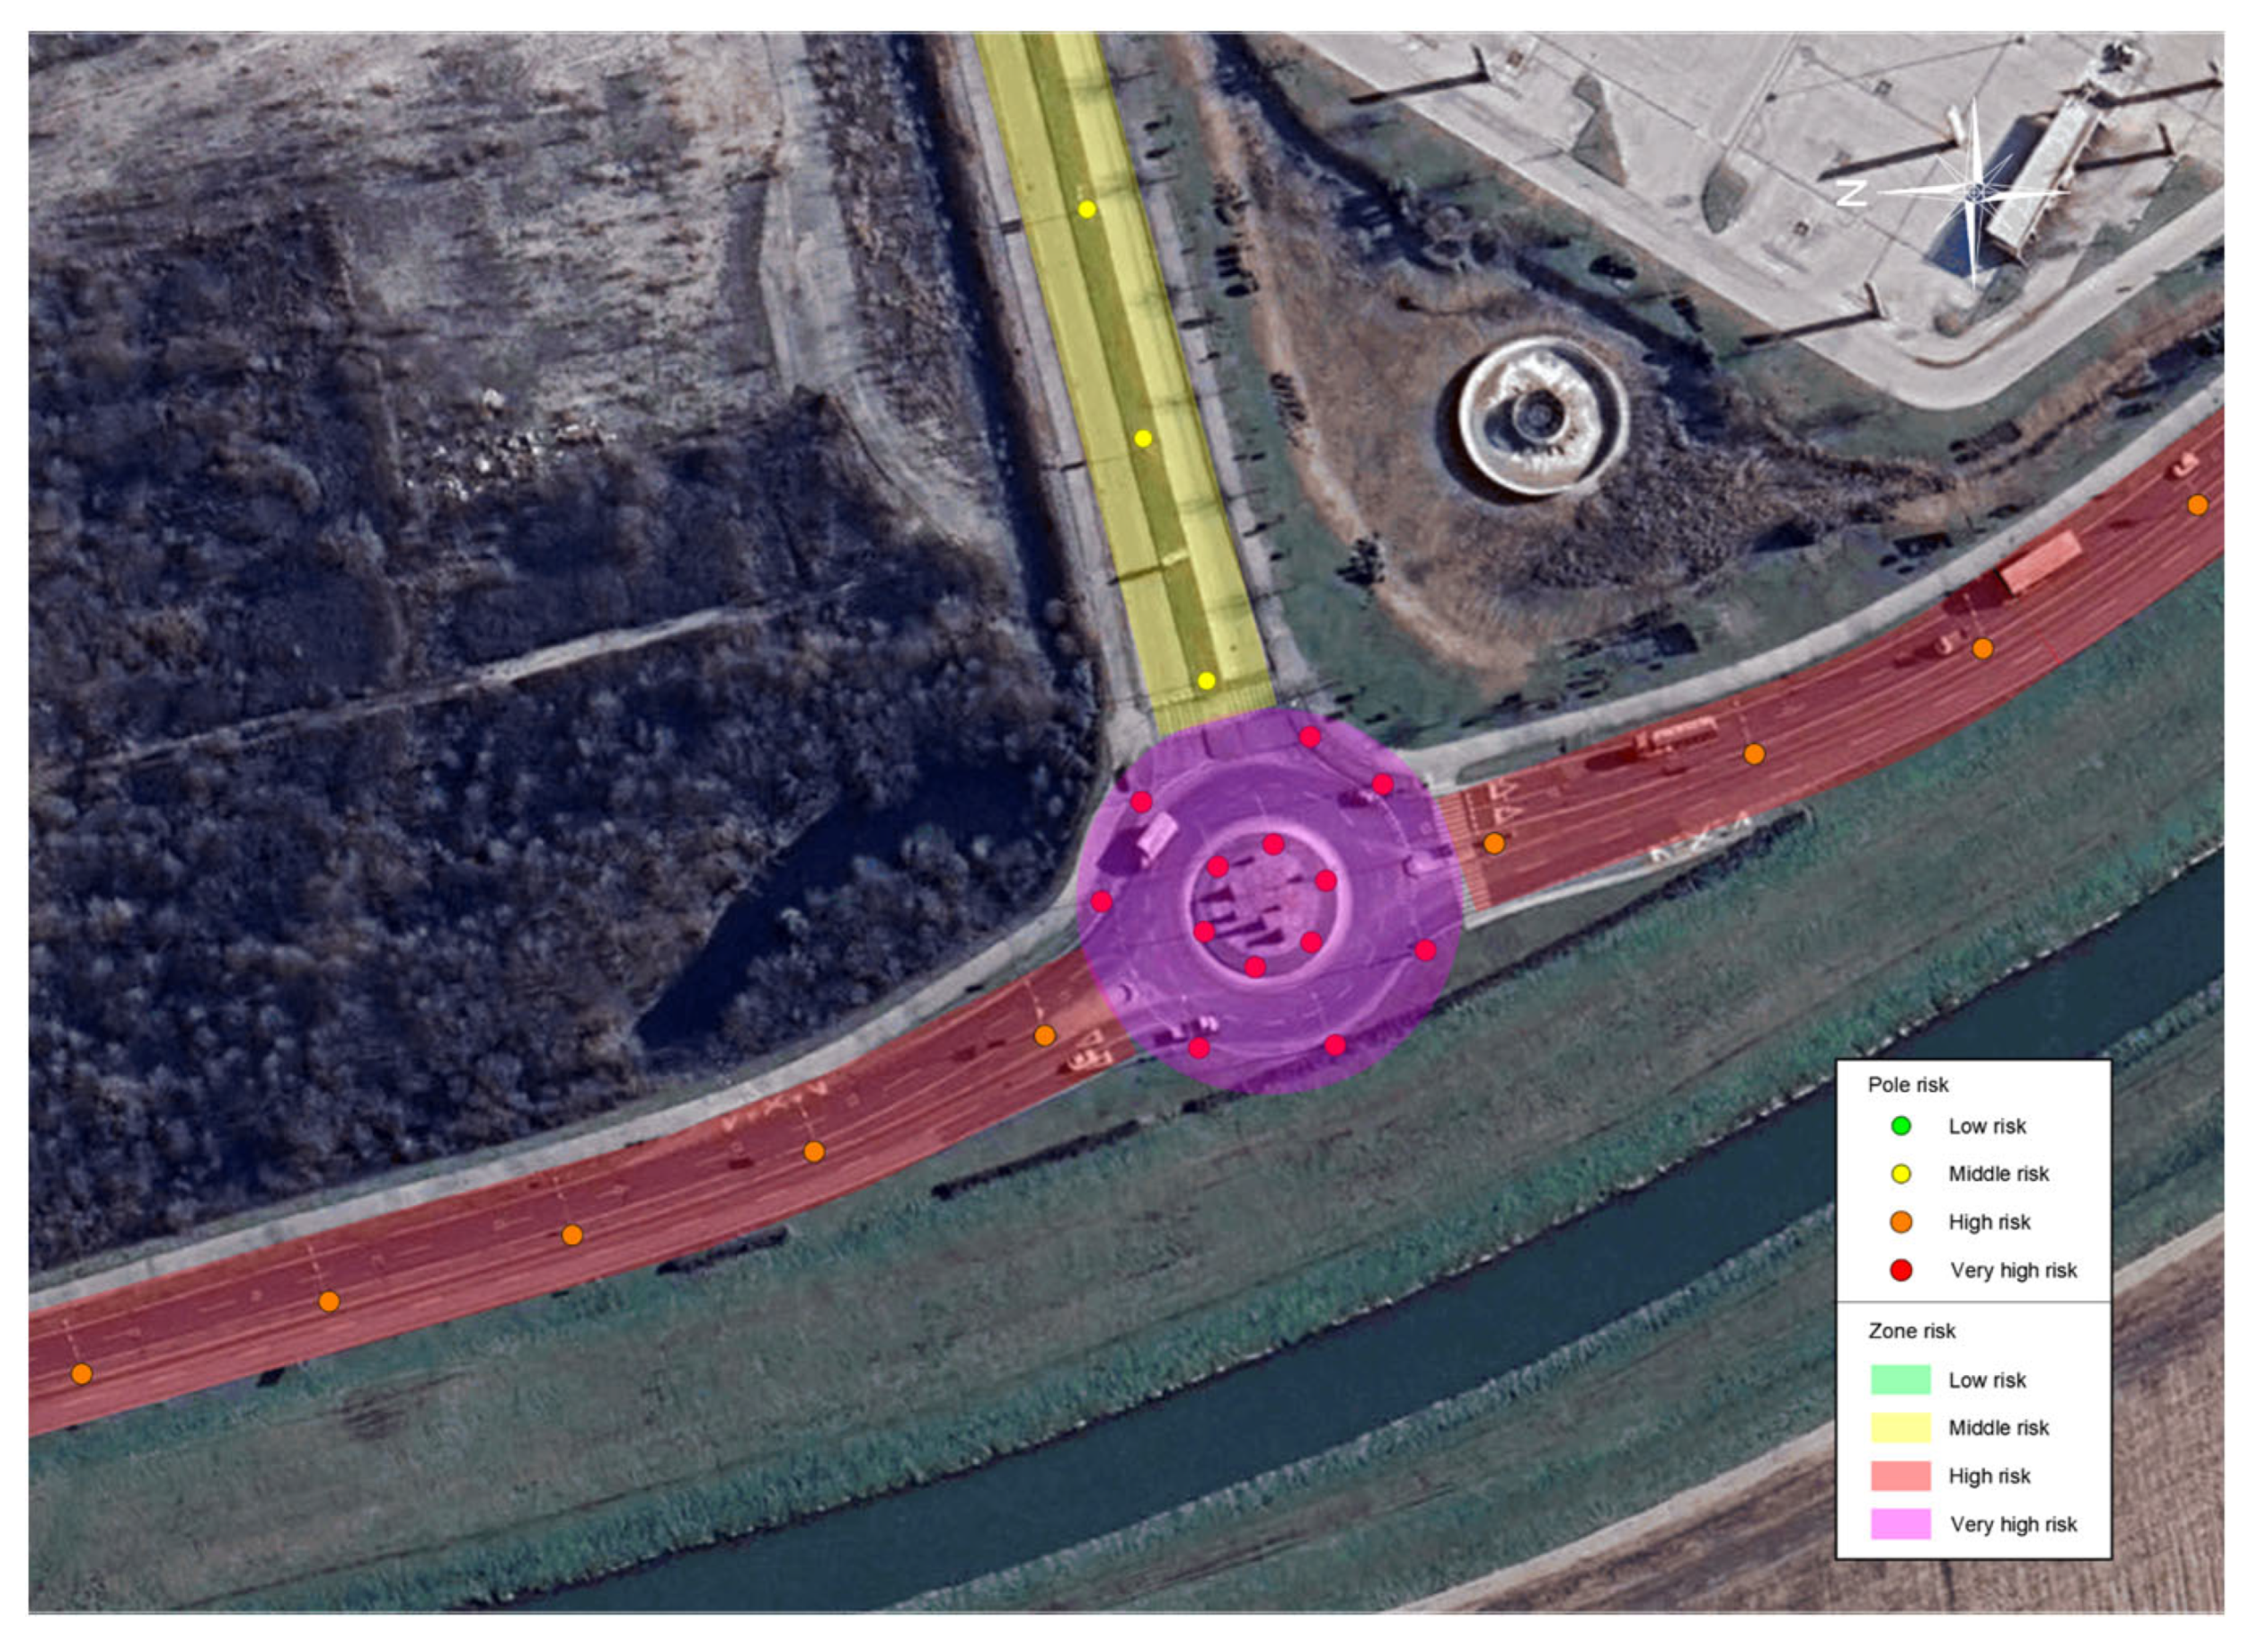
“Pole risk” refers to the risk associated with a particular pole location (based on its environment), while “zone risk” reflects the cumulative risk of a roadway section containing one or more such poles. Based on the available data, risk zones were categorized as low, medium, high, and very high risk. The classification aspired to prioritize intervention and propose locations where passively safe poles or other measures would be most effective. Figure 4 and Figure 5 present representative examples of defined pole crash risk zones.
The results obtained from this study’s analysis served as a foundation for proposing appropriate solutions following EN 12767:2019. The selection process considered descriptive crash patterns, classification results, and speed thresholds defined in the standard. The application of passively safe poles is illustrated through two representative locations described below.
For both locations, the recommended solution is the use of energy-absorbing poles. NE poles are not advised at such sites, as they are most appropriately deployed along straight road sections with clear zones exceeding 40 m and where there are no other road users or secondary hazards.
For the location shown in Figure 4, which is situated outside a settlement and includes sections adjacent to forested areas, the recommended solution is the application of LE poles. Given the limited presence of pedestrians in this area, LE poles are considered more suitable than HE poles, as they offer greater protection for vehicle occupants. Although the posted speed limit is 50 km/h, it is advisable to use poles classified for at least 70 km/h due to the likelihood that pole impacts at such sites result from speeding.
Regarding occupant safety level, the highest feasible classes (B or C) are recommended, since class A is achievable only with deformable bollards. As for the backfill type, no specific requirements are foreseen, and types R, S, or X are acceptable. Regarding collapse mode, LE poles are designed to separate from their foundations (SE). MD poles are recommended for the direction class, as they ensure consistent behavior regardless of the direction of impact. Concerning the risk of roof indentation, class 0 is advised, indicating that any indentation is expected to be less than 102 mm.
In conclusion, recommended pole classifications for this site include: 70-LE-B-NR-SE-MD-0, 70-LE-C-NR-SE-MD-0, or 100-LE-B-NR-SE-MD-0.
At the location shown in Figure 5, situated within a roundabout on a road with two traffic lanes per direction, adjacent to a shopping center (where traffic volumes are high during certain times of the day and week) the recommended solution is the application of passively safe poles with high energy absorption capacity (HE), for the following reasons. Unlike NE and LE poles, HE poles remain fixed to their foundations during a vehicle impact, reducing the likelihood of secondary crashes caused by pole detachment. Compared to LE poles, HE poles bring the vehicle to a stop more rapidly, which is particularly beneficial in minimizing the risk of secondary collisions with other vehicles in such traffic-congested environments. For this location, the recommended classifications include 70-HE-B-R-NS-MD-0 (for the roundabout zone) and 100-HE-B-R-NS-MD-0 (for the approaching zones). Given that the speed limit on the roads approaching the roundabout is 60 km/h, the appropriate minimum speed class for poles within the roundabout is 70 km/h. However, a higher classification (100 km/h) is more appropriate for poles along the approach roads. Regarding the occupant safety level, class B or C is recommended. Since the existing poles are embedded in concrete, the appropriate backfill classification is rigid (R). As HE poles do not detach from their foundations upon impact, the collapse mode is classified as NS. Given the nature of roundabouts, where collisions may occur from multiple angles, MD poles are strongly recommended to ensure consistent performance regardless of the impact direction. Finally, to minimize the risk of roof intrusion during a collision, the safer roof indentation class 0 is advised, indicating that any indentation is expected to be less than 102 mm.
Further analysis of pole crashes is essential to understand their specific characteristics and contributing factors better, enabling more precise identification of high-risk zones and optimizing safety improvements.
Future studies could benefit from cross-country comparisons between regions that have widely implemented EN 12767-compliant infrastructure and those that have not, to evaluate the standard’s real-world effectiveness in reducing crash severity and roadside fatalities.

4. Conclusions

The findings of this study emphasize that roadside pole collisions represent a significant safety concern, particularly in urban environments and areas with higher speed limits. Using a combination of media research and official crash data, 38 crashes involving light poles were analyzed, revealing that a majority resulted in injuries or fatalities. Speed limit emerged as the only statistically significant predictor of crash outcome, confirmed through crosstabulation and CHAID decision tree analysis.
One of the study’s conclusions is the need to improve crash data collection. With a more systematic recording of the characteristics of crashes, more precise research can be conducted and thus significantly improve the condition of the road infrastructure.
The results support the application of passively safe poles as a promising solution to mitigate the consequences of such crashes. Their use is especially relevant in identified high-risk zones, where the likelihood of pole impacts is increased due to road curvature, pole proximity, or high traffic speeds. This research provides a basis for targeted safety interventions and future infrastructure planning. Future work should incorporate actual traffic flow speeds or impact speeds and larger datasets to improve analysis and road safety strategies further. Further, future research should analyze the implementation costs of passively safe poles and develop recommendations for their integration into road infrastructure. Such findings could also benefit other countries where passively safe poles have not yet been widely implemented.

Author Contributions

Conceptualization, V.T.L. and D.B.; methodology, V.T.L. and D.B.; validation, D.B.; formal analysis, D.B. and M.F.; investigation, V.T.L. and D.B.; writing—original draft preparation, V.T.L.; writing—review and editing, V.T.L., D.B., and M.F.; visualization, V.T.L.; supervision, V.T.L.; project administration, V.T.L. All authors have read and agreed to the published version of the manuscript.

Funding

This research received no external funding.

Data Availability Statement

Data used to support the findings of this study are available from the corresponding author upon request.

Conflicts of Interest

The authors declare no conflicts of interest.

References

  1. Global Status Report on Road Safety 2023; World Health Organization: Geneva, Switzerland, 2023.
  2. Mobility and Transport. 20,400 Lives Lost in EU Road Crashes Last Year. Available online: https://transport.ec.europa.eu/news-events/news/20400-lives-lost-eu-road-crashes-last-year-2024-10-10_en (accessed on 12 March 2025).
  3. EU Road Fatalities Drop by 3% in 2024, but Progress Remains Slow. Available online: https://transport.ec.europa.eu/news-events/news/eu-road-fatalities-drop-3-2024-progress-remains-slow-2025-03-18_en (accessed on 12 March 2025).
  4. Atasayar, H.; Donabauer, M.; Soteropoulos, A. Facts and Figures: Single Vehicle Crashes; European Commission, European Road Safety Observatory: Brussels, Belgium, 2024. [Google Scholar]
  5. Fatality Facts. Collisions with Fixed Objects and Animals. Available online: https://www.iihs.org/topics/fatality-statistics/detail/collisions-with-fixed-objects-and-animals (accessed on 13 March 2025).
  6. Bulletins on Road Safety. Ministry of the Interior of the Republic of Croatia. Available online: https://mup.gov.hr/pristup-informacijama-16/statistika-228/statistika-mup-a-i-bilteni-o-sigurnosti-cestovnog-prometa/bilteni-o-sigurnosti-cestovnog-prometa/287330 (accessed on 13 March 2025).
  7. Road Traffic Injuries. World Health Organization. Available online: https://www.who.int/news-room/fact-sheets/detail/road-traffic-injuries (accessed on 17 March 2025).
  8. Labra, J.J.; Kimball, C.E., Jr.; McDevitt, C.F. Development of Safer Utility Poles. Transp. Res. Rec. 1983, 942, 42–53. [Google Scholar]
  9. Good, M.C.; Fox, J.C.; Joubert, P.N. An in-depth study of accidents involving collisions with utility poles. Accid. Anal. Prev. 1987, 19, 397–413. [Google Scholar] [CrossRef] [PubMed]
  10. Jones, I.S.; Baum, A.S. An Analysis of the Urban Utility Pole Accident Problem; Federal Highway Administration: New York, NY, USA; Washington DC, USA, 1980. [Google Scholar]
  11. Zegeer, C.; Scott, P.; Ivey, D.L.; Zeegeer, K. Utility Pole Safety and Hazard Evaluation Approaches; National Academies of Sciences, Engineering, and Medicine: Washington, DC, USA, 2020. [Google Scholar] [CrossRef]
  12. Levett, S.; Cleaver, M. Addressing the problem of vehicles crashing into utility poles on metropolitan & rural-urban roads in NSW. In Proceedings of the 2008 Australasian Road Safety Research, Policing and Education Conference, Adelaide, Australia, 9–12 November 2008; pp. 547–553. [Google Scholar]
  13. Roque, C.; Cardoso, J.L.; Martensen, H.; Lequeux, Q. The influence of high energy absorbing passive safe poles in run-off-road crash severity. J. Saf. Res. 2024, 91, 217–229. [Google Scholar] [CrossRef] [PubMed]
  14. Tkalčević Lakušić, V.; Lakušić, S. The behaviour of passively safe roadside columns in impact with vehicles. In Proceedings of the 2nd International Conference on Road and Rail Infrastructure, Dubrovnik, Croatia, 7–9 May 2012; pp. 1129–1138. [Google Scholar]
  15. Alardhi, M.; Sequeira, R.; Melad, F.; Alrajhi, J.; Alkhulaifi, K. Crashworthiness Analysis to Evaluate the Performance of TDM-Shielded Street Poles Using FEA. Appl. Sci. 2023, 13, 4393. [Google Scholar] [CrossRef]
  16. Raguraman, P.; Norihan Ibrahim, M. Crash and Impact Analysis of Light Vehicle Against Traffic Light Pole. Res. Prog. Mech. Manuf. Eng. 2024, 5, 180–191. [Google Scholar] [CrossRef]
  17. Holdridge, J.M.; Shankar, V.N.; Ulfarsson, G.F. The crash severity impacts of fixed roadside objects. J. Safety Res. 2005, 36, 139–147. [Google Scholar] [CrossRef] [PubMed]
  18. Daniello, A.; Gabler, H.C. Fatality risk in motorcycle collisions with roadside objects in the United States. Accid. Anal. Prev. 2011, 43, 1167–1170. [Google Scholar] [CrossRef] [PubMed]
  19. Thomson, R.; Naing, C.L.; Hill, J.; Klootwijk, C.W.; Garcia, J.M.; Grosse, U.; Dupre, G.; Bisson, O.; Figaredo, A.; Papi, J.; et al. Roadside Infrastructure for Safer European Roads: D03 Critical Vehicle and Infrastructure Interactions. 2019; Project Funded by the European Community Under the ‘Competitive and Sustainable Growth’ Programme (1998–2002). Available online: https://hdl.handle.net/2134/2202 (accessed on 23 March 2025).
  20. Elmarakbi, A.; Sennah, K.; Siriya, P.; Emam, A. Parametric effects on the performance of traffic light poles in vehicle crashes. Int. J. Crashworthiness 2010, 11, 217–230. [Google Scholar] [CrossRef]
  21. Baranowski, P.; Damaziak, K. Numerical Simulation of Vehicle–Lighting Pole Crash Tests: Parametric Study of Factors Influencing Predicted Occupant Safety Levels. Materials 2021, 14, 2822. [Google Scholar] [CrossRef] [PubMed]
  22. Tkalčević Lakušić, V.; Babić, D. Passively safe poles along roads as a measure to increase traffic safety. Građevinar 2025, 2, 141–150. [Google Scholar] [CrossRef]
  23. Haglund, M.; Åberg, L. Speed choice in relation to speed limit and influences from other drivers. Transp. Res. Part F Traffic Psychol. Behav. 2000, 3, 39–51. [Google Scholar] [CrossRef]
  24. Song, Y.-Y.; Lu, Y. Decision tree methods: Applications for classification and prediction. Shanghai Arch. Psychiatry 2015, 27, 130–135. [Google Scholar] [CrossRef] [PubMed]
  25. Milanović, M.; Stamenković, M. CHAID Decision Tree: Methodological Frame and Application. Econ. Themes 2016, 54, 563–586. [Google Scholar] [CrossRef]
  26. Sari, N.; Malkham, S.; Suparma, L.B. Road Traffic Accidents Factor on rural arterial roads. J. Appl. Eng. Sci. 2024, 22, 470–482. [Google Scholar] [CrossRef]
  27. Doecke, S.D.; Kloeden, C.N.; Dutschke, J.K.; Baldock, M.R.J. Safe speed limits for a safe system: The relationship between speed limit and fatal crash rate for different crash types. Traffic Inj. Prev. 2018, 19, 404–408. [Google Scholar] [CrossRef] [PubMed]
  28. Mohammed, A.A.; Ambak, K.; Mosa, A.M.; Syamsunur, D. A Review of Traffic Accidents and Related Practices Worldwide. Open Transp. J. 2019, 13, 65–83. [Google Scholar] [CrossRef]
  29. EN 12767:2019; Passive Safety of Support Structures for Road Equipment—Requirements and Test Methods. European Committee for Standardization: Brussels, Belgium, 2019.
  30. EN 12767:2007; Passive Safety of Support Structures for Road Equipment—Requirements and Test Methods. European Committee for Standardization: Brussels, Belgium, 2007.
  31. Passive Safe Light Poles and Support Structures. Available online: https://www.hydro.com/globalassets/download-center/publications/hydro_papers_pole-products-passive-safety-march-2021.pdf (accessed on 20 March 2025).
  32. Williams, G.L.; Kennedy, J.V.; Carroll, J.A.; Beesley, R. The Use of Passively Safe Signposts and Lighting Columns; Transport Research Laboratory: Berkshire, UK, 2008. [Google Scholar]
  33. Why Creating ‘Forgiving’ Roadsides? Available online: www.zippole.com (accessed on 20 March 2025).
  34. Tkalčević Lakušić, V. Safety of roadside columns in case of vehicle impact. Građevinar 2012, 64, 305–313. [Google Scholar] [CrossRef]
  35. Magnelis. Available online: https://www.laser-ing.hr/blog/sto-je-magnelis-celik/ (accessed on 21 March 2025).
  36. Tkalčević Lakušić, V. Analiza stupova uz prometnice iz aspekta sigurnosti u prometu. In Projektiranje Prometne Infrastrukture; Lakušić, S., Ed.; Department of Roads, Faculty of Civil Engineering, University of Zagreb: Zagreb, Croatia, 2011; pp. 321–346. [Google Scholar]
  37. Why Aluminium. Available online: https://www.aluminium-lighting.com/products/why-aluminium/ (accessed on 21 March 2025).
  38. Composite Utility Poles: A High Performance Solution. Available online: https://www.resilient-structures.com/article-composite-utility-poles-a-high-performance-solution/ (accessed on 21 March 2025).
  39. Love, L.; Post, B.; Tekinalp, H.; Wang, P.; Atkins, C.; Roschli, A.; Zhao, X.; Rencheck, M. Assessment of Commercial Composite Power Pole Performance; Oak Ridge National Laboratory: Oak Ridge, TN, USA, 2021. [Google Scholar]
  40. Mou, Z.; Jin, C.; Wang, H.; Chen, Y.; Li, M.; Chen, Y. Spatial influence of engineering construction on traffic accidents, a case study of Jinan. Accid. Anal. Prev. 2022, 177, 106825. [Google Scholar] [CrossRef] [PubMed]
Figure 1. Distribution of fixed-object crash deaths by object struck (2022) [5].
Infrastructures 10 00163 g001
Figure 2. CHAID decision tree predicting crash consequence (material damage vs. injury/fatal outcome) based on speed limit.
Infrastructures 10 00163 g002
Figure 3. Schematic representation of pole behavior: (a) NE poles, (b) HE poles, (c) LE poles [31].
Infrastructures 10 00163 g003
Figure 4. Risk zones in a curve.
Infrastructures 10 00163 g004
Figure 5. Risk zones in a roundabout.
Infrastructures 10 00163 g005
Table 1. Variables’ description.
VariableFrequencyPercentValid PercentCumul. Percent
DescriptionCode
Day of the week
Monday137.98.18.1
Tuesday2615.816.224.3
Wednesday3410.510.835.1
Thursday4410.510.845.9
Friday5615.816.262.2
Saturday6718.418.981.1
Sunday7718.418.9100
Total 3797.4100
Missing 12.6
No. of vehicles involved
One13694.794.794.7
Two225.35.3100
Vehicle type
Passenger car13284.284.284.2
PTW237.97.992.1
Cargo vehicle337.97.9100
Visibility conditions
Day11436.837.837.8
Night22360.562.2100
Total 3797.4100
Missing 12.6
In settlement
No0410.510.510.5
Yes13489.589.5100
Road section
Intersection1718.419.419.4
Curve171847.45069.4
Straight road section181128.930.6100
Total 3694.7100
Missing 25.3
Weekend
No02360.560.560.5
Yes11539.539.5100
Speed limit
≤40 km/h137.97.97.9
50 km/h23078.978.986.8
>50 km/h3513.213.2100
Crash consequence (binary)
Material damage11334.234.234.2
Injury or fatal outcome22565.865.8100
Table 2. Crosstabulation-based chi-square tests for binary crash consequence.
VariableChi2dfp-ValueNInterpretation
Speed limit8.9820.01536Significant
Visibility0.4310.51437Not significant
Road section1.8820.3936Not significant
In settlement2.3310.12738Not significant
Vehicle type2.9620.22738Not significant
Weekend0.3710.54438Not significant
Circumstances group0.1210.73238Not significant
Table 3. Crash severity outcomes (material damage vs. injury/fatal) across speed limit groups.
Speed Limit GroupMaterial Damage (n, %)Injury/Fatal (n, %)Total (n)
≤40 km/h3 (100%)0 (0%)3
50 km/h10 (33%)20 (67%)30
>50 km/h0 (0%)5 (100%)5
Table 4. Classification elements according to EN 12767:2019.
Classification ElementMeaningValues
Speed classVehicle test impact speed50, 70, 100 (km/h)
Energy absorption categoryEnergy dissipation abilityHE (High), LE (Low), NE (None)
Occupant safety levelPassenger safety in crashA, B, C, D, E (A being the highest level)
Backfill typeFoundation materialS (Soil), R (Rigid), X (Other)
Collapse modePole separating from foundationNS (No separation), SE (Separation)
Direction classAngle-dependent performanceSD (Single-), BD (Bi-), MD (Multi-direction)
Roof indentation riskRisk of roof penetration0 (<102 mm), 1 (≥102 mm)
Disclaimer/Publisher’s Note: The statements, opinions and data contained in all publications are solely those of the individual author(s) and contributor(s) and not of MDPI and/or the editor(s). MDPI and/or the editor(s) disclaim responsibility for any injury to people or property resulting from any ideas, methods, instructions or products referred to in the content.

