1. Introduction
Track managers currently estimate intervention requirements qualitatively in the initial phases of the intervention planning process based on the synthesis of visual inspection and measurement train results by a group of track engineers [
1,
2]. The current practice, however, is time-consuming, labour-intensive, and cognitively demanding for engineers. Moreover, the biases and subjectivity of experts’ judgments may result in the sub-optimal scheduling of interventions. This could eventually result in higher intervention costs and more frequent service disruptions [
3]. Consequently, a systematic approach that can generate a quantitative and comprehensive outlook of intervention requirements for all tracks over the future planning periods, considering all crucial factors and criteria, would be beneficial for track managers.
The current intervention planning process can be improved through the integration of a digital tool, leveraging recent technological advancement and the accumulation of extensive data on track component characteristics, their condition, the evolution of their condition over time, and the costs associated with their maintenance and replacement. This tool can improve the ability of track managers to plan effectively [
3,
4].
This manuscript proposes a methodology to automatically generate a consistent overview of component-level interventions, costs, possession windows, and the evolution of failure risks for all track sections located in a railway network over future planning periods. This includes considering the interaction between deteriorating components using Bayesian filters, the impacts of the residual damages to the components due to the imperfect execution of maintenance interventions using non-homogeneous transition probabilities, and the evolving risks associated with different types of potential service losses that may occur due to the sudden and gradual deterioration events connected to the time and the condition of components using fault trees. The methodology uses data of different levels of detail, probabilistic discrete state modelling for uncertain deterioration of components, and component-level intervention strategies.
The methodology enables the use of both qualitative and quantitative data collected from several sources such as visual inspections, approximate and detailed estimates of failure risks, intervention costs and impacts on service. An application of this methodology is demonstrated by estimating a complete overview of component-level intervention requirements for track sections on a 25 km railway network in Switzerland.
The remainder of this manuscript is organised as follows:
Section 2 provides a brief overview of the research on estimating the intervention requirements for railway assets.
Section 3 includes a detailed description of the proposed methodology.
Section 4 includes a detailed explanation of the example railway network, along with a detailed description of results from the implementation of the proposed methodology.
Section 5 explains how to enable the use of the methodology in infrastructure management firms.
Section 6 includes the discussion of the results, strengths and limitations of the presented methodology. Finally, the manuscript is concluded in
Section 7.
2. Literature Review
State-of-the-art methodologies aim to improve intervention planning for different infrastructure assets by addressing the concerns of different asset managers. A selection of these methodologies is summarised in
Table 1 and
Table 2. These methodologies are based on either deterministic or probabilistic modelling approaches.
Deterministic models mainly assume that the condition of a railway asset evolves over time as a (non-)linear function of the asset age. For example, Giunta et al. [
5] developed maintenance strategies for the bitumen-stabilised ballast using a deterministic model as a function of the age of the ballasts. While these models ensure the ease of comprehension and implementation in the existing asset management systems, they do not account for the uncertain behaviour of railway assets throughout their life cycle [
6].
Probabilistic models, on the other hand, consider the uncertainties associated with the evolution of railway assets’ condition subject to several deterioration processes over time. For example, Fecarotti, Andrews, and Pesenti [
7] determined the optimal track intervention strategies with the help of probabilistic modelling of deterioration processes to account for the uncertain evolution of track assets throughout their life cycle.
In addition, many state-of-the-practice methodologies use probabilistic modelling; for example, AASHTOWare in the USA, Kuba and SwissTamp in Switzerland, and the Network Rail bridge-management system in the UK [
8,
9]. These systems estimate intervention requirements over future planning periods by classifying the damage indicator measurements, determined by the inspectors, into appropriate Condition States (CSs) and probabilistically modelling their evolution over time.
Although these methodologies can be used to generate an overview of intervention requirements, they often lack the detail and considerations required by track managers, such as service loss risks and the granularity of intervention estimates. To address this limitation, some researchers suggested incorporating the sudden deterioration processes, such as the occurrence of natural hazards, into the probabilistic methodologies. For example, Lethanh et al. [
10] developed a Markov model for determining optimal intervention strategies taking into account both gradual and sudden deterioration processes using two sets of non-failure and failure CSs. Similarly, Kobayashi et al. [
11] used Bayesian estimation and the Markov Chain Monte Carlo method to estimate how assets evolve over time. These works, however, did not consider the interaction between deteriorating asset components. Therefore, some researchers proposed to consider such interactions in the construction of the models. For example, Fecarotti and Andrews [
12] incorporated the risks associated with railway track failure into their probabilistic modelling to determine the optimal track intervention strategy. Although not explicitly, they considered the interaction between deteriorating railway assets. In addition, others suggested considering the dynamic changes in the deterioration modelling to account for the impact of the residual damages after the execution of maintenance interventions. For example, Mehranfar et al. [
1] incorporated the dynamic changes in the deterioration rate of each asset component after each maintenance intervention into their probabilistic deterioration modelling to have more realistic estimates of intervention requirements using non-homogeneous transition probabilities. Some suggested conducting the deterioration modelling at the element level instead of the component level, meaning that the analysis is to be conducted for each element, such as each bolt in a fastening system. For example, Kaewunruen et al. [
13] proposed a risk-based intervention planning methodology for fastening systems. This level of detail, however, requires a vast amount of high-quality data and computing capacity.
Unfortunately, these cutting-edge methodologies are not often deemed desirable by track managers, despite their potential benefits. There are two major reasons for this. First, the implementation of these methodologies increases the efforts needed by track managers and the inspectors to generate an early-phase overview of track interventions. This is considered by many as a major barrier, e.g., collecting and analysing element-level data on all track sections requires a significant amount of time and effort since a detailed study must be conducted on all track sections in a network. Second, from the management point of view, it is more likely that an intervention is executed on all components of the same type in a track section, rather than targeting only a single element in that track section. Indeed, the likelihood might not be the same based on the specific characteristics of the components.
Ultimately, this manuscript presents a methodology to generate an efficient and complete overview of intervention requirements, their possession windows, and costs. It contributes to the state-of-the-art by the following:
estimating intervention requirements and the failure risk at the component level, since this is considered to establish an appropriate trade-off between the required effort to implement the methodology and the provided level of detail.
using non-homogeneous deterioration rates coupled with Bayesian filters to provide an improved modelling of the components’ deterioration, since the deterioration rate of the components changes over time due to both the imperfections in the execution of the maintenance intervention and the interaction between deteriorating components [
14]. For example, a fresh ballast does not behave the same as a ballast that has been rehabilitated three times.
incorporating the service loss in the estimation of intervention requirements in addition to the structural failure, since the highest risks associated with railway tracks in a well-managed railway infrastructure are the service loss, and not total structural failure.
Table 1.
Summary of a selection of literature related to railway intervention estimation.
Table 1.
Summary of a selection of literature related to railway intervention estimation.
| Source | Theme | Detail Level |
|---|
| Giunta et al. [5] | Life cycle cost assessment of bitumen stabilised ballast: A novel maintenance strategy for railway track-bed | Element |
| Kobayashi et al. [11] | A competing Markov model for cracking prediction on civil structures | Asset |
| Fecarotti and Andrews [12] | Producing effective maintenance strategies to control railway risk | Asset |
| Kaewunruen et al. [13] | Risk-Based Maintenance Planning for Rail Fastening Systems | Element |
| Adey and Hajdin [15] | Methodology for determination of financial needs of gradually deteriorating bridges with only structure level data | Asset |
| Allah Bukhsh et al. [16] | Multi-year maintenance planning framework using multi-attribute utility theory and genetic algorithms | Asset |
| Bressi et al. [17] | Optimization of maintenance strategies for railway track-bed considering probabilistic degradation models and different reliability levels | Element |
| Chiachío et al. [18] | A knowledge-based prognostics framework for railway track geometry degradation | Asset |
| Consilvio et al. [19] | A data-driven prioritisation framework to mitigate maintenance impact on passengers during metro line operation | Asset |
| Consilvio et al. [20] | On Applying Machine Learning and Simulative Approaches to Railway Asset Management: The Earthworks and Track Circuits Case Studies | Asset |
| Fecarotti and Andrews [21] | A Petri net approach to assess the effects of railway maintenance on track availability | Component |
| Hidirov and Guler [22] | Reliability, availability and maintainability analyses for railway infrastructure management | Component |
| Irfan et al. [23] | Framework for airfield pavements management—an approach based on cost-effectiveness analysis | Asset |
| Prescott and Andrews [24] | Investigating railway track asset management using a Markov analysis | Asset |
| Prescott and Andrews [25] | A track ballast maintenance and inspection model for a rail network | Component |
| Rúa et al. [26] | A top-down approach for a multi-scale identification of risk areas in infrastructures: particularization in a case study on road safety | Asset |
| Sadeghi et al. [27] | Improvement of railway ballast maintenance approach, incorporating ballast geometry and fouling conditions | Element |
| Sancho et al. [28] | Optimizing Maintenance Decision in Rails: A Markov Decision Process Approach | Asset |
| Sasidharan et al. [29] | A whole life cycle approach under uncertainty for economically justifiable ballasted railway track maintenance | Asset |
| Sharma et al. [30] | Data-driven optimization of railway maintenance for track geometry | Asset |
| Soleimanmeigouni et al. [31] | Prediction of railway track geometry defects: a case study | Asset |
| Sresakoolchai and Kaewunruen [32] | Railway infrastructure maintenance efficiency improvement using deep reinforcement learning integrated with digital twin based on track geometry and component defects | Component |
| Usman et al. [33] | Railway track subgrade failure mechanisms using a fault chart approach | Element |
| Usman et al. [34] | Using Probabilistic Fault Tree Analysis and Monte Carlo Simulation to Examine the Likelihood of Risks Associated with Ballasted Railway Drainage Failure | Asset |
| Vale and Simos [35] | Prediction of Railway Track Condition for Preventive Maintenance by Using a Data-Driven Approach | Asset |
| Vandoorne and Gräbe [36] | Stochastic rail life cycle cost maintenance modelling using Monte Carlo simulation | Element |
| Wenfi et al. [37] | Optimization Model of Life Cycle Repair Decisions for Track Network | Asset |
| Proposed methodology | Improving the intervention planning of railway tracks considering the interaction of components and uncertain evolution of failure risks | Component |
Table 2.
Summary of a selection of literature related to railway intervention estimation.
Table 2.
Summary of a selection of literature related to railway intervention estimation.
| | Deterioration Types | | | | Failure Risks | | | |
|---|
|
Source
|
Gradual
|
Sudden
|
Deterioration Modelling
|
Dynamic Deterioration Rates
| Interaction Between Assets/Components |
Structural
|
Service
|
Dynamic FR 1 Calculation
|
IS 1 Determination/Utilization
|
Generating Future Interventions Overview
|
|---|
| Giunta et al. [5] | ✓ | × | Deterministic | × | × | × | × | × | ✓ | × |
| Kobayashi et al. [11] | ✓ | × | Stochastic | × | ✓ | × | × | × | ✓ | × |
| Fecarotti and Andrews [12] | ✓ | ✓ | Stochastic | × | × | ✓ | × | × | ✓ | × |
| Kaewunruen et al. [13] | × | ✓ | Stochastic | × | × | ✓ | × | ✓ | × | × |
| Adey and Hajdin [15] | ✓ | ✓ | Stochastic | × | × | ✓ | × | × | ✓ | × |
| Allah Bukhsh et al. [16] | ✓ | × | Mixed | ✓ | × | ✓ | × | × | ✓ | × |
| Bressi et al. [17] | ✓ | × | Stochastic | × | × | × | × | × | ✓ | × |
| Chiachío et al. [18] | ✓ | ✓ | Stochastic | × | × | ✓ | × | ✓ | × | × |
| Consilvio et al. [19] | × | × | - | × | × | × | ✓ | × | ✓ | × |
| Consilvio et al. [20] | ✓ | × | Stochastic | × | × | ✓ | × | ✓ | ✓ | × |
| Fecarotti and Andrews [21] | ✓ | ✓ | Stochastic | × | × | × | ✓ | × | ✓ | × |
| Hidirov and Guler [22] | ✓ | ✓ | Stochastic | × | × | ✓ | × | × | ✓ | × |
| Irfan et al. [23] | ✓ | × | Deterministic | × | × | × | × | × | ✓ | × |
| Prescott and Andrews [24] | ✓ | × | Stochastic | × | × | × | × | × | ✓ | × |
| Prescott and Andrews [25] | ✓ | × | Stochastic | × | × | × | × | × | ✓ | × |
| Rúa et al. [26] | × | ✓ | - | × | × | ✓ | × | × | × | × |
| Sadeghi et al. [27] | ✓ | × | Deterministic | × | × | × | × | × | ✓ | × |
| Sancho et al. [28] | ✓ | × | Stochastic | × | × | × | × | × | ✓ | × |
| Sasidharan et al. [29] | ✓ | ✓ | Stochastic | × | × | ✓ | × | × | ✓ | × |
| Sharma et al. [30] | ✓ | ✓ | Stochastic | × | × | ✓ | × | × | ✓ | × |
| Soleimanmeigouni et al. [31] | ✓ | × | Deterministic | ✓ | × | ✓ | × | ✓ | × | × |
| Sresakoolchai and Kaewunruen [32] | ✓ | × | AI | ✓ | × | × | × | × | ✓ | × |
| Usman et al. [33] | × | ✓ | - | × | × | ✓ | × | × | × | × |
| Usman et al. [34] | × | ✓ | Stochastic | × | × | ✓ | × | ✓ | × | × |
| Vale and Simos [35] | ✓ | × | Stochastic | × | × | × | × | × | ✓ | × |
| Vandoorne and Gräbe [36] | ✓ | ✓ | Stochastic | × | × | ✓ | × | × | ✓ | × |
| Wenfi et al. [37] | ✓ | ✓ | Stochastic | ✓ | ✓ | × | × | × | ✓ | × |
| Proposed Methodology | ✓ | ✓ | Stochastic | ✓ | ✓ | ✓ | ✓ | ✓ | ✓ | ✓ |
3. Methodology
3.1. Steps
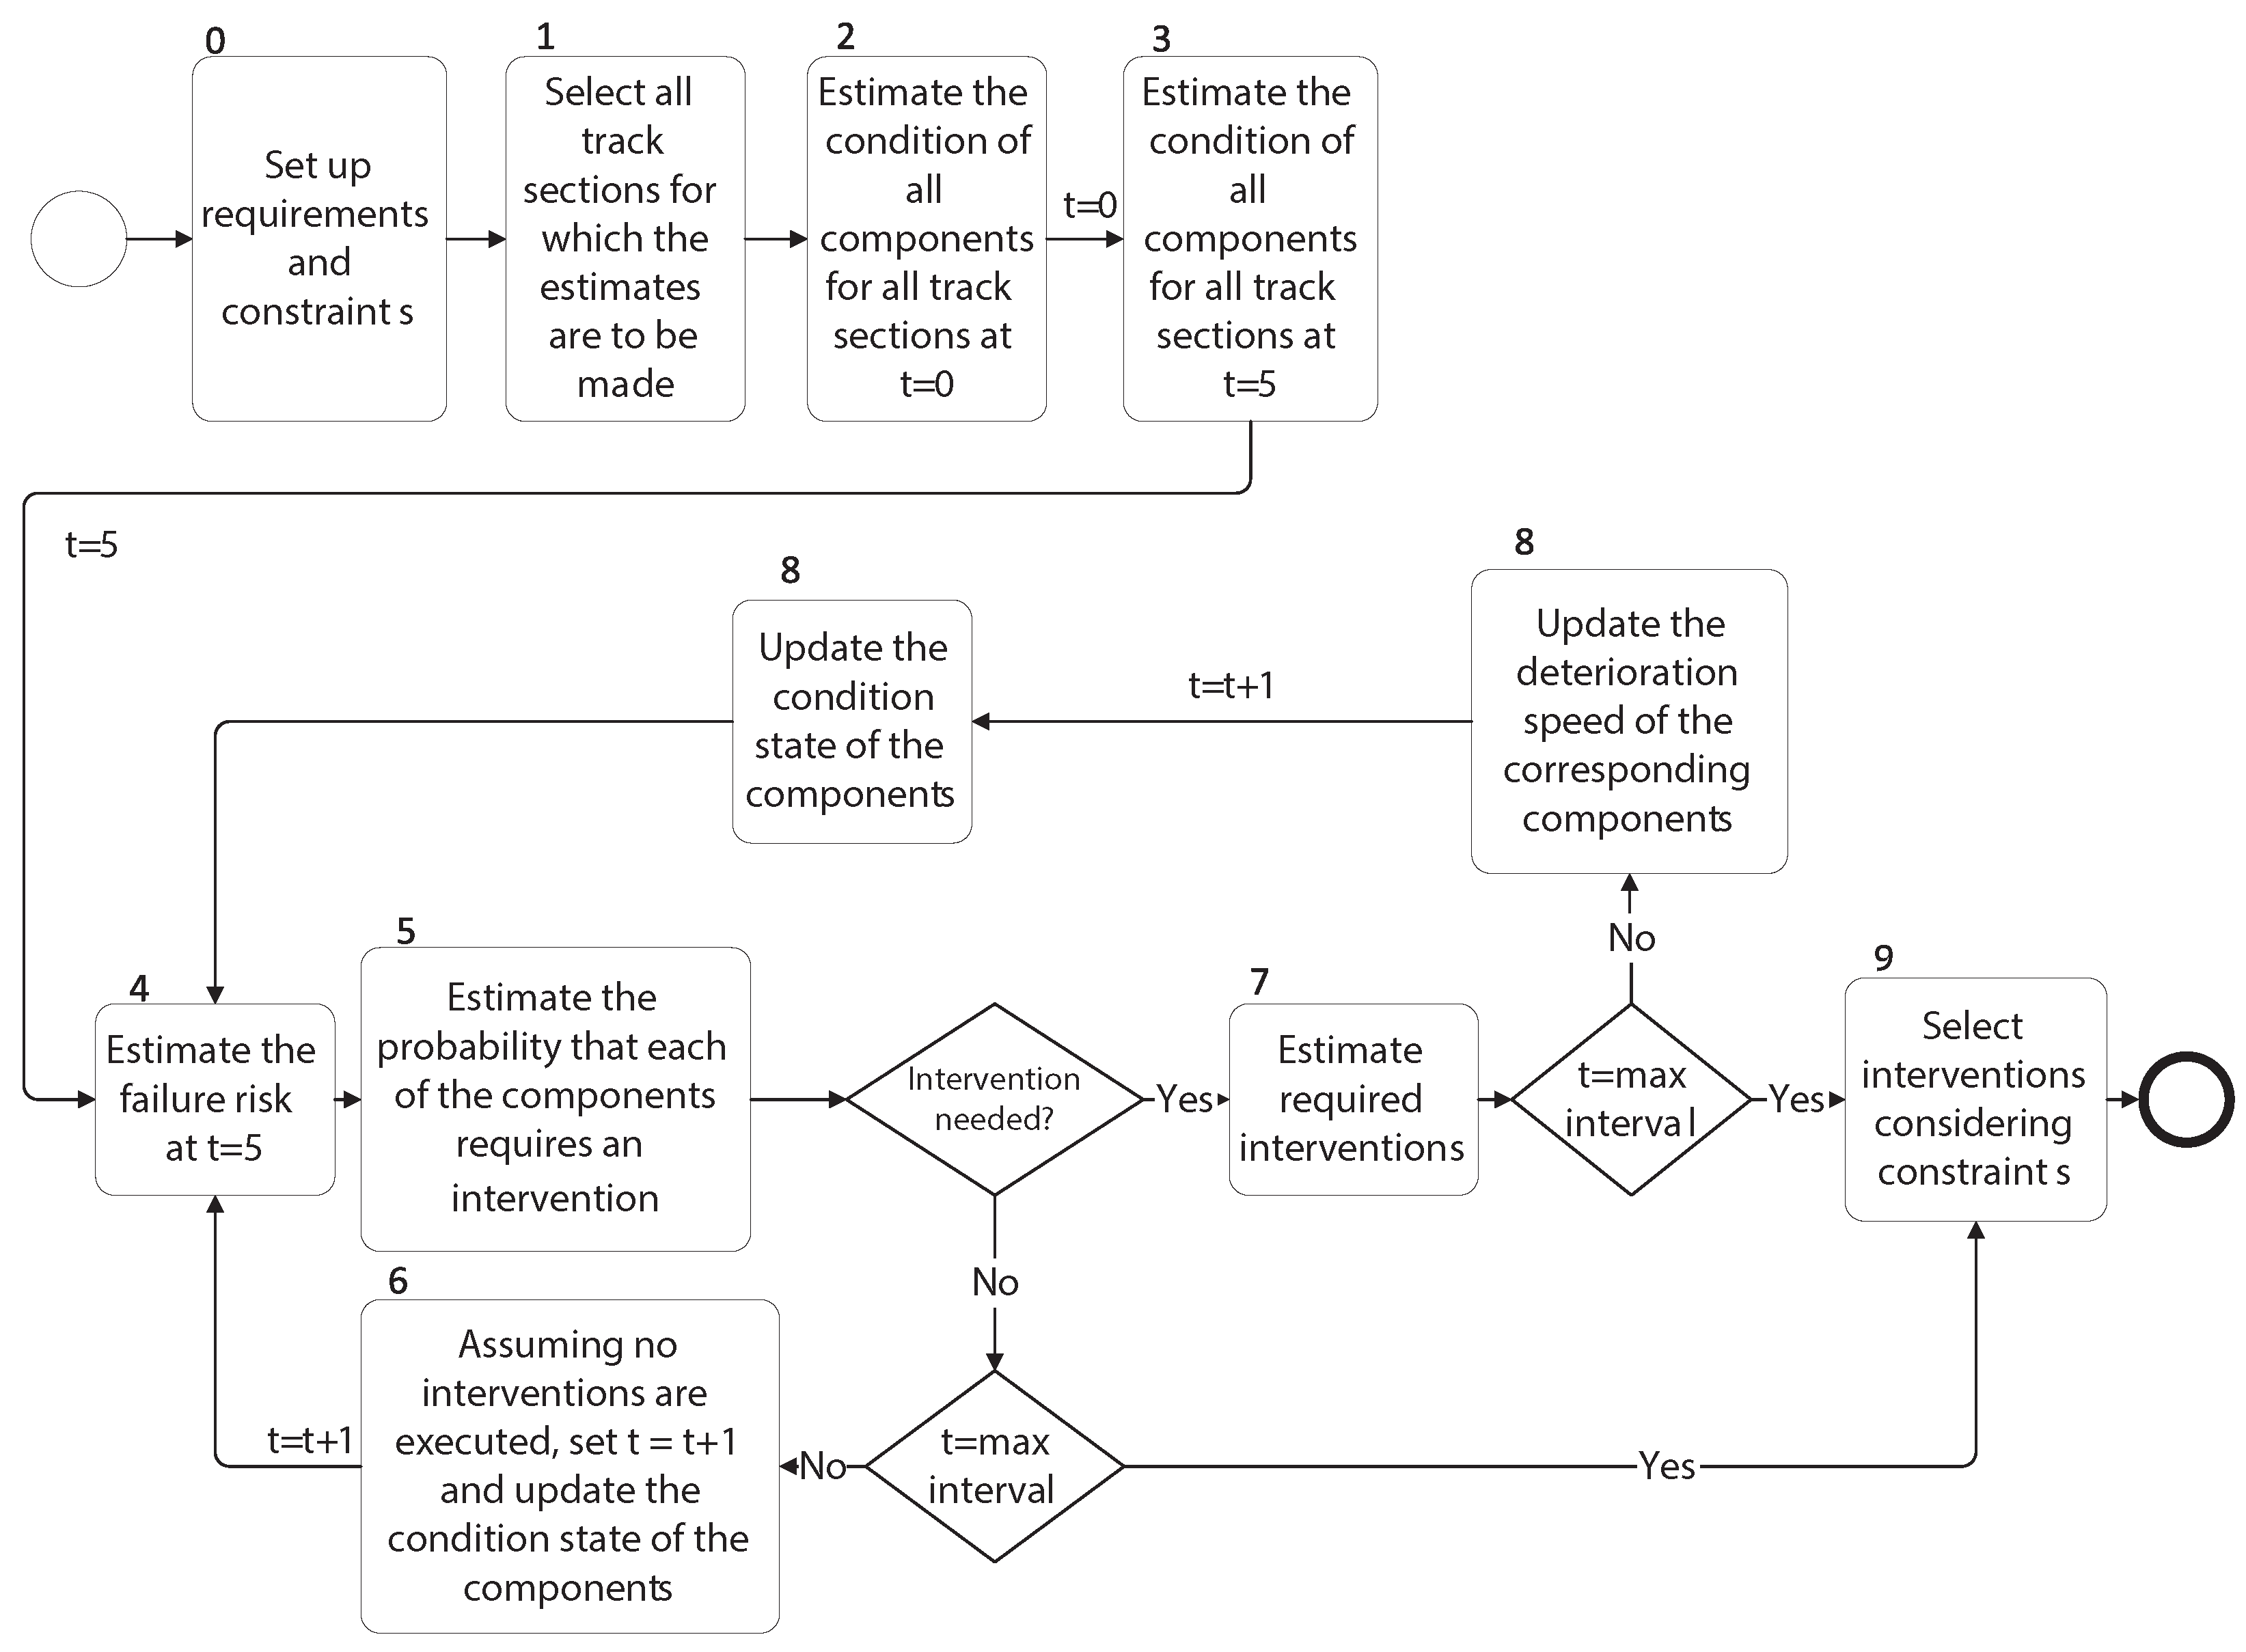
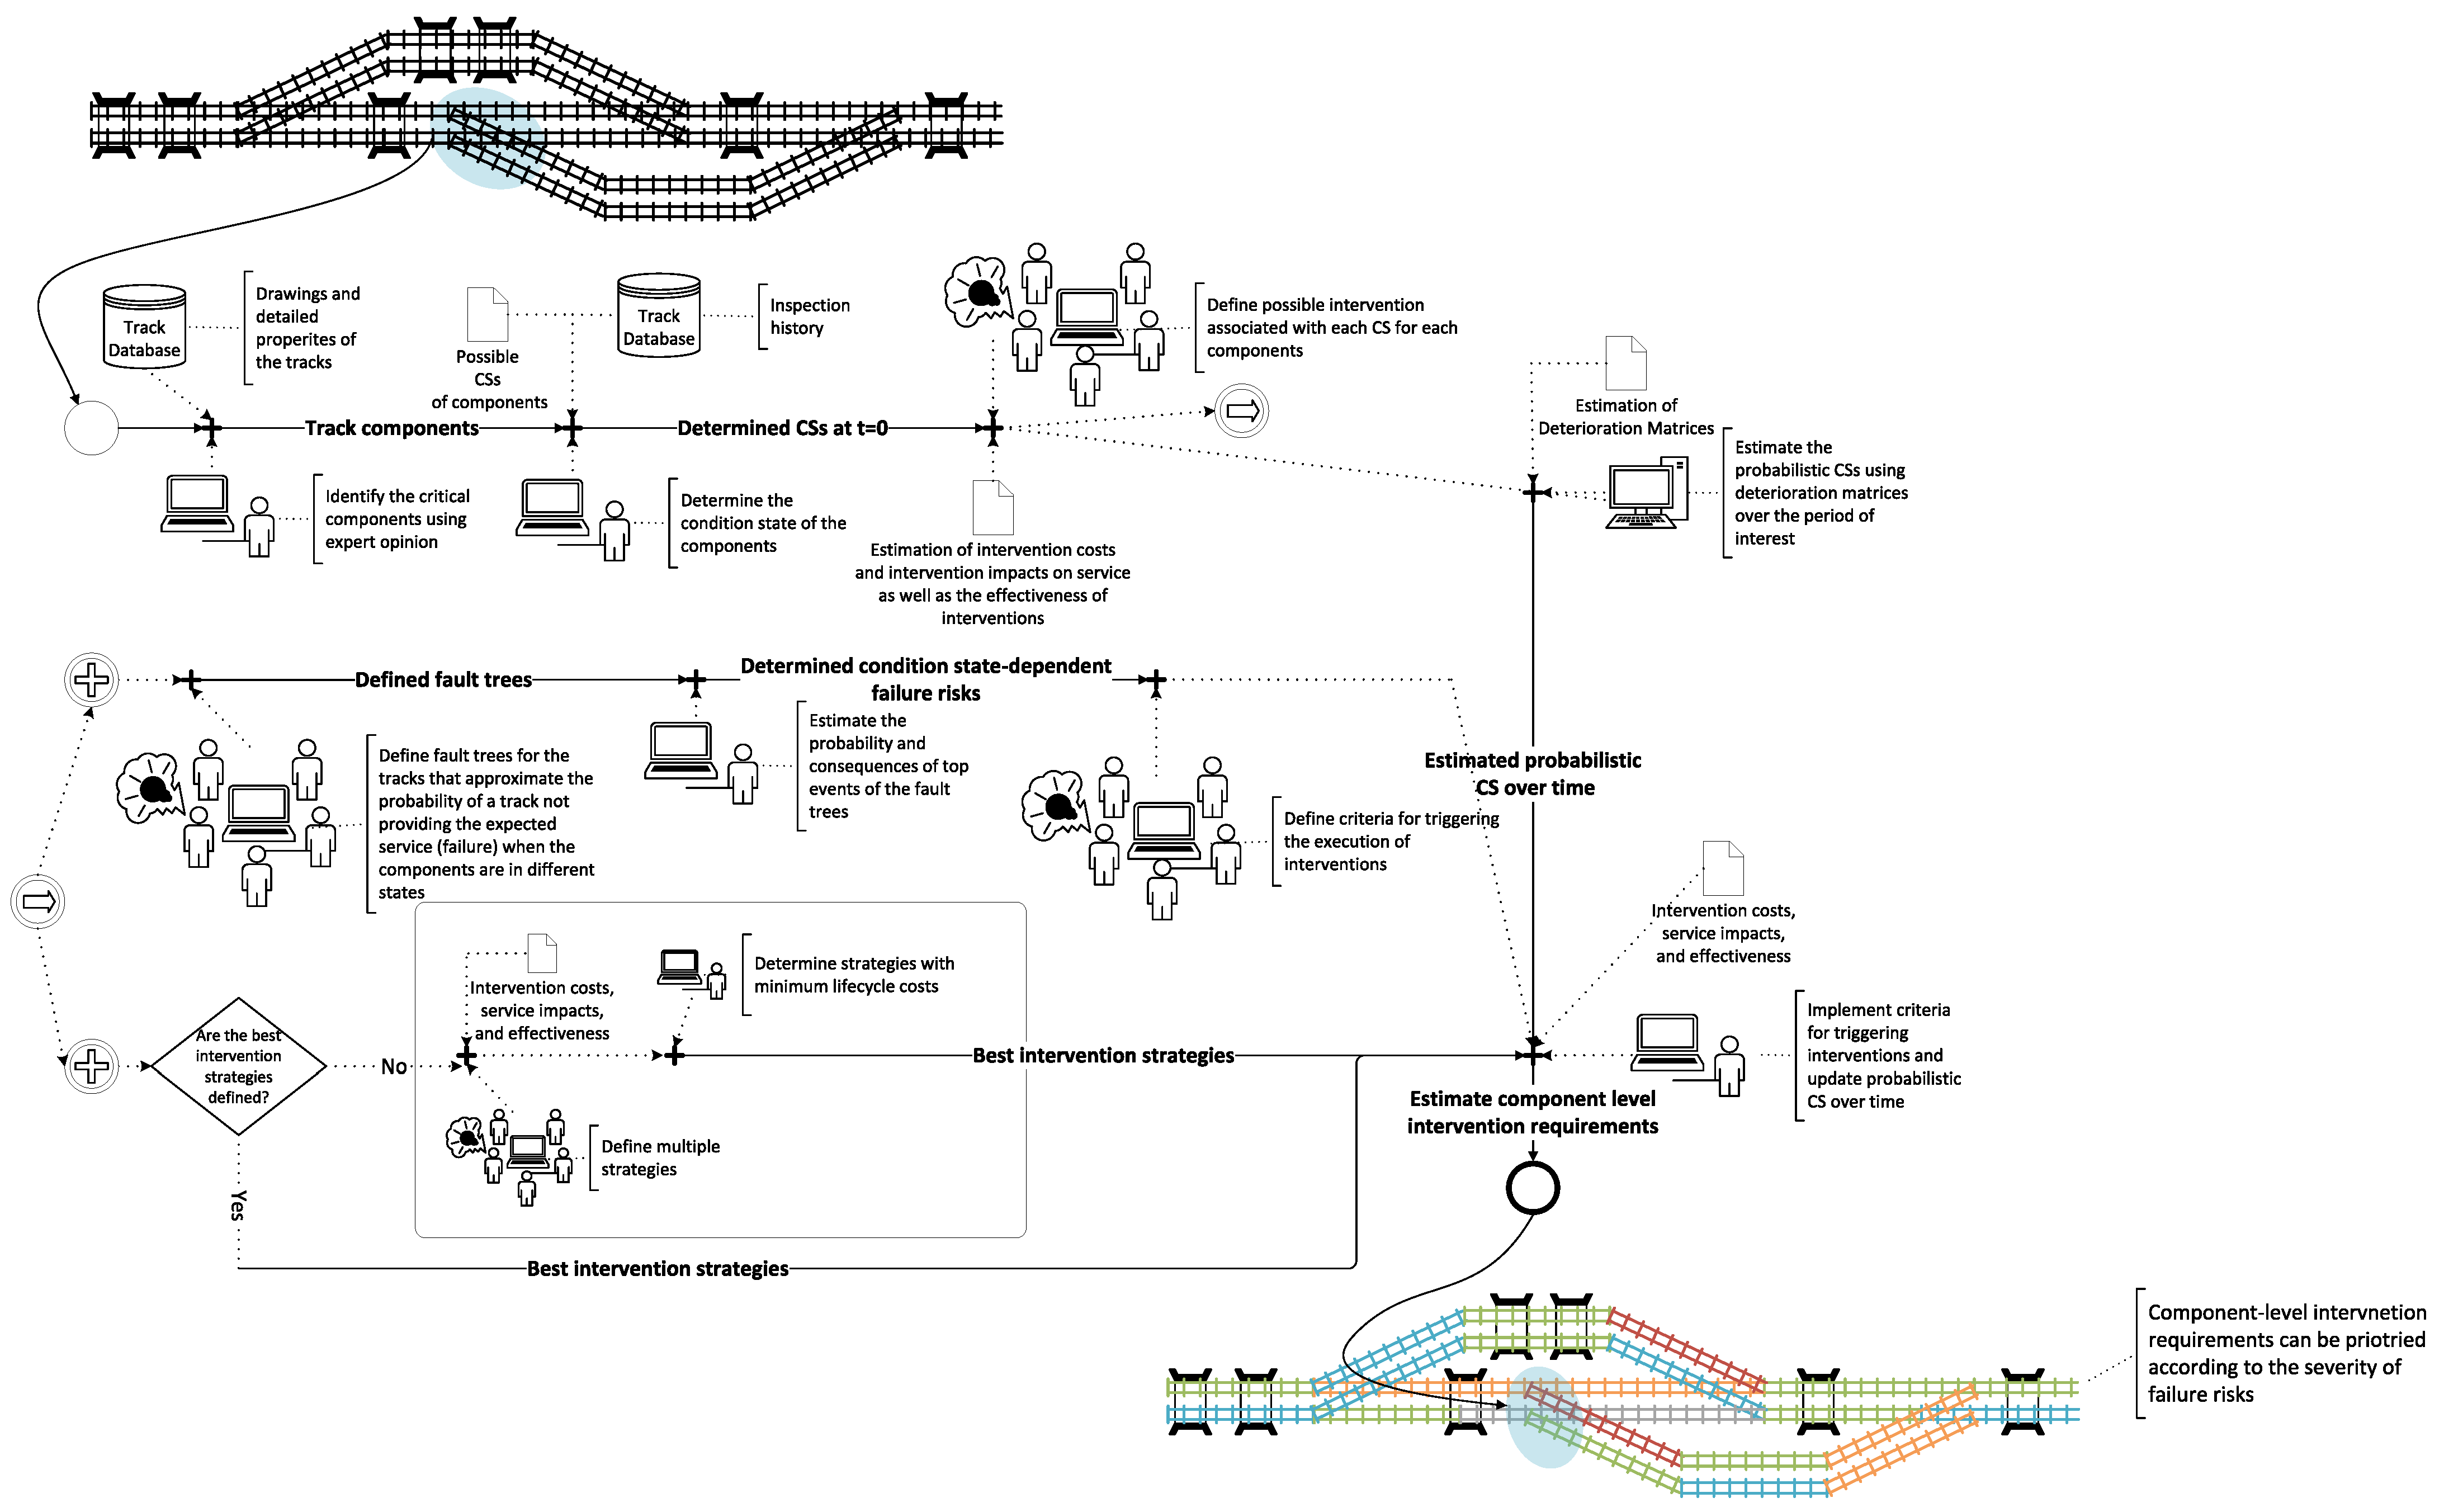
The overview of the proposed methodology is shown in
Figure 1. This methodology encompasses multiple steps that are described as follows:
- 0.
Setup the requirements and constraints: The requirements and constraints for initialising and using the algorithm must be set up first.
- 1.
Select all track sections for which the estimates are to be made: The track sections that are planned to undergo a detailed investigation by engineering firms must be excluded.
- 2.
Estimate the condition of all components for all track sections at : The initial condition of all track components should be consistently estimated.
- 3.
Estimate the condition of all components for all track sections at : Intervention requirements must be estimated 15 years ahead of the execution due to budgeting and permission requirements [
2,
3]. The 15 years planning horizon consists of three blocks of five years, wherein all interventions between
and
have already been planned and almost no major changes can be made [
1]. This means that they have received their allocated budget, obtained the necessary permits, and are in the detailed execution planning stage [
3]. Given this procedure,
is considered the initial point after which estimates can be made.
- 4.
Estimate the failure risk at : The risks associated with the occurrence of the different service loss types need to be estimated.
- 5.
Estimate the probability that each component requires an intervention based on component-level intervention strategies: These estimates are conducted for the periods between and and between and .
- 6.
If no intervention is needed, set and update the condition state of the components: Repeat steps 3 to 6 until the probabilities of components requiring intervention and the failure risks have been estimated for each of the five years within each planning period.
- 7.
Estimate the required interventions: An intervention on a track section in the upcoming planning period is required if either the probability of requiring intervention on any of its components or the failure risk in that planning period exceeds a certain threshold value. The possible and most likely types of interventions, required possession windows, and intervention costs are estimated as a function of the intervention type and service impacts.
- 8.
Checking the termination condition: If , i.e., the end of the planning period, update the deterioration speed if the corresponding components, set and update the condition state of the components, repeat steps 3 to 7 until the end of the planning period.
- 9.
Suggest intervention postponements: Prioritise interventions based on the failure risk value if the execution of all of them is not possible within the planning period. Then, the interventions associated with the lower risk track sections are postponed until the constraints are met.
3.2. Requirements and Constraints
The requirements and constraints for initialising and using the algorithm are as follows:
Definition of track components: The main track components are discerned through the examination of the track drawings. Subdividing the tracks into components helps provide more insight into the content of future intervention requirements. For example, knowing that the switches of a track section will require a rehabilitation intervention in 10 years and that this will require the closing of the associated track for eight hours is more useful than just knowing that the track section will require a rehabilitation intervention and being unsure if the intervention can be executed with or without closing the rail line. In addition, this allows early estimations of the costs and the possibility of executing multiple interventions simultaneously on different components of the track section. A more detailed analysis would subdivide the track sections into their elements. For example, each switch associated with a track section consists of the switching machine, toes, switch rails, fastenings, ballasts, sleepers, heels, check rail, wing rail, crossing nose, stock rail, through rail, and subgrade [
38]. This is, however, not currently proposed for two reasons. First, it would increase the work required by track managers and inspectors to obtain the initial overview of the track sections, which is a major barrier to implementation. Second, it is unlikely that interventions would target single elements, and it is more likely that multiple elements of a single component would need intervention. For instance, it is more plausible for an intervention to be executed on all fastenings in a track section simultaneously, rather than targeting a single fastening element. Therefore, estimating the required interventions on the component level provides a suitable balance between the accuracy and the required time and effort in estimating the information to make estimates for all track sections in a network.
Definition of possible condition states of track components: The condition states are defined to reflect the physical condition of the components. Different classification schemes can be used for this purpose, such as a discrete scale from 1 to 5 that is used in this manuscript to classify the condition of components. In this classification scheme, the best condition is represented by Condition State 1 (CS1) and the worst condition is represented by Condition State 5 (CS5). These definitions have to comply with the organisation’s guidelines and preferences of track managers.
Estimation of the current condition state of components: The current CS of components is estimated using existing data sources, e.g., proprietary asset condition database. If they are not explicitly estimated, the inspection reports can be used to determine the CS of the components by matching the damage indicators mentioned in the inspection reports with the definition of the CSs. In case the existing data are imperfect or if data on the condition of the components are not available, different methods such as Bayesian networks can be used to estimate the current condition of components [
4].
Estimation of the likelihood of changing states over time, i.e., transition probabilities: Estimating transition probabilities is necessary to predict the future state of components. In the absence of the condition monitoring data, these values can be estimated using expert opinions, taking into account the interaction between deteriorating components and the impacts of the residual damages to the component due to the imperfect execution of maintenance interventions. These values can be updated once enough information becomes available, for example, using data-driven approaches [
39,
40,
41,
42].
Definition of possible interventions for each track component in each CS and estimation of their costs and impacts on service: The possible interventions associated with each CS for each component should include the activities to address the damage indicators mentioned in the definition of the CSs, along with the estimates of their costs and impacts on service. For example, a switch should be replaced if signs of plastic deformation are observed in the crossing nose of the switch, i.e., CS5. This intervention roughly costs 0.5 million Monetary Units (0.5Mum) and approximately takes 8 h to complete. These interventions and estimates can be defined using expert opinion or using existing references, e.g., [
43].
Identification of the best component-level intervention strategies: These strategies provide a guideline as to the actions to be taken when a component is in a specific CS. For example, the intervention strategy for the switches could indicate that no intervention needs to be executed on the switches if they are in CS 1–4, and a replacement is needed if they are in CS5.
Definition of fault trees for the track sections: fault trees can assess how each component functions individually and how they work together to ensure the provision of sufficient service on the track section. These are used to approximate the probability of a track section not providing the expected service (failure) when the components are in different CSs. These fault trees can be developed initially with an acceptable level of detail and then be updated with more sophisticated ones based on the requirements of track managers.
Estimation of the occurrence probability of basic events: The probability of occurrence for a basic event should be correlated to the time and the evolution of components’ CS, which is likely to provide a realistic idea of how the failure risks evolve over time. For example, if a switch is in CS1, the failure probability of this switch due to the occurrence of a severe sudden event is very low (
), whereas this probability is very high (
) if the switch is in CS5. These estimations can initially be made using expert opinion and then be updated in the future using more advanced approaches such as Finite Element Analysis conducted by [
44,
45].
Estimation of the consequences of each failure type: the consequences related to the occurrence of each failure type, i.e., the top events, must be estimated to enable the calculation of the failure risks that are dependent on the time and condition of components. For example, the estimation of consequences must encompass the owner and the user costs, which include expenses related to materials and equipment, traffic management, and increased travel time due to the service reduction or loss. These estimations can be made using a combination of expert opinion and construction price indices, e.g., the Swiss construction pricing index [
46].
4. Case Study
The case study includes a network of eight stations spanning a distance of 25 km, located in Switzerland. A schematic overview of the case study is shown in
Figure 2. This is a double-track network with an average daily passenger traffic of 45 trains on each track side. The geometry of tracks is measured using diagnostics trains twice a month for twist, cross-level, gauge, curvature, and alignment error [
47]. In addition, other possible issues, such as sleeper cracks or ballast loss, are measured every year on the tracks with high demand using semi-automatic and manual inspections [
2,
48].
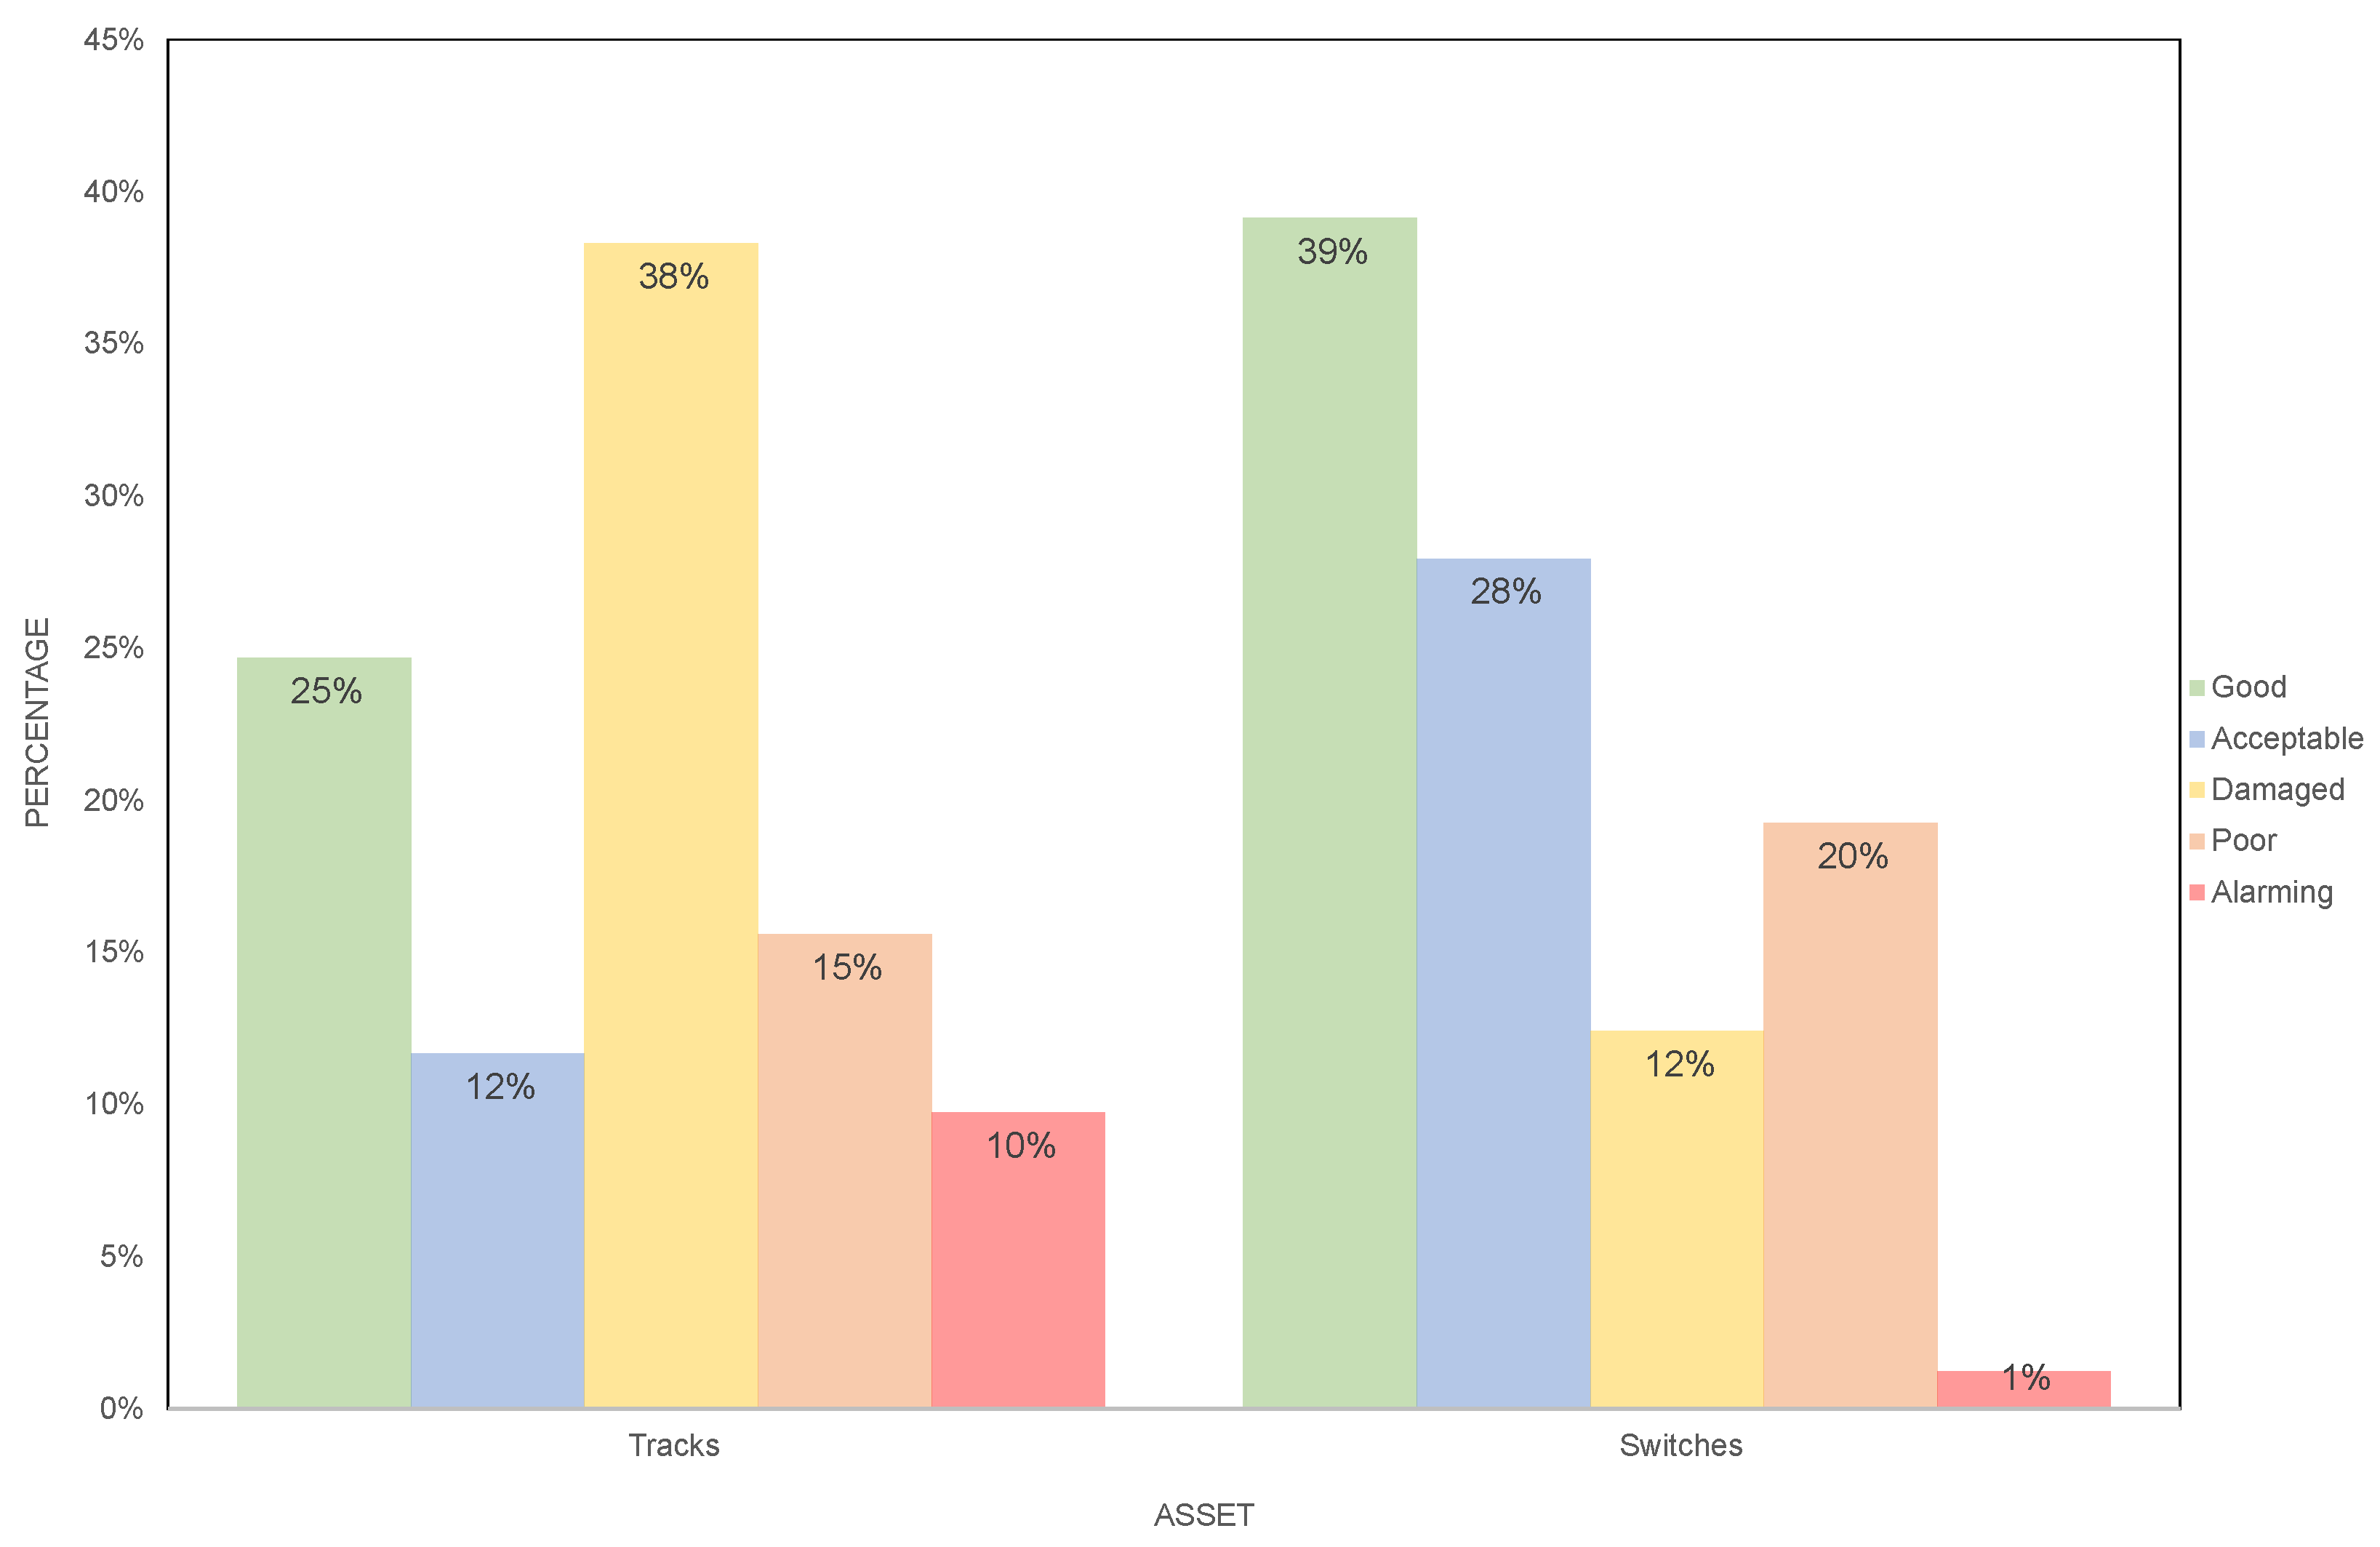
The case study is segmented into 154 tracks and 161 switches, considering the length of 120–125 for each track section. The latest inspection reports regarding the condition of each track section are available in the internal track condition database, which was used as the basis for this case study. A summary of the condition of all track sections is provided in
Figure 3. It is observed that while most switches are in a rather healthy condition, tracks are mostly in a damaged condition.
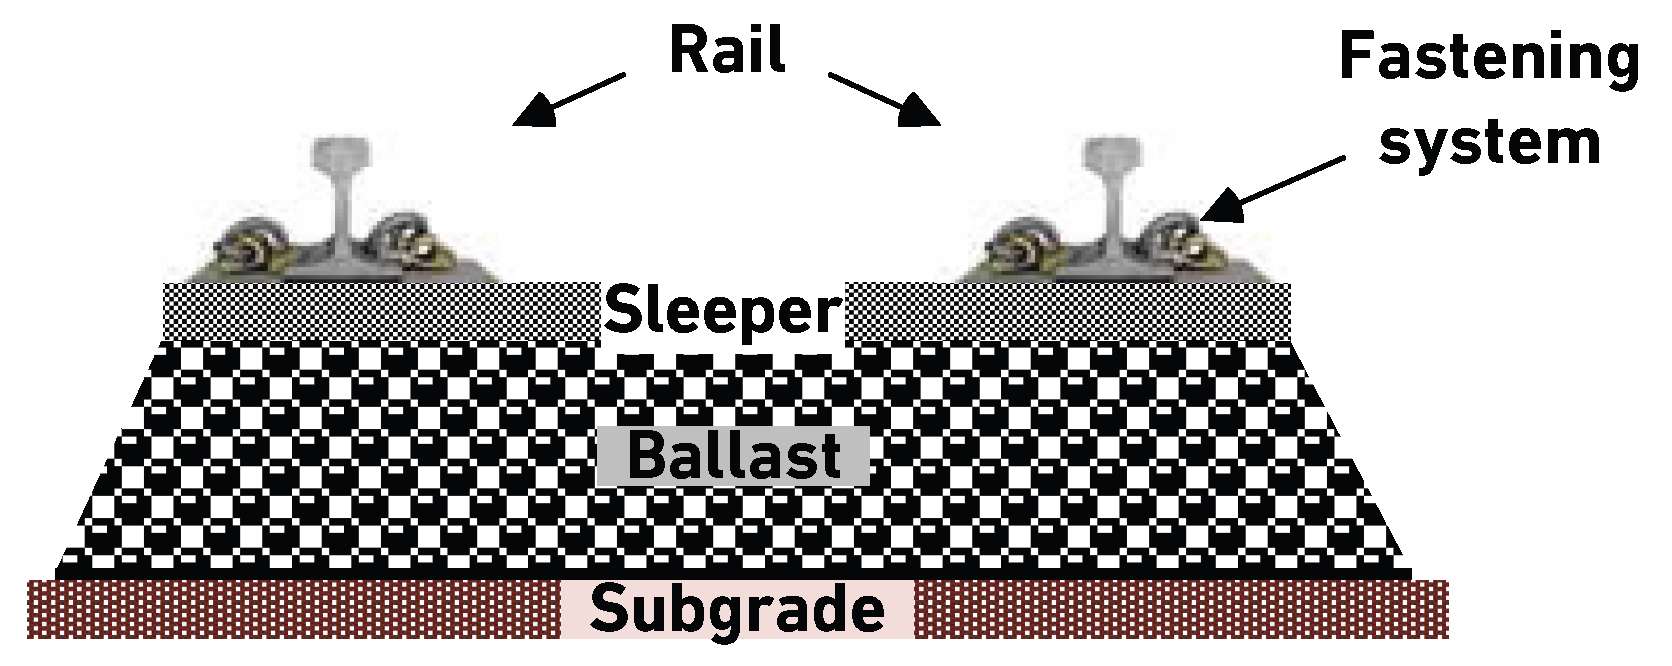
4.1. Components
Railway tracks are split into five main components, i.e., rails, fastenings, sleepers, ballasts/sub-ballasts, and subgrades, as illustrated in
Figure 4. Ballasts and sub-ballasts are considered as one component since they deteriorate in a similar manner [
43]. In addition, switches are considered as one component since their maintenance includes performing interventions on multiple elements [
43,
49]. Therefore, the case study consists of a total of 931 components.
4.2. CS of the Components at and
The proposed methodology aligns with standard railway inspection protocols that operate at three distinct levels: visual inspection, diagnostic train assessment, and detailed investigation using destructive or non-destructive techniques such as ultrasound. The present research specifically addresses the first level, which is designed to support identifying critical issues such as fractures and rail contact fatigue that subsequently trigger more detailed inspections and flag components for potential intervention consideration in future planning periods.
The condition of the components is represented through five discrete states, i.e.,
. In this scale, CS1 represents the best condition, where there is no or minor damage, and CS5 represents the worst condition, where there exists severe damage that is unsafe. The states in between show increasing levels of damage.
Table 3 shows an example definition for the CSs of the switches. Based on this table, switches are in CS1 if they have no issues and in CS5 if the settlement is too high or the cross nose is deformed. Similar to switches, such CSs are defined for other components. The CSs are defined for all other track components similarly.
Such simplified definitions of condition states, while not capturing all causal deterioration mechanisms and detailed indicators, provide sufficient discriminatory power for strategic maintenance planning while maintaining computational feasibility. These criteria, nonetheless, require customisation for each type of component based on inspection methodologies, regulatory frameworks, and operational contexts. The implementation of this methodology on a portfolio of railway track assets necessarily involves calibration in collaboration with maintenance execution specialists and compliance with existing regulations. Future research will explore methods to incorporate more complex deterioration processes without compromising the practical utility of the model for infrastructure managers.
The CS of all track components at
is estimated based on information provided in the latest inspection reports, which is summarised in
Figure 5a. The CSs of each component were determined by matching the definition of CSs with the damage indicators mentioned in the inspection reports. The CS of components in each track section is then assumed to be the same as the overall CS for those sections where component-level information was consistently unavailable. This assumption allows for a consistent estimation of initial CSs across all components, ensuring a convenient approach in the absence of component-level information.
Probabilistic discrete state modelling is used to estimate how CSs evolve over time, which is similar to the modelling used in existing railway asset management systems [
28,
30].
Table 4 represents an example of non-homogeneous transition probabilities for switches over a one-year period, which corresponds to the mean interval between two inspections. Here, it is assumed that deterioration rates increase as a function of the times maintenance interventions are executed on the component. This is because of imperfection in executing maintenance interventions, which do not always reinstate the physical and chemical characteristics of the components [
15,
50]. The impact of this on the deterioration rate can be determined using expert opinion. In case enough data are available, other methods such as stochastic approaches can be used to determine this impact [
51,
52]. It is assumed there is a
increase in the deterioration rate following each successive maintenance intervention. This assumption is inspired by the works of Peng et al. and Li and Jia [
53,
54]. The maintenance count resets for each component upon the replacement of the component. This rationale is consistently applied across all components.
Moreover, the deterioration rates for each component are further refined to account for the interaction between deteriorating components. Bayesian filters are used for this purpose. These filters can be integrated into the existing infrastructure management system, without the need to make significant changes in the logic and the modelling structure [
55,
56]. This is likely to reduce the effort and the costs needed to implement the proposed methodology in a railway company. These filters are defined depending on the location of the components on the tracks. For example, while the condition of the rails is influenced by the condition of the fastenings, sleepers, ballasts, and subgrade, the condition of the subgrade and switches is independent of the condition of other components [
21,
43]. For example, Equation (
1) represents the Bayesian filter associated with the interaction between rails and other track components, which is indicated with
. In this equation,
(
I is an identity matrix) when other influencing components are in CS1 or CS2. The influence of the condition of other components, when they are in CS3, CS4, and CS5, on the CS of the rails is represented, respectively, by
,
, and
. The values associated with these filters can be estimated using expert opinion or using more advanced techniques, such as regression-based nonlinear optimisation or neural networks [
57,
58] in case enough information is available. The definition of these filters for other track components are provided in
Appendix A.
The calibration and validation of these parameters can be performed using empirical methods. For instance, regression methods or Bayesian updating can effectively compare predicted and observed deterioration rates [
41,
57]. Furthermore, sensitivity analysis can verify the reliability of the estimated parameters. For illustrative purposes in this study, it is assumed that
,
, and
, which are inspired by the works of Chen et al., Niroshan et al., and Kobayashi et al. [
11,
57,
58].
An overview of the most likely CS of all components at
is shown in
Figure 5b. These are estimated using Equation (
2) that multiplies the CS of components at
with the probability of them transitioning to the possible future states, shown with
P, and with the Bayesian filter associated with each component, represented by
, within 5 years.
4.3. Component-Level Interventions and Intervention Strategies
Several interventions are required to maintain the expected serviceability of components throughout their life cycle. These interventions vary with respect to the component characteristics and damage severity. These interventions can be categorised using three generic terms, i.e., Rehabilitation, Renewal, and Replacement, to represent different levels of execution complexity [
15,
43].
The intervention costs are calculated as the total of owner costs,
, and user costs,
,
.
is calculated using a construction pricing index [
46].
is calculated by monetising the average daily added travel time, i.e., 6’524 mu/day, using Equation (
3). In this formula, the average number of passengers per day is represented by
, the average daily wage by
, and average daily added travel time per passenger by
.
Table 5 shows the example switch intervention costs, which increase with the complexity and labour demand of activities [
12,
21,
43]. These costs are calculated similarly for other track components.
Component-level intervention strategies, along with their effectiveness, can be estimated using a combination of the internal documentation and expert opinion. In case these strategies do not exist in an organisation, they can be determined using different techniques such as Markov chains [
1,
15,
40]. For example,
Table 6 shows an example of multiple variants for switch intervention effectiveness, where the switch intervention strategy used is highlighted in violet, and the effectiveness is given in terms of the probability of being in CS1 or CS2 after the execution of the intervention. This is derived using internal documents of railway assets. The switch intervention strategy indicates that no intervention is needed in CS1 and CS2, while a replacement is needed in CS5. For CS3 and CS4, rehabilitation and renewal are applied, respectively. The effectiveness indicates the probability of a component being in CS1 or CS2 after executing an intervention, which can be estimated with different methods, for example, using Data Envelopment Analysis [
59,
60]. In this paper, these are inspired by the values mentioned in [
59,
60].
4.4. Evolution of Failure Risks
There are different methods to assess the risks associated with the failure of components to provide a sufficient level of service, such as Fault Tree Analysis, or Failure Modes and Effects Analysis [
38,
61]. However, compared to other risk assessment methods, fault trees not only better help infrastructure managers visually map the logical relationships between basic component failures and the resulting system-level failure, i.e., top events, but also offer a great level of adaptability so that they can be continually updated as more data become available over time [
34,
62]. This iterative nature makes them well-suited for infrastructure intervention planning.
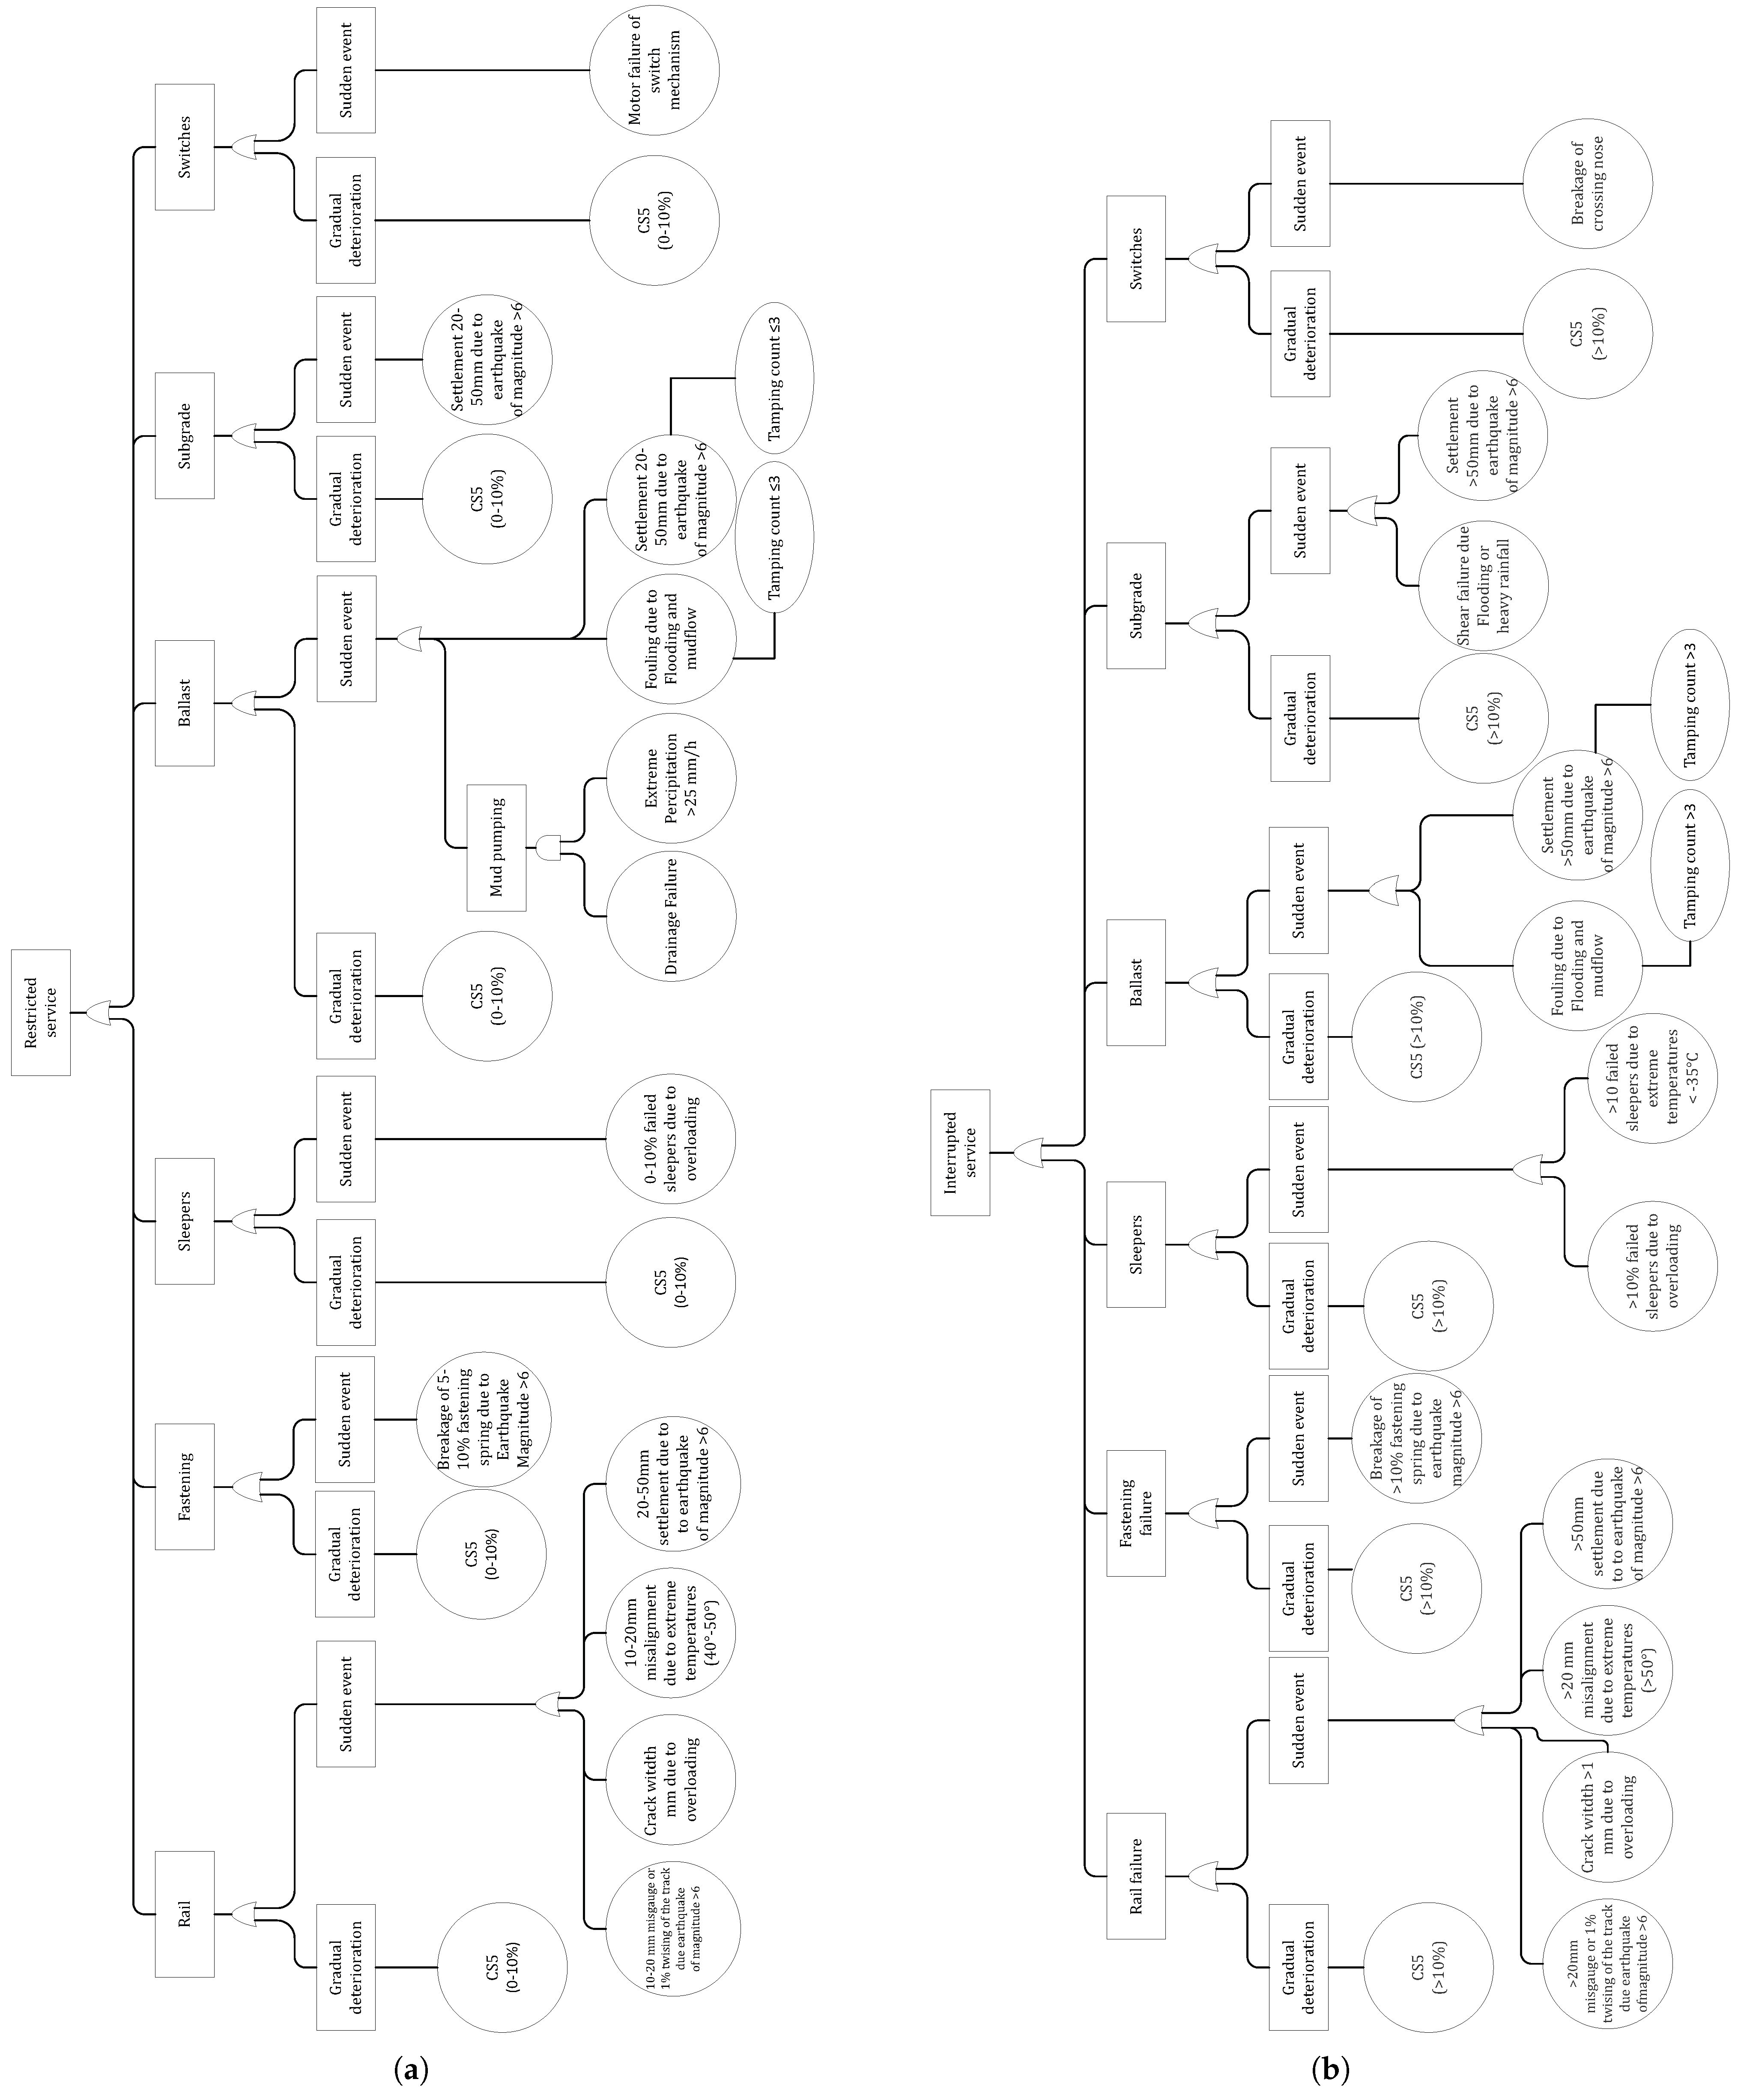
The evolution of failure risks is estimated using fault trees, connected to the components’ failure severity. Top events are “restricted service” (due to rehabilitation at night) and “interrupted service” (due to replacement with total closure) defined for each track section, as shown in
Figure 6a and
Figure 6b, respectively. The basic events are the gradual or sudden deterioration of the individual components due to external loads, such as traffic or natural hazards.
The failure probabilities of components are estimated based on the occurrence probability of basic events. These events depend on the occurrence of external loads and the component resistance. The occurrence of external loads is independent of the CSs of components and based on expert opinion, while the resistance of components varies with the components’ CS. This means the failure probabilities of components due to the occurrence of basic events vary for different CSs at different times, with a lower value for CS1 and a higher value for CS5.
Equation (
4) indicates how failure probabilities are estimated, where
represents the probability that component
i fails at year
t due to the occurrence of the sudden event
j,
is the occurrence probability of the sudden events
j until year
t,
is the resistance factor of component
i, and
is the CS of the component
i at year
t, which is represented as a
vector.
is assumed to follow a Poisson process as suggested by Usman et al. [
34]. This way of calculating the failure probabilities enables taking into account the changes in the occurrence probability of top events in each year within each planning period.
For example
of a switch at year t due to the occurrence of the sudden event
j with a return period of T years, i.e.,
at year
t and the resistance vector
can be calculated as follows:
The consequences of each top event depend on how much work is needed to restore the level of service. These are estimated in terms of owner and user costs of executing immediate interventions using information from
Section 4.3. The failure risks associated with each track section are then estimated depending on the components’ CS. These estimates enable obtaining a meaningful overview of interventions and avoiding intervening on different components every year. These also help plan interventions using a predefined failure risk threshold in case there are no component-level intervention strategies defined. This threshold is defined as the value of failure risks when all components are in CS4, since having any assets in CS5 is not desirable for the asset managers [
1].
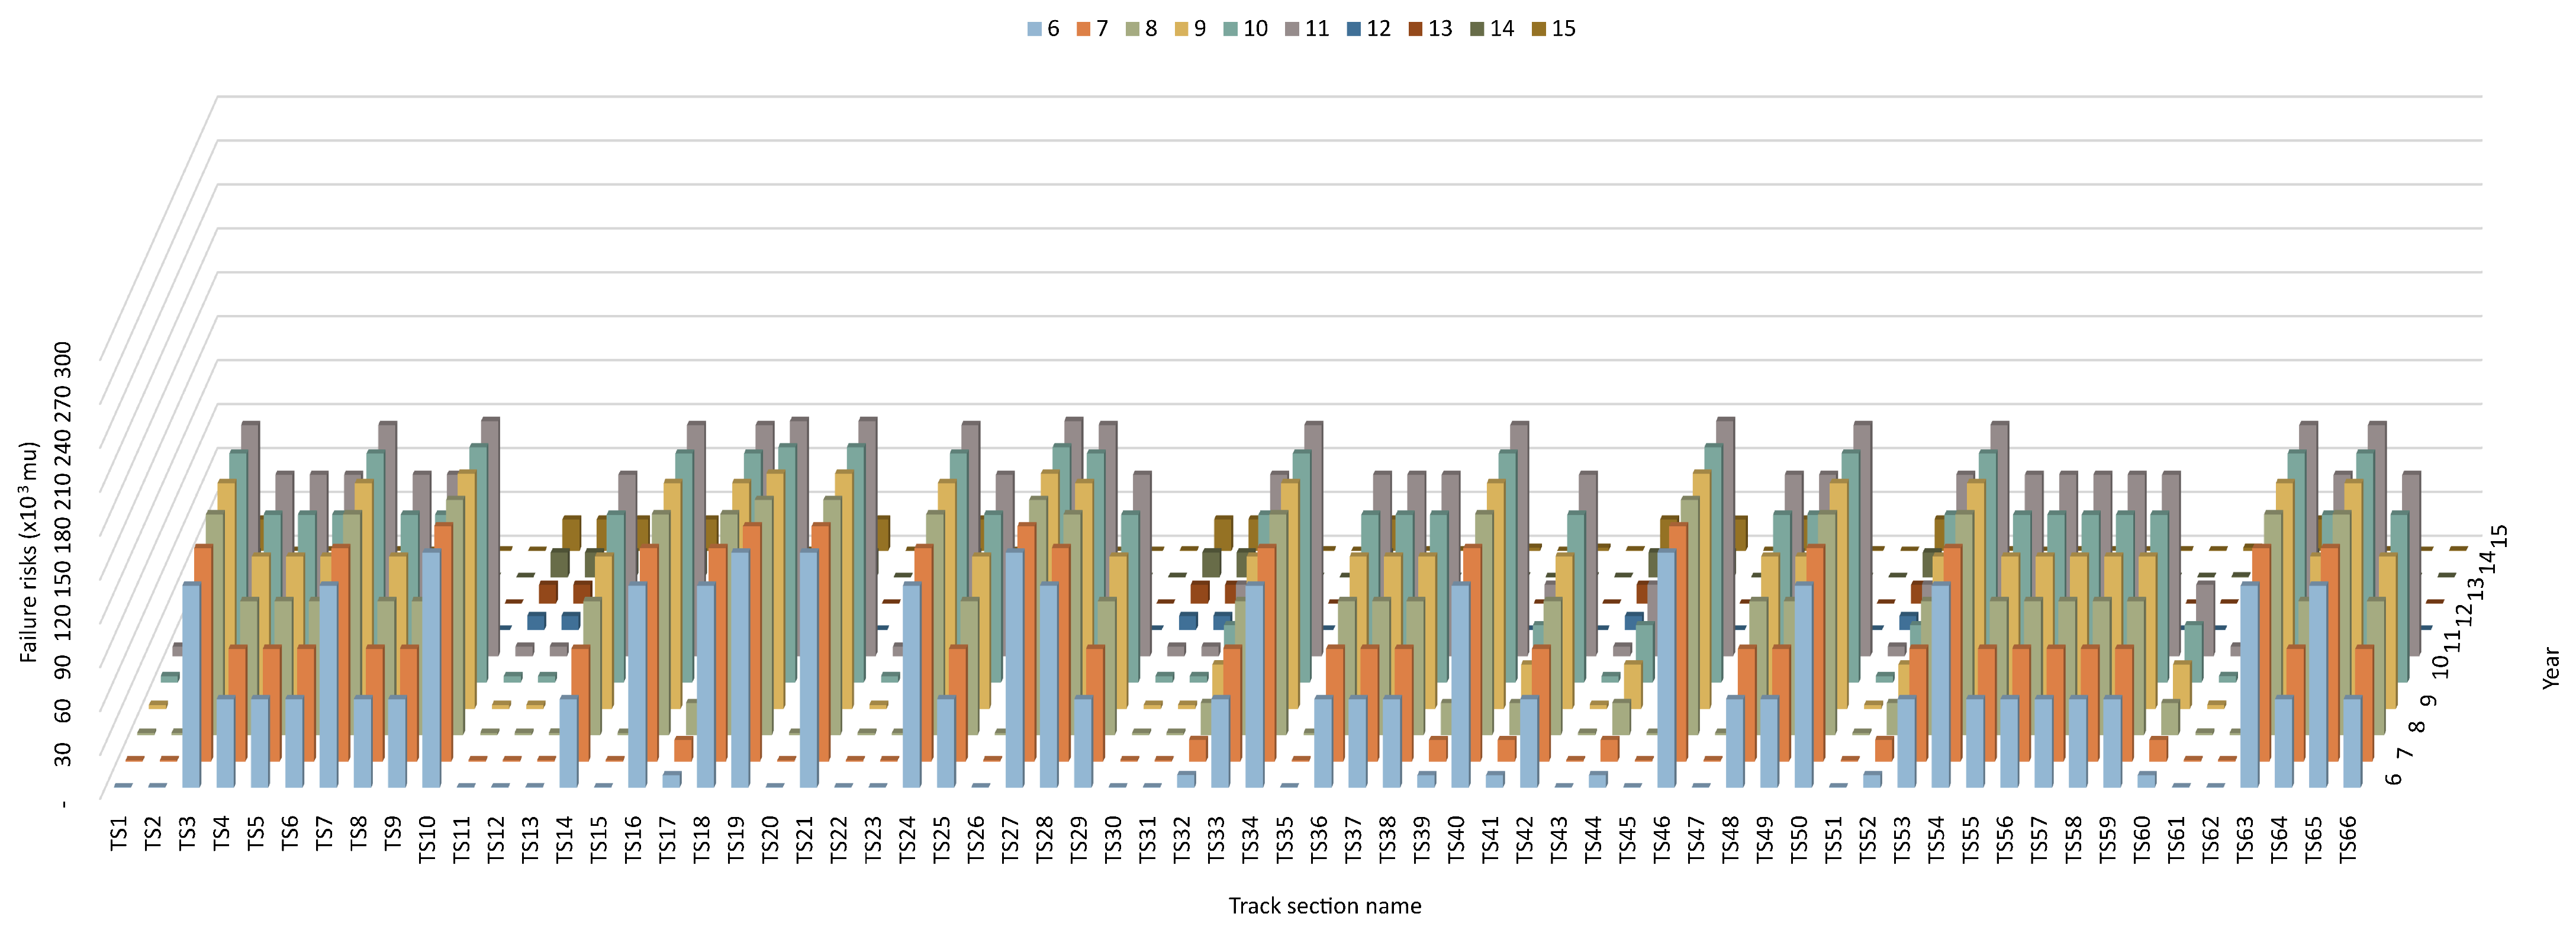
An overview of the evolution of failure risks for a selection of track sections is shown in
Figure 7. In this figure, TS3 notably exhibits one of the highest failure risks, while TS11 exhibits one of the lowest. The primary reason for this difference is the initial CS of the components on these two track sections, which are in CS4 and CS1, respectively.
4.5. Overview of Component-Level Intervention Requirements
The interventions are estimated for the next planning periods, i.e., t = 6 to t = 10, and t = 11 to t = 15 considering deterioration rates and intervention strategies discussed in
Section 4. Interventions are scheduled to be executed on a component when the failure risks associated with each track section reach the pre-defined failure risk threshold in each planning period. After knowing which interventions are needed, detailed information regarding the most likely interventions, such as the expected costs and possession windows, is estimated. These estimates are not conducted for the period between
and
since any interventions between t = 0 and t = 5 have already entered a detailed planning phase based on the intervention planning process.
Table 7, for example, shows the chances of intervention requirements between t = 6 and t = 10, along with the estimates of possession windows requirements and the expected costs for only two switches. Based on this table, there is a 34% likelihood that S1 require an intervention. It is most likely that the type of this intervention will be rehabilitation, with a 27% likelihood. If this is executed alone, the rehabilitation would be expected to take six hours, of which one would require no disruption to service, one hour would require restrictions to be implemented and four hours would require the associated track section to be closed. This would be expected to cost 263,000 mu.
4.6. Prioritisation of Interventions as a Function of the Failure Risk Estimates
Track managers must decide which interventions to postpone in a situation when detailed investigations on all track sections requiring interventions cannot be initiated, or if all interventions cannot be executed due to organisational restrictions. A benchmark is needed to enable managers to do so. Such a benchmark should capture different characteristics of the components as well as the concerns of track managers. For example, track managers consider CS4 as the last point before the initiation of emergency intervention [
1,
2]. This means that the ratio of failure risks associated with the track sections when their components are in their current or predicted CSs, and failure risks associated with the track sections when their components are in CS4 can be used to prioritize interventions (the calculation of the failure risks for each track section when all components are in CS4 and are conducted by setting
in Equation (
4) and then calculating the failure risks with respect to the associated logic of the described fault trees). This failure risk ratio reflects an indication of the failure risk level for each track section, which exists even without any damage. Track managers need to keep this level within a reasonable margin for each track section. At the same time, track managers do not aim to achieve the same failure risk level across all track sections. An example is shown in
Figure 8. This would mean that if a detailed investigation of one of the track sections needed to be postponed, it would be the one for TS35, as the failure risks associated with this track section are the farthest away in terms of percentage from the failure risks associated with the track section if all of its components were in CS4.
5. Enabling the Use
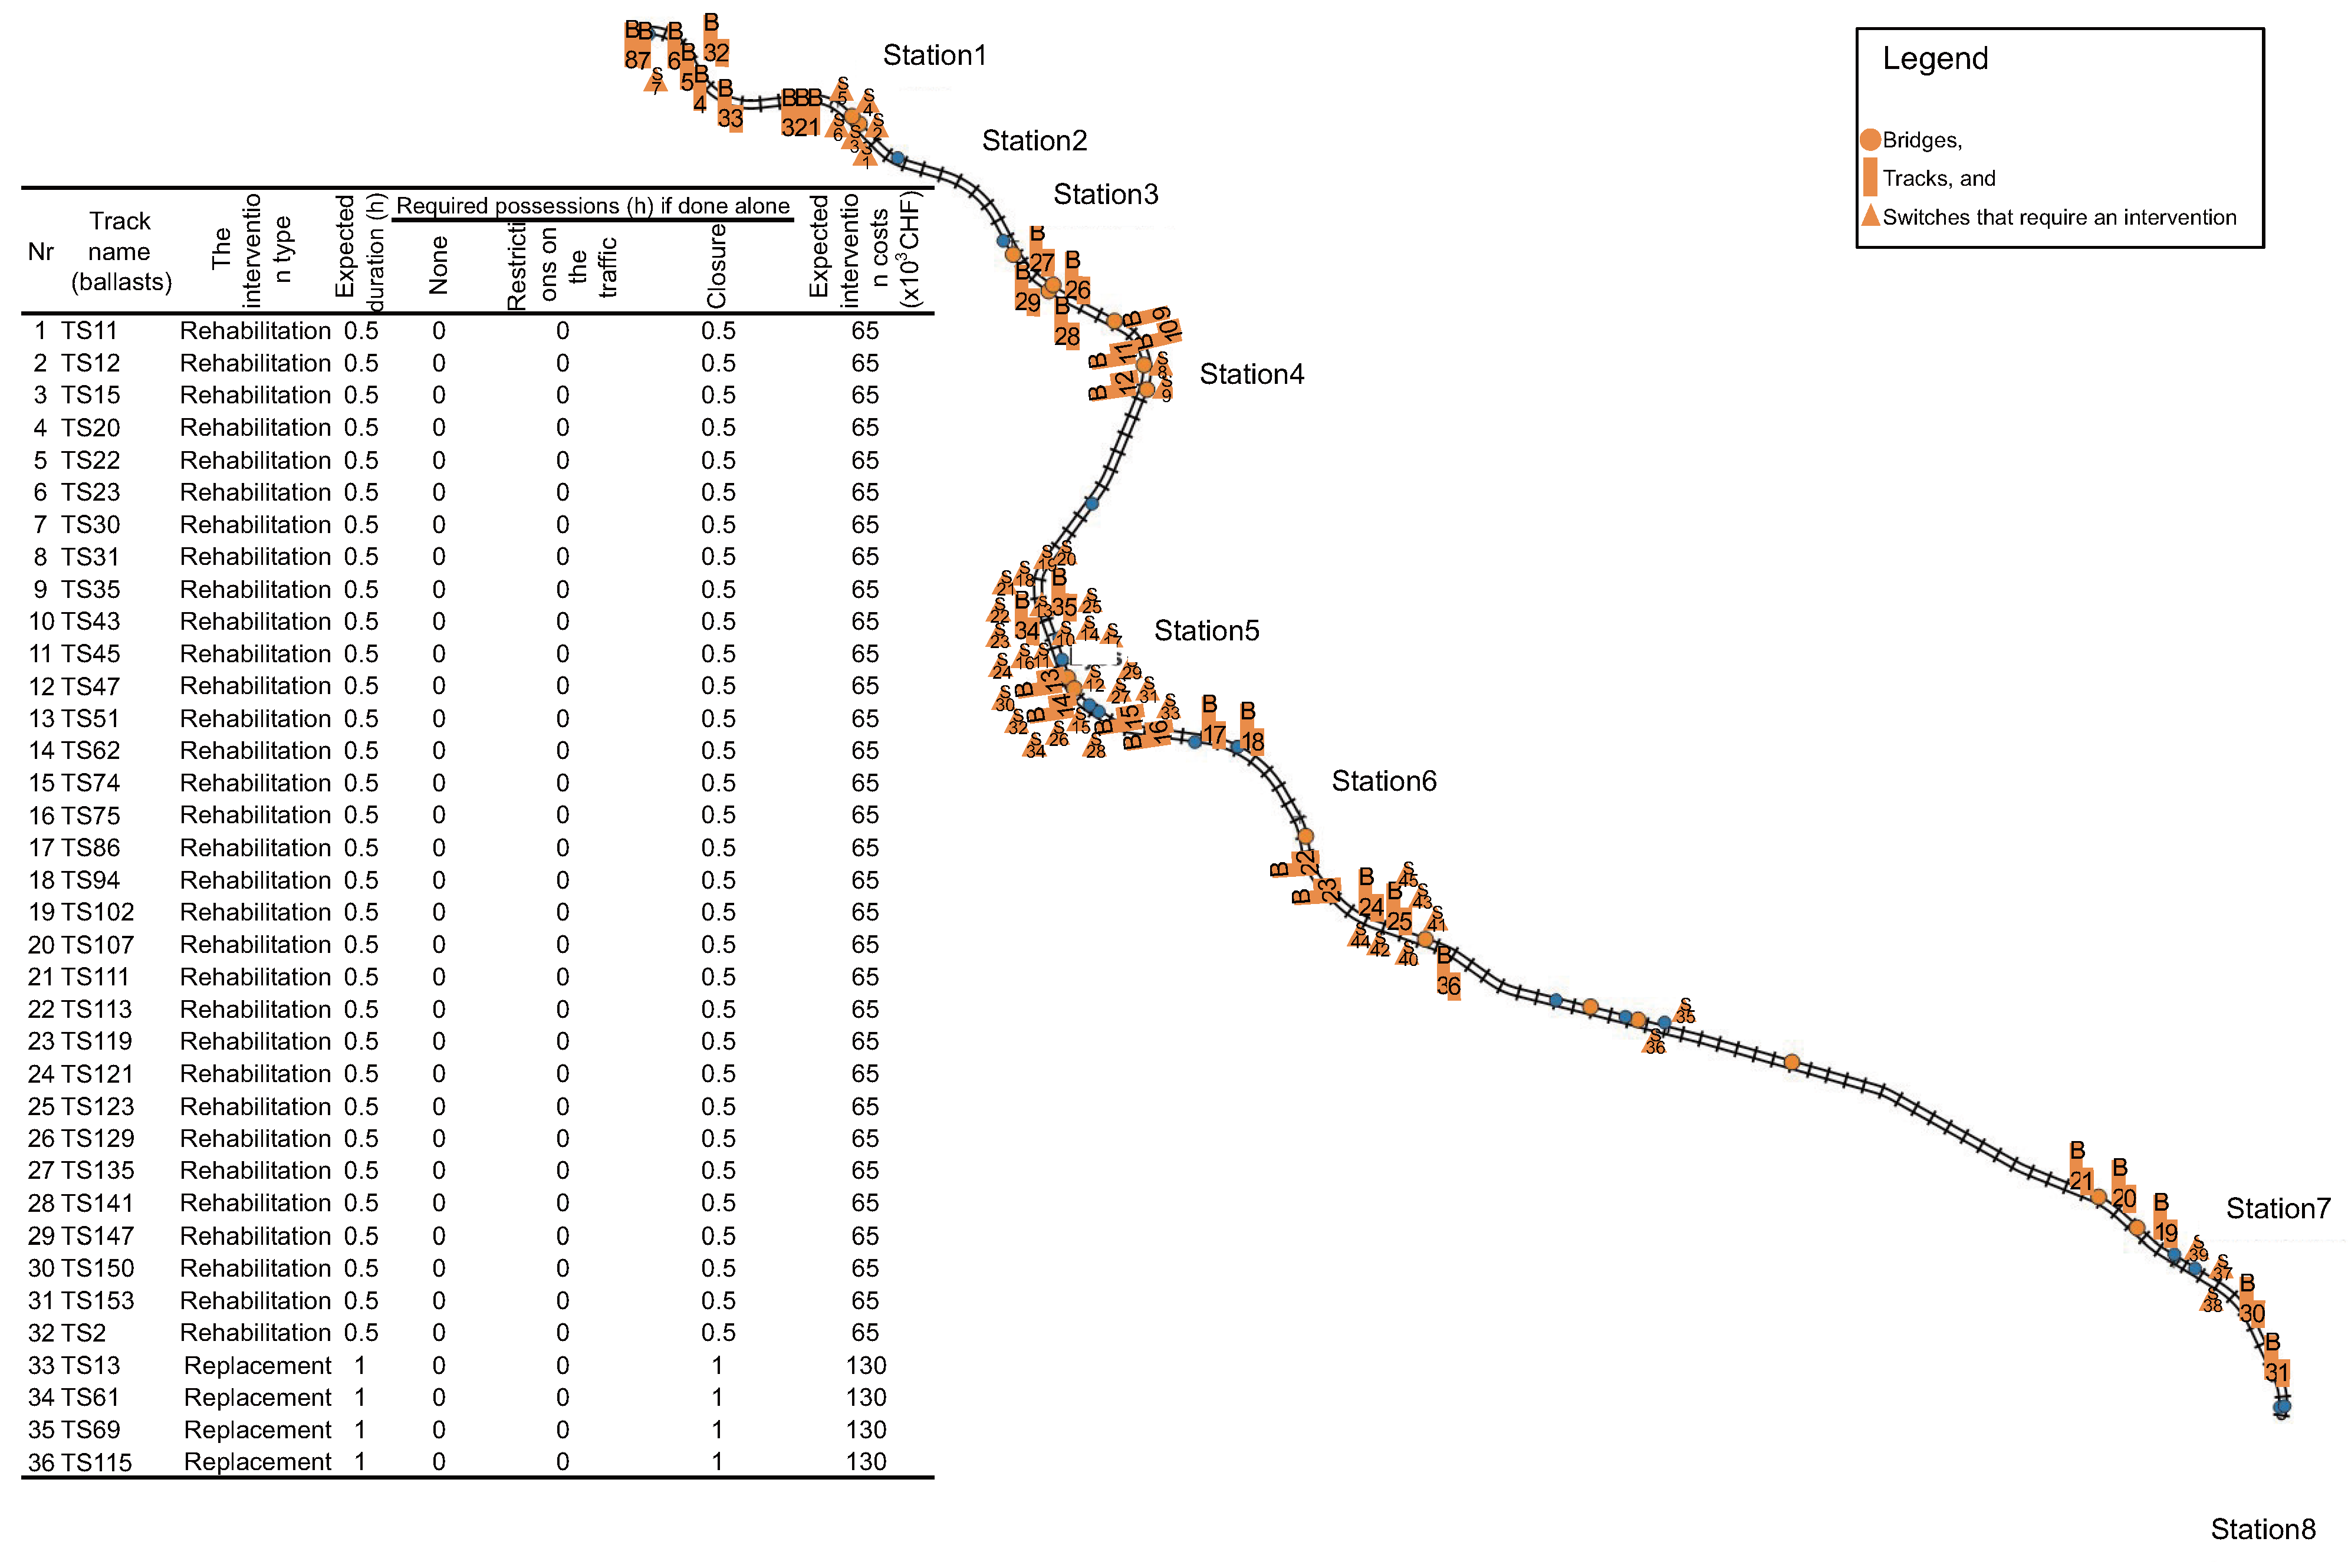
Enabling the use of the proposed methodology in the intervention planning process requires some effort from infrastructure managers to initialise the methodology. A schematic overview of the setup and implementation process is also shown in
Figure 9. This methodology is designed to be implemented with minimum requirements, e.g., using a computer equipped with spreadsheet software. However, it is recommended to use a programming language such as R [
63] to analyse the entire railway network of a country. The estimation of the required information can be achieved using various sources with different levels of detail, from expert opinion to detailed track management databases. After the proper implementation of the proposed methodology, the output can be used to develop intervention programmes that consider all asset-level and network-level constraints, such as the interdependencies between the interventions. Moreover, the use of BIM (Building Information Modelling) or GIS (Geographic Information System) allows for automatic storage and visualisation of the methodology’s output as new information becomes available, which is crucial in a digitalised intervention planning process. For example, the output can be visualised for a selection of track sections that will require interventions on the case study railway network using a GIS platform to provide an overview of the most likely intervention requirement, along with the early estimates of the related costs and possession windows over the future planning periods, as shown in
Figure 10 for the periods between
and
.
6. Discussion
The proposed methodology provides railway asset managers with an efficient overview of the component-level interventions, related costs, possession windows, and associated failure risks over future planning periods. The methodology considers components’ condition, deterioration rates, the interaction between them, component-level intervention strategies, and a tolerable failure risk threshold. Additionally, the methodology enables the prioritisation of component-level interventions based on the level of failure risks associated with each track section to decide which one should be selected to initiate the preliminary study phase.
One limitation of the methodology is that even though it is designed to be implemented with minimum effort, the initial estimates of all input information are still required to be made by infrastructure managers, e.g., initial components’ condition, deterioration rates and the impact of their interaction on deterioration rates, possible interventions and their impacts on service and the associated costs as described in the manuscript. This limitation would be the same with all such methodologies. In some parts, such as estimating the components’ condition, generating the input information can be made easier using stochastic and data-driven methods.
Additionally, the development of fault trees is deemed demanding, but adequate consideration of failure risk is necessary to support decision-making. From a planner’s perspective, it is useful to have a comprehensive overview of failure risk, i.e., the likelihood and consequences of having to close parts of the railway network for emergency maintenance interventions. From an engineer’s perspective, it is difficult to estimate the probabilities of occurrence of base events and the consequences exactly, which is made harder when there are criticisms of the exactness. This, in many cases, is likely to mean that the estimates are not made, which unfortunately means risk is not explicitly considered. From a planner’s perspective, it is preferable to have general, albeit approximate, estimates rather than none at all.
A further challenge is to accurately estimate the potential effects on service, required possession windows and, if required, the cost estimates. This challenge arises primarily for two reasons. Firstly, the methodology is to be used at an early planning stage, where there is limited knowledge regarding the specific activities encompassed in the interventions. Even if approximate, this estimation is essential for acquiring an early yet comprehensive understanding of all track interventions in a railway network. Secondly, even if estimates at the component level were known for individual interventions, the impacts on service and the intervention costs would fluctuate as individual component-level interventions become clustered into cohesive intervention programs. This is because clusterisation results in some interventions being executed earlier or later than they would be executed if the assets were considered alone, and the combination of some interventions in time with others will likely result in a net reduction in both costs and service disruptions.
7. Conclusions
This manuscript proposes a methodology to estimate interventions, possession times, costs, and failure risks for track sections. It is exemplified through application on a 25 km railway network in Switzerland. The novelty of the method includes the focus on components and their interaction over time, and the use of fault trees to estimate condition-dependent failure risks. The methodology accounts for the factors that are of concern to track managers. It uses a five-state probabilistic model to estimate the current and future CSs and intervention requirements. It uses fault trees to estimate the failure probabilities and consequences for the two top events related to different service loss scenarios. The consequences include owner and user costs. To comprehensively assess the advantages of this methodology, future studies should conduct testing on both real-world and simulated networks using different methods such as business processes simulation or structural equations modelling.
The proposed methodology provides a consistent and complete early estimation of component-level interventions, their costs, and associated possession windows, as well as failure risks in the upcoming planning periods. The methodology considers the condition of the components, their non-homogeneous deterioration rates as a function of the maintenance count, the interaction between the deteriorating components, and the component-level intervention strategies. Interventions are triggered through the coupling of failure risks with the CS evolution. If deemed necessary, the decisions on postponing interventions or their prioritisation can be made using the ratio between predicted failure risks and the failure risk threshold.
The methodology presented herein represents an advancement over the current state-of-the-art practices. It comprehensively encompasses crucial aspects essential in the track managers’ decision-making process. This methodology effectively estimates the failure risks associated with the condition of asset components. Notably, the dynamic adaptation of fault tree calculations for the estimation of condition-dependent failure risks, coupled with a comprehensive overview of intervention requirements, distinguishes this methodology. To the authors’ knowledge, such an application is unprecedented in existing railway asset management systems [
43,
64].
The systematic overview provided by this methodology in terms of the interventions required, the associated possession windows and the cost estimates streamlines the communication among various stakeholders in the intervention planning process, such as asset managers, line planners, and network developers. Having such a comprehensive overview is crucial for the development of stable train schedules, ensuring that multiple interventions are synergistically integrated within limited time frames.
The design of the proposed methodology was aimed at ensuring the ease of implementation. It allows for the estimation of required input information from several sources, ranging from expert judgment to existing databases, with varying levels of granularity. The accuracy of this input data can be refined further upon the availability of more detailed information. Additionally, other parts of the methodology, such as the definition of CSs, can be improved to incorporate indications generated from advanced measuring tools. For example, these can cover cross-section loss of the rail head in percentage if such measurement is consistently available. Moreover, more detailed fault trees can be developed according to the needs of the infrastructure managers. The methodology accounts for the further refinement of component-level intervention strategies. For example, the estimates of the initial CSs can be improved using the DBN (Dynamic Bayesian Network) to impute the missing values in the database [
4].
Implementing the methodology presented in this manuscript within a suitable platform will enable track managers to efficiently take advantage of digitalisation. This will facilitate the generation of a detailed overview of the intervention requirements, their initial costs and impacts on the service, as well as the level of failure risks in future planning periods for all track sections in a systematic manner. The adoption and application of the proposed methodology are expected to significantly improve the efficiency and effectiveness of the intervention planning process. Future studies should focus on improving different aspects of the presented methodology, with a particular emphasis on applying the proposed methodology to generate the component-level intervention programmes for all assets within a railway network. For example, the consistent estimation of initial CSs for all infrastructure components using advanced models, such as physics-informed CS estimation [
65], should be integrated into the current methodology.
Additionally, future studies should enhance the visualisation capabilities of the presented methodology. The outcomes could be displayed on a GIS-based Building Information Modelling (BIM) platform for the entire railway network, including detailed BIM for each track section, to improve the interpretation of intervention requirements, preliminary costs, and required possession windows for upcoming planning periods.
Finally, future research should quantitatively evaluate the efficiency improvements achieved through this methodology. This should involve a systematic comparison of the methodology’s outputs with validated real-world benchmarks. Furthermore, key metrics such as planning time, number of iterations, the extent of decision-maker engagement, and maintenance budget approval success rates should be measured before and after implementation to provide empirical evidence of the methodology’s effectiveness.
Author Contributions
Conceptualisation, H.M., B.T.A., S.M. and C.F.; methodology, H.M., B.T.A., S.M. and C.F.; writing—original draft preparation, H.M. and B.T.A.; writing—review and editing, H.M., B.T.A., S.M. and C.F.; visualisation, H.M.; supervision, B.T.A., S.M. and C.F. All authors have read and agreed to the published version of the manuscript.
Funding
This research received no external funding.
Data Availability Statement
The data that support the findings of this study contain confidential information and are not publicly available. However, these data may be made available upon reasonable request and subject to appropriate confidentiality agreements.
Acknowledgments
This work is part of STABILITY research project that is supported by the ETH Mobility Initiative and the ETH Zurich Foundation. A large language model has been used to improve the grammar of the text in proofreading. The data used are not publicly available due to confidentiality. However, they can be shared upon reasonable request.
Conflicts of Interest
The authors declare no conflicts of interest.
Appendix A. Bayesian Filters
The Bayesian filters associated with the interaction between fastenings and other track components, sleepers and other track components, and ballasts and other components are, respectively, shown in Equations (
A1)–(
A3). The same values as the ones discussed in
Section 4.2 are used for these filters. Please note that the deterioration rate of subgrades is assumed to be independent of the CSs of other track components.
Appendix B. Estimating the Condition State of the Components over Time
The Algorithm A1 shows the pseudocode associated with CS estimation taking into account the interactions between components and the impacts of the imperfect execution of maintenance interventions. The CS of the components was estimated each year taking into account the transition probability associated with each component, the acceleration factor, the number of years throughout the planning periods, the effectiveness of the interventions, the Bayesian filters and the initial condition of the components. CSs at
, as mentioned in
Section 3.1, are first estimated by multiplying the initial CSs by the transition probabilities for all components (lines 2 to 5). The year count is then updated on line 6. The main loop of the algorithm starts by estimating the CS of all components in year
t by multiplying the CS of the components in year
by the associated transition probabilities (line 9). The line 11 captures the interaction between the components by updating the deterioration rates of the components by multiplying their current transition probabilities by the Bayesian filter associated with each component. For example, if all components are in CS in year
t then, as discussed in
Section 4.2 and
Appendix A, it would be
. This means that if all components are in CS2, their transition probabilities would remain unchanged. In the next step, the algorithm checks if the conditions for triggering interventions are met. If positive, the CS of the components in need of interventions is updated by multiplying their estimated CS by the intervention effectiveness vector, as seen in line 13. The impact of maintenance interventions on deterioration rates is captured in lines 14 and 15. In these lines, the algorithm checks if the intervention type was not “Replacement”. In case this statement is positive, the algorithm updates the transition probabilities by multiplying the current transition probabilities by a given acceleration factor, as discussed in
Section 4.2. The algorithm continues until the CSs for the last year of the last planning period are estimated.
| Algorithm A1 Estimating CS of the components over time |
- 1:
Input: Transition Probabilities (), TP acceleration factor (), Planning Periods (), Intervention Strategies (), Intervention Effectiveness (), Bayesian Filters (), Initial Condition State () - 2:
- 3:
for to 5 do - 4:
- 5:
end for - 6:
- 7:
while
do - 8:
// For all components in parallel: - 9:
- 10:
// Check condition states of all dependable components and update TP with Bayesian Filters - 11:
- 12:
if indicates an intervention is needed (per corresponding ) then - 13:
- 14:
if Intervention type ≠ Replacement (per corresponding ) then - 15:
- 16:
end if - 17:
end if - 18:
end while
|
Appendix C. Estimating Failure Risks
The Algorithm A2 shows the pseudocode related to the estimation of failure risks over time. The failure risks were estimated taking into account the length of the planning periods, the evolution of CSs over time, and the probability of occurrence of basic events depending on the condition of components. Based on this algorithm, the failure probability of the components due to the basic event
j in year
t, i.e.,
, is calculated taking into account the probability of occurrence of that event in that year, i.e.,
, the condition of the components in that year, i.e.,
, and a factor to represent the resistance of each component
i in each CS against the impacts of the occurred of basic events (
). In the final step, the failure risks (
) in each year are calculated taking into account the structure of the fault trees. The algorithm then checks whether the level of failure risk exceeds the acceptable failure risk threshold and if positive, flags for intervention. The loop continues until the end of the planning period. More detailed information regarding the definition and the use of fault trees connected to the condition of components are found in [
1].
| Algorithm A2 Estimating evolution of failure risks |
- 1:
Input: Acceptable Failure Risk Level (), Condition States (), Planning Periods (), Probability of Occurrence (), Consequences () - 2:
- 3:
while
do - 4:
for each component i do - 5:
for each failure mode j do - 6:
- 7:
end for - 8:
end for - 9:
- 10:
if then - 11:
Flag for intervention - 12:
end if - 13:
- 14:
end while
|
References
- Mehranfar, H.; Adey, B.T.; Moghtadernejad, S.; Chuo, S. Automated early estimation of bridge interventions, possession windows and costs. Infrastruct. Asset Manag. 2023, 11, 128–144. [Google Scholar] [CrossRef]
- SBB Infrastruktur. Network Status Report 2020; Technical Report; VöV: Bern, Switzerland, 2020. [Google Scholar]
- Adey, B.T. A road infrastructure asset management process: Gains in efficiency and effectiveness. Infrastruct. Asset Manag. 2018, 6, 2–14. [Google Scholar] [CrossRef]
- Chuo, S.; Moghtadernejad, S.; Adey, B.T.; Mehranfar, H. Estimation of bridge component condition states with varying data availability. In Proceedings of the Life-Cycle of Structures and Infrastructure Systems, Milan, Italy, 28 June 2023; CRC Press: Boca Raton, FL, USA, 2023. [Google Scholar]
- Giunta, M.; Bressi, S.; D’Angelo, G. Life cycle cost assessment of bitumen stabilised ballast: A novel maintenance strategy for railway track-bed. Constr. Build. Mater. 2018, 172, 751–759. [Google Scholar] [CrossRef]
- O’Connor, K.; Wynd, B.; Cunningham, G.; MacPherson, D. Maintenance of early reinforced-concrete road bridges in Aberdeenshire, Scotland. Proc. Inst. Civ. Eng. Bridge Eng. 2019, 172, 293–302. [Google Scholar] [CrossRef]
- Fecarotti, C.; Andrews, J.D.; Pesenti, R. A mathematical programming model to select maintenance strategies in railway networks. Reliab. Eng. Syst. Saf. 2021, 216, 107940. [Google Scholar] [CrossRef]
- Calvert, G.; Neves, L.; Andrews, J.; Hamer, M. Modelling the interactions between defect mechanisms on metal bridges. In Bridge Maintenance, Safety, Management, Life-Cycle Sustainability and Innovations, Proceedings of the 10th International Conference on Bridge Maintenance, Safety and Management, IABMAS 2021, London, UK, 19 April 2021; CRC Press: Boca Raton, FL, USA, 2021; pp. 2743–2751. ISBN 9780429279119. [Google Scholar] [CrossRef]
- Ricketts, N. Railway Bridge Maintenance, 2nd ed.; ICE Publishing: London, UK, 2017. [Google Scholar] [CrossRef]
- Lethanh, N.; Adey, B.T.; Fernando, D.N. Optimal intervention strategies for multiple objects affected by manifest and latent deterioration processes. Struct. Infrastruct. Eng. 2015, 11, 389–401. [Google Scholar] [CrossRef]
- Kobayashi, K.; Kaito, K.; Lethanh, N. A competing Markov model for cracking prediction on civil structures. Transp. Res. Part B Methodol. 2014, 68, 345–362. [Google Scholar] [CrossRef]
- Fecarotti, C.; Andrews, J.D. Producing effective maintenance strategies to control railway risk. In Proceedings of the PSAM 14—Probabilistic Safety Assessment and Management, Nottingham, UK, 16–21 September 2018. [Google Scholar]
- Kaewunruen, S.; Osman, M.H.; Hao Cheng Eric, W. Risk-Based Maintenance Planning for Rail Fastening Systems. ASCE-ASME J. Risk Uncertain. Eng. Syst. Part A Civ. Eng. 2019, 5, 04019007. [Google Scholar] [CrossRef]
- Mahmoud, H.; Zafar, A. Time-Dependent Reliability Analysis of Reinforced-Concrete Bridges Including Deterioration Effects. In Proceedings of the Geotechnical and Structural Engineering Congress 2016, Phoenix, AZ, USA, 14–17 February 2016; pp. 1354–1366. [Google Scholar] [CrossRef]
- Adey, B.T.; Hajdin, R. Methodology for determination of financial needs of gradually deteriorating bridges with only structure level data. Struct. Infrastruct. Eng. 2011, 7, 645–660. [Google Scholar] [CrossRef]
- Allah Bukhsh, Z.; Stipanovic, I.; Doree, A.G. Multi-year maintenance planning framework using multi-attribute utility theory and genetic algorithms. Eur. Transp. Res. Rev. 2020, 12, 3. [Google Scholar] [CrossRef]
- Bressi, S.; Santos, J.; Losa, M. Optimization of maintenance strategies for railway track-bed considering probabilistic degradation models and different reliability levels. Reliab. Eng. Syst. Saf. 2021, 207, 107359. [Google Scholar] [CrossRef]
- Chiachío, J.; Chiachío, M.; Prescott, D.; Andrews, J.D. A knowledge-based prognostics framework for railway track geometry degradation. Reliab. Eng. Syst. Saf. 2019, 181, 127–141. [Google Scholar] [CrossRef]
- Consilvio, A.; Vignola, G.; López Arévalo, P.; Gallo, F.; Borinato, M.; Crovetto, C. A data-driven prioritisation framework to mitigate maintenance impact on passengers during metro line operation. Eur. Transp. Res. Rev. 2024, 16, 6. [Google Scholar] [CrossRef]
- Consilvio, A.; Solís-Hernández, J.; Jiménez-Redondo, N.; Sanetti, P.; Papa, F.; Mingolarra-Garaizar, I. On applying machine learning and simulative approaches to railway asset management: The earthworks and track circuits case studies. Sustainability 2020, 12, 2544. [Google Scholar] [CrossRef]
- Fecarotti, C.; Andrews, J. A Petri net approach to assess the effects of railway maintenance on track availability. Infrastruct. Asset Manag. 2020, 7, 201–220. [Google Scholar] [CrossRef]
- Hidirov, S.; Guler, H. Reliability, availability and maintainability analyses for railway infrastructure management. Struct. Infrastruct. Eng. 2019, 15, 1221–1233. [Google Scholar] [CrossRef]
- Irfan, M.; Khurshid, M.B.; Iqbal, S.; Khan, A. Framework for airfield pavements management—an approach based on cost-effectiveness analysis. Eur. Transp. Res. Rev. 2015, 7, 1–14. [Google Scholar] [CrossRef]
- Prescott, D.; Andrews, J. Investigating railway track asset management using a Markov analysis. Proc. Inst. Mech. Eng. Part F J. Rail Rapid Transit 2015, 229, 402–416. [Google Scholar] [CrossRef]
- Prescott, D.; Andrews, J. A track ballast maintenance and inspection model for a rail network. Proc. Inst. Mech. Eng. Part O J. Risk Reliab. 2013, 227, 251–266. [Google Scholar] [CrossRef]
- Rúa, E.; Comesaña-Cebral, L.; Arias, P.; Martínez-Sánchez, J. A top-down approach for a multi-scale identification of risk areas in infrastructures: Particularization in a case study on road safety. Eur. Transp. Res. Rev. 2022, 14, 39. [Google Scholar] [CrossRef]
- Sadeghi, J.; Motieyan-Najar, M.E.; Zakeri, J.A.; Yousefi, B.; Mollazadeh, M. Improvement of railway ballast maintenance approach, incorporating ballast geometry and fouling conditions. J. Appl. Geophys. 2018, 151, 263–273. [Google Scholar] [CrossRef]
- Sancho, L.C.B.; Braga, J.A.P.; Andrade, A.R. Optimizing Maintenance Decision in Rails: A Markov Decision Process Approach. ASCE-ASME J. Risk Uncertain. Eng. Syst. Part A Civ. Eng. 2021, 7, 04020051. [Google Scholar] [CrossRef]
- Sasidharan, M.; Burrow, M.P.; Ghataora, G.S. A whole life cycle approach under uncertainty for economically justifiable ballasted railway track maintenance. Res. Transp. Econ. 2020, 80, 100815. [Google Scholar] [CrossRef]
- Sharma, S.; Cui, Y.; He, Q.; Mohammadi, R.; Li, Z. Data-driven optimization of railway maintenance for track geometry. Transp. Res. Part C Emerg. Technol. 2018, 90, 34–58. [Google Scholar] [CrossRef]
- Soleimanmeigouni, I.; Ahmadi, A.; Nissen, A.; Xiao, X. Prediction of railway track geometry defects: A case study. Struct. Infrastruct. Eng. 2020, 16, 987–1001. [Google Scholar] [CrossRef]
- Sresakoolchai, J.; Kaewunruen, S. Railway infrastructure maintenance efficiency improvement using deep reinforcement learning integrated with digital twin based on track geometry and component defects. Sci. Rep. 2023, 13, 2439. [Google Scholar] [CrossRef]
- Usman, K.; Burrow, M.; Ghataora, G. Railway track subgrade failure mechanisms using a fault chart approach. Procedia Eng. 2015, 125, 547–555. [Google Scholar] [CrossRef]
- Usman, K.; Burrow, M.P.N.; Ghataora, G.S.; Sasidharan, M. Using Probabilistic Fault Tree Analysis and Monte Carlo Simulation to Examine the Likelihood of Risks Associated with Ballasted Railway Drainage Failure. Transp. Res. Rec. 2021, 2675, 70–89. [Google Scholar] [CrossRef]
- Vale, C.; Simões, M.L. Prediction of Railway Track Condition for Preventive Maintenance by Using a Data-Driven Approach. Infrastructures 2022, 7, 34. [Google Scholar] [CrossRef]
- Vandoorne, R.; Gräbe, P.J. Stochastic modelling for the maintenance of life cycle cost of rails using Monte Carlo simulation. Proc. Inst. Mech. Eng. Part F J. Rail Rapid Transit 2018, 232, 1240–1251. [Google Scholar] [CrossRef]
- Wenfei, B.; Yun, W.; Rengkui, L. Optimization Model of Life Cycle Repair Decisions for Track Network. J. Transp. Eng. Part A Syst. 2022, 148, 04022032. [Google Scholar] [CrossRef]
- Jalili Hassankiadeh, S. Failure Analysis of Railway Switches and Crossings for the Purpose of Preventive Maintenance. Master’s Thesis, Royal Institute of Technology (KTH), Stockholm, Sweden, 2011. [Google Scholar]
- Zhao, Y.; Cozzani, V.; Sun, T.; Vatn, J.; Liu, Y. Condition-based maintenance for a multi-component system subject to heterogeneous failure dependences. Reliab. Eng. Syst. Saf. 2023, 239, 109483. [Google Scholar] [CrossRef]
- Liang, Z.; Parlikad, A.K. A Condition-Based Maintenance Model for Assets with Accelerated Deterioration Due to Fault Propagation. IEEE Trans. Reliab. 2015, 64, 972–982. [Google Scholar] [CrossRef]
- Moghtadernejad, S.; Huber, G.; Hackl, J.; Adey, B.T. Data-driven estimation of deterioration curves: A railway supporting structures case study. Infrastruct. Asset Manag. 2021, 9, 3–17. [Google Scholar] [CrossRef]
- Mizutani, D.; Lethanh, N.; Adey, B.T.; Kaito, K. Improving the estimation of markov transition probabilities using mechanistic-empirical models. Front. Built Environ. 2017, 3, 58. [Google Scholar] [CrossRef]
- Tzanakakis, K. The Railway Track and Its Long Term Behaviour; Springer: Berlin/Heidelberg, Germany, 2013; Volume 2, ISBN 978-3-642-36050-3. [Google Scholar] [CrossRef]
- Kosič, M.; Anžlin, A.; Bau’, V. Flood vulnerability assessment: An effective tool to evaluate the lifecycle risk analysis of bridges. Eur. Assoc. Qual. Control Bridg. Struct. Digit. Transform. Sustain. 2023, 6, 817–823. [Google Scholar] [CrossRef]
- Sathya, S.U.; Mahmoodian, M.; Bandara, C.S.; Naderpajouh, N.; Dissanayake, P.B.R. Fragility Prediction for Earthquake-Induced Embankment Failures Through Empirical Methods. In Proceedings of the ICSBE, Yogyakarta, Indonesia, 15–16 November 2022; Lecture Notes in Civil Engineering; Dissanayake, R., Mendis, P., Weerasekera, K., De Silva, S., Fernando, S., Konthesingha, C., Gajanayake, P., Eds.; Springer: Singapore, 2023; pp. 519–535. [Google Scholar] [CrossRef]
- Federal Statistical Office. Baupreisindex—Durchschnittliche Einheitspreise in der Schweiz und in den Grossregione. Technical Report. 2021. Available online: https://dam-api.bfs.admin.ch/hub/api/dam/assets/20404732/master (accessed on 1 April 2025).
- Asmussen, B. Overview of Methods for Measurement of Track Irregularities Important for Ground-Borne Vibration Deliverable D2.5. RIVAS Railway Induced Vibration Abatement Solutions Collaborative Project, Feb 7; European Commission: Brussels, Belgium, 2013.
- Kim, H. Trackside Measurement of Critical Zones in Railway Tracks. Ph.D. Thesis, University of Birmingham, Birmingham, UK, 2016. [Google Scholar]
- Union Pacific Railroad. Engineering Track Maintenance Field Handbook; Technical Report; Union Pacific: Omaha, NE, USA, 2022. [Google Scholar]
- Martinod, R.M.; Bistorin, O.; Castañeda, L.F.; Rezg, N. Maintenance policy optimisation for multi-component systems considering degradation of components and imperfect maintenance actions. Comput. Ind. Eng. 2018, 124, 100–112. [Google Scholar] [CrossRef]
- Mosayebi Omshi, E.; Grall, A. Replacement and imperfect repair of deteriorating system: Study of a CBM policy and impact of repair efficiency. Reliab. Eng. Syst. Saf. 2021, 215, 107905. [Google Scholar] [CrossRef]
- Chen, J.; Ren, L.; Li, J. Research on imperfect condition-based maintenance strategy based on accelerated degradation process. Meas. Control 2024, 57, 510–518. [Google Scholar] [CrossRef]
- Li, M.; Jia, G. Age, state, and environment dependent non-homogeneous stochastic model for improved bridge deterioration prediction. In Proceedings of the Bridge Maintenance, Safety, Management, Life-Cycle Sustainability and Innovations, London, UK, 19 April 2021; CRC Press: Boca Raton, FL, USA, 2021; 8p. [Google Scholar]
- Peng, J.; Liu, B.; Liu, Y.; Xu, X. Condition-Based Maintenance Policy for Systems with a Non-Homogeneous Degradation Process. IEEE Access 2020, 8, 81800–81811. [Google Scholar] [CrossRef]
- Chiachío, J.; Jalón, M.L.; Chiachío, M.; Kolios, A. A Markov chains prognostics framework for complex degradation processes. Reliab. Eng. Syst. Saf. 2020, 195, 106621. [Google Scholar] [CrossRef]
- Morato, P.G.; Andriotis, C.P.; Papakonstantinou, K.G.; Rigo, P. Inference and dynamic decision-making for deteriorating systems with probabilistic dependencies through Bayesian networks and deep reinforcement learning. Reliab. Eng. Syst. Saf. 2023, 235, 109144. [Google Scholar] [CrossRef]
- Wellalage, N.K.W.; Zhang, T.; Dwight, R. Calibrating Markov Chain–Based Deterioration Models for Predicting Future Conditions of Railway Bridge Elements. J. Bridge Eng. 2015, 20, 04014060. [Google Scholar] [CrossRef]
- Shen, Y.; Goodall, J.L.; Chase, S.B. Condition State–Based Civil Infrastructure Deterioration Model on a Structure System Level. J. Infrastruct. Syst. 2019, 25, 04018042. [Google Scholar] [CrossRef]
- Ozbek, M.E.; de la Garza, J.M.; Triantis, K. Efficiency Measurement of Bridge Maintenance Using Data Envelopment Analysis. J. Infrastruct. Syst. 2010, 16, 31–39. [Google Scholar] [CrossRef]
- Zhang, Z.; Agbelie, B.R.; Labi, S. Efficiency Measurement of Bridge Management with Data Envelopment Analysis. Transp. Res. Rec. 2015, 2481, 1–9. [Google Scholar] [CrossRef]
- Salim, W.S.W.; Liew, M.S.; Shafie, A. Fault tree analysis for reinforced concrete highway bridge defect. In Engineering Challenges for Sustainable Future; CRC Press: Boca Raton, FL, USA, 2016; ISBN 978-1-315-37505-2. [Google Scholar]
- Modarres, M.; Kaminskiy, M.P.; Krivtsov, V. Reliability Engineering and Risk Analysis: A Practical Guide, 3rd ed.; CRC Press: Boca Raton, FL, USA, 2016. [Google Scholar] [CrossRef]
- R Core Team. R: A Language and Environment for Statistical Computing; R Foundation for Statistical Computing: Vienna, Austria, 2024. [Google Scholar]
- Kim, S.; Ge, B.; Frangopol, D.M. Probabilistic Optimum Bridge System Maintenance Management Considering Correlations of Deteriorating Components and Service Life Extensions. ASCE-ASME J. Risk Uncertain. Eng. Syst. Part A Civ. Eng. 2022, 8, 04022023. [Google Scholar] [CrossRef]
- Kamariotis, A.; Chatzi, E.; Straub, D.; Dervilis, N.; Goebel, K.; Hughes, A.J.; Lombaert, G.; Papadimitriou, C.; Papakonstantinou, K.G.; Pozzi, M.; et al. Monitoring-supported value generation for managing structures and infrastructure systems. Data-Centric Eng. 2024, 5, e27. [Google Scholar] [CrossRef]
| Disclaimer/Publisher’s Note: The statements, opinions and data contained in all publications are solely those of the individual author(s) and contributor(s) and not of MDPI and/or the editor(s). MDPI and/or the editor(s) disclaim responsibility for any injury to people or property resulting from any ideas, methods, instructions or products referred to in the content. |
© 2025 by the authors. Licensee MDPI, Basel, Switzerland. This article is an open access article distributed under the terms and conditions of the Creative Commons Attribution (CC BY) license (https://creativecommons.org/licenses/by/4.0/).


