Article

Performance of High Strength Fiber Reinforced Mortar Made with Ceramic Powder, Metakaolin, and Magnetized Water

by
Osama Youssf
1,*,
Khalid A. Eltawil
2,
Mohamed M. Yousry Elshikh
1 and
Mostafa M. Keshta
2
1
Structural Engineering Department, Mansoura University, Mansoura 35516, Egypt
2
Civil Engineering Department, Higher Institute for Engineering and Technology, Manzala 35642, Egypt
*
Author to whom correspondence should be addressed.
Infrastructures 2025, 10(5), 124; https://doi.org/10.3390/infrastructures10050124
Submission received: 14 April 2025 / Revised: 9 May 2025 / Accepted: 15 May 2025 / Published: 19 May 2025

Abstract

In recent years, there has been a notable concern about the production of cementitious composites due to its high cement consumption and the corresponding carbon footprint. This has led to significant progress within the construction sector in integrating various waste materials as cement alternatives into cementitious composites. In this study, a sustainable high strength fiber reinforced mortar (HS-FRM) was designed with ceramic powder (CP) and metakaolin (MK) materials as partial replacements of the conventional HS-FRM by up to 80%. Magnetized water (MW) was used in the proposed HS-FRM as mixing water and replaced the normal tap water (TW) for producing a more sustainable and higher strength cementitious product. The HS-FRM was cured using four different curing methods, namely, tap water, seawater, air, and sunlight. Fresh, mechanical, durability, and microstructure characteristics were measured and analyzed for the proposed HS-FRM. The results showed that CP can enhance the slump of HS-FRM by up to 50% (achieved at 40% CP), while MK showed the same or less slump (by up to 33%) than that of the conventional HS-FRM. Using up to 80% of either CP or MK in the HS-FRM continuously decreased its 28-day compressive strength by up to 78% or 83%, respectively. The HS-FRM cured in tap water exhibited the highest compressive strength compared to the other curing conditions. The use of MW improved the workability of the HS-FRM by up to 225% and the compressive strength by up to 13%. The microstructure analyses interpreted the reported variation in the HS-FRM compressive strength and showed that using MW in the HS-FRM revealed a dense structure with an adequate bond between the fiber and the matrix with a relatively low number of micro-cracks and pores compared when using TW. The XRD analysis showed higher peaks of Q, C, and L with the presence of MW compared to mixtures made with TW.

1. Introduction

In recent decades, the sustainability of cementitious products has become a pressing concern due to two primary issues: greenhouse gas emissions and demolition waste accumulation management. The building industry contributes significantly to global greenhouse gas emissions, owing to the large, embodied carbon footprint of ordinary Portland cement (OPC) used in cementitious products. Producing OPC releases enormous amounts of carbon dioxide (CO2), which account for approximately 7% of global CO2 emissions [1].
Many research studies have developed various advanced types of cementitious products to meet sustainability requirements, especially from an economic and environmental perspective. Moreover, environmental challenges linked to the industrial use of traditional materials are controlled by climate change and the reduction of essential natural resources. As a result, recent research should use innovative, eco-friendly, and sustainable solutions to tackle these issues [2]. Incorporating waste materials, such as ceramic powder, granite powder, glass powder, brick powder, and metakaolin, into the production of cementitious products not only enhances their characteristics but helps preserve the environment and conserve natural resources [3,4]. Numerous studies have investigated the use of waste oyster shells in concrete production. Due to their angular shape and flaky texture, these shells require more cement paste to achieve proper bonding, which leads to increased void content and reduced concrete performance [5]. Recently, waste oyster shells have been used as a replacement for natural sand in cement-based materials [6].
High strength mortar is a mixture of cement, fine aggregates, and additives that provides greater compressive strength than regular mortar. The benefits of using this type of mortar include increased load-bearing capacity, greater durability, and enhanced resistance to environmental parameters, making it well-suited for use in structural projects. On the other hand, it tends to be more expensive due to the use of high-quality materials, and requires skilled labor for effective mixing and application. Furthermore, its rigid nature can make it prone to brittleness, which raises the risk of cracking under temperature changes or seismic events.
With an annual production of 790 million m2 of ceramic tiles, ceramic powder (CP) is among the largest by-product of solid waste globally. Additionally, the polishing process generates between 1.15 and 2.05 kg of CP for every 1.02 m of polished tiles. As the ceramic industry grows rapidly, the increasing discharge of CP from tile manufacturing poses environmental challenges and hinders the industry’s potential for sustainable development [7,8]. Given its elevated pozzolanic activity, CP presents a promising alternative material for use in both conventional concrete and mortar [9,10]. Conversely, several studies have explored the feasibility of substituting CP for cement in concrete or mortar production for various applications. For example, Kannan et al. [11] created concrete with CP replacing 10, 20, and 30% of the cement. They found that substituting cement with CP led to a decrease in the compressive strength of concrete, with reductions of 2.7% and 17.3% for 10% and 40% cement replacement, respectively. Gautam et al. [10] noted that the compressive strength improved when CP replaced 10% of cement, likely due to the pozzolanic reaction. However, further increases in CP content resulted in a decrease in the compressive strength. Chen et al. [12] evaluated both short- and long-term properties of recycled aggregate concrete with CP replacing cement. They concluded that CP could improve the long-term strength of this type of concrete, with optimal replacement levels ranging from 10% to 20%. Hoppe Filho et al. [13] examined the microstructure and mechanical properties of blended mortar by replacing 30% of Portland cement with red CP. They found that this substitution could decrease the compressive strength by up to 16% at 182 days. It was also found that there is an inverse relationship between the compressive strength and water absorption of ECC containing CP at different contents; as the compressive strength decreased due to the increased CP content, the water absorption increased, and vice versa [14].
Metakaolin (MK) has attracted research interest because of its technological and financial advantages [15]. Metakaolin is formed by exposing calcining kaolin to high temperatures, and typically contains 40–45% aluminum oxide (Al2O3) and 50–55% silicon dioxide (SiO2) [16]. The byproduct of cement hydration processes, calcium hydroxide (CH), adversely affects the concrete’s mechanical and durability properties and does not significantly contribute to the desired strength [17]. The SiO2 and Al2O3 that are in MK can react with CH to create calcium silicate hydrates (C-S-H), calcium aluminate hydrates (CAH), and calcium (alumino)silicate hydrates (CASH) when water is present [18]. Employing 20–40% MK in concrete, removes CH after 28 days of the concrete age according to [19,20]. Using MK in concrete reduces CH by 83% after 28 days of the concrete age according to Zhao and Khoshnazar [21]. MK exhibited greater pozzolanic activity compared to silica fume [22]. The rate of pozzolanic product formation is influenced by the reaction temperature, the composition of MK, and its calcination process [18].
Incorporating various types of fibers to enhance the different properties of concrete or mortar is of great interest. Glass fibers serve multiple purposes in concrete, including crack control, preventing the merging of cracks, and altering the material behavior by bridging across the cracks. Incorporating 1% to 2% glass fiber into cementitious products is effective for reducing shrinkage cracks, enhancing flexural toughness, and improving temperature resistance in lightweight concrete, according to Mirza and Soroushian [23]. According to Iskender and Karasu [24], The addition of glass fibers does not impact the modulus of elasticity of concrete; however, it positively influences the stress–strain curve and enhances the flexural strength.
Magnetized water (MW) is a promising material in the concrete industry due to its promising effects on concrete properties, which have captured the interest of numerous researchers recently. It is a crucial new and inventive technique for sustainability in building sectors because of its cost-effectiveness, ecologically friendly, and simple technique to enhance the properties of cementitious composite materials [25]. The water magnetization technology activates tap water (TW) by passing it through a magnetic field at a specified flow rate to improve its properties, such as specific area, pH, alkalinity, acidity, chlorides, surface tension, conductivity, viscosity, and absorbance [26,27]. As a result, the MW provides advantages in construction by enhancing the mechanical and durability properties of concrete and decreasing the amount of cement needed [28]. MW could enhance the 28-day compressive strength of cement mortar by 16.7% while showing reduced porosity and nitrogen component dissolution [28]. In addition, it has the ability to reduce the amount of cement used in concrete while still achieving the desired strength [29,30]. A study by Su and Wu [31] demonstrated that incorporating MW into concrete led to a 15–25% increase in the compressive strength compared to concrete prepared with conventional TW. Su et al. [32] investigated the effect of MW on the mechanical properties of concrete containing slag. They found that MW enhanced the compressive strength of concrete by 9–19%. Khattab et al. [33] showed that MW-based geopolymer concrete had a 100% greater slump and up to 193%, 192%, and 124% greater compressive strength after 7, 28, and 56 days, respectively, compared to TW-based geopolymer concrete [33]. Elkerany et al. [34] reported that incorporating MW with MK led to increases in the compressive strength of up to 33%, 32%, and 27% over a period of 365 days. Ahmed et al. [35] demonstrated that using MW in concrete resulted in improvements of up to 80% in the compressive strength, 98% in the splitting tensile strength, and 22% in the flexural strength compared to conventional control concrete. Other researchers have found that the use of MW in volcanic ash concrete notably improved its workability, along with enhancements in the compressive strength, the splitting tensile strength, and the flexural strength [36].
As per the above literature, the performance of MW-based high strength fiber reinforced mortar (HS-FRM) has not yet been explored. The purpose of this research is to develop sustainable HS-FRM utilizing innovative binder ingredients, such as CP and MK, with and without MW as mixing water. The effects of four curing conditions (tap water, sea water, sunlight, and air) on the HS-FRM performance were also explored, with the goal to produce a sustainable and durable HS-FRM mixture for use in the construction industry. Compressive strength, uniaxial tensile strength, flexural strength, durability properties, and microstructure analyses were used in the assessment of the proposed HS-FRM. This work is a part of ongoing research work on utilizing MW in producing different types of concrete and mortar.

2. Experimental Program
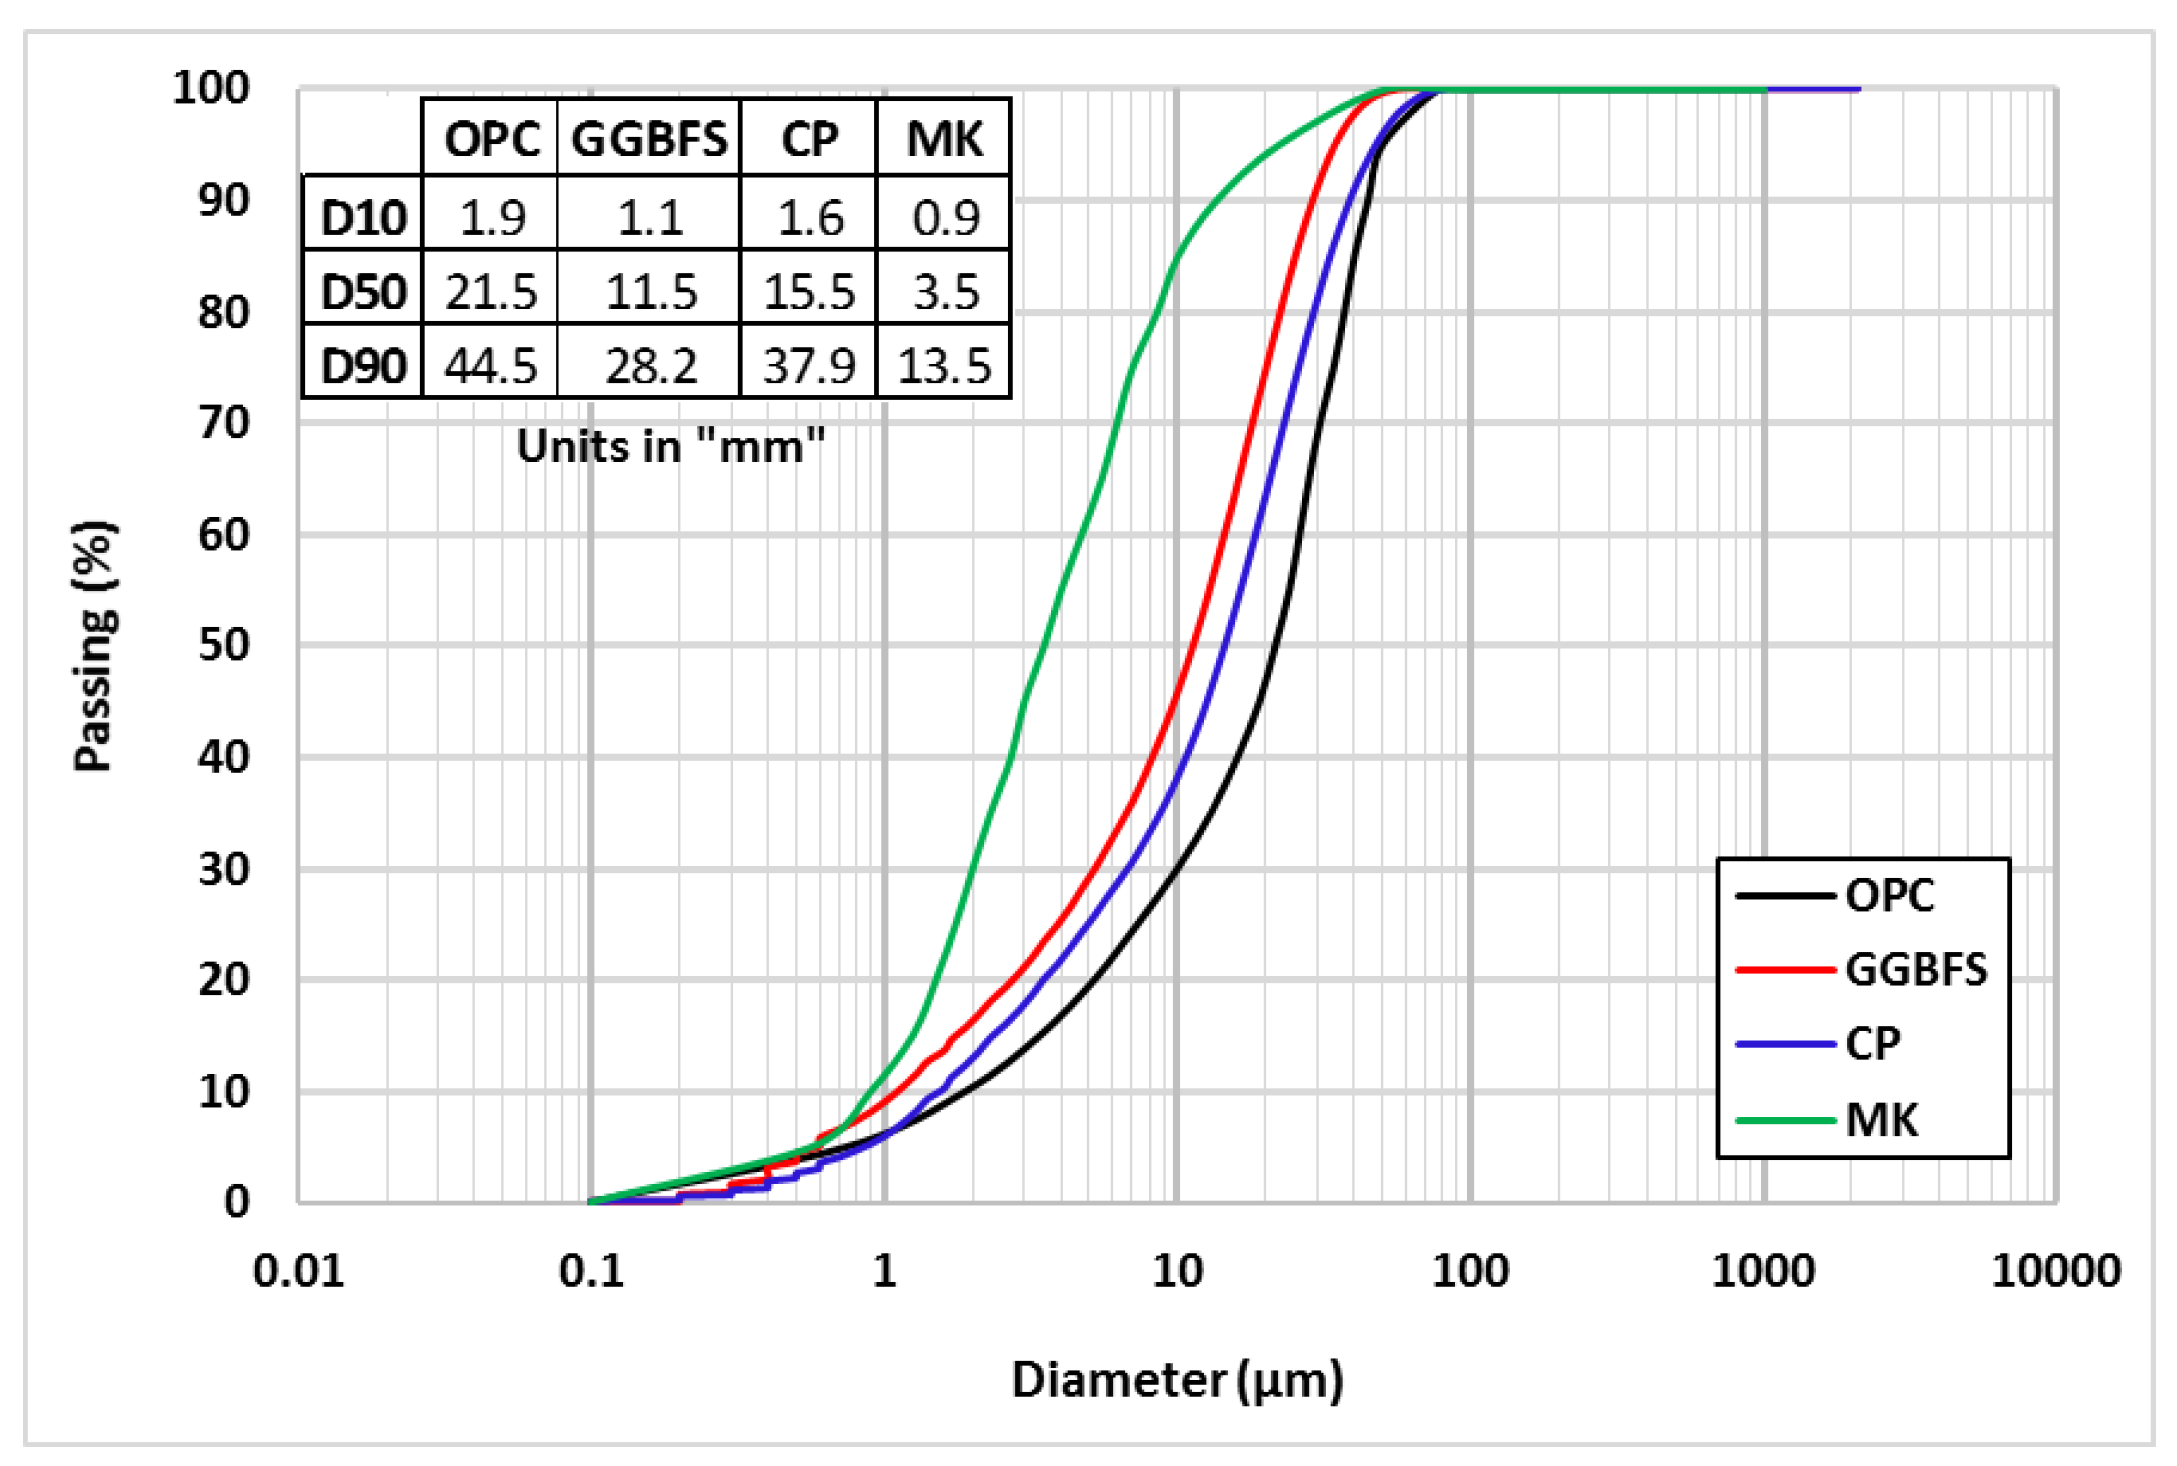
2.1. Materials

The binder materials in this study included OPC (CEM-52.5), MK, CP, and GGBFS, with specific gravities of 3.15, 2.61, 2.6, and 2.83, respectively. All binder materials were sourced from local Egyptian companies. The OPC and GGBFS were provided as pre-packed binders (powders) and were used as received. The MK was prepared by exposing calcining kaolin to a high temperature of 650 °C, and then it was ground into small particles. The CP was prepared by collecting ceramic tile waste that was crushed in a Los-Angeles machine to produce small particles. All binder materials were passed through a sieve, size No. 170, to ensure sufficient fineness for hydration, mixing, compaction, and quality control processes. Figure 1 shows the particle size distribution combined with D10, D50, and D90 of all utilized binders. Table 1 displays the chemical composition of the binder materials used. River sand (0.16/4.75 mm) with a specific gravity of 2.63, high range water reducer (superplasticizer—SP) “type G” with specific gravity of 1.08, and glass fiber (GF) with specific gravity of 0.91 were also used in preparing the HS-FRM. The physical and geometric characteristics of the GF fiber are outlined in Table 2.
Two types of mixing water were used in this study, namely TW and MW. The MW was produced by subjecting TW to a magnetic field with a strength of 1.6 Tesla for 150 cycles. This number of cycles was selected based on previous studies [36,37], which identified it as the optimal level for enhancing the overall properties of concrete. Figure 2 illustrates the device used in magnetizing the water in this study. The device included a permanent magnet with a magnetic strength of 1.6 Tesla, a water pump, a water tank, and a set of pipes with valves to control the water flow. In each magnetization cycle, the TW was pumped from the water tank through the pipes, then through the magnet, and finally, it returned back to the tank.

2.2. Variables and Mixes

The variables in this study were the CP and MK contents as partial replacements of the HR-FRM binder. In addition, MW was used as the HS-FRM mixing water instead of TW in some selected mixtures. Twelve mixtures were used to investigate the effect of different ratios of CP and MK on the performance of the HS-FRM in terms of fresh, mechanical, and durability properties, as well as microstructure. The mixtures consisted of four groups: the first group had one mixture, which served as the control HS-FRM, with cementitious materials comprising 50% cement and 50% GGBFS; the second group had four mixtures, each represented by a substitution ratio of cement and GGBFS equally by the CP binder, with contents of 20%, 40%, 60%, and 80%; the third group was similar to the second group, but when using MK to partially substitute cement and GGBFS equally; the fourth group consisted of three mixtures selected from the other three groups but made with MW instead of TW. The selected mixtures included the control mixture (C), the mixture with 20% CP (CP20), and the mixture with 20% MK (MK20). The sand, fiber, water, and SP contents were kept constant in all mixtures at 571 kg/m3, 3% (of mix volume), 330 kg/m3, and 1% (of binder weight), respectively. Table 3 illustrates the mixing ratios for all aforementioned mixtures.
The blending process of the HS-FRM adhered to some procedures. Initially, half of the water combined with half of the SP were added into the mixer and mixed for 4 min. Subsequently, the pre-mixed solid components, like cement, GGBFS, CP, MK, and sand, were gradually added along with the remaining water and SP, and mixed for another 4 min. Following this, GF was added gradually to the mixture while mixing. The mixing was then continued for an additional 5 min after complete adding of the fiber to ensure its full dispersion in the mixture. The freshly prepared HS-FRM was then poured into molds and covered with plastic wraps to prevent moisture loss. After a 24-h period, all specimens were demolded, and the curing was started using different methods, namely tap water, sea water, air, and sunlight, until the testing day.

2.3. Test Procedures

2.3.1. Workability and Mechanical Characteristics

The workability of the HS-FRM mixtures was assessed through conducting the slump test. A standard cone-shaped mold with dimensions of 200 mm at the base, 100 mm at the top, and 300 mm in height was used according to ASTM C 143-10 [38]. The HS-FRM compressive strength assessment was conducted through testing 50 mm cubic specimens at 7, 28, and 90 days. In total, 18 cubes were tested for each mixture; 3 cubes at 7 days and 12 cubes at 28 day (3 cubes for each of the four curing methods), and 3 cubes at 90 days, according to ASTM C109 [39]. The average compressive strength of each mixture was determined by averaging the results of the three specimens. The ultimate tensile strength of the HS-FRM mixtures was evaluated through a uniaxial tensile test following the JSCE standard [40]. Dog-bone shaped specimens were utilized for this purpose (2 specimens per mixture) at 28 days of tap water curing. The dog-bone specimen had gauge length of 80 mm with cross section dimensions of 30 mm in width and 13 mm in thickness, as shown in Figure 3. The flexural strength was assessed using 3 plate specimens measuring 40 mm × 40 mm × 160 mm at 28 days of water curing, by testing each plate using a three-point bending test in accordance with ASTM C348-14 [41].

2.3.2. Durability Properties

To assess the HS-FRM durability properties, water absorption and sorptivity tests were conducted. The water absorption (WA) test was carried out according to ASTM C642 [42] and aimed to ascertain the absorption and voids ratios in the cured HS-FRM. Initially, the specimens underwent oven-drying at a temperature ranged from 100 °C to 110 °C after 28 days of the curing or water. Following this, they were allowed to cool down to room temperature (20–25 °C), and their masses were subsequently measured. Before each weight measurement, a dry cloth was employed to eliminate water from the specimen’s surface. The measuring process concluded when the mass difference between two consecutive weightings fell below 0.5%, signifying the saturation phase. The WA was determined using Equation (1) as follows:
W A   ( % ) = W 1 W 2 W 2 × 100
where WA is the absorption ratio, W1 is the saturated weight (g), and W2 is the dry weight (g).
The sorptivity test was conducted to assess the absorption rate of the HS-FRM. This test provides a straightforward approach for measuring the capillary action of mortar upon contact with water [43]. It involves measuring the rate at which water is absorbed by observing the increase in the specimen mass over time when one surface is exposed to water through capillary suction. The sorptivity test was performed on specimens measuring 50 × 50 × 50 mm, following the guidelines outlined in ASTM C1585-13 [44]. At 28 days of water curing, specimens were retrieved and subjected to a three-day drying process in an oven at a temperature of 50 ± 2 °C and relative humidity of 80 ± 3% until a constant mass was attained. Prior to commencing the measurements of the sorptivity test, the side surfaces of the specimens were covered with epoxy material to ensure that water movement was only permitted through the bottom surface, as depicted in Figure 4. The specimens were subsequently positioned over two plastic bars in a plastic container, and the water level maintained at 3 mm above the bottom surface of the specimens, as shown in Figure 4.
Initially, the weights of specimens were recorded before immersing them in water, and subsequent weight measurements were taken at specified intervals in accordance with ASTM C1585-13 [44], using a digital balance after removing excess surface water with a wet cloth. The specimens were then promptly returned to the container within 15 s for the next interval readings. Throughout the test, water was refilled into the container to maintain a water level of 3 mm above the bottom surfaces of the specimens. The cumulative volume of absorbed water per unit surface area (denoted as I) in mm3/mm2 was plotted against the square root of time. The value of “I” was determined using Equation (2) according to ASTM C1585-13 as follows [44]:
  I = M A . D
where M represents the change in mass of the specimen at time “t” in gm, A denotes the exposed area of the bottom surface in mm2, and D signifies the density of water in gm/mm3. The sorptivity coefficient was determined as the slope of the best-fitted straight line of “I” plotted against the square root of time. Equation (3) was utilized for this purpose, as follows:
I = S t + b
where S represents the absorption rate or the sorptivity coefficient in mm/sec1/2, t stands for the measured time in sec, and b denotes the corresponding constant value that elucidates the impact of the initial water filling at the mortar surface. As shown in Equation (3), S and b depends on the mass difference and I in this equation. According to ASTM C1585-13 [44], capillary absorption can be segmented into two stages. The first stage is the initial absorption that occurs within 0 to 6 h after the test initiation, while the second stage is the secondary absorption that takes place between 6 h and 7 days. In this investigation, data from both stages were utilized to compute the initial and secondary sorptivity coefficients. Additionally, the correlation coefficient (R) underwent regression analysis, with a requirement that it surpasses 0.98, as stipulated by ASTM C1585-13 [44].

2.3.3. Microstructure Analyses

Several microstructure analyses were conducted on the HS-FRM samples obtained from the cured cube specimens in water. The analyses included scanning electron microscope (SEM), energy dispersive X-ray (EDX), and X-ray diffraction (XRD). The SEM imaging was carried out after coating the HS-FRM samples with a 12 nm thick layer of gold using a JEOL JSM 6510 LV microscope, operating at a 30 kV acceleration voltage. The EDX analysis was conducted to determine the atomic percentage of each element within the HS-FRM matrix utilizing an Oxford X-Max 20 device. XRD is a nondestructive method for obtaining precise data about a material’s chemical makeup, physical characteristics, and crystallographic structure. It was performed on 2 cm3 samples extracted from the core of each HS-FRM mixture. These samples were crushed into powder and subsequently dried at 60 °C for 24 h. The diffraction patterns were then obtained for each sample within the 2θ range of 5–80° at a scanning rate of 2° per minute, using a voltage of 40 kV and a current of 30 mA.

3. Results and Discussion

3.1. Workability

Figure 5a illustrates the slump results in of the HS-FRM mixtures containing CP with contents ranged from 20% to 80%. It is noted that, when using CP, slump values increased when the CP content was increased to 20%, 40%, and 60% by 33%, 50%, and 17%, respectively, compared to the control HS-FRM mixture. However, no effect on the HS-FRM slump was observed when using 80% CP, as the slump value remained constant at 30 mm compared with the control HS-FRM. The continuous increase in slump values when using CP up to 40% can be attributed to the spherical nature of its particles, as depicted in its SEM analysis as shown in Figure 5b. This helped in enhancing the movability of the mixture ingredients within the matrix and, hence, had better workability. Moreover, the improvement in the workability of the HS-FRM when using CP could be credited to the low water demand of CP particles, as noted in previous research [45]. This enhanced the plasticity of the mixture, and therefore the mixture workability. However, the decrease in the workability increasing rate with the use of higher CP contents (60% and 80%) is attributed to the availability of CP that was able to fill the spaces between the OPC and GGBFS particles. As a result, the friction between the particles increased, which caused the slump decrease.
Figure 6a illustrates the effect of using MK on the workability of the HS-FRM at 20%, 40%, 60%, and 80% contents. The performance of MK in the HS-FRM was contrary to that of CP, where the effect of using different contents of MK from 20% to 80% on workability was either negative or insignificant. This is attributed to the rough surface MK particles with their sharp edges (see Figure 6b) that made it difficult for water to surround the MK particles easily, thereby reducing the workability of the HS-FRM. In addition, MK has a relatively high water absorption rate which negatively affects the amount of free water needed for the overall matrix, and hence less workability of the HS-FRM [46,47]. Despite the improvement in workability for the HS-FRM using CP and the reduction in the slump values using MK, overall, the slump values were relatively low. The use of MW in the HS-FRM mixtures overcame its relatively low slump.
Figure 7 illustrates the effect of MW on the workability of the control HS-FRM mix, the mix with 20% CP, and the mix with 20% MK. The use of MW improved the workability of the control mix by 100%, the mix with 20% CP by 225%, and the mix with 20% MK by 140%. This can be attributed to the efficiency of MW in breaking the bonds between water molecules, facilitating easy penetration between cementitious material particles, improving the hydration process, and consequently enhancing workability [36,37].

3.2. Mechanical Characteristics

3.2.1. Compressive Strength

Figure 8 and Table 4 illustrate the compressive strength of the HS-FRM mixtures (cured in tap water) containing CP and MK at different contents (ranging from 20% to 80%) measured at 7, 28, and 90 days. At 7 days, a decrease in the compressive strength was observed when using CP by 18%, 42%, 60%, and 82%, respectively, for cementitious materials replacement ratios of 20%, 40%, 60%, and 80%. At the same replacement ratios, the decrease in the compressive strength was 11%, 17%, 47%, and 78%, respectively, at 28 days, and was 2%, 17%, 45%, and 71%, respectively, at 90 days. When using MK at 20%, 40%, 60%, and 80%, the decrease in the compressive strength was as follows: 18%, 38%, 58%, and 89%, respectively, at 7 days; 23%, 30%, 53%, and 83%, respectively, at 28 days; 18%, 26%, 49%, and 82%, respectively, at 90 days. These results demonstrated a gradual improvement in the compressive strength with the HS-FRM age development due to the progress of hydration and interaction between water and cementitious materials.
The decrease in the compressive strength of the HS-FRM when increasing the cementitious material replacement ratio is attributed to the decrease in the production of free calcium hydroxide (CH) resulting from the hydration process between water and cement. Consequently, the generation of gelatinous calcium silicate hydrate (C-S-H) decreases, leading to weakened cohesion, and hence the compressive strength reduction. In addition, the relatively high specific surface area of CP and MK resulted in a greater interfacial transition zone (ITZ) area between the CP or MK and the other HS-FRM matrix ingredients. This diminished both the strength and toughness of the matrix.
Figure 9 and Table 4 and Table 5 illustrate the effect of MW on the HS-FRM mixtures containing 0% and 20% of CP or MK. The figure shows the compressive strength results at ages of 7, 28, and 90 days. When using MW, the compressive strength increased by only 2% at 7 days for the control HS-FRM and remained nearly constant or slightly decreases at both 28 and 90 days. When CP was used, it was observed that MW has a negative effect on the HS-FRM compressive strength at all ages, with a decrease of approximately 20% compared to the corresponding mixtures made with TW. However, the positive effect of MW was noted when MK was used, especially in the later ages of 28 and 90 days, where the compressive strength increased by 12% and 11%, respectively. These results are attributed to the ferric oxide element (Fe2O3) present in all cementitious materials used in this study. The Fe2O3 concentration is about 3.3, 1.70, 0.45, and 7.62 (wt %) in cement, MK, GGBFS, and CP, respectively. With the increase of Fe2O3, the effect of MW becomes either absent or negative on the HS-FRM compressive strength due to the attraction between these materials and MW. This attracted more water away from the cement and weakened the hydration process, and hence decreased the HS-FRM compressive strength. Previous research [48,49] has reported that MW has a positive effect when cement was the only binder in the concrete matrix; however, when cement was mixed with other binder materials containing higher Fe2O3 content, the results were affected by the attraction between MW and those materials. The positive effect of MW on the HS-FRM compressive strength in the case of utilizing MK is attributed to the broken clusters of water which accelerates the hydration process and allows for more CH production. These CHs react with MK particles and generate CSH gels which worked as a bridge for voids and increased the compressive strength [34,47].
Figure 10a and Table 4 show the effect of curing conditions on the HS-FRM compressive strength containing CP at 28 days. As shown in the figure, the compressive strength decreased when the HS-FRM was cured in air, sunlight, and seawater by 27%, 22%, and 13%, respectively, compared with conventional tap water curing. This implies that, when using cement or slag individually, the second best curing condition after tap water (conventional mortar curing) is seawater, as it has the least negative effect on the compressive strength compared to other curing conditions. However, when using CP in different contents ranging from 20% to 80%, it became evident that, at 20% CP, the compressive strength decreased in all applied curing conditions by a percentage ranged from 4% to 35%. At 40% CP, the HS-FRM compressive strength decreased by percentages ranged from 11% to 31%, making sunlight the optimal curing condition at this CP content. When the CP reached 60%, there was a reduction in the HS-FRM compressive strength up to 18%. For 80% CP, there was an observed increase in the compressive strength in all three curing conditions compared to the conventional tap water curing, with percentages ranged from 8% to 43%.
When using different contents of MK under various curing conditions, it became apparent that the HS-FRM compressive strength decreased when air curing was employed, as shown in Figure 10b and Table 4. This strength reduction was observed in the HS-FRM control mixture, as well as mixtures containing MK with 40%, 60%, and 80%, by percentages of 22%, 20%, 17%, and 37%, respectively, compared to conventional tap water curing. However, at 20% MK, there was a 5% increase in the compressive strength when cured in air. Using sunlight as an alternative curing method resulted in a decrease in the HS-FRM compressive strength ranging from 20% to 27% compared to the conventional tap water curing, regardless of the MK content. When seawater was used in curing the HS-FRM containing MK, it was observed that this curing condition had a relatively less significant effect on the compressive strength, as the strength decreased by up to 5% only, compared with the other applied curing conditions.
From the above results, it can be noted that the HS-FRM cured in tap water exhibited the highest compressive strength compared to other curing conditions. This is attributed to the fact that water curing facilitates the complete hydration process, imparting full strength to these mixtures by the age of 28 days. When air curing was employed, along with the use of CP or MK, there was no significant increase in the compressive strength. This was due to the lower cement content that caused less reliance on complete hydration in water, as in conventional curing conditions, especially when using MK [50,51]. However, the HS-FRM containing CP showed good compressive strength when cured in air, as there was sufficient internal moisture available, and hence the chemical reactions could proceed swiftly. The compressive strength enhancement when sunlight was utilized for curing (especially at 40% CP content) is attributed to the ability of sunlight to activate the chemical reactions within the matrix, and hence better strength.
Figure 10c and Table 4 illustrates the effect of different curing conditions on the HS-FRM made with MW. The results indicated that, when MW was used in the control HS-FRM mixture, the compressive strength increased by 9% and 6%, respectively, when cured in air and sunlight; while it decreased by 4% when seawater was used. When MW was used with the HS-FRM containing 20% CP, a decrease in the compressive strength by 29% and 26% was observed when cured in air and sunlight, respectively, compared to the corresponding HS-FRM cured in tap water. Conversely, a 54% increase in the compressive strength was noted when seawater curing was used compared to the corresponding HS-FRM cured in tap water. Similar results were obtained in the HS-FRM mixture containing 20% MK, with a decrease in the compressive resistance of 18% and 5%, respectively, when cured with air and sunlight, but the strength increased by 21% when seawater curing was used. The increase in the compressive strength when MW was used with seawater refers to two reasons: (1) MW allows for more water to penetrate the cement particles and then more CH is produced, which results in more CSH that fills the pores and voids; (2) the presence of Na+, Cl, Mg2+, and Ca2+ ions in seawater enhances the properties of concrete by accelerating the hydration of cement. This acceleration leads to an increase in the content of CH, which is available for pozzolanic reaction with supplementary cementitious materials (such as CP and MK), resulting in the formation of more CSH in the HS-FRM. The interaction between CP/MK and seawater during the curing time facilitates the formation of Friedel’s salt. Higher compressive strength could be achieved by densifying the microstructure and enhancing the integrity of the hydrated cementitious materials by the production of Friedel’s salt [52].

3.2.2. Flexural Strength

Figure 11 and Table 4 illustrates the effect of different contents of CP and MK, as well as MW, on the flexural strength of the HS-FRM. The figure indicates that the flexural strength decreased by 35%, 4%, 42%, and 47% when CP replaced the cementitious materials by 20%, 40%, 60%, and 80%, respectively, compared to the control HS-FRM mixture. Similarly, the flexural strength decreased by 29%, 53%, and 47% when MK was used at 20%, 60%, and 80%, respectively, while it increased by 4% when MK was used at 40%. The decrease in the flexural strength at CP or MK contents of 20%, 60%, and 80% is attributed to the lower cement content in these mixtures, resulting in low content of CH and consequently low presence of CSH. However, at a CP or MK content of 40%, the flexural strength slightly improved due to the high proportion of fibers immersed in the cementitious matrix at this ratio, leading to an overall enhancement in the flexural strength.
When using MW, it was evident that the flexural strength significantly improved by 56%, 81%, and 36%, respectively, for the control mix, 20% for the CP mix, and 20% for the MK mix. This improvement is attributed to the ability of MW to allow deeper penetration into cement particles which enhances the hydration reaction due to the disruption of water bonds caused by the magnetic field. In addition, the high fiber content in the HS-FRM significantly interacted with the cement matrix in the presence of MW.

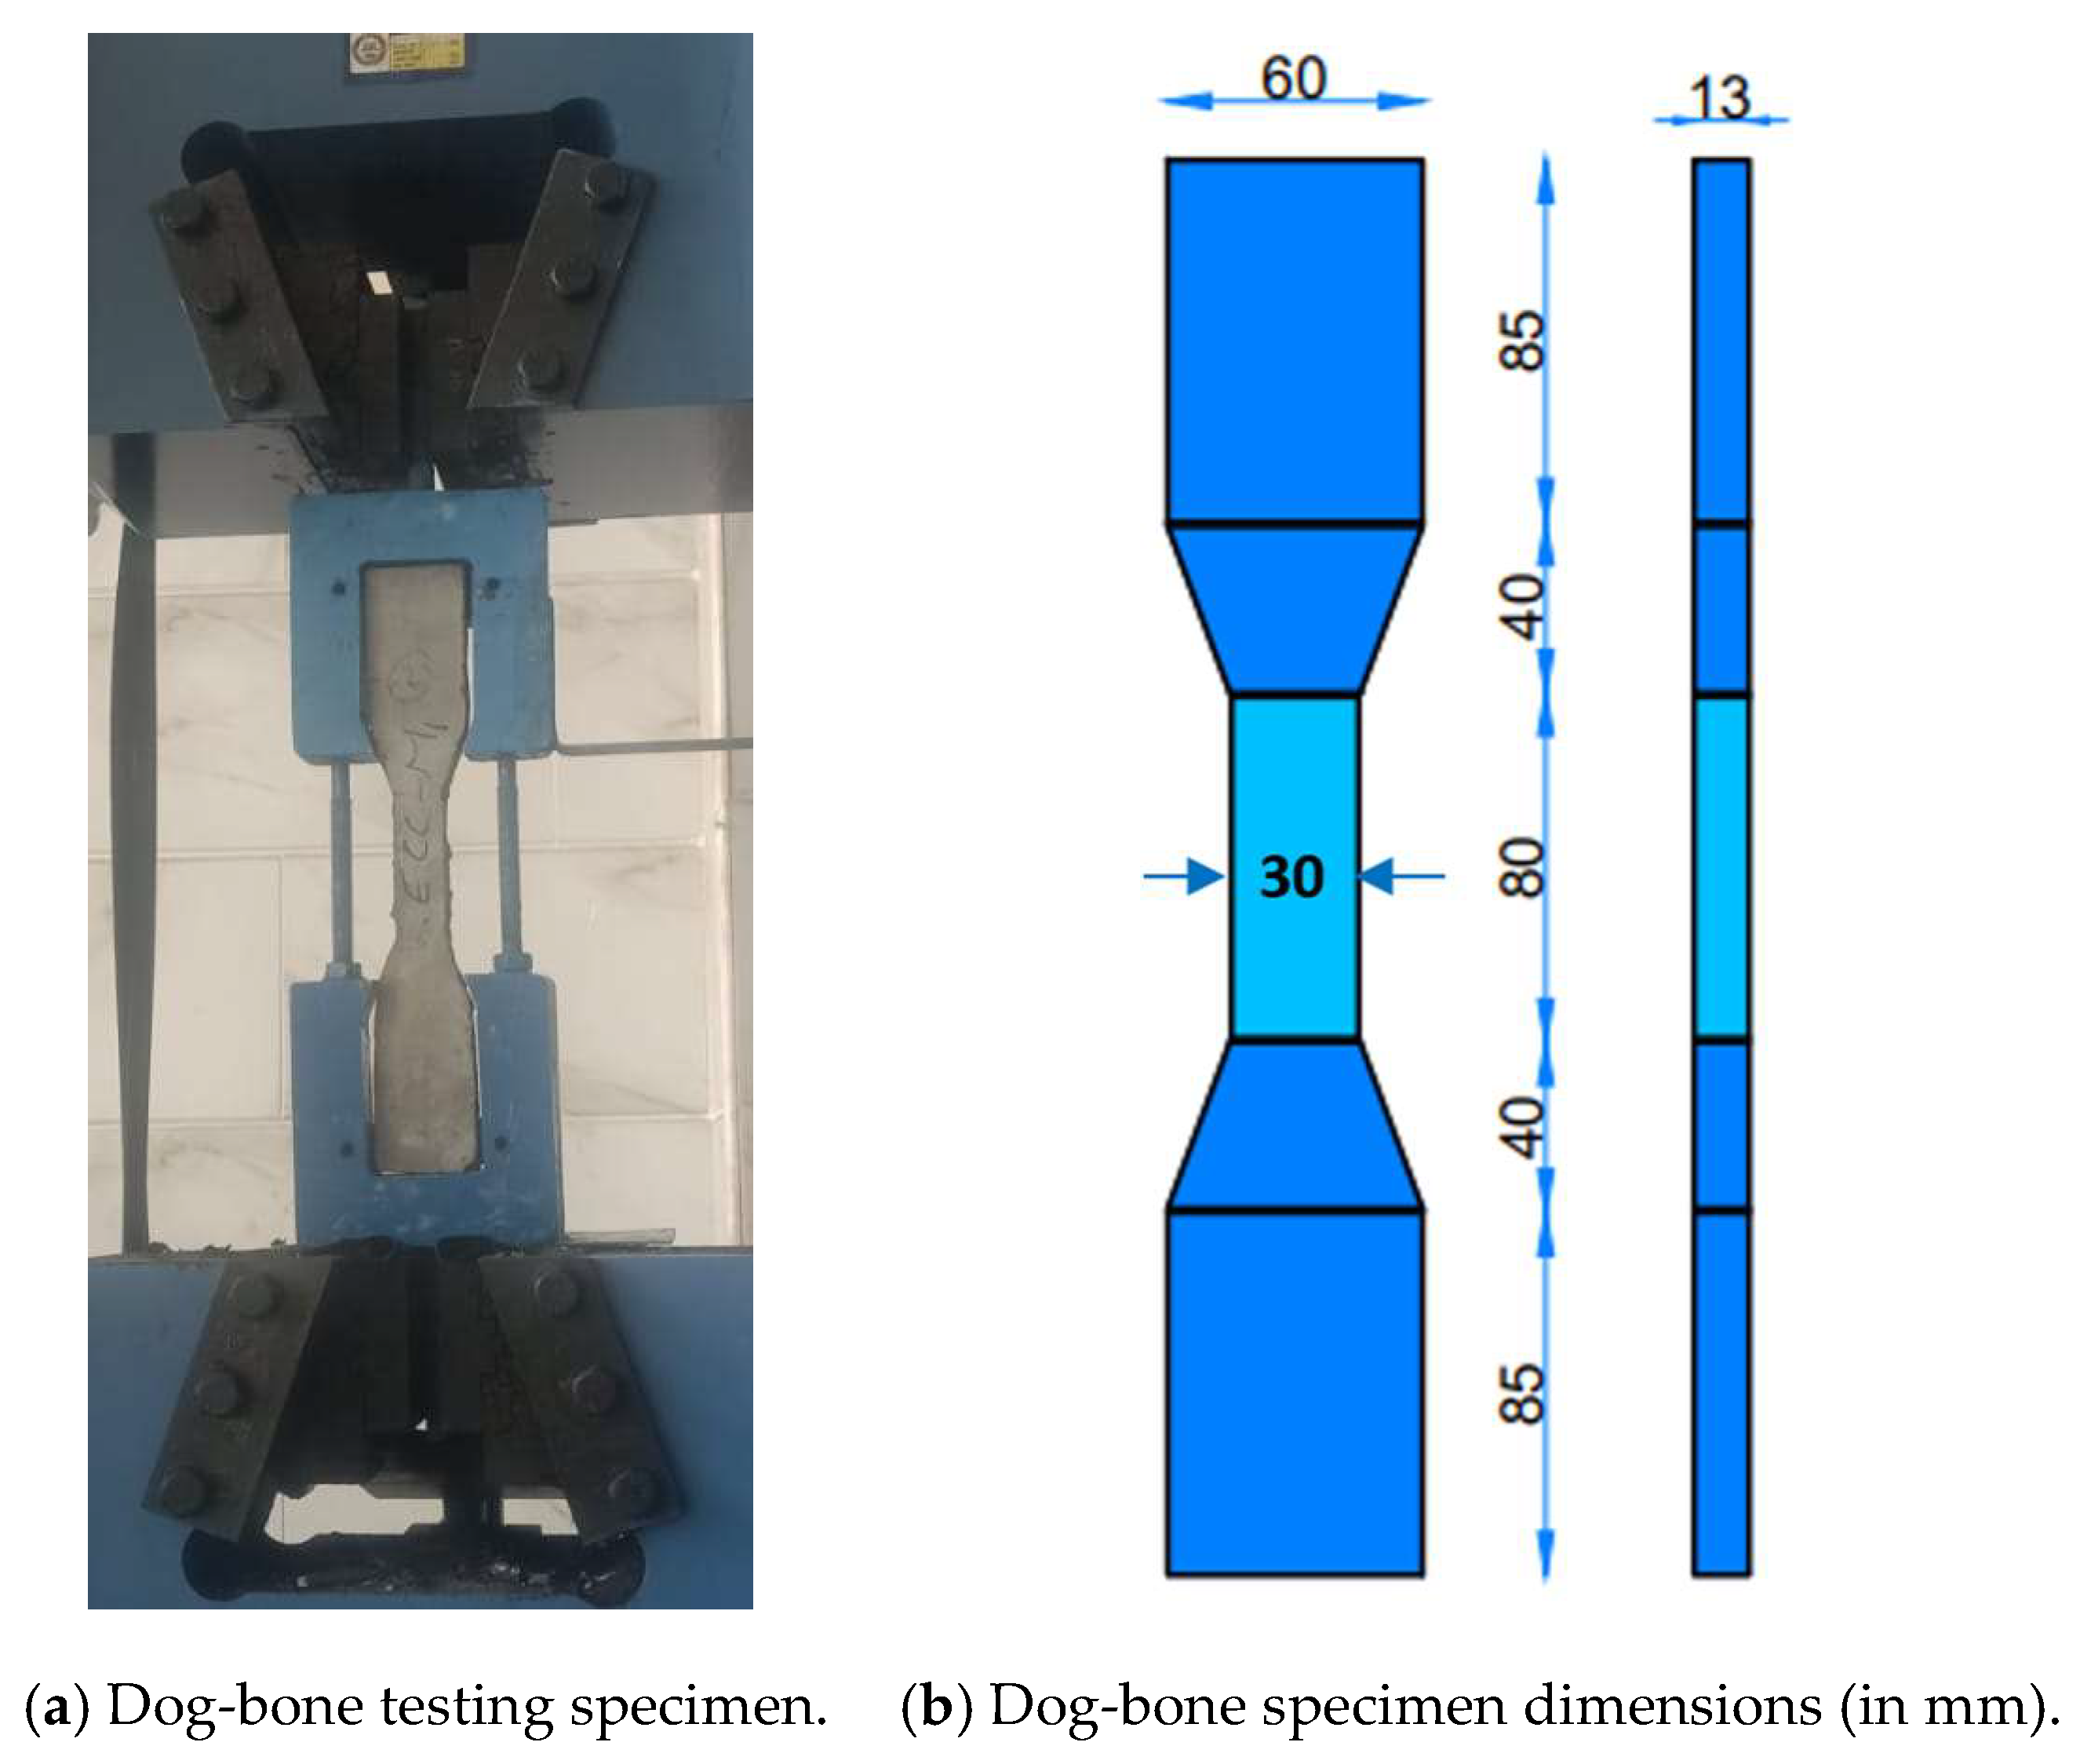
3.2.3. Tensile Strength

Figure 12 and Table 4 illustrate the effect of substituting 20% of cement by CP and MK, as well as MW, on the uniaxial tensile strength of the HS-FRM. The figure demonstrates a decrease in the uniaxial tensile strength when 20% CP or MK were used, with reductions of 19% and 30%, respectively, compared with the control mix. However, when MW was used, there was an increase in the tensile strength by 7%, 12%, and 8%, respectively, compared to the corresponding mixtures made with TW. This tensile strength increase is attributed to the enhanced hydration reaction due to the presence of MW, as well as the high fiber content which reinforces the cementitious matrix, resulting in an overall increase in the tensile strength.

3.3. Durability Properties

3.3.1. Water Absorption

The water absorption rate of the HS-FRM mixtures is shown in Figure 13. The water absorption rate of the control HS-FRM was 3.33%, and decreased in mixtures containing 20% CP, where the water absorption rate reached 3.09%. As the content of CP increased, the water absorption rate gradually increased to 8.32% at 80% CP. These results correspond with the relevant compressive strength results at 28 days, as higher water absorption rates correlated with a lower compressive strength due to the presence of voids, especially in mixtures with high contents of CP. This was due to the hydration between CH and cement at higher ratios of CP resulting in less CSH in pores and voids. When MK was used, the water absorption rate slightly increased at different contents, where it was 4.27%, 5.67%, 6.37%, and 6.37% at MK contents of 20%, 40%, 60%, and 80%, respectively. The slight increase in the water absorption rate when using MK is due to the dense structure of the cement paste occurring as the concentration of cementitious products from binder hydration increases, leading to a reduction in pore volume within the structure.
When using MW, an increase in the absorption rate was observed. For the control mixture, the water absorption increased 21%. However, MW decreased the water absorption of 20% CP and 20% MK mixtures by 24% and 23%, respectively. This explains the increase in the compressive strength in that mixture when using MW, where the void ratio decreased due to the dense consistency resulting from the increased hydration rate and increased C-S-H gels caused by using MW.

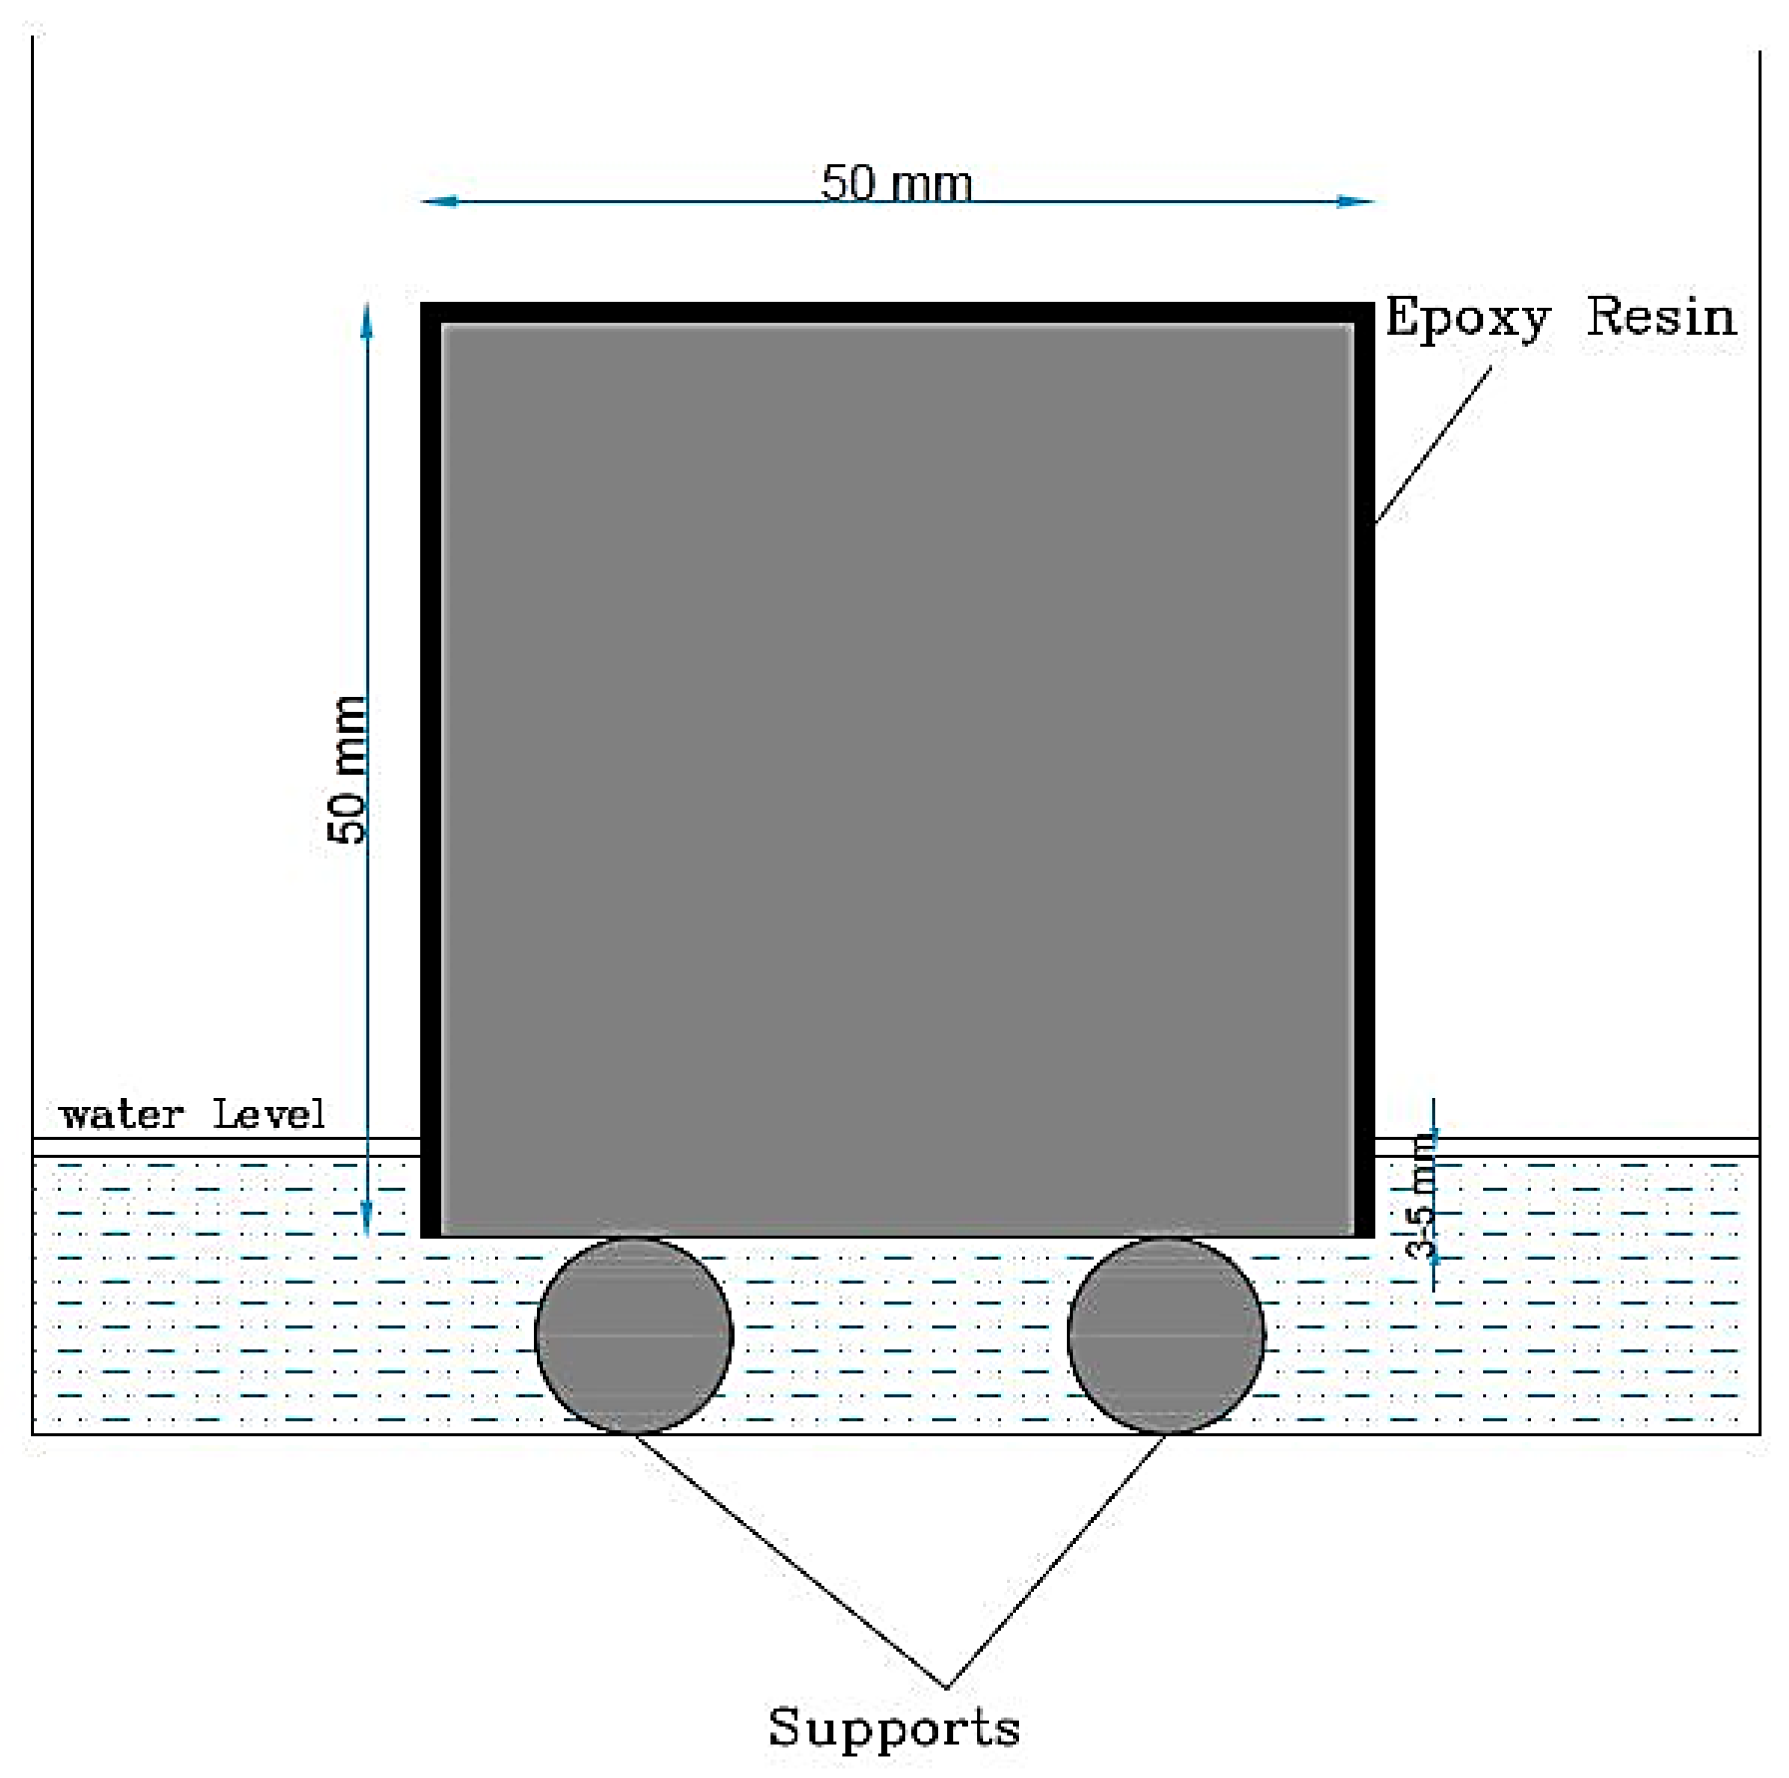
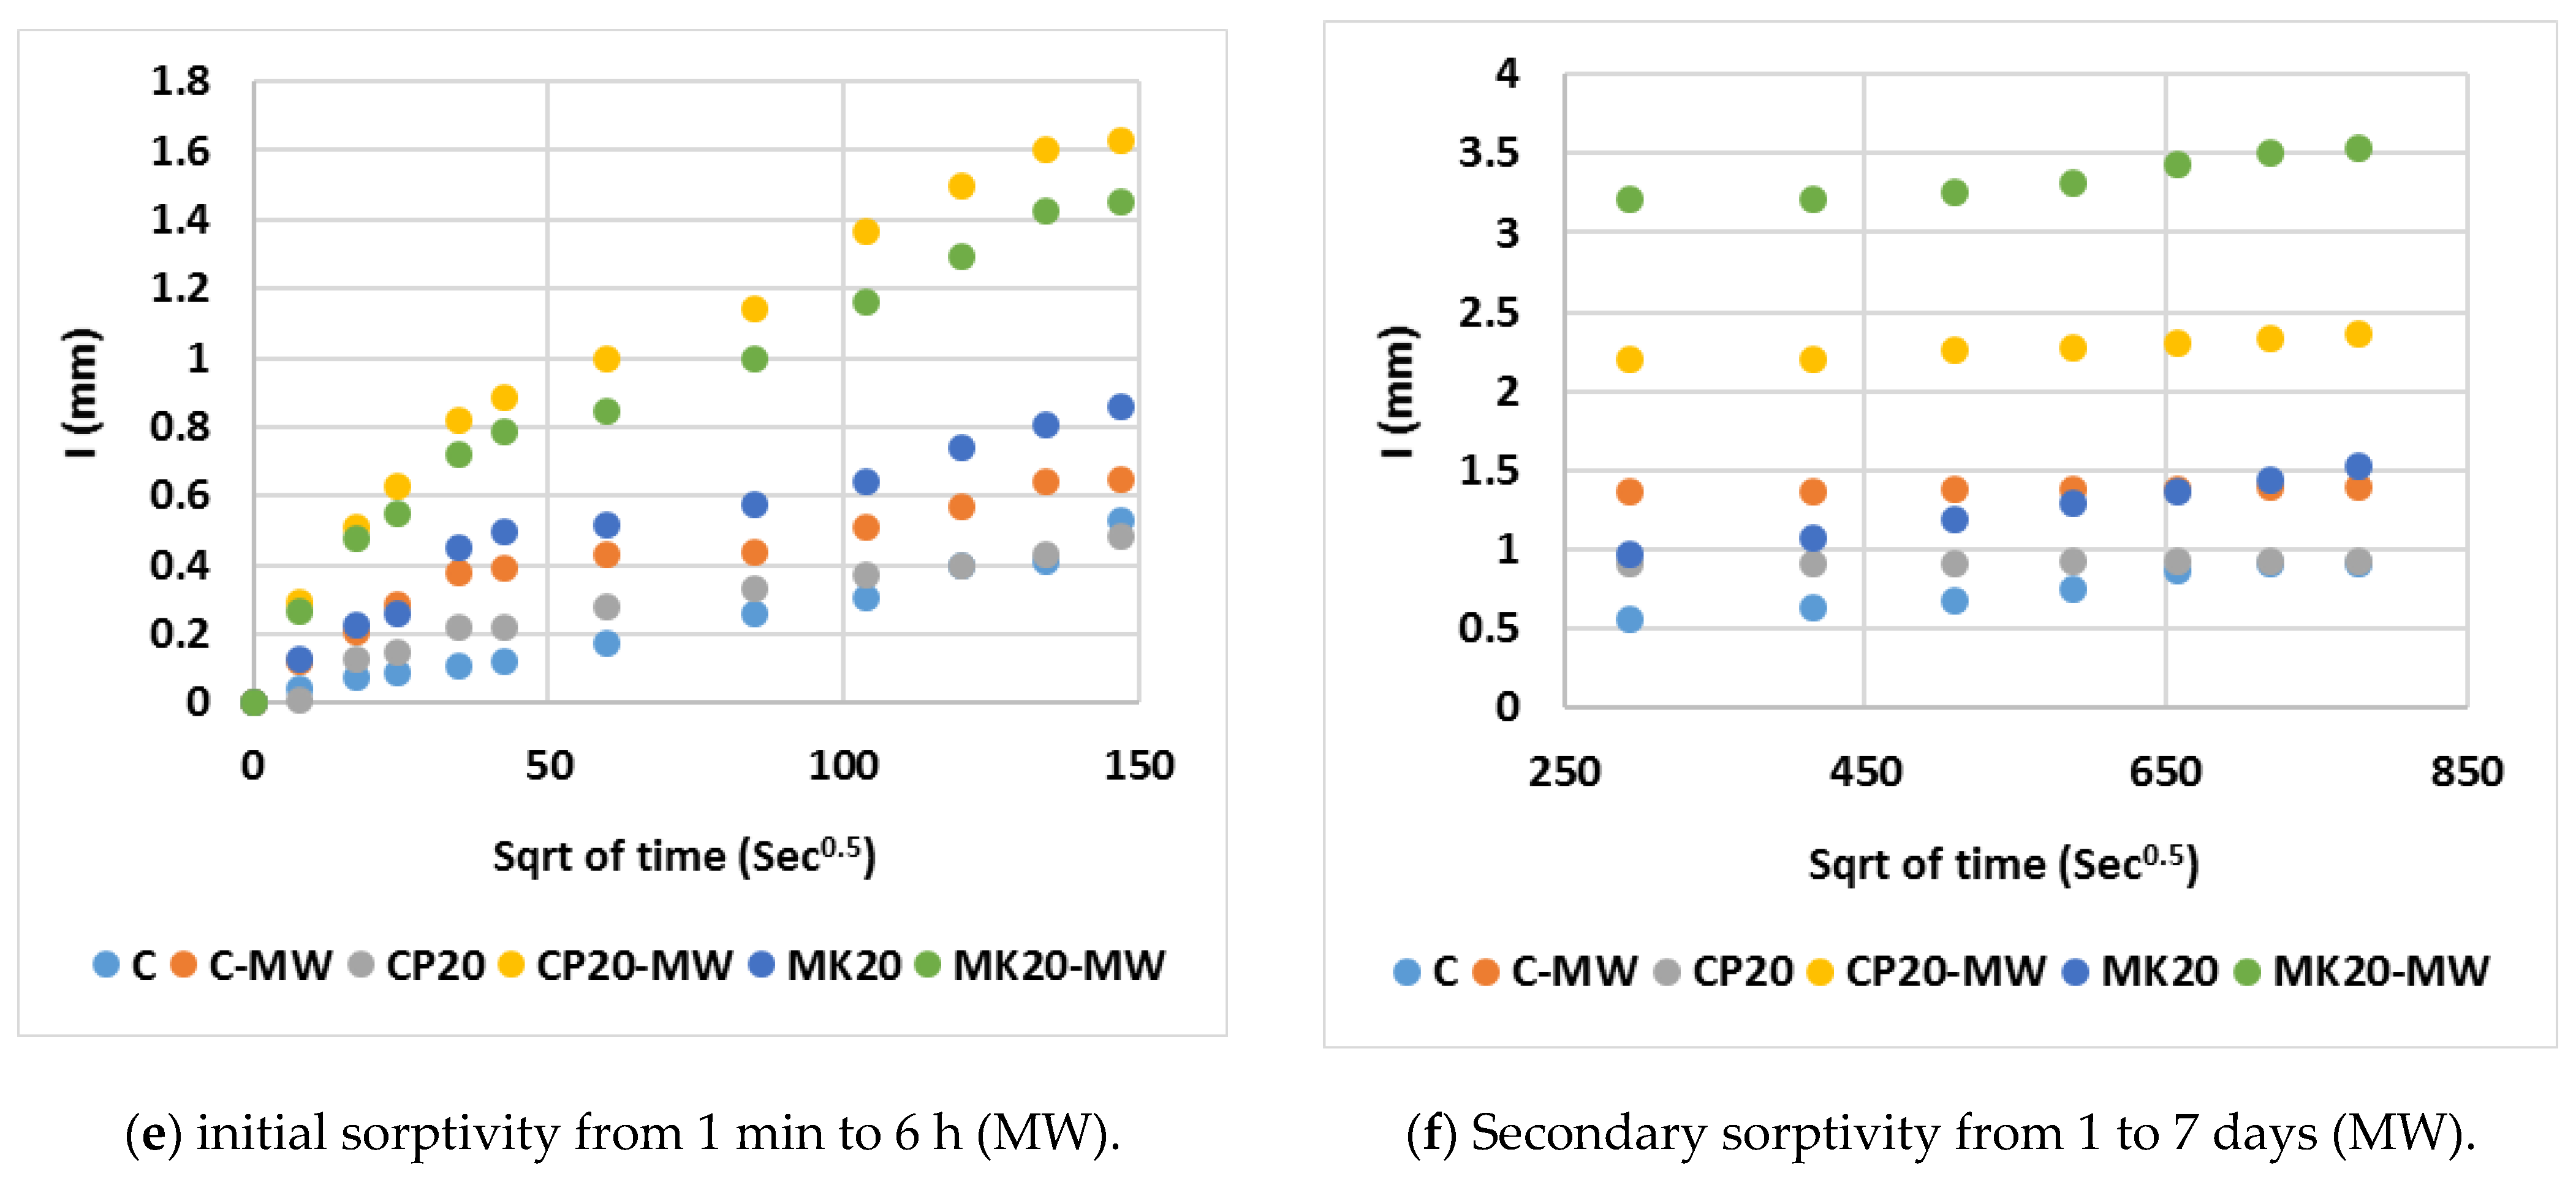
3.3.2. Sorptivity Assessment

Table 6 outlines the average water absorption and sorptivity coefficients. Figure 14 plots the mean cumulative water absorption per unit area against the square root of time. As evident from the figures, the rate of water absorption (sorptivity index) was initially rapid during the test, and gradually decreased over time. The absorption began with a swift saturation of numerous capillary pores near the surface of the immersed specimen, succeeded by a rapid filling of finer pores situated further away from the immersed surface. These results confirm the findings of both the compressive strength and water absorption rate using the conventional tap water curing method. It was observed that, as the substitution ratio of cement increased, the HS-FRM sorptivity increased, especially in the early ages from 0 to 6 h. This is due to the presence of voids caused by the low cement content and consequently low gel materials (CSH). Subsequently, there was a stabilization to some extent in the sorptivity in ages from 1 to 7 days because the voids in early ages had already been filled with absorbed water. It was observed also that the rate of absorption of the HS-FRM containing 80% MK was higher than the corresponding mix containing 80% CP. This is due to the high number of pores and voids in these mixes which allows for more water absorption.

3.4. Microstructure Analyses

3.4.1. Scanning Electronic Microscope (SEM)

Figure 15 illustrates the fracture surface morphology of the HS-FRM containing 0% and 20% of both MK and CP, where TW and MW were used. In the control mixture, whether TW or MW was used, noticeable pores were observed when using TW, separating the hydration products from the GF, along with a significant number of CH and C-S-H crystals. However, when using MW in the control mixture C, these pores turned into microcracks. The existence of these pores or microcracks explains the stability of the compressive strength when using both TW and MW. In the CP20 mixture, numerous CH crystals were also observed when using TW. These crystals react with CP to produce C-S-H, as seen in Figure 15c. However, in the CP20-MW mixture, as shown in Figure 15d, the weak surface representing the interfacial transition zone ITZ of the HS-FRM is evident due to the accumulation of CH particles around the surface, explaining the decrease in the compressive strength using MW compared to ordinary TW. In Figure 15e,f, the ability of MW to increase the compressive strength in the mixture containing 20% MK is evident. This is due to the reduction in pores and the relatively high presence of C-S-H crystals when using MW compared to TW, leading to greater immersion of GF in the cementitious matrix, which explains the positive impact on the compressive strength using MK.

3.4.2. Energy Dispersive X-Ray (EDX) Spectroscopy

Table 7 and Figure 16 show the results of the EDX test, which illustrates the presence of chemical elements in the same mixtures previously scanned in the SEM analysis. As can be seen in the figure, the higher the Ca/Si ratio, the lower the compressive strength. This is because these elements are specifically responsible of developing the HS-FRM compressive strength, as they are involved in the formation of chemical productions during the hydration process. For the C and C-MW mixtures, the Ca/Si ratios were 3.88 and 3.55, respectively, which are quite similar. In the CP20 and CP20-MW mixtures, the Ca/Si ratio increased slightly with the use of MW, which explains the slight decrease in the compressive strength in this mixture compared to its counterpart made with TW. In the MK20 and MK20-MW mixtures, the Ca/Si ratio decreased with the use of MW, indicating a higher presence of CSH compared to CH. This interprets the increase in the corresponding compressive strength because CSH is responsible for providing strength to the cementitious matrix.

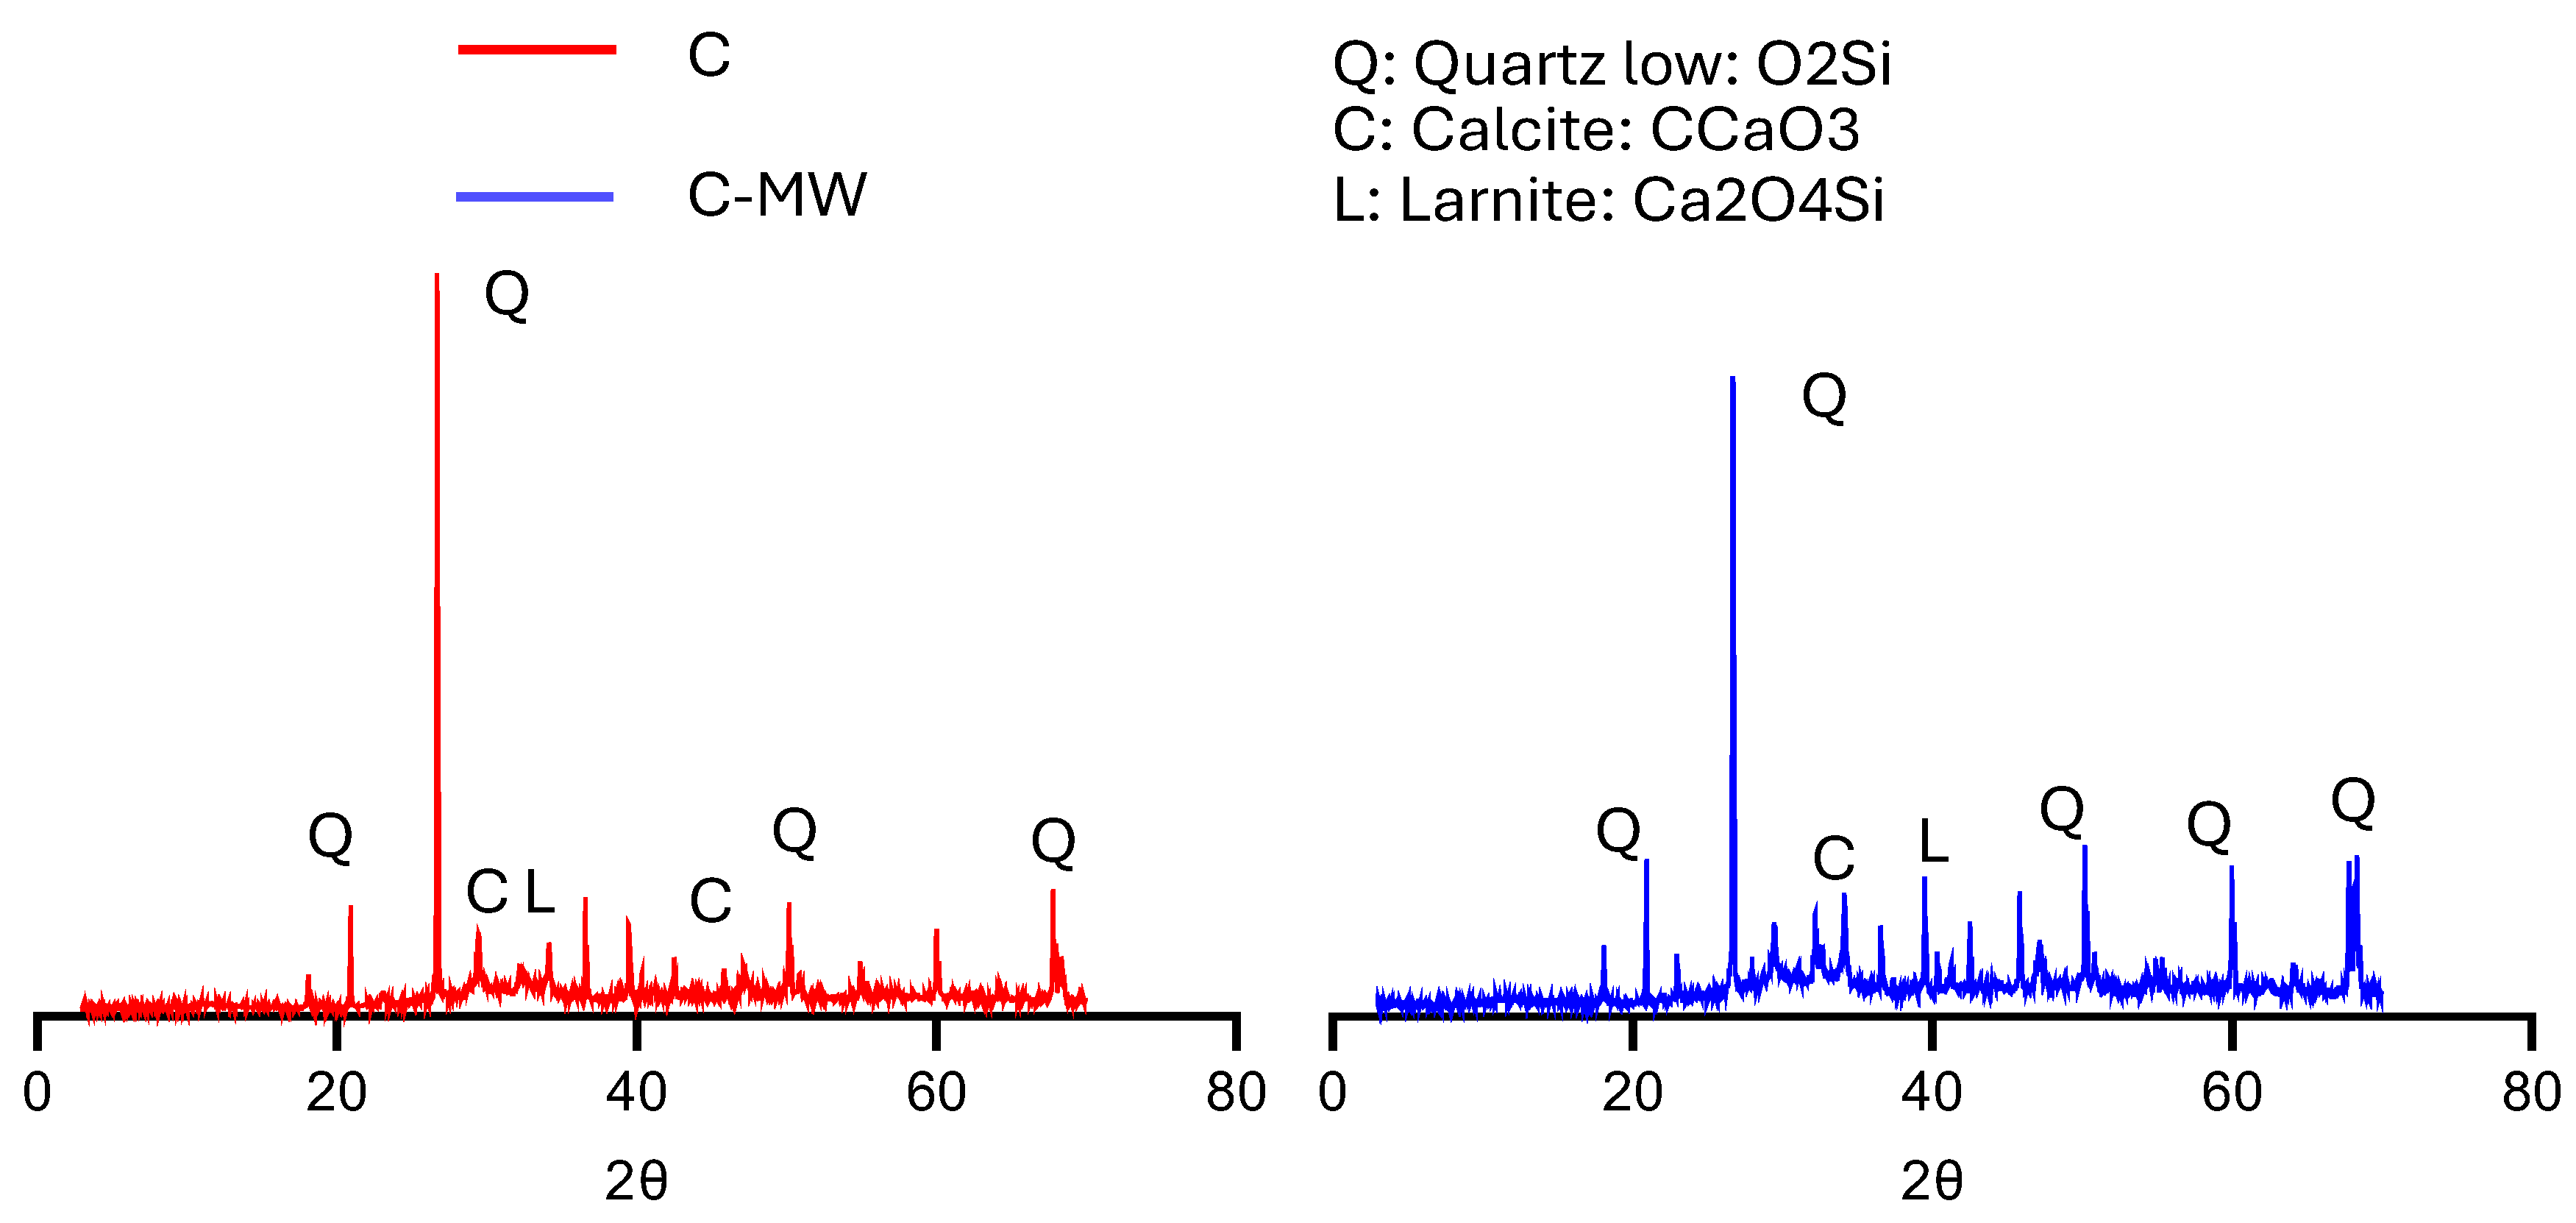
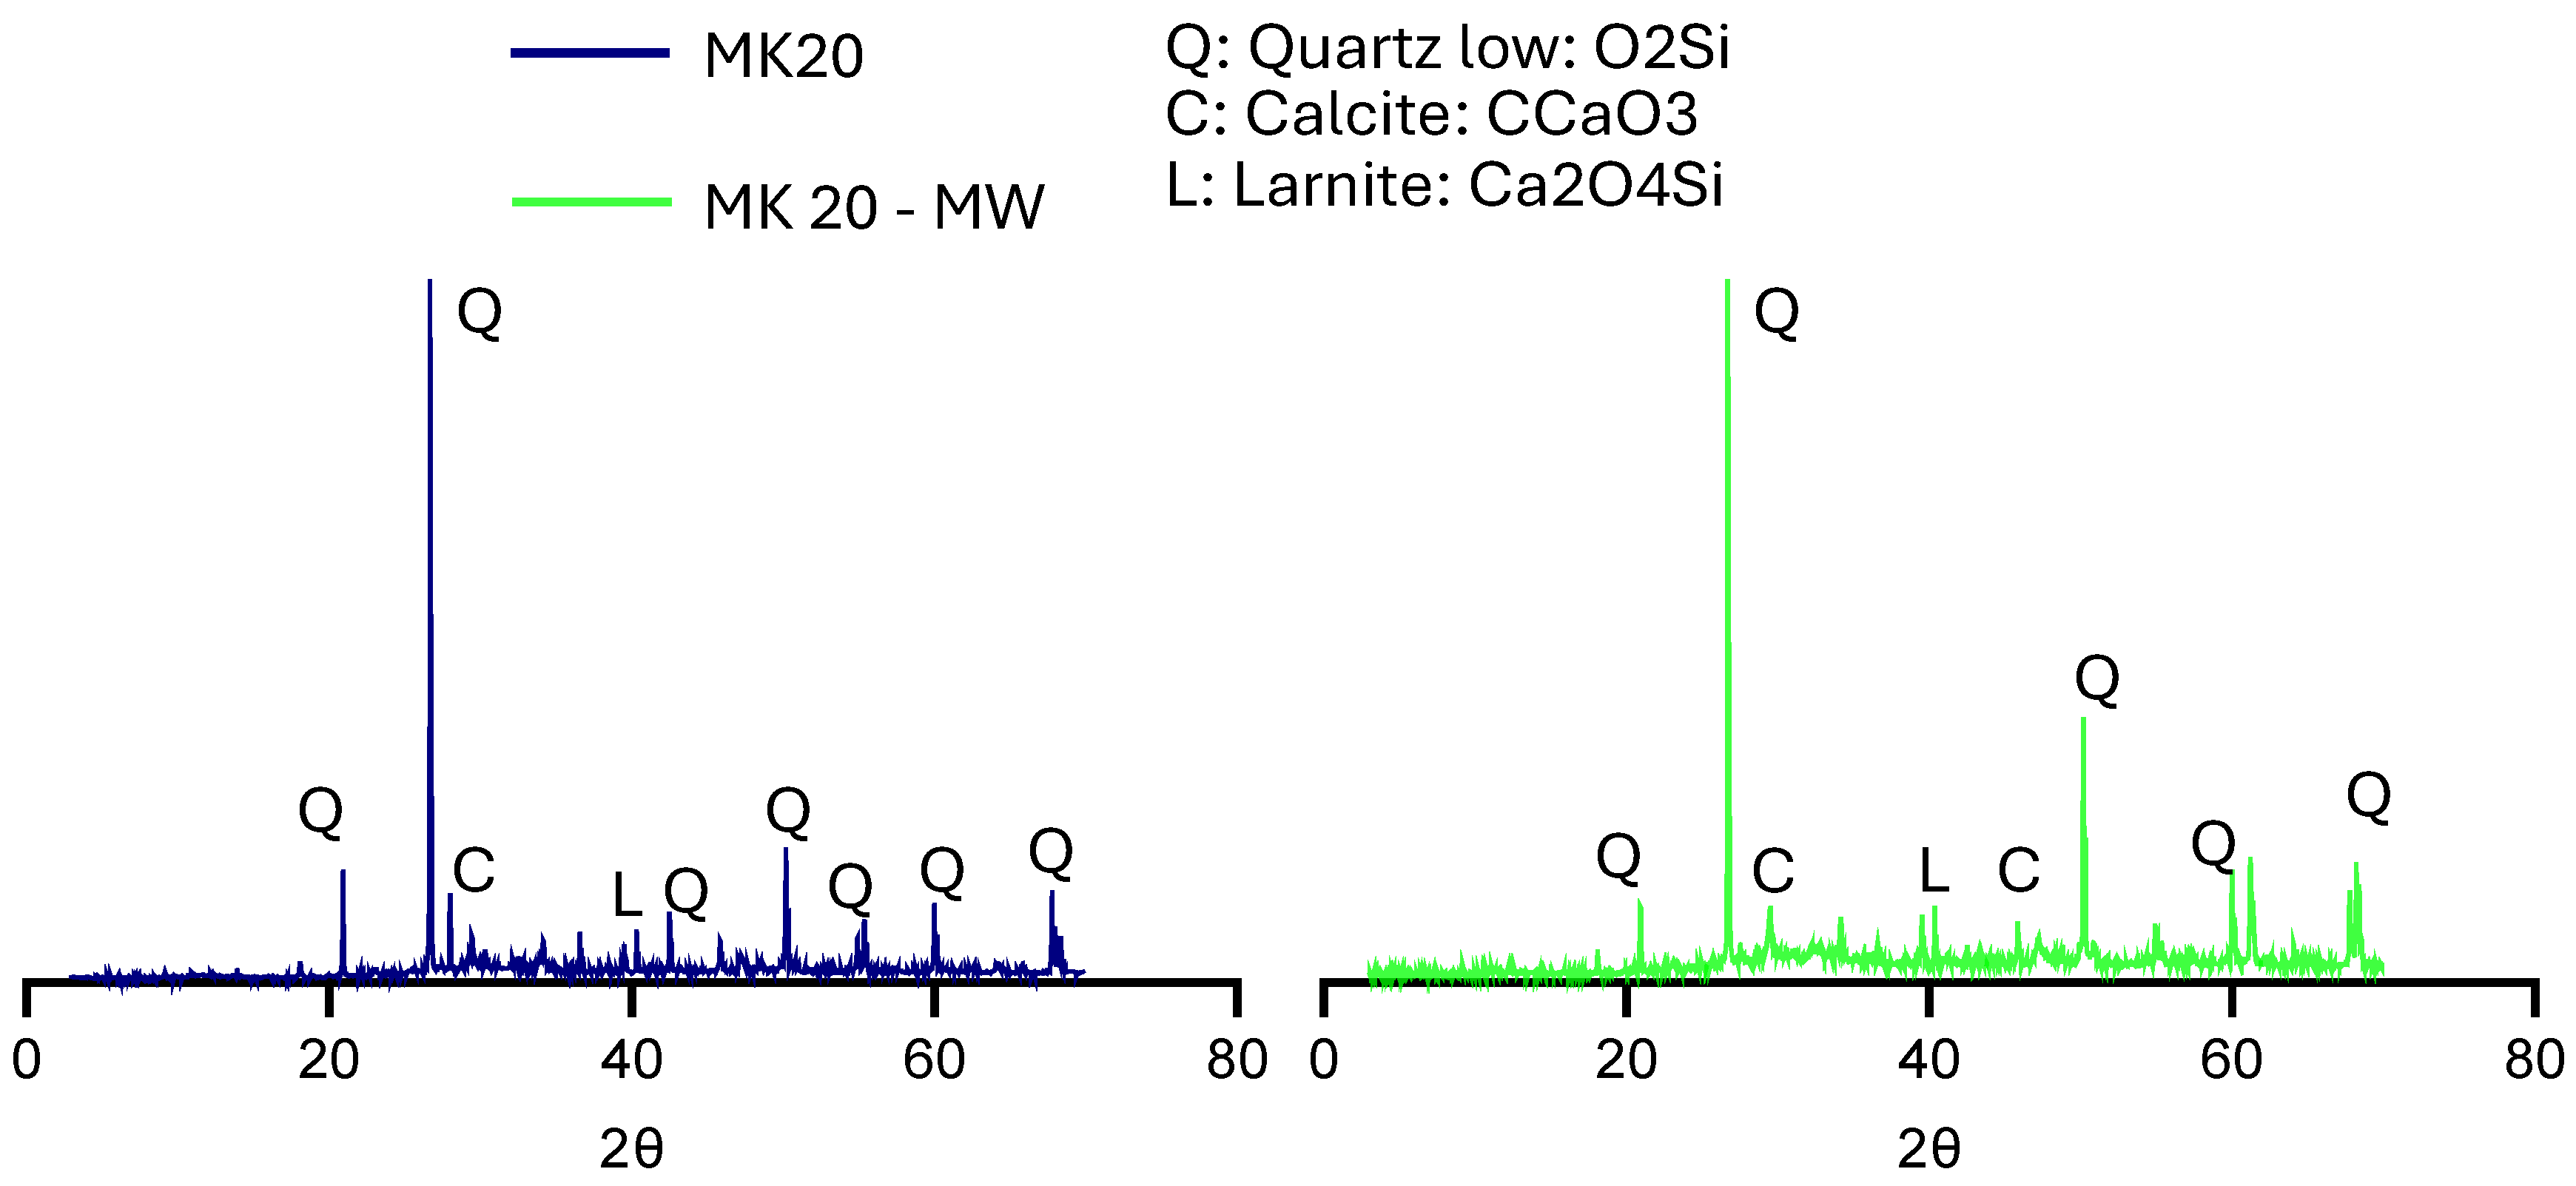
3.4.3. X-Ray Diffraction (XRD)

Figure 17 shows the XRD patterns of hydration products of control mixtures made with TW or MW at 28 days. The X-axis represents the diffraction angle (2θ) in degrees, while the Y-axis represents the intensity (arbitrary units) of the diffracted X-ray beam. The intensity peaks correspond to the crystallographic planes within the mineral phases present in the concrete samples. The diffraction peaks observed in both systems were notably consistent, primarily comprising phases, such as quartz (SiO2) “Q”, calcite (CaCO3) “C”, and larnite (calcium silicate) “L”, in all cases. However, the differences are in their intensity and presence. The mix made with TW (C mix) showed the strong peaks of quartz (SiO2) at around 26° and 50°, and the characteristics of alpha-quartz (the most common polymorph of quartz). However, the mix made with MW (C-MW mix) showed the strong peaks of calcite (CaCO3) at around 29° and 43°, and the characteristics of calcite (a common polymorph of calcium carbonate). This elucidates the compressive strength and workability results of the control concrete with TW and MW, and sheds light on the impact of MW on the hydration products and their interaction with quartz. The quartz mineral enhances the concrete’s microstructure, reduces the pores, and increases its density; however, it simultaneously affects the concrete’s workability.
The XRD patterns of hydration products of both samples (Figure 18) show the effect of CP as a pozzolanic material with TW or MW as a mixing water on the various properties of concrete. The use of TW shows higher peaks for all minerals compared to the use of MW. These XRD patterns prove the results of fresh, mechanical, and workability of the corresponding mixtures, especially the early strength, as larnite can hydrate faster than other components in concrete, potentially leading to earlier strength development. Figure 19 depicts the XRD patterns of the HS-FRM containing MK with TW or MW. As shown, MW was able to improve the microstructure of the mixtures, and it showed higher peaks of Q, C, and L compared to mixture made with TW. This interprets why the compressive strength when using MW was higher than that of TW at 28 days, due to the effect of Q in enhancing the microstructure of concrete.
In summary, using CP or MK as a pozzolanic material has a great influence in enhancing the microstructure of mortar by reducing the amount of C and L, as evident by the XRD analysis. Conversely, the XRD results revealed that the utilization of MW has a limited impact, both positive and negative, on the enhancement of the molecular structure of mortar.

4. Conclusions

The purpose of this research is to develop sustainable HS-FRM utilizing high contents of innovative binder ingredients, such as CP and MK, with and without MW as mixing water. The effects of four curing conditions (tap water, sea water, sunlight, and air) on the HS-FRM performance were also explored. Compressive strength, uniaxial tensile strength, flexural strength, durability properties, and microstructure analyses were used in the assessment of the proposed HS-FRM. The following points summarize the key conclusions of this research:
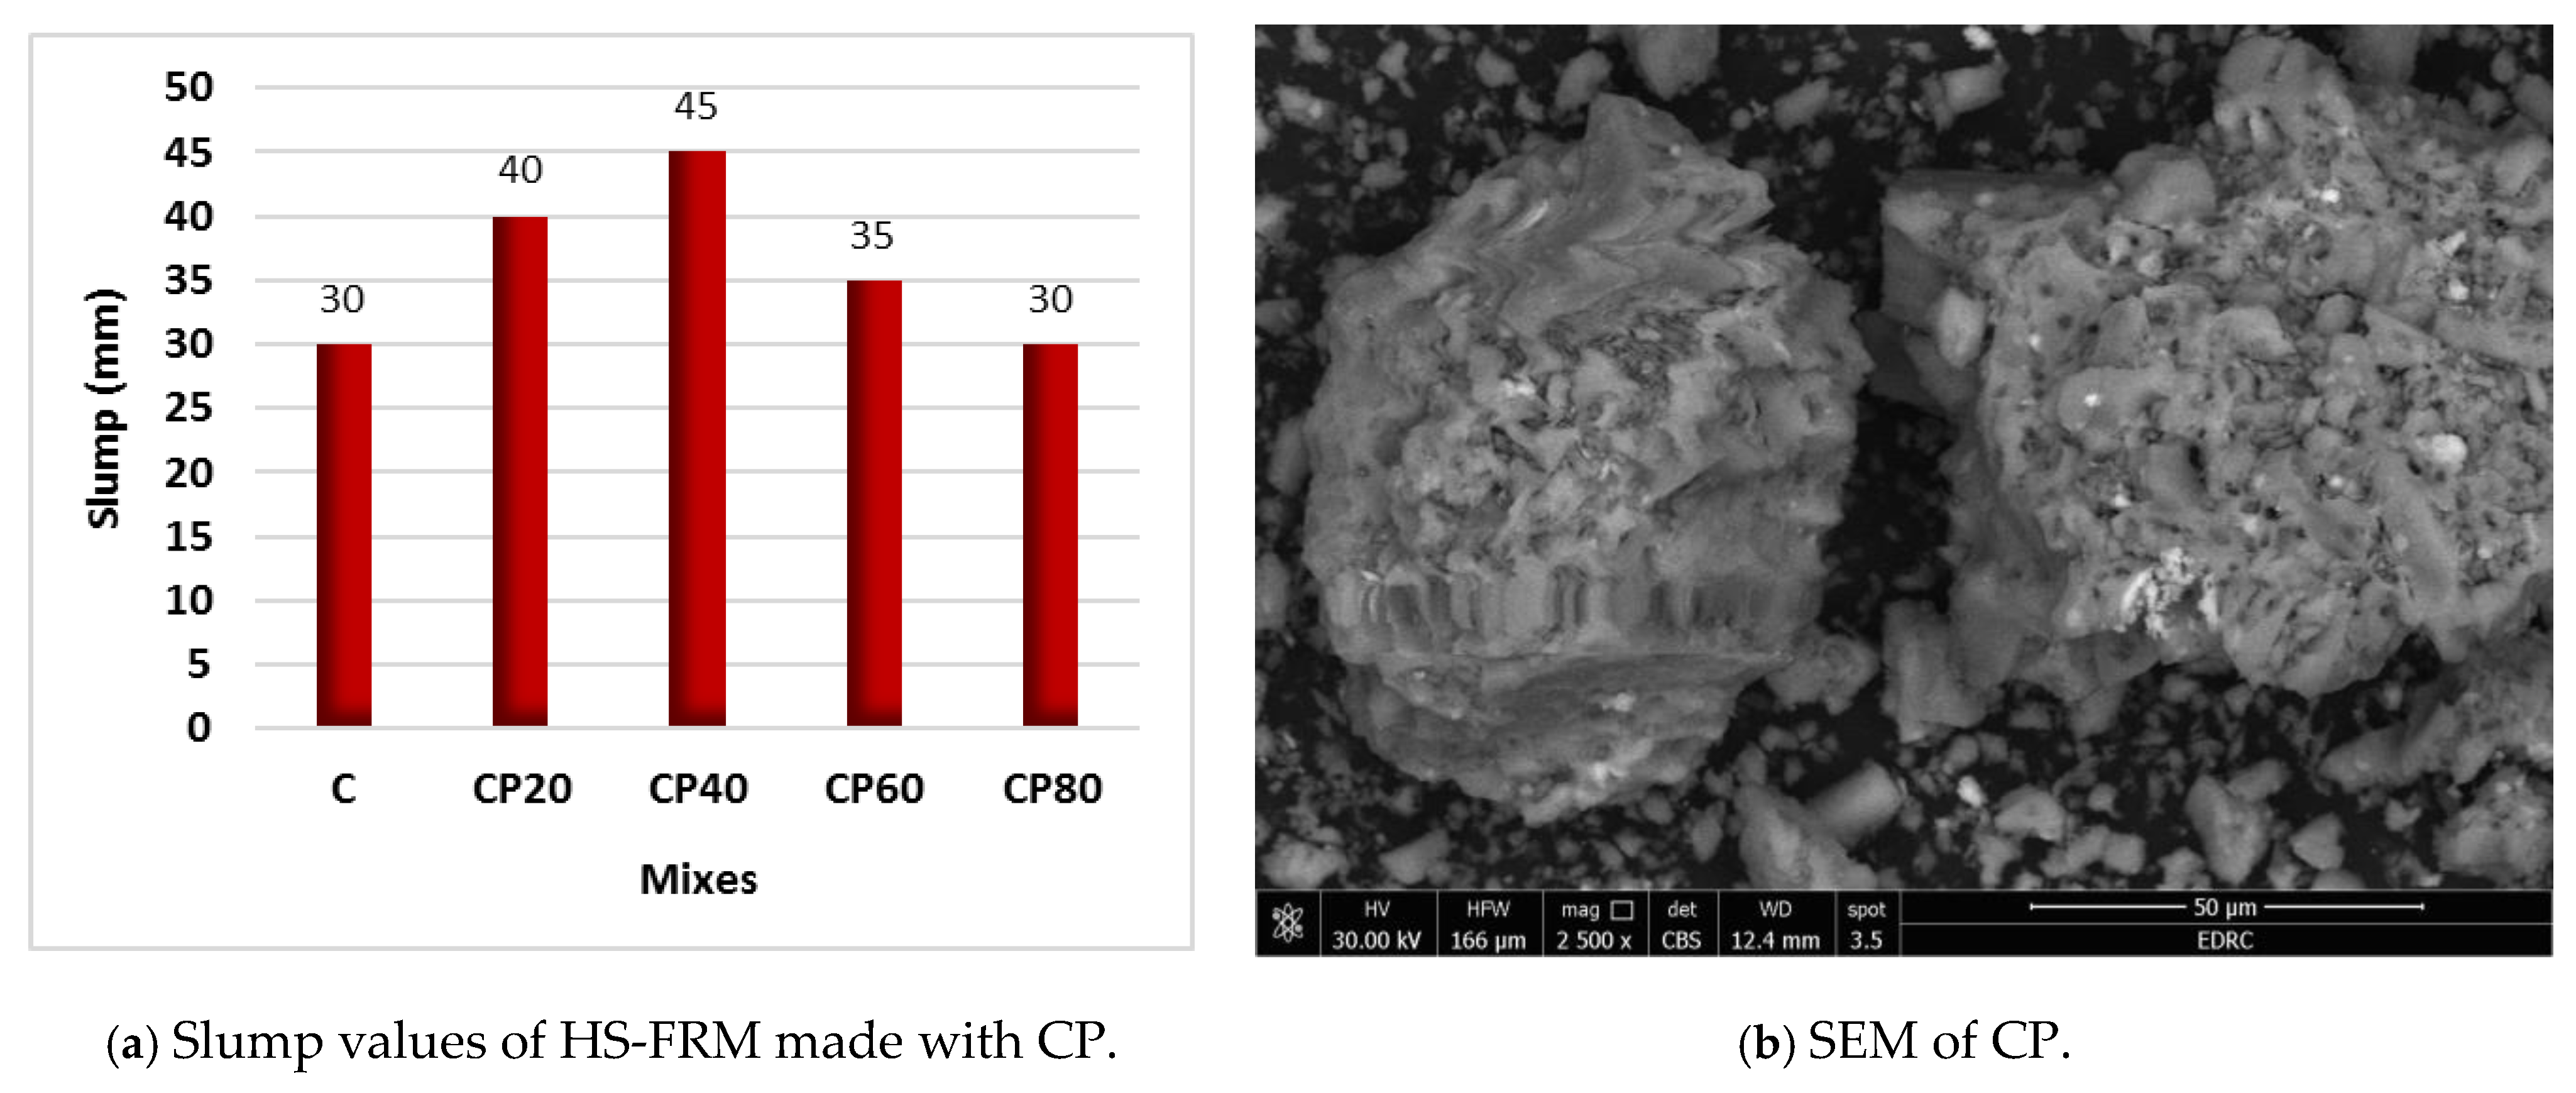
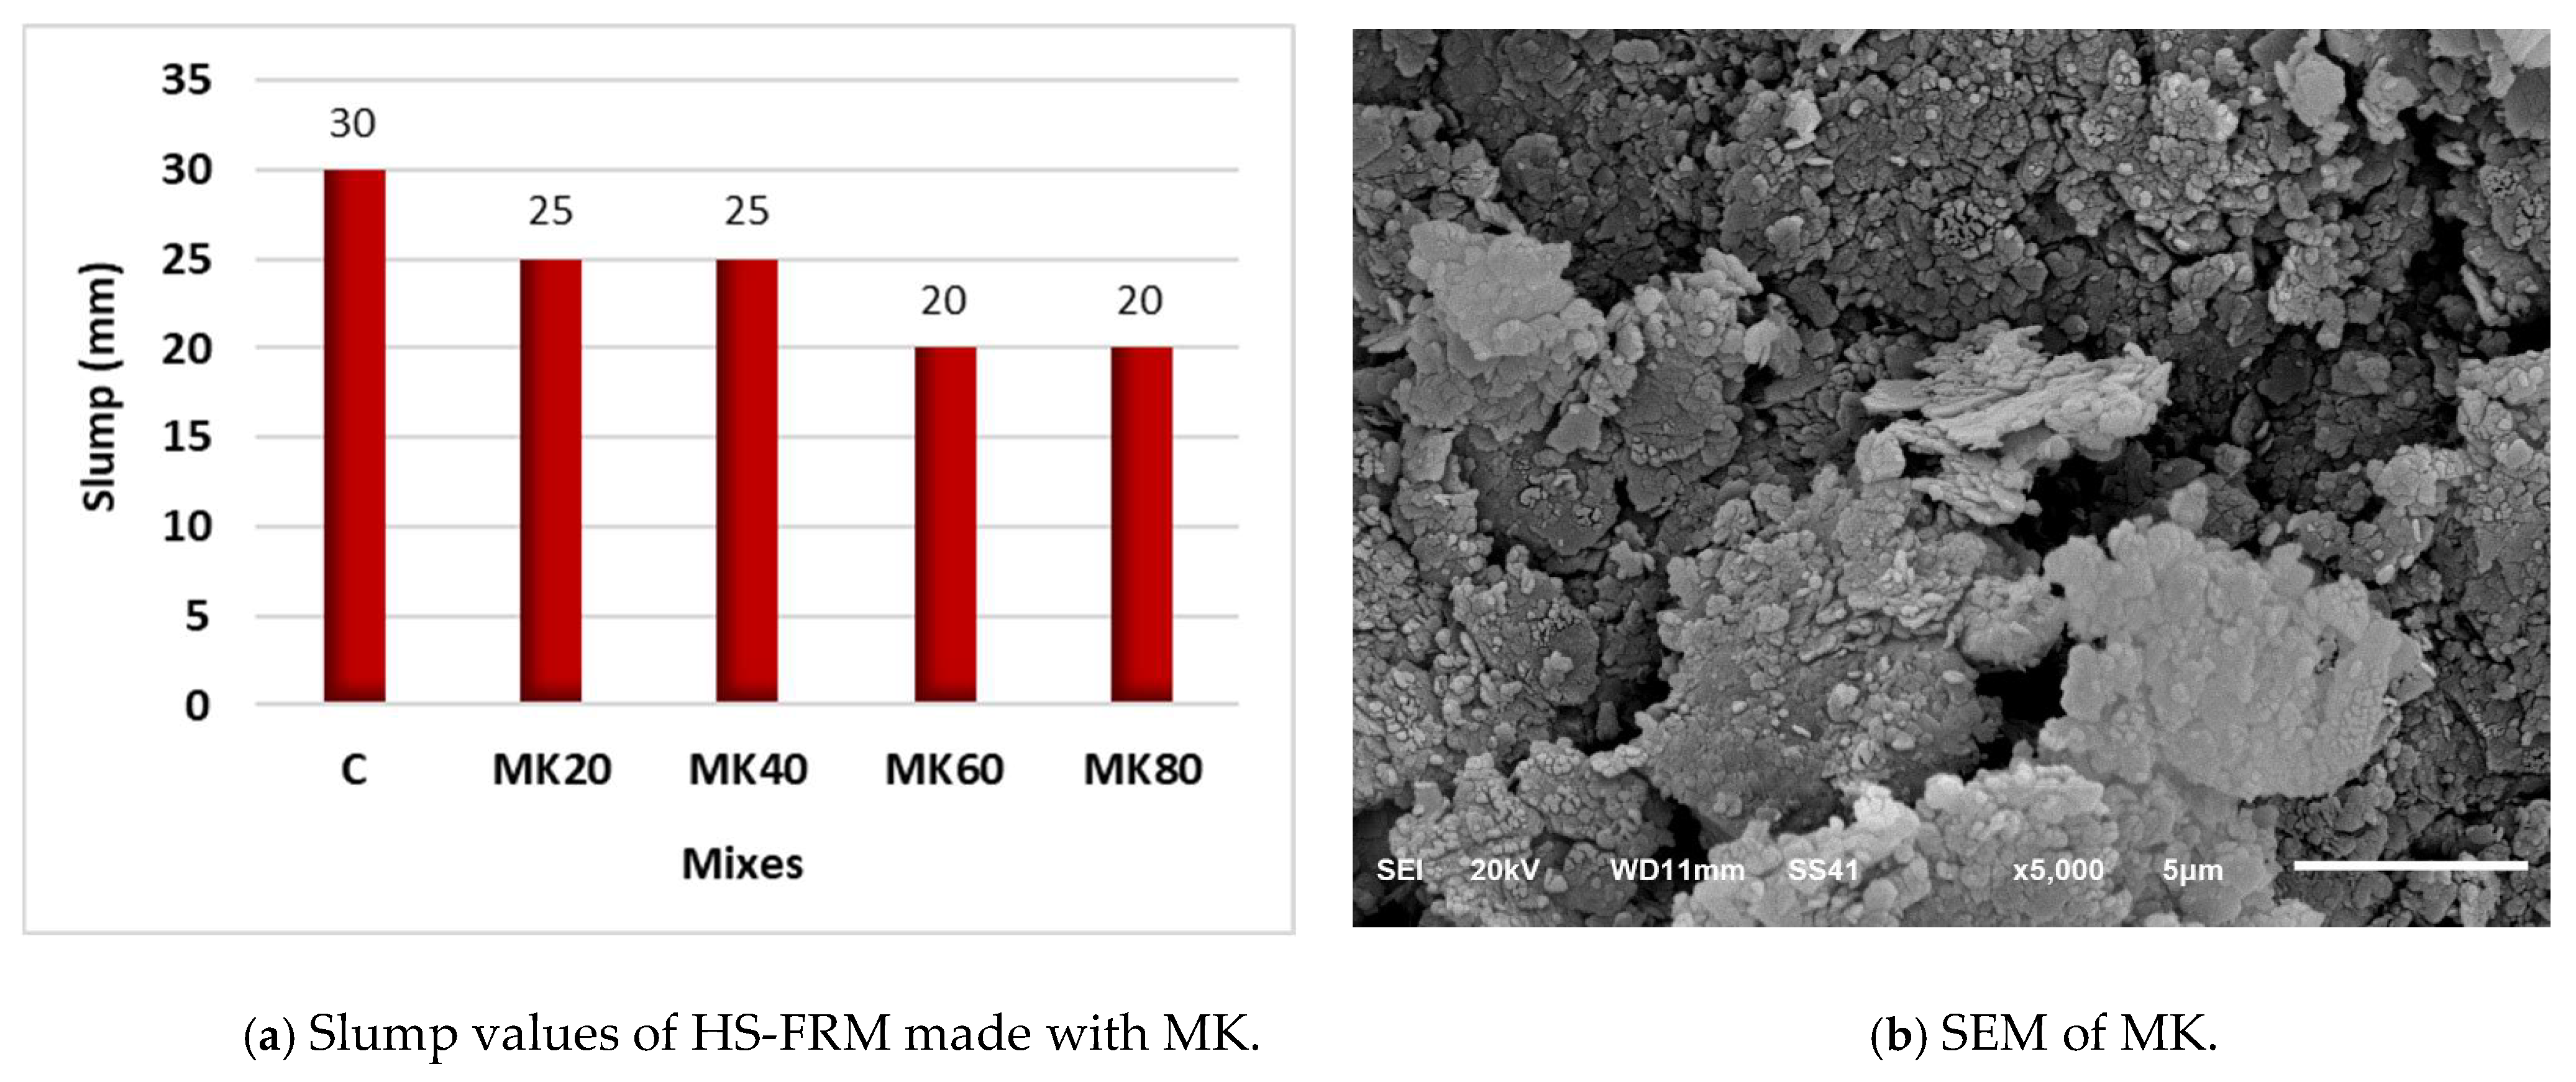
  • Increasing the CP content in the HS-FRM up to 40% showed a slump increase by up to 50%. Using more than 40% CP in the HS-FRM decreased its slump which reached to a 78% decrease compared with the conventional HS-FRM. The used of up to 80% MK in producing the HS-FRM showed the same or less slump (by up to 33%) than that of the conventional HS-FRM. The MW was able to significantly improve the slump of the conventional HS-FRM, CP20, and MK20 by 2, 3.25, 2.4 times, respectively.
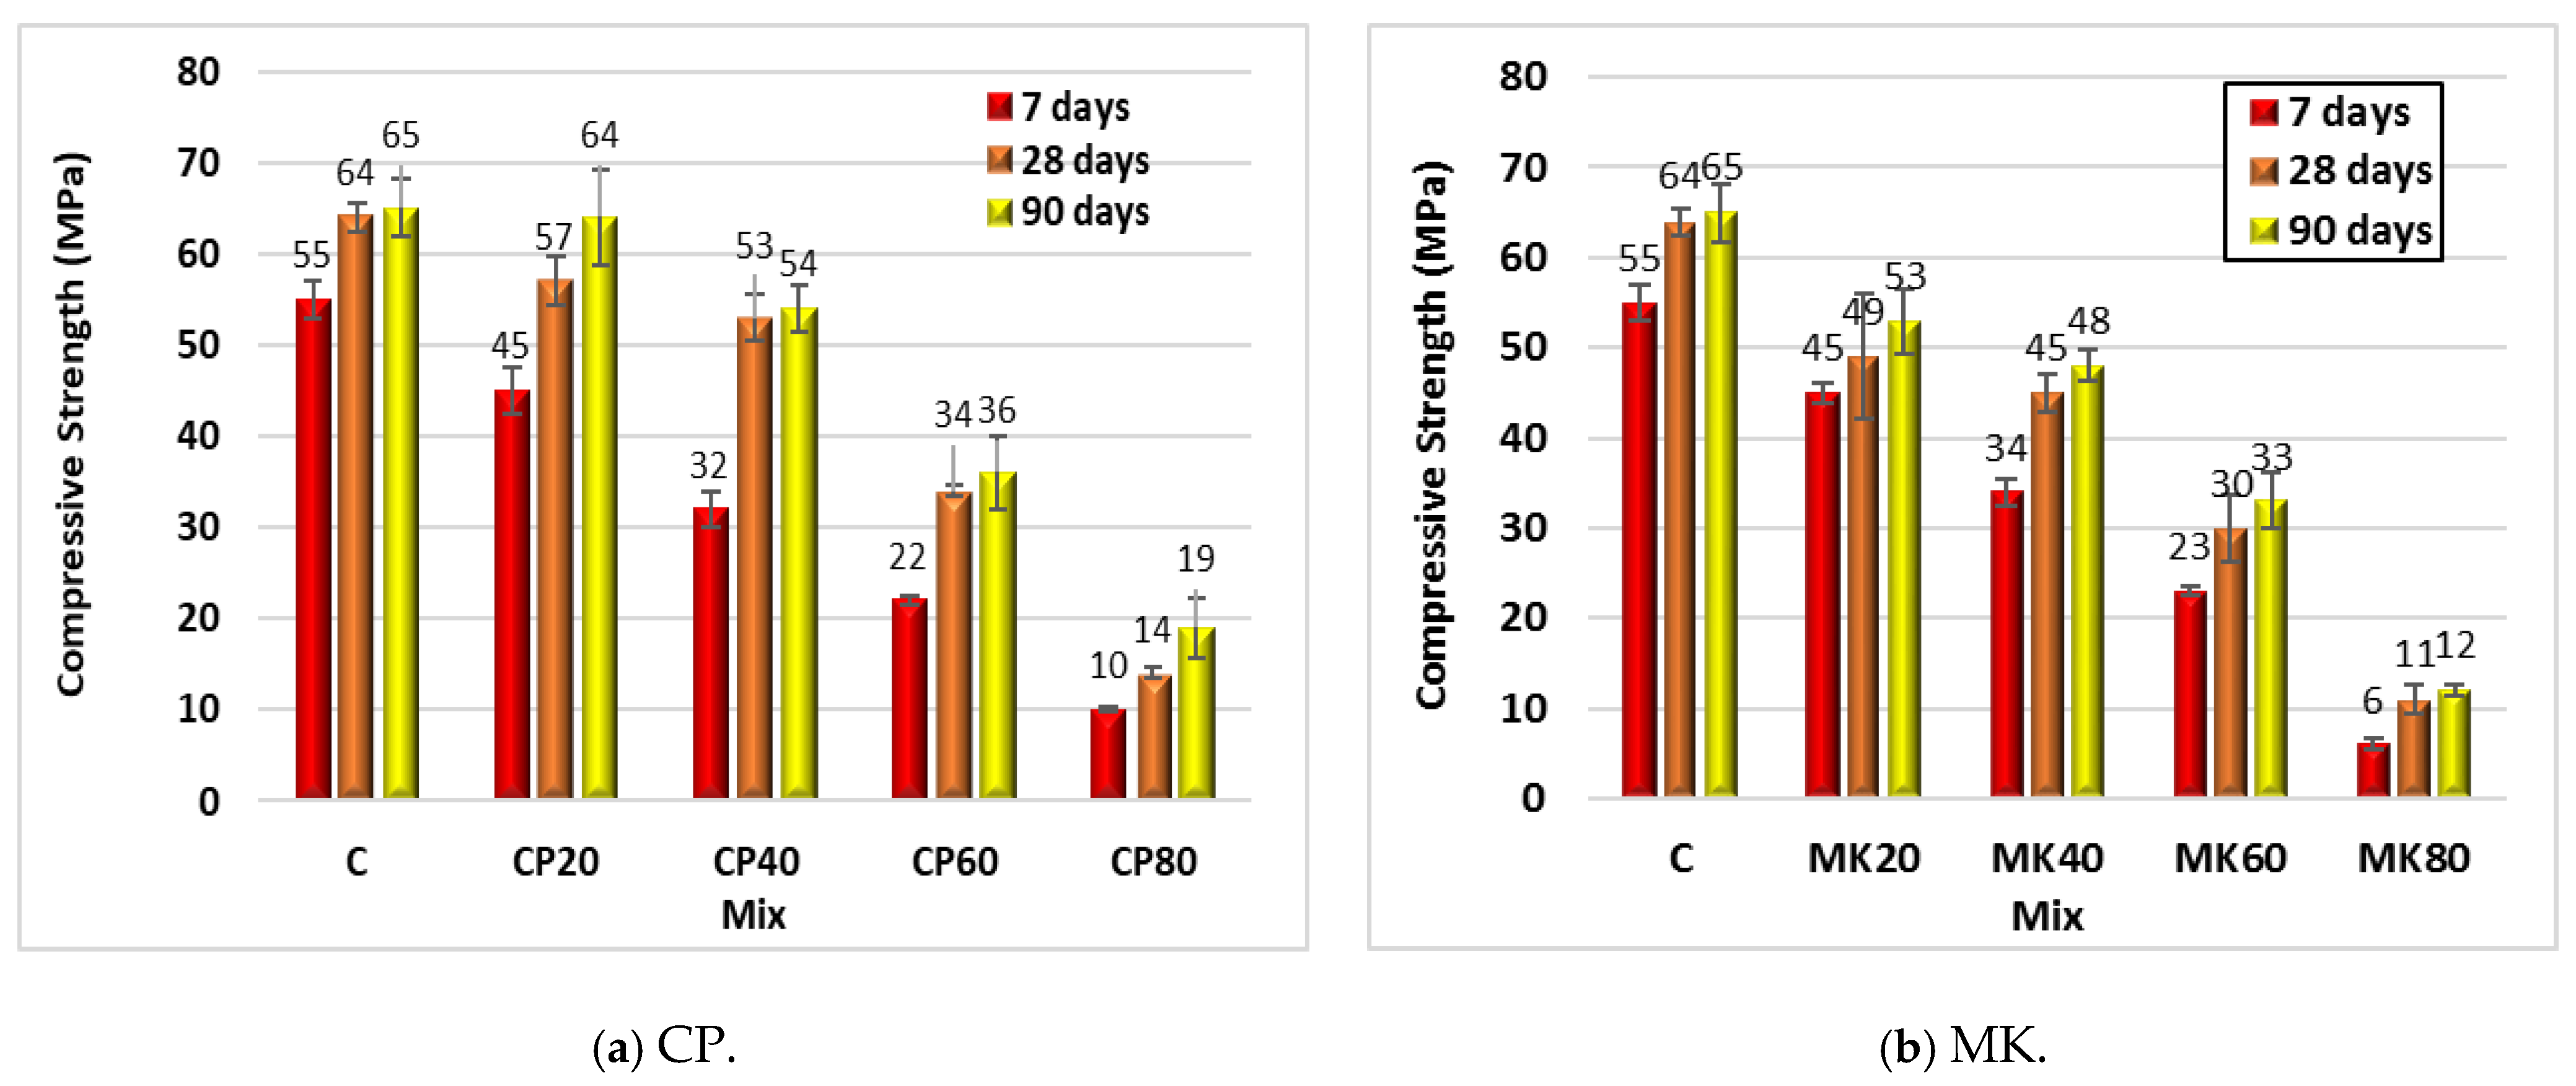
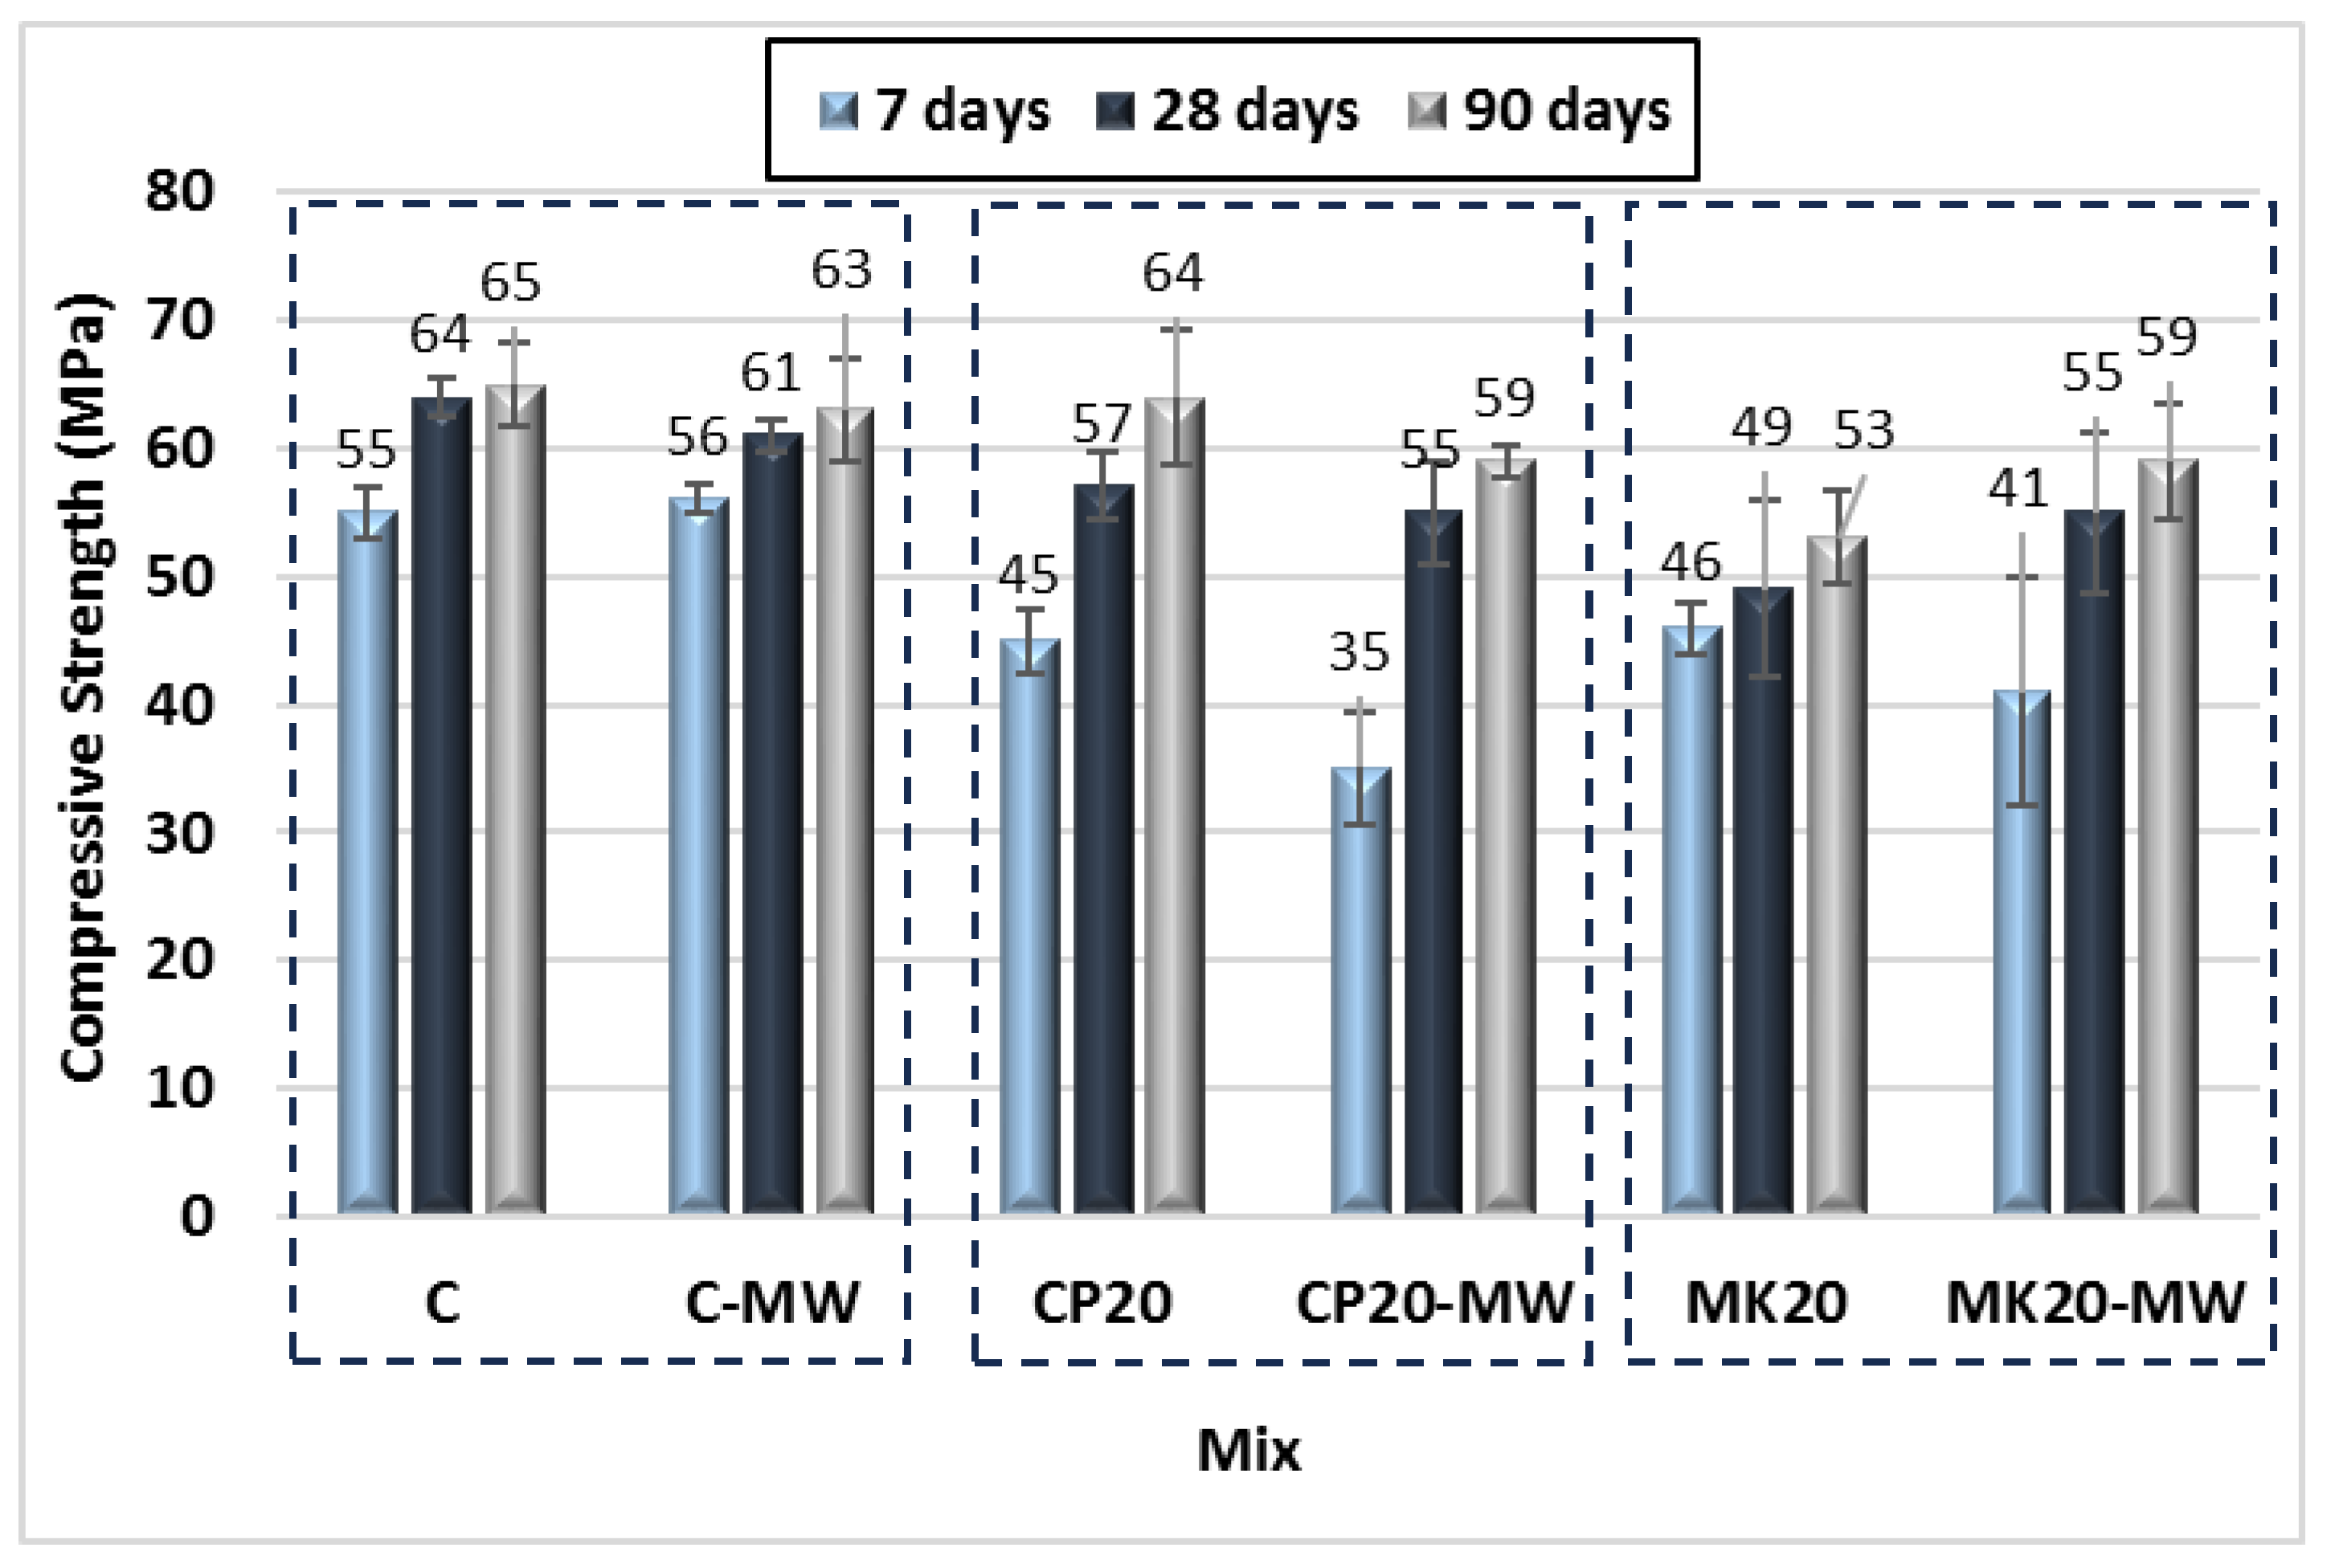
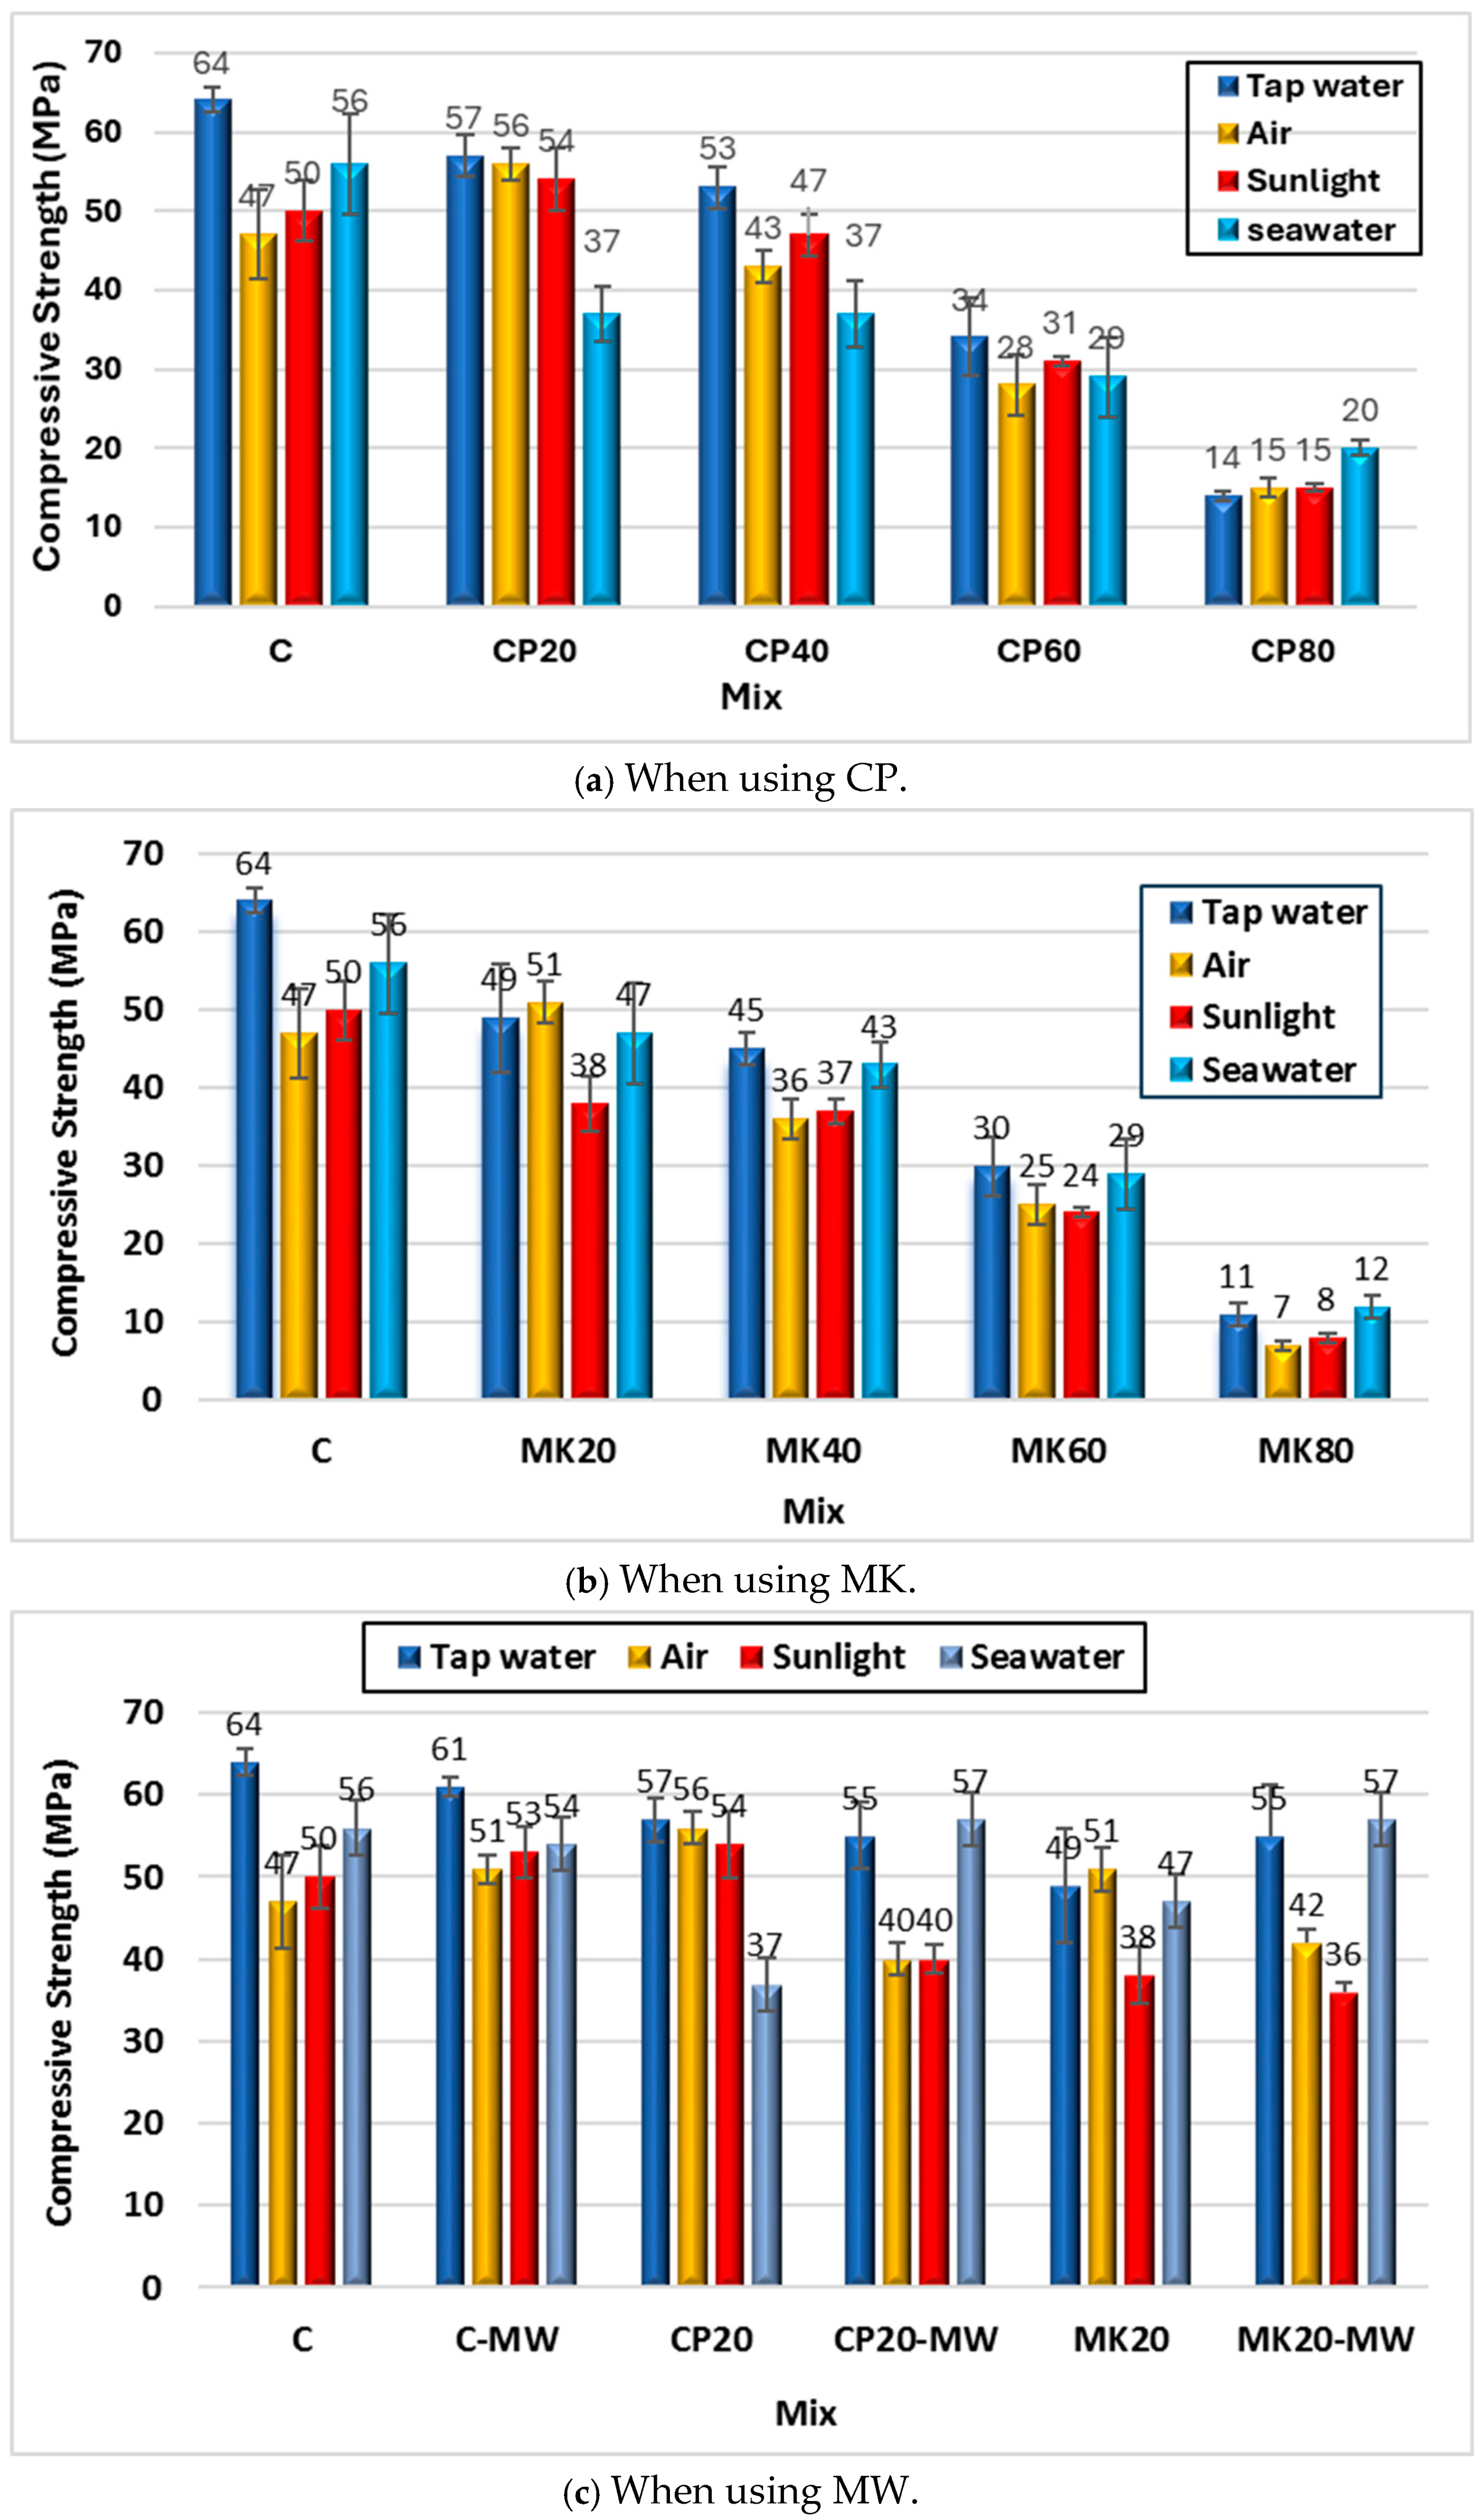
  • Using 20%, 40%, 60%, and 80% of either CP or MK in the HS-FRM decreased its 28 days compressive strength by 11%, 17%, 47%, and 78%, respectively, for CP, and by 23%, 30%, 53%, and 83%, respectively, for MK. Using MW showed an insignificant effect or decrease in the compressive strength of both the control and CP mixtures. However, when using MW in MK mixtures, the compressive strength increased by up to 13%.
  • The HS-FRM cured in tap water exhibited the highest compressive strength compared to other curing conditions. When using cement or slag individually in the HS-FRM, the second best curing condition after tap water was seawater. When using CP in the HS-FRM, sunlight curing showed the least negative effect on its compressive strength after tap water. Seawater curing was the next alternative to tap water for curing when using MK in the HS-FRM.
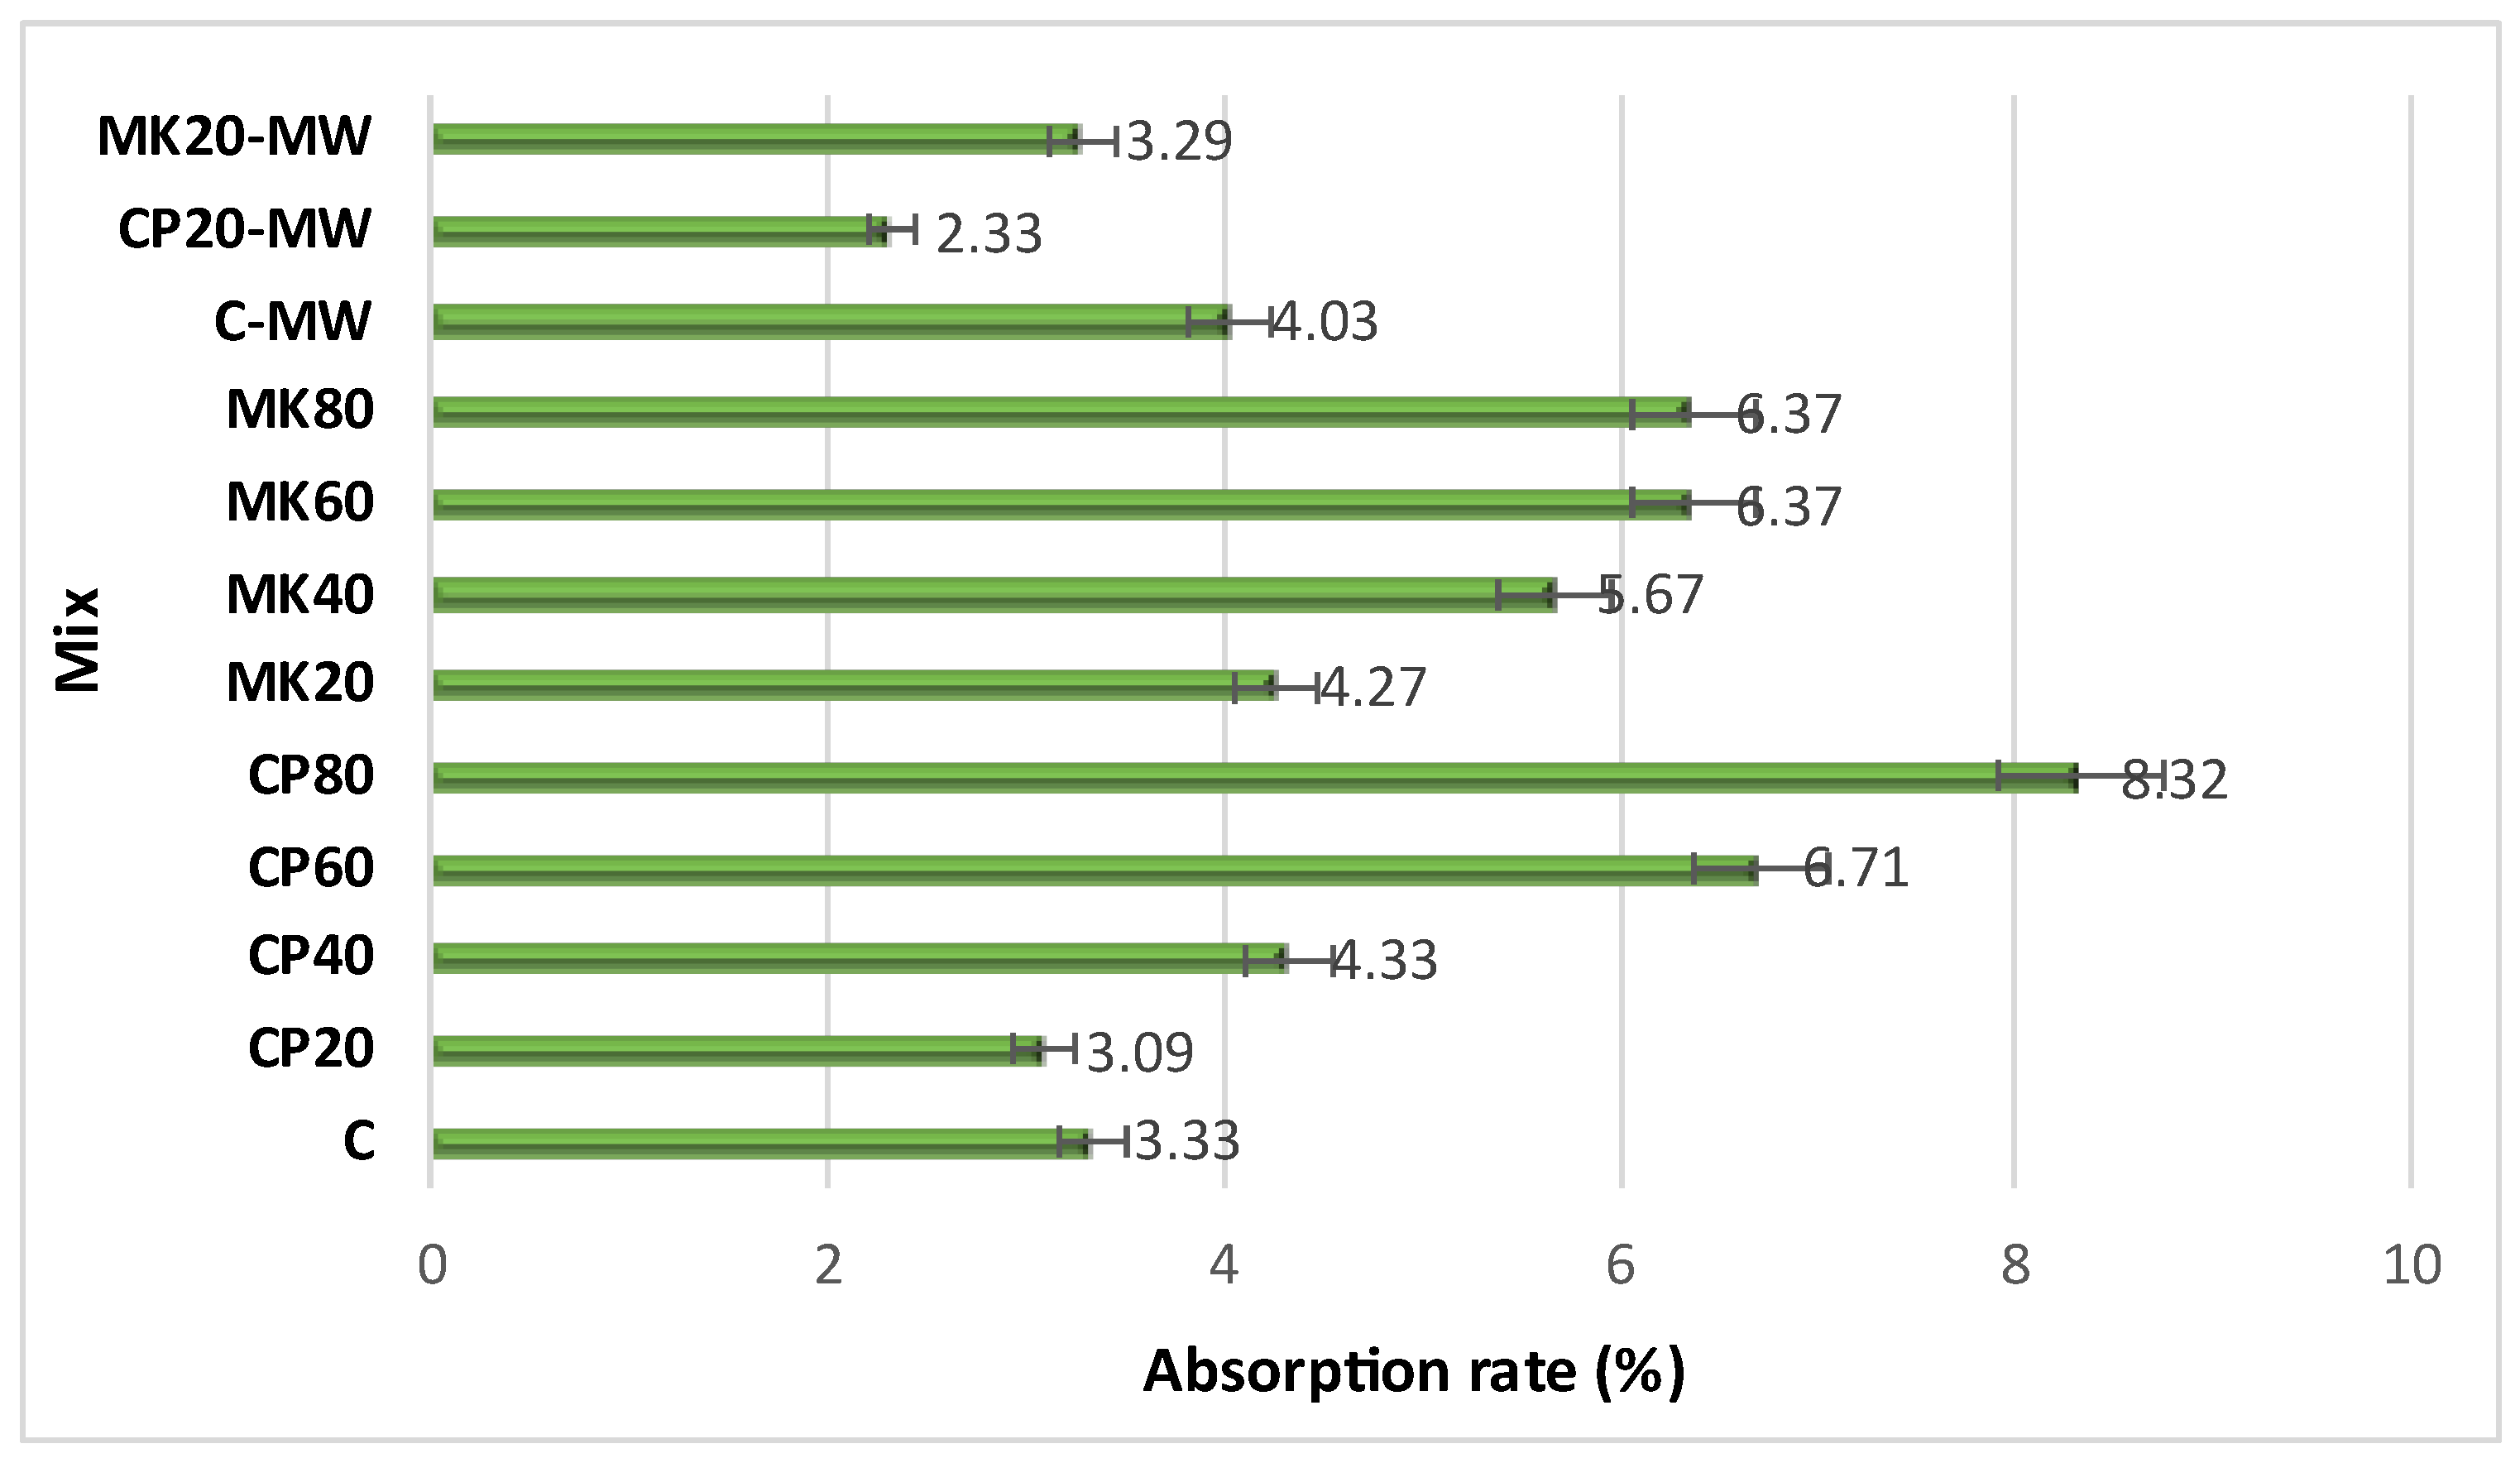
  • The water absorption of the HS-FRM decreased by 7% when 20% CP was presented. Beyond that, the water absorption increased by up to 2.5 times when using up to 80% CP. However, when using MK by up to 80%, the water absorption increased by 28–91%. Using MW in the control mixture increased the water absorption by 21%. However, MW decreased the water absorption of 20% CP and 20% MK mixtures by 24% and 23%, respectively. When increasing the substitution ratio of cement, the HS-FRM sorptivity increased, especially in the early ages (0 to 6 h). The rate of absorption of the HS-FRM containing 80% MK was higher than the corresponding mix containing 80% CP.
  • The SEM analysis showed the ability of MW to increase the compressive strength in the HS-FRM mixtures compared with TW. The pores observed in the HS-FRM matrix when using TW turned into microcracks when using MW. The EDX analysis interpreted the reported variation in the HS-FRM compressive strength. It showed that the Ca/Si ratio increased slightly with the use of MW in CP mixtures, but decreased with the use of MW in MK mixtures. The XRD analysis elucidated the compressive strength and workability results of the control mixture with TW and MW, and shed light on the impact of MW on the hydration products and their interaction with quartz. The XRD analysis showed that MW was able to improve the microstructure of the mixtures, and it showed higher peaks of Q, C, and L compared to mixture made with TW.
Future research should consider carrying out full tensile stress–strain measurements and analysis for the proposed HS-FRM to fully assess and compare the tensile toughness and performance of the sustainable HS-FRM.

Author Contributions

Conceptualization, O.Y. and M.M.K.; formal analysis, K.A.E. and M.M.K.; investigation, M.M.K.; methodology, O.Y.; project administration, M.M.Y.E.; resources, K.A.E. and M.M.Y.E.; software, K.A.E.; supervision, O.Y., K.A.E. and M.M.Y.E.; validation, M.M.Y.E.; writing—original draft, O.Y., K.A.E., M.M.Y.E. and M.M.K.; writing—review and editing, O.Y. and M.M.K. All authors have read and agreed to the published version of the manuscript.

Funding

This research received no external funding.

Data Availability Statement

All data generated or analyzed in this study are included in the manuscript.

Acknowledgments

The authors would like to acknowledge the contributions of the following Honors’ students who assisted in the experimental work reported in this paper: Mariam El-Torgoman, Mazen Ghoneim, Omar Abdulaziz, Muhammad Al-Borai, Muhammad Ratib, Muhammad Ashraf, and Mahmoud Saad.

Conflicts of Interest

The authors declare no conflict of interest.

References

  1. Eltawil, K.A.; Mahdy, M.G.; Youssf, O.; Tahwia, A.M. Producing Heavyweight High-Performance Concrete by Using Black Sand as Newly Shielding Construction Material. Materials 2021, 14, 5353. [Google Scholar] [CrossRef] [PubMed]
  2. Yuan, X.; Dai, M.; Gao, Y.; Zhou, Y.; Liu, F. Effect on mechanical properties and microstructure of high-strength eco-friendly concrete with waste glass powder-eggshell particles. J. Build. Eng. 2023, 79, 107871. [Google Scholar] [CrossRef]
  3. Youssf, O.; Safaa Eldin, D.; Tahwia, A.M. Eco-Friendly High-Strength Geopolymer Mortar from Construction and Demolition Wastes. Infrastructures 2025, 10, 76. [Google Scholar] [CrossRef]
  4. Gupta, L.K.; Vyas, A.K. Impact on mechanical properties of cement sand mortar containing waste granite powder. Constr. Build. Mater. 2018, 191, 155–164. [Google Scholar] [CrossRef]
  5. Chen, D.; Zhang, P.; Pan, T.; Liao, Y.; Zhao, H. Evaluation of the eco-friendly crushed waste oyster shell mortars containing supplementary cementitious materials. J. Clean. Prod. 2019, 237, 117811. [Google Scholar] [CrossRef]
  6. Liao, Y.; Fan, J.; Li, R.; Da, B.; Chen, D.; Zhang, Y. Influence of the usage of waste oyster shell powder on mechanical properties and durability of mortar. Adv. Powder Technol. 2022, 33, 103503. [Google Scholar] [CrossRef]
  7. Ferronato, N.; Torretta, V. Waste Mismanagement in Developing Countries: A Review of Global Issues. Int. J. Environ. Res. Public Health 2019, 16, 1060. [Google Scholar] [CrossRef]
  8. Tahwia, A.M.; Elmansy, A.K.; Abdellatief, M.; Elrahman, M.A. Durability and ecological assessment of low-carbon high-strength concrete with short AR-glass fibers: Effects of high-volume of solid waste materials. Constr. Build. Mater. 2024, 429, 136422. [Google Scholar] [CrossRef]
  9. Kaya, M. The effect of micro-SiO2 and micro-Al2O3 additive on the strength properties of ceramic powder-based geopolymer pastes. J. Mater. Cycles Waste Manag. 2022, 24, 333–350. [Google Scholar] [CrossRef]
  10. Gautam, L.; Jain, J.K.; Kalla, P.; Choudhary, S. A review on the utilization of ceramic waste in sustainable con-struction products. Mater. Today Proc. 2021, 43, 1884–1891. [Google Scholar] [CrossRef]
  11. Kannan, D.M.; Aboubakr, S.H.; El-Dieb, A.S.; Taha, M.M.R. High performance concrete incorporating ceramic waste powder as large partial replacement of Portland cement. Constr. Build. Mater. 2017, 144, 35–41. [Google Scholar] [CrossRef]
  12. Chen, X.; Zhang, D.; Cheng, S.; Xu, X.; Zhao, C.; Wang, X.; Wu, Q.; Bai, X. Sustainable reuse of ceramic waste powder as a supplementary cementitious material in recycled aggregate concrete: Mechanical properties, durability and microstructure assessment. J. Build. Eng. 2022, 52, 104418. [Google Scholar] [CrossRef]
  13. Hoppe Filho, J.; Pires, C.A.; Leite, O.D.; Garcez, M.R.; Medeiros, M.H. Red ceramic waste as supple-mentary cementitious material: Microstructure and mechanical properties. Constr. Build. Mater. 2021, 296, 123653. [Google Scholar] [CrossRef]
  14. Eltawil, K.A.; Keshta, M.M.; Elshikh, M.M.Y.; El-Demerdash, W.E.; Youssf, O. Performance of engineered cementitious composites containing high volume of ceramic powder and magnetized water. Hybrid Adv. 2025, 8, 100371. [Google Scholar] [CrossRef]
  15. Al Saffar, D.M.; Tayeh, B.A. Influence of pottery clay in cement mortar and concrete mixture: A review. Int. J. Eng. Technol. 2018, 7, 67–71. [Google Scholar] [CrossRef]
  16. Poon, C.-S.; Lam, L.; Kou, S.; Wong, Y.-L.; Wong, R. Rate of pozzolanic reaction of metakaolin in high-performance cement pastes. Cem. Concr. Res. 2001, 31, 1301–1306. [Google Scholar] [CrossRef]
  17. Homayoonmehr, R.; Ramezanianpour, A.A.; Mirdarsoltany, M. Influence of metakaolin on fresh properties, mechanical properties and corrosion resistance of concrete and its sustainability issues: A review. J. Build. Eng. 2021, 44, 103011. [Google Scholar] [CrossRef]
  18. Siddique, R.; Klaus, J. Influence of metakaolin on the properties of mortar and concrete: A review. Appl. Clay Sci. 2009, 43, 392–400. [Google Scholar] [CrossRef]
  19. Kostuch, J.A.; Walters, G.V.; Jones, T.R. High performance concretes incorporating metakaolin: A review. Concrete 2000, 2, 1799–1811. [Google Scholar]
  20. Oriol, M.; Pera, J. Pozzolanic activity of metakaolin under microwave treatment. Cem. Concr. Res. 1995, 25, 265–270. [Google Scholar] [CrossRef]
  21. Zhao, D.; Khoshnazar, R. Microstructure of cement paste incorporating high volume of low-grade metakaolin. Cem. Concr. Compos. 2020, 106, 103453. [Google Scholar] [CrossRef]
  22. Akcay, B.; Tasdemir, M.A. Performance evaluation of silica fume and metakaolin with identical finenesses in self compacting and fiber reinforced concretes. Constr. Build. Mater. 2018, 185, 436–444. [Google Scholar] [CrossRef]
  23. Mirza, F.A.; Soroushian, P. Effects of alkali-resistant glass fiber reinforcement on crack and temperature resistance of lightweight concrete. Cem. Concr. Compos. 2002, 24, 223–227. [Google Scholar] [CrossRef]
  24. Iskender, M.; Karasu, B. Glass Fibre Reinforced Concrete (GFRC). El-Cezerî Fen Mühendislik Dergisi 2018, 5, 136–162. [Google Scholar] [CrossRef]
  25. Karkush, M.O.; Ahmed, M.D.; Al-Ani, S.M. Effects of Magnetic Fields on the Properties of Water Treatedt by Reversed Osmosis. Preprints 2019, 2019040256. [Google Scholar] [CrossRef]
  26. Khalil, A.; Rosset, R.; Gabrielli, C.; Keddam, M.; Perrot, H. Characterization of the efficiency of antiscale treatments of water. Part II: Physical processes. J. Appl. Electrochem. 1999, 29, 339–346. [Google Scholar] [CrossRef]
  27. Youssf, O.; Swilam, A.; Tahwia, A.M. Performance of crumb rubber concrete made with high contents of heat pre-treated rubber and magnetized water. J. Mater. Res. Technol. 2023, 23, 2160–2176. [Google Scholar] [CrossRef]
  28. Narayanan, K.; Ramalingam, M.; Ayyasamy, M.; Dharamaraj, R. Influences of MW on cement mortar properties at different magnetic exposure. Mater. Today Proc. 2023, in press. [Google Scholar] [CrossRef]
  29. Keshta, M.M.; Eltawil, K.A.; Elshikh, M.M.Y.; Youssf, O. A comparative study of the behavior of engineered cementitious composites and engineered geopolymer composites containing metakaolin and magnetized water. Innov. Infrastruct. Solut. 2025, 10, 1–21. [Google Scholar] [CrossRef]
  30. Hamed, Y.R.; Elshikh, M.M.Y.; Elshami, A.A.; Matthana, M.H.; Youssf, O. Mechanical properties of fly ash and silica fume based geopolymer concrete made with magnetized water activator. Constr. Build. Mater. 2024, 411, 134376. [Google Scholar] [CrossRef]
  31. Su, N.; Wu, C.-F. Effect of magnetic field treated water on mortar and concrete containing fly ash. Cem. Concr. Compos. 2003, 25, 681–688. [Google Scholar] [CrossRef]
  32. Su, N.; Wu, Y.-H.; Mar, C.-Y. Effect of magnetic water on the engineering properties of concrete containing granulated blast-furnace slag. Cem. Concr. Res. 2000, 30, 599–605. [Google Scholar] [CrossRef]
  33. Khattab, S.A.; Elshikh, M.M.Y.; Elemam, W.E.; Elshami, A.A.; Youssf, O. Effect of Magnetized Water-Based Alkaline Activator on Geopolymer Concrete Mechanical Performance and Durability. Sustainability 2023, 15, 16315. [Google Scholar] [CrossRef]
  34. Elkerany, A.M.; Elshikh, M.M.Y.; Elshami, A.A.; Youssf, O. Effect of Water Magnetization Technique on the Properties of Metakaolin-Based Sustainable Concrete. Constr. Mater. 2023, 3, 434–448. [Google Scholar] [CrossRef]
  35. Ahmed, A.S.; Elshikh, M.M.Y.; Elemam, W.E.; Youssf, O. Influence of Mixing-Water Magnetization Method on the Performance of Silica Fume Concrete. Buildings 2022, 13, 44. [Google Scholar] [CrossRef]
  36. Keshta, M.M.; Elshikh, M.M.Y.; Elrahman, M.A.; Youssf, O. Utilizing of Magnetized Water in Enhancing of Volcanic Concrete Characteristics. J. Compos. Sci. 2022, 6, 320. [Google Scholar] [CrossRef]
  37. Keshta, M.M.; Elshikh, M.M.Y.; Kaloop, M.R.; Hu, J.-W.; Elmohsen, I.A. Effect of magnetized water on characteristics of sustainable concrete using volcanic ash. Constr. Build. Mater. 2022, 361, 129640. [Google Scholar] [CrossRef]
  38. ASTM C143/C143M; Standard Test Method for Slump of Hydraulic—Cement Concrete. ASTM International: West Conshohocken, PA, USA, 2015.
  39. ASTM C109; Standard Test Method for Compressive Strength of Hydraulic Cement Mortars. ASTM International: West Conshohocken, PA, USA, 2014.
  40. Yokota, H.; Rokugo, K.; Sakata, N. JSCE Recommendations for Design and Construction of High Performance Fiber Reinforced Cement Composites with Multiple Fine Cracks. In High Performance Fiber Reinforced Cement Composites; Japan Society of Civil Engineers: Tokyo, Japan, 2008. [Google Scholar]
  41. ASTM C348-14; Standard Test Method for Flexural Strength of Hydraulic-Cement Mortars. Annual Book of ASTM Standards; ASTM International: West Conshohocken, PA, USA, 2014.
  42. ASTM Standard C 642-06; Standard Test Method for Density, Absorption, and Voids in Hardened Concrete. ASTM International: West Conshohocken, PA, USA, 1997; pp. 1–3.
  43. Helmy, S.H.; Tahwia, A.M.; Mahdy, M.G.; Elrahman, M.A.; Abed, M.A.; Youssf, O. The Use of Recycled Tire Rubber, Crushed Glass, and Crushed Clay Brick in Lightweight Concrete Production: A Review. Sustainability 2023, 15, 10060. [Google Scholar] [CrossRef]
  44. ASTM C1585–13; Standard Test Method for Measurement of Rate of Absorption of Water by Hydraulic-Cement Concretes. ASTM International: West Conshohocken, PA, USA, 2013. [CrossRef]
  45. Huseien, G.F.; Sam, A.R.M.; Shah, K.W.; Mirza, J. Effects of ceramic tile powder waste on properties of self-compacted alkali-activated concrete. Constr. Build. Mater. 2020, 236, 117574. [Google Scholar] [CrossRef]
  46. Moon, J.; Bae, S.; Celik, K.; Yoon, S.; Kim, K.-H.; Kim, K.S.; Monteiro, P.J. Characterization of natural pozzolan-based geopolymeric binders. Cem. Concr. Compos. 2014, 53, 97–104. [Google Scholar] [CrossRef]
  47. Elkerany, A.M.; Keshta, M.M.; Elshikh, M.M.Y.; Elshami, A.A.; Youssf, O. Characteristics of Sustainable Concrete Containing Metakaolin and Magnetized Water. Buildings 2023, 13, 1430. [Google Scholar] [CrossRef]
  48. Elshami, A.; Essam, N.; Yousry, E.-S.M. Improvement of hydration products for self-compacting concrete by using magnetized water. Fract. Struct. Integr. 2022, 16, 352–371. [Google Scholar] [CrossRef]
  49. Yousry, O.M.M.; Abdallah, M.A.; Ghazy, M.F.; Taman, M.H.; Kaloop, M.R. A Study for Improving Compressive Strength of Cementitious Mortar Utilizing Magnetic Water. Materials 2020, 13, 1971. [Google Scholar] [CrossRef]
  50. Flatt, R.J.; Scherer, G.W.; Bullard, J.W. Why alite stops hydrating below 80% relative humidity. Cem. Concr. Res. 2011, 41, 987–992. [Google Scholar] [CrossRef]
  51. Jensen, O.; Hansen, P.; Lachowski, E.; Glasser, F. Clinker mineral hydration at reduced relative humidities. Cem. Concr. Res. 1999, 29, 1505–1512. [Google Scholar] [CrossRef]
  52. Cai, Y.; Tao, Y.; Xuan, D.; Zhu, X.; Poon, C.S. Effects of seawater on the formation and mechanical properties of Friedel’s salt associated with tricalcium aluminate. Cem. Concr. Res. 2023, 174, 107340. [Google Scholar] [CrossRef]
Figure 1. Particle size distribution of all utilized binders.
Infrastructures 10 00124 g001
Figure 2. Water magnetization system.
Infrastructures 10 00124 g002
Figure 3. Dog-bone specimen testing setup and dimensions.
Infrastructures 10 00124 g003
Figure 4. Sorptivity test setup.
Infrastructures 10 00124 g004
Figure 5. Effect of CP on the HS-FRM slump values (TW).
Infrastructures 10 00124 g005
Figure 6. Effect of MK on the HS-FRM slump values (TW).
Infrastructures 10 00124 g006
Figure 7. Effect of MW on the HS-FRM slump values containing CP and MK.
Infrastructures 10 00124 g007
Figure 8. Effect of different contents of CP and MK on the compressive strength of the HS-FRM (Tap water curing).
Infrastructures 10 00124 g008
Figure 9. Effect of MW on the compressive strength of the HS-FRM containing 0% and 20% of CP or MK.
Infrastructures 10 00124 g009
Figure 10. Effect of various curing conditions on the HS-FRM compressive strength (28 days).
Infrastructures 10 00124 g010
Figure 11. Flexural strength of the HS-FRM mixes (28 days).
Infrastructures 10 00124 g011
Figure 12. Uniaxial tensile strength of mixes C, CP20, and MK20 made with TW or MW (28 days).
Infrastructures 10 00124 g012
Figure 13. Water absorption rate of the HS-FRM.
Infrastructures 10 00124 g013
Figure 14. Sorptivity of the HS-FRM.
Infrastructures 10 00124 g014aInfrastructures 10 00124 g014b
Figure 15. SEM analysis of the HS-FRM at 28 days.
Infrastructures 10 00124 g015
Figure 16. EDX analysis for the selected HS-FRM mixtures.
Infrastructures 10 00124 g016
Figure 17. XRD patterns for C, and C-MW mixtures.
Infrastructures 10 00124 g017
Figure 18. XRD patterns for CP20, and CP20-MW mixtures.
Infrastructures 10 00124 g018
Figure 19. XRD patterns for MK20, and MK20-MW mixtures.
Infrastructures 10 00124 g019
Table 1. Chemical composition of binder materials used.
ElementCaOSiO2Al2O3Fe2O3MgOSO3Na2OLOIK2OZnOTiO2
PC62.720.263.322.20.011.7------------
GGBFS43.132.813.40.455.51.90.40.80.31.040.8
CP6.1060.4018.477.620.4770.2412.32----1.9720.1261.12
MK0.2962.0925.311.7020.2760.0150.0178.990.45--0.20
Table 2. The geometric and physical characteristics of GF.
Specific GravityLengthDiameterTensile StrengthElastic Modulus
0.91 g/cm36 mm13 μm480 MPa72 GPa
Table 3. Mixtures ingredient (kg/m3).
HS-FRM MixSandPCGGBFSCPMKGFWaterSP
C571642.6577.30-27.333014.8
CP20571514.1461.8211.3-27.333014.8
CP40571385.6346.4422.7-27.333014.8
CP60571257.0230.9634.0-27.333014.8
CP80571128.5115.5845.4-27.333014.8
MK20571514.1461.8-20427.333014.8
MK40571385.6346.4-40827.333014.8
MK60571257.0230.9-61227.333014.8
MK80571128.5115.5-81627.333014.8
C-MW571642.6577.3--27.333014.8
CP20-MW571514.1461.8211.3-27.333014.8
MK20-MW571514.1461.8-20427.333014.8
Table 4. Relative values (%) of the mechanical properties of all HS-FRM mixtures.
HS-FRM MixtureSlumpCompressive StrengthFlexural StrengthTensile Strength
7 Days28 Days90 Days28 Days28 Days
Tap WaterAirSunlightSeawater
C100100100100100100100100100
CP20133828911910866986581
CP4015058839194668396--
CP6011740536062525558--
CP8010018223230362953--
MK208382771097684827170
MK4083627077747774104--
MK606742475348525147--
MK806711171516211853--
C-MW200102951091069697156107
CP20-MW433648685801029111886
MK20-MW20075868972102919676
Note: All mixes from CP20 to MK20-MW are relatively compared with the mix C.
Table 5. Relative values (%) of the mechanical properties of the HS-FRM mixtures with MW.
HS-FRM MixtureSlumpCompressive StrengthFlexural StrengthTensile Strength
7 Days28 days90 Days28 Days28 Days
Tap WaterAirSunlightSeawater
C100100100100100100100100100
C-MW200102951091069697156107
CP20100100100100100100100100100
CP20-MW3257896717415492181105
MK20100100100100100100100100100
MK20-MW240891128295121111136108
Note: Mixes C-MW, CP20-MW, and MK20-MW are relatively compared with mixes C, CP20, and MK20, respectively.
Table 6. Values of absorption rates and sorptivity coefficients of all mixtures.
HS-FRM MixtureSinitialSsecondaryΔWinitialΔWsecondaryΔWtotal
C3.20.801.320.962.28
CP202.80.041.201.122.32
CP404.71.302.322.394.71
CP607.42.402.963.656.61
CP8012.13.805.019.7414.75
MK204.71.102.141.663.80
MK405.01.103.052.175.22
MK6014.91.006.242.698.93
MK8031.91.6015.0811.7126.79
C-MW3.30.051.621.863.48
CP20-MW9.00.304.081.825.90
MK20-MW7.80.703.635.208.83
Sinitial: rate of initial absorption; Ssecondary: rate of secondary absorption; ΔWinitial: weight of absorbed water in the first 6 h; ΔWsecondary: weight of absorbed water up to 7 days; ΔWtotal: weight of absorbed water within 7 days.
Table 7. Chemical elements of the selected HS-FRM mixtures.
MixtureCONaMgAlSiSKCaTiFeCa/Si
C1.840.30.31.53.610.20.50.439.6---1.83.88
C-MW2.044.50.71.34.010.70.80.6380.43.73.55
CP201.547.60.50.82.78.30.90.435.40.21.63.61
CP20-MW1.448.40.71.13.210.20.50.631.50.22.13.74
MK201.645.6---0.93.611.30.90.233.8---2.22.99
MK20-MW4.751.22.40.94.511.00.11.221.80.71.41.98
Disclaimer/Publisher’s Note: The statements, opinions and data contained in all publications are solely those of the individual author(s) and contributor(s) and not of MDPI and/or the editor(s). MDPI and/or the editor(s) disclaim responsibility for any injury to people or property resulting from any ideas, methods, instructions or products referred to in the content.

