Article

Modeling Riding and Stopping Behaviors at Motorcycle Box Intersections: A Case Study in Chiang Mai City, Thailand

by
Wachira Wichitphongsa
1,
Nopadon Kronprasert
1,2,*,
Moe Sandi Zaw
1,
Pongthep Pisetsit
1 and
Thaned Satiennam
3
1
Department of Civil Engineering, Faculty of Engineering, Chiang Mai University, Chiang Mai 50200, Thailand
2
Excellence Center in Infrastructure Technology and Transportation Engineering (ExCITE), Chiang Mai University, Chiang Mai 50200, Thailand
3
Sustainable Infrastructure Research and Development Center, Department of Civil Engineering, Faculty of Engineering, Khon Kaen University, Khon Kaen 40002, Thailand
*
Author to whom correspondence should be addressed.
Infrastructures 2025, 10(4), 97; https://doi.org/10.3390/infrastructures10040097
Submission received: 13 March 2025 / Revised: 12 April 2025 / Accepted: 14 April 2025 / Published: 16 April 2025
(This article belongs to the Special Issue Sustainable Road Design and Traffic Management)

Abstract

A motorcycle box intersection is a signalized intersection with advanced stop lines or stopping spaces intended for motorcycles, creating a waiting area in front of other vehicles. This study introduces the External Driver Model (EDM) with microscopic traffic simulation using PTV Vissim 2024 software, which replicates the filtering and stopping behavior of motorcycles in mixed traffic on intersection approaches. This research aims to evaluate the traffic performance of motorcycle boxes with respect to motorcycle departure times, headway intervals, lane-filtering rates, and vehicle movement patterns at 12 signalized urban intersections in Chiang Mai, Thailand. The results show that the motorcycle box intersection has improved traffic efficiency, reduced motorcycle departure time, and maintained a constant distance between cars and other vehicles. Signalized intersections with motorcycle boxes improved traffic flow efficiency by favoring motorcycles without affecting car delays. Spatial-temporal visualization further supported the clustering characteristics of motorcycles in motorcycle-stopping areas, contributing to more orderly and predictable behavior in traffic. Furthermore, the lane-filtering rates demonstrated significant improvement at intersections equipped with motorcycle boxes compared to conventional intersection designs. These findings indicated that motorcycle boxes are valuable for motorcycle traffic management and intersection safety in urban areas with high volumes of motorcycle traffic.

1. Introduction

In many urban areas, motorcycles represent a significant portion of the traffic, particularly in Asian cities. In recent years, there has been a significant rise in motorcycle usage in Thailand due to its convenience, speed, accessibility, and affordability. Motorcycles offer a faster and more flexible service than private cars, particularly during peak hours when congestion is high. However, the high number of motorcycles on the roads has raised concerns regarding traffic safety, congestion, and overall intersection performance [1]. Signalized intersections, in particular, present unique challenges for motorcyclists, such as limited visibility, interference with passenger vehicles, and delays [2]. One of the main challenges at these intersections is mixed traffic conditions, where motorcycles share lanes and waiting areas with other vehicles [3,4]. The different acceleration rates between motorcycles and passenger cars result in traffic delays and reduced mobility during departure times [5]. In Thailand, vehicles are driven on the left side of the road. The interactions between right-turning motorcycles and straight-moving vehicles at intersections increase the risk of traffic conflicts and accidents [6,7]. To address these challenges, the “box” (known as advanced stop lines or exclusive stopping spaces) has been proposed and implemented for bicycles and more recently, for motorcycles in several countries. Motorcycle boxes are designated areas in front of the regular vehicle stop line at signalized intersections where motorcycles can position themselves during red signals, serving as a dedicated waiting zone for motorcycles [5].
In Chiang Mai City, Thailand, the growing motorcycle traffic has highlighted the need for traffic management strategies that accommodate the unique characteristics of motorcyclists while maintaining or improving the efficiency of intersections. The design of the motorcycle box allows motorcycles to start moving before other vehicles when the traffic signal turns green, reducing conflicts and improving traffic flow [8]. The motorcycle box has been found to reduce conflicts between right-turn motorcyclists and straight-headed vehicles at intersections, leading to improved motorcyclist safety [9]. Furthermore, the motorcycle box intersection provides better visibility for motorcyclists, decreasing the likelihood of rear-end collisions at intersections [10]. The effectiveness of motorcycle boxes in improving traffic flow and safety, particularly for motorcycles, has not been fully explored in the context of mixed conditions in Thailand.
Simulation modeling is a useful tool for analyzing traffic behavior and evaluating road infrastructure designs and traffic management scenarios. However, modeling complex real-world scenarios, particularly focusing on motorcycle traffic in mixed traffic conditions, is a challenging task. This research seeks to analyze the impact of motorcycle boxes at signalized intersections using a microscopic traffic simulation. While previous studies have focused on the general impact of motorcycle boxes, this study emphasizes detailed behavioral modeling by using a customized External Driver Model (EDM) embedded in PTV Vissim. This approach enables the simulation of micro-level motorcycle filtering and clustering patterns, with a specific focus on traffic conditions in Chiang Mai. Microscopic traffic simulation allows for a detailed analysis of traffic behavior at a granular level, considering individual vehicle movements and interactions [11,12]. In this study, PTV Vissim is used to model the behavior of motorcycles at signalized intersections with or without motorcycle boxes, and an External Driver Model (EDM) is developed to accurately simulate motorcycle movements in mixed traffic. This study examines key factors such as motorcycle and passenger car departure times, headway intervals, and the optimal motorcycle composition required for the motorcycle box to be most effective. These findings aim to provide insights for traffic engineers and policymakers to optimize intersection design and signal control strategies in motorcycle-dominated urban environments.
This paper is organized as follows. Section 2 presents a review of the existing literature related to motorcycle box intersections, driver stopping behaviors at intersections, and their impact on traffic flow and safety. Section 3 details the methodology employed in this study, including data collection from multiple signalized intersections and the development of microscopic traffic simulation models. Section 4 discusses the model calibration results and findings from the simulation model analysis, covering the performance measures of motorcycle boxes, such as departure rates, filtering rates, traffic flow efficiency, and headway distribution. Section 5 provides the conclusions from this study and offers recommendations for optimizing motorcycle box implementations in urban traffic management.

2. Literature Review

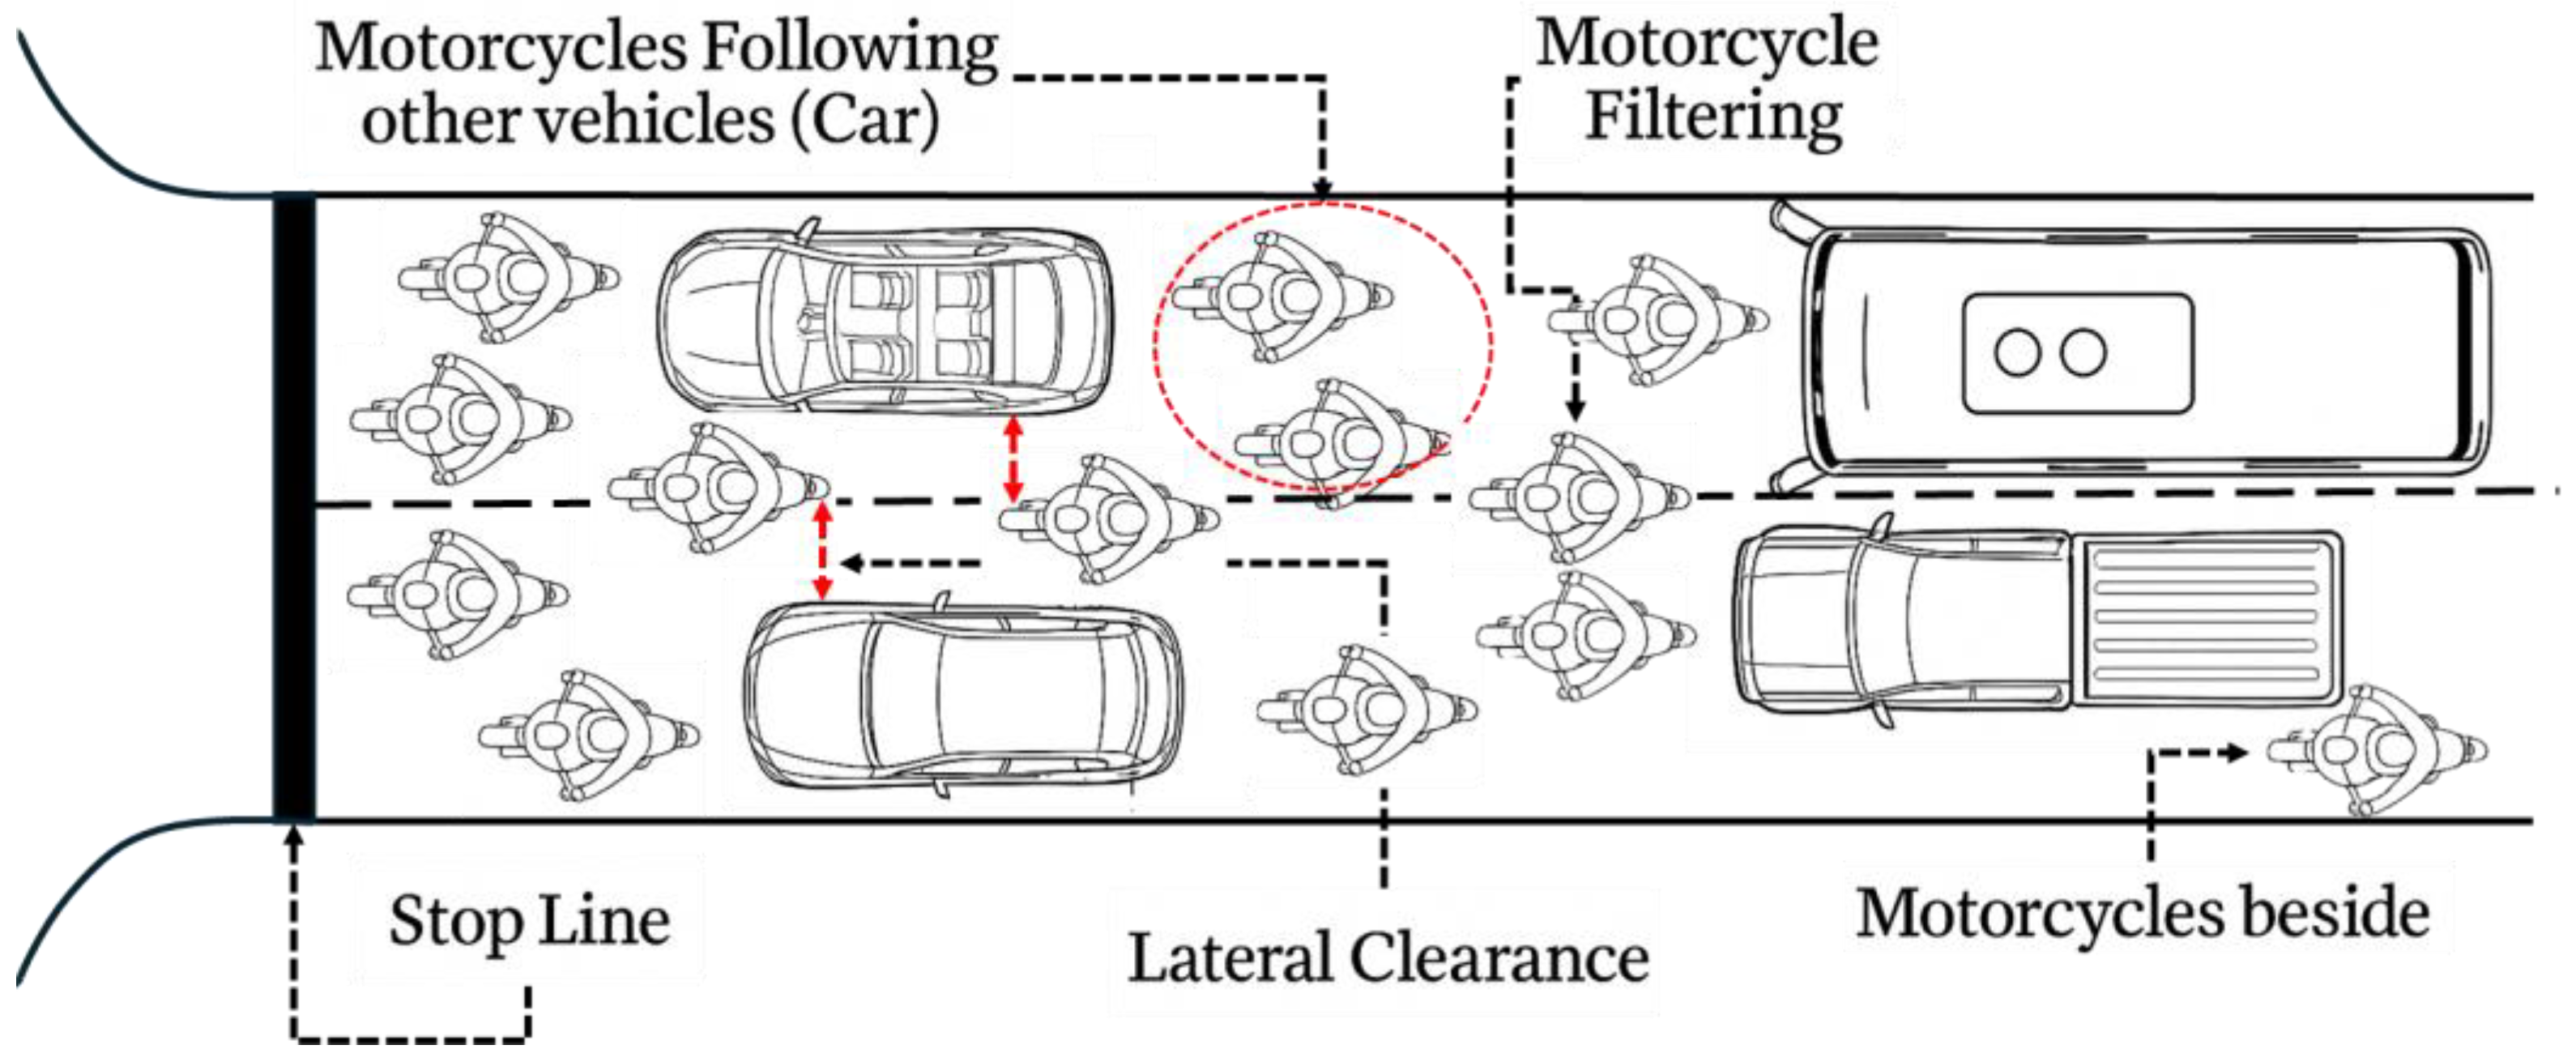
2.1. Motorcycle Box Intersection

Motorcycle box intersections, also known as motorcycle-specific boxes at traffic signals, are an innovative design aimed at improving motorcycle safety and facilitating their safe passage through intersections. These boxes are called a “red box”, “advanced stop line (ASL)”, or “exclusive stopping space for motorcycles (ESSM)”—a dedicated area for motorcycles to wait at signalized intersection approaches by separating them from other vehicles and have been implemented in various countries [5,13,14]. Motorcycle boxes allow motorcycles to position themselves ahead of other vehicles during the red phase, reducing interactions with larger vehicles and minimizing start-up delays [5]. They were initially introduced to enhance visibility and safety [8]. The layout of the motorcycle box intersection is presented in Figure 1.
Around the world, where motorcycles dominate the roadways, their use in mixed traffic conditions is extremely challenging because motorcycles share the roads with cars, trucks, buses, and other vehicles. Thus, motorcyclists are exposed to an increased risk of crashes in mixed traffic conditions because there is practically no exclusive infrastructure offered for motorcycles [3]. Two-wheeled motorcycles are agile and smaller than cars and trucks and are thus hard for other vehicles to predict their movement. At the intersection, this unpredictability is increased because vehicles are coming from different directions. Thus, motorcycle box intersections are a solution for reducing these risks by giving safer space for motorcyclists within the signalized intersection. While they may enhance pedestrian safety and reduce vehicle conflicts, they can also encourage aggressive acceleration behaviors, particularly among professional riders in Thailand’s motorcycle service delivery [15,16], raising significant safety concerns in this context [17,18,19,20].
Several studies have suggested that motorcycle boxes contribute to better traffic flow, improved road safety, and reduced vehicle conflicts. Motorcycle boxes contribute to safer and more efficient intersections by allowing motorcycles to clear intersections faster, reducing the risk of collisions with larger vehicles [21]. However, the effectiveness of these boxes is contingent upon several factors, particularly how they integrate with the overall traffic flow and whether they are designed with consideration for mixed traffic dynamics. The efficiency of motorcycle boxes is influenced by traffic volumes and lane configurations. The National Association of City Transportation Officials (NACTO) has suggested that motorcycle boxes are generally applied to one or two lanes for through and right-turn movements [22]. In London, motorcycle boxes are typically applied to one or two lanes but can extend to three lanes in high motorcycle volume scenarios [23]. When motorcycles are included, the waiting area expands to at least two lanes [21]. The recommended width of motorcycle boxes varies depending on the traffic conditions and motorcycle or bicycle proportions, as suggested by different national guidelines. A study by [24] from India analyzed motorcycle boxes using micro-simulation, revealing that a 4 m box reduced delays up to traffic volumes of 1500 vehicles per hour. However, a 6 m box showed no additional benefits. The motorcycle box in England has an ideal width of 4 to 5 m to create more space for motorcycles and bicycles, with minimal impact on overall traffic flow and capacity [21]. In Indonesia, the motorcycle box, known as the “Red Box”, is set at 8 m to accommodate high motorcycle volumes [5]. In India, the optimal motorcycle box width is 2 to 4 m, depending on the motorcycle proportion and traffic volume [25]. In addition, [26] proposed that motorcycle waiting zones should have a minimum width of 0.8 m and a length of 2.3 m for each turning movement.

2.2. Stopping Behavior at Intersections

Signalized intersections are pivotal in urban traffic, where delays, congestion, and conflicts among various road users happen frequently [27,28]. The motorcycles’ driving behavior becomes unpredictable and risk-prone in mixed traffic conditions [3] since motorcycles share the roadway with other types of vehicles, mainly in the area of intersections. Stopping behavior at intersections is critical for the overall safety and efficiency of traffic flow, especially in mixed traffic [29]. In the absence of motorcycles, how mixed vehicles stop at intersections would provide varying dynamics in safety because of their size, agility, and vulnerability compared to larger vehicles. Of the stopping behaviors most commonly seen at an intersection, improper stopping is among the most frequent, followed by not stopping from a distance far enough [4]. Other vehicles usually reach the intersection first without using any space in front of them. Motorcycles always need to stop closer to the intersection because of the requirement for fast acceleration [2]. Motorcycle boxes are made to give motorcyclists a safer waiting area and improve visibility. The effectiveness of these motorcycle boxes depends on motorcyclists and other vehicles complying with motor vehicle laws. Figure 2 demonstrates the motorcycle behaviors at the signalized intersection.
The study by [30] analyzed motorcycle stopping positions at four-legged signalized intersections in Malaysia using video recordings and statistical analysis, finding that over 60% of motorcyclists stop ahead of the stop line, increasing early departures and pedestrian risks. Similarly, [29] examined motorcyclists’ glancing and stopping behaviors at intersections using eye-tracking and onboard sensors, finding that motorcyclists made fewer last glances toward potential hazards, were less likely to come to a complete stop, and had a wider but less safety-focused visual search pattern compared to car drivers. The study by [4] used UAV observations and multinomial logistic regression to analyze motorcyclists’ stopping behaviors at 10 signalized intersections in Thailand, finding that most riders stopped in front of the stop line, with factors like helmet use, vehicle presence, shade, and peak-hour traffic significantly influencing their stopping locations.
In response to these safety concerns, [9] demonstrated that 40 feet from crosswalks’ advanced stop lines reduced vehicle encroachment from 10.7% to 3.3% and vehicle–pedestrian conflicts from 2.7% to 0.7%. The research in [8] evaluated bike boxes at 10 intersections, documenting a 31% decrease in conflicts despite an increased bicycle volume (94%) and right-turning vehicles (15%). Vehicle encroachment into crosswalks decreased in both colored (25% to 6%) and uncolored (19% to 6%) installations, with 77% of cyclists reporting improved safety. Extending this to motorcycles, [10] analyzed 4901 crashes at signalized intersections in Colombia, finding that advanced stop lines for motorcycles reduced overall crashes by 6.13% and fatalities by 33.33%.

2.3. Entropy Analysis in Traffic and Behavior Modeling

The concept of entropy in traffic systems, particularly as it relates to motorcycles, is often used in entropy-based models to improve routing and understand traffic complexity. Entropy is a measure of disorder or randomness. This particularly makes sense for the cities of Thailand, where mixed traffic consisting of many motorcycles can show flow characteristics that are entirely different from those on the road that are free of motorcycles. Entropy-based measures for traffic flow have been extensively applied, as entropy provides a measure for the degree of asymmetry of the uncertainty produced by a system [31]. Entropy analysis depicts a measure of the unpredictability of drivers’ behaviors towards traffic in the case of various parameters at intersections, merging lanes, and congested urban areas [32,33]. For example, in mixed traffic conditions at motorcycle box intersections, motorcyclists show variable stopping, waiting, and accelerating behaviors, which are often influenced by external factors such as traffic signals, vehicle interactions, and roadway geometry [4]. These variations create high uncertainties in understanding movement patterns, which can be studied more systematically through entropy-based models. Entropy-based models measure the complexity of traffic situations, which helps in understanding and predicting traffic patterns, which is important for developing effective navigation systems [34]. The use of entropy in traffic flow analysis helps identify potential congestion patterns and bottlenecks, allowing for more informed traffic management decisions [35].
Spatial entropy is a fundamental measure used to quantify the uncertainty and uniformity in the distribution of vehicles across a given road network, such as intersections, lanes, or dedicated motorcycle waiting areas. This is particularly useful for conducting a traffic study on congestion trends by finding congestion in the lanes and improving urban transport planning. Spatial entropy is rooted in Shannon entropy, which quantifies the uncertainty of probability distribution mathematically. The formula is given as follows:
S s p a t i a l = i = 1 n p i ln p i
where S s p a t i a l   represents the entropy, which p i is the probability of vehicles occupying a specific i region, and n is the total number of defined spatial zones. The probability distribution is computed as p i = N i N total , where N i   is the number of vehicles in the region i and N t o t a l is the total vehicle count in all regions.
In practice, spatial entropy is applied by first dividing the road network or intersection into predefined spatial zones, counting the number of motorcycles in each section, and computing the probability distribution; the entropy indicates the state of traffic disorder. For example, a low entropy value S s p a t i a l   0   means that motorcycles or vehicles are clustered in specific areas, which means an efficient flow. Conversely, a high entropy value S s p a t i a l   S m a x indicates a random or chaotic distribution, which means inefficient space usage or the possibility of congestion.

3. Methodology

The workflow consists of several key stages: intersection selection using established criteria, followed by field data collection through video recording consistent with [36], who used video recordings during peak hours to gather traffic data, including motorcycles at intersections; this study applies video recording to capture motorcyclist behaviors at motorcycle box intersections in Chiang Mai. This process enables the analysis of key performance indicators that demonstrate traffic efficiency. Subsequent steps involve calibration and validation of the simulation model, followed by sensitivity analysis with various traffic volumes. The methodology concludes with the formulation of evidence-based conclusions and recommendations, as shown in Figure 3.

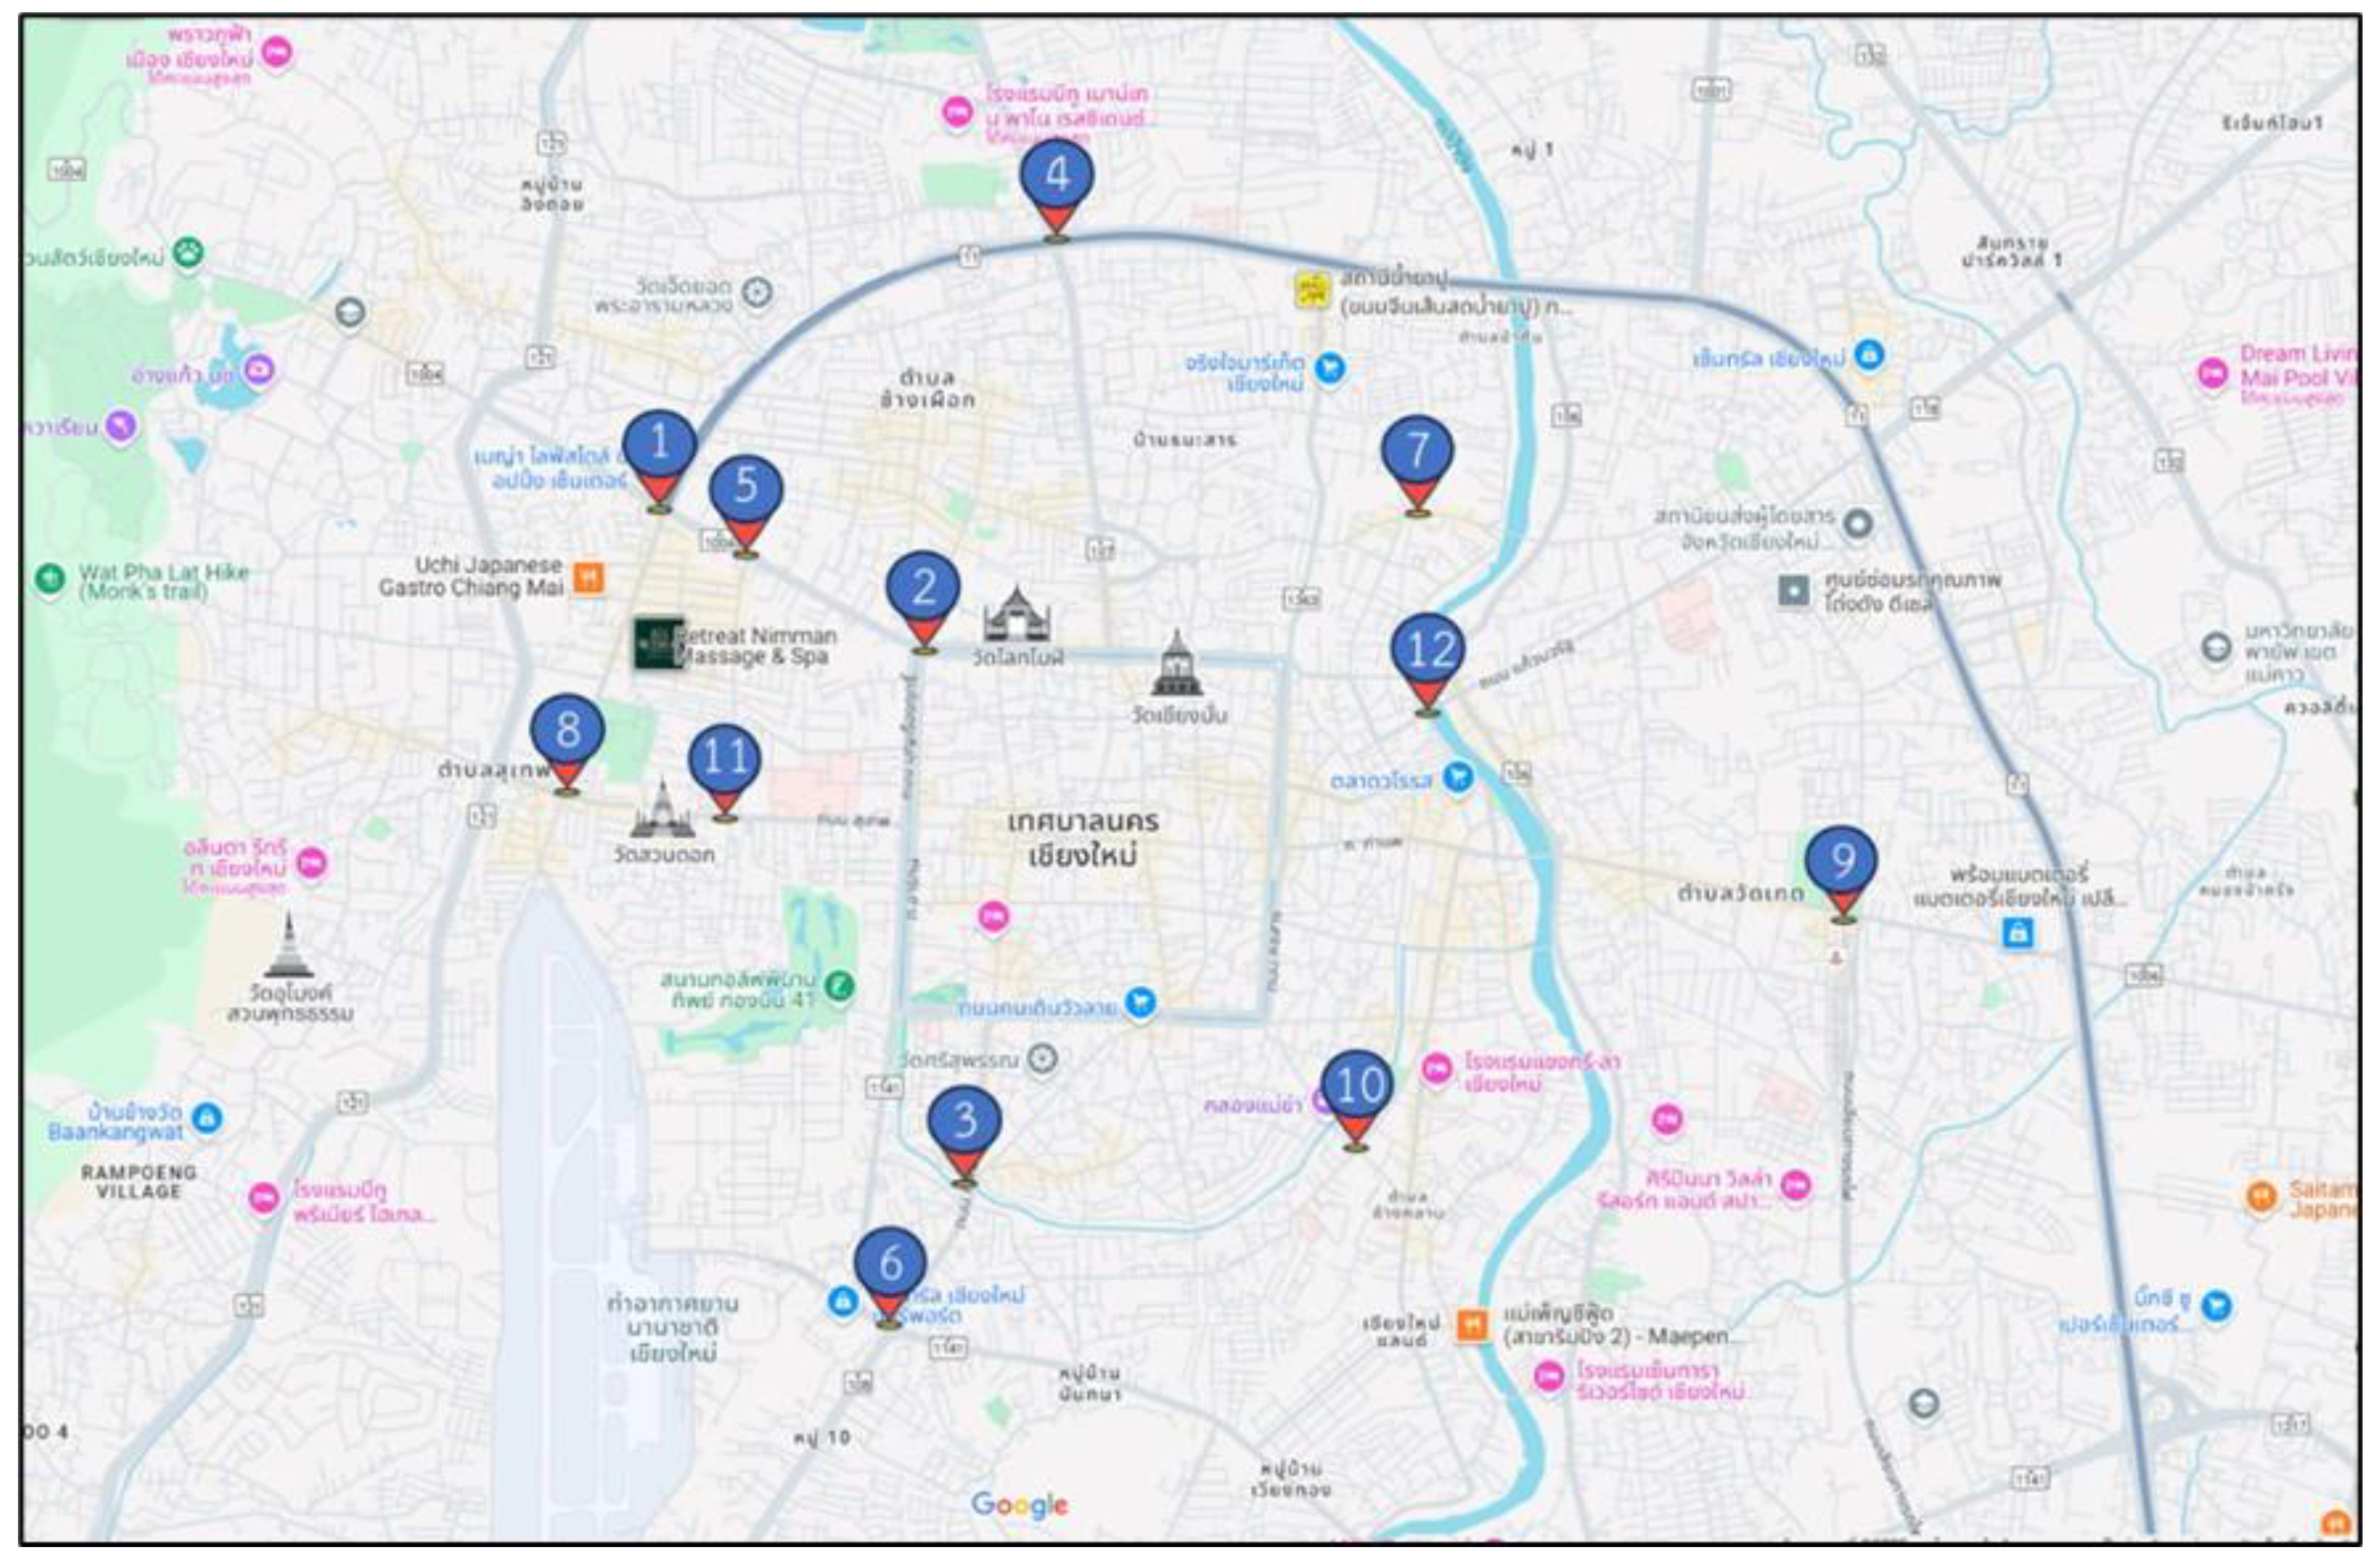
3.1. Data Collection

In this study, the data were collected from 12 signalized urban intersections in Chiang Mai City, Thailand. These intersections were selected to represent a range of intersection geometric configurations, traffic volumes, and operational characteristics, ensuring the framework’s applicability across various urban contexts. Figure 4 shows a map of the location’s intersections, while Figure 5 shows the signalized intersections selected as study areas. It is noted that the numbers in parentheses indicate the hourly traffic volumes on a specified intersection approach.
These selected signalized intersections vary in physical and operational characteristics, as presented in Table 1, making them ideal for comprehensive analysis. For example, lane configurations vary from a single lane to five lanes. Lane widths of the intersection approaches range from 2.4 to 4.5 m. There are dedicated left-turn lanes at seven intersections and medians at six intersections that could affect the traffic flow. The signal cycle lengths vary from moderate to high due to continuous traffic flow in urban areas due to continuous traffic flow patterns. Approach speeds are in the range of 12.4 km/h at Rincome to 20.3 km/h at the airport intersection, and eight out of the total twelve intersections incorporate motorcycle boxes on the intersection approaches. The variation enhanced the applicability of the research findings to similar urban environments, consistent with [37], who strategically selected intersections across different districts of Riyadh, representing various traffic patterns and urban dynamics.

3.2. Microscopic Traffic Simulation Model Development

The microscopic traffic simulation models are developed by using PTV Vissim software. The model development process followed multiple steps to define the characteristics, layouts, traffic signals, and motorcycle boxes at intersections.
  • Characteristics of Intersections
This study developed three typical sections of the intersections: two-lane, four-lane, and six-lane signalized intersections, all classified as light traffic intersections. The analysis considered only the entrance to the intersection of the main road, as the selection of the motorcycle box installation point is based on inbound roads and evaluated individually.
  • Lane width
The width of the traffic lanes affects motorcyclists’ behaviors. According to the standard specifications in Thailand, the recommended lane width for installing the motorcycle box should be at least 3 m [38,39]. If the lane width is narrower than 3 m, motorcyclists are unable to filter toward the motorcycle box effectively, as observed during the model development’s analysis and testing. This is comparable to Malaysia’s standard of 3.25–3.65 m and Indonesia’s range of 3.0–3.5 m for similar motorcycle facilities [30,40]. This study selected a lane width of 3.5 m as a typical lane width for the model development.
  • Traffic signal configuration
A traffic signal configuration used in the model development follows a split-phase signal pattern, with left turns prohibited as typically operated in the study area. Left-turn vehicles must wait for the signal. Installing the motorcycle box at the intersection where left-turning vehicles are free to turn could cause motorcyclists to move toward the stop line, potentially obstructing the left-turning vehicle. Regarding the cycle time, this study set the vehicle signal cycle for the main road intersections to a duration of 240 s for intersections with four and six traffic lanes. For intersections with two lanes, the signal cycle was set to 180 s per cycle.
  • The size of the motorcycle box
The motorcycle box in the study area is 5 m in length, as it needs motorcyclists to wait for the traffic signal. The area is designated to allow two rows (2 m per row) for motorcycles. Therefore, the researcher chose to use the 5 m box to develop the model.
This study selected the traffic volume for two types of vehicles in urban areas, motorcycles and passenger cars, and determined the optimal proportion of motorcycles for installing a motorcycle box. The sensitivity model input utilizes traffic volumes of 100, 200, 300, 400, and 500 vehicles per hour per lane. These volumes are divided into the traffic of motorcycles and passenger cars, resulting in a more varied proportion of motorcycles to passenger cars.
  • Parameters for motorcycle box base model
The base model simulates motorcycle behavior in traffic through calibrated Vissim driving parameters. Motorcycles maintain the “Desired position at free-flow” in the “Middle of the lane” with a “Collision time gain” of 2.00 s and “Minimum longitudinal speed” of 3.60 km/h. Safety distances are precisely defined, with a “Minimum lateral distance standing” of 0.25 m at 0 km/h and a “Minimum lateral distance driving” of 0.15 m at 50 km/h, plus a “Min. clearance (front/rear)” of 0.20 m. The model’s perception system allows motorcycles to monitor up to a “Look ahead distance” of 250.00 m and a “Look back distance” of 150.00 m simultaneously. Braking behavior follows the “Wiedemann 74” model with a “Maximum deceleration” set at −4.00 m/s2 for the motorcycle and −3.00 m/s2 for trailing vehicles. These parameters collectively enable the model to replicate the movement patterns and traffic interactions characteristic of motorcycle behavior in Chiang Mai traffic scenarios.

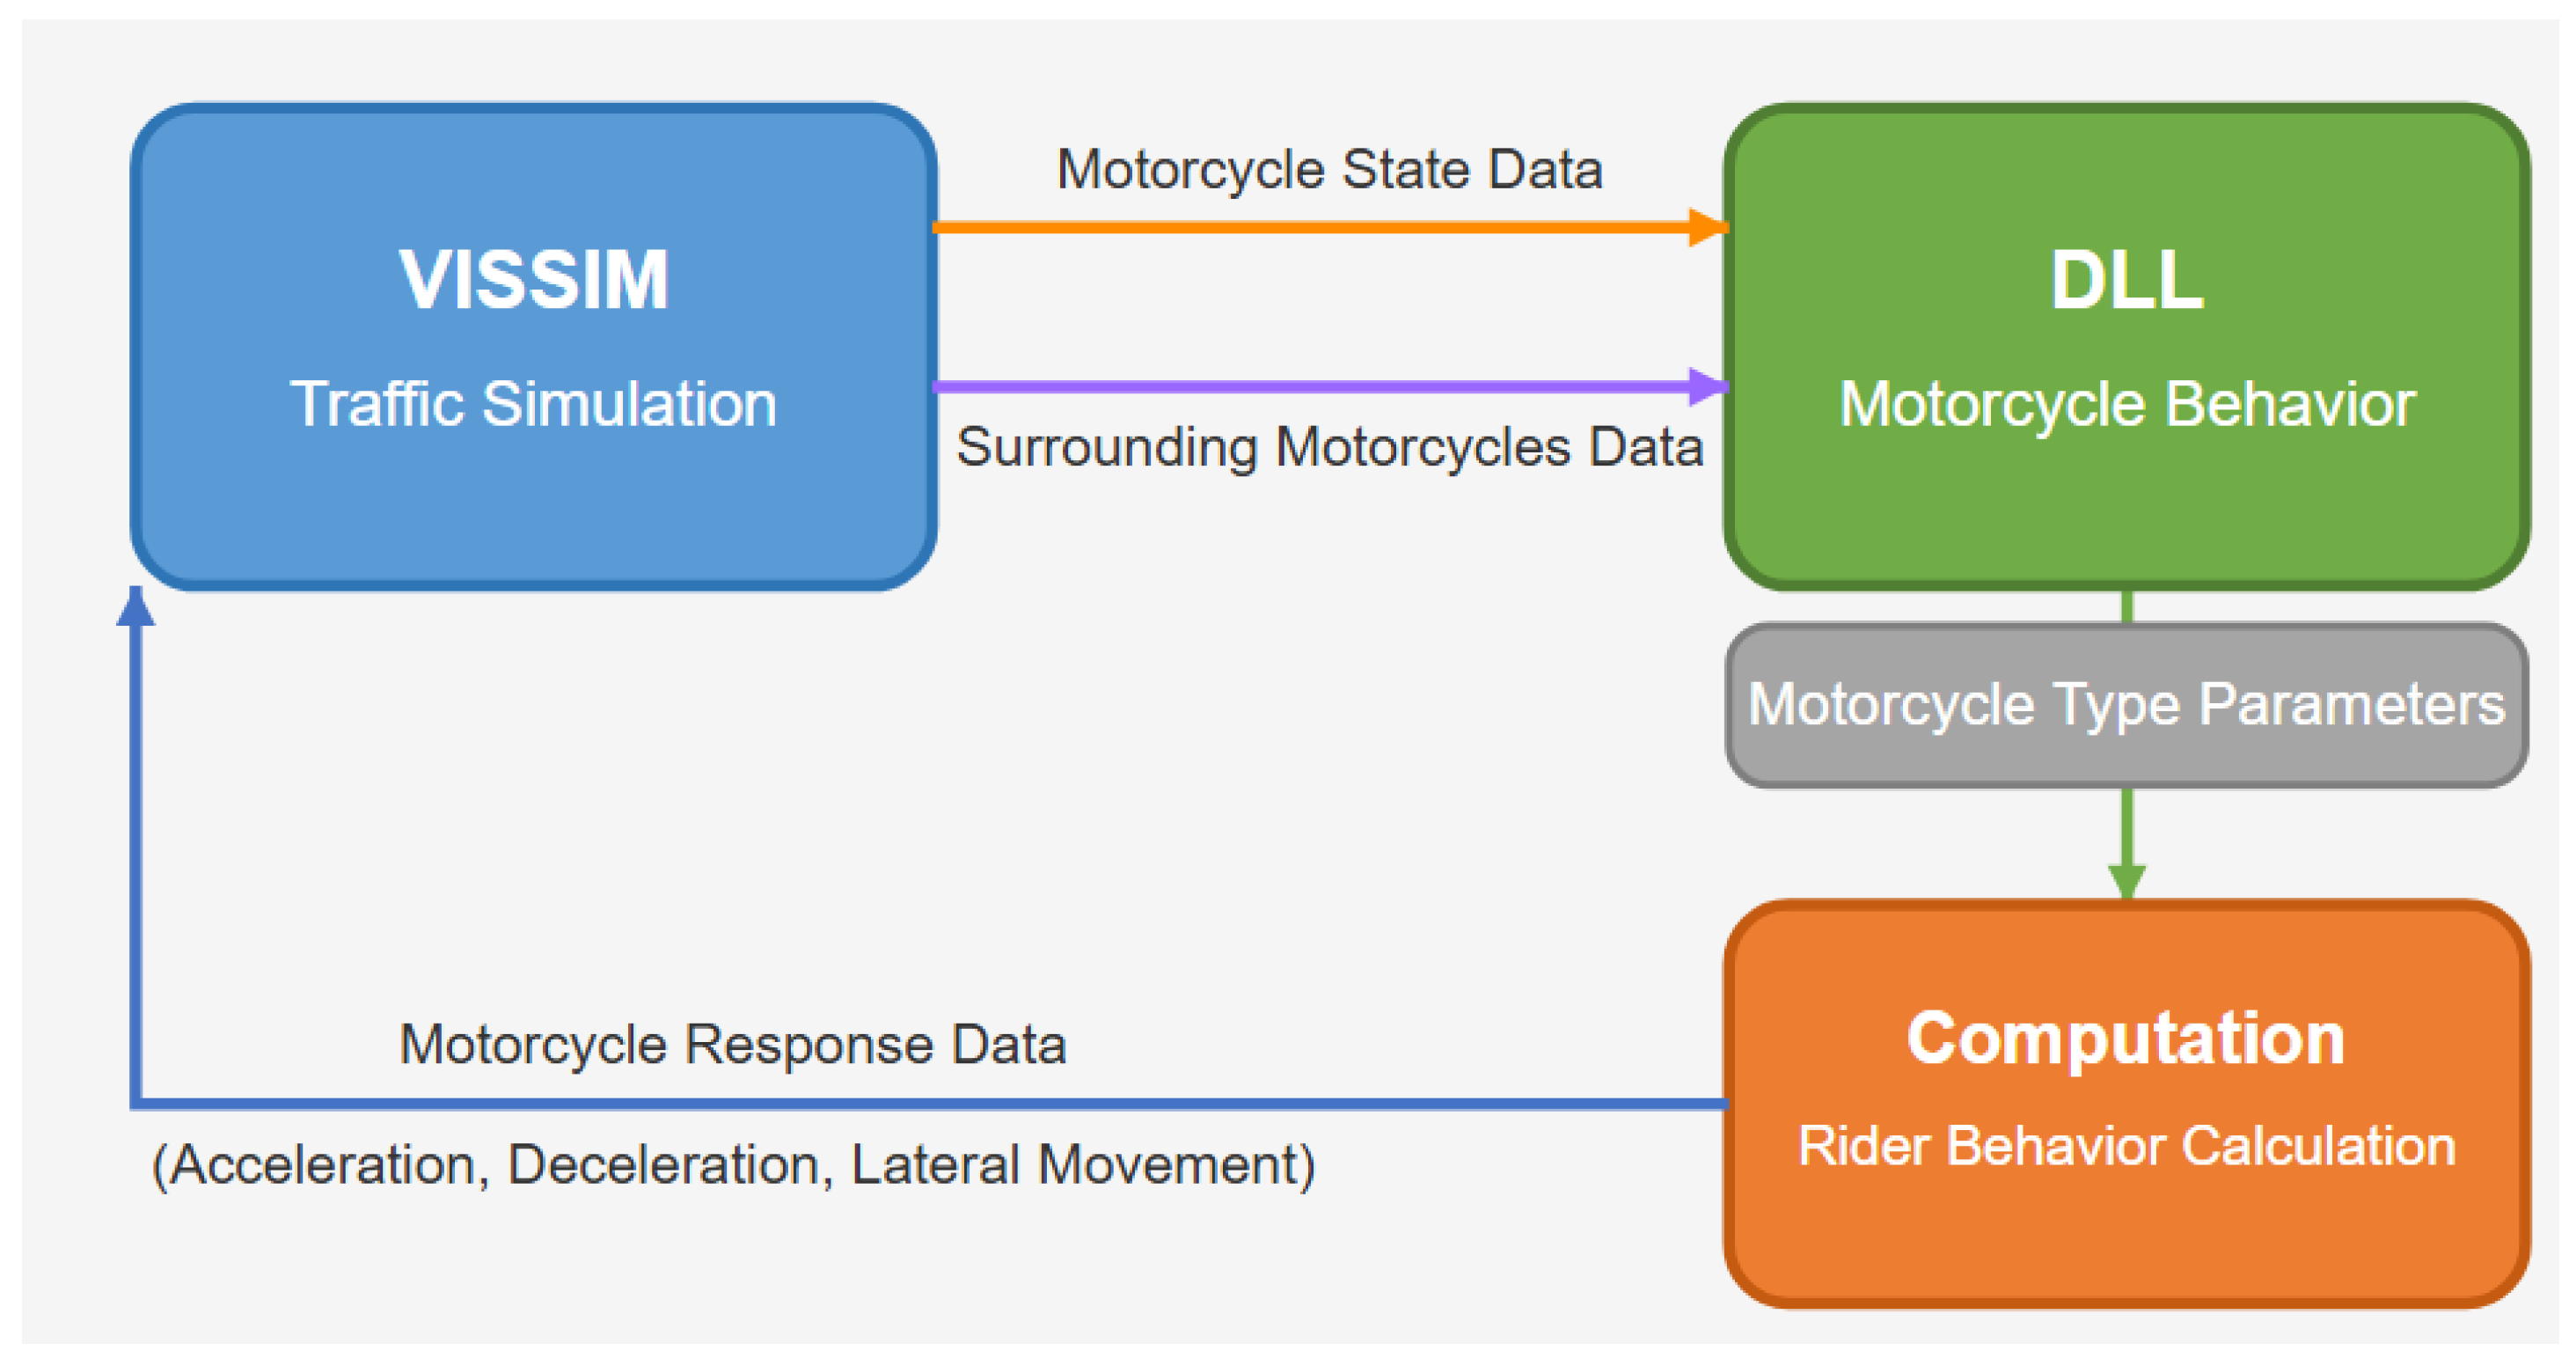
3.3. Traffic Simulation with Motorcycle External Driver Model (MC-EDM)

Motorcycles behave quite differently from vehicles in traffic, especially in urban areas, where they weave through vehicles and move to the front of the line during red traffic lights. Most traffic simulation models are built around cars and trucks, so they do not replicate the way motorcycles travel. To solve this problem, this study built a unique motorcycle movement model, called the “External Driver Model (EDM)”, in the high-level programming language C++ with the help of PTV Vissim’s API.
EDM is a technology specifically created to model motorcycle dynamics in mixed traffic accurately, particularly to simulate realistic filtering and weaving behaviors at intersections. It makes an on-the-fly selection from the three following filtering strategies: normal filtering for slow traffic; front-seeking to push through as aggressively as possible to the front of queues; and aggressive filtering for high-speed, tight-gap pulp, depending on the real-time road conditions, such as speed, which is based on the intersection’s distance, as well as the available space, which are all reported at a faster-than-competitive, per-cycle frequency. It actively checks for safety by controlling the lean angle of the motorcycle, detecting secure gaps, and blocking unsafe lane changes. It also prioritizes intersections, estimates queues, and allows motorcycles in front when they need to. The EDM utilizes Vissim’s API to create more realistic, real-time traffic simulations for traffic planning and safety analyses. It uses how well the motorcycle behaves by making intelligent decisions, smooth filtering in lanes, and handling at intersections through EDM, so this study can better model the behavior of the most dynamic and responsive vehicle at high density.
Figure 6 shows the data exchange flow chart for the motorcycle simulation. It integrates a PTV Vissim traffic simulation and motorcycle EDM. The DLL component receives information such as motorcycle state data and surrounding motorcycles from PTV Vissim traffic simulations, which are processed in a litter that requires the parameters to be configured specifically for motorcycle types. Based on these inputs, the computation module computes rider behavior responses (acceleration, deceleration, and lane-filtering movements) and returns the response data to the PTV Vissim traffic simulation. This process creates a continuous feedback loop that facilitates a realistic simulation of motorcycle traffic patterns, including their maneuverability characteristics, lane-filtering behavior, and interactions with other road users under mixed traffic conditions.
The motorcycle filtering model algorithm was developed to simulate motorcyclists’ behaviors in congested traffic, especially when approaching intersections. It starts with evaluating how far the motorcycle had traveled (speed, position) and the minimum distance to the nearest signal. The motorcycle selected one of three behaviors: normal (default), aggressive (when the path times out), or front-seeking (when near the queue front) based on the queue’s traffic conditions. Central to the algorithm was the determination of whether a gap between tending or slowing vehicles was large enough for the motorcycle to pass, given its width, the addition of safety margins, and the current speed. A priority score was assigned to each potential gap depending on its position and whether the gap led to the intersection. Upon entering the gap, the motorcycle underwent a tri-phased filtering transition: preparation (closer to car position adjustments), entry (interaction through the gap), and stabilization (normal road reorientation). At each iteration, the algorithm computes/recalculates the control parameters (alert factors laterally, its desired velocity, steering angle, and turn indicators) for the vehicle so that safety can be managed continuously while moving through heavy traffic.
This model dynamically selected filtering strategies based on measurable traffic conditions. When motorcycles approach intersections (when d_i < d_threshold) in slow-moving traffic conditions (v < v_threshold), motorcycle riders switch between normal, aggressive, forward, and elderly strategy behaviors depending on the rider type, arrival time, and estimated distance to the front of the motorcycle queue; this approach mirrors the behavior of motorcycle riders when entering dense intersections to ensure safe lane insertion. The model checks for safe gaps based on how fast the motorcycle is going, making sure that motorcycles need more room when they are moving quickly. The model also includes safety rules that take into account the motorcycle’s surroundings and situation, making sure to keep a safe distance from large vehicles like trucks or buses and from vehicles that produce a lot of smoke, as long as there is enough space on the side. Each possible gap is given a score ρ that reflects how important it is, based on how far away it is, where it is located, and how it connects to the intersection, with higher scores for gaps that lead straight to a traffic light.
The model incorporates three lane insertion processes as follows: φ1: preparation, φ2: approach, and φ3: safe and secure insertion. Each step corresponds to a different control behavior and movement intention. In the preparation phase, the motorcycles start to make slight lateral movements toward the target gap (i.e., m.λ_target ← g*.λ·(α1 + β1·p)). As they approach the target, the lateral movements intensify (steps φ2), and upon reaching the gap, the riders stabilize (steps φ3) and align themselves to the desired direction, reflecting the gradual and stepwise nature of real-world lane insertion. This gradual method of adjusting parameters matches the lane insertion patterns seen in real-life data and the paths tracked from vehicle detection. For older riders, the model introduces additional safety constraints based on the survey data. These riders exhibit more cautious behaviors. They avoid narrow lanes (w < w_elderly_safe) and take longer to make lane insertion decisions due to increased cognitive processing times. Their speed is also limited (v_desired ≤ v_elderly_max), reflecting the observed slower driving speeds and safety-driven preference for stable positions in traffic streams. Appendix A displays the details of the algorithm.
This study developed microscopic traffic simulation models for two conditions: the base simulation model (without the motorcycle EDM) and the simulation model (with the motorcycle EDM). Figure 7 illustrates the traffic simulation models of four-lane intersection approaches without the MC-EDM and with the MC-EDM.

4. Model Calibration and Validation

This study proposed motorcycle riding and stopping models on signalized intersection approaches and integrated them into microscopic traffic simulation models of motorcycle box intersections. The models were validated by comparing simulation outputs against the real-world traffic data collected from video analytics at three different intersections with varying lane configurations. After the simulation model development, the study calibrated and validated the models using entropy analysis and visualization of the vehicle movement patterns. All validation results demonstrated statistical significance at the 95% confidence level.

4.1. Model Calibration and Validation on Stopping and Filtering Behaviors

For model calibration and validation, this study utilized Shannon entropy distribution to describe the vehicle stopping location and motorcycle lane filtering. In this method, the area of the intersection approach is divided into 1 × 1 square meters, and then the probability distribution of each location being occupied by motorcycles or vehicles is calculated based on the vehicle maneuvers collected from the video analytics in the study areas.
Three intersections with different intersection layouts (two-lane, four-lane, and six-lane intersection approaches) were selected to track motorcycle filtering behaviors. The results from all three intersections showed that the MC-EDM model could simulate the lane-changing behavior of motorcycles more accurately compared to the base model, especially in terms of lateral position entropy, which was an important indicator of spatial distribution. Table 2, Table 3 and Table 4 present the calibration results of the base Vissim model and the MC-EDM model related to three intersections.
  • Two-lane intersection (Phrachasamphan intersection): The lateral position entropy from the field data was 1.014. The MC-EDM model gave a value of 1.052 (deviation +3.75%), while the base Vissim model showed a deviation as high as +34.32%.
  • Four-lane intersection (Rincome intersection): The lateral position entropy from the field data was 1.142. The MC-EDM model gave a value of 1.187 (deviation +3.94%), while the base Vissim model showed a deviation of up to +19.44%.
  • Six-lane intersection (railway station intersection): The lateral position entropy from the field data was 1.075. The MC-EDM model gave a value of 1.128 (deviation +4.93%), while the base Vissim model showed a deviation as high as +37.95%.
In addition, the motorcycle filtering rate, which is another important indicator of motorcycle behavior at an intersection, showed that the MC-EDM model can replicate the behavior close to real-world traffic.
  • Two-lane intersection (Phrachasamphan intersection): The field data had a 65.7% motorcycle filtering rate, while the MC-EDM model gave 63.8% (deviation −2.89%).
  • Four-lane intersection (Rincome intersection): The field data had a 75.3% motorcycle filtering rate, while the MC-EDM model gave 73.5% (deviation −2.89%).
  • Six-lane intersection (railway station intersection): The field data had a 65.7% motorcycle filtering rate, while the MC-EDM model gave 63.8% (deviation −2.89%).
The results also showed the differences in motorcycle volumes. The railway station intersection had the highest motorcycle volumes (425 motorcycles/hour/lane), followed by the Rincome intersection (312 motorcycles/hour/lane) and the Phrachasamphan intersection (263 motorcycles/hour/lane). The MC-EDM model accurately simulated these behaviors with deviations of less than 5% and RMSE values below 1.2 at all intersections. To further validate the model, paired t-tests were conducted comparing the MC-EDM results with field data across key measures (Table 2, Table 3 and Table 4). The statistical analysis revealed that the MC-EDM model showed no significant differences from the field observations at a 95% confidence level across all key metrics (p > 0.05). For lateral position entropy, the MC-EDM model demonstrated strong statistical alignment with the field data (t(2) = 2.31, p = 0.147), whereas the base model exhibited a significant deviation (t(2) = 8.76, p = 0.013). Similarly, for motorcycle filtering rates, the MC-EDM model results (t(2) = 2.52, p = 0.128) were statistically comparable to the field observations, while the base model showed significant differences (t(2) = 9.47, p = 0.011).
Spatial distribution data showed motorcycle clustering at the edge of the lane (0–5 m), while passenger cars were more evenly distributed. The highest motorcycle density was found at 1 to 7 m from the stop line. The MC-EDM model’s entropy ratio was within an acceptable range (0.85–1.15) according to the standard guidelines. Adjusting parameters such as speed, gap acceptance, and lateral positioning made the model realistic and applicable for planning and designing road infrastructure that effectively accommodated motorcycle driving behavior.

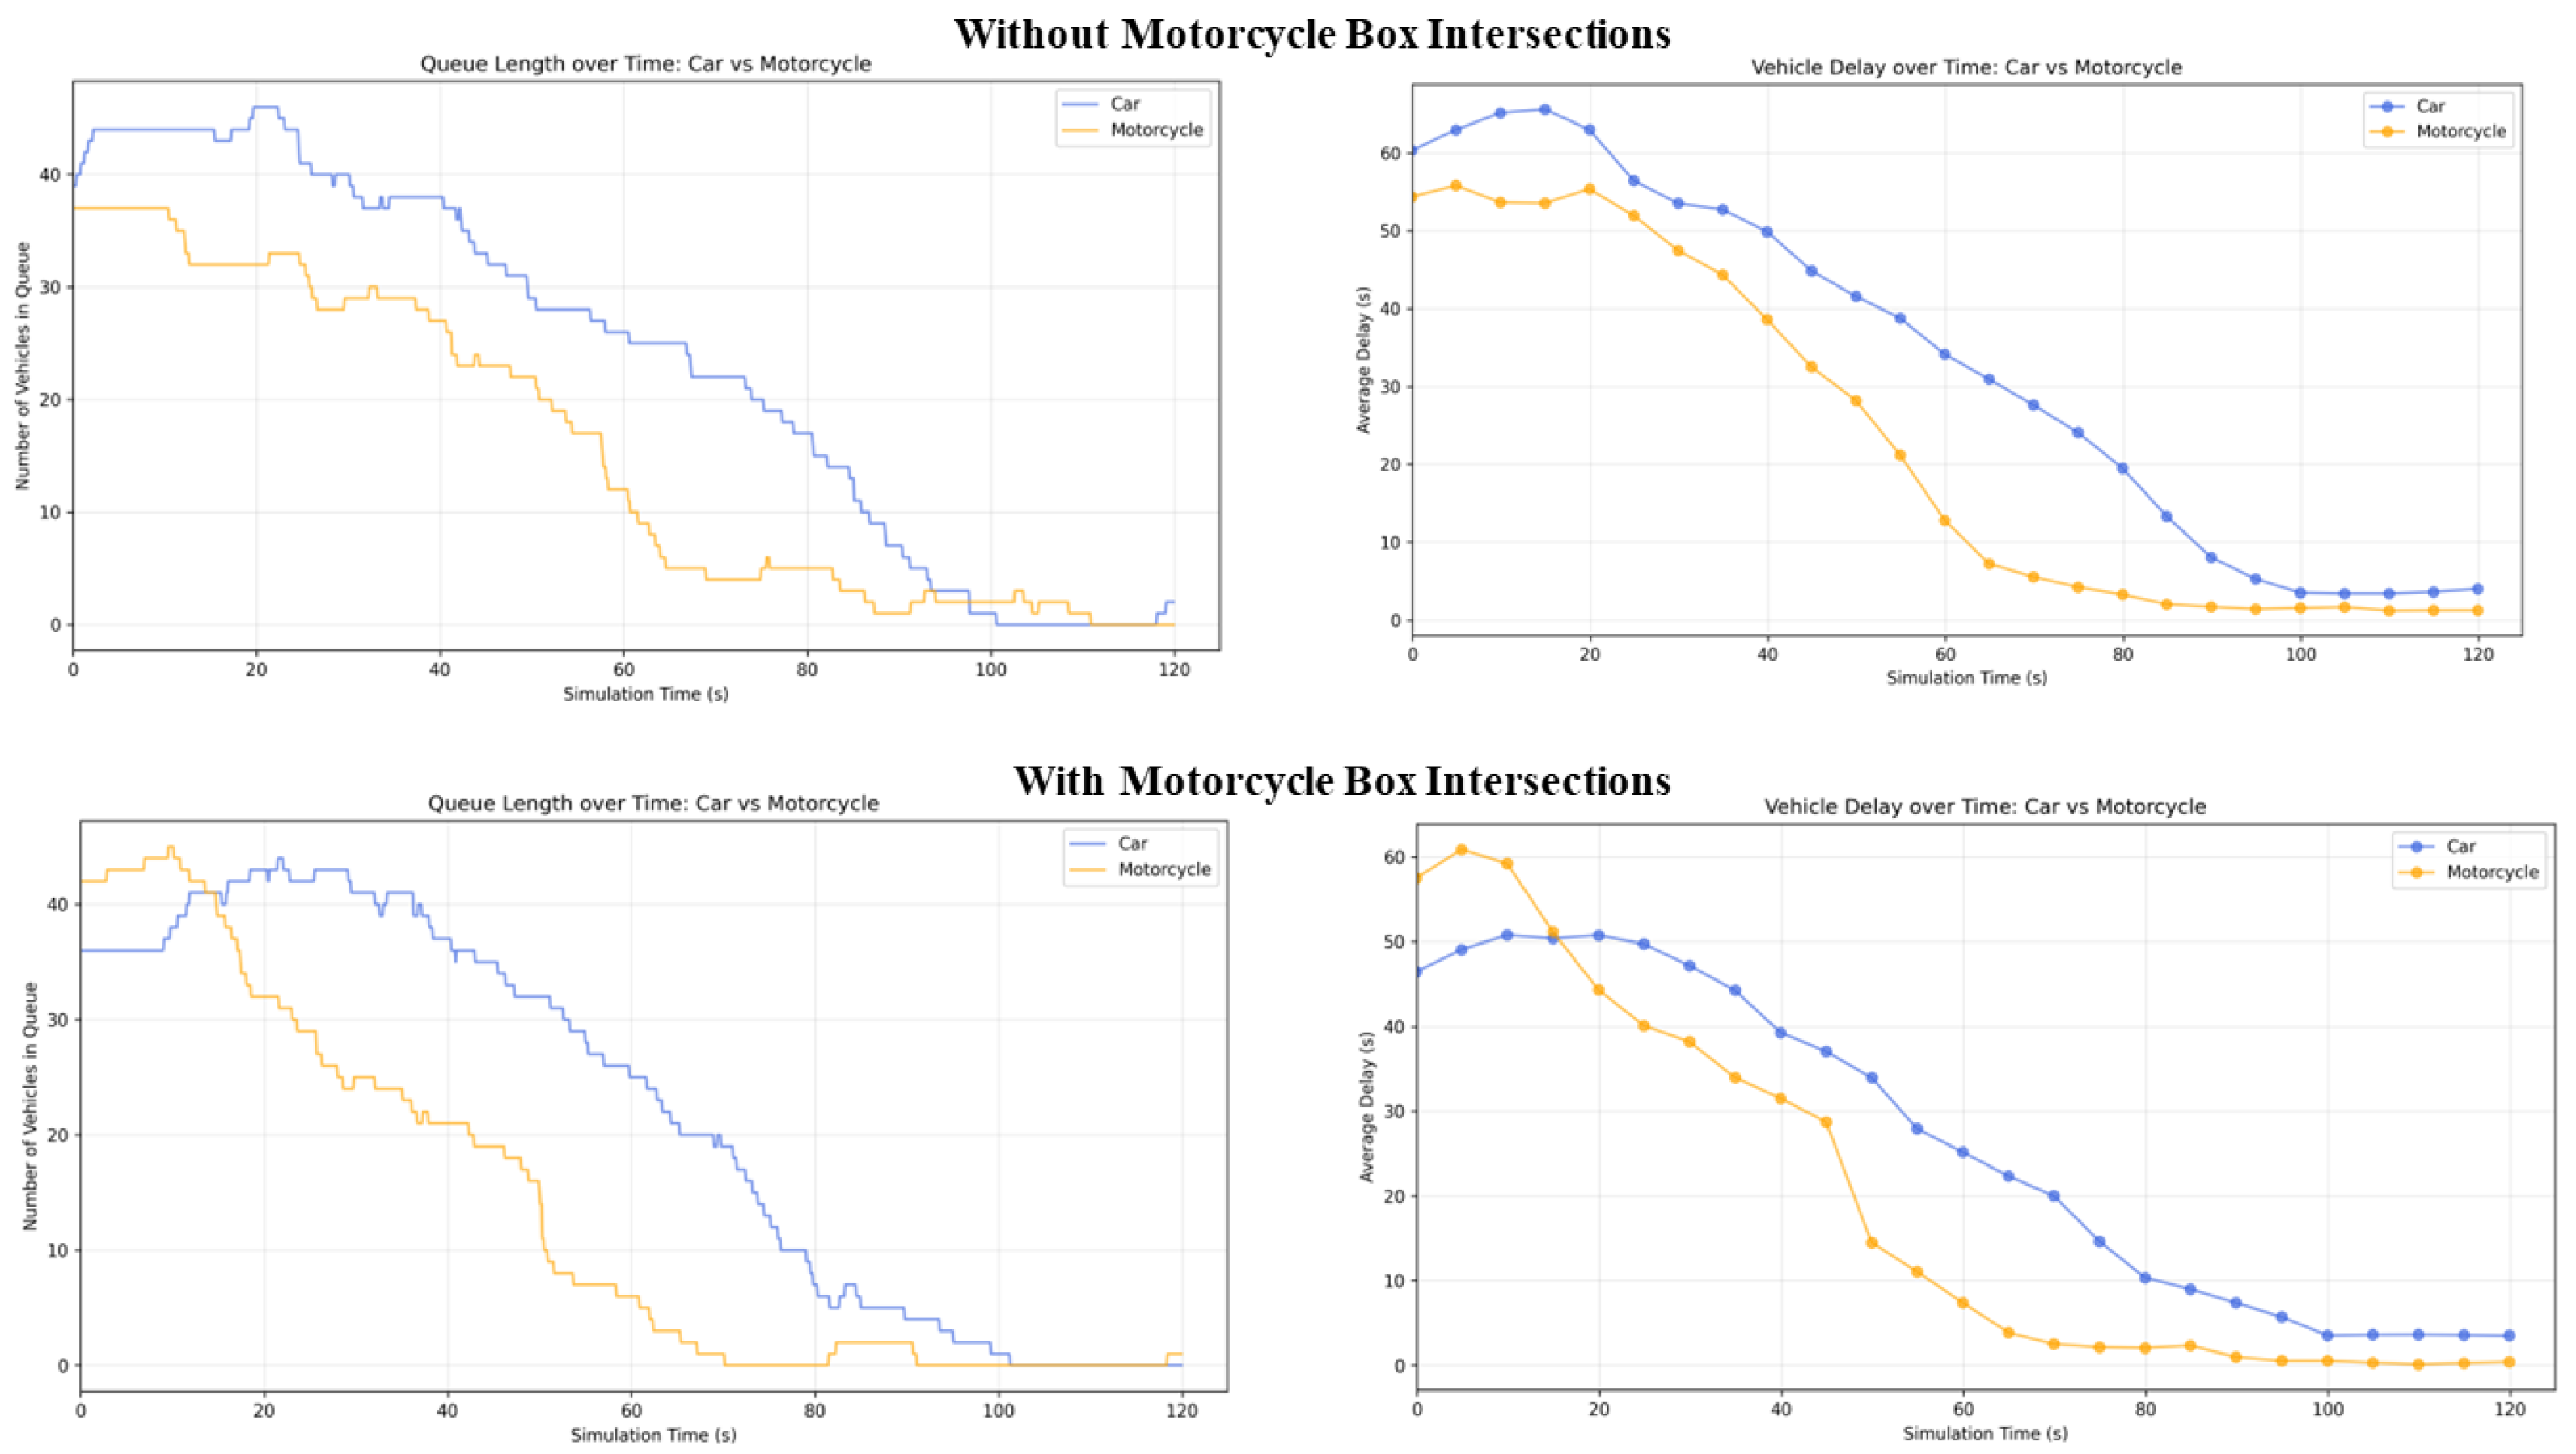
4.2. Spatial-Temporal Visualization of Vehicle Movement Patterns

This study utilized a parallel display method to verify the accuracy of traffic behaviors. In this study, advanced techniques were used to analyze the spatial-temporal vehicle dynamics at a motorcycle box intersection in Chiang Mai, as presented in Figure 8. The upper part of Figure 8 shows the vehicle trajectories: the red line represents motorcycle trajectories, and the green line represents car trajectories, highlighting their movement patterns. The lower part of Figure 8 shows a heat map, representing the level of vehicle density from a low density (in blue) to a high density (in red), indicating congestion levels. Such techniques allow us to visualize the spatial and temporal patterns of traffic flow simultaneously.
This study applied video analytics and computer vision to detect and track 1887 vehicles, including 1242 motorcycles and 645 cars, at three intersections during the peak period. This study divided the area into 0.5 × 0.5 square meters to analyze the distribution and movement patterns.
Based on Kernel Density Estimation (KDE), the results showed a significant difference between motorcycle and car density distribution. For motorcycles, the highest density was 0.87 motorcycles/sq.m. at a motorcycle box and 0.62 motorcycles/sq.m. at lane-filtering zones of traffic lanes and shoulders. For cars, the highest density was 0.31 cars/sq.m. and was uniformly distributed across the traffic lanes.
Based on Ripley’s K-function analysis, the results showed the clustering pattern of motorcycles. The K(r) was 3.24 (mean = 3.14, S.D. = +3.2%) at r = 1.0 m, 14.78 (mean = 12.56, S.D. = +17.7%) at r = 2.0 m, and 102.36 (mean = 78.5, S.D. = +30.4%) at r = 5.0 m. This proved the statistical significance (p < 0.0001) in clustering at all intersections. In particular, at the railway station intersection (six-lane approach), the highest motorcycle volumes of 425 motorcycles per hour per lane with K(r) = 114.72 at r = 5.0 m was apparent, followed by the Prachasamphan intersection (one-lane approach) with K(r) = 105.47, and the Rincome intersection (two-lane approach) with K(r) = 94.81. It showed the orderly clustering of motorcycles in motorcycle boxes.
Comparing the base model and the MC-EDM model, the MC-EDM could produce a better simulation. The MC-EDM model provided a spatial entropy of 4.08 bits, which was closer to that from the field data (4.12 bits) than the base model of 5.27 bits. The MC-EDM model had a temporal persistence of 0.83, which was closer to that from the field data (0.86) than the base model of 0.47. The MC-EDM model could identify the locations of high motorcycle density more accurately than the base model. The MC model provided an accuracy of 91.7% (which differed from the field data by 0.072), while the base model gave 64.2% (which differed from the field data by 0.387).

5. Results and Discussion

Based on the calibrated and validated simulation models, this study developed the simulation models of motorcycle box intersections to evaluate the performance of the motorcycle box installation on intersection approaches. The models considered three intersection sizes (two-lane, four-lane, and six-lane intersections), two types of vehicles (motorcycles and passenger cars), traffic volumes varied between 100 and 500 vehicles per hour per lane, and the motorcycle composition was between 50% and 83% in urban areas of Chiang Mai City. This study evaluated the traffic performance of motorcycle box intersections in three measures: motorcycle flow and filtering rate, traffic flow, and vehicle headway on motorcycle box intersection approaches.

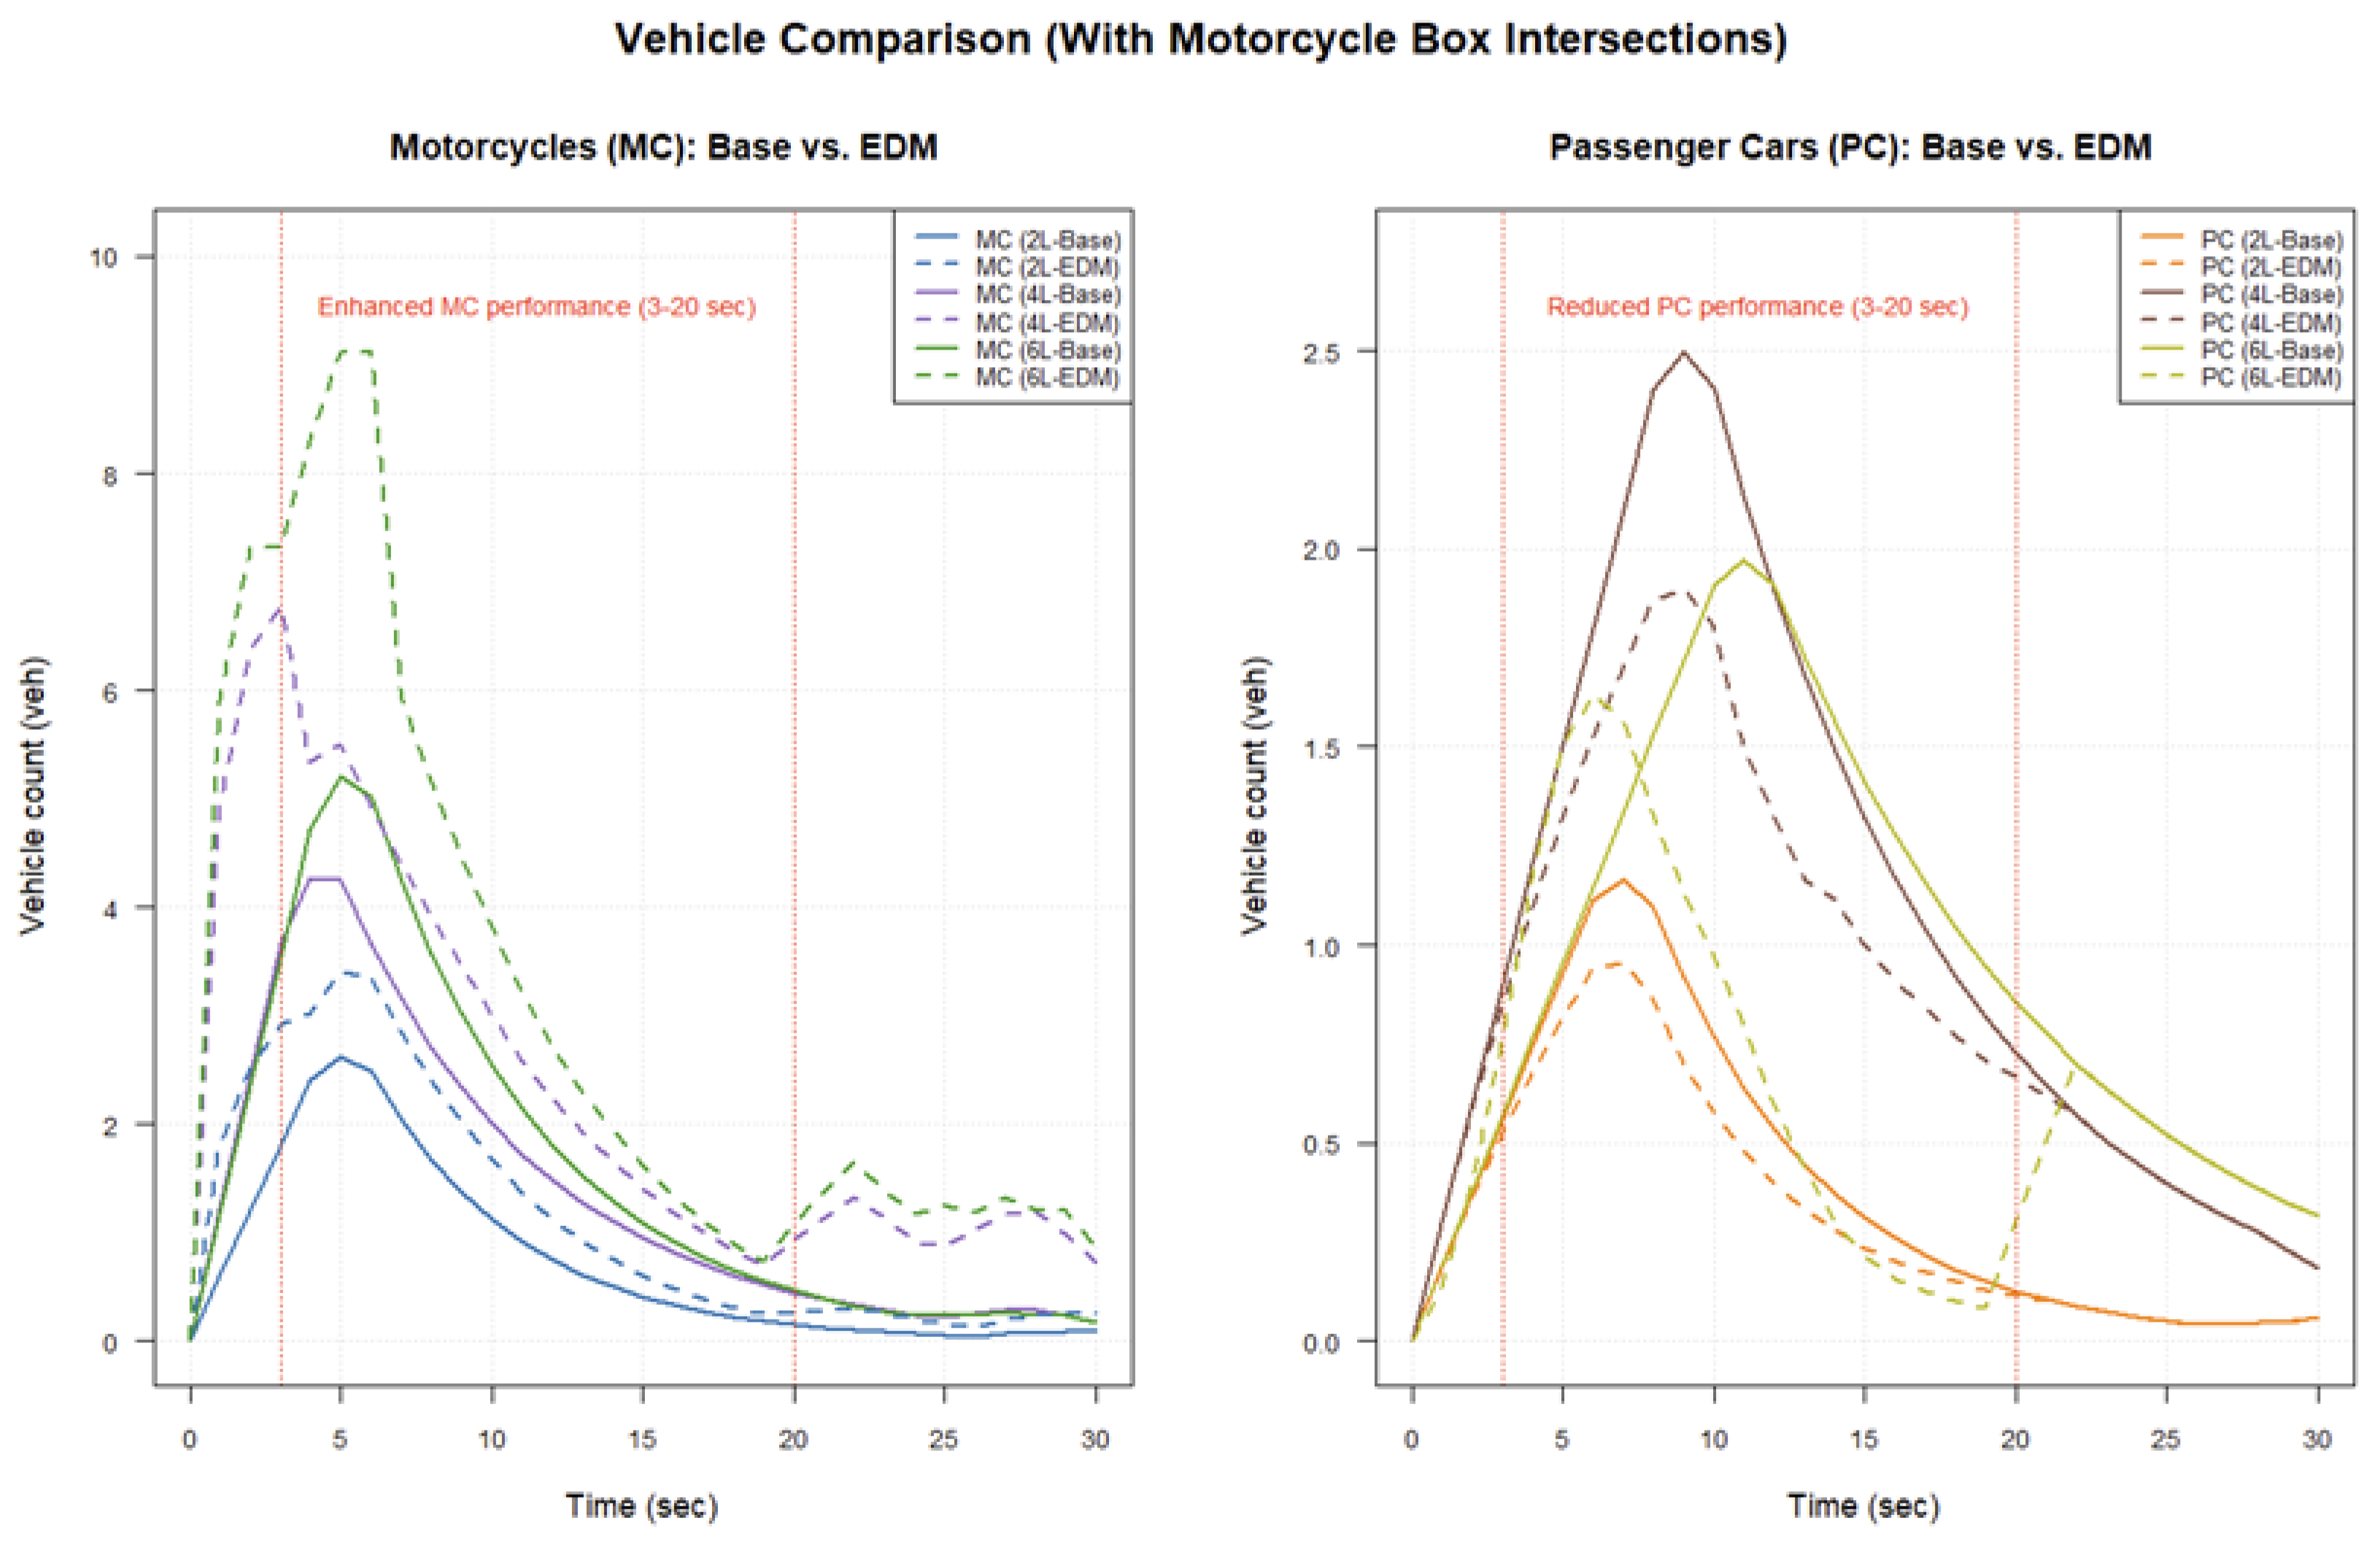
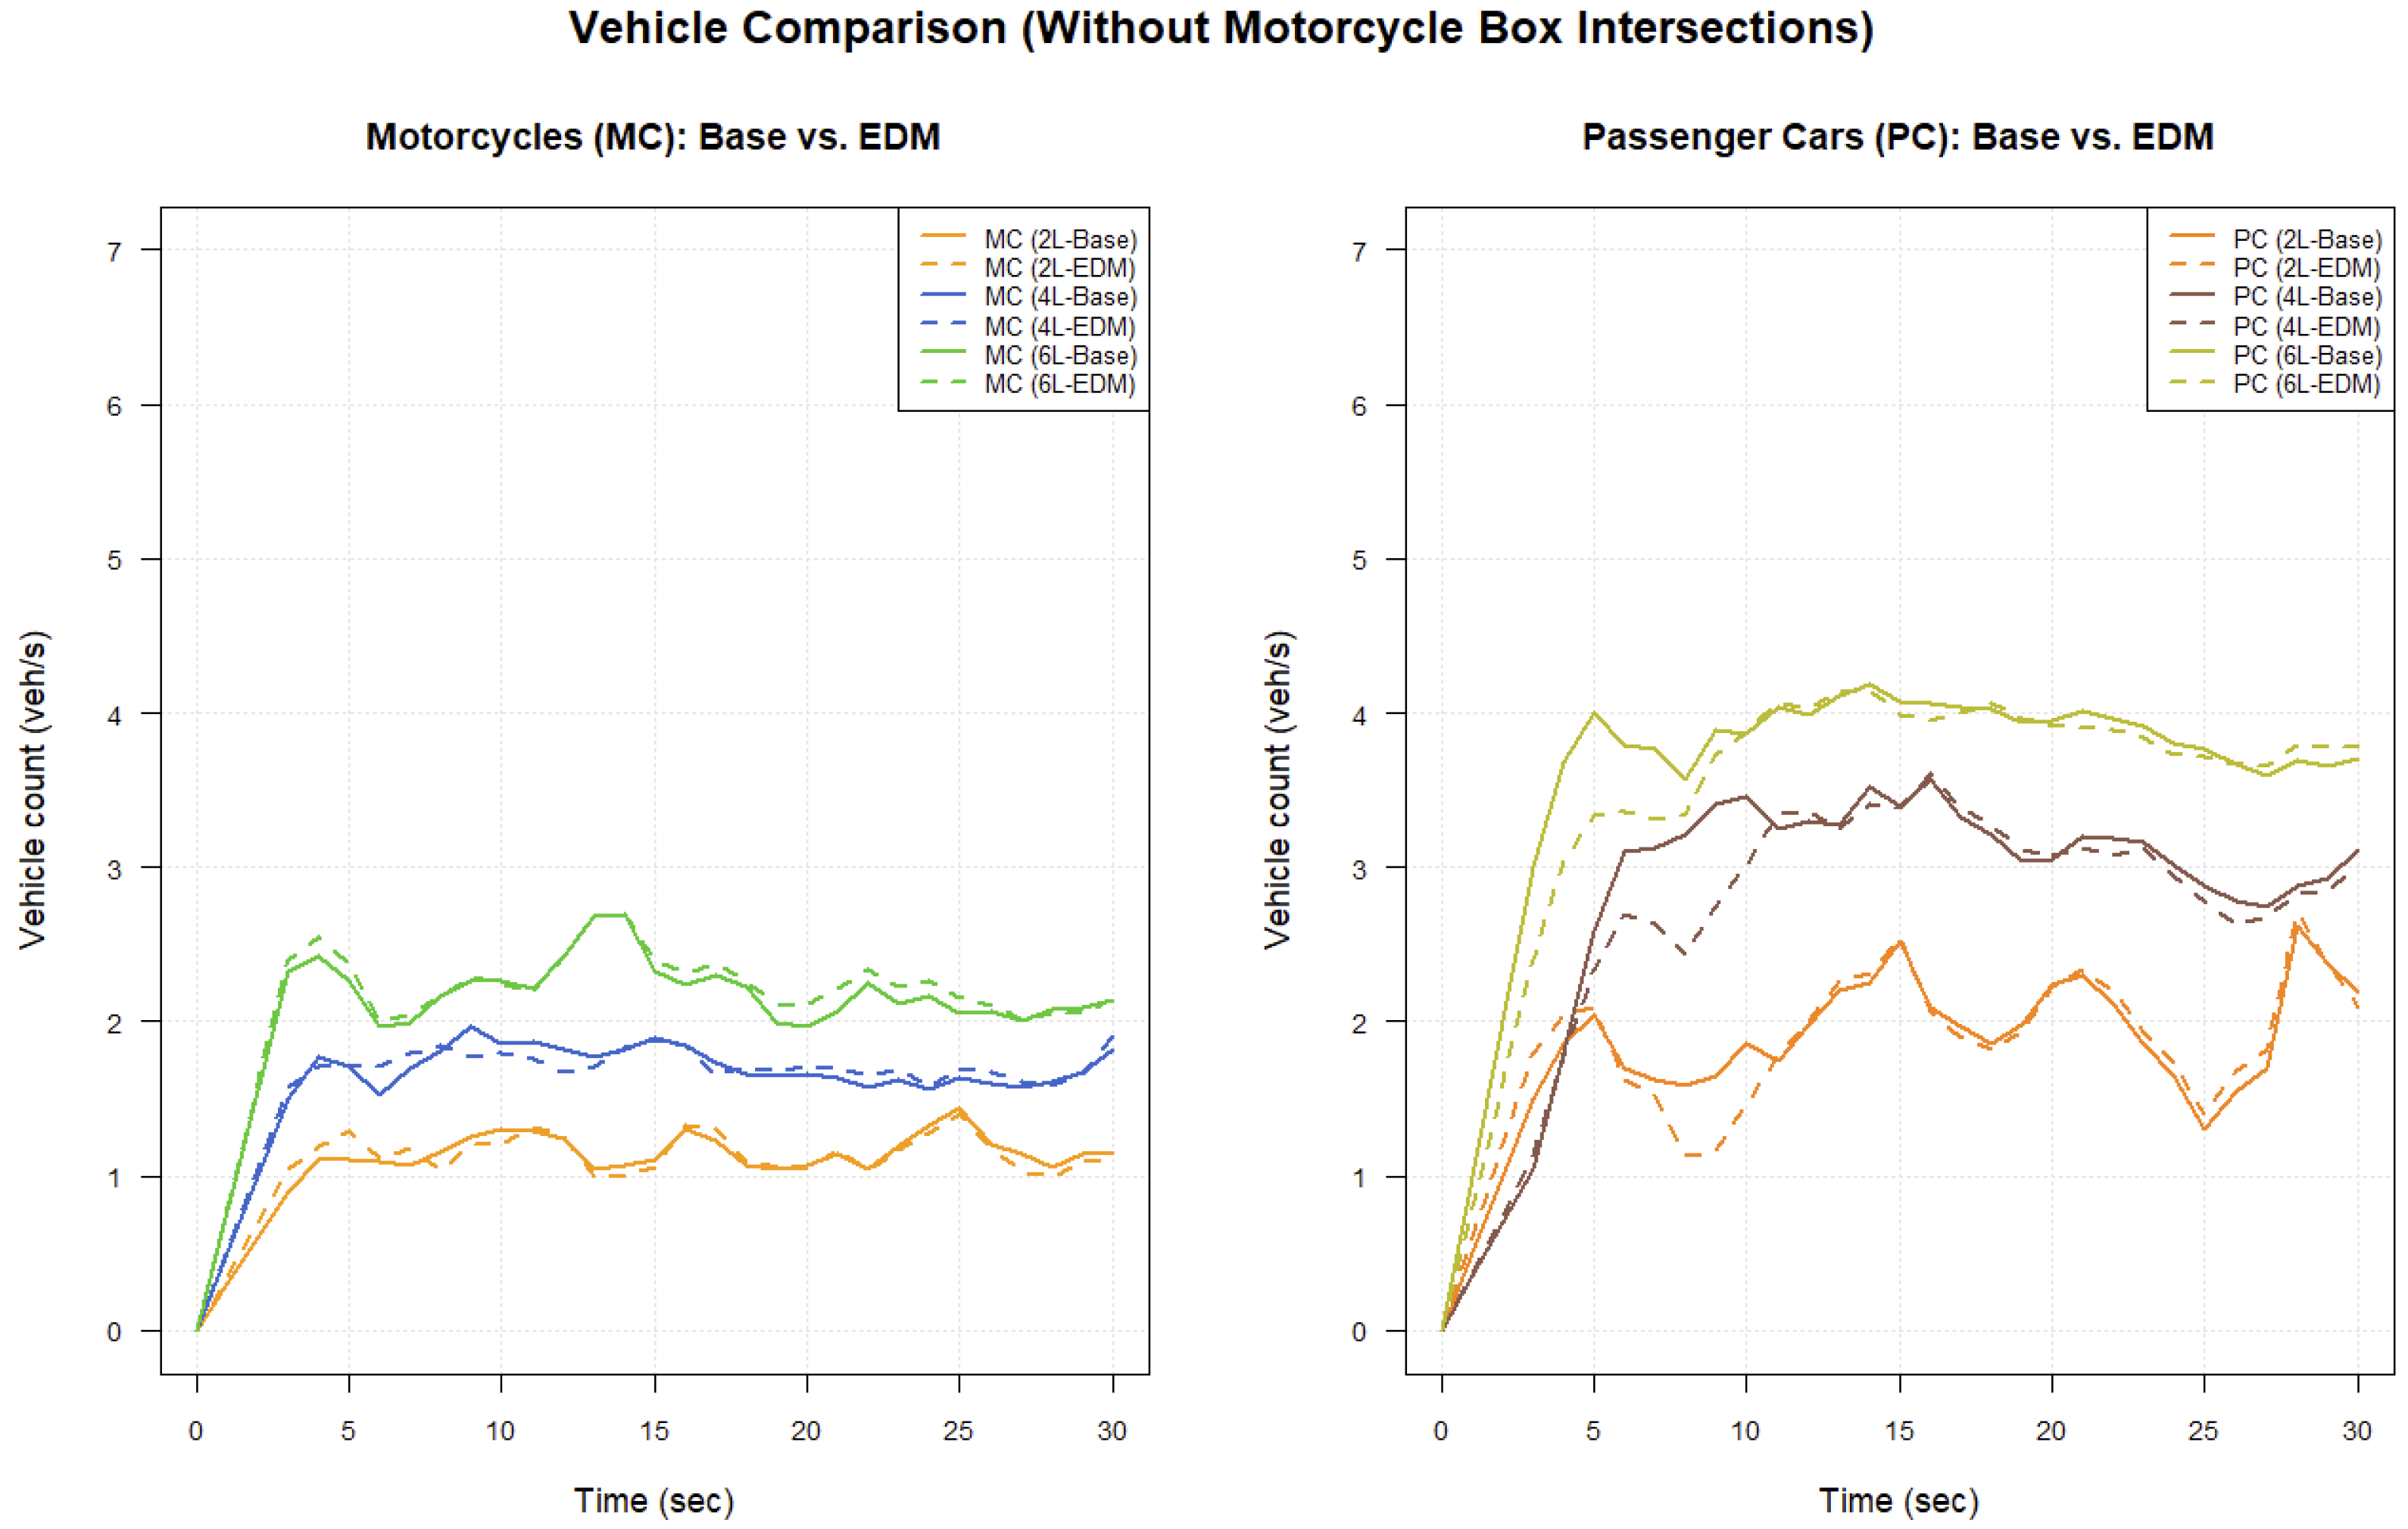
5.1. Flow Rate and Filtering Rate

This study compared the motorcycle flow and filtering rates of simulated motorcycle box intersections between the base model and the MC-EDM model. The performance analysis of motorcycle box intersections, as shown in Figure 9, revealed a clear difference between the base model and the MC-EDM model across all intersection sizes. At the two-lane intersection, the MC-EDM model exhibited the highest motorcycle flow rate of 3.4 vehicles per second in the first 5 s, compared to only 2.5 vehicles per second in the base model, which represented a 36% increase. At the four-lane intersection, the MC-EDM model showed a peak flow rate of 6.8 vehicles per second, compared to 5.4 vehicles per second in the base model (a 25.9% increase). Most notably, at the six-lane intersection, the MC-EDM model provided a peak flow rate of 9.2 vehicles per second, compared to just 7.4 vehicles per second in the base model (a 24.3% increase).
The filtering rate at all intersection sizes with motorcycle boxes showed a clear improvement when using the MC-EDM model. At the two-lane intersection, the filtering rate increased from 58.3% (base model) to 73.5% (MC-EDM model) (+26.1%). At the four-lane intersection, it increased from 63.4% to 78.9% (+24.4%), and at the six-lane intersection, it increased from 65.2% to 82.6% (+26.7%). These values demonstrated that the MC-EDM model could more accurately simulate lane-changing behavior across all intersection sizes, particularly as the number of lanes increased.
In terms of passenger cars, the motorcycle box intersection had varying impacts depending on the size of the intersection. At the two-lane intersection, the MC-EDM model resulted in a decrease in the maximum flow rate of passenger vehicles from 1.0 to 0.9 vehicles per second (−10%). At the four-lane intersection, the flow rate decreased from 2.5 to 2.0 vehicles per second (−20%), and at the six-lane intersection, it decreased from 1.9 to 1.5 vehicles per second (−21.1%). However, at all intersection sizes, it was observed that after 20 s, the flow of passenger vehicles tended to improve, especially at the four-lane and six-lane intersections. This indicates that although the use of the motorcycle box reduces the efficiency of passenger vehicles shortly after the green light, it contributes to better traffic flow in the long run. Similar trends have been observed in the study [41,42], where it was found that the implementation of a red motorcycle box increased the overall traffic flow and made intersection movements smoother and more orderly. Additionally, these boxes have been recognized as an effective measure to enhance traffic flow at intersections by providing a designated waiting area ahead of other motor vehicles, thereby improving visibility and prioritizing movement efficiency [43].
The difference in performance across intersection sizes showed that the motorcycle box is most effective at intersections with a larger number of lanes (six lanes) and lane widths of 3.5 m or more. This corresponds with intersections experiencing higher traffic volumes, where there are more opportunities for lane filtering.
The results from the intersections without motorcycle boxes showed a significantly different movement pattern for motorcycles and passenger cars compared to the intersections with motorcycle boxes, as shown in Figure 10. When examining the graph on the left, which compared the number of motorcycles between the base model and the MC-EDM model, it was evident that the peak flow rates significantly decreased at all intersection sizes. The peak flow rates were 1.2, 1.8, and 2.7 vehicles per second at the two-lane, four-lane, and six-lane intersections, respectively. Compared to the intersections with motorcycle boxes, these values represented a reduction of up to 70.7% at the six-lane intersection.
When comparing intersections without motorcycle boxes, the MC-EDM model showed much less difference from the base model (only a 15.8% difference at the six-lane intersection). Both models exhibited a noticeable decrease in the filtering rate (44.3% and 38.7%, respectively), which was nearly half of the filtering rate observed in the intersections with motorcycle boxes. In contrast, passenger cars benefited from the absence of the motorcycle box, with flow rates increasing by up to 110% at the six-lane intersection and 40% at the four-lane intersection. However, it was interesting to note that the flow rate of passenger cars exhibited high variability and was less smooth, indicating that although a higher volume of vehicles passed through the intersection initially, the overall flow decreased in the long term. A study by [44] found that the motorcycle-stopping space exhibits higher overall saturation flow due to the presence of heavy vehicles, but motorcycles contribute to congestion by blocking traffic flow and delaying other vehicles due to the lack of organized lane usage. In contrast, the motorcycle-stopping space at intersections improves motorcycle movement efficiency and reduces delays for light vehicles, but its overall impact on traffic flow depends on the lane width and vehicle composition.
When considering the overall performance, although the absence of the motorcycle box improved the short-term movement of passenger vehicles, it led to a decrease in overall traffic performance. This is because the movement of motorcycles causes overtaking and lane-cutting behavior throughout the entire traffic signal cycle, which has a significant impact in areas with a high proportion of motorcycles.

5.2. Traffic Flow Analysis

The traffic performance between intersections without and with a motorcycle box showed differences in many factors, such as the average queue length and average delay, as shown in Figure 11. The upper graphs showed an intersection without a motorcycle box. The queue length graph showed that passenger cars (blue line) started with a maximum queue length of about 45 m, which gradually decreased with high fluctuation between 15 and 60 s, reflecting uneven movement. Motorcycles (orange line) started with a queue length of about 35 m and decreased more rapidly than passenger vehicles in the early stages, but there was still a queue remaining until approximately 80 s, with the slope of the graph changing intermittently, indicating an inconsistent queue discharge rate. The delay graph showed that passenger cars had an initial delay of about 55 s, which decreased steadily with relatively low values, while motorcycles had an initial delay of about 50 s and decreased more quickly between 40 and 60 s, although some delays remained until around 80 s.
When compared to intersections with a motorcycle box (lower graphs), several significant differences were observed. The queue length graph shows that the motorcycle queue decreased much more rapidly and consistently, particularly between 20 and 60 s, and was completely cleared by 60 s, which was 20 s faster than in intersections without a motorcycle box. The queue length for passenger cars followed a similar pattern to the case without a motorcycle box but with less fluctuation, indicating more consistent movement. The delay graph (bottom right) shows a rapid decrease in motorcycle delays, especially between 40 and 60 s, with a 70% reduction compared to intersections without a motorcycle box, reaching near zero at 70 s. For passenger cars, the delay decreased by 15–20%, especially toward the end (60–100 s), indicating that while passenger cars experienced slightly more delays in the initial phase, the overall traffic flow improved, resulting in a reduction of overall delay in the long term. A similar study has been observed in a previous study, which found that the implementation of advanced stop lines could reduce delays by improving vehicle organization and optimizing intersection efficiency [45]. Research on the implementation of motorcycle boxes in India indicated that it could help decrease delays at signalized intersections, particularly under specific traffic conditions [24]. This noticeable difference showed that the motorcycle box not only helped motorcycles travel more quickly but also contributed to more organized and efficient overall traffic movement.

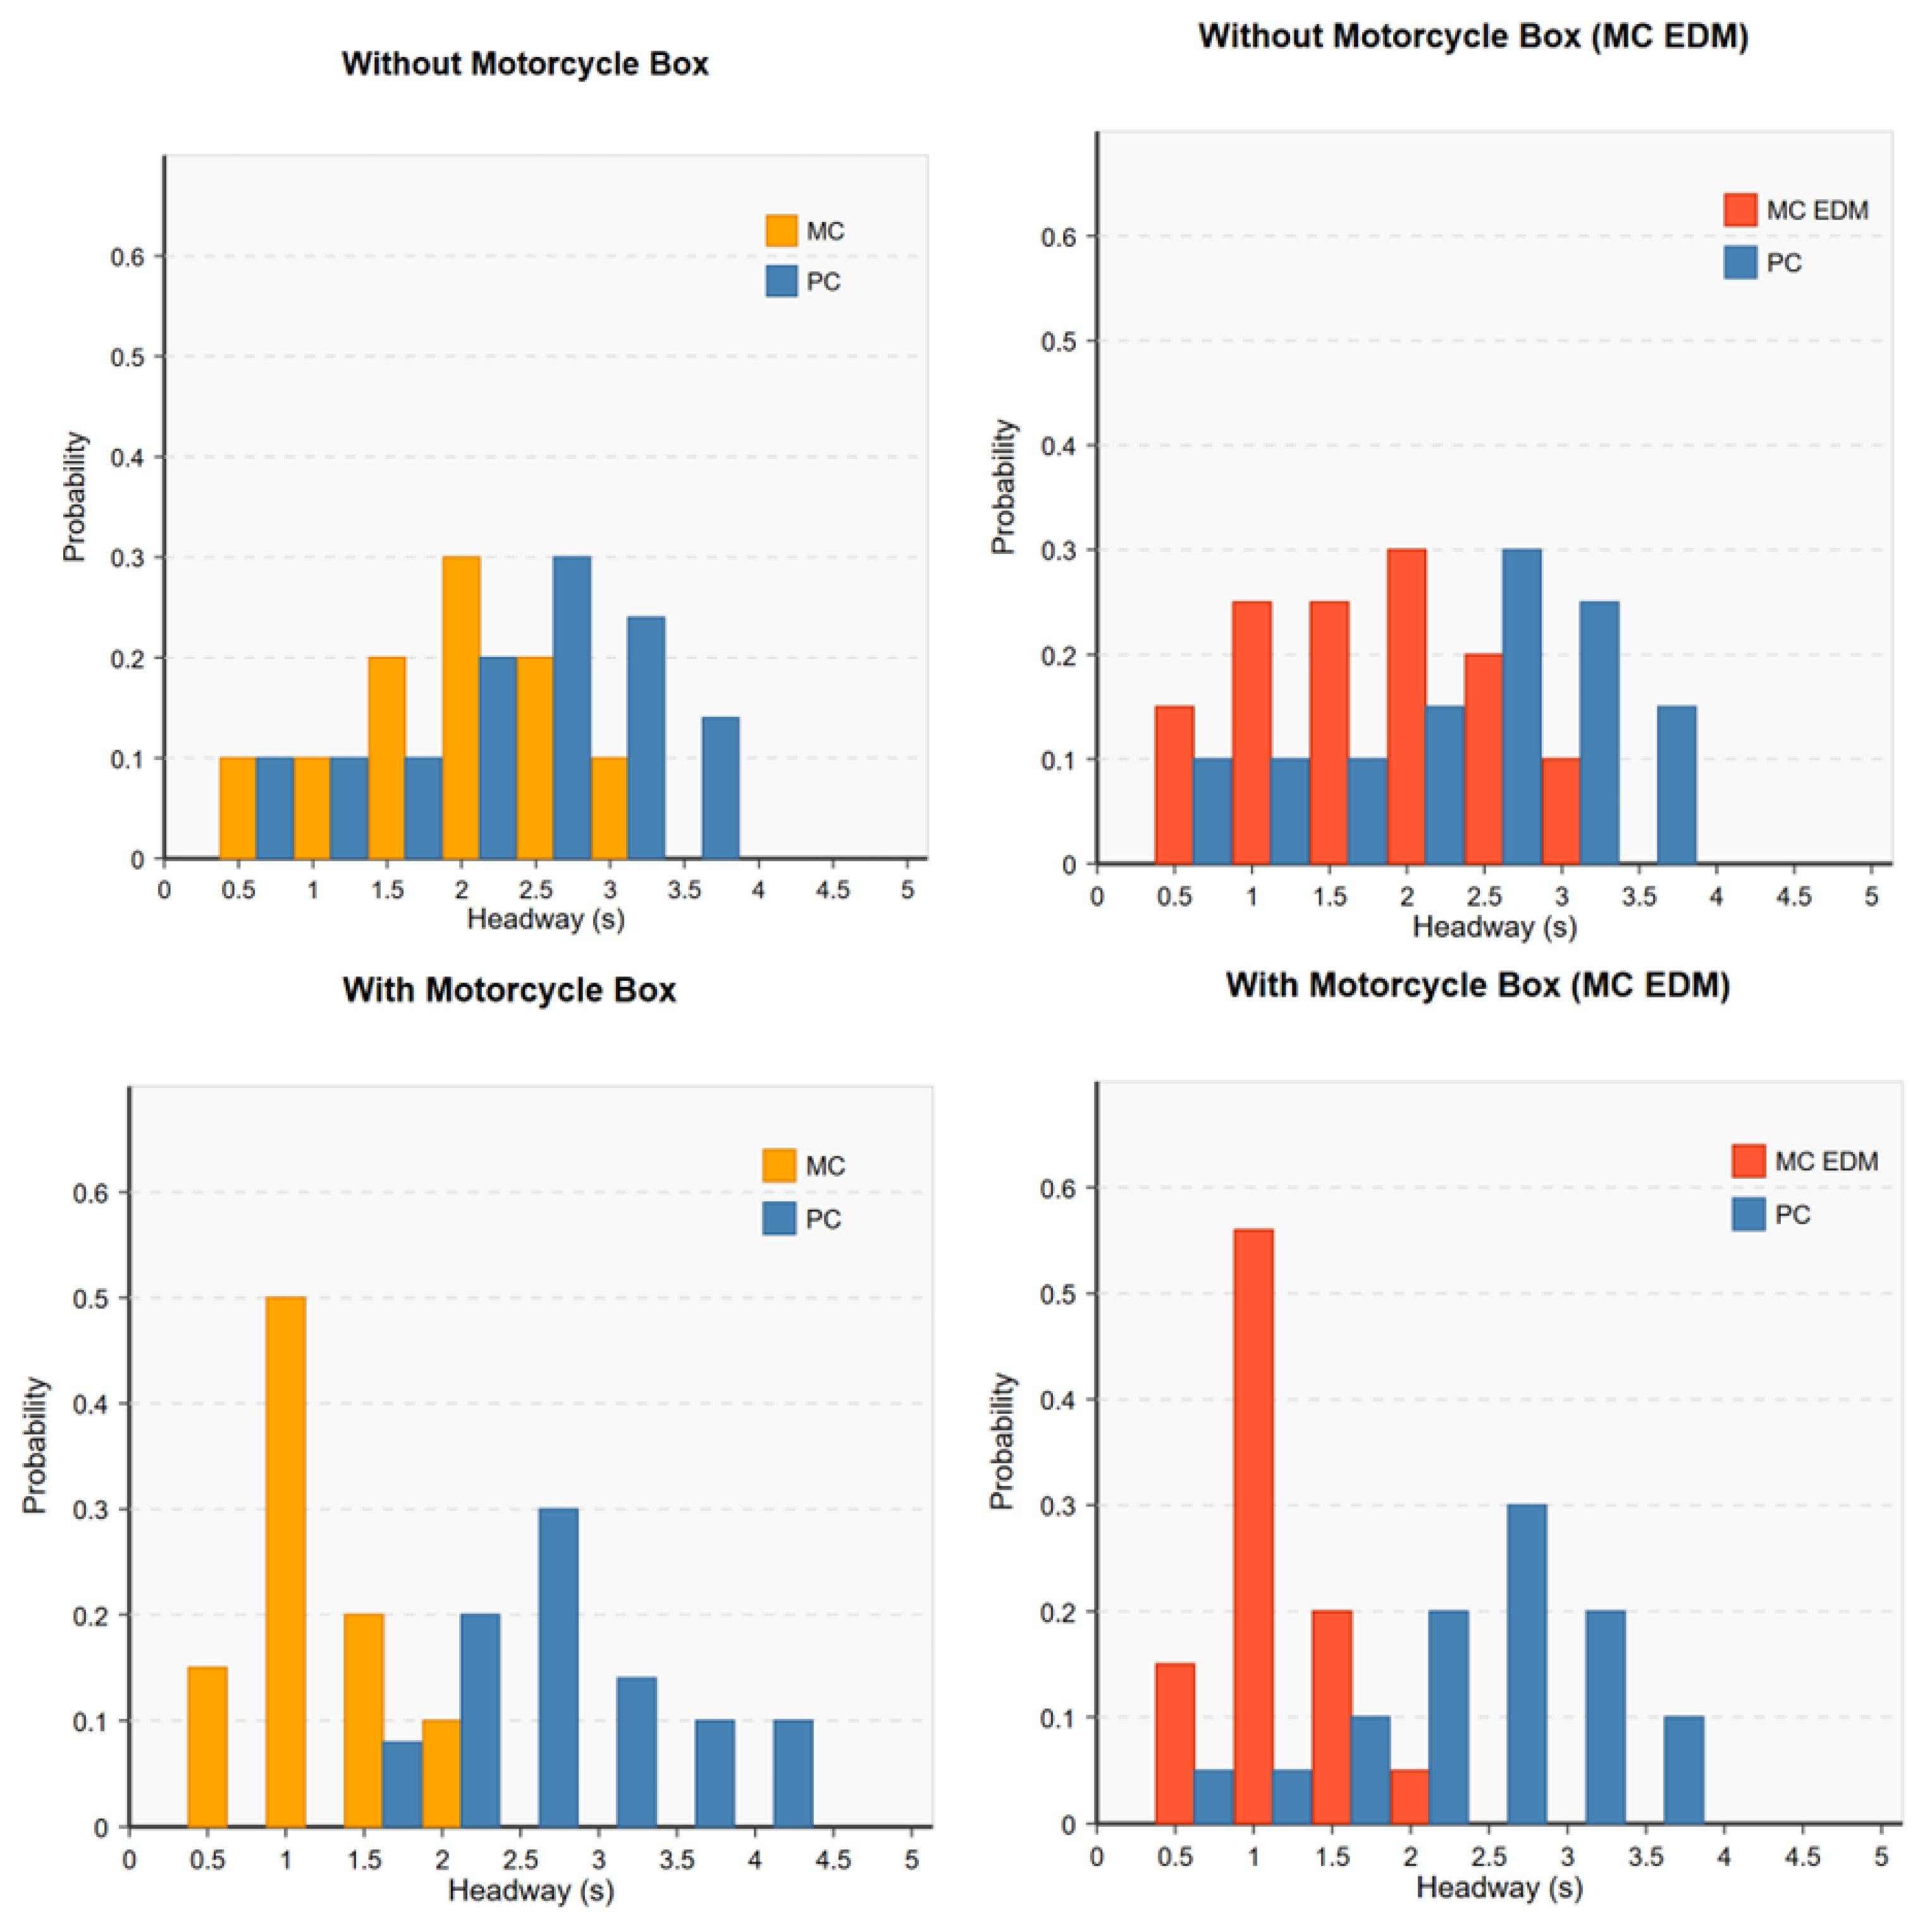
5.3. Headway Distribution

The motorcycle box had a significant impact on the headway of motorcycles at signalized intersections, as presented in Figure 12. A comparison of four scenarios (the base models and MC-EDM models of intersections without and with a motorcycle box) showed that with the motorcycle box, the headway of motorcycles decreased significantly, from 2–2.5 s to 0.5–1 s. The probability of this reduction increased from 0.3 to 0.5–0.55. This result indicated that motorcycles were able to move through the intersection more quickly and in a more organized manner, resulting in an average headway reduction from 1.72 s to 1.03 s, representing a 40% improvement in performance. A study in Thailand stated that intersections with designated motorcycle-stopping spaces resulted in lower start-up lost times, whereas intersections without such spaces experienced increased delays [46].
While the motorcycle box offered significant benefits to motorcycles, it was noteworthy that this installation did not appear to have significant negative impacts on passenger car headway distribution based on our analysis. This supported previous research by [41], which demonstrated that the implementation of motorcycle boxes at signalized intersections increased traffic flow by up to 13% while reducing motorcycle-related traffic conflicts by approximately 39%. From the graph, it was evident that the headway of passenger cars remained distributed in the same manner, primarily around 2.5–3 s, regardless of the presence of the motorcycle box. Statistical tests confirmed that the average headway for passenger cars changed negligibly (from 2.47 to 2.39 s), with no statistically significant difference. This meant that the motorcycle box enhanced motorcycle performance without adversely affecting other vehicles. A study by [4] highlighted that providing a stopping space for motorcycles helps improve the overall efficiency of motorcycle movement, reducing delays and congestion.
When considering the differences between the base model and the MC-EDM model, it was observed that the MC-EDM model simulated motorcycle driving behavior more realistically, especially when a motorcycle box was present. The MC-EDM model showed a higher probability of headways at 0.5 s (0.55 compared to 0.5 in the base model) and a narrower distribution. This result showed that motorcycles in real-world traffic could take greater advantage of the motorcycle box than what was predicted by the standard model.

6. Conclusions

This study introduced the External Driver Model (EDM) into microscopic traffic simulation models to accurately replicate motorcycle filtering and stopping behaviors at signalized intersections in mixed traffic conditions in Chiang Mai, Thailand. Motorcycle riders exhibit habitual driving patterns, such as line leading and lane splitting at a signalized intersection. These rider driving patterns are not specifically handled in vehicle simulation studies, but this paper contributes further to the study of rider behavior by first studying the rider’s behavior and, subsequently, simulations of rider behaviors in order to examine one specific change in motorcycle boxes. This study attempts to examine the influence of motorcycle boxes on signalized intersection approaches through a microscopic traffic simulation. The integration of microscopic traffic simulation with EDM evolution in C++ effectively represented motorcycle filtering in lanes, acceleration, and departure patterns. This research aimed to address critical concerns regarding motorcycles in traffic efficiency.
The data were collected and analyzed from 12 signalized intersection locations in Chiang Mai City, Thailand, using video analytics. These intersections were varied by geometric intersection design, traffic volumes, and operational types. The models were developed and validated against real-world data and applied algorithms that use entropy-based measures or statistical goodness-of-fit tests. The tests on the comparisons gave confidence that the simulated behaviors identify consistency with actual motorcyclists’ interactions in traffic systems.
A key contribution of this study lies in its assessment of motorcycle boxes using the developed models. Motorcycle boxes are designated areas at the front of traffic queues at intersections, allowing motorcyclists to wait ahead of other vehicles during the red signal phase. This study simulated traffic conditions with and without motorcycle boxes under various volume and geometric scenarios and evaluated the resulting performance. This research has shown that, with respect to signalized intersections, motorcycle boxes tend to be in favor of motorcycles, while no delays are experienced by cars. The boxes provide the needed allowance for motorcyclists to move in front of other vehicles, distributing different flows of traffic.
Furthermore, the waiting areas reserved for motorcycles at intersections reduce headway times between motorcycles and cars while allowing for constant distances between cars and other vehicles. Motorcyclists positioned in the front row can accelerate without being obstructed by larger vehicles, reducing delays and smoothing the departure wave at the intersection. Improved headway distributions would allow motorcycles to merge into the intersection with less congestion and, thus, lower the chances of collision. Additionally, the presence of motorcycle boxes promotes a more orderly lateral positioning of motorcycles, reducing conflicts with other vehicles and enhancing safety.
The dedicated waiting zones provided by motorcycle boxes enable a more organized and structured start-up process, leading to improved safety outcomes. This reduces sudden lane changes or weaving conflicts between motorcyclists and drivers of larger vehicles, preventing collisions. A spatial-temporal visualization of vehicle movement patterns confirmed distinctive motorcycle clustering patterns within the designated box areas. Such clustering inside a motorcycle box indicates, in turn, a sort of orderly queuing system, thus reducing any random behavior of filtering and unpredictable motorcycle movements. Thus, clustering can actually assist in controlling the flow and reduce traffic congestion, thus improving the intersection’s efficiency under conditions of high traffic density. The ability to visualize and analyze these movement patterns provides critical information to aid decision-making on effective motorcycle box designs and their implementation in urban environments.
Additionally, the lane-filtering rates demonstrated significant improvement at intersections equipped with motorcycle boxes compared to conventional designs. It is much safer and more efficient to provide dedicated waiting areas for motorcyclists, as it provides a more organized way through traffic lights. The presence of a designated waiting area becomes far more predictable as opposed to being somewhat erratic, which would allow fewer sudden changes through the intersection; thus, it would enable vehicles to have that much more time to enter into the traffic flow. This helps to ensure better traffic flow, fewer delays for all road users, and less unpredictability associated with lane filtering from motorcycles during congestion.
This study highlighted the positive impact of motorcycle boxes on urban traffic efficiency, motorcyclist safety, and overall intersection performance. Statistical analyses of our simulation results demonstrated that the MC-EDM model showed no significant differences from the field observations at a 95% confidence level across the key metrics (p > 0.05), validating the accuracy of our findings. For critical measures such as lateral position entropy (t(2) = 2.31, p = 0.147) and motorcycle filtering rates (t(2) = 2.52, p = 0.128), the MC-EDM model demonstrated strong statistical alignment with the field data.
Despite its strengths, this study also acknowledges certain limitations regarding transferability to regions with different traffic cultures, as well as environmental factors that are not fully accounted for, with a focus primarily on peak-hour conditions without long-term behavior analysis, assumptions about rule compliance, and simulation models for more complex traffic and intersection configuration scenarios. These limitations suggest valuable directions for future research. Traffic simulations with EDM should suffice to assess mixed traffic scenarios with scooters, as producing ideal designs for such waiting areas would perform wonders for traffic flow at intersections. The integration of EDM into traffic simulations offers a robust framework for evaluating motorcycle behavior in mixed traffic conditions, confirming that well-designed motorcycle waiting areas can significantly enhance intersection operations. Policymakers and urban planners would be able to relate the research results to the possible implementations of motorcycle boxes as a very important method in traffic regulation in any city where motorcycles are prevalent.

Author Contributions

Conceptualization and methodology, W.W. and N.K.; data collection, W.W. and P.P.; formal analysis, W.W., P.P. and M.S.Z.; validation, N.K. and T.S.; writing—original draft preparation, W.W. and M.S.Z.; writing—review and editing, N.K.; supervision, T.S. All authors have read and agreed to the published version of the manuscript.

Funding

This research work was supported by the Faculty of Engineering, Chiang Mai University, and the Excellence Center in Infrastructure Technology and Transportation Engineering (ExCITE) of Chiang Mai University.

Institutional Review Board Statement

Not applicable.

Informed Consent Statement

Not applicable.

Data Availability Statement

The data presented in this study are available upon request from the corresponding author.

Conflicts of Interest

The authors declare no conflicts of interest.

Appendix A

Algorithm A1: Motorcycle Filtering Behavior Model.
1: procedure MOTORCYCLE_FILTERING_MODEL (m, T, I)
2:   /* Initialize key parameters */
3:   v ← m.velocity
4:   x ← m.position
5:   d_i ← distance(x, nearest_signal(I))
6:   s ← s1 // Initial strategy: NORMAL
7:
8:   /* Strategy selection based on traffic conditions */
9:   if d_i < d_threshold and v < v_threshold then
10:    x_f ← estimate_queue_front(x, T, d_i)
11:    if (x_f − x) < d_f then
12:      s ← s3 // FRONT_SEEKING
13:    else if late_arrival(m, T) then
14:      s ← s2 // AGGRESSIVE
15:    end if
16:  end if
17:
18:  /* Space identification process */
19:  G ← ∅ // Empty set of potential gaps
20:  for each vehicle v ∈ neighborhood(T, x, d_max) do
21:    g ← find_gap_near(v, T)
22:    if g.width > (w_m + 2·δ_s + v·k_v) then
23:      g.ρ ← ρ(g, x_f, d_i) // Calculate priority
24:      if g.leads_to_intersection then
25:        g.ρ ← g.ρ + ρ_i
26:      end if
27:      G ← G ∪ {g}
28:    end if
29:  end for
30:
31:  g* ← arg max_{g∈G} g.ρ // Select highest priority gap
32:  if g* exists and safety(g*, v) then
33:    if ¬m.filtering then
34:      /* Start filtering process */
35:      m.filtering ← true
36:      m.stage ← φ1 // Initial stage: PREPARATION
37:    end if
38:
39:    /* Update parameters based on filtering stage */
40:    if m.stage = φ1 then
41:      p ← (g*.x − x)/(g*.x − x0) // Progress ratio
42:      m.λ_target ← g*.λ·(α1 + β1·p)
43:      m.v_desired ← f_v(v, s, φ1)
44:      if p > p_threshold then m.stage ← φ2 end if
45:
46:      else if m.stage = φ2 then
47:      m.λ_target ← g*.λ·min(λ_max, α2 + β2·p)
48:      m.v_desired ← f_v(v, s, φ2)
49:      if x ≥ g*.x then m.stage ← φ3 end if
50:
51:    else if m.stage = φ3 then
52:      m.θ_target ← θ_road + (m.θ − θ_road)·γ
53:      if |m.λ–m.λ_target| < ε then
54:        m.filtering ← false
55:      end if
56:    end if
57:
58:    /* Calculate final control parameters */
59:    Δθ ← f_θ(m.λ, m.λ_target, v)
60:    m.θ ← θ_road + min(max(Δθ, −θ_max), θ_max)
61:    m.indicator ← direction(g*.side)
62:  end if
63:
64:  return m with updated parameters
65: end procedure

References

  1. Iamtrakul, P.; Chayphong, S.; Klaylee, J. Foreign Tourist Behavior and Perception of Motorcycle Accident Risk in Chiang Mai, Thailand. Lowl. Technol. Int. 2019, 21, 187–196. [Google Scholar]
  2. Minh, C.; Sano, K.; Matsumoto, S. Maneuvers of motorcycles in queues at signalized intersections. J. Adv. Transp. 2012, 46, 39–53. [Google Scholar] [CrossRef]
  3. Damani, J.; Vedagiri, P. Safety of motorised two wheelers in mixed traffic conditions: Literature review of risk factors. J. Traffic Transp. Eng. 2021, 8, 35–56. [Google Scholar] [CrossRef]
  4. Promraksa, T.; Satiennam, T.; Satiennam, W.; Kaewwichian, P.; Kronprasert, N. Factors Influencing Stopping Locations of Motorcycle Riders on Signalized Urban Intersection Approaches. Sustainability 2022, 14, 15236. [Google Scholar] [CrossRef]
  5. Mulyadi, A.M.; Sihombing, A.V.R.; Hendrawan, H.; Marpaung, E.; Malisan, J.; Arianto, D.; Mardiana, T.S.; Puriningsih, F.S.; Subaryata; Siregar, N. A.M.; et al. Effect of Traffic Lights Countdown Timer and Motorcycle Lanes as an Approach to the Red Box for Motorcycles in Bali Island. Infrastructures 2022, 7, 127. [Google Scholar] [CrossRef]
  6. Bonela, S.R.; Kadali, B.R. Examining the effect of vehicle type on right-turn crossing conflicts of minor road traffic at unsignalized T-intersections. IATSS Res. 2023, 47, 545–556. [Google Scholar] [CrossRef]
  7. Abdul Manan, M.M. Motorcycles entering from access points and merging with traffic on primary roads in Malaysia: Behavioral and road environment influence on the occurrence of traffic conflicts. Accid. Anal. Prev. 2014, 70, 301–313. [Google Scholar] [CrossRef]
  8. Dill, J.; Monsere, C.M.; McNeil, N. Evaluation of bike boxes at signalized intersections. Accid. Anal. Prev. 2012, 44, 126–134. [Google Scholar] [CrossRef]
  9. Retting, R.; Van Houten, R. Safety benefits of advance stop lines at signalized intersections: Results of a field evaluation. ITE J. (Inst. Transp. Eng.) 2000, 70, 47–49. [Google Scholar]
  10. León, F.J.; Pérez-Pulido, M.; Mogollón-Alaguna, O.; Salas-Rondón, M. Effectiveness of the advanced stop line for motorcycles in Bucaramanga validated by means of a logistic regression model. Aibi Res. Manag. Eng. J. 2025, 13, 44–51. [Google Scholar] [CrossRef]
  11. Toledo, T.; Koutsopoulos, H.; Ben-Akiva, M.; Jha, M. Microscopic Traffic Simulation: Models and Application. In Simulation Approaches in Transportation Analysis: Recent Advances and Challenges; Springer: Boston, MA, USA, 2005; Volume 31, pp. 99–130. [Google Scholar]
  12. Zhao, J.; Knoop, V.L.; Wang, M. Microscopic Traffic Modeling Inside Intersections: Interactions Between Drivers. Transp. Sci. 2023, 57, 135–155. [Google Scholar] [CrossRef]
  13. Wall, G.T.; Davies, D.G.; Crabtree, M. Capacity Implications of Advanced Stop Lines for Cyclists. TRL Rep. 2003, 585, 46. [Google Scholar]
  14. Ramli, W.N.S.; Ishak, S.; Najwa, F. A study on advance stop line for motorcyclists at signalised intersection in Malaysia. Adv. Transp. Logist. Res. 2021, 3, 861–868. [Google Scholar]
  15. Hsu, C.-K.; Lee, T.-C.; Wong, K. Kinematic Characterization of Risky Riding Behavior of On-Demand Food-Delivery Motorcyclists in Taiwan. Transp. Res. Rec. J. Transp. Res. Board 2023, 2677, 036119812311688. [Google Scholar] [CrossRef]
  16. Hsu, C.-K.; Lee, T.-C.; Io Wong, K. Time is money: Effects of time-sensitive incentive on risky driving among on-demand food-delivery motorcyclists in Taiwan. Saf. Sci. 2024, 176, 106549. [Google Scholar] [CrossRef]
  17. Kwangsukstith, S.; Surawattanasakul, V.; Mahakkanukrauh, C.; Panumasvivat, J.; Sirikul, W.; Kitro, A.; Siviroj, P. Major injuries and associated factors in traffic accidents among motorcycle food delivery riders during the COVID-19 pandemic in Thailand. Heliyon 2024, 10, e39032. [Google Scholar] [CrossRef]
  18. Molo, M.; Changsan, S.; Madares, L.; Changkwanyeun, R.; Wattanasoei, S.; Vittaporn, S.; Khamnuan, P.; Pongpan, S.; Pooseesod, K.; Saita, S. A decision tree model for traffic accident prediction among food delivery riders in Thailand. Epidemiol. Health 2024, 46, e2024095. [Google Scholar] [CrossRef]
  19. Prakobkarn, P.; Luangwilai, T.; Prempree, P.; Kunno, J. Prevalence of motorcycle accidents among food delivery drivers and its relation to knowledge, attitudes, and practices in urban areas in Bangkok, Thailand. PLoS ONE 2024, 19, e0303310. [Google Scholar] [CrossRef]
  20. Sanghatawatana, P.; Liang, J.; Kaewkluengklom, R.; Chalermpong, S. Analysis of Risky Driving Behaviors and Self-Reporting Incidents Among Different Types of Motorcycle Drivers in Bangkok. SSRN 2023. [Google Scholar] [CrossRef]
  21. McPherson, C.; Eady, J.; Daff, M.; Wigan, M. Road Space Initiatives for Motorcycles; SB18859 Part B; SKM: Melbourne, Australia, 2010. [Google Scholar]
  22. Allen, D.; Bygrave, S.; Harper, H. Behaviour at Cycle Advanced Stop Lines; PPR240; TRL Limited: Crowthorne, UK, 2005. [Google Scholar]
  23. Atkins Services. Advanced Stop Line Variations Research Study; 503 1271; Atkins: London, UK, 2006. [Google Scholar]
  24. Asaithambi, G.; Sivanandan, R. Microscopic Simulation for Modeling Exclusive Stopping Space for Motorcycles under Non-lane Based Mixed Traffic Conditions. Eur. Transp. Trasp. Eur. 2015, 57, 1–13. [Google Scholar]
  25. Santamariña-Rubio, E.; Pérez, K. Methods to evaluate the effectiveness of advanced stop lines for motorcycles in improving road safety. MethodsX 2021, 8, 101267. [Google Scholar] [CrossRef] [PubMed]
  26. Le, T.Q.; Asih Nurhidayati, Z. A Study of Motorcycle Lane Design in Some Asian Countries. Procedia Eng. 2016, 142, 291–297. [Google Scholar] [CrossRef]
  27. Yue, W.; Li, C.; Chen, Y.; Duan, P.; Mao, G. What is the Root Cause of Congestion in Urban Traffic Networks: Road Infrastructure or Signal Control? IEEE Trans. Intell. Transp. Syst. 2022, 23, 8662–8679. [Google Scholar] [CrossRef]
  28. Kronprasert, N.; Sutheerakul, C.; Satiennam, T.; Luathep, P. Intersection Safety Assessment Using Video-Based Traffic Conflict Analysis: The Case Study of Thailand. Sustainability 2021, 13, 12722. [Google Scholar] [CrossRef]
  29. Muttart, J.W.; Peck, L.R.; Guderian, S.; Bartlett, W.; Ton, L.P.; Kauderer, C.; Fisher, D.L.; Manning, J.E. Glancing and Stopping Behavior of Motorcyclists and Car Drivers at Intersections. Transp. Res. Rec. 2011, 2265, 81–88. [Google Scholar] [CrossRef]
  30. Mohd Zulkiffli, N.S.; Ho, J.S.; Hamidun, R.; Roslan, A.; Nemmang, M.S.; Mhd Yunin, N.A.; Syed Tajul Arif, S.T.M.; Harun, N.Z. Motorcyclists’ Stopping Position at 4-Legged Signalised Intersections. Construction 2023, 3, 163–171. [Google Scholar] [CrossRef]
  31. Shannon, C.E. A mathematical theory of communication. Bell Syst. Tech. J. 1948, 27, 379–423. [Google Scholar] [CrossRef]
  32. Kosun, C.; Ozdemir, S. An Entropy-Based Analysis of Lane Changing Behavior: An Interactive Approach. Traffic Inj. Prev. 2016, 18, 441–447. [Google Scholar] [CrossRef]
  33. Shao, Y.; Han, X.; Wu, H.; Claudel, G.C. Evaluating Signalization and Channelization Selections at Intersections Based on an Entropy Method. Entropy 2019, 21, 808. [Google Scholar] [CrossRef]
  34. Huang, P.; Ding, H.; Chen, H. An entropy-based model for quantifying multi-dimensional traffic scenario complexity. IET Intell. Transp. Syst. 2024, 18, 1289–1305. [Google Scholar] [CrossRef]
  35. Sui, X.; Zhang, Y. Entropy-based Traffic Congestion Propagation Pattern Mining with GPS Data. In Proceedings of the 2021 IEEE 6th International Conference on Big Data Analytics (ICBDA), Xiamen, China, 5–8 March 2021; IEEE: New York, NY, USA, 2021; pp. 128–132. [Google Scholar]
  36. Owais, M.; Abulwafa, O.; Abbas, Y. When to Decide to Convert a Roundabout to a Signalized Intersection: Simulation Approach for Case Studies in Jeddah and Al-Madinah. Arab. J. Sci. Eng. 2020, 45, 7897–7914. [Google Scholar] [CrossRef]
  37. Owais, M.; El Sayed, M.A. Red light crossing violations modelling using deep learning and variance-based sensitivity analysis. Expert Syst. Appl. 2025, 267, 126258. [Google Scholar] [CrossRef]
  38. Department of Rural Roads. Guidelines for Bicycle and Motorcycle Priority Areas at Signalized Intersections (Bike Box); Bureau of Road Safety, Department of Rural Roads: Bangkok, Thailand, 2020. [Google Scholar]
  39. Department of Highways. Guidelines for the Development of Bicycle Facilities; Bureau of Road Safety, Department of Highways: Bangkok, Thailand, 2015. [Google Scholar]
  40. Sutandi, A.; Siregar, D. Evaluation of Exclusive Stopping Space for Motorcycle at Signalized Intersections in Large Cities in Indonesia. MATEC Web Conf. 2017, 103, 08007. [Google Scholar] [CrossRef]
  41. Mulyadi, A.M.; Amelia, S. Influence of red motorcycle box to the traffic conflict and traffic flow at the Ahmad Yani-Laswi signalized intersection. In Proceeding of the 16th International Conference Road Safety on Four Continents (RS4C 2013), Beijing, China, 15–17 May 2013; Statens väg-och transportforskningsinstitut: Linköping, Sweden, 2013. [Google Scholar]
  42. Mulyadi, A.M. Red Box Motorcycle Evaluation at Signalized Intersection in Denpasar Bali. J. East. Asia Soc. Transp. Stud. 2019, 13, 1966–1982. [Google Scholar]
  43. Madsen, T.K.O.; Charlotte, T.; Vingaard, O.A.; Tove, H.; Lahrmann, H. Advanced stop boxes and their effect on traffic conflict rates between cyclists and turning vehicles. J. Transp. Saf. Secur. 2022, 14, 1731–1749. [Google Scholar] [CrossRef]
  44. Kariyana, M.; Suthanaya, P.; Wedagama, D.; Ariawan, I.M.A.; Dissanayake, D. The influence of motorcycle behavior on saturation flow rate at signalized intersections with and without exclusive stopping space for motorcycle (ESSM). IOP Conf. Ser. Earth Environ. Sci. 2021, 673, 012020. [Google Scholar] [CrossRef]
  45. Lin, Y.; Liu, Y.; Tang, L.; Zheng, S.; Chen, B.; Yang, H. Bicycle Crossing Design and Signal Control Optimization for the Symmetric Intersection. In Proceeding of the 2021 6th International Conference on Transportation Information and Safety (ICTIS), Wuhan, China, 22–24 October 2021; IEEE: New York, NY, USA, 2021; pp. 406–414. [Google Scholar]
  46. Pasakorn, K.; Thaned, S.; Wichuda, S.; Pathompong, S. Evaluation Study on Start-up Lost Time Reduction of Exclusive Stopping Space for Motorcycle at Signalized Intersections. KKU Res. J. 2021, 22. [Google Scholar]
Figure 1. Motorcycle box intersections layouts.
Infrastructures 10 00097 g001
Figure 2. The behavior of motorcycle filtering on a signalized intersection approach.
Infrastructures 10 00097 g002
Figure 3. Workflow diagram for analyzing motorcycle box effectiveness at intersections.
Infrastructures 10 00097 g003
Figure 4. Map of study intersection locations.
Infrastructures 10 00097 g004
Figure 5. Study areas.
Infrastructures 10 00097 g005
Figure 6. Traffic simulation with motorcycle external driver model (MC-EDM) framework.
Infrastructures 10 00097 g006
Figure 7. Snapshots of developed microscopic simulation models: (a) base model and (b) proposed model with MC-EDM.
Infrastructures 10 00097 g007
Figure 8. Spatial-temporal visualization for vehicle movement analysis.
Infrastructures 10 00097 g008
Figure 9. Motorcycle and passenger car flow rates for motorcycle box intersections.
Infrastructures 10 00097 g009
Figure 10. Motorcycle and passenger car flow rates for intersections without motorcycle box.
Infrastructures 10 00097 g010
Figure 11. Comparative analysis of traffic performance metrics.
Infrastructures 10 00097 g011
Figure 12. Headway distribution for intersections without and with motorcycle boxes based on the base model and MC-EDM model.
Infrastructures 10 00097 g012
Table 1. Characteristics of selected intersections in the study area.
No.IntersectionLane Width (m)No. of LanesLeft-Turn Lane?Cycle Length (s)Motorcycle Box?Speed (km/h)Median?Lane-Filtering Rates (%)
1Rincome3.25Yes260Yes12.4Yes75.3
2Chang Hua Lin3.42No150No15.2No84.6
3Hai Ya3.43Yes80Yes12.9Yes82.5
4Khuang Singh4.53No380Yes17.6No70.1
5Fa Thani3.22Yes115Yes16Yes84.2
6Airport3.24No200No20.3No85.8
7Pa Phaeng2.93Yes105Yes16.1Yes65.1
8Ton Phayom3.53No225No12.7No86.9
9Railway Station2.63No300Yes13.5No82.6
10Pracha Samphan3.91No60No14.2No65.7
11Neurological H.2.53Yes125Yes12.7Yes60.4
12Nakornping B.2.42Yes120Yes17.6Yes31.1
Table 2. Calibration results of two-lane intersection (Pracha Samphan intersection).
MeasureField Data Base Model MC-EDM Model
Value%Difference ResultDeviation (%)
Vehicle Count (veh/h)689658−4.50%685−0.58%
Motorcycle (veh/h/lane)263239−6.61%261−0.55%
Car (veh/h/lane)326319−2.15%324−0.61%
Avg. Speed (km/h)14.215.811.27%14.52.11%
MC Filtering Rate (%)65.758.3−11.26%63.8−2.89%
Lateral Position Entropy1.0141.36234.32%1.0523.75%
RMSE (Vehicle Trajectory)2.740.92
Table 3. Calibration results of four-lane intersection (Rincome intersection).
MeasureField Data Base Model MC-EDM Model
Value%Difference ResultDeviation (%)
Vehicle Count (veh/h)16281571−3.50%1620−0.49%
Motorcycle (veh/h/lane)312303−2.88%301−3.53%
Car (veh/h/lane)526513−2.47%507−3.61%
Avg. Speed (km/h)16.215.1−6.79%15.3−5.56%
MC Filtering Rate (%)75.366.8−11.29%73.5−2.39%
Lateral Position Entropy1.1421.36419.44%1.1873.94%
RMSE (Vehicle Trajectory)3.821.18
Table 4. Calibration results of six-lane intersection (railway station intersection).
MeasureField Data Base Model MC-EDM Model
Value%Difference Value%Difference
Vehicle Count (veh/h)19551872−4.25%1903−2.66%
Motorcycle (veh/h/lane)425391−8.00%404−4.94%
Car (veh/h/lane)616566−8.12%587−4.71%
Avg. Speed (km/h)14.515.88.97%14.92.76%
MC Filtering Rate (%)82.665.2−21.07%78.3−5.21%
Lateral Position Entropy1.0751.48337.95%1.1284.93%
RMSE (Vehicle Trajectory)3.581.05
Disclaimer/Publisher’s Note: The statements, opinions and data contained in all publications are solely those of the individual author(s) and contributor(s) and not of MDPI and/or the editor(s). MDPI and/or the editor(s) disclaim responsibility for any injury to people or property resulting from any ideas, methods, instructions or products referred to in the content.

