
A Comparative Study of Bikeability Index and CycleRAP in Examining Urban Cycling Facilities


Abstract
1. Introduction
2. Materials and Methods
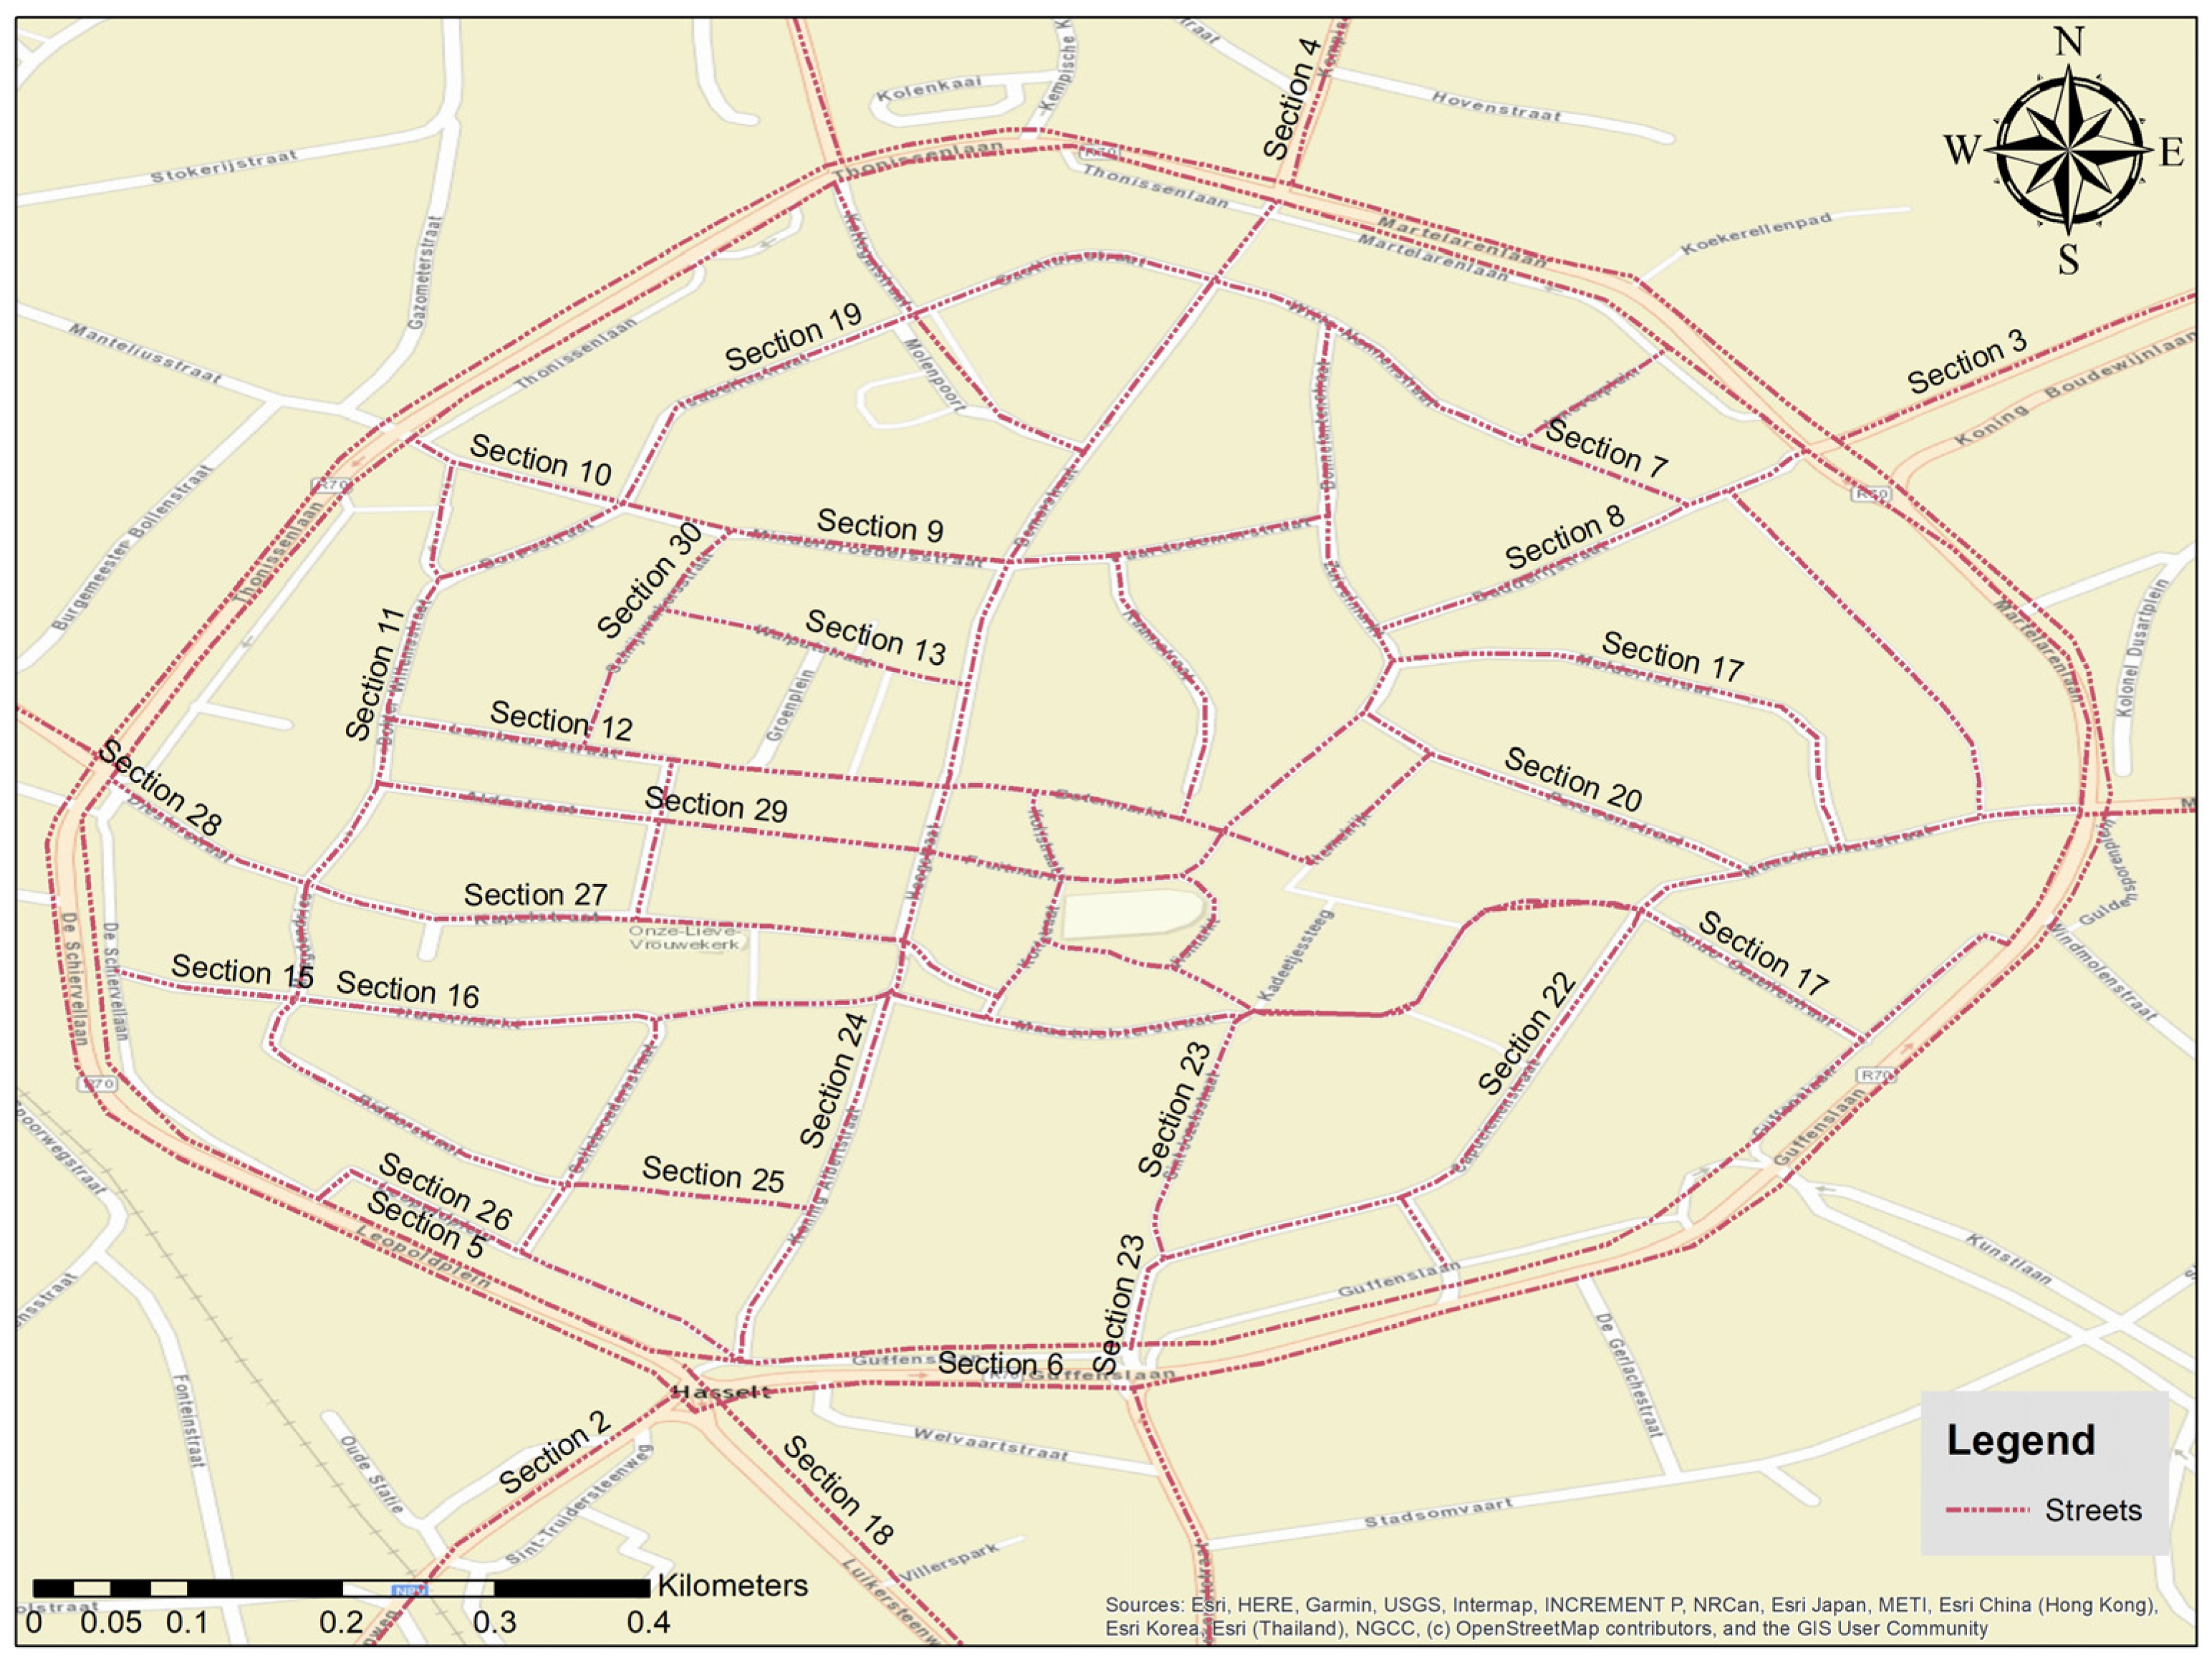
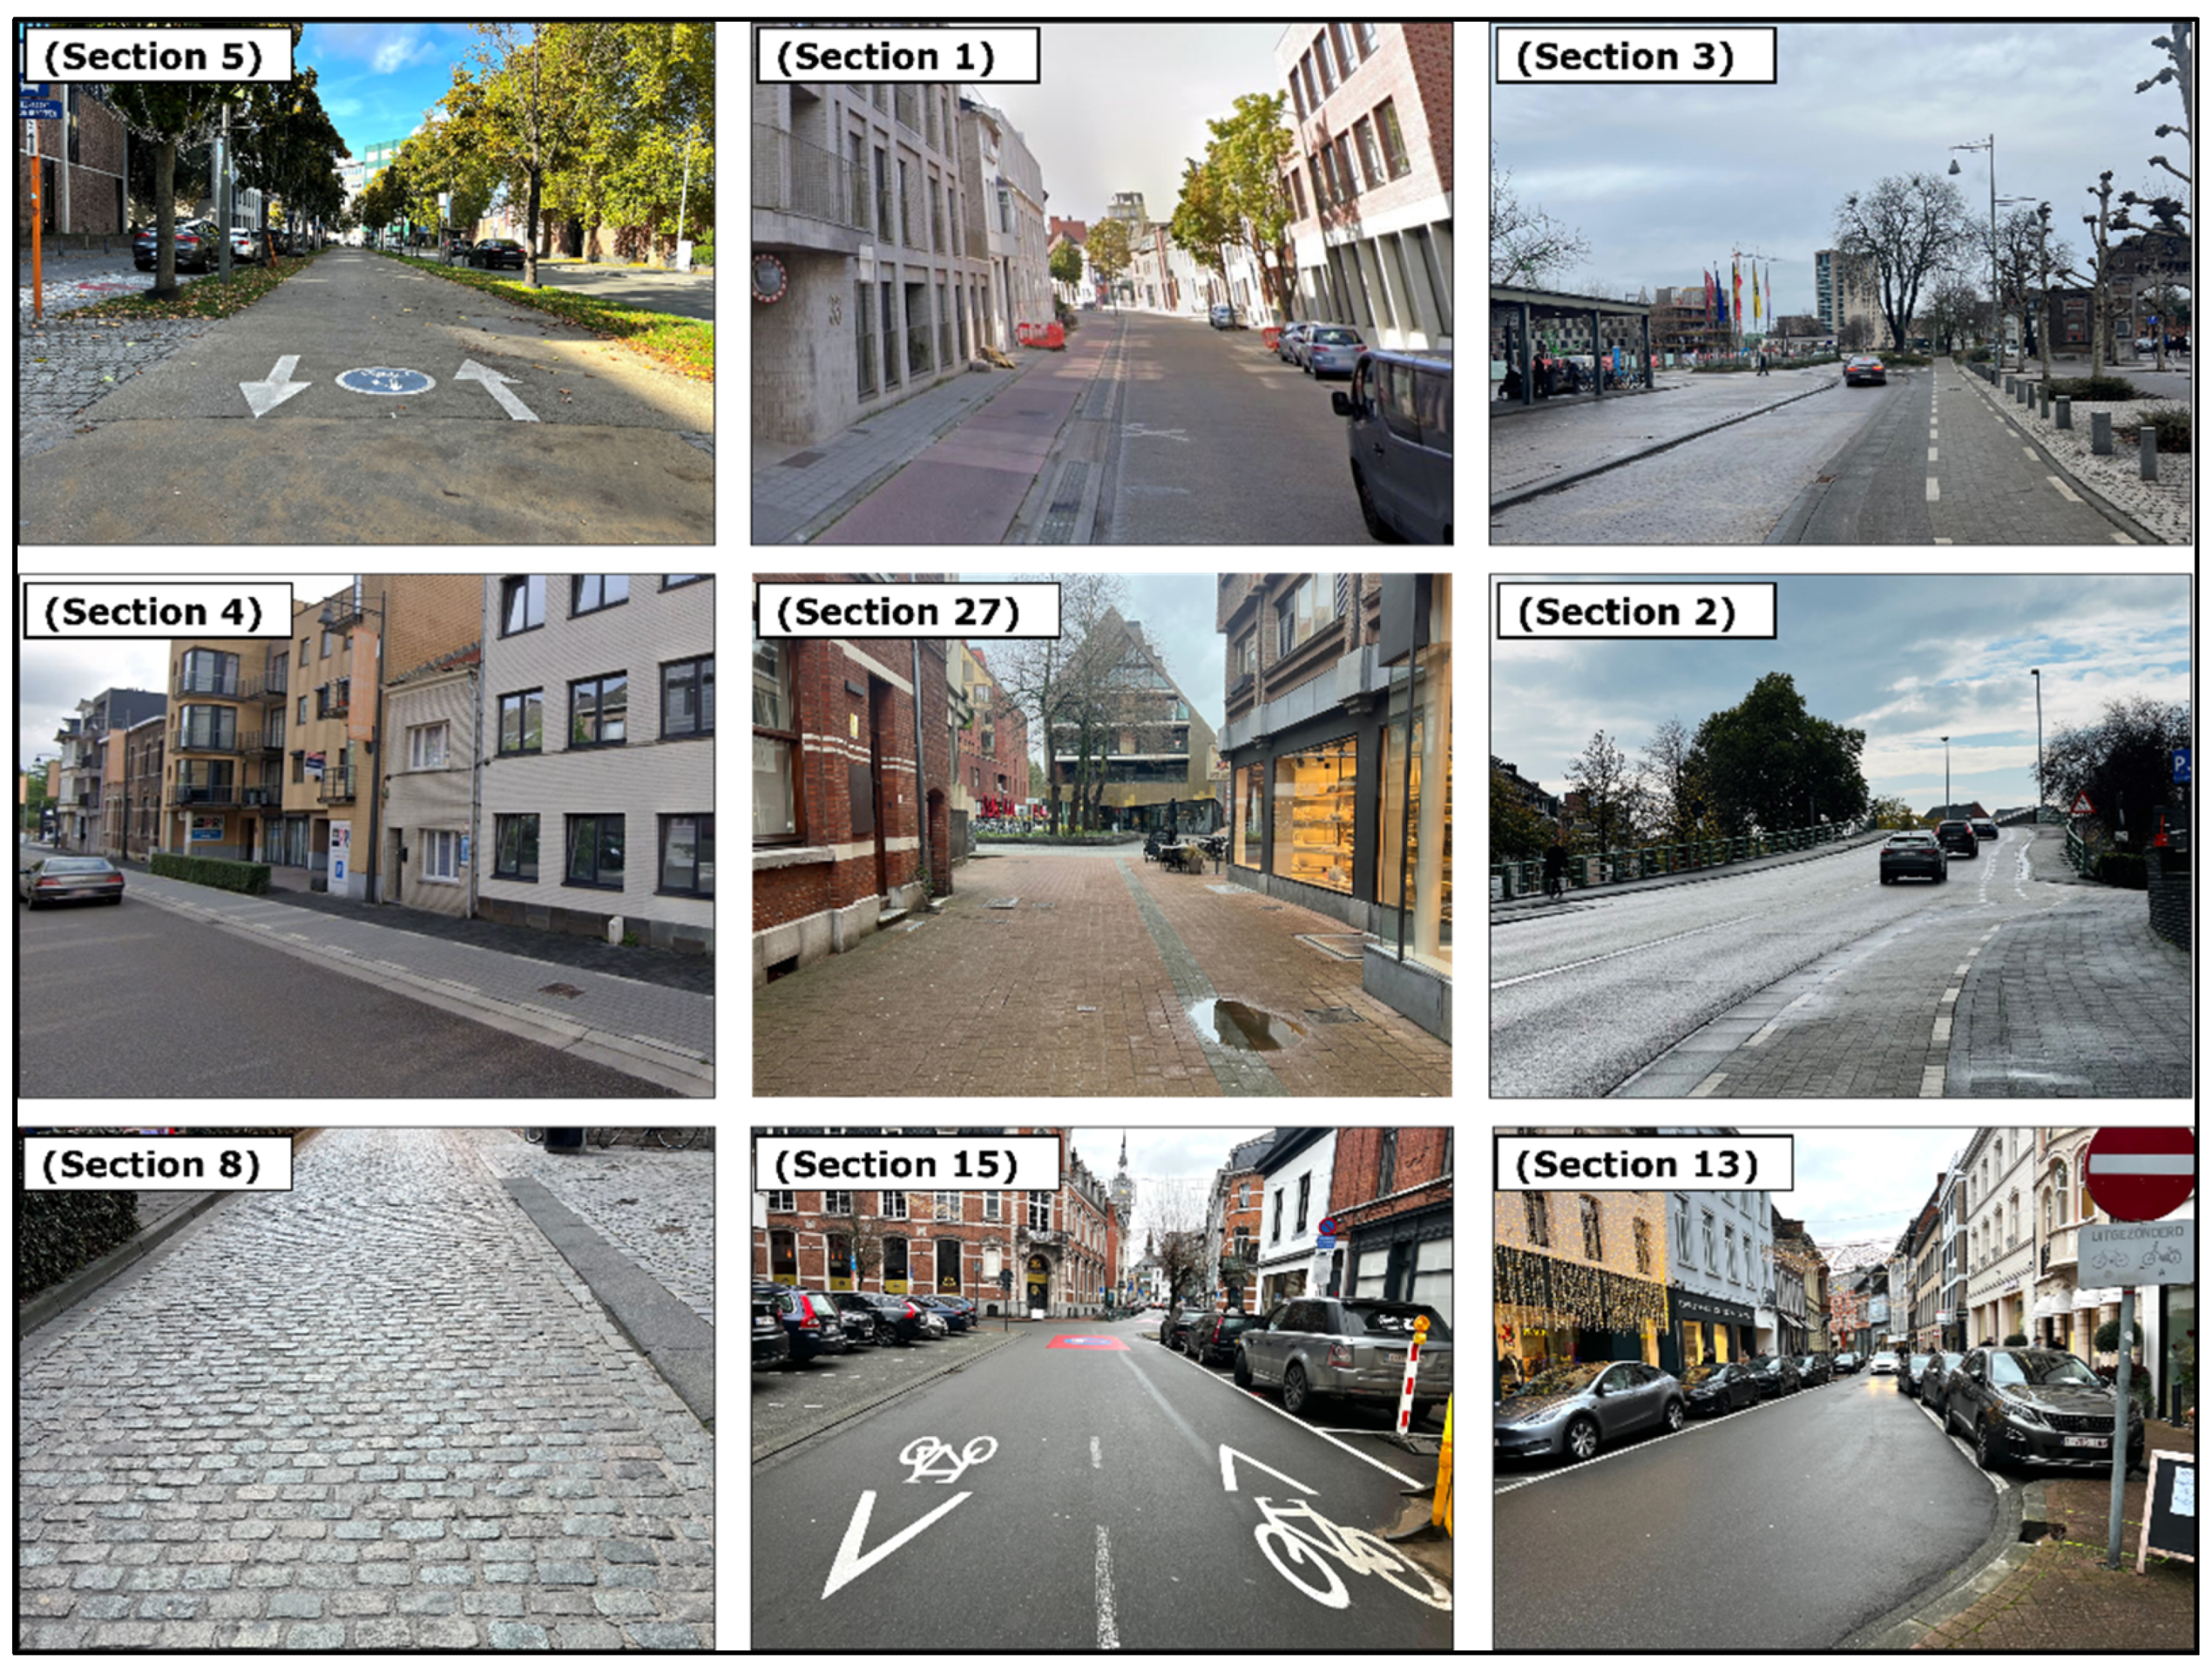
2.1. Study Area
2.2. Calculating Bikeability Score
- BIW = bikeability weighted index;
- jc = coefficient/weight of comfort criteria;
- js = coefficient/weight of safety criteria;
- ja = coefficient/weight of attractiveness criteria;
- jdc = coefficient/weight of directness and coherence criteria;
- Cci = co-efficient/weight of comfort indicators;
- Sci = score of comfort indicators;
- Csi = co-efficient/weight of safety indicators;
- Ssi = score of safety indicators;
- Cai = co-efficient/weight of attractiveness indicators;
- Sai = score of attractiveness indicators;
- Cdci = co-efficient/weight of directness and coherence indicators;
- Sdci = score of directness and coherence indicators;
- n,m,p,q = total number of indicators in each category (comfort, safety, attractiveness, directness and coherence).
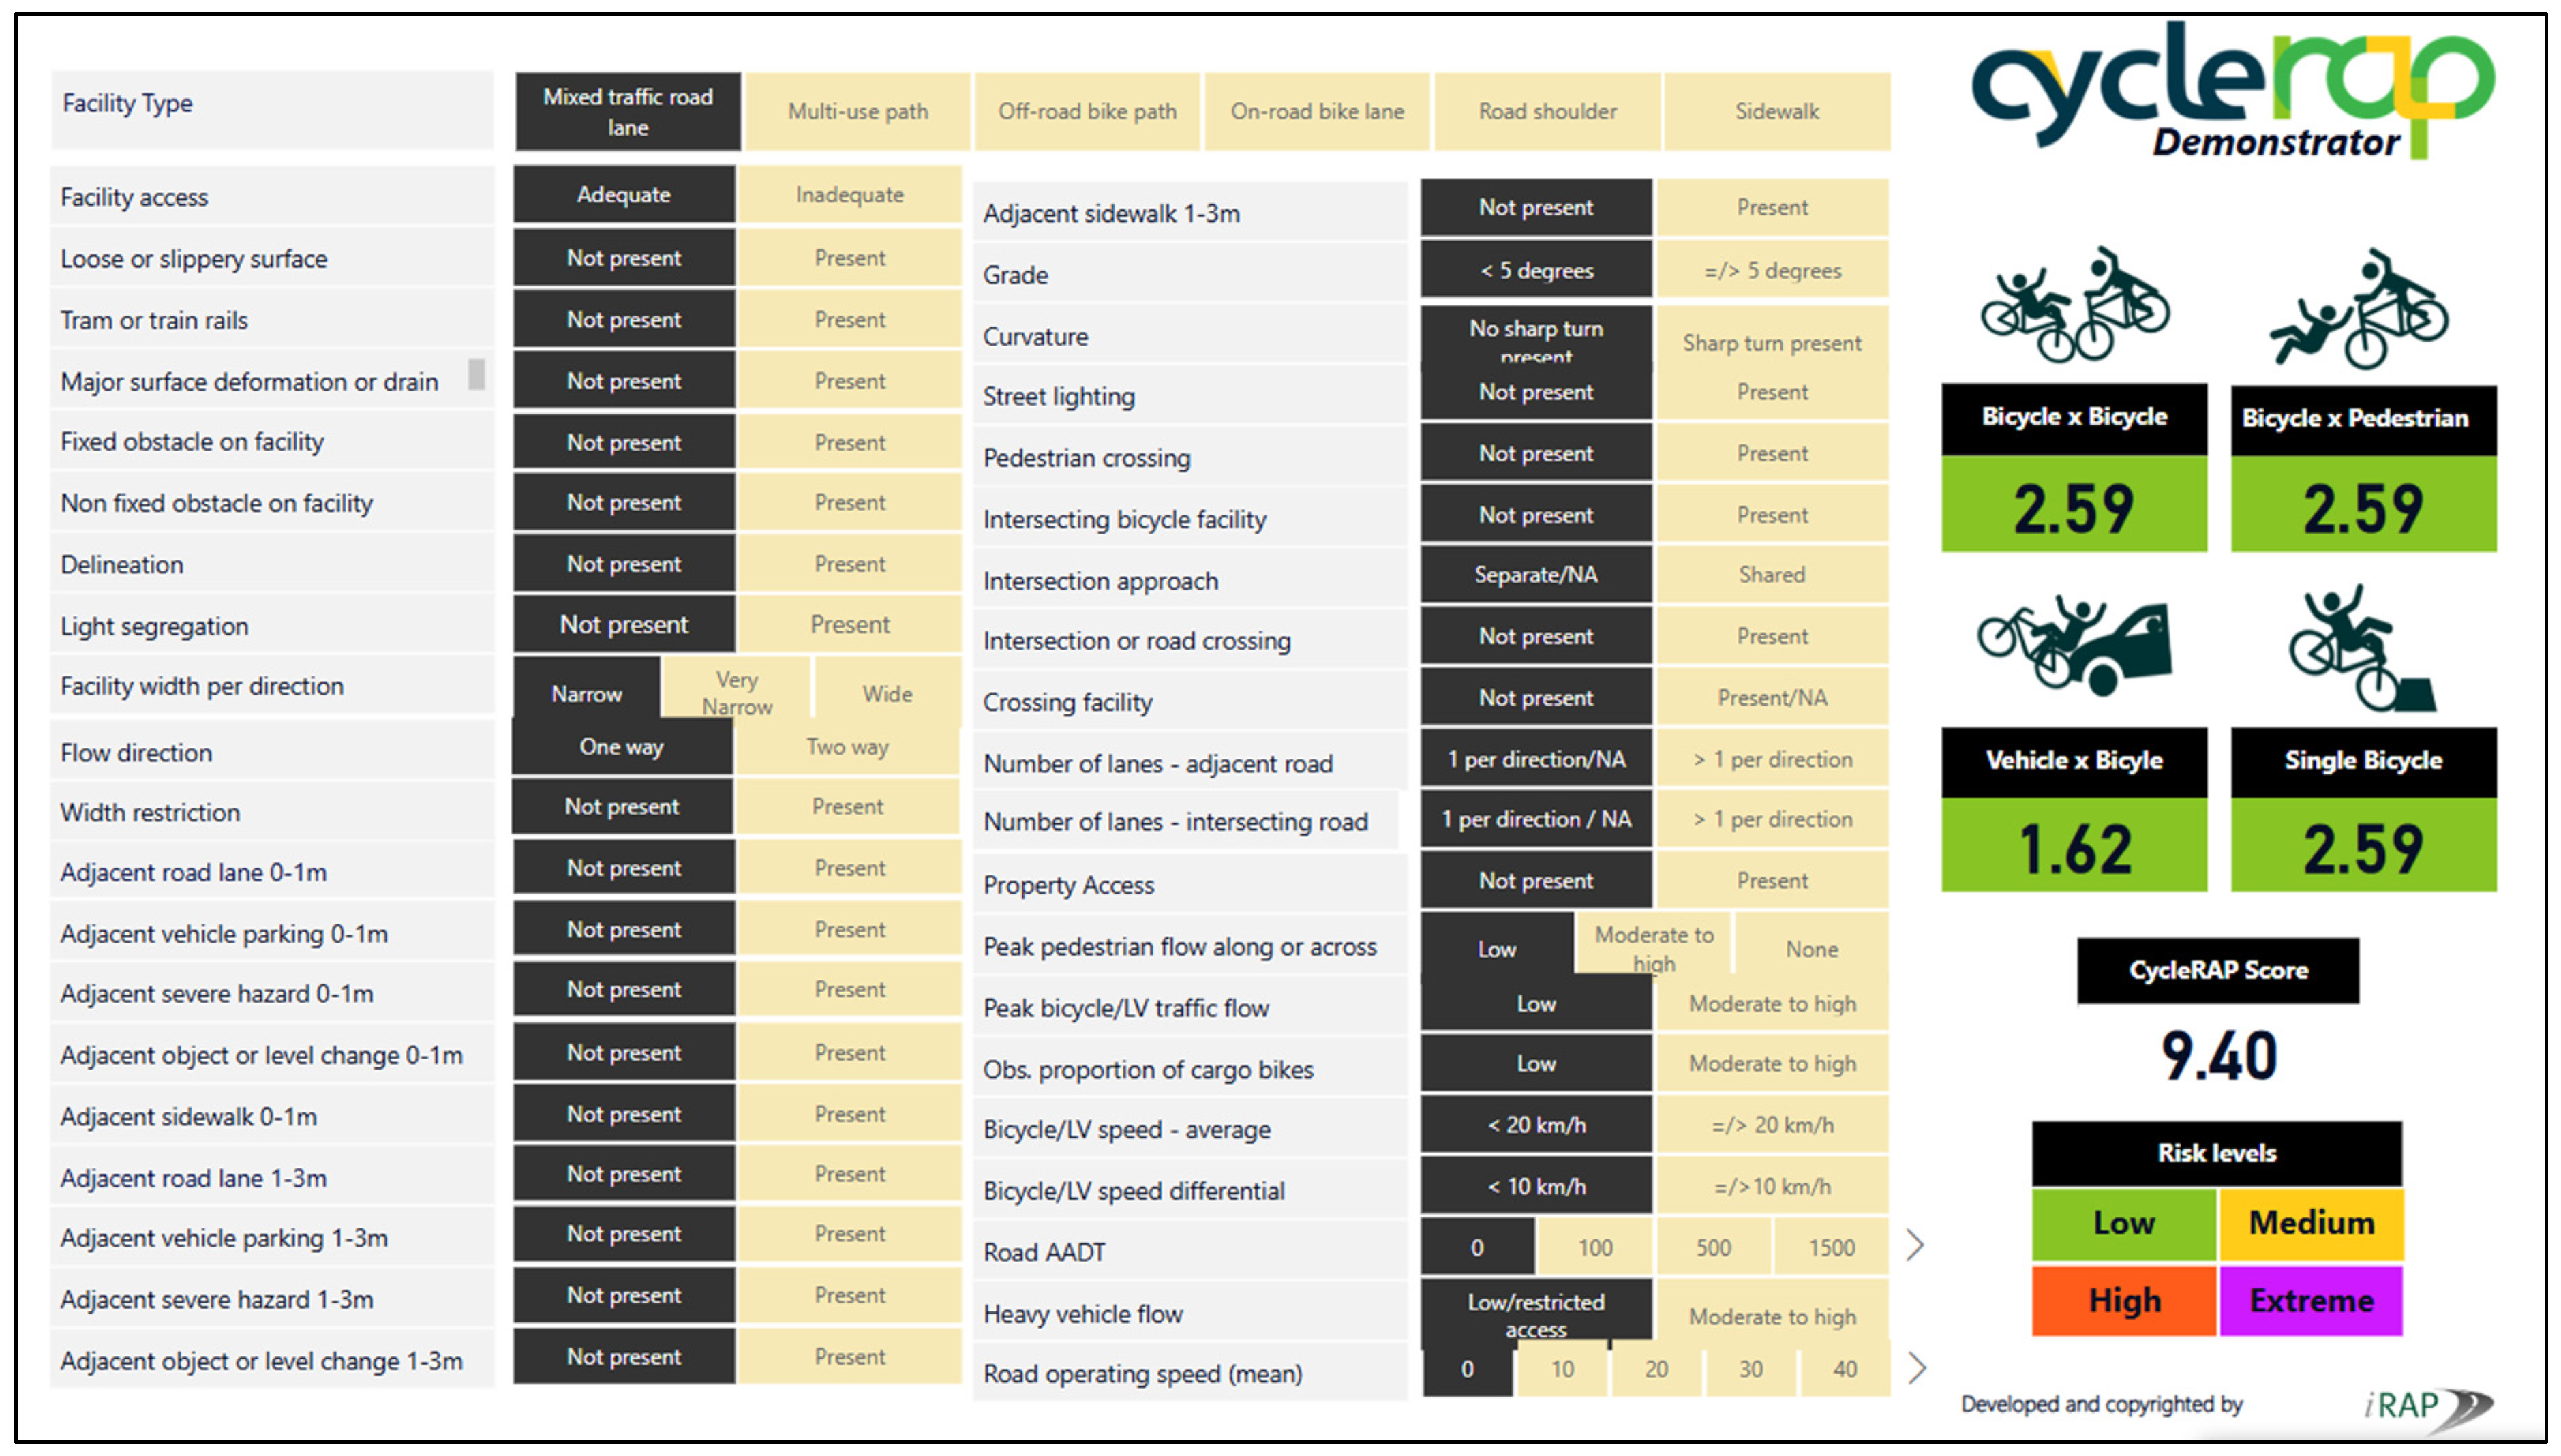
2.3. Calculating CycleRAP Score
2.4. Calculating the BI Safety Score
2.5. Data Collection
3. Results
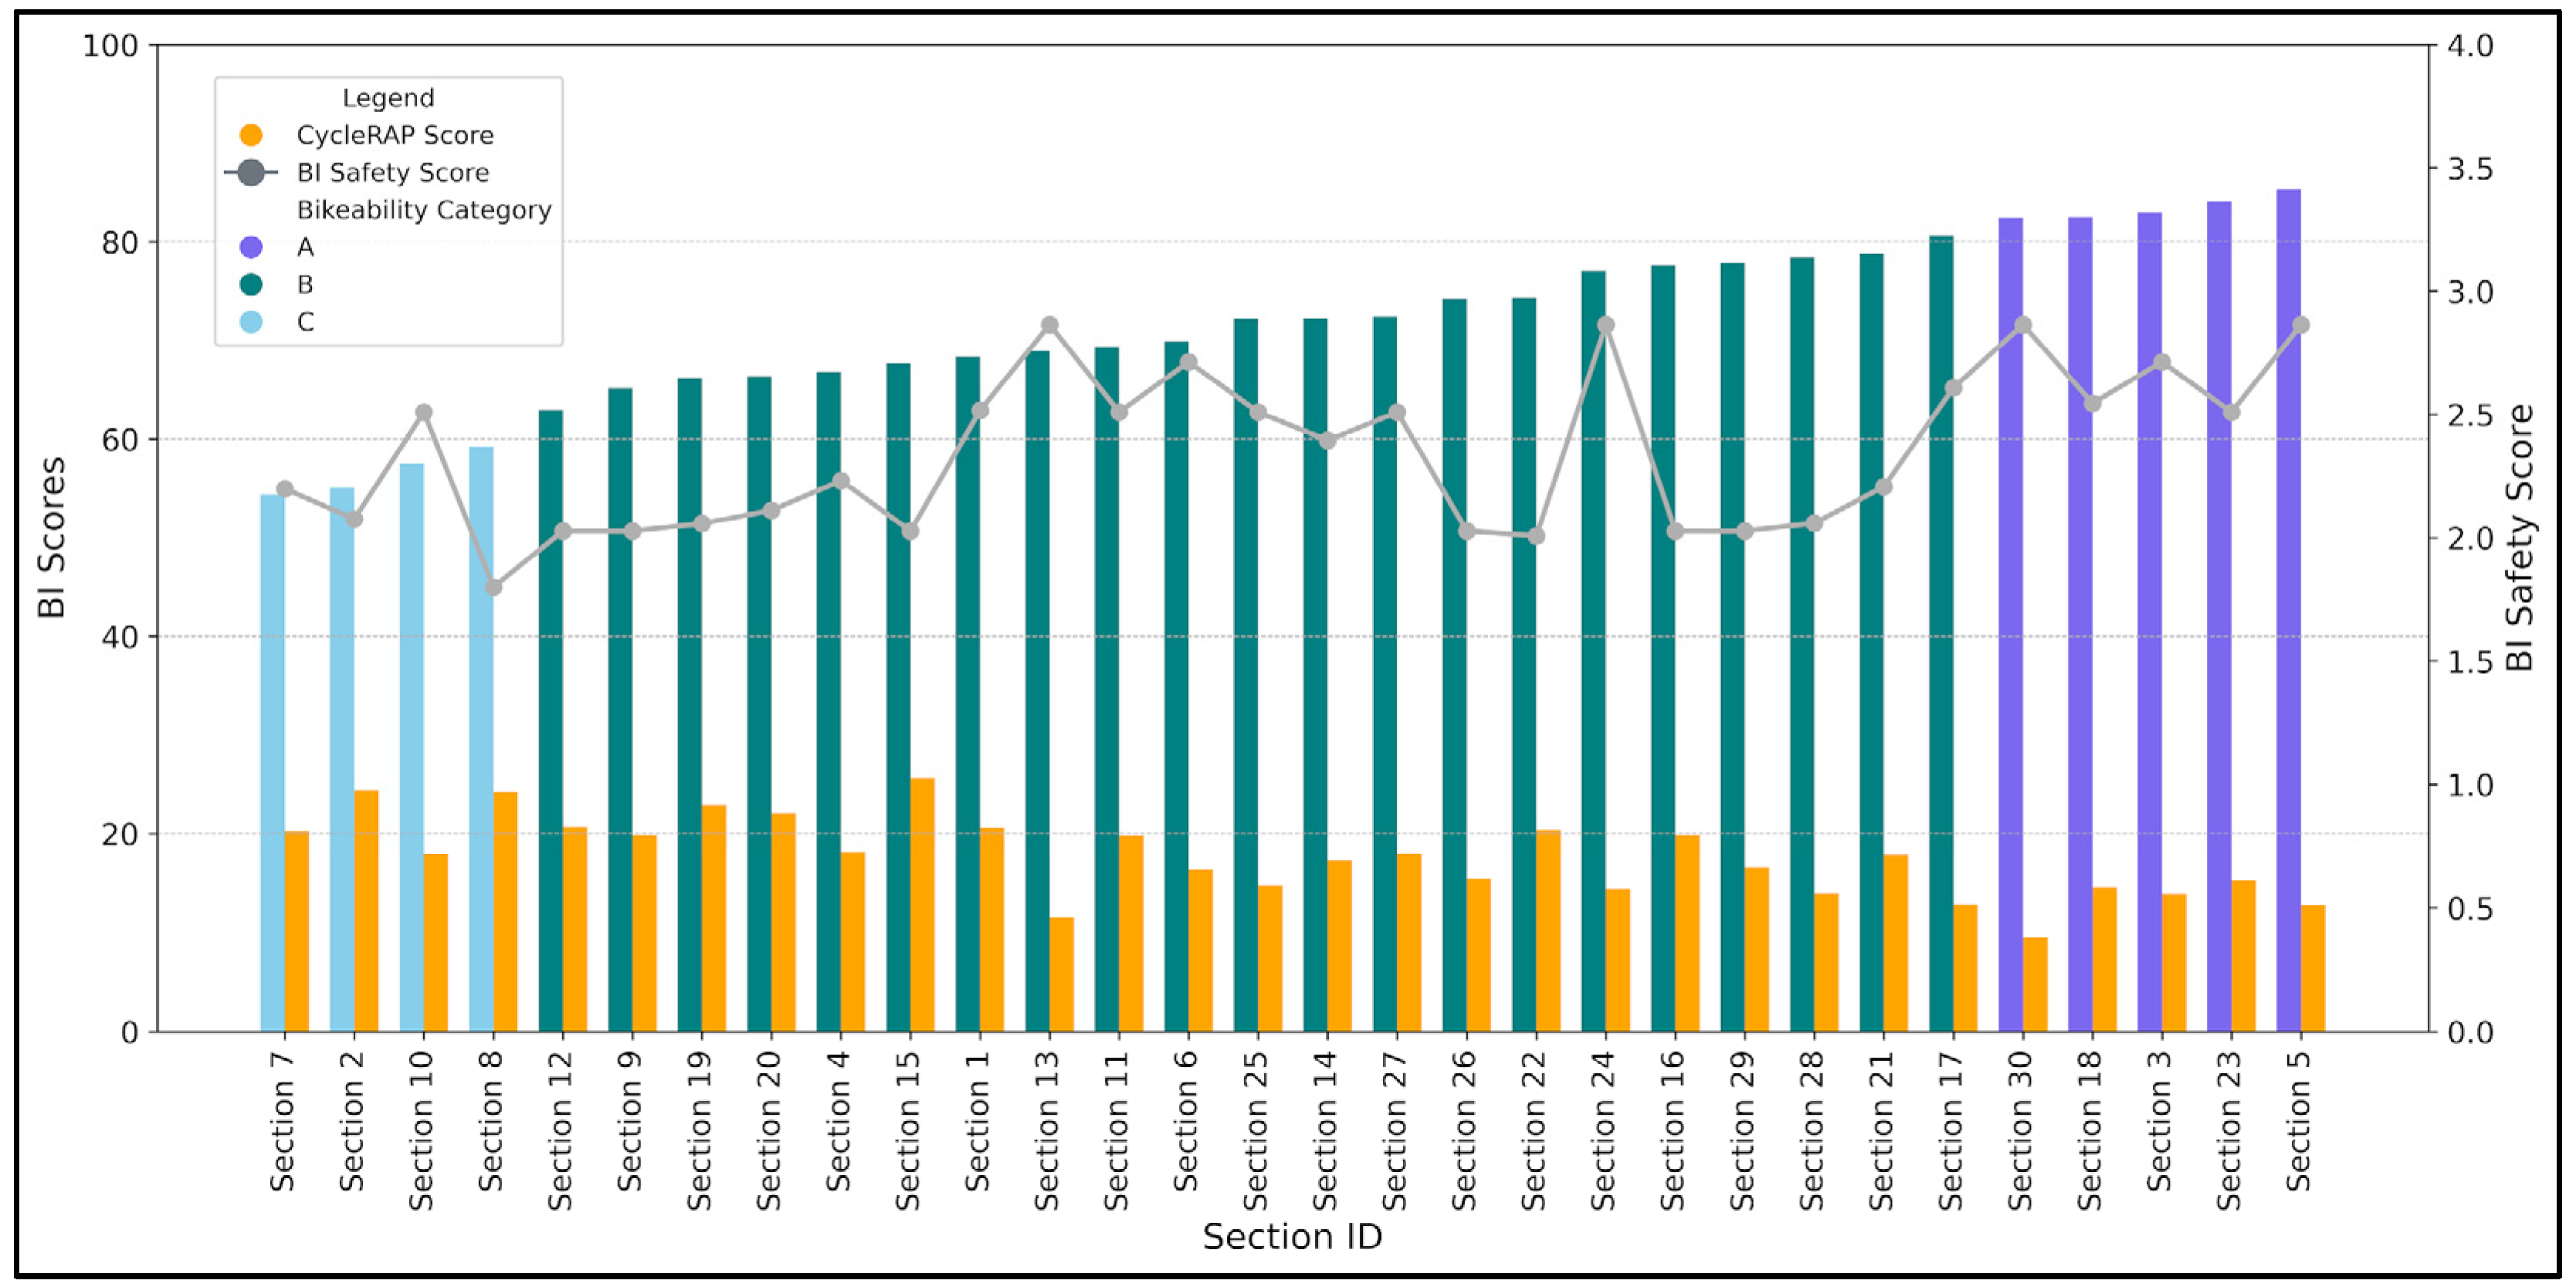
3.1. Bikeability and BI Safety Scores
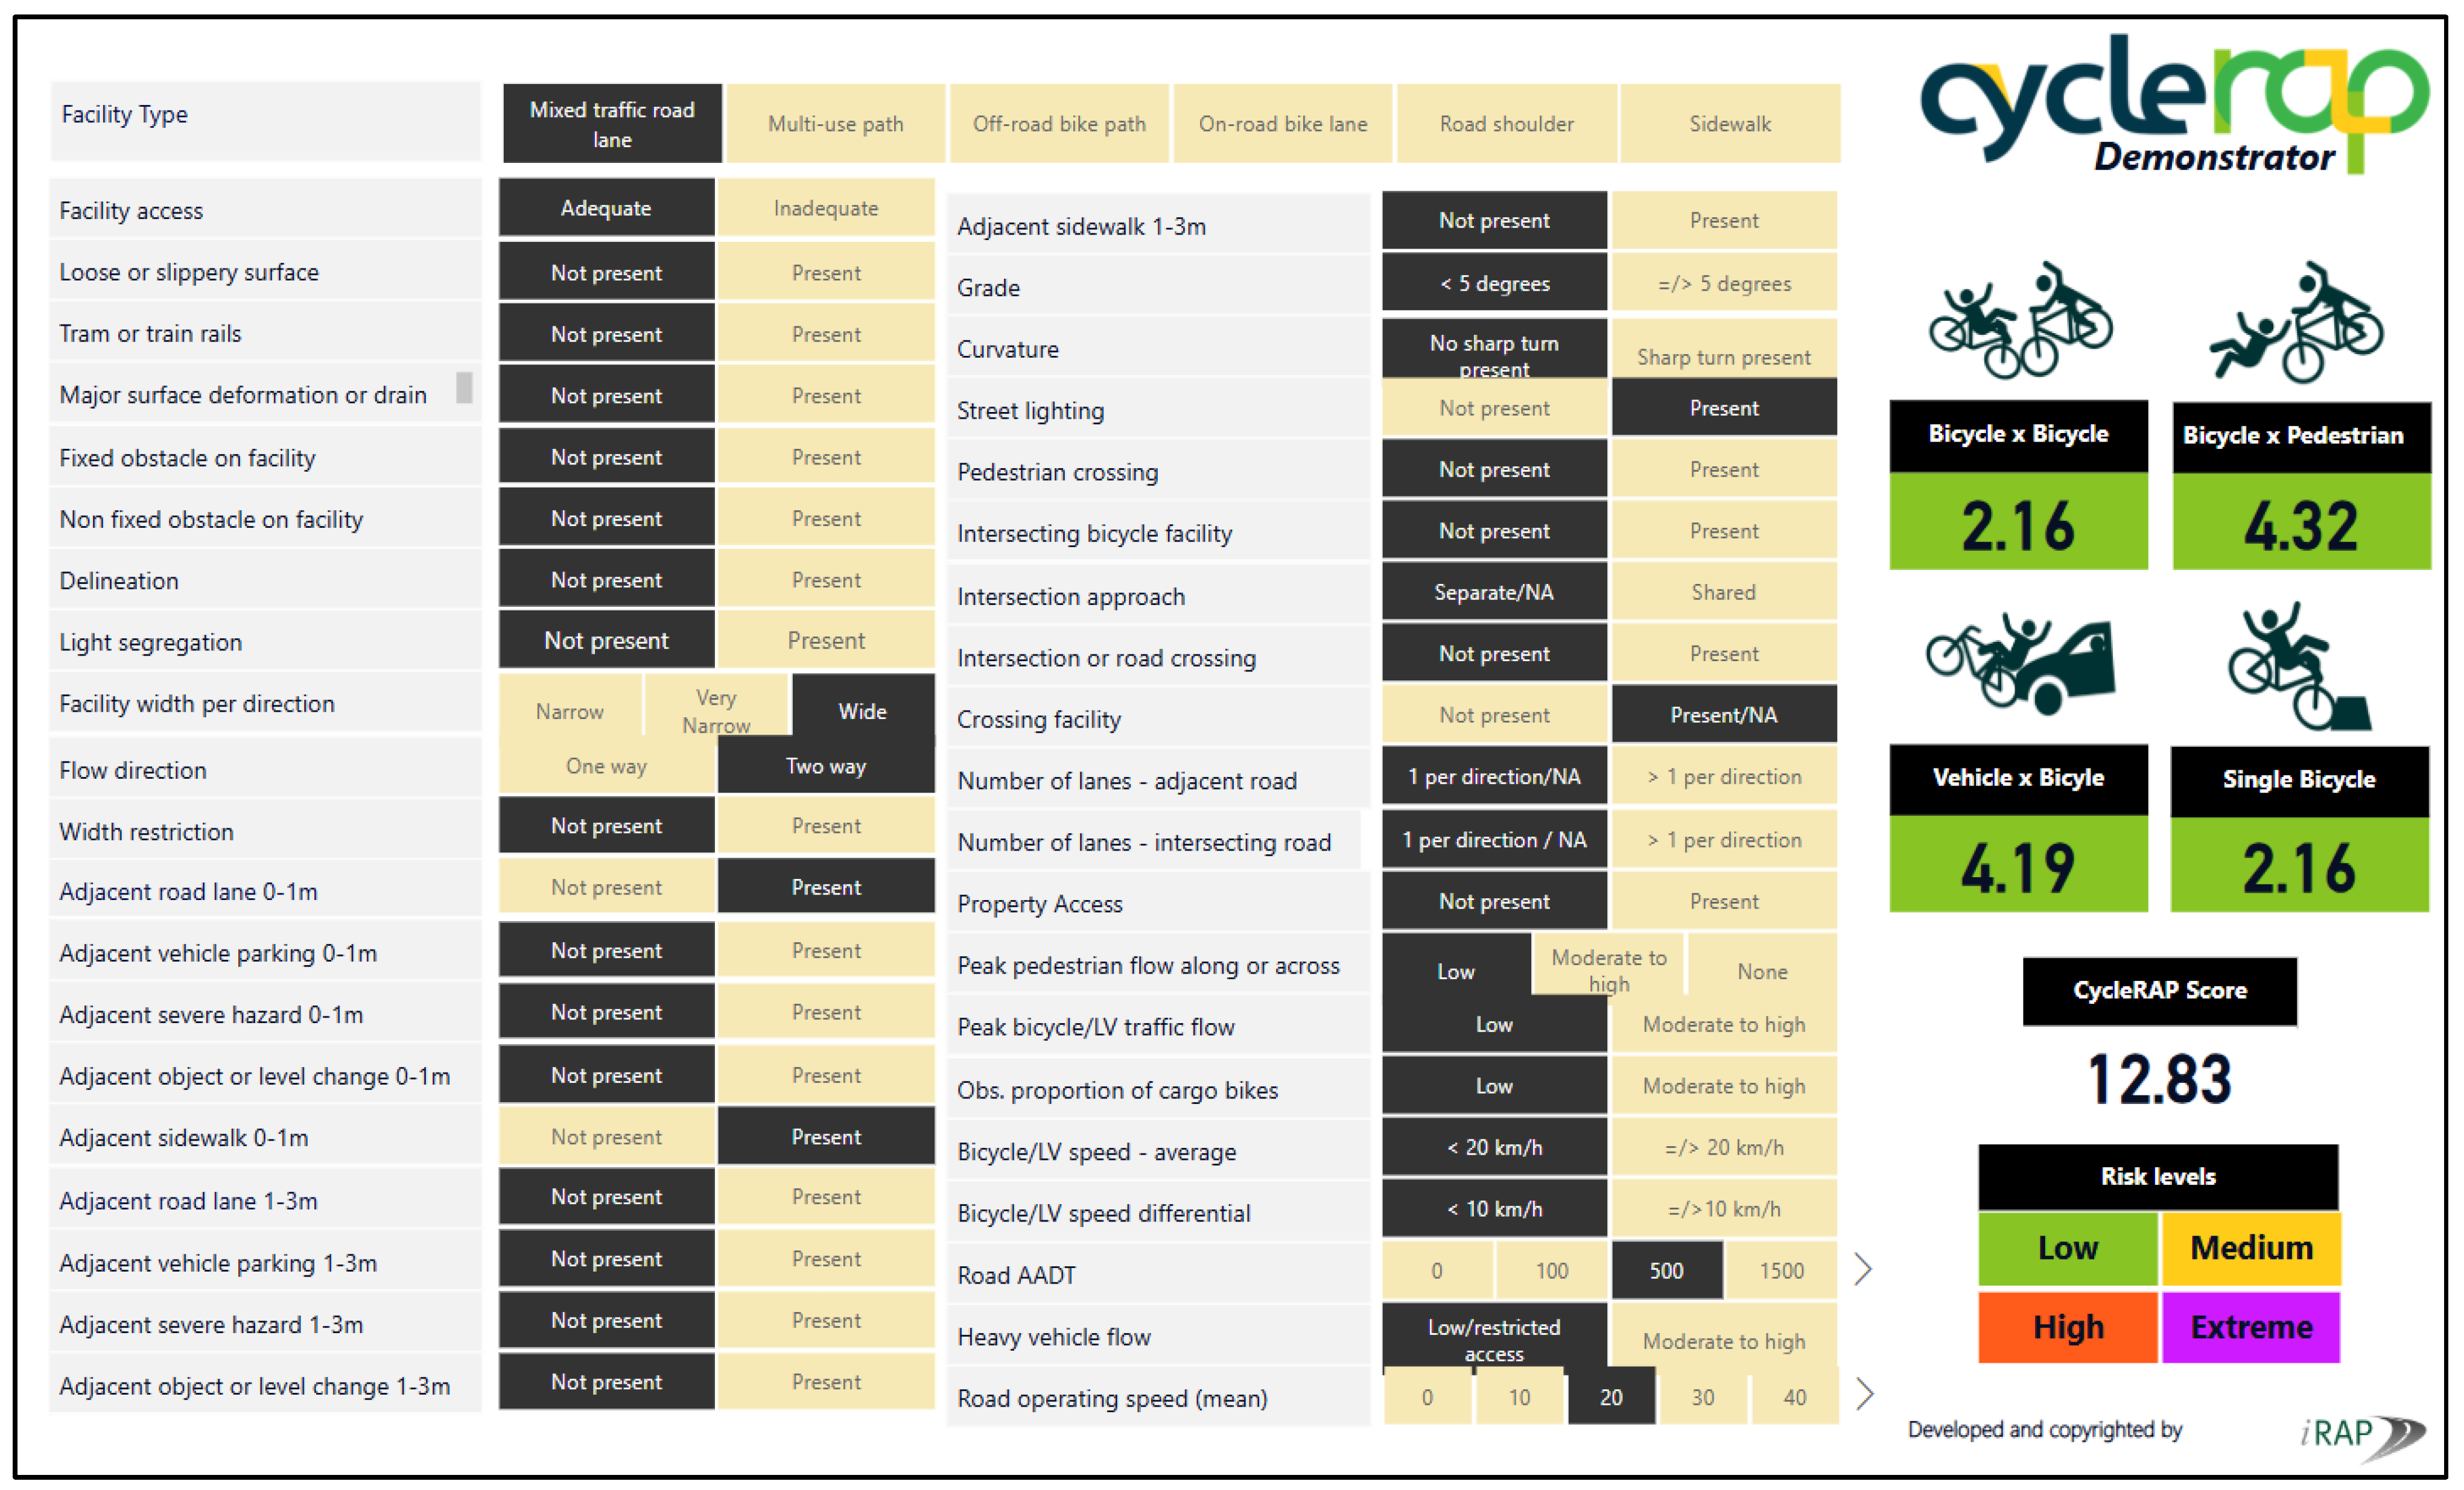
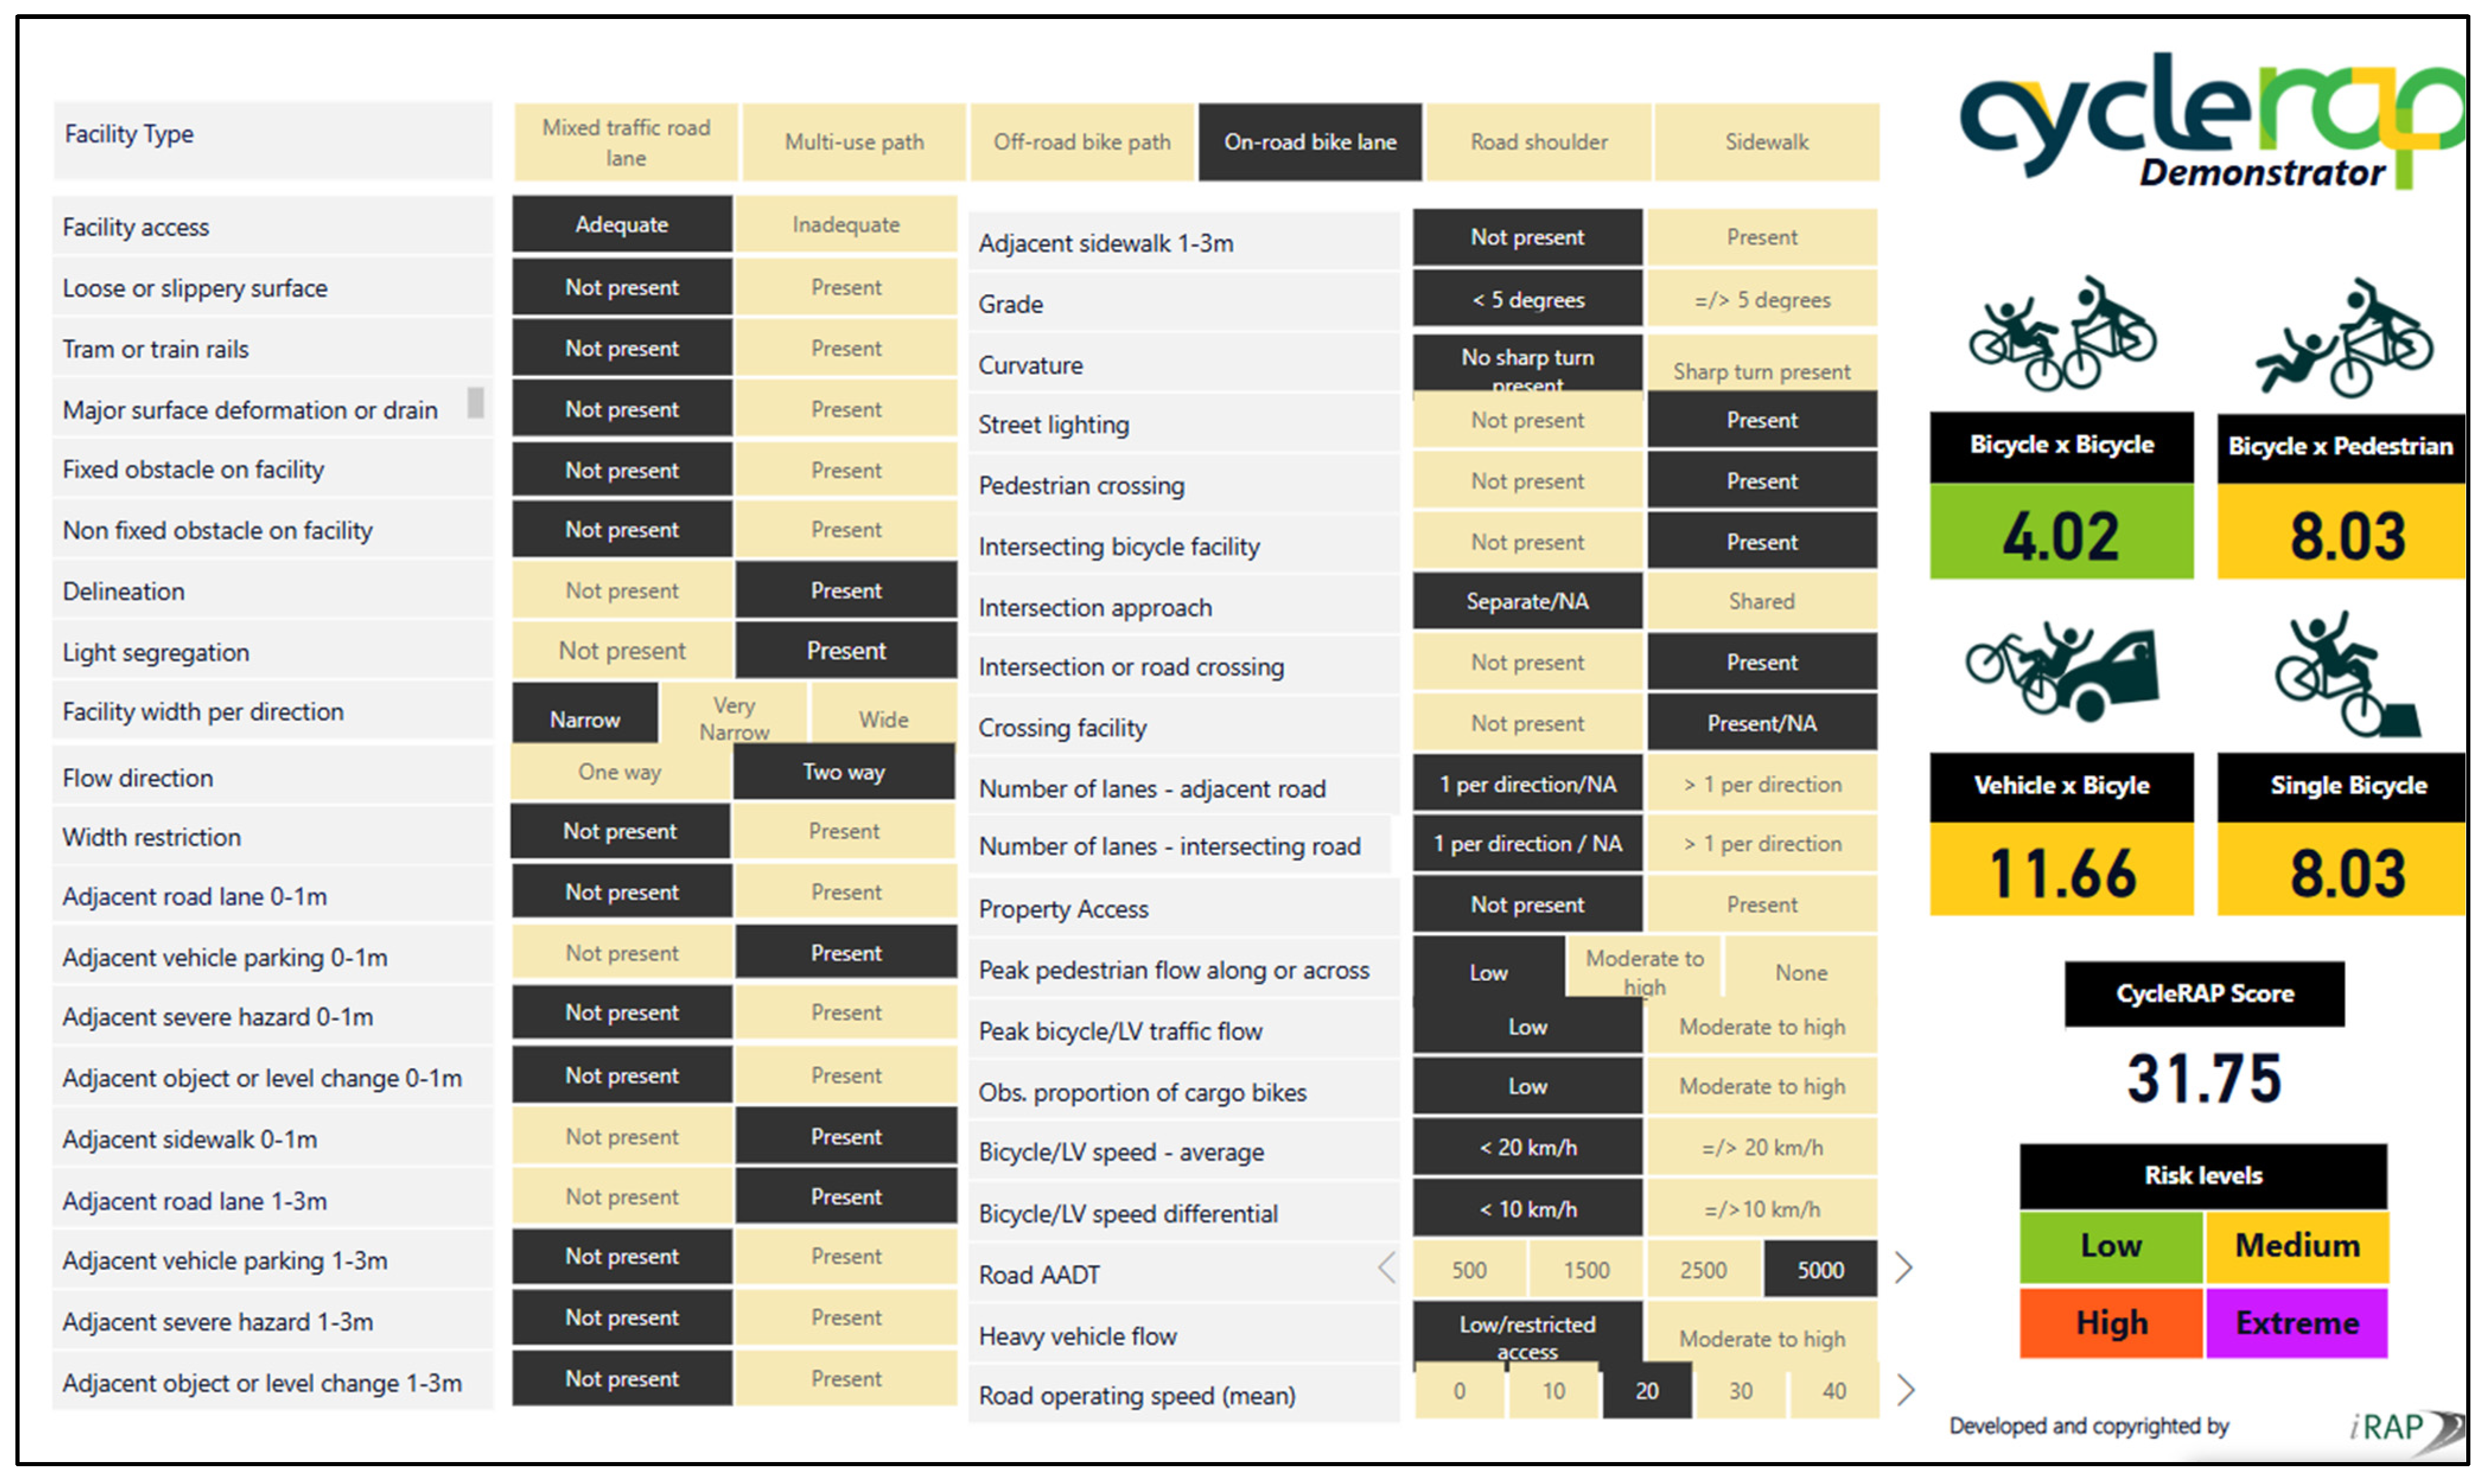
3.2. CycleRAP Scores
3.3. Comparison of BI and CycleRAP Scores
4. Discussion
5. Conclusions
Author Contributions
Funding
Data Availability Statement
Acknowledgments
Conflicts of Interest
Appendix A. Score of Bikeability Sub-Indicators (Source: [36])

| Criteria | Indicators | Sub-Indicators | Scores |
|---|---|---|---|
| Comfort | CMF01 | Solitary bike path. | 1.00 |
| Physically separated (by height or space) bicycle lane. | 0.66 | ||
| Bicycle lane. | 0.41 | ||
| Bicycle-prioritized street. | 0.63 | ||
| Suggested bicycle path. | 0.14 | ||
| Bicycle path shared with motorized traffic. | 0.00 | ||
| CMF02 | Asphalt-paved. | 1.00 | |
| Concrete-paved. | 0.79 | ||
| Paving slabs. | 0.42 | ||
| Cobblestones paved | 0.00 | ||
| CMF03 | Unidirectional, wide (≥2 m). | 1.00 | |
| Unidirectional, narrow (<2 m). | 0.40 | ||
| Double direction, wide (≥3 m). | 0.93 | ||
| Double direction, narrow (<3 m). | 0.00 | ||
| Shared. | 0.30 | ||
| CMF04 | Buffered from cycle lane. | 1.00 | |
| Adjacent to cycle lane. | 0.48 | ||
| Shared with cyclist. | 0.00 | ||
| CMF05 | Low (1–3%). | 1.00 | |
| Medium (3–6%). | 0.57 | ||
| High (>6%). | 0.00 | ||
| Safety | SFT01 | Solitary bike path. | 1.00 |
| Physically separated (by height or space) bicycle lane. | 0.80 | ||
| Bicycle lane. | 0.44 | ||
| Bicycle prioritized street. | 0.60 | ||
| Suggested bicycle path. | 0.21 | ||
| Bicycle path shared with motorized traffic. | 0.00 | ||
| SFT02 | Shared with motorized traffic. | 0.91 | |
| 30 km/h. | 1.00 | ||
| 50 km/h. | 0.67 | ||
| 70 km/h. | 0.00 | ||
| SFT03 | Availability of traffic signals at intersections. | 1.00 | |
| Non-availability of traffic signals. | 0.00 | ||
| SFT04 | Good street lighting (not exceeding 60 m apart from one another). | 1.00 | |
| Limited street lighting (the distances between the light poles are longer). | 0.38 | ||
| No street lighting. | 0.00 | ||
| SFT05 | No car parking. | 1.00 | |
| Car parking with a buffer area. | 0.65 | ||
| Car parking without a buffer area. | 0.00 | ||
| Attractiveness | ATR01 | Bicycle route/lane along trees and landscaping or water area. | 1.00 |
| Bicycle route/lane without trees and landscaping or water area. | 0.00 | ||
| ATR02 | Parking facilities at key destinations (e.g., shops, stations, etc.). | 1.00 | |
| No parking facilities at key destinations (e.g., shops, stations, etc.). | 0.00 | ||
| Directness and Coherence | DC01 | Presence of bicycle facilities at intersections. | 1.00 |
| Partial presence of bicycle facilities at intersections. | 0.88 | ||
| Non-presence of bicycle facilities at intersections. | 0.00 | ||
| DC02 | Well-signposted. | 1.00 | |
| Partially signposted/signage missing at key location. | 0.47 | ||
| No signage available. | 0.00 | ||
| DC03 | One or no interruptions. | 1.00 | |
| Two or more interruptions. | 0.00 |
References
- Garrard, J.; Rissel, C.; Bauman, A. Health Benefits of Cycling. City Cycl. 2012, 31, 31–56. [Google Scholar]
- Handy, S.; van Wee, B.; Kroesen, M. Promoting Cycling for Transport: Research Needs and Challenges. Transp. Rev. 2014, 34, 4–24. [Google Scholar] [CrossRef]
- Hamilton, T.L.; Wichman, C.J. Bicycle Infrastructure and Traffic Congestion: Evidence from DC’s Capital Bikeshare. J. Environ. Econ. Manag. 2018, 87, 72–93. [Google Scholar] [CrossRef]
- Pucher, J.; Dill, J.; Handy, S. Infrastructure, Programs, and Policies to Increase Bicycling: An International Review. Prev. Med. 2010, 50, S106–S125. [Google Scholar] [CrossRef]
- Pucher, J.; Buehler, R. Making Cycling Irresistible: Lessons from the Netherlands, Denmark and Germany. Transp. Rev. 2008, 28, 495–528. [Google Scholar] [CrossRef]
- Kraus, S.; Koch, N. Provisional COVID-19 Infrastructure Induces Large, Rapid Increases in Cycling. Proc. Natl. Acad. Sci. USA 2021, 118, e2024399118. [Google Scholar] [CrossRef]
- Hong, J.; McArthur, D.P.; Livingston, M. The Evaluation of Large Cycling Infrastructure Investments in Glasgow Using Crowdsourced Cycle Data. Transportation 2020, 47, 2859–2872. [Google Scholar] [CrossRef]
- Adinarayana, B.; Mir, M.S. Development of Bicycle Safety Index Models for Safety of Bicycle Flow at 3-Legged Junctions on Urban Roads under Mixed Traffic Conditions. Transp. Res. Procedia 2020, 48, 1227–1243. [Google Scholar] [CrossRef]
- Asadi-Shekari, Z.; Moeinaddini, M.; Zaly Shah, M. A Bicycle Safety Index for Evaluating Urban Street Facilities. Traffic Inj. Prev. 2015, 16, 283–288. [Google Scholar] [CrossRef]
- Bíl, M.; Andrášik, R.; Kubeček, J. How Comfortable Are Your Cycling Tracks? A New Method for Objective Bicycle Vibration Measurement. Transp. Res. Part C Emerg. Technol. 2015, 56, 415–425. [Google Scholar] [CrossRef]
- Arellana, J.; Saltarín, M.; Larrañaga, A.M.; González, V.I.; Henao, C.A. Developing an Urban Bikeability Index for Different Types of Cyclists as a Tool to Prioritise Bicycle Infrastructure Investments. Transp. Res. Part A Policy Pract. 2020, 139, 310–334. [Google Scholar] [CrossRef]
- Castañon, U.N.; Ribeiro, P.J.G. Bikeability and Emerging Phenomena in Cycling: Exploratory Analysis and Review. Sustainability 2021, 13, 2394. [Google Scholar] [CrossRef]
- Beura, S.K.; Bhuyan, P.K. Development of Artificial Intelligence-Based Bicycle Level of Service Models for Urban Street Segments. Int. J. Intell. Transp. Syst. Res. 2021, 20, 142–156. [Google Scholar] [CrossRef]
- Landis, B.W.; Vattikuti, V.R.; Brannick, M.T. Real-Time Human Perceptions: Toward a Bicycle Level of Service. Transp. Res. Rec. 1997, 1578, 119–126. [Google Scholar] [CrossRef]
- Davis, J. Bicycle Safety Evaluation. Auburn University, City of Chattanooga, and Chattanooga-Hamilton County Regional Planning Commission, Chattanooga, Tenn., 1987. DELOITTE. Guia Para Melhorar a Governança Corporativa Através de Eficazes Controles Internos. Deloit. Outubro 1987, 1002–1438. [Google Scholar]
- Davis, W.J. Bicycle Test Route Evaluation for Urban Road Conditions. In Proceedings of the Transportation Congress, Volumes 1 and 2: Civil Engineers—Key to the World’s Infrastructure, ASCE, San Diego, CA, USA, 22–26 October 1995; pp. 1063–1076. [Google Scholar]
- Crist, K.; Schipperijn, J.; Ryan, S.; Appleyard, B.; Godbole, S.; Kerr, J. Fear Factor: Level of Traffic Stress and GPS Assessed Cycling Routes. J. Transp. Technol. 2018, 9, 14–30. [Google Scholar] [CrossRef]
- Boettge, B.; Hall, D.M.; Crawford, T. Assessing the Bicycle Network in St. Louis: A PlaceBased User-Centered Approach. Sustainability 2017, 9, 241. [Google Scholar] [CrossRef]
- Ito, K.; Biljecki, F. Assessing Bikeability with Street View Imagery and Computer Vision. Transp. Res. Part C Emerg. Technol. 2021, 132, 103371. [Google Scholar] [CrossRef]
- Sorton, A.; Walsh, T. Bicycle Stress Level as a Tool to Evaluate Urban and Suburban Bicycle Compatibility. Transp. Res. Rec. 1994, 1438, 17–24. [Google Scholar]
- Kazemzadeh, K.; Laureshyn, A.; Winslott Hiselius, L.; Ronchi, E. Expanding the Scope of the Bicycle Level-of-Service Concept: A Review of the Literature. Sustainability 2020, 12, 2944. [Google Scholar] [CrossRef]
- Asadi-Shekari, Z.; Moeinaddini, M.; Zaly Shah, M. Non-Motorised Level of Service: Addressing Challenges in Pedestrian and Bicycle Level of Service. Transp. Rev. 2013, 33, 166–194. [Google Scholar] [CrossRef]
- Huertas, J.A.; Palacio, A.; Botero, M.; Carvajal, G.A.; van Laake, T.; Higuera-Mendieta, D.; Cabrales, S.A.; Guzman, L.A.; Sarmiento, O.L.; Medaglia, A.L. Level of Traffic Stress-Based Classification: A Clustering Approach for Bogotá, Colombia. Transp. Res. Part D Transp. Environ. 2020, 85, 102420. [Google Scholar] [CrossRef]
- Bhavsa, J.; Olyslagers, M.; Lucchesi, S. 104 Demystifying Safe Infrastructure for Cyclists: Low-Risk Examples from 5 Cities. Inj. Prev. 2024, 30, A16. [Google Scholar] [CrossRef]
- Daraei, S.; Pelechrinis, K.; Quercia, D. A Data-Driven Approach for Assessing Biking Safety in Cities. EPJ Data Sci. 2021, 10, 11. [Google Scholar] [CrossRef]
- Ahmed, T.; Pirdavani, A.; Janssens, D.; Wets, G. Utilizing Intelligent Portable Bicycle Lights to Assess Urban Bicycle Infrastructure Surfaces. Sustainability 2023, 15, 4495. [Google Scholar] [CrossRef]
- Costa, M.; Marques, M.; Siebert, F.W.; Azevedo, C.L.; Moura, F. Scoring Cycling Environments Perceived Safety Using Pairwise Image Comparisons. In Proceedings of the 2023 IEEE 26th International Conference on Intelligent Transportation Systems (ITSC), Bilbao, Spain, 24–28 September 2023; pp. 4046–4051. [Google Scholar]
- Ahmed, T.; Pirdavani, A.; Wets, G.; Janssens, D. Bicycle Infrastructure Design Principles in Urban Bikeability Indices: A Systematic Review. Sustainability 2024, 16, 2545. [Google Scholar] [CrossRef]
- Kellstedt, D.K.; Spengler, J.O.; Maddock, J.E. Comparing Perceived and Objective Measures of Bikeability on a University Campus: A Case Study. SAGE Open 2021, 11, 1–10. [Google Scholar] [CrossRef]
- Karolemeas, C.; Vassi, A.; Tsigdinos, S.; Bakogiannis, D.E. Measure the Ability of Cities to Be Biked via Weighted Parameters, Using GIS Tools. the Case Study of Zografou in Greece. Transp. Res. Procedia 2022, 62, 59–66. [Google Scholar] [CrossRef]
- Lin, J.J.; Wei, Y.H. Assessing Area-Wide Bikeability: A Grey Analytic Network Process. Transp. Res. Part A Policy Pract. 2018, 113, 381–396. [Google Scholar] [CrossRef]
- Lowry, M.; Callister, D.; Gresham, M.; Moore, B. Assessment of Communitywide Bikeability with Bicycle Level of Service. Transp. Res. Rec. 2012, 2314, 41–48. [Google Scholar] [CrossRef]
- Schmid-Querg, J.; Keler, A.; Grigoropoulos, G. The Munich Bikeability Index: A Practical Approach for Measuring Urban Bikeability. Sustainability 2021, 13, 428. [Google Scholar] [CrossRef]
- Winters, M.; Teschke, K.; Brauer, M.; Fuller, D. Bike Score®: Associations between Urban Bikeability and Cycling Behavior in 24 Cities. Int. J. Behav. Nutr. Phys. Act. 2016, 13, 18. [Google Scholar] [CrossRef] [PubMed]
- Porter, A.K.; Kohl, H.W.; Pérez, A.; Reininger, B.; Pettee Gabriel, K.; Salvo, D. Bikeability: Assessing the Objectively Measured Environment in Relation to Recreation and Transportation Bicycling. Environ. Behav. 2020, 52, 861–894. [Google Scholar] [CrossRef]
- Ahmed, T.; Pirdavani, A.; Wets, G.; Janssens, D. Micro-Level Bicycle Infrastructure Design Elements: A Framework for Developing a Bikeability Index for Urban Areas. Smart Cities 2025, 8, 46. [Google Scholar] [CrossRef]
- Arellana, J.; Saltarín, M.; Larrañaga, A.M.; Alvarez, V.; Henao, C.A. Urban Walkability Considering Pedestrians’ Perceptions of the Built Environment: A 10-Year Review and a Case Study in a Medium-Sized City in Latin America. Transp. Rev. 2020, 40, 183–203. [Google Scholar] [CrossRef]
- iRAP. Cyclerap Methodology Factsheet. 2024. Available online: https://resources.irap.org/Key-documents/CycleRAP_Methodology.pdf?_gl=1*8jasw1*_ga*MTk4MzgzMjUwNi4xNzIwNjE5OTQ5*_ga_HK6PSM29PR*MTc0MzgyMTQ4NC45NC4xLjE3NDM4MjE2MTEuMC4wLjA (accessed on 10 June 2024).
- Bai, L.; Liu, P.; Chan, C.-Y.; Li, Z. Estimating Level of Service of Mid-Block Bicycle Lanes Considering Mixed Traffic Flow. Transp. Res. Part A Policy Pract. 2017, 101, 203–217. [Google Scholar] [CrossRef]
- Schimek, P. Bike Lanes next to On-Street Parallel Parking. Accid. Anal. Prev. 2018, 120, 74–82. [Google Scholar] [CrossRef]
- Duthie, J.; Brady, J.F.; Mills, A.F.; Machemehl, R.B. Effects of On-Street Bicycle Facility Configuration on Bicyclist and Motorist Behavior. Transp. Res. Rec. 2010, 2190, 37–44. [Google Scholar] [CrossRef]
- Marshall, W.E.; Garrick, N.W. Research Article: Evidence on Why Bike-Friendly Cities Are Safer for All Road Users. Environ. Pract. 2011, 13, 16–27. [Google Scholar] [CrossRef]
- Cohen, E. Segregated Bike Lanes Are Safest for Cyclists. Can. Med. Assoc. J. 2013, 185, E443–E444. [Google Scholar] [CrossRef]
- Foster, N.; Monsere, C.M.; Dill, J.; Clifton, K. Level-of-Service Model for Protected Bike Lanes. Transp. Res. Rec. 2015, 2520, 90–99. [Google Scholar] [CrossRef]
- Asadi-Shekari, Z.; Moeinaddini, M.; Zaly Shah, M. A Pedestrian Level of Service Method for Evaluating and Promoting Walking Facilities on Campus Streets. Land Use Policy 2014, 38, 175–193. [Google Scholar] [CrossRef]
- Reggiani, G.; van Oijen, T.; Hamedmoghadam, H.; Daamen, W.; Vu, H.L.; Hoogendoorn, S. Understanding Bikeability: A Methodology to Assess Urban Networks. Transportation 2022, 49, 897–925. [Google Scholar] [CrossRef]
- Asadi-Shekari, Z.; Moeinaddini, M.; Aghaabbasi, M.; Cools, M.; Zaly Shah, M. Exploring Effective Micro-Level Items for Evaluating Inclusive Walking Facilities on Urban Streets (Applied in Johor Bahru, Malaysia). Sustain. Cities Soc. 2019, 49, 101563. [Google Scholar] [CrossRef]
- Kang, H.; Kim, D.H.; Yoo, S. Attributes of Perceived Bikeability in a Compact Urban Neighborhood Based on Qualitative Multi-Methods. Int. J. Environ. Res. Public Health 2019, 16, 3738. [Google Scholar] [CrossRef]

| Criteria | Criteria Weight (1) | Indicators | Indicator Notations (2) | Indicator Weights (3) | Score of Indicators (4) | Indicator Weighted Scores (5) = (3) × (4) | BIMS (6) = (3) × 1 | BIW (7) = (1) × ∑(5) | BIMP (8) = (1) × ∑(6) | BI% = ∑(7)/∑(8) × 100 |
|---|---|---|---|---|---|---|---|---|---|---|
| Comfort | 0.86 | Presence of bicycle infrastructure | CMF01 | 0.595 | 1.00 | 0.595 | 0.595 | 1.849 | 2.403 | 86.26 |
| Pavement type | CMF02 | 0.646 | 1.00 | 0.646 | 0.646 | |||||
| Bike lane width | CMF03 | 0.653 | 0.93 | 0.607 | 0.653 | |||||
| Presence of sidewalk | CMF04 | 0.598 | 0.00 | 0.000 | 0.598 | |||||
| Grade | CMF05 | 0.302 | 1.00 | 0.302 | 0.302 | |||||
| Safety | 1 | Presence of bicycle infrastructure | SFT01 | 0.753 | 1.00 | 0.753 | 0.753 | 2.848 | 2.848 | |
| Motorized traffic speed | SFT02 | 0.640 | 1.00 | 0.640 | 0.640 | |||||
| Traffic control devices | SFT03 | 0.561 | 1.00 | 0.561 | 0.561 | |||||
| Street lighting | SFT04 | 0.471 | 1.00 | 0.471 | 0.471 | |||||
| Car parking along the cycle path | SFT05 | 0.423 | 1.00 | 0.423 | 0.423 | |||||
| Attractiveness | 0.7 | Trees/green area and landscaping | ATR01 | 0.477 | 1.00 | 0.477 | 0.477 | 0.674 | 0.674 | |
| Bicycle parking | ATR02 | 0.486 | 1.00 | 0.486 | 0.486 | |||||
| Directness and Coherence | 0.76 | Presence of cycle facilities at a traffic signal | DC01 | 0.658 | 1.00 | 0.658 | 0.658 | 0.754 | 1.176 | |
| Road signage | DC02 | 0.555 | 0.00 | 0.000 | 0.555 | |||||
| Interruptions (i.e., pedestrian crosswalks, intersections, or bus stops on bicycle lanes) | DC03 | 0.334 | 1.00 | 0.334 | 0.334 |
| Crash Type | Low Risk (Green) | Medium Risk (Yellow) | High Risk (Red) | Extreme Risk (Dark Red) |
|---|---|---|---|---|
| VB | <10 | 10 to 25 | 25 to 60 | >60 |
| BB, BP, SB | <5 | 5 to 10 | 10 to 20 | >20 |
| Facility Type | Indicator Measurement | Data Collection |
|---|---|---|
| Facility access | Adequate. | Google Maps |
| Inadequate. | ||
| Loose or slippery surface | Not present. | Field visit |
| Present. | ||
| Tram or train rails | Not present. | Google Maps |
| Present. | ||
| Major surface deformation or drain | Not present. | Field visit |
| Present. | ||
| Fixed obstacle on facility | Not present. | Google Maps |
| Present. | ||
| Non-fixed obstacle on facility | Not present. | Field visit |
| Present. | ||
| Delineation | Not present | Field visit |
| Present. | ||
| Light segregation | Not present. | Google Maps |
| Present. | ||
| Facility width per direction | Very narrow (less than 1 m). | Field visit |
| Narrow (1 to 2 m). | ||
| Wide (more than 2 m). | ||
| Flow direction | One-way. | Field visit |
| Two-way. | ||
| Width restriction | Not present. | Field visit |
| Present. | ||
| Adjacent road lane 0–1 m | Not present. | Google Maps |
| Present. | ||
| Adjacent vehicle parking 0–1 m | Not present. | Google Maps |
| Present. | ||
| Adjacent severe hazard 0–1 m | Not present. | Field visit |
| Present. | ||
| Adjacent object or level change 0–1 m | Not present. | Field visit |
| Present. | ||
| Adjacent sidewalk 0–1 m | Not present. | Google Maps |
| Present. | ||
| Adjacent road lane 1–3 m | Not present. | Google Maps |
| Present. | ||
| Adjacent vehicle parking 1–3 m | Not present. | Google Maps |
| Present. | ||
| Adjacent severe hazard 1–3 m | Not present. | Field visit |
| Present. | ||
| Adjacent object or level change 1–3 m | Not present. | Field visit |
| Present. | ||
| Adjacent sidewalk 1–3 m | Present. | Google Maps |
| Not present. | ||
| Grade | <5 degrees. | GIS |
| ≥5 Degrees. | ||
| Curvature | No sharp turn present. | Google Maps |
| Sharp turn present. | ||
| Street lighting | Present. | Field visit |
| Not present. | ||
| Pedestrian crossing | Present. | Google Maps |
| Not present. | ||
| Intersecting bicycle facility | Present. | Google Maps |
| Not present. | ||
| Intersection approach | Present. | Google Maps |
| Separate/NA. | ||
| Intersection or road crossing | Present. | Google Maps |
| Not present. | ||
| Crossing facility | Present. | Field visit |
| Present/NA. | ||
| Number of lanes—adjacent road | One per direction/NA. | Google Maps |
| >one per direction. | ||
| Number of lanes—intersecting road | One per direction/NA. | Google Maps |
| >One per direction. | ||
| Property access | Present. | Google Maps |
| Not present. | ||
| Peak pedestrian flow along or across | Low. | Field visit |
| Moderate to high. | ||
| Peak bicycle/LV traffic flow | Low. | Field visit |
| Moderate to high. | ||
| Obs. proportion of cargo bikes | Low. | Field visit |
| Moderate to high. | ||
| Bicycle/LV speed—average | <20 km/h. | Field visit |
| ≥20 km/h. | ||
| Bicycle/LV speed differential | <10 km/h. | Field visit |
| ≥10 km/h. | ||
| Road AADT | 0–40,000. | Secondary data |
| Heavy vehicle flow | Low. | Field visit |
| Moderate to high. | ||
| Road operating speed (mean) | 10–140 km/h. | Field visit |
| Criteria | Indicator Notations | Measurement Criteria | Data Collection |
|---|---|---|---|
| Comfort | CMF01 | Solitary bike path. | Google Maps |
| Physically separated (by height or space) bicycle lane. | |||
| Bicycle lane. | |||
| Bicycle-prioritized streets. | |||
| Suggested bicycle path. | |||
| Bicycle path shared with motorized traffic. | |||
| CMF02 | Asphalt-paved. | Google Maps | |
| Concrete-paved. | |||
| Paving slabs. | |||
| Cobblestones. | |||
| CMF03 | Unidirectional, wide (≥2 m). | Field visit | |
| Unidirectional, narrow (<2 m). | |||
| Double direction, wide (≥3 m). | |||
| Double direction, narrow (<3 m). | |||
| Shared. | |||
| CMF04 | Buffered from cycle lane. | Google Maps | |
| Adjacent to cycle lane. | |||
| Shared with cyclist. | |||
| CMF05 | Low (1–3%). | GIS | |
| Medium (3–6%). | |||
| High (>6%). | |||
| Safety | SFT01 | Solitary bike path. | Google Maps |
| Physically separated (by height or space) bicycle lane. | |||
| Bicycle lane. | |||
| Bicycle-prioritized street. | |||
| Suggested bicycle path. | |||
| Bicycle path shared with motorized traffic. | |||
| SFT02 | 30 km/h. | Field visit | |
| 50 km/h. | |||
| 70 km/h. | |||
| SFT03 | Availability of traffic signals at intersections. | Field visit | |
| Non-availability of traffic signals. | |||
| SFT04 | Good street lighting (not exceeding 60 m apart from one another). | Field visit | |
| Limited street lighting (the distances between the light poles are longer than 60 m). | |||
| No street lighting. | |||
| SFT05 | No car parking. | Google Maps | |
| Car parking with a buffer area. | |||
| Car parking without a buffer area. | |||
| Attractiveness | ATR01 | Bicycle route/lane along trees and landscaping or water area. | Google Maps |
| Bicycle route/lane without trees and landscaping or water area. | |||
| ATR02 | Parking facilities at key destinations (e.g., shops, stations, etc.). | Field visit | |
| No parking facilities at key destinations (e.g., shops, stations, etc.). | |||
| Directness and Coherence | DC01 | Presence of bicycle facilities at intersections. | Google Maps |
| Partial presence of bicycle facilities at intersections. | |||
| Non-presence of bicycle facilities at intersections. | |||
| DC02 | Well-signposted. | Field visit | |
| Partially signposted/signage missing at key location. | |||
| No signage available. | |||
| DC03 | One or no interruptions. | Google Maps | |
| Two or more interruptions. |
| Street Name | Street/Bicycle Facility Section ID | BI Score | BI Safety Score | CycleRAP Score |
|---|---|---|---|---|
| Maastrichtersteenweg | Section 1 | 69.27 | 2.486 | 20.36 |
| Sint-Truidersteenweg | Section 2 | 55.82 | 2.067 | 24.36 |
| Koning Boudewijnlaan | Section 3 | 83.00 | 2.697 | 13.88 |
| Kempische Steenweg | Section 4 | 60.99 | 2.274 | 18.09 |
| Inner Ring Hasselt | Section 5 | 86.26 | 2.848 | 12.76 |
| Inner Ring (Outer Side) | Section 6 | 69.74 | 2.697 | 16.34 |
| Witte Nonnenstraat | Section 7 | 55.03 | 2.197 | 20.24 |
| Badderijstraat | Section 8 | 49.65 | 1.803 | 24.25 |
| Minderbroedersstraat | Section 9 | 66.38 | 2.066 | 19.84 |
| Dorpstraat | Section 10 | 57.35 | 2.489 | 17.93 |
| Dokter Willemsstraat | Section 11 | 69.96 | 2.489 | 19.78 |
| Lombaardstraat | Section 12 | 65.13 | 2.066 | 20.70 |
| Walputstraat | Section 13 | 69.67 | 2.848 | 11.50 |
| Onze-Lieve-Vrouwstraat | Section 14 | 73.39 | 2.399 | 17.28 |
| Ridder Portmansstraat | Section 15 | 68.71 | 2.066 | 25.61 |
| Havermarkt | Section 16 | 79.05 | 2.066 | 19.84 |
| Melderstraat | Section 17 | 80.80 | 2.592 | 12.83 |
| Luikersteenweg | Section 18 | 82.87 | 2.549 | 14.53 |
| Isabellastraat | Section 19 | 66.55 | 2.037 | 22.90 |
| Persoonstraat | Section 20 | 66.70 | 2.095 | 22.04 |
| Guido Gezellestraat | Section 21 | 79.83 | 2.066 | 17.83 |
| Capucienenstraat | Section 22 | 76.12 | 2.018 | 20.38 |
| Sint-Jozefsstraat | Section 23 | 85.09 | 2.489 | 17.27 |
| Koning Albertstraat | Section 24 | 77.47 | 2.848 | 14.42 |
| Ridderstraat | Section 25 | 72.10 | 2.489 | 14.74 |
| Cellebroedersstraat | Section 26 | 75.27 | 2.066 | 15.46 |
| Kapelstraat | Section 27 | 72.75 | 2.489 | 17.97 |
| Diesterstraat | Section 28 | 78.38 | 2.489 | 13.93 |
| Aldestraat | Section 29 | 78.86 | 2.066 | 16.57 |
| Schrijnwerkersstraat | Section 30 | 82.52 | 2.848 | 9.51 |
Disclaimer/Publisher’s Note: The statements, opinions and data contained in all publications are solely those of the individual author(s) and contributor(s) and not of MDPI and/or the editor(s). MDPI and/or the editor(s) disclaim responsibility for any injury to people or property resulting from any ideas, methods, instructions or products referred to in the content. |
© 2025 by the authors. Licensee MDPI, Basel, Switzerland. This article is an open access article distributed under the terms and conditions of the Creative Commons Attribution (CC BY) license (https://creativecommons.org/licenses/by/4.0/).
Share and Cite
Ahmed, T.; Pirdavani, A.; Wets, G.; Janssens, D. A Comparative Study of Bikeability Index and CycleRAP in Examining Urban Cycling Facilities. Infrastructures 2025, 10, 90. https://doi.org/10.3390/infrastructures10040090
Ahmed T, Pirdavani A, Wets G, Janssens D. A Comparative Study of Bikeability Index and CycleRAP in Examining Urban Cycling Facilities. Infrastructures. 2025; 10(4):90. https://doi.org/10.3390/infrastructures10040090
Chicago/Turabian StyleAhmed, Tufail, Ali Pirdavani, Geert Wets, and Davy Janssens. 2025. "A Comparative Study of Bikeability Index and CycleRAP in Examining Urban Cycling Facilities" Infrastructures 10, no. 4: 90. https://doi.org/10.3390/infrastructures10040090
APA StyleAhmed, T., Pirdavani, A., Wets, G., & Janssens, D. (2025). A Comparative Study of Bikeability Index and CycleRAP in Examining Urban Cycling Facilities. Infrastructures, 10(4), 90. https://doi.org/10.3390/infrastructures10040090