Article

Novel Fuzzy Multi-Criteria Decision Framework for Maritime Infrastructure Maintenance

by
Ehidiame Ibazebo
1,
Vimal Savsani
1,2,
Arti Siddhpura
1,
Milind Siddhpura
1,* and
Poonam Savsani
1,3
1
Engineering Institute of Technology, 6 & 8 Thelma Street, West Perth 6005, Australia
2
Department of Engineering, Canadore College, North Bay, ON P1B 8K9, Canada
3
School of Engineering Technology, Cambrian College, Sudbury, ON P3A 3V8, Canada
*
Author to whom correspondence should be addressed.
Infrastructures 2025, 10(4), 89; https://doi.org/10.3390/infrastructures10040089
Submission received: 21 February 2025 / Revised: 2 April 2025 / Accepted: 3 April 2025 / Published: 7 April 2025
(This article belongs to the Special Issue Smart, Sustainable and Resilient Infrastructures, 3rd Edition)

Abstract

The maintenance of critical maritime infrastructure is essential for ensuring the safe, reliable, and efficient operations of marine seaports. This paper proposes a novel fuzzy multi-criteria decision framework for evaluating the maintenance practices and culture of maintenance-critical maritime infrastructure, such as port loading and unloading machinery and equipment. The proposed framework incorporates three distinct multi-criteria decision-making tools Step-wise Weight Assessment Ratio Analysis, Weighted Aggregate Sum Product Assessment, and Technique for Order of Preference by Similarity to Ideal Solution. Fuzzy logic is incorporated into the framework to enhance the precision and robustness of the evaluation process. To form the basis of the assessment, the framework is structured around five key maintenance practice criteria: planning and scheduling; data collection and analysis; documentation and record keeping; maintenance personnel training; and competency, and four important maintenance culture criteria: leadership commitment, proactive and preventive approach, safety and compliance focus, and continuous improvement and learning. To validate the framework, an empirical evaluation was conducted, analyzing maintenance practices and culture across six Nigerian seaports. Data collection uses a questionnaire administered to relevant maintenance experts in the ports, ensuring a comprehensive and expert-informed analysis. The data collected was then analyzed using the fuzzy multi-criteria decision framework. The results provide valuable and actionable insights into the current maintenance practices and maintenance culture of the ports, identifying areas for improvement.

1. Introduction

The maritime industry is a cornerstone of global economic growth and trade, with maritime seaports facilitating logistics and international trade and contributing to the economic development of regions and countries [1]. Hence, stakeholders, port authorities, the government, and investors are keen to ensure that critical infrastructures are well maintained to make seaports attractive to clients and investors. This has stimulated interest in investment in maintenance-critical maritime infrastructure (MCMI), which is essential for the long-term success and competitiveness of seaports. In most seaports, MCMI management is under the supervision of the port authorities. A well-maintained infrastructure and equipment ensure operational continuity through minimal downtime, ensuring a continuous flow of goods and attracting clients who depend on timely shipments. In addition, cargo can be handled quickly and efficiently, reducing turnaround times for ships and increasing port throughput. The safety of port workers and cargo is ensured as regular maintenance helps prevent accidents and equipment failures. Efficient, well-maintained infrastructures lead to lower operational costs because the need for costly emergency repairs is reduced and operational disruptions are minimized. This leads to cost savings that can be passed on to clients in the form of competitive rates, making the port more attractive when compared to less efficient ports. A well-maintained port with a track record of well-maintained infrastructure builds trust with clients and presents a positive image, enhancing its reputation in the industry.
MCMI evaluation involves the systematic assessment of the condition and performance of various components that make up a port infrastructure and facilities to ensure they are safe, functional, reliable, and efficient. This includes evaluating the state of docks, piers, breakwaters, navigation channels, port equipment like cranes, loading and unloading machinery, utilities, buildings, and other shore-based facilities. The evaluation process typically involves visual inspection by technical personnel; structural integrity, wear, and corrosion diagnostic testing; operational capacity and efficiency performance monitoring; and analysis of maintenance records and asset management data. Deficiencies, deterioration, or damage that could impact the safety, reliability, and productivity of operations are identified. The information gathered is then used to guide maintenance planning, budgeting, and capital improvement projects to keep the infrastructure in good working condition.
MCMI also serves as an essential tool for setting benchmarks. Benchmarking can be seen from two perspectives: maintenance practice and maintenance culture, which are related but distinct concepts. Maintenance practice refers to specific activities, strategies, procedures, and methods used to ensure the proper functioning and longevity of infrastructure, equipment, and assets. It encompasses a range of activities such as preventive maintenance, corrective maintenance, predictive maintenance, condition-based monitoring, and reliability-centred maintenance. Maintenance culture, on the other hand, refers to the broader organizational mindset, values, beliefs, and attitudes regarding the importance of maintenance. It encompasses how people within an organization approach and view maintenance activities, their commitment to equipment maintenance and maintenance task prioritization, and the level of responsibility they take in ensuring assets are properly maintained. A robust maintenance practice and a supportive maintenance culture are crucial for organizations to maximize asset reliability, optimize the lifecycle performance of their physical assets and infrastructure, and achieve operational excellence.
An approach that can be used for analyzing port maintenance practices and culture is the multi-criteria decision-making (MCDM) framework. Studies have used MCDM approaches to address various maintenance issues in the maritime industry. However, to the best of the author’s knowledge, no investigation has been conducted into benchmarking a port’s MCMI using MCDM. Thus, this paper proposes a framework for MCMI evaluation using selected maintenance practices and maintenance culture criteria. The proposed framework incorporates three distinct multi-criteria decision-making tools, namely fuzzy Step-wise Weight Assessment Ratio Analysis (SWARA), Weighted Aggregate Sum Product Assessment (WASPAS), and Technique for Order of Preference by Similarity to Ideal Solution (TOPSIS). The fuzzy SWARA method was used to determine the importance of the maintenance practice and maintenance culture criteria. Also, fuzzy TOPSIS and WASPAS were applied to rank the performance of the port’s maintenance practices and culture criteria.
The proposed framework exhibits adaptability, robustness, and a strong focus on safety and compliance, which provides a versatile and reliable tool for application across various maritime contexts.

2. Literature Review

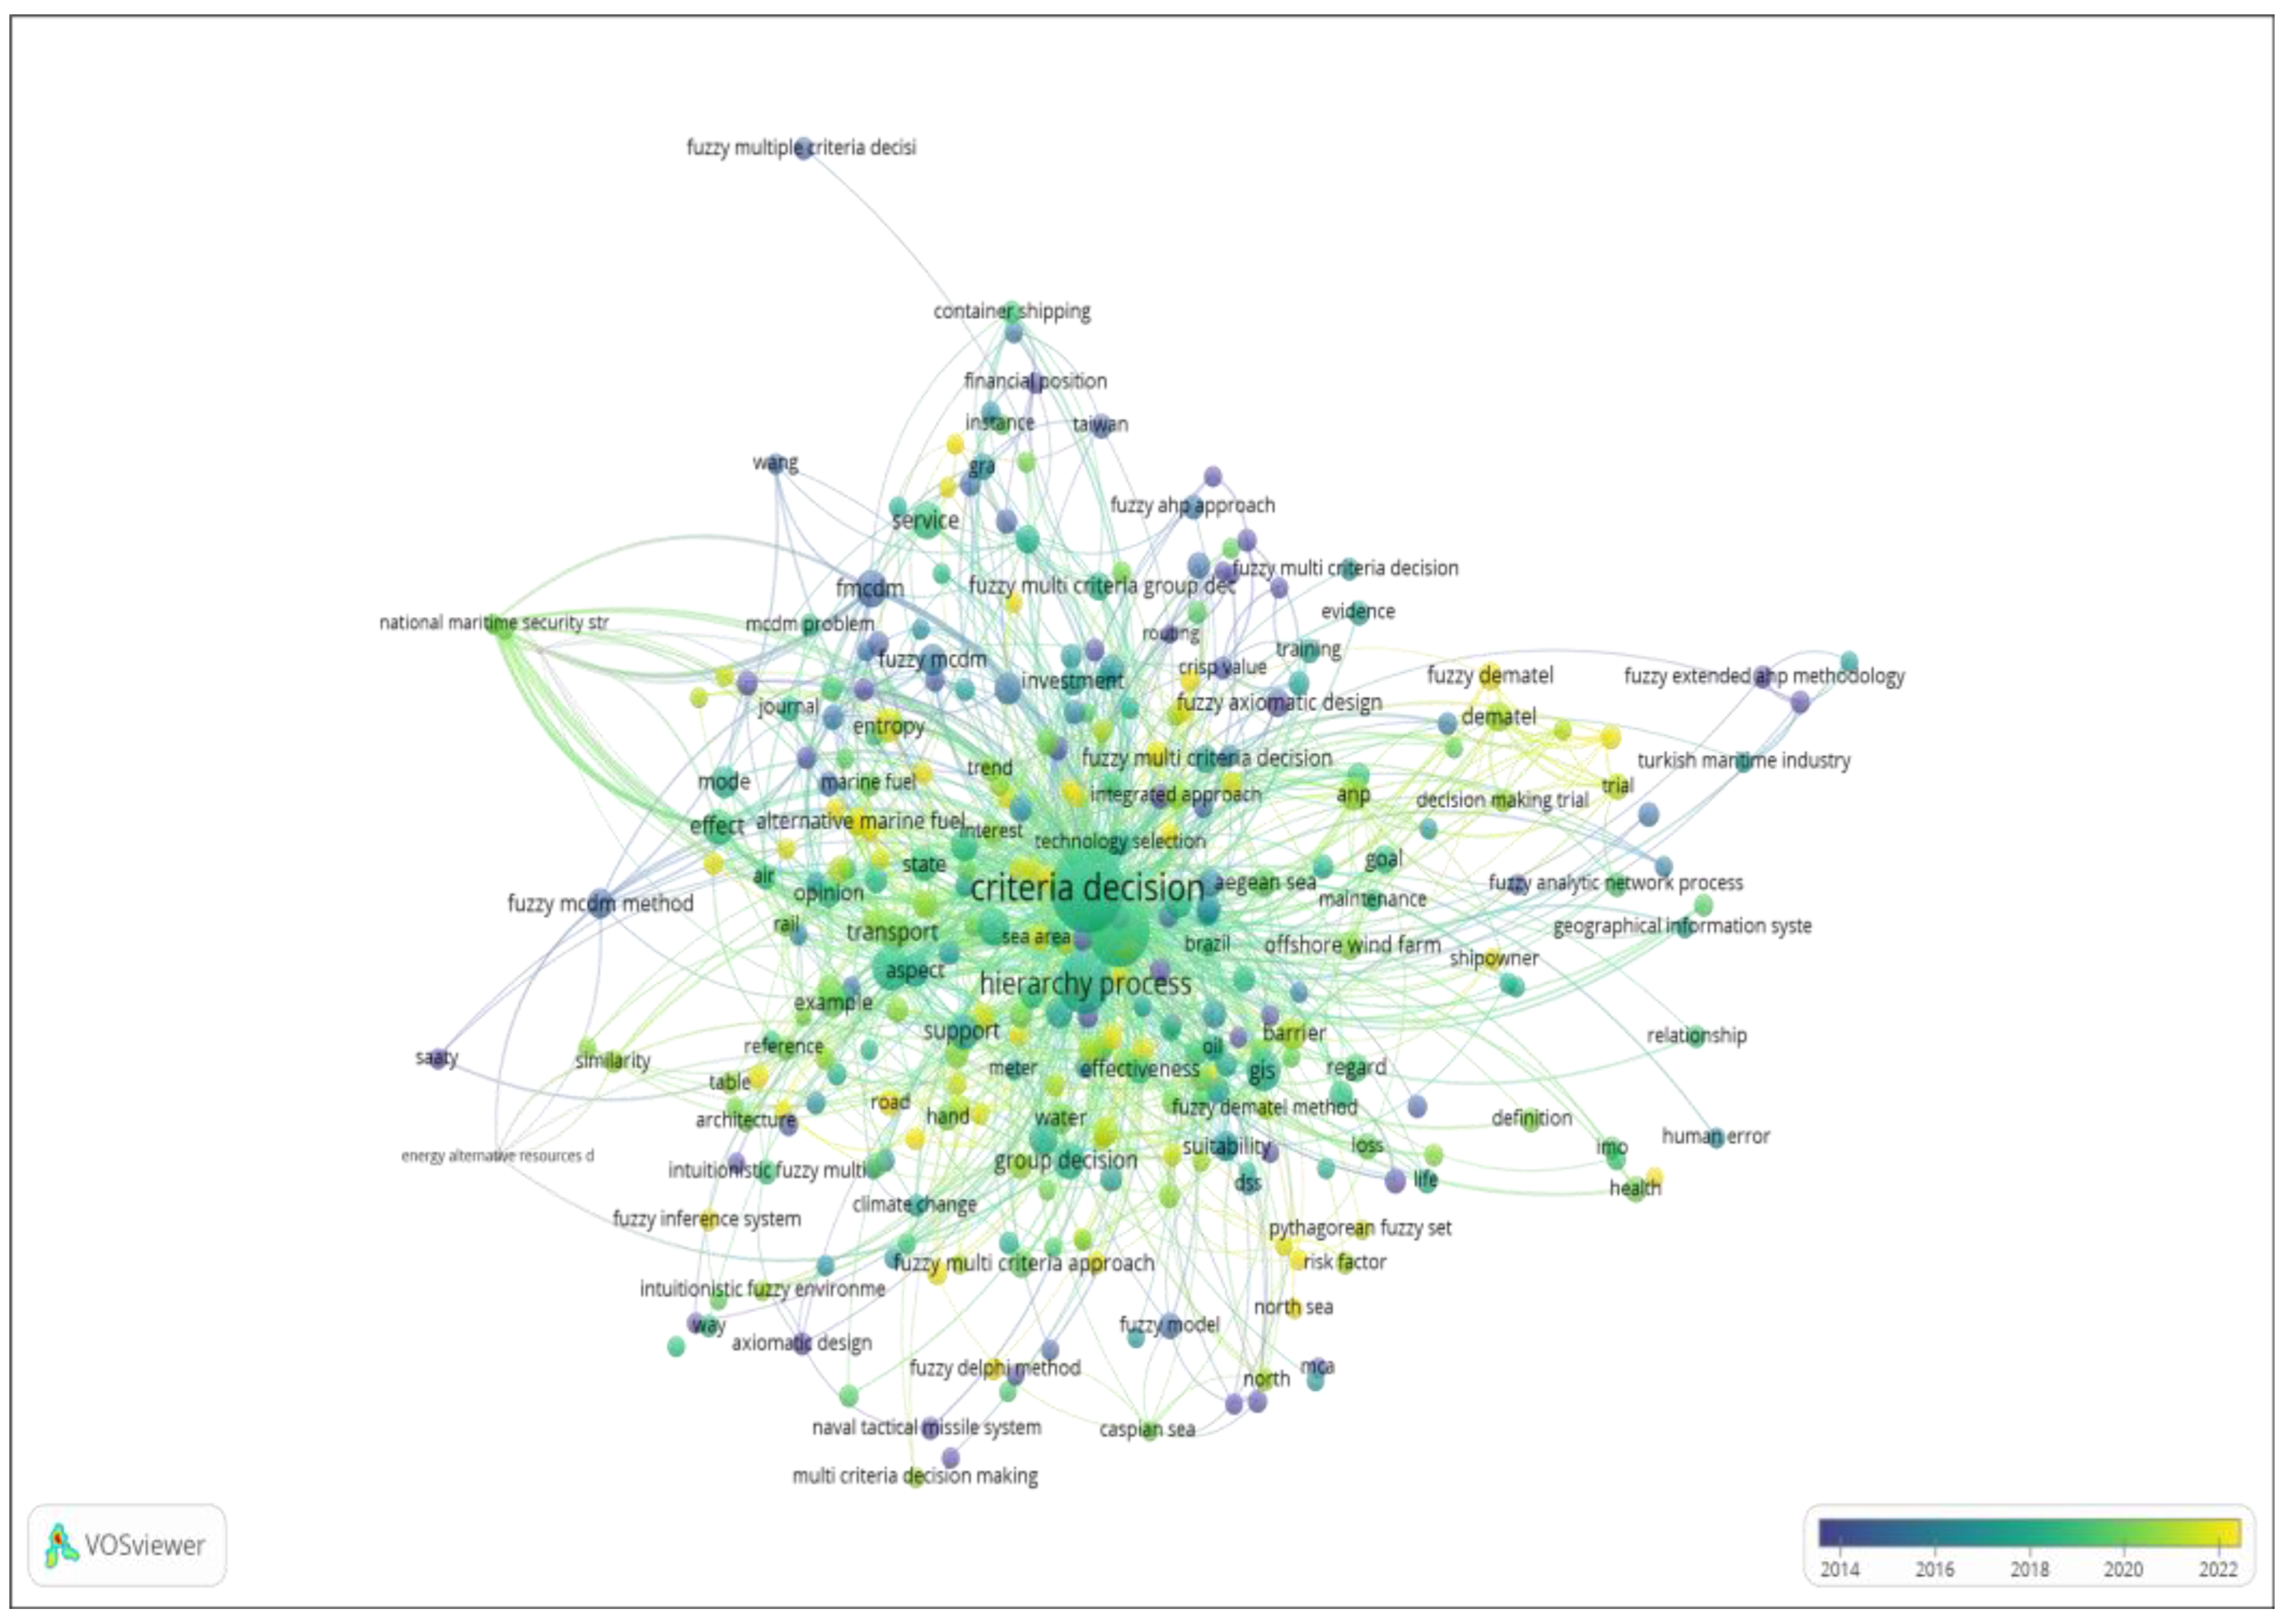
Several studies have documented the application of fuzzy logic in MCDM techniques in addressing issues in the maritime sector. Google Scholar was searched for articles with the keywords fuzzy, multi-criteria decision-making, and maritime. The 980 most relevant articles were selected from 1997 to 2024. The bibliometric analysis of the co-occurrence of keywords in the title and abstract was carried out with the help of VOS Viewer. VOS Viewer produced 326 keywords and divided them into 15 clusters. The overlay visualization in Figure 1 shows the selected data from 2014 to 2024.
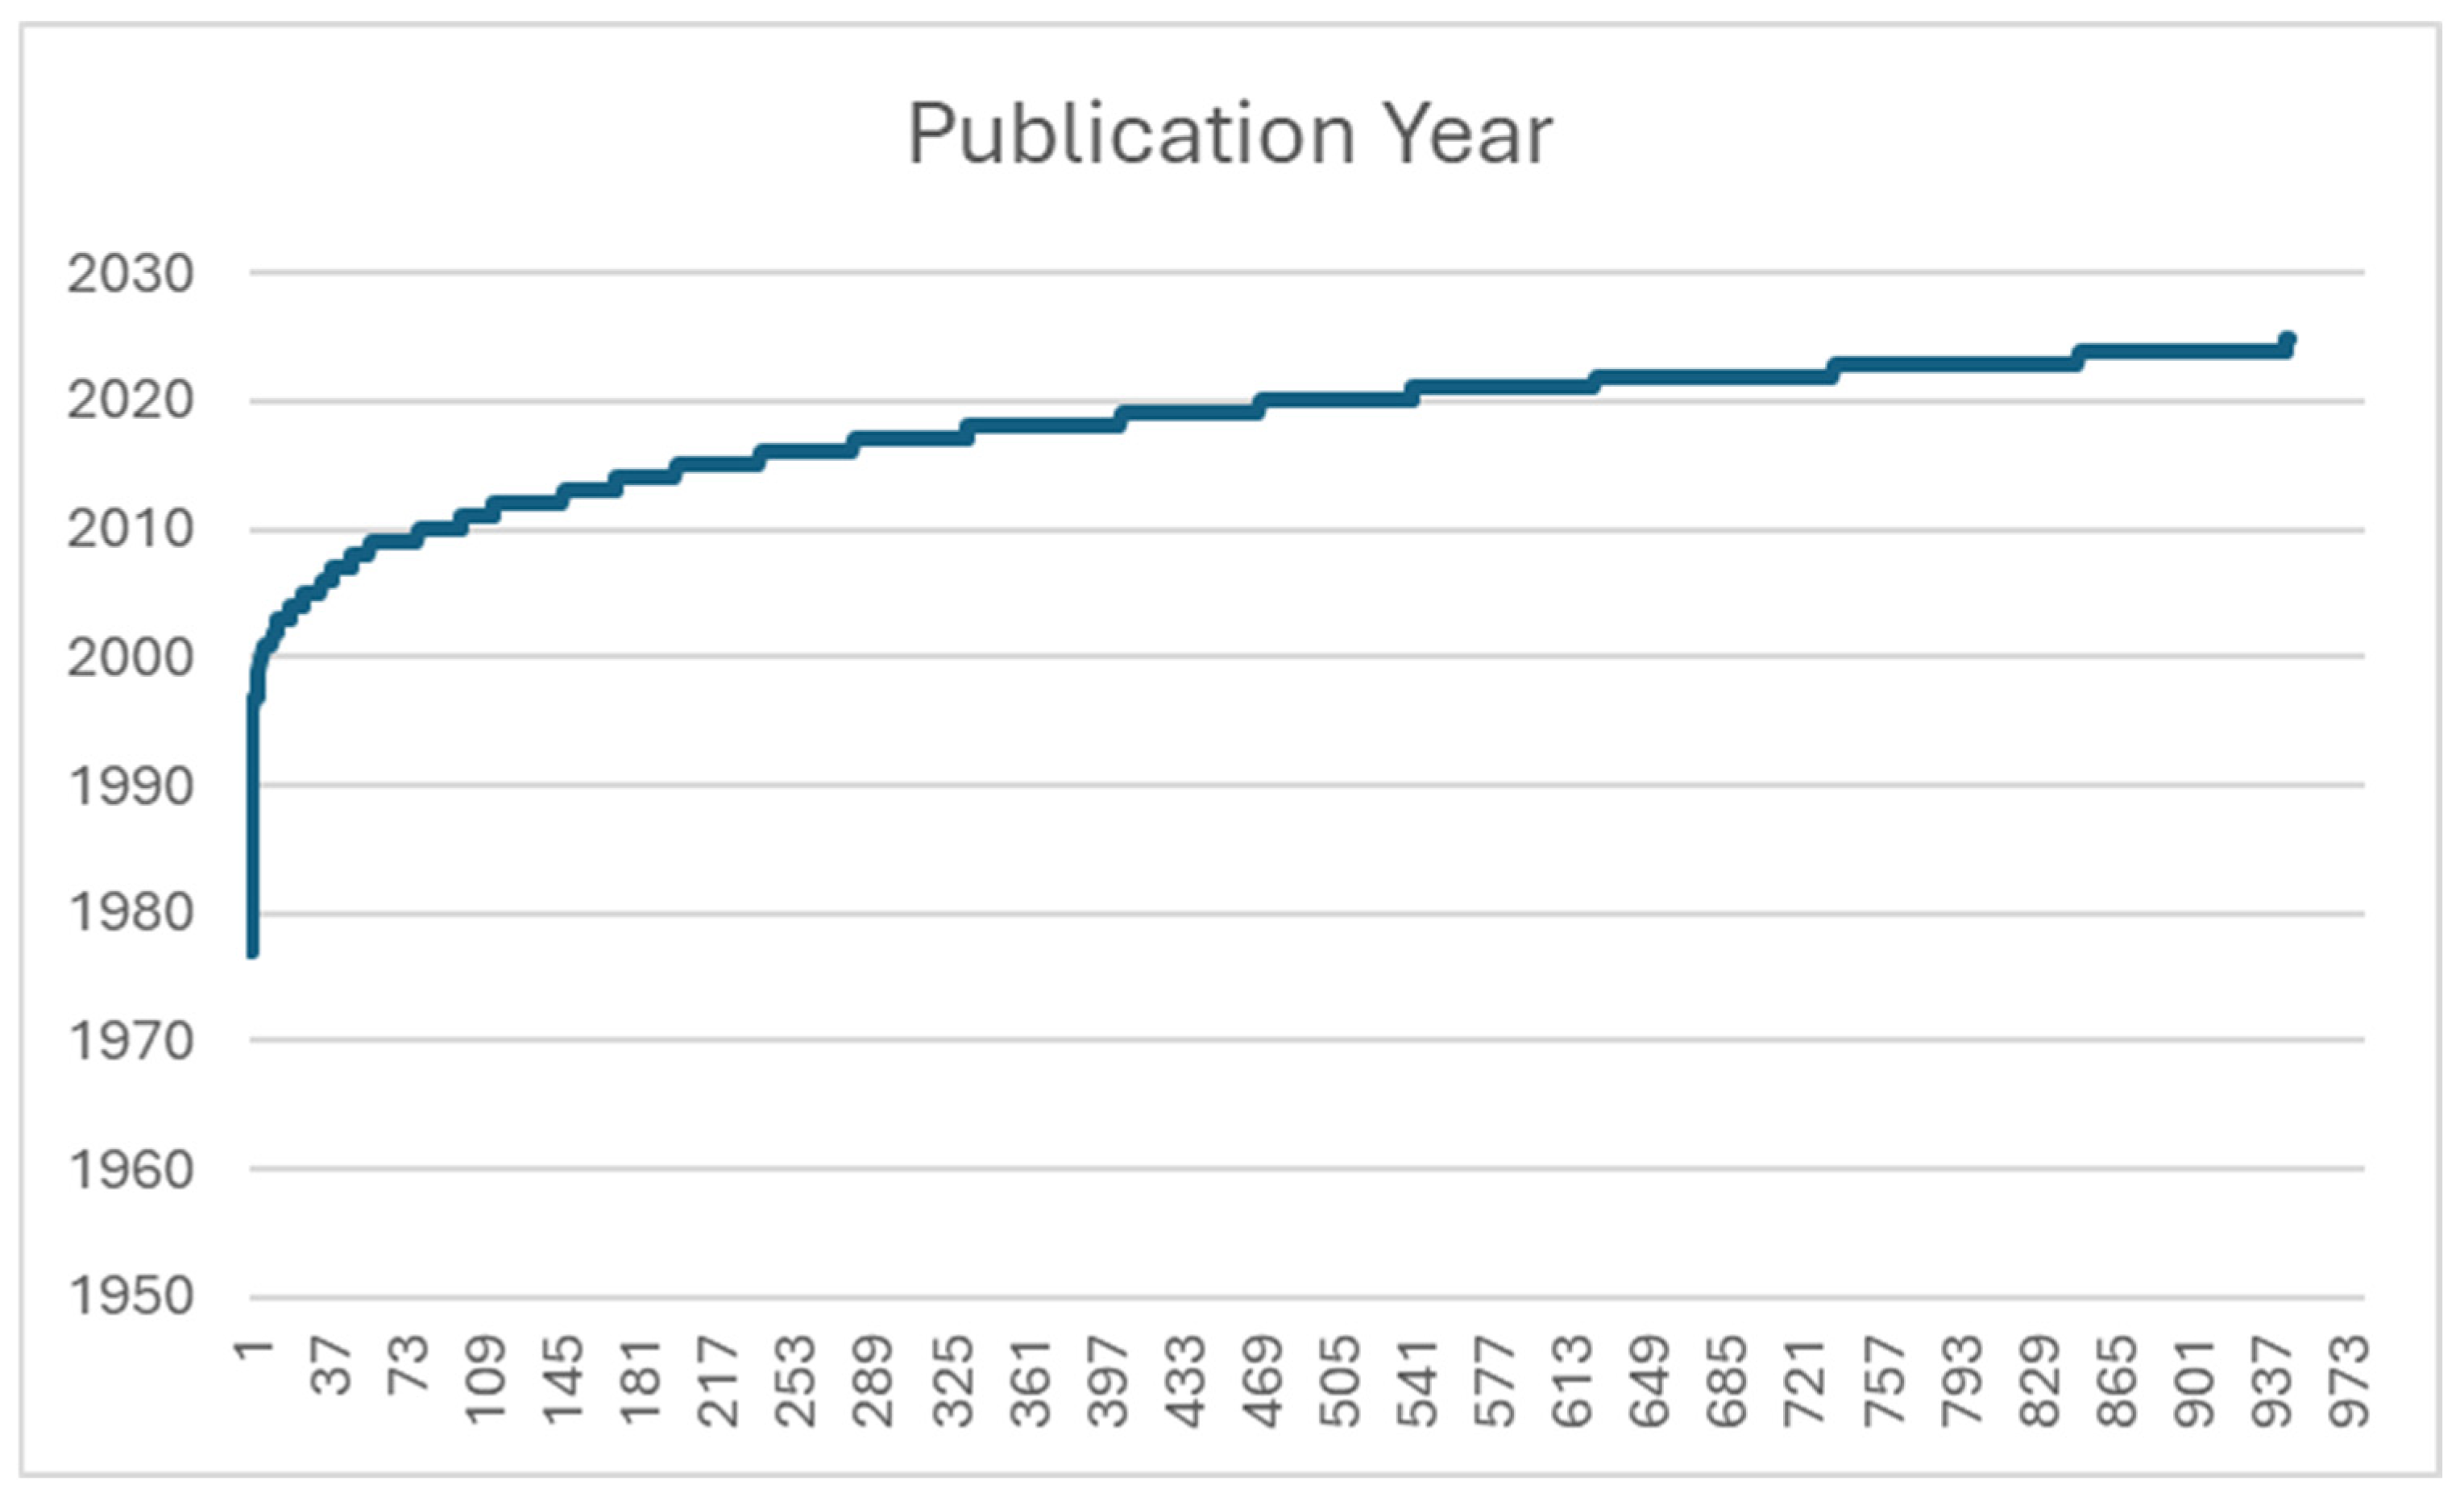
The year-wise no. of publications graph created from these 980 articles can be seen in Figure 2. The graph depicts an increasing interest by researchers in MCDM studies.
Fuzzy logic, which was introduced by Lofti A. Zadeh [2], is an extension of classical logic that deals with reasoning under uncertainty. It allows variables to have degrees of truth ranging between 0 and 1, unlike the traditional binary logic, where variables take values of either 0 or 1 (true or false). It provides a framework for handling uncertain or imprecise information. Fuzzy logic operates on fuzzy sets, which are defined by fuzzy numbers and described using fuzzy linguistic terms. A fuzzy set is characterized by a membership function (MF) that maps each element in a set to a membership degree between 0 and 1, and it describes how likely it is that the element represents the value of the fuzzy number. The relationship between fuzzy linguistic terms (such as “low”, “medium”, and “high”) and fuzzy numbers (mathematically representing these terms) is based on the fuzzy set theory [2] and research practices for modelling uncertainty and vagueness. To represent linguistic terms mathematically, triangular fuzzy numbers (TFNs) and trapezoidal fuzzy numbers (TrFNs) are commonly used due to their simplicity and intuitive interpretations. TFNs are defined by three parameters (a, b, c) representing the lower limit, peak (most likely value), and upper limit, while TrFNs are defined by four parameters (a, b, c, d), creating a trapezoidal shape. For example, a linguistic term like “low” might be modelled as TRN, A = (1, 3, 5), where 1 represents the minimum value considered “low”, 3 represents the most likely (or peak) value, and 5 represents the upper boundary of “low”. This modelling aligns with the principles outlined by Zimmermann [3] and Klir and Yuan [4], which emphasize the flexibility of fuzzy numbers in capturing uncertainty and imprecision.
In the practical determination of fuzzy numbers, the selection of appropriate fuzzy numbers for linguistic terms often depends on expert input and established methodologies, which include expert consensus methods, standard practices and literature, and context-specific adjustments. Expert consensus methods like the Delphi method [5] involve iterative rounds of consultation with experts to converge on a consensus to define fuzzy numbers, thus ensuring that the assigned values reflect collective judgment and domain knowledge. In standard practices and the literature, many decision-making frameworks, such as the fuzzy analytical hierarchy process (fuzzy AHP) [6], use predefined scales. For example, a scale mapping linguistic terms to fuzzy numbers might assign “less important” to (3, 5, 7) (3, 5, 7), (3, 5, 7), reflecting a consensus on its relative weight in a pairwise comparison. Depending on the problem domain, membership functions can be tailored to reflect specific criteria in context-specific adjustments. For instance, in a service quality evaluation [7], fuzzy numbers may be adjusted based on performance metrics and customer feedback.
While theoretical and expert-based methods are widely used, empirical data can be further validated and refined. This involves comparing linguistic assessments with quantitative data to fine-tune membership functions. For instance, if survey responses rate a service as “excellent”, the corresponding numerical scores can be analyzed to adjust the fuzzy number associated with “excellent”.
As mentioned earlier, the mapping of fuzzy linguistic terms to fuzzy numbers is a well-established process grounded in fuzzy set theory and expert judgment. By leveraging both theoretical foundations and practical methods, fuzzy numbers can effectively represent linguistic uncertainty in decision-making models. Empirical validation, where feasible, further enhances the robustness of these mappings. This combination of theory, expert consensus, and data-driven refinement ensures that the fuzzy models accurately capture the nuances of human language and the decision-making process.
Marine ports, as crucial nodes in the global supply chain, facilitate the movement of goods and services across international borders. However, ports face multiple challenges, including infrastructural development, safety, congestion, environmental sustainability, and operational efficiency. A robust decision-making framework, like MCDM, has emerged as a valuable tool in addressing these issues. This literature review explores the application of various MCDM methods in addressing issues in marine ports.
MCDM techniques are decision-support methodologies used to analyze and evaluate multiple conflicting criteria in decision-making scenarios. In the context of marine ports, these techniques are employed to optimize port operations, enhance competitiveness, and improve sustainability. Some traditional MCDM techniques include the Analytical Hierarchy Process (AHP); Technique for Order Preference by Similarity to Ideal Solution (TOPSIS); Step-wise Weight Assessment Ratio Analysis (SWARA); Measurement of Alternatives and Ranking according to Compromise Solution (MARCOS); Combined Compromise Solution (CoCoSo); Best Worst Method (BWM); Preference Ranking Organization Method for Enrichment Evaluation (PROMETHEE); Elimination and Choice Expressing Reality (ELECTRE); VIseKriterijumska Optimizacija I Kompromisno Resenje (VIKOR), Serbian words that mean Multi-criteria Optimization and Compromise Solution; Simple Additive Weighting (SAW); and Decision-Making Trial and Evaluation Laboratory (DEMATEL), amongst others. Some of these traditional techniques have a weakness of not being able to properly handle the uncertainty inherent in decision-making, and thus, modifications to these techniques through hybridization with another technique are made to compensate for this weakness [8], e.g., the AHP-TOPSIS technique. Decision-making involves some imprecision and uncertainty in subjective judgment, and fuzzy logic has been integrated with these traditional techniques by using fuzzy numbers to represent the subjective assessment of decision-makers. This has generated fuzzy logic-based MCDM techniques, such as FAHP, FTOPSIS, and hybrids like FAHP-FTOPSIS techniques [8].
Several studies have documented the use of MCDM techniques in tackling problems/issues and improving decision-making within marine ports. These issues include performance evaluation, sustainability, site selection, port expansion, safety and security, and congestion management, among others.
Görçün [9] used the AHP for optimal container port selection amongst nine ports in Turkey, taking into account criteria such as port location, port safety and security, total operational costs, total storage capacity, total vehicle capacity, sufficient draft, total length of quays, number of liners, and maximum length of ships that can berth in the port. TOPSIS was employed to rank the ports. Port location was seen as the most important selection criterion, as it determines successful logistics operations and easy access by customers. The port of Ambarli was selected because it is the nearest container port to commercial, industrial, and trading centres compared to other alternatives. Also, its safety level is higher than the others. On the other hand, the charges and operational costs are a little high compared to the other decision alternatives. Kurt et al. [10] also applied the AHP to analyze hub/port selection in the Mediterranean Sea. Five main criteria (location, connectivity, port performance, port capacity, and investment opportunities) and sixteen sub-criteria determined from the literature review were compared through a survey by various stakeholders, including port users, ocean carrier operators, and other service providers in the region. The obtained survey results were applied to three pre-determined ports (Piraeus–Greece, Candarli–Turkey, Gioia–Italy), and the AHP model scored Piraeus Port as the best, followed by Candarli Port. Chou [11] proposed a fuzzy multiple criteria decision-making model (FMCDM) in evaluating and selecting the optimal container transshipment hub in Southeast Asia by applying the canonical representation of the multiplication operation on three fuzzy numbers. The port of Kaohsiung, Taiwan, was selected because of its cheaper transshipment costs.
With increasing pressure to reduce environmental impact while maintaining economic viability, sustainability has become a key focus for marine ports. MCDM techniques have been utilized to assess port sustainability initiatives, considering factors such as energy efficiency, emissions reduction, waste management, and social responsibility. Chiu et al. [12] applied AHP to analyze the importance and priority of port factors; then, fuzzy AHP was employed to conduct the assessment of green port operations of five ports in Taiwan. The assessed criteria include environmental quality, use of energy and resources, waste handling, habitat quality and greenery, and social participation. This study ranked the green port performance of the ports, with the port of Taichung ranking first, followed by the port of Keelung in second place, and the port of Kaohsiung in third place. Due to limited resources, it would be difficult for ports to fully implement all greener requirements, and the more feasible action is to choose the more important factors as the priority implementation items. The AHP and FAHP techniques provided a good solution for helping decision-makers in the ports to take appropriate actions. Majidi et al. [13] conducted a sustainability ranking of major Iranian ports using various MCDM methods, including SWARA, MARCOS, CoCoSo, and TOPSIS, taking into consideration the economic, environmental, and social aspects of sustainability. SWARA was used to calculate the weight of the sub-criteria under each aspect, and MARCOS, CoCoSo, and TOPSIS were used to rank the ports. Loading and unloading oil, pier length, and population sub-criteria obtained the highest scores in the economic, environmental, and social aspects of sustainability, respectively, which shows that they had the greatest impact on the sustainability assessment of Iranian ports. MARCOS and CoCoSo techniques had very similar results in all three dimensions of sustainability and were deemed to be suitable methods for evaluating the sustainability of ports. The ports of Astara, Bushehr, and Imam Khomeini were the three top ports, and with the analysis of the results, several managerial insights to make better industry decisions are also revealed.
In the area of port site selection and expansion, MCDM techniques have been applied to help decision-makers weigh multiple criteria and select the most suitable sites. Chowdhury and Haque [14] proposed a framework for identifying the best location for a new dry port in Bangladesh using three multi-criteria decision analysis (MCDA) techniques: FAHP, BWM, and PROMETHEE. The FAHP and BWM were applied to find the weights of the dry port location selection decision criteria. The PROMETHEE was used to rank five potential locations based on the proximity of the dry port to the exporter and importer, accessibility to the high-capacity road network, proximity of the dry port to the seaport, and availability of the rail network. The port of Savar was identified as the best location, followed by the port of Mirsharai. This study will benefit government and private investors in making dry port investment decisions. In a study of dry port selection in China, Brian [15] used the FAHP to determine the weights of criteria that have an impact on the decision-making process, which include transportation, common facilities, cost factor, economic level, trade level, and policy advantage. ELECTRE was applied to rank the alternatives, with Zhengzhou and Xi’an emerging as the top two suitable sites.
In marine ports, processes such as the loading, handling, and unloading of cargo carry many risks. MCDM techniques have been used to evaluate and manage these risks. Şenel et al. [16] carried out a risk analysis of the loading and unloading process in a port in Turkey. The study determined the most important risk factors using a failure mode and effect analysis (FMEA), and fuzzy TOPSIS was used to prioritize and determine the most important risks. The study identified the neglect of technical personnel, lack of loading and unloading equipment maintenance, and improper storage of goods in the ship’s cargo holds as the most important risks. The safety and security of people and goods are critical in ports, and MCDM methods have been used to assess and manage risks, thus allowing port authorities to develop risk mitigation strategies. Khorrama [17] proposed a port risk management model aimed at transferring the conventional safety-oriented functional safety assessment (FSA) to a framework-based approach and utilizes an FAHP-VIKOR combined model in an Iranian port container terminal. This study revealed that the applicability of the conventional FSA method can be improved by applying the ranking method in a fuzzy environment.
One of the persistent challenges affecting the efficiency of global trade is port congestion. Port congestion is also a critical problem that affects seaports’ performance and productivity and efficiency levels. MCDM techniques have been applied to identify the root causes of congestion and evaluate strategies for reducing it. Bolat et al. [18] used AHP to determine the key elements that affect port congestion and identify the most significant factors. According to the results, the most important main factors for port congestion are documentation procedures, port operation and management, ship traffic inputs, port structure and strategy, and government relations, respectively.
In maritime stakeholder relationship management, port performance measurement (PPM) has become an important tool to achieve a sustainable competitive position. Ha et al. [19] proposed a PPM framework using a hybrid DEMATEL and ANP methodology incorporating fuzzy evidential reasoning (FER) by taking the perspectives of different port stakeholders. The framework identified the most crucial port performance indicators (PPIs) for each group of stakeholders, considering the uncertainty and interdependencies among the PPIs. The framework was validated through a case study of four major container ports in South Korea.
In the last decade, inter-port competition has significantly increased, especially in the West Africa region. VanDyke and Ismael [20] used the AHP to evaluate the competitiveness of six ports in the region: Dakar, Abidjan, Tema, Lome, Cotonou, and Lagos. The main criteria considered include cargo volume, port location, port efficiency and performance, port infrastructure, port cost, and political stability. From the study, the port of Abidjan emerged as the most competitive, and the port of Cotonou emerged as the least competitive.
Maritime structures and infrastructures can be assessed, diagnosed, and monitored using the inverse analysis methodology. It involves using measured data, usually from sensors, to infer unknown parameters, such as structural properties, material characteristics, or damage locations, by solving the inverse problem [21]. An inverse problem is the process of determining unknown causes or system parameters by observing their effects or measured responses. An example is the use of vibration data from a breakwater to identify internal voids or damage. Inverse analysis is typically used in the maritime environment for damage detection, e.g., identifying cracks, corrosion, or fatigue in ship hulls, offshore platforms, and pipelines [22,23,24]; structural health monitoring (SHM) using sensor data [25,26]; material property estimation, e.g., estimating unknown properties like stiffness and damping [27]; and residual life assessment by predicting future degradation and remaining service life [28,29].
From the literature reviewed on MCDM, it can be seen that many prior studies on maritime infrastructure maintenance often rely on traditional decision-making models, which typically assume precise data inputs and either focus on single decision-making techniques or do not explicitly integrate uncertainty into their models. However, in real-world maritime operations, maintenance decisions frequently involve subjective, imprecise, and uncertain information due to the complex and dynamic nature of the port environment. This proposed framework addresses these gaps by integrating fuzzy logic into all three methods (fuzzy SWARA, fuzzy TOPSIS, and fuzzy WASPAS), thus enabling decision-makers to account for the vagueness and uncertainty inherent in the maintenance decision criteria. The combination of the three distinct fuzzy MCDM tools within a single framework provides several methodological improvements. The incorporation of fuzzy logic across SWARA, TOPSIS, and WASPAS ensures that the imprecise linguistic assessments provided by maintenance experts (e.g., “very important”) are accurately captured and processed. This enhances the overall robustness and reliability of the results compared to traditional models that require precise numerical inputs. Fuzzy SWARA facilitates a subjective but systematic weighting process, allowing experts to dynamically adjust the relative importance of the criteria. Compared with conventional SWARA, this provides more realistic and context-sensitive weight assignments. Fuzzy TOPSIS evaluates alternatives based on their proximity to an ideal solution. This method ensures balanced decision-making, allowing for both the best- and worst-case scenarios to be accounted for. This is critical in maintenance decisions involving safety and cost trade-offs. Fuzzy WASPAS combines Weighted Product and Weighted Sum Models, offering a hybrid assessment that balances accuracy and simplicity. This dual approach improves ranking stability, especially when the criteria exhibit high variability.
To underscore the advantages of the proposed framework, a comprehensive empirical evaluation across six Nigerian seaports was conducted, leveraging expert input via structured questionnaires. The expert-driven fuzzy evaluation provided insights that would have been difficult to achieve using conventional methods. Specifically, the fuzzy data collection and analysis captured nuanced expert opinions, leading to more accurate prioritization of maintenance areas. The results identified specific gaps in both maintenance practices and cultural aspects, highlighting areas for targeted improvement. Despite the importance of maintenance-critical infrastructure in seaports, to the best of the author’s knowledge, no investigation has been conducted into benchmarking the port’s MCMI using MCDM. This is what this paper intends to address.

3. Methodology

A framework leveraging fuzzy logic and MCDM techniques (SWARA, TOPSIS, WASPAS) was used to evaluate MCMI. This framework considers two primary dimensions: maintenance practice and maintenance culture. These dimensions are further broken down into specific criteria. Fuzzy SWARA was used to determine the weights of the different criteria in the maintenance practice and maintenance culture dimensions. Fuzzy TOPSIS and fuzzy WASPAS are used to rank six ports in Nigeria in terms of maintenance practice and maintenance culture.
Four experienced port infrastructure maintenance experts, all belonging to a common marine engineering community in Nigeria, discussed and reached a consensus on the maintenance practice and culture criteria. There are machinery and equipment that make up the port infrastructure. However, all the experts are involved in the maintenance of port loading and offloading equipment like cranes, which is very critical for smooth port operation. Through questionnaires, the experts expressed their opinions on the various maintenance practices and culture criteria in the six ports, using linguistic terms.

3.1. Fuzzy SWARA (Alternatives Weight Determination)

Fuzzy SWARA is an extension of the traditional SWARA technique used in MCDM that incorporates fuzzy logic to handle vagueness and uncertainty in decision-making. Traditional SWARA uses a deterministic approach to assess the relative importance or weights of the criteria, but fuzzy SWARA accommodates the inherent subjectivity and imprecision involved in human judgment, thus allowing for a more flexible evaluation. SWARA is easy to understand and apply, relying heavily on the opinions of decision-makers who rank criteria step by step, with the weight of each criterion calculated based on its relative importance to others, using ratios between successive criteria. SWARA is especially useful in situations where expert judgment is needed to prioritize criteria.
The advantages of using fuzzy SWARA in MCDM include the fact that the fuzzy logic element deals with the ambiguity and vagueness that accompanies subjective judgments, thus making it more suitable for complex and uncertain environments. Also, fuzzy SWARA allows the decision-maker’s expertise to be directly used in the weighting criteria, thus enhancing the quality of the decision-making process. Fuzzy SWARA has been used in various domains, including logistics [30,31], sustainable construction [32], ranking road sections [33], advancing sustainable urban development [34], sustainable supplier selection [35], and many other fields where decision-making involves imprecision and uncertainty.
The steps in applying the fuzzy SWARA are as follows.

3.1.1. Step 1: Criteria Identification and Sorting

The SMEs identify relevant criteria important to maintenance practice and culture. The criteria are arranged in descending order of their perceived importance by the SMEs. The most important criterion is placed first, followed by the second most important, and so on. The least important criterion is placed at the bottom.

3.1.2. Step 2: Calculation of the Fuzzy Relative Importance (sj)

Starting from the second-ranked criterion, the SMEs use fuzzy linguistics variables (e.g., equally important, less important, etc.) to express the relative importance of each criterion compared to the one ranked just before it. Each linguistic variable is represented by a fuzzy number using the triangular fuzzy scale shown in Table 1. A triangular fuzzy number (TFN) is made up of three parameters: a, b, and c, where a is the smallest likely value, b is the most probable value, and c is the largest possible value of any fuzzy event.

3.1.3. Step 3: Calculation of the Fuzzy Weight Coefficient of Importance (kj)

The fuzzy weight coefficient of importance is then calculated:
k j = s j + 1 ,
where k j denotes criterion j’s fuzzy weight coefficient of importance, and s j denotes criterion j’s relative importance.

3.1.4. Step 4: Calculation of the Criteria Initial Weights (qj)

The initial weight for each criterion is calculated by considering the weight coefficients in a step-wise manner. Starting with the most important criterion (first-ranked), which is assigned a weight of 1, the following formula is used for subsequent criteria:
q j = q j 1 k j
where q j denotes the initial weights for criterion j, q(j−1) is the weight of the previous criterion, and k j is the weight coefficient of the current criterion.

3.1.5. Step 5: Criteria Initial Weight Normalization

The criteria initial weights are then normalized to ensure they add up to 1 by dividing each weight by the sum of the weights. This is performed to enhance its comparable capability [36].

3.1.6. Step 6: Defuzzification and Final Weight Assignment

The fuzzy weights are converted into crisp values using the weighted average method, and the final crisp weights are assigned to each criterion.

3.2. Fuzzy TOPSIS (Alternatives Ranking)

Fuzzy TOPSIS is an extension of the traditional TOPSIS method that incorporates fuzzy set theory and allows for the representation of ambiguous and vague information usually encountered in real-world decision-making problems. TOPSIS is a MCDM technique used in evaluating and ranking alternatives based on how close each of the alternatives is to an imaginary ideal positive and equally how far they are from an imaginary ideal negative solution. The highest ranked and best alternative for the decision-maker is one that is closer to the positive ideal solution and further from the negative ideal solution. Fuzzy TOPSIS deals with the imprecision and uncertainty in decision-making by using fuzzy numbers to represent decision-makers’ subjective assessments.
Fuzzy TOPSIS has been used in various domains, including supply chain [37,38], ship investment [39], human resources [40], sustainability [41], etc.
The fuzzy TOPSIS steps are as follows.

3.2.1. Step 1: SMEs’ Linguistic Evaluation

SMEs evaluate six maritime ports based on the identified maintenance practice criteria and maintenance culture criteria. The evaluations are given using linguistic terms, e.g., low, medium, high, etc., which are converted into fuzzy numbers using the triangular fuzzy scale shown in Table 2.

3.2.2. Step 2: Decision Matrix Construction

The decision matrix is constructed by converting the fuzzy values of the matrix to crisp values using the averaging method.

3.2.3. Step 3: Decision Matrix Normalization

The values in the decision matrix are then normalized using the vector normalization technique for the r j i element of the normalized decision matrix as follows:
r j i = x j i j = 1 N x j 2
where j = 1, 2 …, N; i = 1, 2 …, k; and x j i = alternative j value with respect to attribute i.

3.2.4. Step 4: Weighted Normalized Decision Matrix

The next step is to calculate the weighted normalized fuzzy decision matrix   u j i . The normalized fuzzy numbers obtained in Step 3 are multiplied by the weight values of the criteria from 3.1 Step 6.
u j i = w i r j i

3.2.5. Step 5: Fuzzy Positive-Ideal Solution (FPIS) and Fuzzy Negative-Ideal Solution (FNIS) Determination

FPIS and FNIS are determined to evaluate alternatives against the criteria. FPIS represents the best or optimal value for each criterion. These values are determined to create an imaginary alternative that is “most preferred”. FNIS represents the worst or least desirable value for each criterion. These values are determined to create an imaginary alternative that is “least preferred” possible values for each criterion.
The imaginary ideal solution, i.e., positive ( A + ) and negative ( A ) ideal solution, respectively, are defined as follows:
A + = v 1 + ,   v 2 + ,   ,   v i + , ,   v k +
A = v 1 ,   v 2 ,   ,   v i , ,   v k
where v j +   and   v j   represent positive-ideal and negative-ideal values for each criterion j, respectively. v j + and v j are calculated for each criterion based on whether the criterion is benefit-oriented or cost-oriented.
Positive-Ideal Solution
The benefit criterion (jϵI) is for criteria where higher values are preferable (e.g., efficiency, quality). The positive-ideal solution is the maximum value across all alternatives ( m a x i vij):
v j + = ( m a x i   v i j   | j ϵ I )
where I is set of benefit criteria
The cost criterion (jϵI′) is for criteria where lower values are preferable (e.g., cost, downtime).
The positive-ideal solution is the minimum value across all alternatives ( m i n i vij):
v 1 + = ( m i n i   v i j   | j ϵ I )
where I′ is set of cost criteria
Negative-Ideal Solution
The benefit criterion (jϵI) is for criteria where higher values are preferable. The negative-ideal solution is the minimum value across all alternatives ( m i n i vij):
v j = ( m i n i   v i j   | j ϵ I )
The cost criterion (jϵI′) is for criteria where lower values are preferable. The negative-ideal solution is the maximum value across all alternatives ( m a x i vij):
v 1 + = ( m a x i   v i j   | j ϵ I )

3.2.6. Step 6: Distance Calculation

The distance of each alternative from the ideal positive and negative values determines the final ranking of each alternative. The distance from the positive ideal solution S i + and distance from the negative ideal solution S i   is obtained from the following equation:
S i + = i = 1 K v j i v i + 2
where v j i is the value of the i-th alternative for the j-th criterion.
S i = i = 1 K v j i v i 2
where j = 1, 2, …, n.

3.2.7. Step 7: Closeness Coefficient and Ranking

The overall distance of each alternative Aj from the positive ideal solution is estimated as follows:
c j + = s j s j + + s j
The best ranked alternative has the maximum C j + value. This implies that if C j + is close to 1, the ideal alternative is Aj and non-ideal if it is close to 0.

3.3. Fuzzy WASPAS (Alternatives Ranking)

Fuzzy WASPAS is an extension of WASPAS, a popular MCDM technique. It integrates fuzzy logic into the traditional WASPAS method to handle imprecision and uncertainty in the decision-making process. WASPAS is a hybrid MCDM technique developed from a systematic combination of two widely used methods: the Weighted Sum Model (WSM) and the Weighted Product Model (WPM). The combination of these two models helps in improving the reliability and accuracy of decision-making when dealing with multiple criteria. WASPAS has been applied in solving MCDM problems. For example, Turskis et al. [43] applied the technique to determine critical infrastructure information.
The steps of the fuzzy WASPAS technique are as follows.

3.3.1. Step 1: Decision Matrix Construction

Construct the decision matrix where each row represents an alternative and each column corresponds to a criterion. The performance of the alternatives is represented as the matrix values.

3.3.2. Step 2: Decision Matrix Normalization

The decision matrix is normalized to bring the criteria into a comparable scale [36]. In the WASPAS technique, the approach for decision matrix normalization depends on whether the decision matrix criteria are benefits or non-benefits (costs). For the benefit criteria, normalization is performed by dividing each value by the maximum value of the criterion. For non-benefit (cost) criteria, the normalization is performed by dividing the minimum value by each value of the criterion.
Equations for normalizing benefits and non-benefits (costs) criteria are as follows:
For the benefit criteria,
p i j = x i j m a x x i j
where m a x i is the maximum value, j = 1, 2, …, n; i = 1, 2, … m
For the non-benefit (cost) criteria,
p i j = x i j m i n   x i j
where m i n i is the minimum value, j = 1, 2, …, n; i = 1, 2, …, m.

3.3.3. Step 3: Weighted Sum Model (WSM) Score

The Weighted Sum Model (WSM) score for each alternative is calculated using the weighted sum formula:
s i = j = 1 n p i j w j
where w j is the weight of the j-th criterion, and   p i j is the normalized value of the i-th alternative for the j-th criterion.

3.3.4. Step 4: Weighted Product Model (WPM) Score

The Weighted Product Model (WPM) score for each alternative is calculated using the weighted product formula:
P i = j = 1 n r i j w j
where w j is the weight of the j-th criterion, and r i j   is the normalized value of the i-th alternative for the j-th criterion.

3.3.5. Step 5: Final Score

The WSM and WPM scores are combined to give the WASPAS final score for each alternative using the following equation:
z i = λ s i + 1 λ P i
where z i is the final score for alternative i, and λ is the weight given to the WSM score. This is usually set to 0.5, giving equal importance to both WSM and WPM.
Thus,
z i = 0 5 s i + 0.5 p i

3.3.6. Step 6: Alternatives Ranking

The alternatives are then ranked based on their z I value. The alternative with the highest z i value is considered the best.

3.4. Case Study

In Nigeria, the southern region hosts a cluster of the country’s seaports. Six seaports in this region are used in this paper to evaluate the proposed framework’s applicability (Figure 3). These are the Lagos port complex, the Tincan Island port complex, the Rivers port complex, the Onne port complex, the Delta port complex, and the Calabar port complex. The Nigerian Ports Authority, which is a Federal Government Agency, governs and operates the ports. The ports handle various types of cargo, including dry and wet bulk cargoes, box-containerized cargoes, RORO services, and general cargo. As previously mentioned, four experienced experts with present maintenance working experience in these ports, and who belong to a common marine engineering community, discussed and arrived at a consensus on the criteria for maintenance practice and maintenance culture. Through questionnaires, the experts expressed their opinions on the various maintenance practices and culture criteria in the six ports using linguistic terms.
Table 3 gives brief information about these ports.

4. Results

4.1. SWARA Results

4.1.1. Maintenance Practice

Step 1: Criteria Identification and Sorting
Four SMEs (DM1-DM4) reached a consensus and identified the relevant criteria important to maintenance practice, and sorted them in descending order of importance, as shown in Table 4.
As seen from Table 4, the SMEs placed planning and scheduling as the most important criterion in maritime maintenance practice. The reasons adduced for this are that well-structured planning and scheduling ensure that all necessary maintenance tasks are executed at the correct intervals, thus minimizing the risk of equipment failures, ensuring the functionality and safety of the infrastructure, and maximizing operational uptime. In a maritime environment, poor planning can lead to unplanned downtime with severe safety and financial consequences.
Competent and well-trained personnel are crucial for executing maintenance tasks safely and effectively. This directly impacts the reliability of the infrastructure, and thus, this criterion was ranked second by the SMEs. In a maritime environment, improper handling of critical infrastructure can result in significant operational risks. The skills and competency of personnel determine the maintenance quality, reduce human error, and ensure that maintenance activities are performed correctly. Without qualified personnel, maintenance plans cannot be implemented effectively.
Continuous improvement, which was ranked third, drives the long-term effectiveness of the entire maintenance program. It involves analyzing past maintenance activities, identifying areas for improvement, and implementing more efficient, safer, and cost-effective procedures over time. Continuous improvement helps reduce long-term risks and inefficiencies.
Data are key to making informed decisions about maintenance. This includes gathering baseline data, e.g., equipment specifications, manufacturer recommendations, and historical maintenance records; monitoring key performance indicators (KPIs) that help to identify potential problems before they become critical; and analyzing maintenance data to find areas for optimization, such as adjusting maintenance frequencies or identifying recurring issues. Data collection and analysis, which was ranked fourth, provides valuable insights into the performance of infrastructure, predicts potential failures, helps to optimize maintenance activities, and improves overall operational efficiency. In the maritime context, analyzing data is essential but relies heavily on a foundation of good planning, skilled personnel, and a commitment to continuous improvement.
Documentation and record keeping, which was ranked lower in importance relative to the other criteria, is essential for regulatory compliance, tracking historical maintenance activities, and audits. Good documentation supports all other activities but does not directly impact the effectiveness of maintenance without proper execution of the other maintenance practices.
Step 2: Calculation of the Fuzzy Relative Importance
Starting from the second criterion, the SMEs use linguistics terms (Table 1) to express the relative importance of each criterion compared to the one ranked just before it. For example, the relative importance expression of DM1 is as follows:
The importance of P2 compared to P1 (maintenance personnel training and competency vs. planning and scheduling) is moderately less important (MLI), etc. Expressions of relative importance by all DMs are presented in Table A1. The linguistic terms were then converted to fuzzy numbers using Table 1. The results are presented in Table A2. The fuzzy numbers are then converted to decimal numbers, and the results are presented in Table 5.
The relative importance of each criterion Sj is calculated by finding the average of the three values: smallest likely values, most probable values, and largest possible values.
For example, the relative importance of criterion P2 is calculated as follows:
Smallest likely value = (0.6667 + 0.6667 + 1.0000 + 1.0000)/4 = 0.8334.
Most probable value = (1.0000 + 1.0000 + 1.0000 + 1.0000)/4 = 1.0000.
Largest possible value = 1.5000 + 1.5000 + 1.0000 + 1.0000)/4 = 1.2500.
The results of this exercise are presented in Table 6.
Step 3: Determination of the Criteria Fuzzy Weight Coefficient of Importance, Kj
The fuzzy weight coefficient of importance is calculated using Equation (1).
Kj for criterion P2: 0.8334 + 1, 1.0000 + 1, 1.2500 + 1, and the results are presented in Table 6.
Step 4: Calculation of the Criteria Initial Weights, qj
Since P1 was placed as the most important criterion by the SMEs, it was assigned an initial weight of 1. Equation (2) is then used to calculate the other criteria’s initial weights, as shown in Table A3, and the results are presented in Table 6.
Step 5: Criteria Initial Weight Normalization, wj
The criteria initial weights are normalized by dividing each criterion weight by the sum of all criteria weights, and the results are presented in Table 7.
Step 6: Defuzzification and Final Weight Assignment
The values in Table 7 are defuzzied using the weighted average method, and the final weight is obtained. For example, the final weight for P1 = (0.4467 + 0.5030 + 0.5686)/3 = 0.5061.
The final weights for the other criteria were calculated, and the results are presented in Table 7. The criteria’s final weights are shown graphically in Figure 4.

4.1.2. Maintenance Culture

The same SMEs (DM1-DM4) in 4.1.1 reached a consensus, identified the relevant criteria important to maintenance culture, and sorted them in descending order of importance, as shown in Table 8.
Step 1: Criteria Identification and Sorting
With respect to maintenance culture criteria, the SMEs rated safety and compliance focus as the most important criterion, as shown in Table. In maritime infrastructure, this criterion is paramount due to the inherently hazardous nature of the environment. To avoid accidents, legal penalties, and environmental damage, compliance with both national and international regulations is critical. Thus, safety is a core value that ensures the personnel, equipment, and the environment are protected, making this the highest priority in the maintenance culture.
To minimize the risk of equipment failure and ensure that issues are addressed before they escalate, a proactive and preventive maintenance approach is required. This criterion is rated second after the safety and compliance focus. In the maritime industry, unexpected breakdowns can lead to safety risks and severe financial losses. Thus, this approach is essential for ensuring the longevity and reliability of the maritime infrastructure.
Leadership sets the mode for the entire maintenance culture, and this criterion was ranked third. Strong leadership commitment drives safety, ensures resources are allocated appropriately, and encourages a proactive approach.
Adapting to new technologies, regulations, and best practices requires continuous improvement and learning. While this is important for long-term success, it builds on a foundation of strong leadership, safety focus, and proactive maintenance practices. Though this criterion supports the evolution of the maintenance culture, it ranks lower in the immediate impact compared to others.
Step 2: Calculation of the Fuzzy Relative Importance
The experts’ relative importance expression is shown in Table A4. Following the steps in Section 3.1, the linguistic terms are converted to fuzzy numbers as shown in Table A5, and calculations for Sj, Kj, qj, wj, and the final weights are conducted.
The results are presented in Table 9 and shown graphically in Figure 5.

4.2. Fuzzy TOPSIS Results

4.2.1. Maintenance Practice

Step 1: SMEs’ Linguistic Evaluation
As mentioned earlier, SMEs rate the maintenance practice of the ports using the linguistic terms in Table 2, and the results are presented in Table A6.
Step 2: Decision Matrix Construction
The linguistic terms were converted to fuzzy numbers using Table 2. The results are presented in Table A7. The fuzzy numbers were transformed into crisp values to give the decision matrix, and the results are presented in Table 10, for example, transforming A1/P1 = (0.25 + 0.5 + 0.75)/3 = 0.5.
Step 3: Fuzzy Decision Matrix Normalization
Using Equation (3), the fuzzy decision matrix presented in Table 10 is normalized. The results are presented in Table 11.
Step 4: Weighted Normalization Fuzzy Decision Matrix
Using Equation (4) and the maintenance practice weights from Table 7, the weighted normalization fuzzy decision matrix is calculated and presented in Table 12, for example, A1/P1: 0.18 × 0.5061 = 0.0911.
Step 5: Fuzzy Positive Ideal Solution (FPIS) and Fuzzy Negative Ideal Solution (FNIS) Determination
The imaginary fuzzy positive and negative ideal reference point is determined by taking the largest element of each benefit criterion and the smallest element of each cost criterion, using Equations (5) and (6). Thus, the fuzzy positive ideal reference point (A+) and fuzzy negative ideal reference point (A−) for each criterion are set, and the results are presented in Table 13.
Step 6: Distance Calculation
The distances of each port alternative from the FPIS and FNIS values with respect to each criterion are calculated using Equations (11) and (12). As an example, the distance of alternative A1 to FPIS (D1+) and FNIS (D1), with respect to criterion P1, is calculated as follows:
D1+ = √ (0.0911−0.1417)2 + (0.0449−0.0548)2 + (0.0224−0.0249)2 + (0.0129−0.0144)2 + (0.0136−0.0087)2 = 0.0519.
D1 = √ (0.0911−0.0911)2 + (0.0449−0.0449)2 + (0.0224−0.0186)2 + (0.0129−0.0072)2 + (0.0136−0.0145)2 = 0.0069.
The distances of other alternatives to FPIS and FNIS were determined, and the results are presented in Table 14.
Step 7: Closeness Coefficient and Ranking
Based on the results obtained in Step 6, the closeness coefficient (CC) of each alternative can be calculated using Equation (9). For example, the calculation of the CC value for alternative A1 is as follows:
D1+ = 0.0519 and D1− = 0.0069.
CC1 = 0.0069/(0.0519 + 0.0069) = 0.1173.
The CC values for other alternatives are calculated, and the alternatives are ranked. The results are presented in Table 14.

4.2.2. Maintenance Culture

As mentioned earlier, SMEs rate the maintenance culture of the ports using the linguistic terms in Table 2, and the results presented in Table A8. The linguistic terms were converted to fuzzy numbers using Table 2. The results are presented in Table A9. The fuzzy numbers are transformed into crisp values to give the fuzzy decision matrix, and the results are presented in Table 15.
Following the steps outlined in Section 4.2.1, the D+, D, CC values, and the port rankings are calculated. The results are presented in Table 16.

4.3. Fuzzy WASPAS Results

4.3.1. Maintenance Practice

Step 1: Decision Matrix Fuzzy Numbers
In Table A7, the values are transformed into crisp values, with each row representing an alternative and each column corresponding to a criterion (Table 17).
Step 2: Normalization of Decision Matrix and the Weighted Decision Matrix (WSM and WPM)
As shown in Equations (14) and (15), the beneficial criteria are normalized by dividing each value by the maximum value of the criterion. For example, the maximum value of criterion P1 is 0.92. For the cost criteria, the minimum value is divided by each value of the criterion. For example, the minimum value of P5 is 0.5. The results are presented in Table A10.
The normalized matrix is then weighted.
(a) For WSM
Using Equation (14), the normalized weight matrix for the WSM is calculated. For example, P1/A1: 0.543 × 0.5061 = 0.275. Other criteria were calculated, and the results are presented in Table 18.
(b) For WPM
Using Equation (15), the normalized decision matrix values (Table A10) are raised to the power of each criterion weight.
For example, P1/A1: (0.543)0.5061 = 0.734.
P2/A1: (0.667)0.2493 = 0.904.
P3/AI: (0.667)0.1243 = 0.951.
P4/A1: (0.667)0.0719 = 0.971.
P5/A1: (0.667)0.0484 = 0.981.
The results are presented in Table 19.
Step 3: Calculation of the WSM and WPM Scores for Each Alternative
For WSM (Equation (16)), for example, A1: 0.275 + 0.166 + 0.083 + 0.048 + 0.032 = 0.604. Calculation is performed for other criteria, and the results are presented in Table 20.
For WPM, (Equation (17)), for example, A1: 0.734 × 0.904 × 0.951 × 0.971 × 0.981 = 0.601. Calculation is performed for other criteria, and the results are presented in Table 20.
Step 4: WASPAS Final Score for Each Alternative
Using Equation (19), the final WASPAS score is obtained. For example, for A1, 0.5 (0.604) + 0.5 (0.601) = 0.603. Calculation is performed for other criteria, and the results are presented in Table 20.
Step 5: Alternatives Are Then Ranked Based on the Final WASPAS Scores
The alternative with the highest score is considered the best option. The results of the ranking of the alternatives based on WASPAS, WPM, and WSM are presented in Table 20.

4.3.2. Maintenance Culture

Following the steps enumerated in Section 4.3.1, the maintenance culture decision matrix (Table 15) is normalized and weighted using the WSM and WPM methods. The results are presented in Table 21 and Table 22, respectively.
The WSM and WPM scores for each alternative were then calculated. Alternatives are then ranked based on the final WASPAS scores. The alternative with the highest score is considered the best option. The results of the ranking of the alternatives based on WASPAS, WPM, and WSM are presented in Table 23.
The maintenance practice and culture ratings using the fuzzy TOPSIS and fuzzy WASPAS methods are shown graphically in Figure 6 and Figure 7, respectively.

5. Sensitivity Analysis

A sensitivity analysis was conducted on the criteria weights to assess the impact of changes in these weights on the port rankings. For maintenance practice, the weight of planning and scheduling, a criterion that has the highest weighting (beneficial criterion), and documentation and record keeping, which is the only cost criterion, are increased by 10%. A sensitivity analysis is then conducted for each scenario.
For maintenance culture, where all the criteria are beneficial, the weight of the safety and compliance focus criterion, which is deemed as most important by the SMEs, is increased by 10%, and sensitivity analysis is conducted. The weights were adjusted and normalized to maintain a total sum of 1.0. The rankings are then recalculated using fuzzy TOPSIS and fuzzy WASPAS methods. The results are presented in Table 24 and Table 25, respectively.

6. Discussion

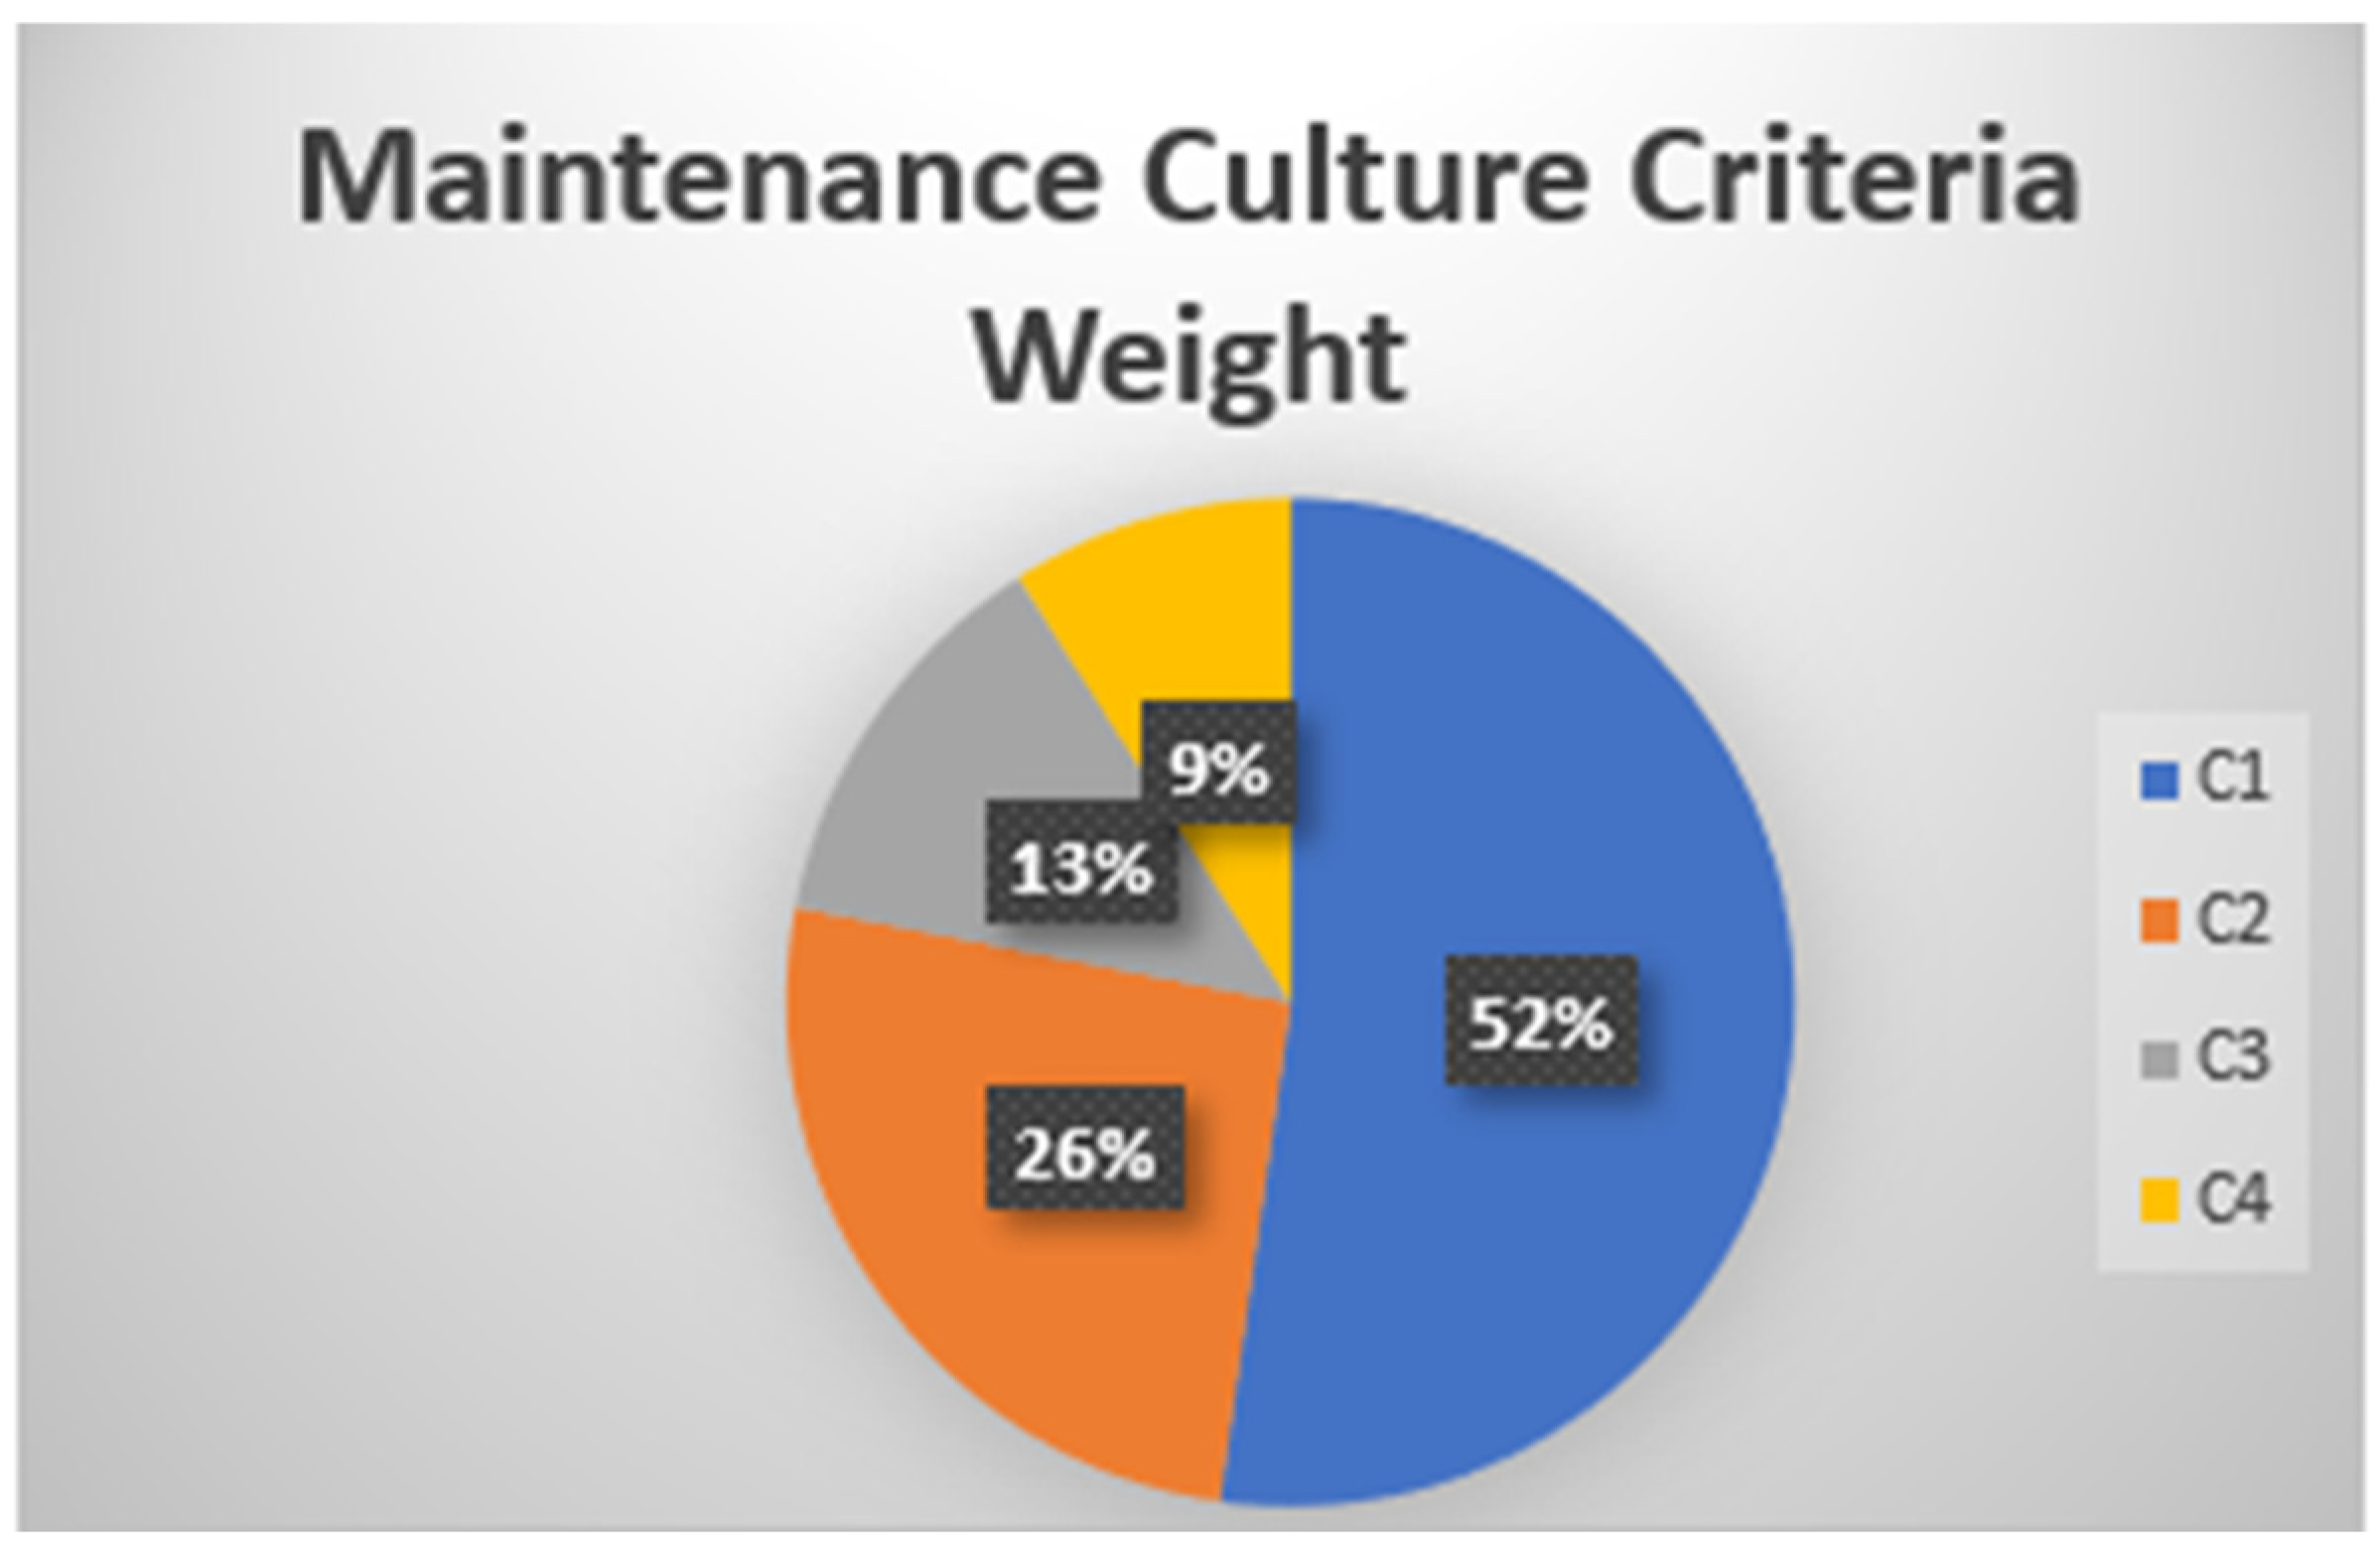
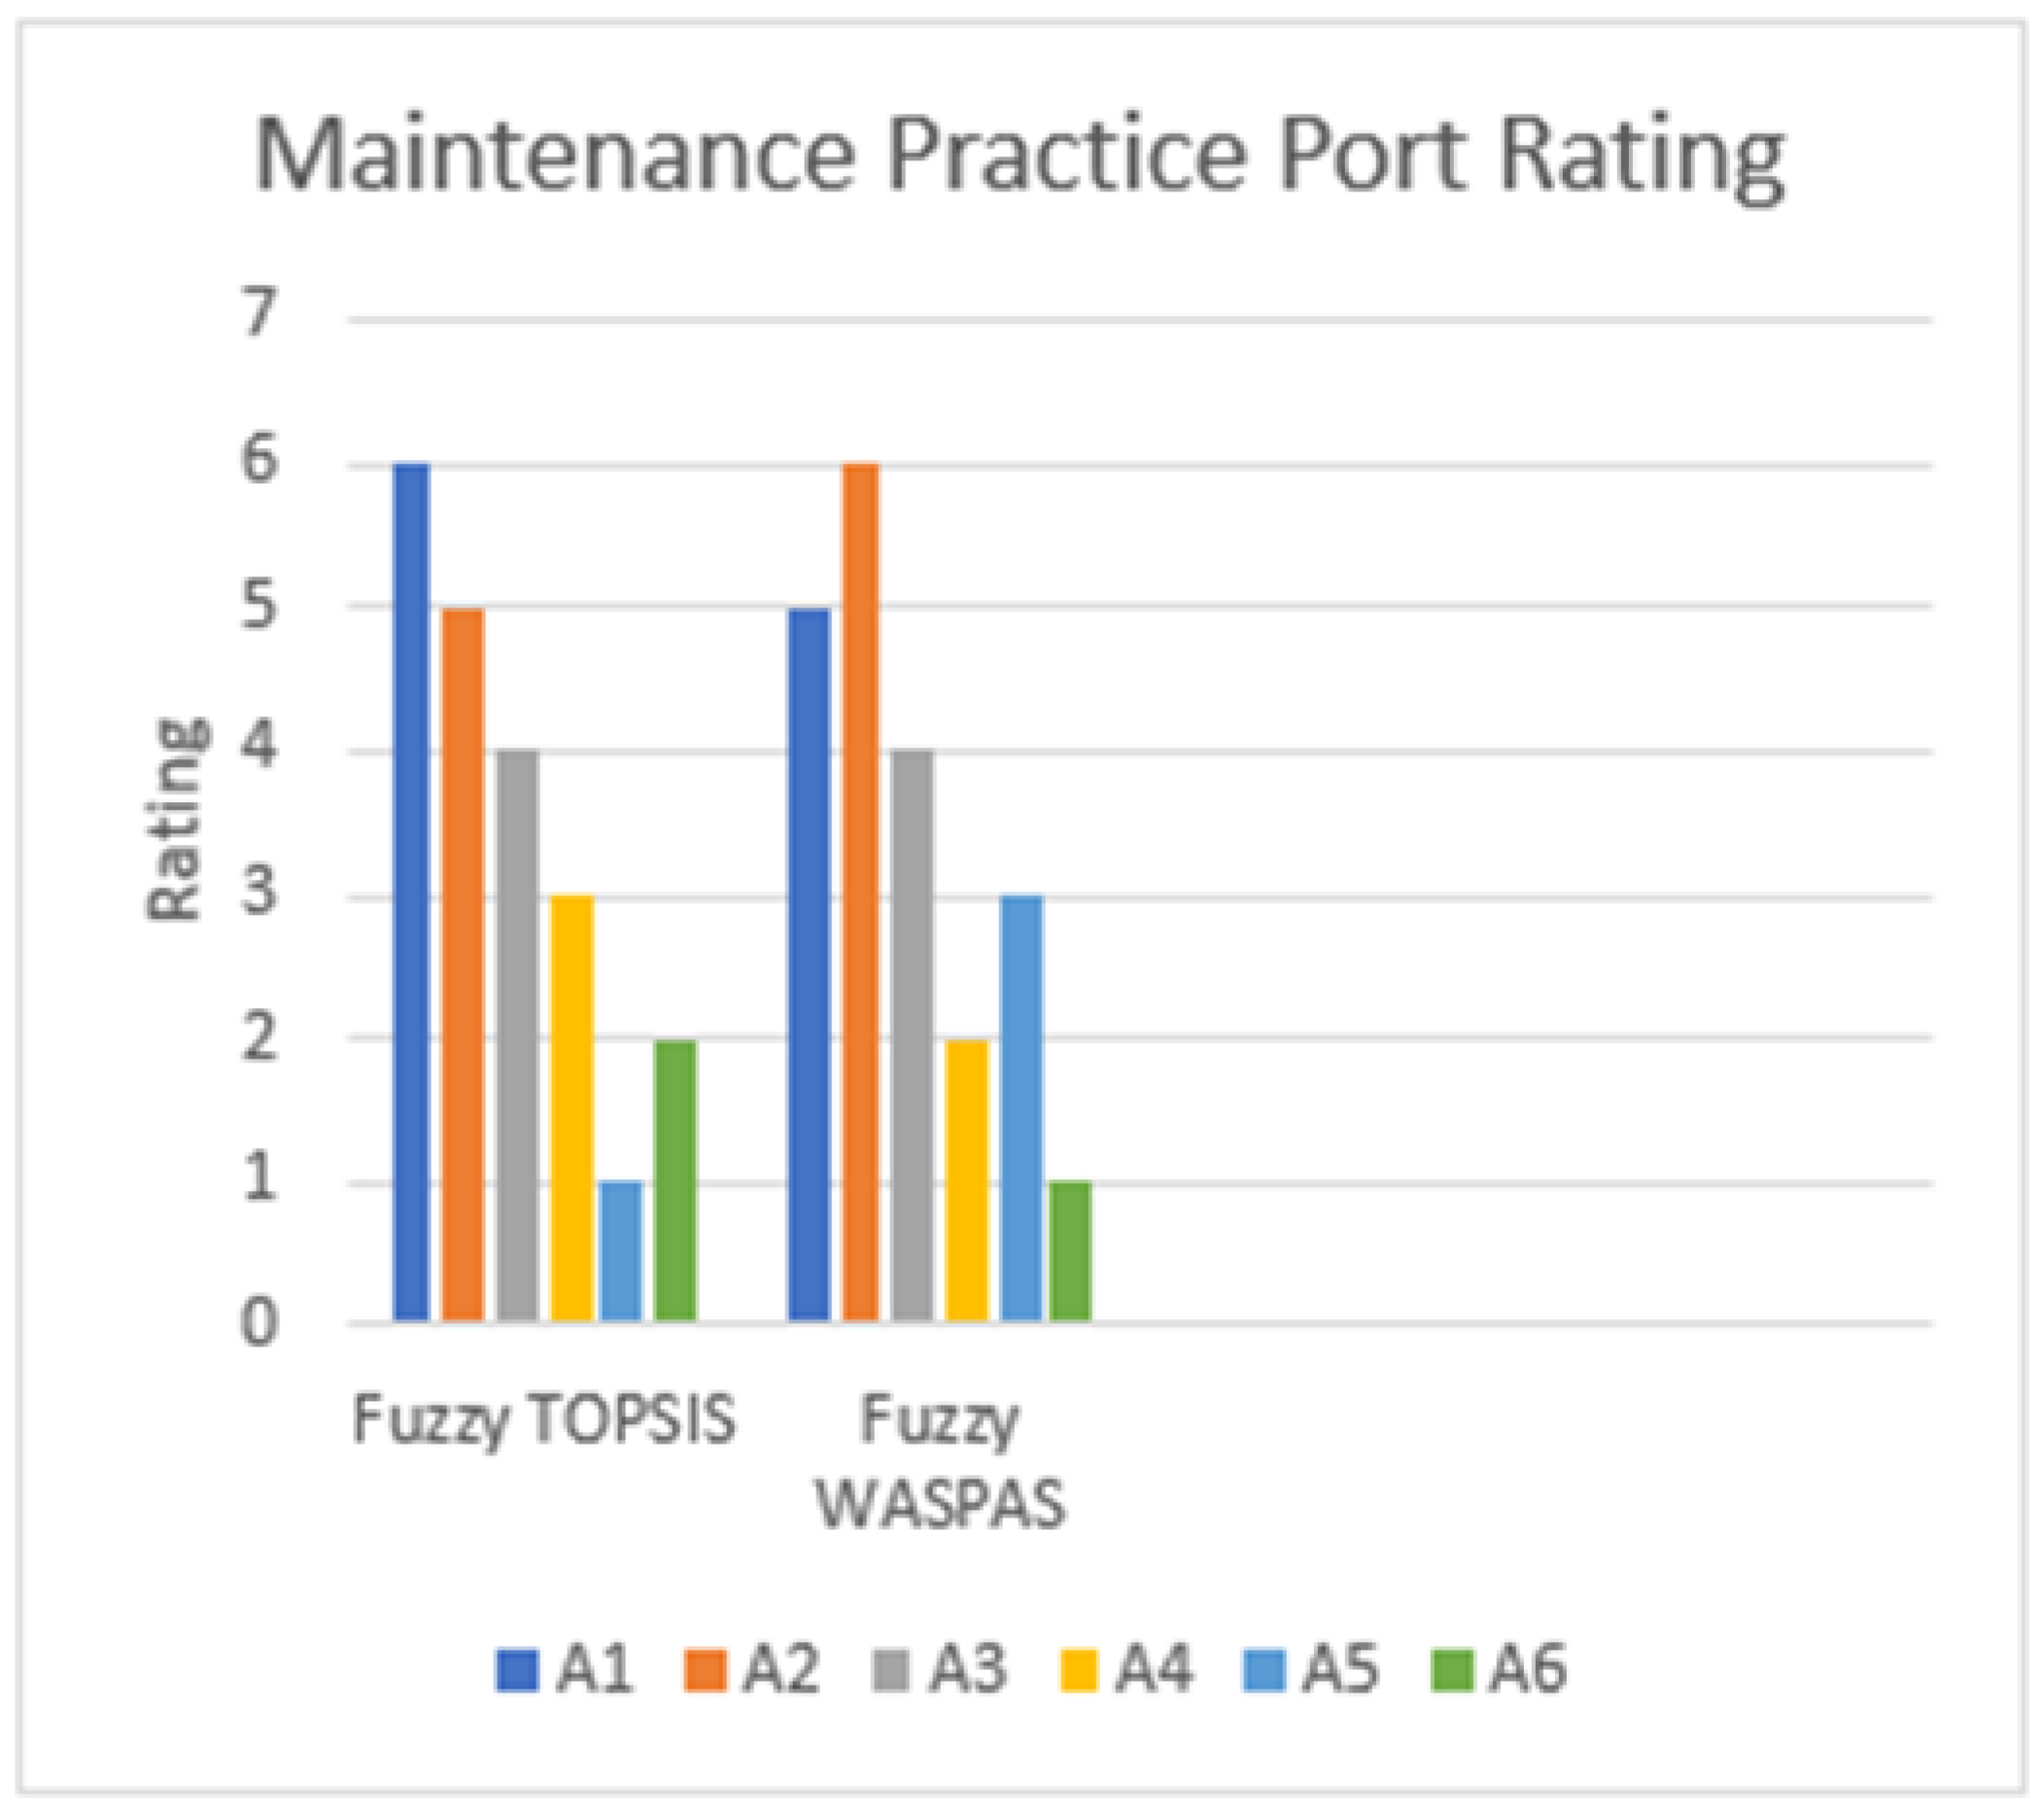
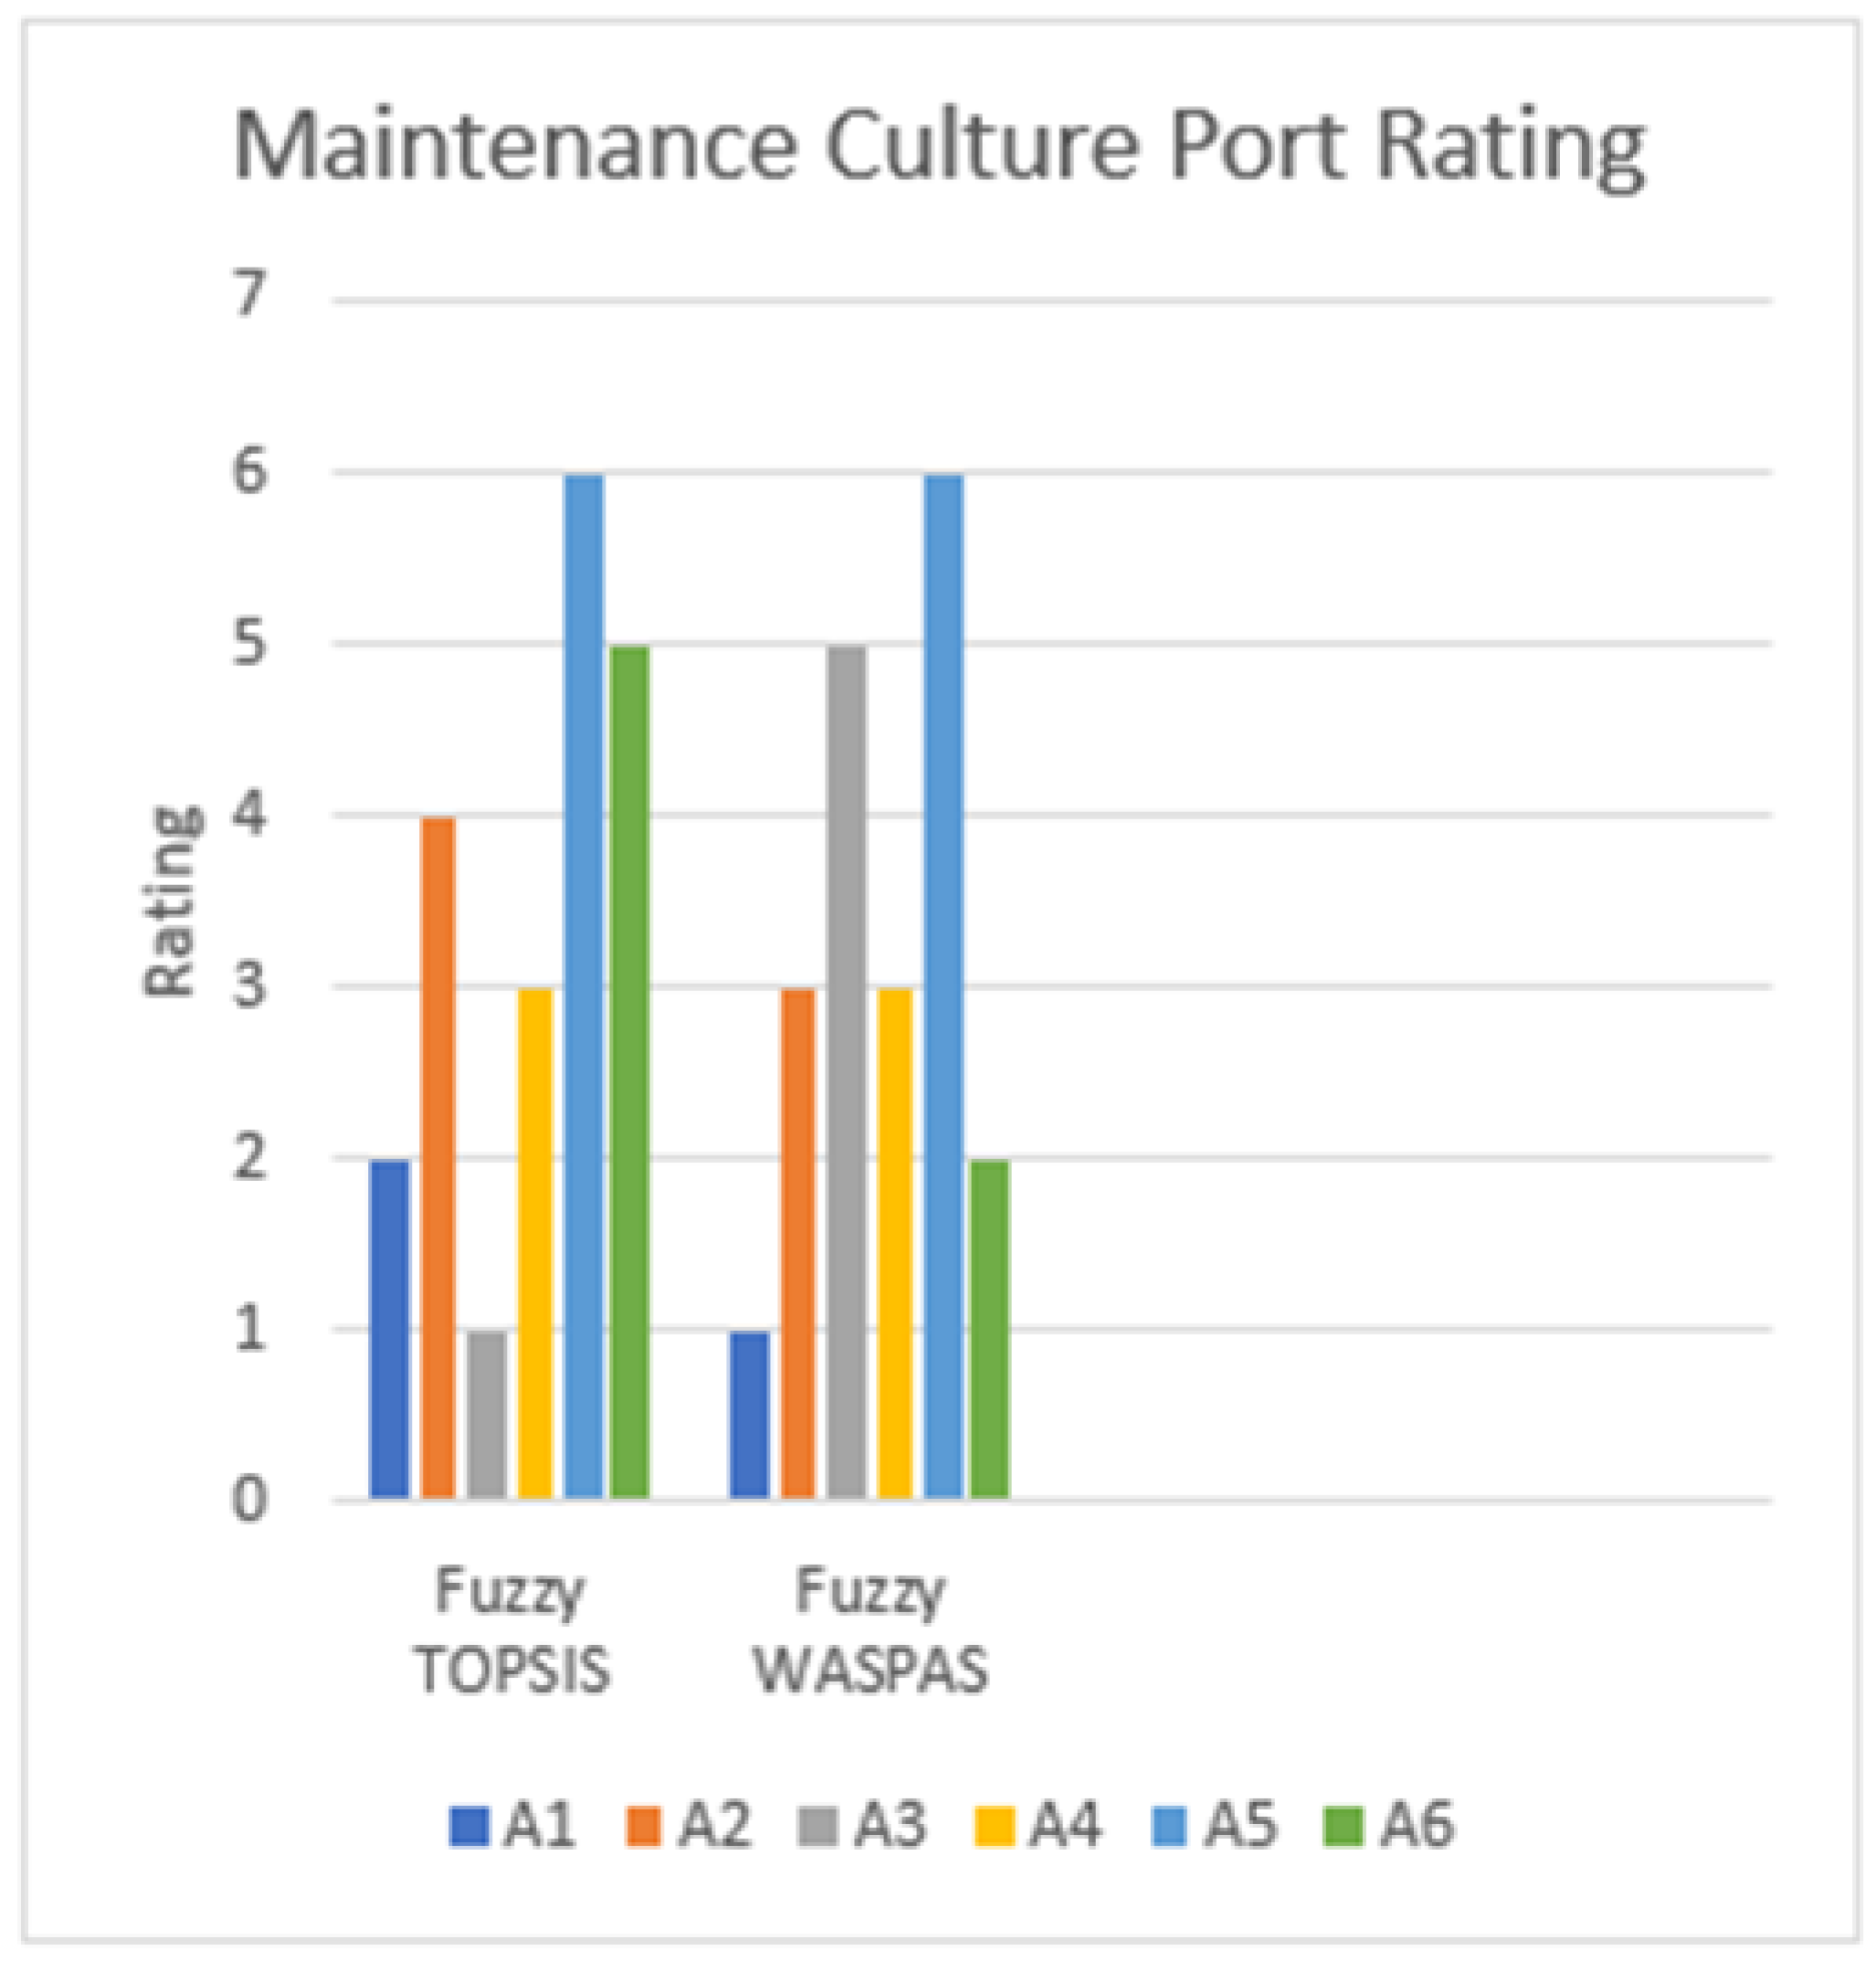
The results of applying fuzzy TOPSIS and fuzzy WASPAS to evaluate maintenance-critical maritime infrastructure highlight the differences in performance across various ports under both the maintenance practice and maintenance culture criteria. For maintenance practice, the rankings are based on criteria such as planning and scheduling, personnel training and competency, continuous improvement, data collection and analysis, and documentation and record keeping. The rankings for maintenance culture are based on safety and compliance focus, proactive and preventive approach, leadership commitment, continuous improvement, and learning.
In the maintenance practice ranking, Port A5 (Onne Port Complex) is ranked first by TOPSIS and third by WASPAS, showing consistently strong performance across both methods. However, it ranks last (6th) in maintenance culture across both TOPSIS and WASPAS methods, indicating potential weakness in proactive safety practices, compliance, and leadership commitment. Its better performance in maintenance practice may reflect operational strength but also a lack of emphasis on cultural aspects.
Port A6 (Lagos Port Complex, Apapa) ranks second with TOPSIS and first with WASPAS in maintenance practice, showing competitive strength, especially in the WASPAS method. In the area of maintenance culture, the port demonstrated varied performance, with strong results in the WASPAS ranking (2nd) but less consistency in TOPSIS (5th). This may suggest potential sensitivity to the evaluation method used, and further investigation into the specific criteria affecting each ranking is needed.
Port A1 (Calabar Port) emerged as a strong performer in the maintenance culture, ranked second by TOPSIS and first by WASPAS. However, it exhibited weaker performance in the maintenance practice, ranked sixth by TOPSIS and fifth by WASPAS. The discrepancy in maintenance practice may indicate sensitivity to the weighting of specific criteria in the two methods. The general result suggests that while the port demonstrated a strong commitment to safety, compliance, and leadership, it may have challenges in operational aspects like planning and scheduling or continuous improvement practices.
Port A4 (Tincan Island Port) ranks relatively high in both maintenance practice and maintenance culture. In the maintenance practice, it is ranked third in TOPSIS and second in WASPAS. In the maintenance culture, it is ranked third in TOPSIS and joint third in WASPAS with Port A2. This suggests good performance across a broad range of maintenance practices and maintenance culture.
In the maintenance culture, Port A3 (Rivers Port Complex, Port Harcourt) has a first-place ranking in TOPSIS but drops to fifth in WASPAS, indicating that it excels in some culture criteria but falls behind in others. It also highlights the sensitivity of the rankings to the specific characteristics of the fuzzy methods applied. In maintenance practice, it is ranked fourth in both TOPSIS and WASPAS, suggesting that improvement is needed in this area.
Port A2 (Delta Port Complex, Warri) performed poorly in the maintenance practice, ranking fifth in TOPSIS and last (6th) in WASPAS. It exhibited a better performance in the maintenance culture, ranking fourth by TOPSIS and joint third with Port A4 in WASPAS. The low rankings in both the maintenance practice and maintenance culture dimensions indicate a need for significant improvements.
The sensitivity analysis revealed the influence of altering criterion weights on the decision outcomes for maintenance practices and culture rankings. For maintenance practices, the weight of P1 (planning and scheduling) was increased by 10%. In the FTOPSIS analysis, the increase marginally benefits the top-ranked port, A5, with an improved closeness coefficient (CC) of 0.8441 from 0.8331. On the contrary, lower-ranked ports such as A1 and A3 experienced a decline in CC from 0.1173 to 0.1089 and 0.2358 to 0.2297, respectively. In the FWASPAS results, the ranking order remains stable, with A6 retaining the top position and A2 the bottom position. However, the weighted scores for A5 and A6 increase slightly, indicating the sensitivity of the method to priority shifts in benefit criteria such as planning and scheduling. Increasing the weight of the cost criterion, P5 (documentation and record keeping), the FTOPSIS analysis results in slightly reduced CC values across all ports except A6 and A5, which remain unaffected. Similarly, in the FWASPAS results, the rankings remain stable, with A6 retaining the top position with minor adjustments in scores reflecting the increased emphasis on cost management.
In conducting the sensitivity analysis for the maintenance culture, the weight of C1 (safety and compliance focus) was increased by 10%. In the FTOPSIS results, increasing the weight significantly alters the rankings for the maintenance culture. A1, with a CC value of 0.5428, moves to the top, displacing A3, which was previously in the top position. The CC values for ports such as A5 and A6 showed noticeable declines. The FWASPAS rankings exhibited higher sensitivity, with A1 having a score of 0.927 and securing the top position. This outcome emphasizes that FWASPAS may be more responsive to changes in the weights of the highly impactful benefit criteria.
The sensitivity analysis demonstrates the robustness of the decision framework, with minor variations in rankings despite changes in weights. However, the results highlight certain characteristics. The FTOPSIS method exhibits a moderate level of stability, especially for top-ranked ports (e.g., A5 and A6 for maintenance practices). However, lower-performing port rankings were more sensitive to weight changes. FWASPAS is slightly more sensitive to weight changes, particularly for benefit criteria such as P1 and C1. The FWASPAS’s relative scoring approach amplifies the impact of changes in weights, especially for closely ranked alternatives.
The differences in rankings between FTOPSIS and FWASPAS highlight the sensitivity of the decision-making process to the chosen methodology, with each method emphasizing different aspects of the criteria. FTOPSIS focuses on the relative closeness to the positive and negative ideal solutions, emphasizing the distance-based trade-offs between the criteria. It is also sensitive to the distribution of scores, particularly for alternatives with intermediate performance. FWASPAS combines weighted sum and product models, which tend to highlight absolute performance differences across alternatives. FWASPAS exhibits higher sensitivity to changes in benefit criteria due to the multiplicative nature of the scoring mechanism. The high degree of variability between FTOPSIS and FWASPAS observed in Ports A5 and A6 may be attributed to different algorithmic approaches for incorporating the weights. This calls for a closer look at the weight distribution of the criteria in each method.
Based on the analysis and observed differences, it is recommended that decision-makers use FTOPSIS when the goal is to evaluate relative performance, especially when distinguishing between high-performing and low-performing alternatives. FTOPSIS is also suitable for scenarios with balanced trade-offs and moderate sensitivity to weight changes. FWASPAS is recommended to be used when prioritizing certain criteria that significantly affect decision outcomes, for example, in cases where decision-makers wish to emphasize planning (P1) or safety (C1).
The practical implications of these results are that when planning (P1) or safety and compliance (C1) are critical, as in high-risk maritime environments, FWASPAS may provide a more nuanced perspective. Conversely, FTOPSIS is a reliable option for general infrastructure evaluation where stability is prioritized. Also, ports with better rankings in both maintenance practice and culture, such as Port A4 and Port A6, may serve as benchmarks for best practices in both operations and safety. In addition, ports with lower scores in maintenance culture, especially Port A5, should consider adopting more proactive approaches to maintenance culture to improve safety, culture, and leadership commitment. Those with lower scores in maintenance practice, especially Ports A1 and A2, should consider more proactive approaches to maintenance practice to improve planning and scheduling, maintenance personnel training and competency, continuous improvement, and data analysis collection and analysis. Decision-makers should regularly conduct sensitivity analyses to understand the robustness of rankings against priority shifts. This ensures transparent and well-informed decision-making.
This proposed framework exhibits high adaptability to other maritime contexts due to its ability to account for uncertain, imprecise, and subjective decision-making conditions. Offshore infrastructures, such as subsea pipelines, offshore wind farms, and oil platforms, operate in dynamic and unpredictable environments where maintenance decisions often involve high degrees of uncertainty. The incorporation of fuzzy logic ensures that the framework can handle the imprecise opinions of experts, making it suitable for evaluating offshore maintenance practices where qualitative factors such as safety compliance, regulatory adherence, and environmental protection are as critical as quantitative performance indicators. The framework can be easily adapted by modifying the criteria to suit the unique requirements of different maritime infrastructure types. For offshore infrastructures that operate under stringent regulatory frameworks, additional criteria such as regulatory compliance, structural integrity, corrosion control, and environmental impact can be incorporated to reflect their unique operational challenges. In shipyard infrastructure maintenance, criteria such as vessel turnaround time, dry dock utilization, and safety audits can be included to enhance the decision-making model. The SWARA weighting method can be used to dynamically adjust the importance of these criteria based on the evolving operational priorities. Fuzzy TOPSIS can be employed where the emphasis is on identifying alternatives that are closest to an ideal safety and performance profile. Fuzzy WASPAS is better suited for contexts where the weighted importance of critical maintenance factors, such as corrosion control in subsea structures, requires a more nuanced evaluation. In the offshore environment, conducting a sensitivity analysis can further ensure that critical decision points remain stable even under changing conditions.

7. Conclusions

In this paper, the application of a novel fuzzy multi-criteria framework that effectively leverages fuzzy logic and multi-criteria decision-making (MCDM) techniques (SWARA, TOPSIS, WASPAS) to evaluate maintenance-critical maritime infrastructure revealed important insights into the performance of different ports in Nigeria in both maintenance practice and maintenance culture. The results offer insights into the relative performance of the ports and highlight the importance of considering both maintenance practices and culture. By addressing the identified areas for improvement, decision-makers can enhance the efficiency and sustainability of the maintenance-critical maritime infrastructure. While both FTOPSIS and FWASPAS offer unique advantages, their complementary application provides a holistic perspective, ensuring robust and adaptable decision-making for critical maritime infrastructure management.
To further enhance the robustness of the decision-making framework and ensure an adaptable and more comprehensive evaluation of maritime infrastructure maintenance, future studies will be required. A deeper comparison of the methodologies (fuzzy TOPSIS and fuzzy WASPAS) could help understand why ports rank differently across the two methods. Also, conducting a sensitivity analysis to explore how changes in the fuzzification parameters influence the final ranking. Future studies can track the performance of the ports over time to assess how changes in maintenance practice or culture affect long-term outcomes, such as safety incidents, operational efficiency, and regulatory compliance. A fuzzy decision-making model incorporating different stakeholders’ perceptions of maintenance practices and culture can be developed. Involving such stakeholders as port authorities, regulatory bodies, and maintenance personnel could provide a more significant understanding of performance. In addition, future research could investigate how digital tools such as the Internet of Things (IoT), predictive maintenance, and data analytics impact maintenance practice and culture, thus providing insight into how digital adoption correlates with port rankings in terms of maintenance effectiveness.

Author Contributions

Conceptualization, methodology, software, formal analysis, investigation, resources, writing—original draft preparation by E.I.; writing—review and editing, supervision by V.S., A.S. and M.S.; review by P.S.; project administration by M.S. and A.S. All authors have read and agreed to the published version of the manuscript.

Funding

This research received no external funding.

Data Availability Statement

The data used to support the findings of this study are included within the article.

Conflicts of Interest

The authors declare no conflicts of interest.

Appendix A

Table A1. Experts’ relative importance expression.
DM1DM2DM3DM4
P2MLIMLIEIEI
P3MLIMLIMLIMLI
P4LIMLILIMLI
P5LILILILI
Table A2. SMEs’ linguistic terms converted to fuzzy numbers (Maintenance Practice).
DM1DM2DM3DM4
P2(2/3, 1, 3/2)(2/3, 1, 3/2)(1, 1, 1)(1, 1, 1)
P3(2/3, 1, 3/2)(2/3, 1, 3/2)(2/3, 1, 3/2)(2/3, 1, 3/2)
P4(2/5, ½, 2/3)(2/3, 1, 3/2)(2/5, ½, 2/3)(2/3, 1, 3/2)
P5(2/5, ½, 2/3)(2/5, ½, 2/3)(2/5, ½, 2/3)(2/5, ½, 2/3)
Table A3. Critical initial weight calculation.
P1qp11.0000, 1.0000, 1.0000
P2qp21.0000/1.8334 = 0.5454, 1.0000/2.0000 = 0.5000, 1.0000/2.2500 = 0.4444
P3qp30.5454/1.6667 = 0.3272, 0.5000/2.0000 = 0.2500, 0.4444/2.5000 = 0.1778
P4qp40.3272/1.5334 = 0.2134, 0.2500/1.7500 = 0.1429, 0.1778/2.0834 = 0.0853
P5qp50.2134/1.4000 = 0.1524, 0.1429/1.5000 = 0.0953, 0.0853/1.6667 = 0.0512
Table A4. Maintenance culture: experts’ relative importance expression.
DM1DM2DM3DM4
C2MLIMLIMLIMLI
C3EIEIEIEI
C4LIVLIVLILI
Table A5. SMEs’ linguistic terms converted to fuzzy numbers (Maintenance Culture).
DM1DM2DM3DM4
C2(2/3, 1, 3/2)(2/3, 1, 3/2)(2/3, 1, 3/2)(2/3, 1, 3/2)
C3(1, 1, 1)(1, 1, 1)(1, 1, 1)(1, 1, 1)
C4(2/5, ½, 2/3)(2/7, 1/3, 2/5)(2/7, 1/3, 2/5)(2/5, ½, 2/3)
Table A6. Experts’ linguistic expressions.
A1A2A3A4A5A6
P1MMMHHVH
P2MMMHMH
P3MMMMMH
P4MLLMMH
P5HHMVHMH
Table A7. Maintenance practice: SMEs’ linguistic terms converted to fuzzy numbers.
A1A2A3A4A5A6
P1(0.25, 0.5, 0.75)(0.25, 0.5, 0.75)(0.25, 0.5, 0.75)(0.5, 0.75, 1.0)(0.5, 0.75, 1.0)(0.75, 1.0, 1.0)
P2(0.25, 0.5, 0.75)(0.25, 0.5, 0.75)(0.25, 0.5, 0.75)(0.5, 0.75, 1.0)(0.25, 0.5, 0.75)(0.5, 0.75, 1.0)
P3(0.25, 0.5, 0.75)(0.25, 0.5, 0.75)(0.25, 0.5, 0.75)(0.25, 0.5, 0.75)(0.25, 0.5, 0.75)(0.5, 0.75, 1.0)
P4(0.25, 0.5, 0.75)(0, 0.25, 0.5)(0, 0.25, 0.5)(0.25, 0.5, 0.75)(0.25, 0.5, 0.75)(0.5, 0.75, 1.0)
P5(0.5, 0.75, 1.0)(0.5, 0.75, 1.0)(0.25, 0.5, 0.75)(0.75, 1.0, 1.0)(0.25, 0.5, 0.75)(0.5, 0.75, 1.0)
Table A8. Maintenance culture experts’ linguistic expressions.
A1A2A3A4A5A6
C1MLLLLL
C2MHHHMH
C3HMMMMH
C4MMLMMM
Table A9. Maintenance culture SMEs’ linguistic terms converted to fuzzy numbers.
A1A2A3A4A5A6
C1(0.25, 0.5, 0.75)(0, 0.25, 0.5)(0, 0.25, 0.5)(0, 0.25, 0.5)(0, 0.25, 0.5)(0, 0.25, 0.5)
C2(0.25, 0.5, 0.75)(0.5, 0.75, 1.0)(0.5, 0.75, 1.0)(0.5, 0.75, 1.0)(0.25, 0.5, 0.75)(0.5, 0.75, 1.0)
C3(0.5, 0.75, 1.0)(0.25, 0.5, 0.75)(0.25, 0.5, 0.75)(0.25, 0.5, 0.75)(0.25, 0.5, 0.75)(0.5, 0.75, 1.0)
C4(0.25, 0.5, 0.75)(0.25, 0.5, 0.75)(0, 0.25, 0.5)(0.25, 0.5, 0.75)(0.25, 0.5, 0.75)(0.25, 0.5, 0.75)
Table A10. Maintenance practice WASPAS normalized decision matrix.
BeneficialCriteria Non-Beneficial/Cost Criteria
P1P2P3P4P5
A10.5430.6670.6670.6670.667
A20.5430.6670.6670.3330.667
A30.5430.6670.6670.6671.000
A40.8151.0000.6670.6670.543
A50.8150.6670.6670.6671.000
A61.0001.0001.0001.0000.667
Weights0.50610.24930.12430.07190.0484

References

  1. Arvis, J.F.; Ojala, L.; Wiederer, C.; Shepard, B.; Raj, A.; Dairabayeva, K.; Kiiski, T. Connecting to Connect 2018: Trade Logistics in the Global Economy; The World Bank: Washington, DC, USA, 2018. [Google Scholar]
  2. Zadeh, L.A. The concept of a linguistic variable and its application to approximate reasoning. Inf. Sci. 1975, 8, 199–249. [Google Scholar]
  3. Zimmermann, H.J. Fuzzy Set Theory and its Application; Springer Science & Business Media: Dordrecht, The Netherlands, 2001. [Google Scholar]
  4. Klir, G.J.; Yuan, B. Fuzzy Sets and Fuzzy Logic: Theory and Applications; Prentice Hall Inc.: Hoboken, NJ, USA, 1995. [Google Scholar]
  5. Hsu, C.C.; Sandford, B.A. The Delphi technique: Making sense of consensus. Pract. Assess. Res. Eval. 2007, 12, 10. [Google Scholar]
  6. Chang, D.Y. Applications of the extent analysis method on fuzzy AHP. Eur. J. Oper. Res. 1996, 95, 649–655. [Google Scholar]
  7. Kahraman, C.; Cebeci, U.; Ruan, D. Multi-attribute comparison of catering service companies using fuzzy AHP: The case of Turkey. Int. J. Prod. Econ. 2004, 7, 171–184. [Google Scholar]
  8. Ibazebo, E.; Savsani, V.; Siddhpura, M.; Siddhpura, A. Advancing Ontario’s Marine Transportation Strategy through Maintenance Optimization: A Multi-Criteria Decision-making Strategy Approach. In Proceedings of the Canadian Society for Mechanical Engineering International Conference, Toronto, ON, Canada, 26–29 May 2024. [Google Scholar]
  9. Görçün, Ö.F. An Integrated AHP-TOPSIS Approach for Terminal Selection Problems in the Logistics Management Perspectives of Marine Container Ports: A Case Study for Turkey’s Container Ports and Terminals. J. Yaşar Univ. 2019, 14, 33–47. [Google Scholar]
  10. Kurt, I.; Boulougouris, E.; Turan, O. An AHP Decision Support Model for the Hub Port Choice of the Shipping Liners on the Mediterranean Region. In Proceedings of the Shipping in Changing Climates conference, Glasgow, Scotland, 24–26 November 2015. [Google Scholar]
  11. Chou, C. A fuzzy MCDM method for solving marine transshipment container port selection problems. Appl. Math. Comput. 2007, 186, 435–444. [Google Scholar]
  12. Chiu, R.H.; Lin, L.H.; Ting, S.C. Evaluation of Green Port Factors and Performance: A Fuzzy AHP Analysis. Math. Probl. Eng. 2014, 2014, 802976. [Google Scholar]
  13. Majidi, A.; Mirzapour, S.M.J.; Hashemkhani, S. Sustainability Ranking of the Iranian Major Ports by Using MCDM Methods. Mathematics 2021, 9, 2451. [Google Scholar] [CrossRef]
  14. Chowdhury, M.M.H.; Haque Munim, Z. Dry port location selection using a fuzzy AHP-BWM-PROMETHEE approach. Marit. Econ. Logist. 2023, 25, 301–329. [Google Scholar]
  15. Brian, K.A. Application of Fuzzy AHP and ELECTRE to China Dry Port Location Selection. Asian J. Shipp. Logist. 2011, 27, 331–354. [Google Scholar]
  16. Şenel, M.; Şenel, B.; Havle, C. Risk Analysis of Ports in Maritime Industry in Turkey using FMEA Based Intuitionistic Fuzzy TOPSIS Approach. ITM Web Conf. 2018, 22, 01018. [Google Scholar] [CrossRef]
  17. Khorrama, S. A novel approach for ports’ container terminals’ risk management based on formal safety assessment: FAHP-entropy measure—VIKOR model. Nat. Hazards 2020, 103, 1671–1707. [Google Scholar] [CrossRef]
  18. Bolat, P.; Kayisoglu, G.; Gunes, E.; Kızılay, F.E.; Ozsogut, S. Weighting Key Factors for Port Congestion by AHP Method. JEMS Marit. Sci. 2020, 8, 252–273. [Google Scholar] [CrossRef]
  19. Ha, M.; Yang, Z.; Notteboom, T.; Ng, A.K.Y.; Heo, M. Revisiting port performance measurement: A hybrid multi-stakeholder framework for the modelling of port performance indicators. Transp. Res. Part E Logist. Transp. Rev. 2017, 103, 1–16. [Google Scholar] [CrossRef]
  20. VanDyke, G.K.; Ismael, H.M. Multi-Criteria Evaluation of Port Competitiveness in West Africa Using Analytic Hierarchy Process (AHP). Am. J. Ind. Bus. Manag. 2015, 5, 432–446. [Google Scholar]
  21. Maier, G.; Buljak, V.; Garbowski, T.; Cocchetti, G.; Novati, G. Mechanical characterization of materials and diagnosis of structures by inverse analyses: Some innovative procedures and applications. Int. J. Comput. Methods 2014, 11, 1343002. [Google Scholar] [CrossRef]
  22. Prendergast, L.J.; Hester, D.; Gavin, K. Development of an inverse analysis technique for monitoring scour around bridge piers using vibration measurements. J. Sound Vib. 2018, 421, 100–120. [Google Scholar]
  23. Yan, G.; Ghosh, S.K. Inverse analysis for damage detection in plate-like structures using measured dynamic response. Eng. Struct. 2010, 32, 166–177. [Google Scholar]
  24. Yuan, Y.; Zhang, W.; Cui, W.C. An inverse analysis technique for assessing fatigue damage in subsea pipelines. Ocean. Eng. 2015, 108, 74–86. [Google Scholar]
  25. Gueguen, P.; Bard, P.Y.; Semblat, J.F. Soil-structure interaction in quay walls using inverse analysis with geotechnical and accelerometric data. J. Geotech. Geoenviron. Eng. 2002, 128, 404–415. [Google Scholar]
  26. Colombo, C.; Al-Hussein, M. A comprehensive review on inverse techniques for structural health monitoring of marine structures. Ocean. Eng. 2020, 211, 107–122. [Google Scholar]
  27. Kim, D.-Y.; Sikora, P.; Araszkiewicz, K.; Chung, S.-Y. Inverse Estimation Method of Material Randomness Using Observation. Crystals 2020, 10, 512. [Google Scholar] [CrossRef]
  28. Zhang, P.; Gao, Z.; Cao, L.; Dong, F.; Zou, Y.; Wang, K.; Zhang, Y.; Sun, P. Marine Systems and Equipment Prognostics and Health Management: A Systematic Review from Health Condition Monitoring to Maintenance Strategy. Machines 2022, 10, 72. [Google Scholar] [CrossRef]
  29. Jinlong, W.; Sibo, G.; Shujie, L.; Xiukun, J.; Zeyu, S. Residual fatigue life prediction for ship propeller based on test signal characteristic fusion and TV-HSMM: An experimental case study. Ocean. Eng. 2024, 295, 116944. [Google Scholar]
  30. Mavi, R.K.; Goh, M.; Zarbakhshnia, N. Sustainable third-party reverse logistic provider selection with fuzzy SWARA and fuzzy MOORA in plastic industry. Int. J. Adv. Manuf. Technol. 2017, 91, 2401–2418. [Google Scholar]
  31. Zarbakhshnia, N.; Soleimani, H.; Ghaderi, H. Sustainable Third-Party Reverse Logistics Provider Evaluation and Selection Using Fuzzy SWARA and Developed Fuzzy COPRAS in the Presence of Risk Criteria. Appl. Soft Comput. 2018, 65, 307–319. [Google Scholar]
  32. Matić, B.; Marinković, M.; Jovanović, S.; Sremac, S.; Stević, Ž. Intelligent Novel IMF D-SWARA—Rough MARCOS Algorithm for Selection Construction Machinery for Sustainable Construction of Road Infrastructure. Buildings 2022, 12, 1059. [Google Scholar] [CrossRef]
  33. Vrtagić, S.; Softić, E.; Subotić, M.; Stević, Ž.; Dordevic, M.; Ponjavic, M. Ranking Road Sections Based on MCDM Model: New Improved Fuzzy SWARA (IMF SWARA). Axioms 2021, 10, 92. [Google Scholar] [CrossRef]
  34. Anjum, M.; Min, H.; Sharma, G.; Ahmed, Z. Advancing Sustainable Urban Development: Navigating Complexity with Spherical Fuzzy Decision Making. Symmetry 2024, 16, 670. [Google Scholar] [CrossRef]
  35. Rani, P.; Mishra, A.R.; Krishankumar, R.; Mardani, A.; Cavallaro, F.; Soundarapandian Ravichandran, K.; Balasubramanian, K. Hesitant Fuzzy SWARA-Complex Proportional Assessment Approach for Sustainable Supplier Selection (HF-SWARA-COPRAS). Symmetry 2020, 12, 1152. [Google Scholar] [CrossRef]
  36. Kaklauskas, A.; Zavadskas, E.K.; Raslanas, S.; Ginevicius, R.; Komka, A.; Malinauskas, P. Selection of low-e windows in retrofit of public buildings by applying multiple criteria method COPRAS: A Lithuanian case. Energy Build. 2006, 38, 454–462. [Google Scholar]
  37. Haddad, A.N.; da Costa, B.B.F.; de Andrade, L.S.; Hammad, A.; Soares, C.A.P. Application of Fuzzy-TOPSIS Method in Supporting Supplier Selection with Focus on HSE Criteria: A Case Study in the Oil and Gas Industry. Infrastructures 2021, 6, 105. [Google Scholar] [CrossRef]
  38. Tafazzoli, M.; Hazrati, A.; Shrestha, K.; Kisi, K. Enhancing Contractor Selection through Fuzzy TOPSIS and Fuzzy SAW Techniques. Buildings 2024, 14, 1861. [Google Scholar] [CrossRef]
  39. Sahin, B.; Yip, T.L.; Tseng, P.-H.; Kabak, M.; Soylu, A. An Application of a Fuzzy TOPSIS Multi-Criteria Decision Analysis Algorithm for Dry Bulk Carrier Selection. Information 2020, 11, 251. [Google Scholar] [CrossRef]
  40. Park, C.J.; Kim, S.Y.; Nguyen, M.V. Fuzzy TOPSIS Application to Rank Determinants of Employee Retention in Construction Companies: South Korean Case. Sustainability 2021, 13, 5787. [Google Scholar] [CrossRef]
  41. Anbarkhan, S.H. A Fuzzy-TOPSIS-Based Approach to Assessing Sustainability in Software Engineering: An Industry 5.0 Perspective. Sustainability 2023, 15, 13844. [Google Scholar] [CrossRef]
  42. Santos, F.; Camargo, H. Fuzzy Systems for Multicriteria Decision Making. CLEI Electron. J. 2010, 13, 10. [Google Scholar]
  43. Turskis, Z.; Goranin, N.; Nurusheva, A.; Boranbayev, S. A Fuzzy WASPAS-Based Approach to Determine Critical Information Infrastructures of EU Sustainable Development. Sustainability 2019, 11, 424. [Google Scholar] [CrossRef]
  44. Google. Available online: https://www.google.com/maps/search/maritime-ports-in-nigeria (accessed on 31 October 2024).
  45. Nigerian Ports Authority—Ports Locations. Logistics Cluster 2024.Nigerian Ports Authority. Available online: https://nigerianports.gov.ng/ports (accessed on 31 October 2024).
  46. Nigerian Ports Assessment. Logistics Cluster 2024. Logistics Cluster. Nigeria Port Assessment. Available online: https://lca.logcluster.org/21-nigeria-port-assessment (accessed on 31 October 2024).
Figure 1. Literature bibliometric analysis overlay.
Infrastructures 10 00089 g001
Figure 2. Year-wise number of publications.
Infrastructures 10 00089 g002
Figure 3. Map of Southern Nigeria showing major seaports (study area) [44].
Infrastructures 10 00089 g003
Figure 4. Maintenance practice criteria weight.
Infrastructures 10 00089 g004
Figure 5. Maintenance culture criteria weight.
Infrastructures 10 00089 g005
Figure 6. Maintenance practice port rating.
Infrastructures 10 00089 g006
Figure 7. Maintenance culture port rating.
Infrastructures 10 00089 g007
Table 1. The triangular fuzzy scale [6].
Linguistic TermFuzzy Scale
Equally important (EI)(1, 1, 1)
Moderately less important (MLI)(2/3, 1, 3/2)
Less important (LI)(2/5, 1/2, 2/3)
Very less important (VLI)(2/7, 1/3, 2/5)
Much less important (MLI)(2/9, 1/4, 2/7)
Table 2. Fuzzy triangular scale for seaport rating [42].
Linguistic TermTFN
Very Low (VL)(0, 0, 0.25)
Low (L)(0, 0.25, 0.5)
Medium (M)(0.25, 0.5, 0.75)
High (H)(0.5, 0.75, 1.0)
Very High (VH)(0.75, 1.0, 1.0)
Table 3. Selected Nigerian seaports [45,46].
IDPortDescription
A1Calabar PortThe port has multiple multi-purpose terminals available with necessary facilities (handling equipment, space, storage, etc.) available. Facilities handle containerized cargo, general cargo, including oilfield (refined petroleum bitumen) and project cargo, bulk grain handling, agricultural produce, bagged cement, and fish. It has jurisdiction over crude oil terminals in the axis. The port has various cargo handling equipment, including mobile cranes, transtainers, and grain elevators with bagging machines.
A2Delta Port Complex, WarriThe port handles grain and bulk cargo. It is equipped with various mobile cranes.
A3Rivers Port Complex, Port HarcourtThis port is a multi-purpose facility and is strategically located in one of the world’s largest crude oil production regions, the Niger delta. It is equipped with various tanks of bulk oil installation. It plays the “Mother-Port” role to several jetties surrounding her as “satellites” through the provision of pilotage and towage services, catering to the various markets relating to dry, liquid, and general cargo trades. It is equipped with various mobile cranes.
A4Tincan Island Port ComplexThis is the second busiest port after Apapa Port. The port handles diversified cargoes with five terminal operators specializing in different forms of cargo (dry and wet bulk cargoes, box-containerized cargoes, RORO services). The port handles vessels ranging from 100 to 260 m. It is well-equipped with modern cargo handling equipment such as dockside cranes, gantries, mobile cranes, RORO tugmasters, grain elevators with bagging machines, and transtainers.
A5Onne Port ComplexThis is the first port of its kind in Nigeria that operates the Landlord Port Model devised to encourage private participation in the port industry. It is one of the largest oil- and gas-free zones in the world, supporting exploration and production for Nigerian activities. It robustly serves both onshore and offshore activities while providing efficient access to oil fields in West Africa and the Sub-Saharan region. The port is highly industrialized, with modern facilities and equipment that can stand the test of time. It has one of the biggest harbour mobile cranes in Africa (Liebherr 600) with a lifting capacity of 208 metric tons and twin cranes that have the capacity of lifting a single heavy cargo of 300 tons.
A6Lagos Port Complex, ApapaThe Lagos Port Complex, also referred to as Apapa Quays, is the oldest and largest Port in Nigeria. It is situated in Apapa, Lagos State, the commercial centre of Nigeria. The port handles general cargo, bulk cargo, and container cargo. It has five (5) private terminals and eight (8) jetties. It is well equipped with modern cargo handling equipment such as dockside cranes, gantries, mobile cranes, RORO tugmasters, grain elevators with bagging machines, and transtainers. Sugar, salt, and flour are produced in factories belonging to operators within the port. It boasts of a four-wheel gate of about 8 metres for oversized cargoes, and this has given the port an edge over others in the handling of oversized cargoes.
Table 4. Maintenance practice criteria.
P1Planning and SchedulingMost important
P2Maintenance Personnel Training and Competency
P3Continuous Improvement
P4Data Collection and Analysis
P5Documentation and Record KeepingLeast important
Table 5. Conversion of fuzzy numbers to decimal numbers.
DM1DM2DM3DM4
P2(0.6667, 1.0000, 1.5000)(0.6667, 1.0000, 1.5000)(1.0000, 1.0000, 1.0000)(1.0000, 1.0000, 1.0000)
P3(0.6667, 1.0000, 1.5000)(0.6667, 1.0000, 1.5000)(0.6667, 1.0000, 1.5000)(0.6667, 1.0000, 1.5000)
P4(0.4000, 0.5000, 0.6667)0.6667, 1.0000, 1.5000)(0.4000, 0.5000, 0.6667)(0.6667, 1.0000, 1.5000)
P50.4000, 0.5000, 0.6667)0.4000, 0.5000, 0.6667)0.4000, 0.5000, 0.6667)0.4000, 0.5000, 0.6667)
Table 6. Maintenance practice criteria SWARA.
SjKjqjwj
P1 1.0000 1.0000 1.00000.4467 0.5030 0.5686
P20.8334 1.0000 1.25001.8334 2.0000 2.25000.5454 0.5000 0.44440.2437 0.2515 0.2527
P30.6667 1.0000 1.50001.6667 2.0000 2.50000.3272 0.2500 0.17780.1462 0.1257 0.1011
P40.5334 0.7500 1.08341.5334 1.7500 2.08340.2134 0.1429 0.08530.0953 0.0719 0.0485
P50.4000 0.5000 0.66671.4000 1.5000 1.6667 0.1524 0.0953 0.05120.0681 0.0479 0.0291
Table 7. Criteria initial weight normalization and final weight.
Final Weight
P10.4467, 0.5030, 0.56860.5061
P20.2437, 0.2515, 0.25270.2493
P30.1462, 0.1257, 0.10110.1243
P40.0953, 0.0719, 0.04850.0719
P50.0681, 0.0479, 0.02910.0484
Table 8. Maintenance culture criteria.
C1Safety and Compliance FocusMost important
C2Proactive and Preventive Approach
C3Leadership Commitment
C4Continuous ImprovementLeast important
Table 9. Maintenance culture criteria SWARA.
SjKjqjwjFinal Weight
C1 1.0000 1.0000 1.00000.4709 0.5191 0.57790.5226
C20.6667 1.0000 1.50001.6667 2.0000 2.50000.6000 0.5000 0.40000.2826 0.2595 0.23120.2578
C31.0000 1.0000 1.00002.0000 2.0000 2.00000.3000 0.2500 0.20000.1413 0.1298 0.11560.1289
C40.3429 0.4167 0.53341.3429 1.4167 1.53340.2234 0.1765 0.13040.1052 0.0916 0.07540.0907
Table 10. Fuzzy decision matrix.
A1A2A3A4A5A6
P10.50.50.50.750.750.92
P20.50.50.50.750.50.75
P30.50.50.50.50.50.75
P40.50.250.50.50.50.75
P50.750.750.50.920.50.75
Table 11. Normalized decision matrix.
A1A2A3A4A5A6
P10.180.200.200.220.280.24
P20.180.200.200.220.180.19
P30.180.200.200.150.180.19
P40.180.100.200.150.180.19
P50.280.300.200.260.180.19
Table 12. Weighted normalized fuzzy decision matrix.
A1A2A3A4A5A6
P10.09110.10120.10120.11130.14170.1215
P20.04490.04990.04990.05480.04490.0474
P30.02240.02490.02490.01860.02240.0236
P40.01290.00720.01440.01080.01290.0137
P50.01360.01450.00970.01260.00870.0092
Table 13. FPIS and FNIS values.
CategoryFPISFNIS
P1Benefit0.14170.0911
P2Benefit0.05480.0449
P3Benefit0.02490.0186
P4Benefit0.01440.0072
P5Cost0.00870.0145
Table 14. Maintenance practice fuzzy TOPSIS analysis summary.
PortD+DCC ValuesRanking
A1Calabar Port0.05190.00690.11736
A2Delta Port Complex, Warri0.04180.01290.23585
A3Rivers Port Complex, Port Harcourt0.04080.01550.27534
A4Tincan Island Port Complex0.03150.02290.42103
A5Onne Port Complex0.01030.05140.83311
A6Lagos Port Complex0.02160.03200.59702
Table 15. Maintenance culture fuzzy decision matrix.
A1A2A3A4A5A6
C10.50.250.250.250.250.25
C20.50.750.750.750.50.75
C30.750.50.50.50.50.75
C40.50.50.250.50.50.5
Table 16. Maintenance culture fuzzy TOPSIS analysis summary.
PortD+DCC ValuesRanking
A1Calabar Port0.00290.00340.53972
A2Delta Port Complex, Warri0.05480.04240.43624
A3Rivers Port Complex, Port Harcourt0.04360.05570.56091
A4Tincan Island Port Complex0.05480.04360.44313
A5Onne Port Complex0.05920.02450.29276
A6Lagos Port Complex0.06390.03010.32025
Table 17. Fuzzy decision matrix.
BeneficialCriteria Non-Beneficial/Cost Criteria
P1P2P3P4P5
A10.50.50.50.50.75
A20.50.50.50.250.75
A30.50.50.50.50.5
A40.750.750.50.50.92
A50.750.50.50.50.5
A60.920.750.750.750.75
Weights0.50610.24930.12430.07190.0484
Table 18. WSM normalized weight decision matrix.
BeneficialCriteria Non-Beneficial/Cost Criteria
P1P2P3P4P5
A10.2750.1660.0830.0480.032
A20.2750.1660.0830.0240.032
A30.2750.1660.0830.0480.048
A40.4120.2490.0830.0480.026
A50.4120.1660.0830.0480.048
A60.5060.2490.12430.0720.032
Table 19. WPM normalized weight decision matrix.
BeneficialCriteria Non-Beneficial/Cost Criteria
P1P2P3P4P5
A10.7340.9040.9510.9710.981
A20.7340.9040.9510.9240.981
A30.7340.9040.9510.9711.000
A40.9021.0000.9510.9710.971
A50.9020.9040.9510.9711.000
A61.0001.0001.0001.0000.981
Table 20. Maintenance practice WASPAS analysis summary.
WSM ScoreWPM ScoreWASPAS ScoreWASPAS RankingWPM RankingWSM Ranking
A10.6040.6010.603555
A20.5800.5710.576666
A30.6200.6130.617444
A40.8180.8090.814222
A50.7570.7530.755333
A60.9830.9810.982111
Table 21. Maintenance culture WSM normalized weight decision matrix.
BeneficialCriteria
MCC1MCC2MCC3MCC4
A10.5230.1720.1290.091
A20.2610.2580.0860.091
A30.2610.2580.0860.045
A40.2610.2580.0860.091
A50.2610.1720.0860.091
A60.2610.2580.1290.091
Table 22. Maintenance culture WPM normalized weight decision matrix.
BeneficialCriteria
MCC1MCC2MCC3MCC4
A11.00.9011.01.0
A20.6961.00.9491.0
A30.6961.00.9490.939
A40.6961.00.9491.0
A50.6960.9010.9491.0
A60.6961.01.01.0
Table 23. Maintenance culture WASPAS analysis summary.
WSM ScoreWPM ScoreWASPAS ScoreWASPAS RankingWPM RankingWSM Ranking
A10.9150.9010.908111
A20.6960.6610.679333
A30.6500.6200.635555
A40.6960.6610.679333
A50.6100.5950.603666
A60.7390.6960.718222
Table 24. Maintenance practice sensitivity analysis summary.
ScenarioPortTOPSIS CC ValueTOPSIS RankingWASPAS ScoreWASPAS Ranking
Original weightsA10.117360.6035
A20.235850.5766
A30.275340.6174
A40.421030.8142
A50.833110.7553
A60.597020.9821
P1 + 10%A10.108960.6015
A20.229750.5756
A30.266340.6144
A40.418430.8142
A50.844110.7583
A60.595720.9831
P5 + 10%A10.117960.6035
A20.233550.5776
A30.264540.6194
A40.421230.8132
A50.832510.7573
A60.597420.9811
Table 25. Maintenance culture sensitivity analysis summary.
ScenarioPortTOPSIS CC ValueTOPSIS RankingWASPAS ScoreWASPAS Ranking
Original weightsA10.539720.9081
A20.436240.6793
A30.560910.6355
A40.443130.6793
A50.292760.6036
A60.320250.7182
C1 + 10%A10.542810.9271
A20.415730.7443
A30.541420.7105
A40.415730.7443
A50.289860.6776
A60.313350.7782
Disclaimer/Publisher’s Note: The statements, opinions and data contained in all publications are solely those of the individual author(s) and contributor(s) and not of MDPI and/or the editor(s). MDPI and/or the editor(s) disclaim responsibility for any injury to people or property resulting from any ideas, methods, instructions or products referred to in the content.

