4.1. Models for Predicting Vehicle Trips Generated by Shopping Center During Peak Periods
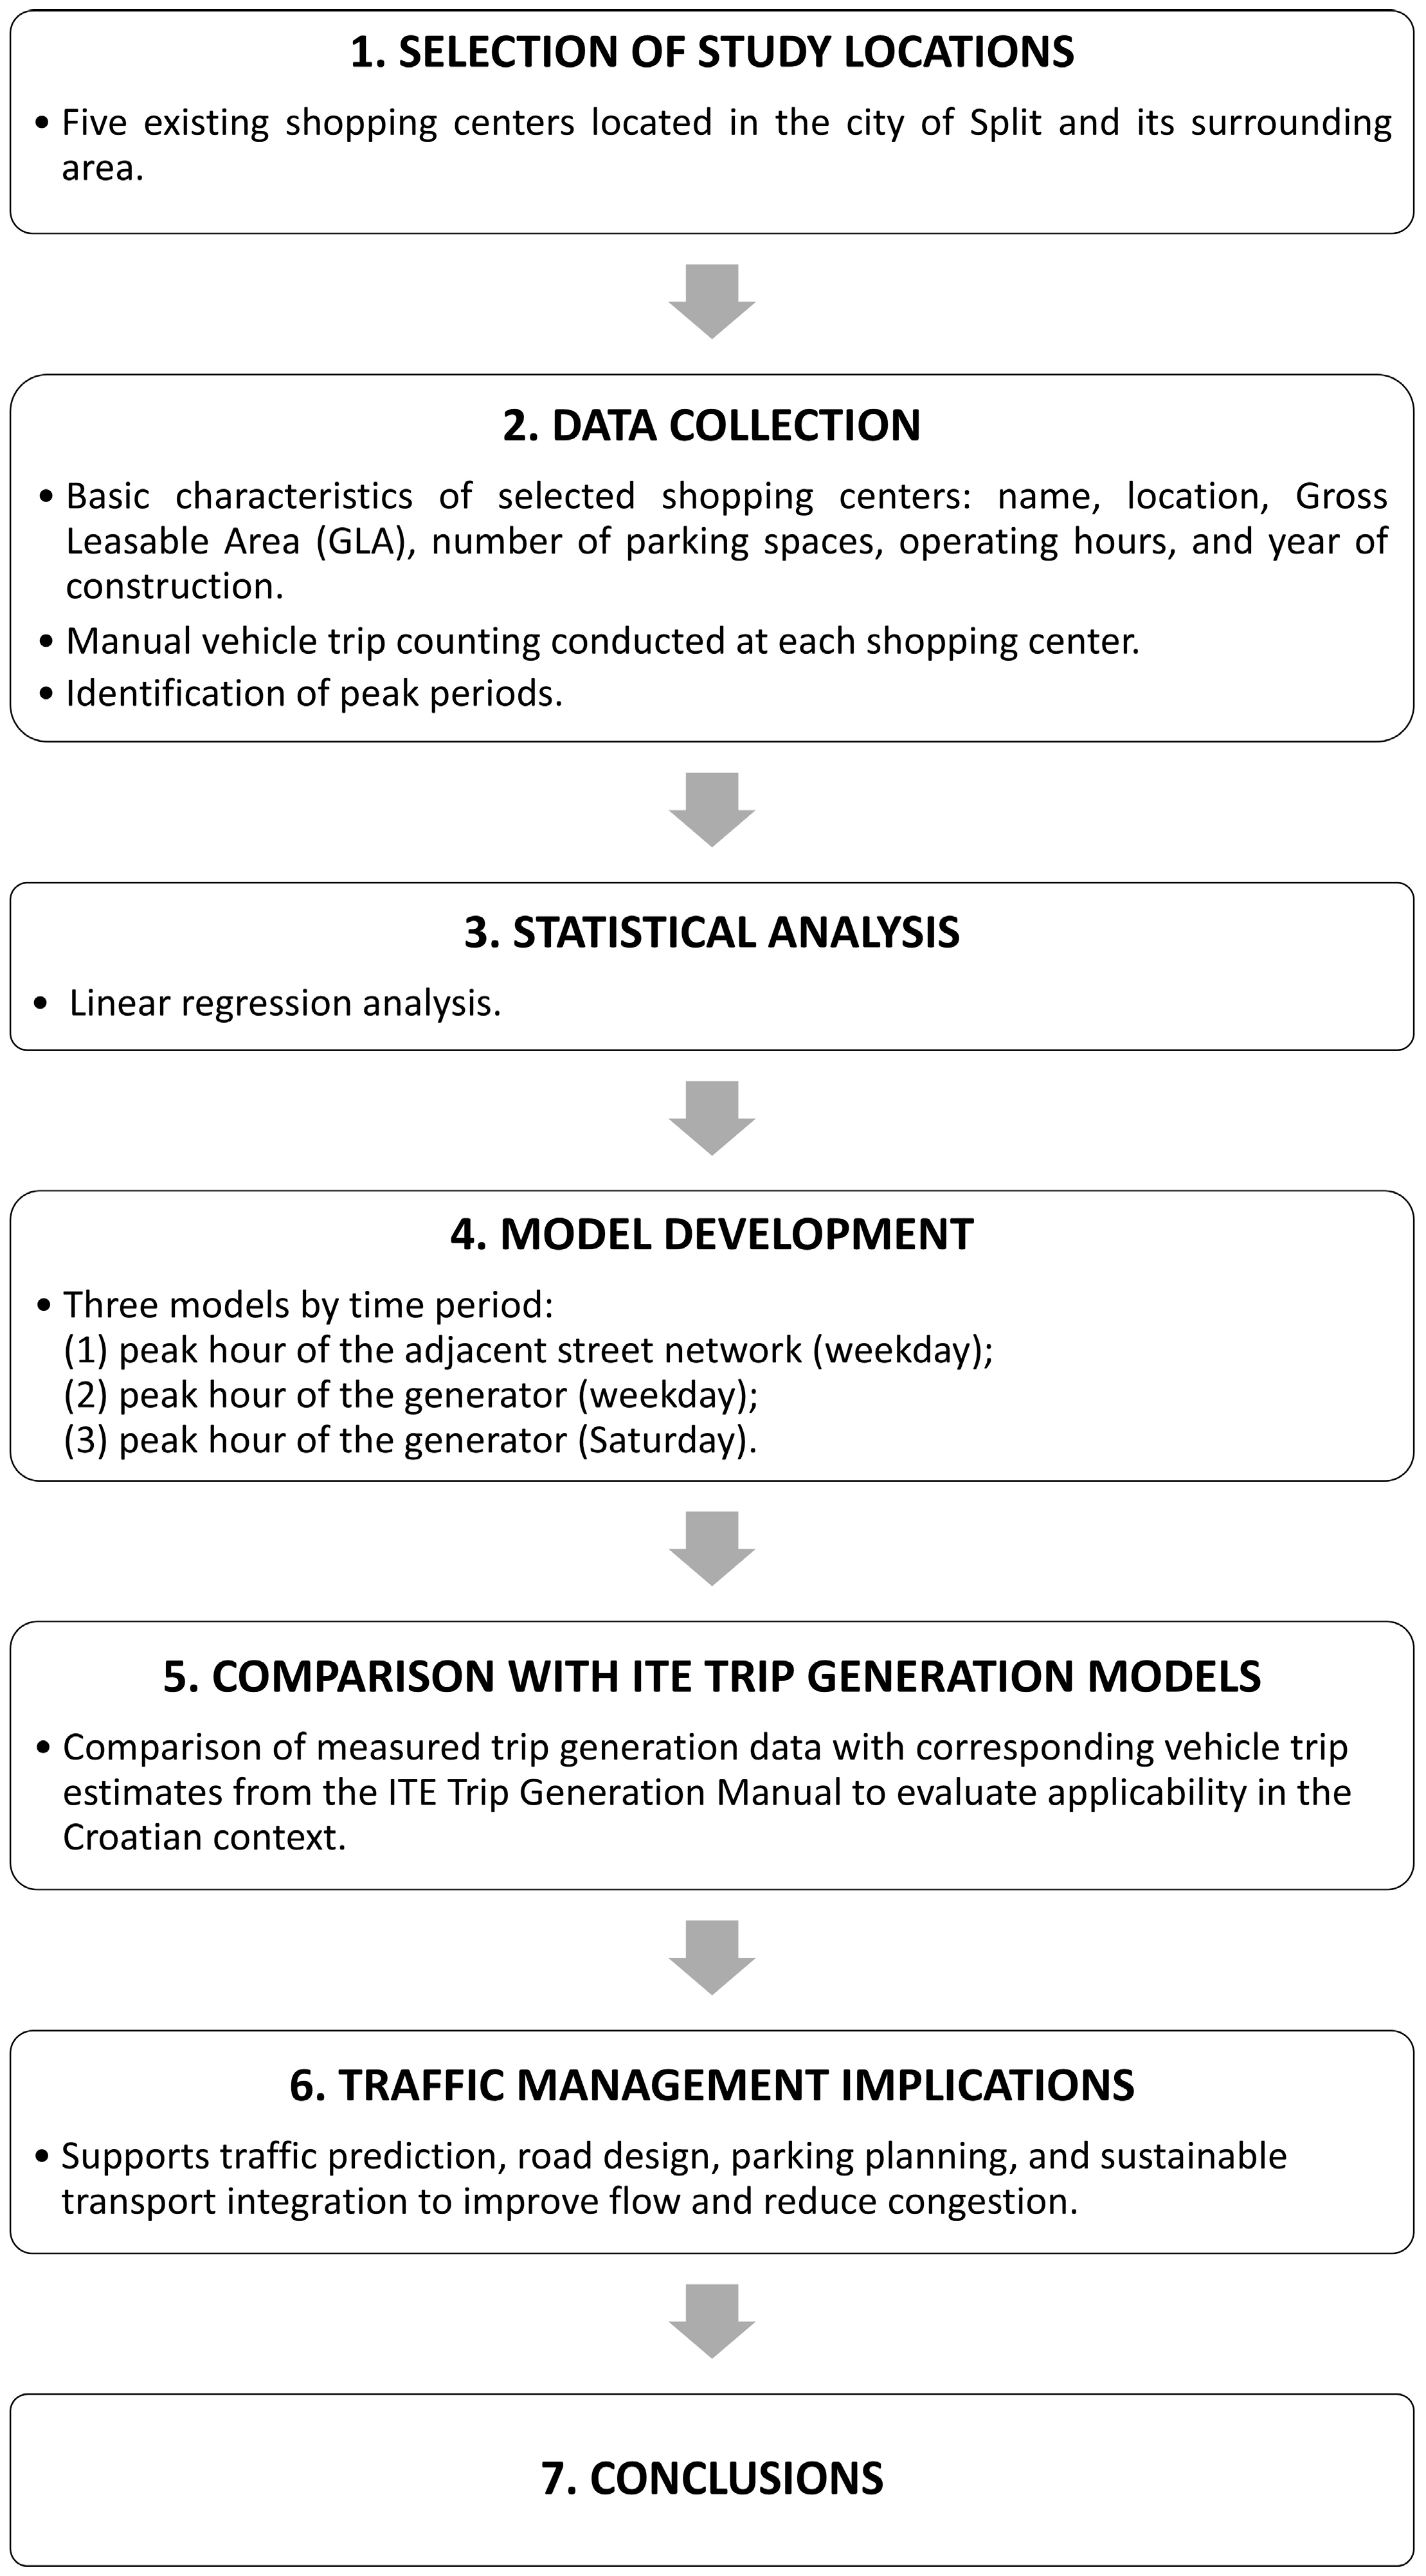
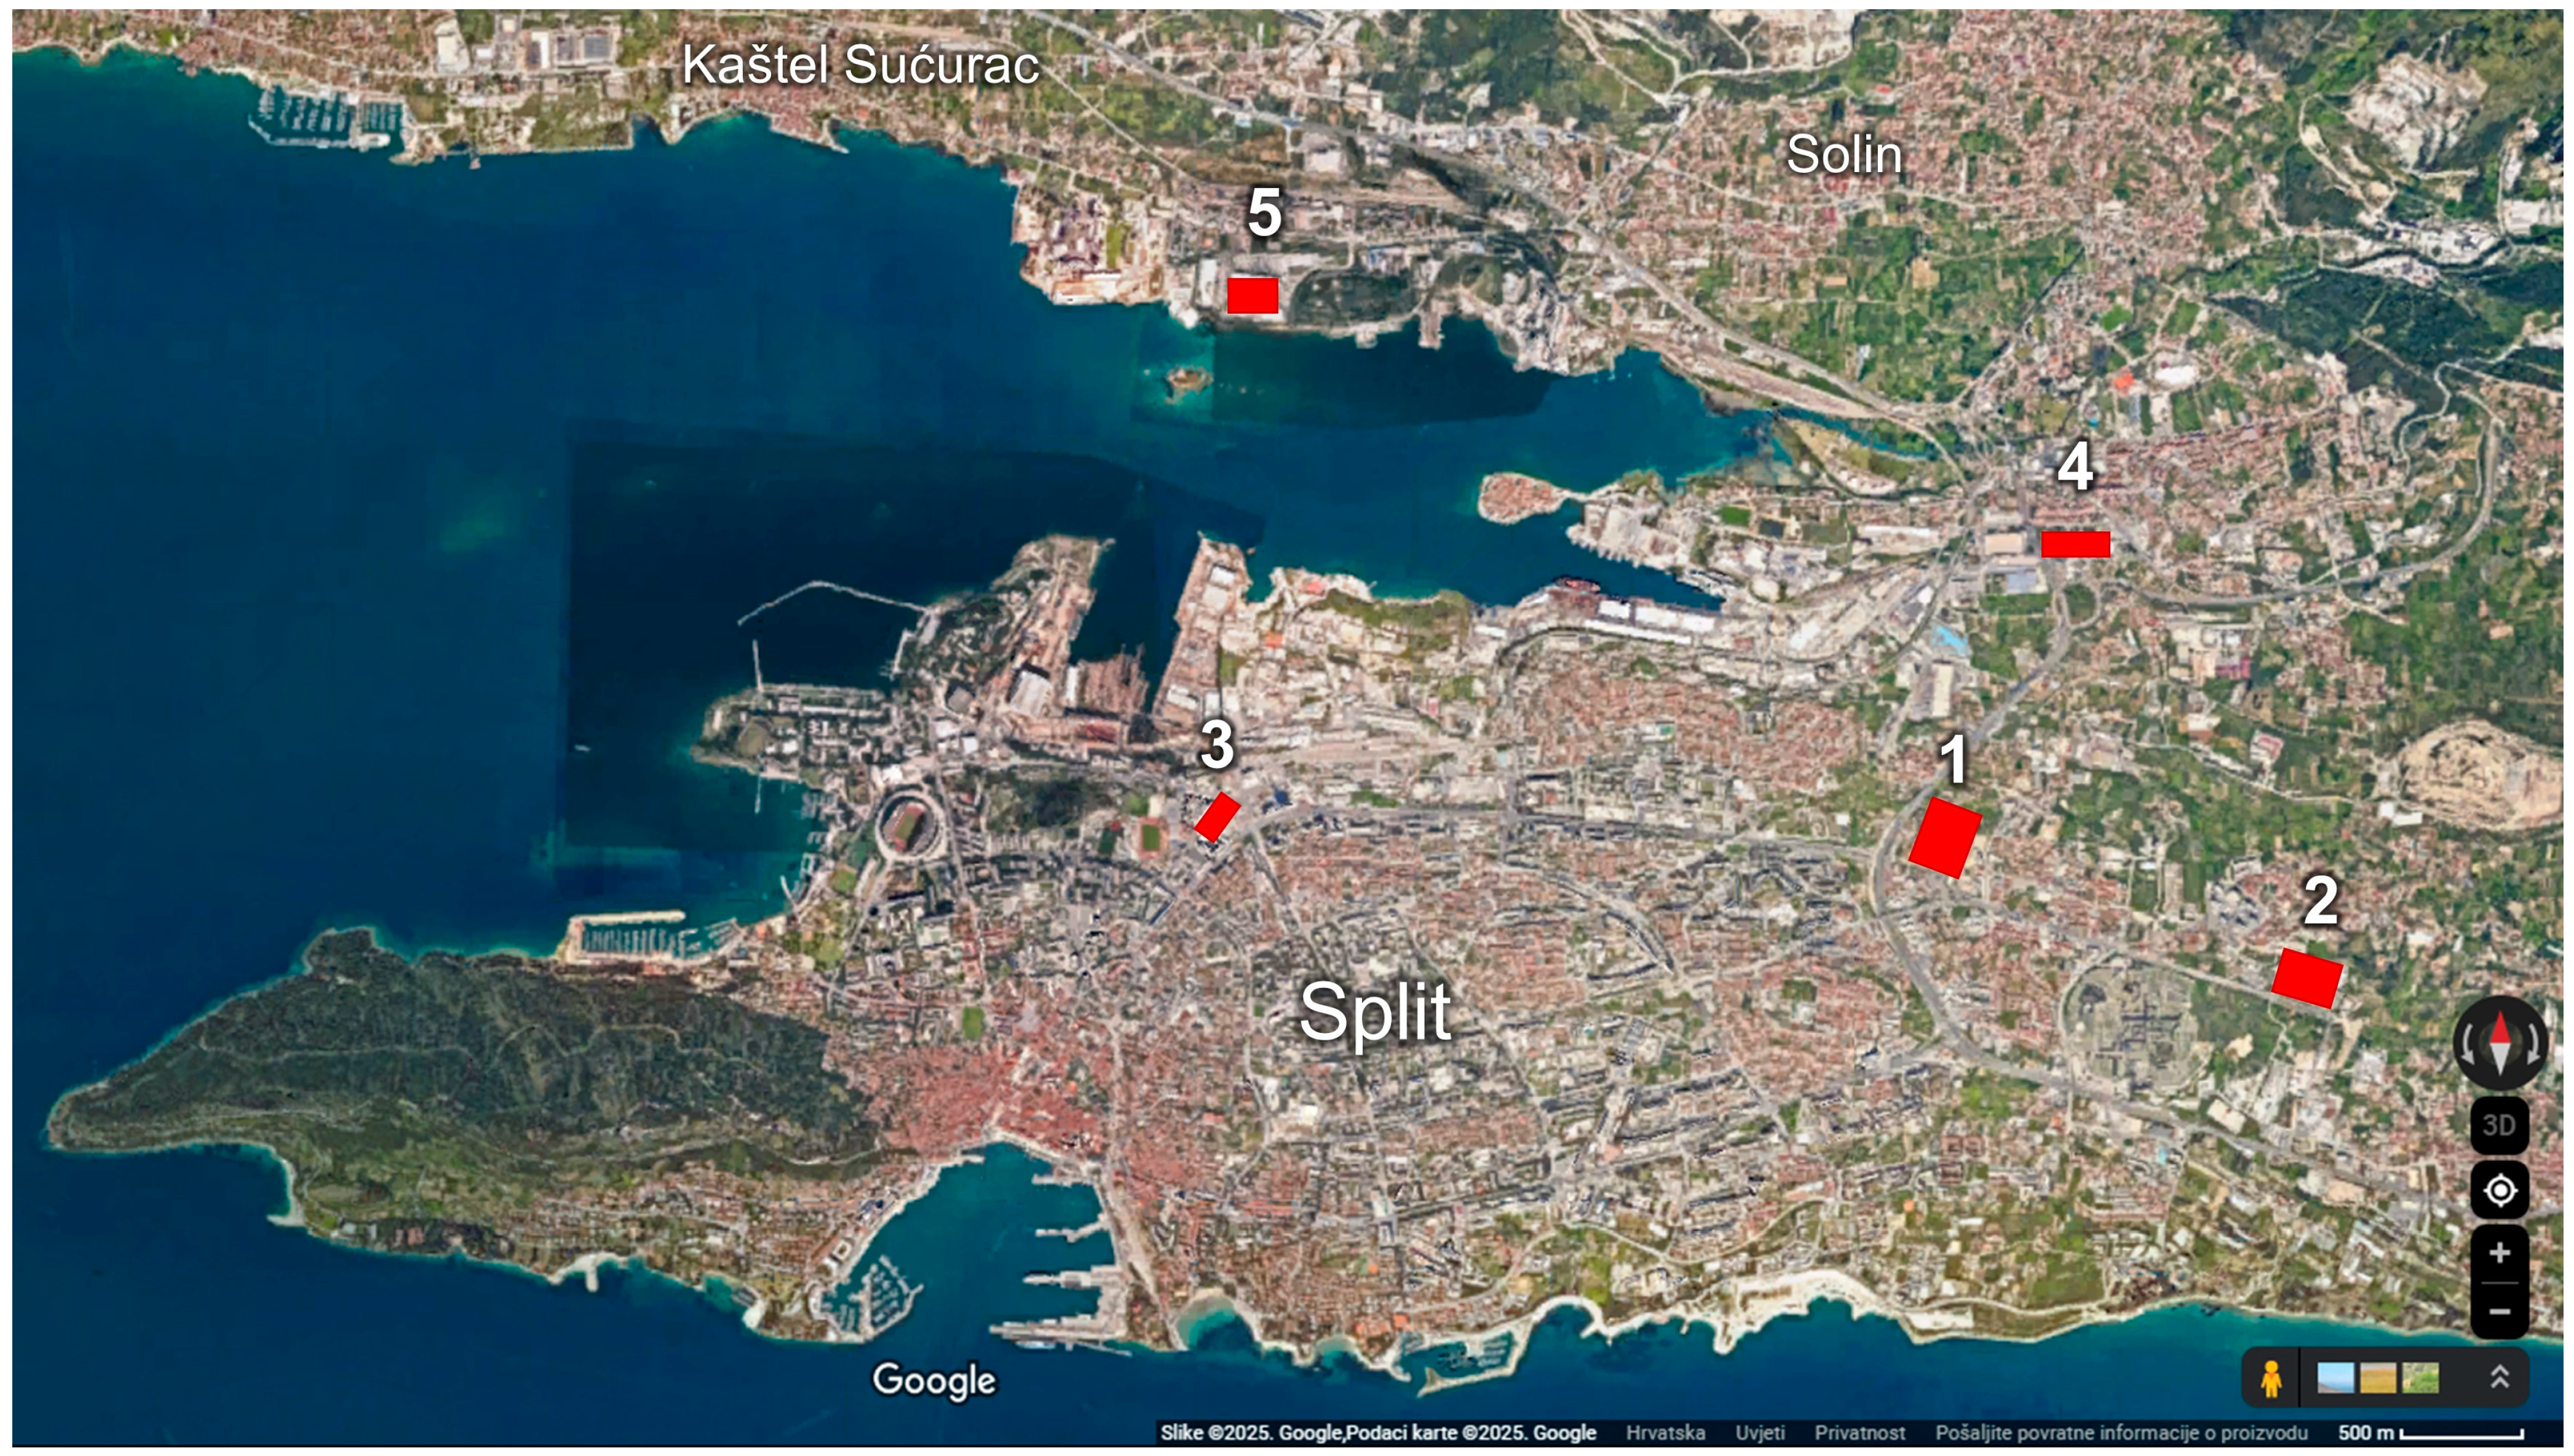
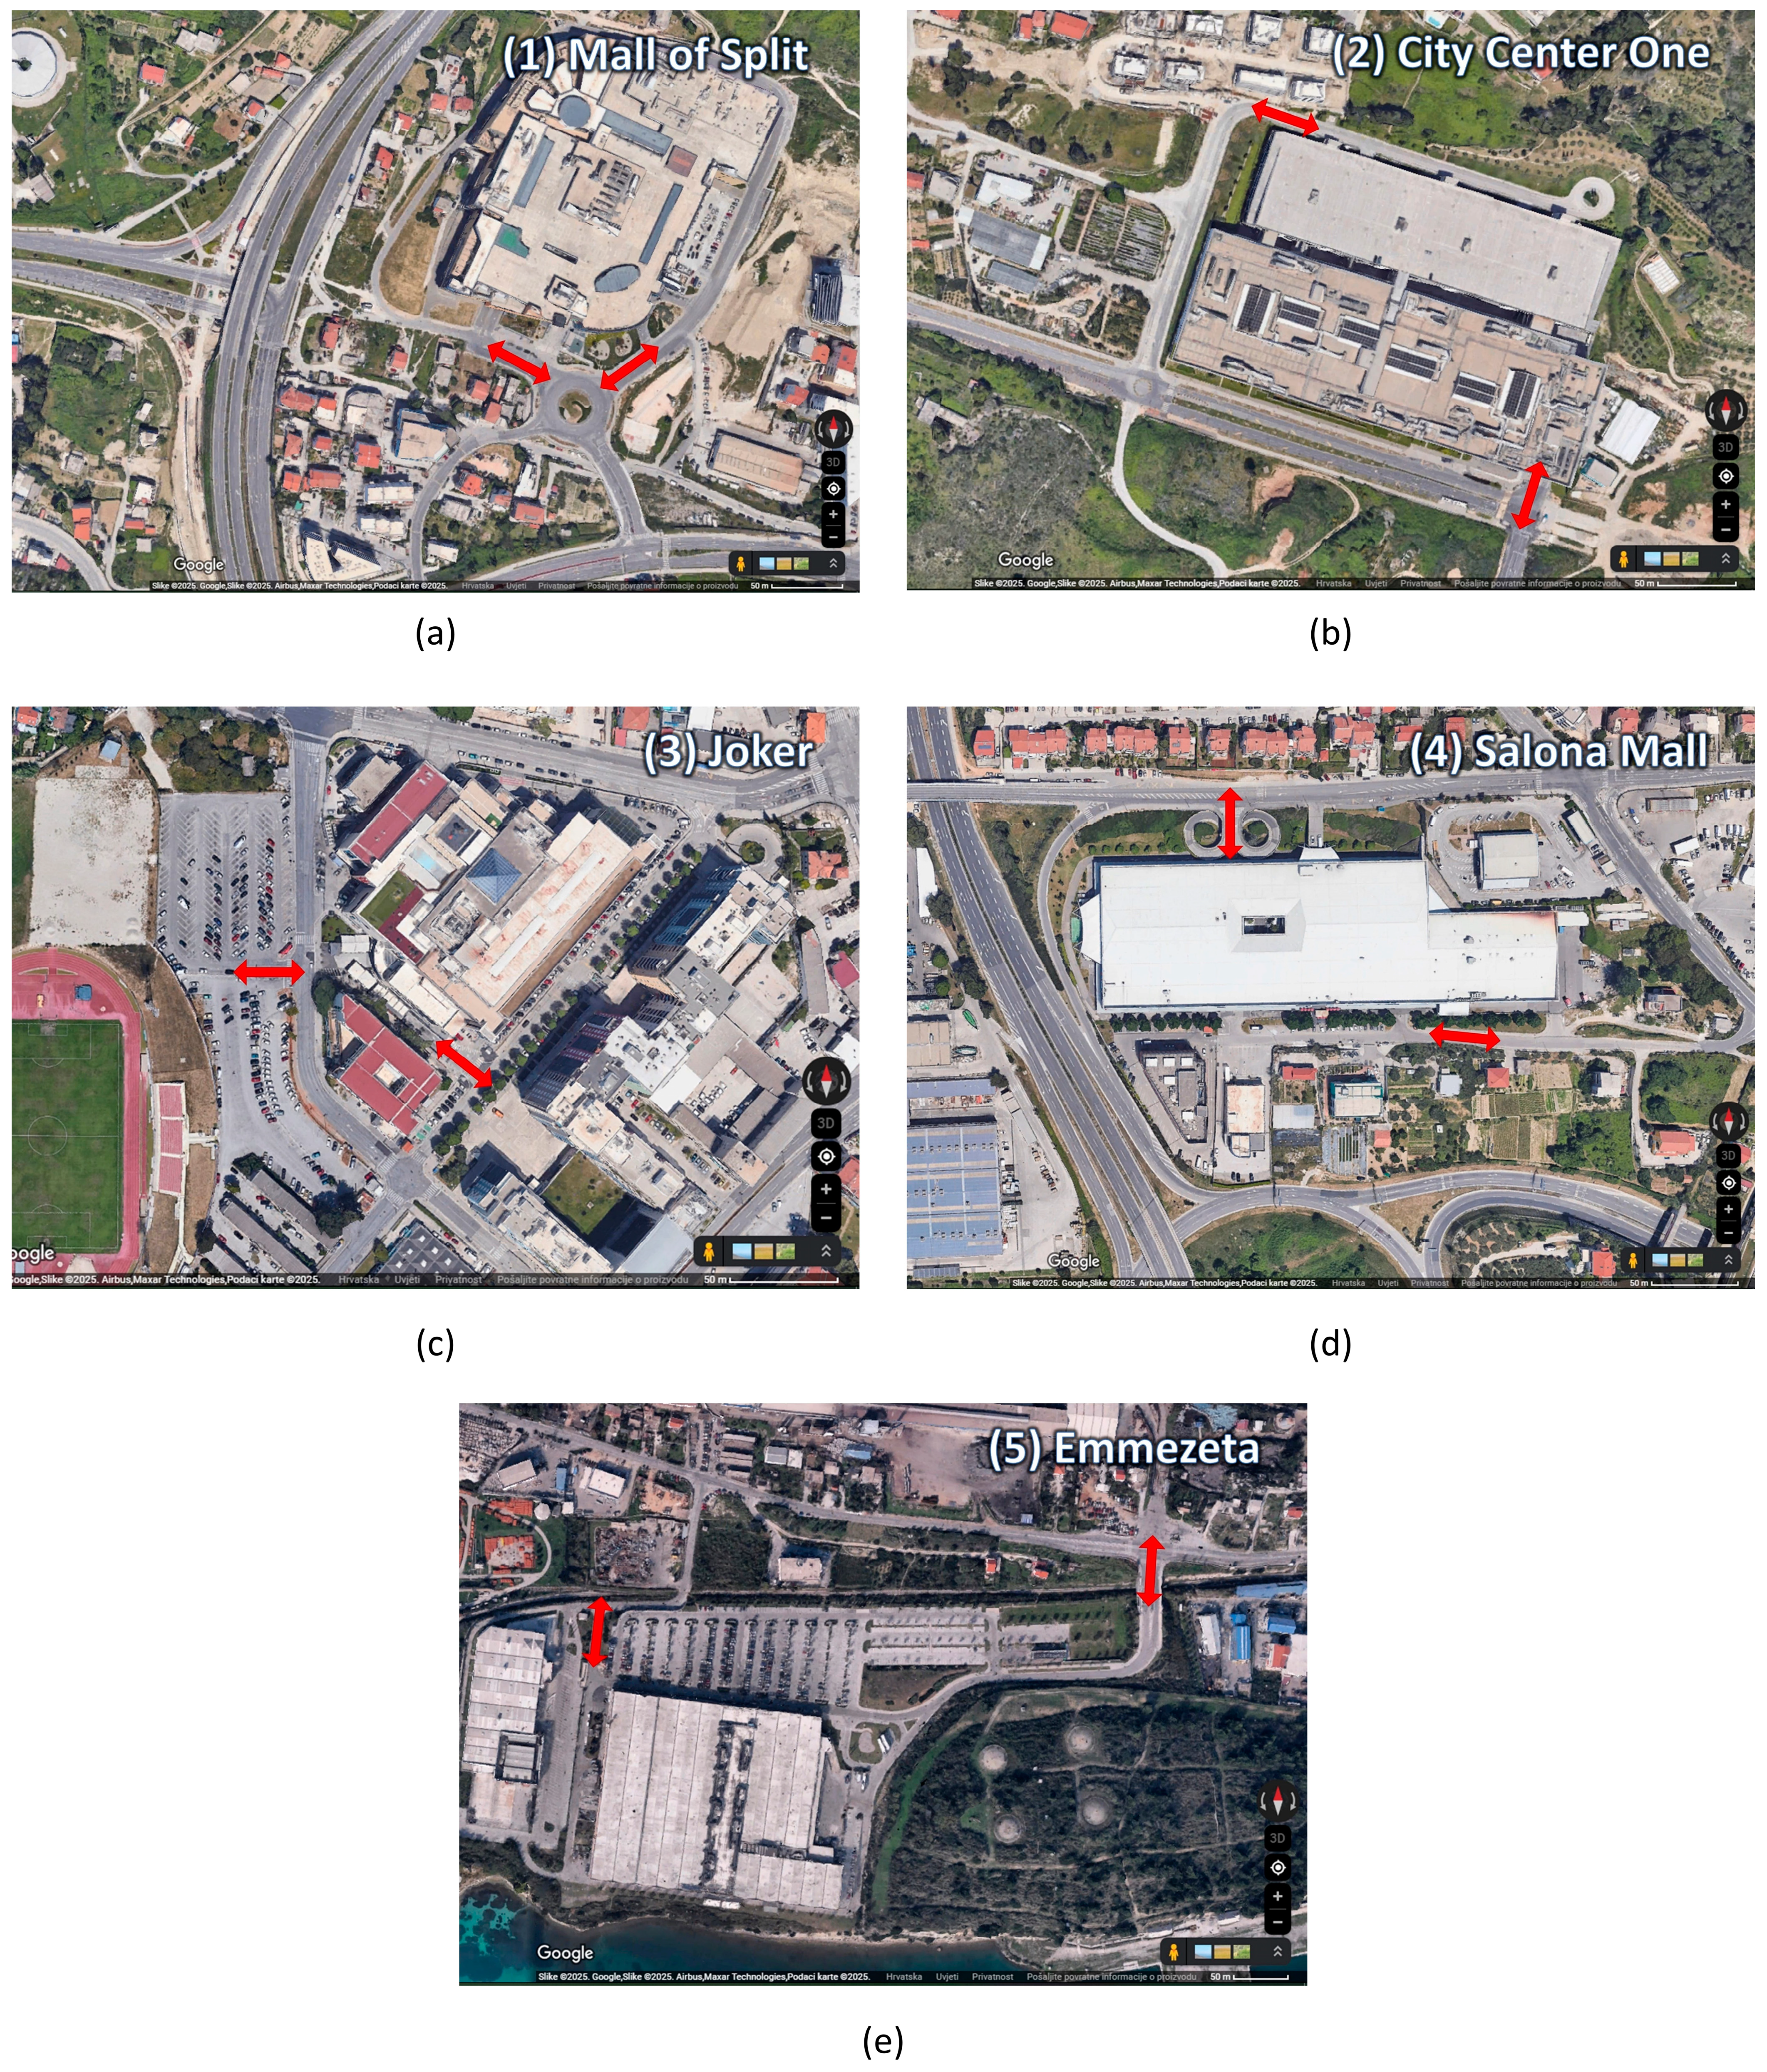
The primary objective of this study was to investigate the number of vehicles attracted by existing shopping centers and to analyze the feasibility of formulating a mathematical model that could be used to predict the number of vehicles during the peak hour for newly planned shopping centers in the future. A trip generated by shopping centers’ attractiveness can be realized using various modes of transportation (private vehicles, bicycles, walking, or public transport). However, this study focused only on vehicle trips, as an increase in vehicle volume on the existing road network can affect traffic flow quality, congestion, and overall safety for all road users. For this purpose, traffic counts were conducted, and a database was created for the application of statistical analysis methods and the development of a predictive model.
Trip generation data can be determined in two ways:
By applying the average trip generation rate of the relationship between the number of trips and a specific independent variable, or
By applying the developed mathematical (regression) equation.
The average trip generation rate is defined as the average number of trips generated by a particular land use type over a specified time period (e.g., per day or during peak hours) in relation to a relevant independent variable. A regression equation with an R
2 of at least 0.75 is preferred because it indicates the desired level of correlation between the trips generated by a site and the value of independent variable [
5].
For the five analyzed locations, a trip generation estimation model was formulated based on linear regression analysis. Linear regression analysis and appropriate statistical tests were performed in JASP 0.19.3 software [
34]. As previously mentioned, some earlier studies have used multiple regression analysis with several independent variables (number of employees, number of stores, number of parking spaces, etc.). However, it was found that Gross Leasable Area (GLA) has the greatest influence on the number of vehicle trips generated by shopping centers [
26,
27,
28]. Due to its strong correlation with trip generation, GLA was selected as the primary independent variable in this study. This approach aligns with the methodology used in the ITE Trip Generation Manual [
6], where GLA is also considered the key predictor variable for estimating vehicle trips associated with shopping centers.
Linear regression analysis was performed for the peak hour of the adjacent street network on weekday, followed by the peak hour of the generator on weekday and on Saturday. The results of the performed analysis are given in
Table 5. For each model, the correlation value R, the coefficient of determination R
2, and standard error of the estimate are shown.
The obtained coefficients of determination (R
2) indicate that all models have good agreement with the measured data, meaning that a substantial proportion of the variability in the dependent variable (vehicle trips) can be explained by the independent variable (GLA). According to the Trip Generation Handbook [
5], a regression equation is recommended when R
2 is at least 0.75. Since all models meet this criterion, they are considered reliable for predicting vehicle trip generation. Additionally, the results of the Analysis of Variance (ANOVA), presented in
Table 6, confirm that there is a statistically significant relationship between Gross Leasable Area (GLA), as the independent variable, and the number of vehicle trips, as the dependent variable.
The significance tests, conducted with a significance level of α = 0.05, indicate that changes in the independent variable significantly influence changes in the dependent variable and the null hypothesis of no relationship between the dependent and independent variables can be rejected. For all analyzed models, the p-value is less than 0.05, confirming that there is a statistically significant relationship between the observed variables.
The values of the regression coefficients (Unstandardized Coefficient) and their corresponding statistical significance (
p-value) are shown in
Table 7 for each of the models. These values confirm the hypothesis that the independent variable significantly contributes to the explanation of the variability of the dependent variable. The
p-value for the intercept (constant) is greater than 0.05, but this does not affect the validity of the model as a whole.
The mathematical equations of the created models for estimating vehicle trips for shopping centers, based on the results of the regression analysis, are presented in
Table 8.
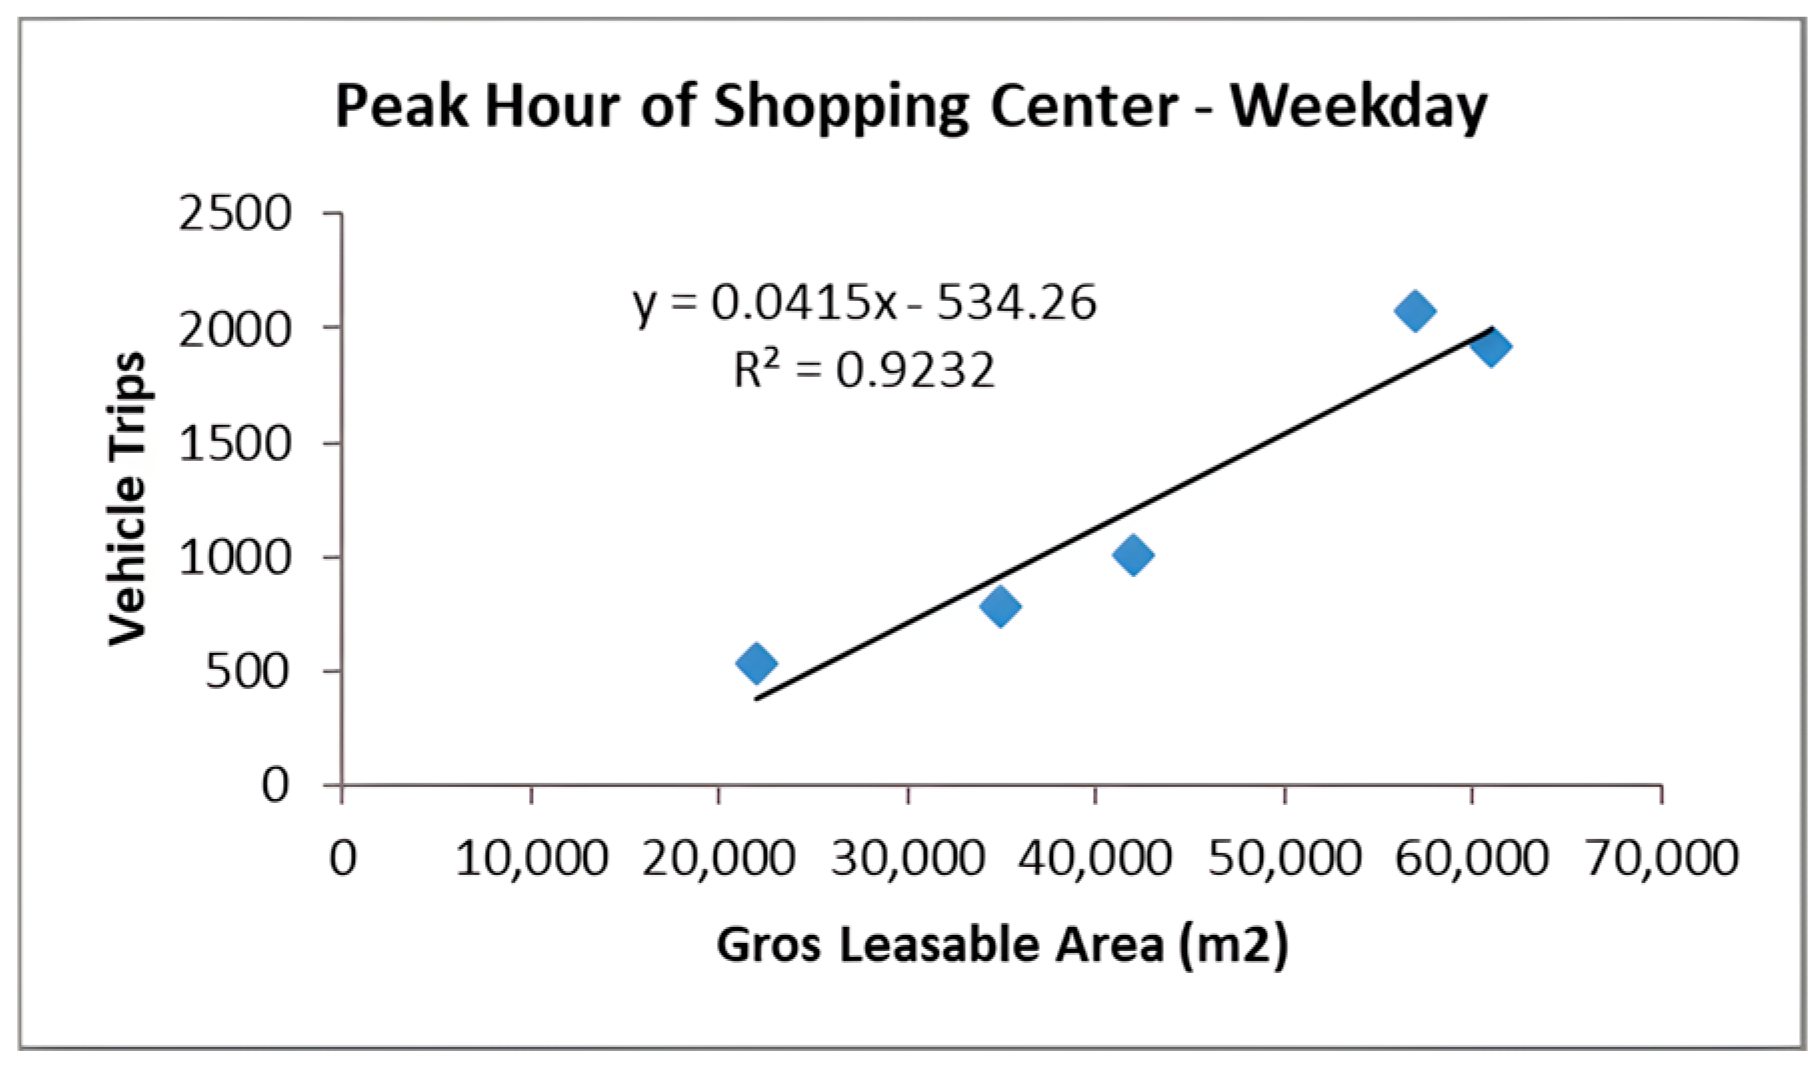
Figure 4,
Figure 5 and
Figure 6 show the measured data along with the corresponding regression equations for each analyzed peak period. The scatter plot with a regression line in
Figure 4 illustrates the relationship between the Gross Leasable Area (GLA) of shopping centers and the number of vehicle trips during the peak hour of adjacent street traffic on a typical weekday. The positive regression coefficient (0.025), which represents the slope of the regression line, indicates that, for every 1000 m
2 increase in GLA, the number of vehicle trips is expected to increase by approximately 25 during the peak hour of adjacent street traffic.
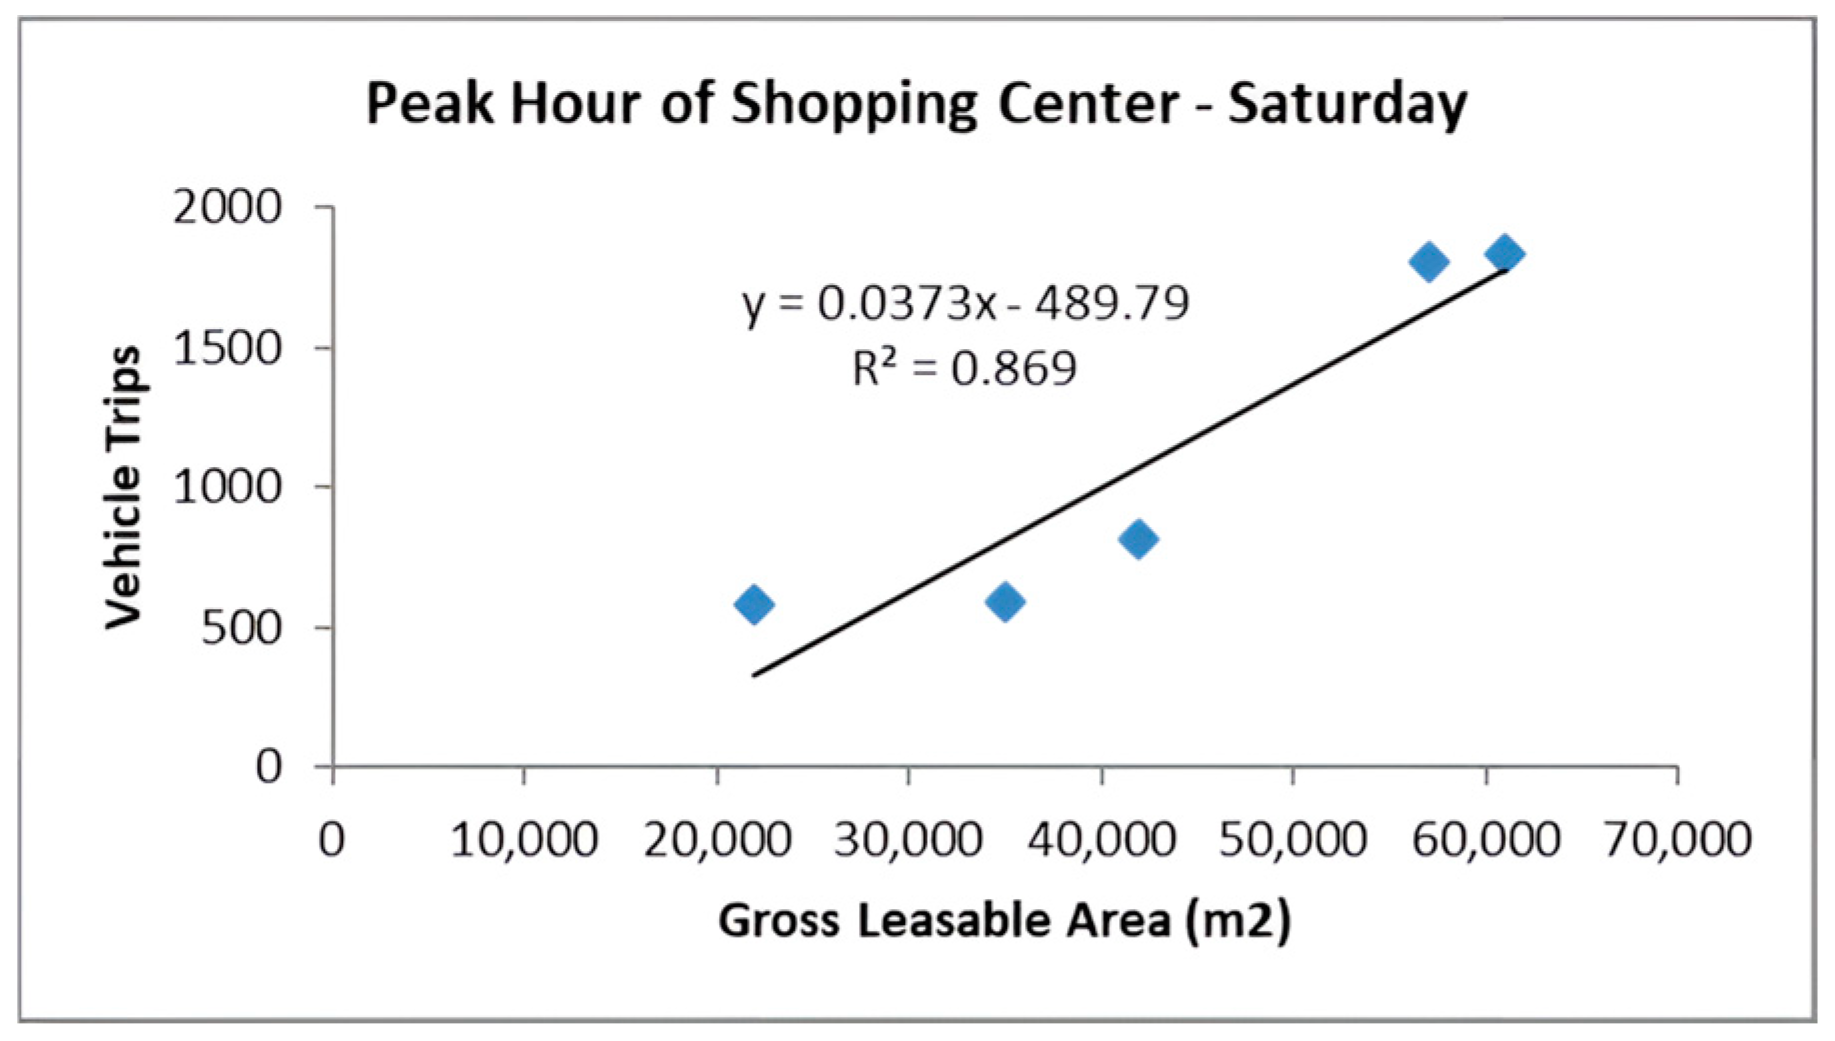
Similar patterns are observed in the other two models.
Figure 5 and
Figure 6 show the relationships between the shopping center GLA and the number of vehicle trips during the peak hour of the shopping center for a typical weekday and for Saturday, respectively. According to the model for the shopping center peak hour on a weekday (
Figure 5), each additional 1000 m
2 of GLA results in an expected increase of approximately 42 vehicle trips. For Saturday’s peak hour (
Figure 6), the model predicts an increase of approximately 37 vehicle trips for every additional 1000 m
2 of GLA.
The presented results are consistent with the traffic counts on which the developed models are based (
Table 2,
Table 3 and
Table 4). The number of vehicle trips is higher during the shopping center’s peak hour than during the peak hour of the adjacent street network. Additionally, the number of trips is greater on weekdays than on weekends, which can be attributed to higher vehicle occupancy rates (e.g., family trips to shopping centers), more frequent use of public transport, and non-motorized modes of travel during the weekend.
All coefficients of determination (R2) for the proposed models have high values, indicating a strong dependence between the dependent and independent variables. Given the characteristics of the analyzed locations, the proposed models can be applied to shopping centers with a Gross Leasable Area (GLA) ranging between 20,000 and 70,000 square meters.
To define the directional distribution of the estimated generated trips, the average distribution of the measured vehicle entry and exit data (as shown in
Table 2,
Table 3 and
Table 4) was used. The average directional distribution for the peak hour of adjacent street traffic is 51% vehicles entering and 49% exiting. For the peak hour of the generator, this distribution comprises 50% entering and 50% exiting vehicles for weekdays, while for Saturday, at the peak hour, this distribution comprises 53% entering and 47% exiting vehicles.
Although the number of locations included in this study meets the criteria outlined in the ITE Handbook [
5], the authors are aware that a larger dataset would provide an even more accurate representation of the impact of GLA on the number of vehicles attracted to a shopping center zone. Due to the limited availability of consistent data, the regression analysis in this study was conducted using five data points, each representing a shopping center. While this approach provides a preliminary insight into potential relationships, statistical measures such as R-squared values and
p-values may be affected by the small sample size. As a result, the outcomes should be interpreted as exploratory rather than conclusive. This limitation is noted, and future studies with larger datasets are recommended to validate and strengthen the findings. The presented results are an initial step in traffic demand modeling and database creation in the Republic of Croatia, as there have been no previous studies on the number of trips generated by different land uses in this area. Furthermore, these findings serve as an incentive for further research to expand and update the database, not only for shopping centers but also for other trip generators (such as residential complexes, hospitals, and large supermarkets) whose construction could significantly impact traffic flow on the existing road network. Based on the estimated future traffic volume caused by new site development, infrastructure measures can be implemented to maintain an adequate level of service and traffic flow quality.
4.2. Comparison of Measured Trip Generation Data with Data According to the ITE Generation Manual
The majority of trip generation studies for different land uses are conducted in the USA, with the results published in the ITE Trip Generation Manual. Due to the lack of locally specific data for Croatia, traffic impact analyses have often relied on data from this publication, adjusted by reducing the values by a certain percentage to better reflect local conditions. The differences arise due to different motorization rate between Croatia and the USA, as well as socio-demographic characteristics and different travel habits of the population. The motorization rate in the USA for 2022 is 775 vehicles per 1000 inhabitants. This value refers to the number of registered light duty vehicles [
35] per 1000 inhabitants [
36]. For the same year and for the same type of vehicle, the motorization rate for Croatia is 475 vehicles per 1000 inhabitants [
29,
37], which is 39% lower than in the USA. There are also differences in the modal distribution of trips, as some European and other countries have a higher usage percentage of public transportation and non-motorized modes than the USA [
38].
Table 9 shows the regression analysis equations used to estimate vehicle trips for different peak periods according to the ITE Trip Generation Manual, 10th edition [
6]. The independent variable in these equations is GLA expressed in 1000 square feet.
A comparison of the number of vehicle trips measured at the observed shopping center locations and the number of vehicle trips estimated by ITE regression equations (
Table 9) is shown in
Table 10,
Table 11 and
Table 12 for the peak hour of adjacent street and the peak hour of the generator on a weekday and on a Saturday, respectively. These disparities highlight the need for locally developed trip generation models that account for Croatia’s specific transportation and behavioral patterns instead of relying solely on adjusted values from the ITE Manual.
This study, like some previous research [
12,
13,
17], has confirmed that the measured vehicle trip values are significantly lower than those estimated using equations from the ITE Trip Generation Manual. For the observed shopping centers in Croatia, the average deviation ranges between 30 and 50%, meaning that values estimated using ITE equations should be reduced by this percentage to better reflect local conditions. It can be observed that the smallest deviations are for shopping centers with larger leasable areas.
Trip generation estimates are generally lower than in the USA due to differences in urban planning, motorization rates, transportation infrastructure, and travel behavior. European cities are more compact with mixed-use developments, where residential, shopping, and recreational areas are closer together, reducing the need for driving. Additionally, the high use of public transport and non-motorized modes of travel results in fewer vehicle trips compared to more car-dependent countries like the USA. The USA has historically invested heavily in car-friendly infrastructure, including extensive highway systems and large parking facilities, which supports higher vehicle usage and trip generation.
In this study, data and estimates for shopping centers were analyzed and compared; however, the general conclusion can also be applied to other land uses. In the context of a traffic impact study, if it is necessary to estimate vehicle trips generated by the new site development, estimates derived from the ITE Generation Manual may be utilized because there are no national databases for trip generation estimates for different land uses in Croatia. However, the resulting values should be lowered by 30–50%, depending on the observed peak period, the type of the facility, and the judgment of the traffic planner. The mean difference of 40% also corresponds to a difference in the rate of motorization, which is 39% lower than that in the USA.


