Article

Electromechanical Impedance-Based Compressive Load-Induced Damage Identification of Fiber-Reinforced Concrete

by
George M. Sapidis
,
Maria C. Naoum
* and
Nikos A. Papadopoulos
Laboratory of Reinforced Concrete and Seismic Design of Structures, Structural Engineering Science Division, Civil Engineering Department, School of Engineering, Democritus University of Thrace, 67100 Xanthi, Greece
*
Author to whom correspondence should be addressed.
Infrastructures 2025, 10(3), 60; https://doi.org/10.3390/infrastructures10030060
Submission received: 9 February 2025 / Revised: 27 February 2025 / Accepted: 6 March 2025 / Published: 10 March 2025

Abstract

Establishing dependable and resilient methodologies for identifying damage that may compromise the integrity of reinforced concrete (RC) infrastructures is imperative for preventing potential catastrophic failures. Continuous evaluation and Structural Health Monitoring (SHM) can play a key role in extending the lifespan of new or existing buildings. At the same time, early crack detection in critical members prevents bearing capacity loss and potential failures, enhancing safety and reliability. Furthermore, implementing discrete fibers in concrete has significantly improved the ductility and durability of Fiber-Reinforced Concrete (FRC). The present study employs a hierarchical clustering analysis (HCA) to identify damage in FRC by analyzing the raw Electromechanical Impedance (EMI) signature of piezoelectric lead zirconate titanate (PZT) transducers. The experimental program consisted of three FRC standard cylinders subjected to repeated loading. The loading procedure consists of 6 incremental steps carefully selected to gradually deteriorate FRC’s structural integrity. Additionally, three PZT patches were adhered across the height of its specimen using epoxy resin, and their EMI response was captured between each loading step. Subsequently, the HCA was conducted for each PZT transducer individually. The experimental investigation demonstrates the efficacy of HCA in detecting load-induced damage in FRC through the variations in the EMI signatures of externally bonded PZT sensors.

1. Introduction

Reinforced concrete (RC) infrastructures deteriorate over time as they are subjected to various load cases and environmental conditions throughout their service life [1]. Consequently, the bearing capacity of RC infrastructures diminishes over time, which compromises their structural integrity and residents’ safety [2]. The continuous deterioration of RC elements manifests in the form of microcrack formation due to concrete’s brittle behavior [3]. These cracks propagate and expand, declining the bearing capacity of the RC elements [4]. Furthermore, the formation of macro cracks in RC members enhances the vulnerability to environmental-induced damage, such as steel reinforcement corrosion, compromising the infrastructure’s service life [2].
Incorporating discrete fibers in concrete significantly enhances its ability to restrain rapid crack propagation and reduces the material’s susceptibility to damage [5,6]. As a result, Fiber-Reinforced Concrete (FRC) exhibits higher durability than RC [5,7]. Thus, FRC has been widely used in various types of infrastructure, like tunnels, subways, airports, and seismic-resistant infrastructures [2]. FRC illustrates elevated straining capacities since fibers inhibit the opening and widening of microcracks [3,4,8]. Further, FRC with synthetic fibers, such as PET, PE, and PP, has improved corrosion, shrinkage, and fire resistance [7,9]. Additionally, their recyclability, versatility, and widespread availability comply with circular economy requirements and resilient and sustainable societies for renewable materials with a reduced ecological impact [10].
Further, civil engineering has growing appeal with regard to the development of applicable structural health monitoring (SHM) techniques. The continuous evaluation and assessment of structural integrity using SHM techniques help to safely expand the lifetime of both newly erected and existing constructions [11]. The prompt diagnosis of crack formation in critical structural members could intercept further loss of bearing capacity and prevent sudden collapses [12]. The utilization of smart piezoelectric materials in the field of SHM is widespread, and the material most commonly used for this purpose is lead zirconate titanate (PZT) [13,14]. The main advantages of piezoelectric materials are their capability to be implemented as actuators and sensors thanks to the piezoelectric effect, their wide variety of shapes and sizes, and their low cost, durability, and reliability [15]. Several SHM techniques employ piezoelectric materials, such as Guided Waves (GWs) [16,17], Acoustic Emissions (AEs) [18,19], ultrasonic [20,21], and electromechanical impedance (EMI) [22,23].
In EMI, a prominent SHM technique, piezoelectric transducers simultaneously serve as actuators and sensors [24], in contrast with other SHM techniques. Further, adopting high-frequency excitations increases the sensitivity and efficiency of the EMI technique in promptly detecting emerging damage. The EMI method relies on the influence of the structure’s mechanical impedance, which is influenced by structural properties, including mass, stiffness, and damping, on the EMI responses of the PZT patches [25]. In this manner, any structural integrity alterations are captured by PZT’s EMI signature [26]. Additionally, a literature review has shown that PZT transducers can either be epoxy-bonded [22] on the external face of the RC member [27] or embedded as smart aggregates [28]. A series of recent studies have indicated the efficiency of EMI-based SHM in RC members. The literature has investigated the identification of flexural damage in ordinary RC [29,30] and prestressed concrete beams [31,32,33]. Further, the efficacy of the EMI technique in prompt diagnosis of brittle failure of shear-deficient RC beams [28,34,35] and shear-critical sub-assemblages of RC structures, such as beam-column joints [27,36,37], has been demonstrated.
Although the literature addresses the efficacy of PZT-enabled EMI-based SHM of RC members, the discussion regarding FRC monitoring continues to be concise [38,39]. Experimental data by Wang et al. suggest that the fiber content of FRC does not affect the EMI signature, indicating the feasibility of the EMI method in FRC [40]. Further, Naoum et al. demonstrated the effectiveness of PZT sensor networks in detecting damage in FRC subjected to repeated bending loads [4]. It is noteworthy to mention that using multiple types of fibers can affect the experimental process due to differences in the materials, stiffness, tensile strength, and aspect ratio, while examining only one type might not affect the experimental outputs.
Several studies have highlighted the significance of diagnosing damage caused by compression in RC members in civil engineering infrastructures [41,42,43]. According to previous research, the stress fields of concrete can impact the EMI measurements of externally bonded or embedded PZT patches [42,44,45]. In particular, embedded PZT patches are highly sensitive to variations in stress fields [45]. The majority of previous studies have used statistical indexes, such as Root Mean Square Deviation (RMSD), Correlation Coefficient Deviation (CCD), and Mean Absolute Percentage Deviation (MAPD), to detect crack formation in concrete specimens [28,42,44,45]. Recent research studies have been primarily centered around implementing machine learning techniques to accurately detect concrete cracks from EMI signatures [39,41,46,47,48].
In the literature, the machine learning algorithms that are frequently employed include principal component analysis, neural networks, and hierarchical and k-means clustering [39,41,47,49,50,51,52]. These techniques have been shown to improve the identification of damage types, severity levels, and locations through EMI feature analysis. Acquiring and establishing a comprehensive SHM dataset is challenging, so implementing unsupervised machine learning algorithms has become a viable solution. Sevillano et al. [48] and Perera et al. [47] have employed hierarchical clustering, an unsupervised machine learning algorithm, to identify the debonding of externally applied synthetic reinforcement, with promising results. Furthermore, Naoum et al. [45] utilize hierarchical clustering to distinguish the influence of stress and damage developed in FRC beams under repeated loading.
However, the differentiation between the HCA’s implementation in this paper and that in the abovementioned works is based on an examination of the development of multiple and concurrent cracks, which can make it difficult to determine the structural integrity of the specimens throughout the repeated loading sequence.
This paper investigates the efficacy of the EMI method in identifying structural deterioration of FRC under repeated compressive loading. The specimens were subjected to a gradually incremental repeated compression loading to develop concrete stress and damage in a controlled manner. Incorporating macro-synthetic fibers has significantly improved the post-elastic behavior of the fiber-reinforced concrete, demonstrating pseudo-ductile characteristics. At the same time, a wireless impedance/admittance monitoring system, called WiAMS, captured the PZT transducers’ EMI signatures during the specimen’s release condition between loading steps. The hierarchical clustering analysis (HCA) promptly identified the formation of fissures in FRC specimens. Moreover, by exploiting FRC’s pseudo-ductility, the HCA effectively assesses damage accumulation throughout the loading sequence in the majority of PZT transducers investigated in this study.

2. Materials and Methods

2.1. Materials Properties

This study involved casting three standard FRC cylinders, each with a height of 300 mm and a diameter of 150 mm. The research utilized a C30/37-grade concrete that adheres to EN 206 specifications. Commercial Portland cement type II-42.5 N, coarse aggregate, fine sand, and water were mixed in proportions of 1:2.8:3.3:0.56. Crushed limestone was utilized as the coarse aggregate, while crushed limestone and natural silica sand were used for the fine aggregate. A high-range superplasticizer was incorporated into 0.7% of the cement to enhance the mixture’s workability. This superplasticizer is marketed under the trade name ‘ViscoCrete® Ultra350’ from Sika Hellas and adheres to EN 934.02:2009+A1:2012 [53] requirements. The macro-synthetic fibers were manufactured by Sika Hellas, with the mark designation SikaFiber Force-50 (Kryoneri, Greece). According to the manufacturer, the fibers have a length of 50 mm, an equivalent diameter of 0.715, a tensile strength of 430 MPa, and a Young’s Modulus of 6 GPa. The fibers were directly incorporated into the freshly poured concrete at a dosage of approximately 5 kg/m3 and distributed randomly, with no adverse impact on the quality of the experimental process.
Additionally, this study employs PZT transducers for EMI-based SHM. The PZT patches utilized in this paper are distributed commercially by Pi Ceramics and possess 20 mm × 20 mm × 5 mm dimensions. As per the manufacturer’s specifications, the PZT material has a density of 7800 kg/m3, a Poisson’s ratio of 0.34, a mechanical quality factor of 100, a dielectric loss factor of 20 × 10−3, and a relative permittivity of 2400 and 1980 in parallel and perpendicular directions to the polarity, respectively.

2.2. Specimens Casting

The raw materials were prepared and added to the rotary mixer in accordance with the principles of ASTM C192 [54]. The coarse and fine aggregates were added first and mixed for a period of 30 s, followed by the addition of cement and another 30 s of mixing. Thereafter, 60% of the designed water was added and mixed again for 30 s, and the remaining 40% of the designed water was poured over the pan with the admixture and mixed for an additional 60 s. The macro-synthetic fibers were then added at four different times during stirring, with equal quantities of 25% added each time to ensure homogeneity and flowability of the fresh FRC mixture, thereby preventing fiber clumping.
The molds of the specimens were then filled almost to their brims with the FRC mixture and adequately vibrated with an automated vibrating table, which has a 508 × 508 mm large platform and a loading capacity of 136 kg. Subsequently, the specimens were kept untouched in a vibration-free environment for 48 h after casting. Further, the curing process was carried out in a controlled-moisture environment at a temperature of 23 ± 1 °C and relative humidity above 95% for 28 days from the time of demolding. Finally, a grinding wheel was used to ensure the planeness of the specimens’ ends and their perpendicularity concerning the longitudinal axis of the cylindrical specimens before the loading procedure.

2.3. Testing Procedure

The primary focus of this study is to examine the effectiveness of EMI techniques for damage identification in FRC. To achieve this, three PZT patches have been affixed at specific predetermined locations along the vertical extent of the specimen’s facade, as demonstrated in Figure 1. Further, PZTs’ placement was implemented, considering their operational monitoring range. Thus, the distance of each PZT transducer from the bottom of the specimen was 225 mm, 150 mm, and 75 mm for PZT Up, PZT Mid, and PZT Down, respectively. An epoxy adhesive layer was utilized to attach the PZT patches to the external surface of the FRC specimen. This approach is a reliable and effective means of achieving a secure bond between the two materials. Subsequently, the specimen was positioned within a Universal Testing Machine equipped with a displacement control feature, with a maximum loading capacity of 3000 kN. The loading rate was chosen based on the ASTM C39 standard practice, which was a loading rate of 1.2 mm/min [55]. Additionally, a laser extensometer was used to measure the strain of FRC within the testing region of the specimen.
The specimens were subjected to incremental repeated compressive loading, which involved loading, unloading, reloading, etc. Six different loading steps were applied based on the specimens’ determined behavior under compressive loading. Each loading step level was meticulously chosen, following similar works from the extant literature, to generate progressively increasing damage in FRC specimens [56,57]. The first four loading steps were established as a percentage of the specimen’s estimated maximum strength. These stages correspond to the elastoplastic region and are identified as the ELASTIC, MID, UP, and MAX levels. The material is within its elastic stage during the initial loading step, corresponding to 40% of the maximum compressive strength (σmax), and thus is designated as ELASTIC. Subsequently, the MID level, which denotes the intermediate loading level of the ascending stress–strain curve, is approximately equivalent to 60% of the σmax. The UP level is positioned at the upper segment of the ascending stress–strain curve, roughly correlating to 85% of σmax. Finally, the MAX level signifies the peak compressive strength that the material can endure. Additionally, the fifth and sixth loading steps, known as SOFT and UD, respectively, correspond to the rupture zone and are determined based on the estimated ultimate deformation. The SOFT level is at the softened descending stress–strain segment, while the UD represents the ultimate damage state point. Within these loading steps, it is anticipated that the FRC specimen will accumulate damage due to the propagation of cracks throughout its structure, leading to a decrease in its bearing capacity and the development of significant plastic deformation. Figure 2 schematically illustrates the loading sequence adopted.

2.4. Damage Identification Process

This study focuses on EMI-based damage identification of FRCs. According to the EMI method, crack formation degrades the FRC’s mechanical impedance, which is reflected in the electrical response of the PZT sensor. Therefore, in the context of structural health monitoring of FRCs, the PZT’s EMI response is routinely recorded within a specified excitation frequency range. Consequently, any alteration in the PZT’s EMI response indicates the emergence of damage in the form of cracks within the FRC.
An extensive amount of literature demonstrates that the EMI method typically utilizes statistical indices to assess and quantify the variations in EMI responses induced by the onset of damage in the surrounding area sensor. Recently, Perera et al. introduced a hierarchical clustering approach for the prompt detection of Fiber-Reinforced Polymers debonding through the variation in PZT’s EMI responses [47,58]. This research examines the feasibility of using the HCA to identify damage induced by repeated compression loading in FRC. Hierarchical clustering constitutes an unsupervised machine learning algorithm that delineates a hierarchy of clusters predicated upon a predetermined metric distance. This study investigates several metric distances, such as Cosine, Correlation, Squared Euclidean, Euclidean, Minkowski, Cityblock, and Chebychev. Subsequently, the metric demonstrating a superior Cophenetic Correlation Coefficient (CCC) is selected, and a dendrogram is employed to visually illustrate the distinct clustering phases, thereby categorizing the dissimilarity among the resulting groups. The CCC was computed according to the following Equation (1):
C C C = s < t d s t d ¯ d s t c o p h d ¯ c o p h s < t d s t d ¯ 2 s < t d s t c o p h d ¯ c o p h 2
In this context, d s t signifies the distance, as measured by the selected metric, between each pair of observations, denoted as s and t. Furthermore, d s t c o p h represents the cophenetic distances, elucidating the group’s dissimilarity when the observations s and t first converge into the same cluster.
The fundamental hypothesis underlying the implementation of HCA in this study posits that the measurements obtained from the PZT transducer after each loading step are anticipated to exhibit analogous behavior unless damage is sustained. The HCA quantifies the dissimilarity between the EMI responses based on the selected metric distance. In this study, we selected the dendrogram to illustrate the hierarchical structure of each individual PZT response. In the dendrogram, measurements exhibiting the highest degree of similarity are interconnected by Π-shaped lines, where the height of the link represents their dissimilarity. As a result, vigorous growth of the dissimilarity degree of an EMI response indicates the emergence of damage during the corresponding loading step. Consequently, the hierarchical structure dictates the configuration of the EMI measurement along the horizontal axis of the dendrogram.
As mentioned in Section 2.3, three PZT transducers were attached to each FRC specimen with epoxy. Additionally, three WiAMS captured the EMI response of each PZT transducer under various damage conditions, as depicted in Figure 1. The WiAMS system was initially developed by Providakis et al. and has been utilized in numerous studies within the broader literature [59]. Each WiAMS device records the EMI response of a PZT transducer within a predetermined frequency range, established explicitly at 10–250 kHz with a resolution of 1 kHz. Before the commencement of the experimental process, the devices are set to implement three-round measurements in pristine condition to assure the functionality, fidelity, and repeatability of the SHM pre-process scheme. The acquired EMI responses of the PZTs were subsequently stored in an online database for post-processing purposes.
As previously indicated, the EMI method facilitates the identification of damage formation by analyzing the alterations it induces in the response of an affixed PZT sensor. Consequently, the EMI response of each PZT patch in the pristine state of the specimens has been recorded and designated as healthy. Subsequently, after completing the loading-unloading procedure for every step, the WiAMS measured the EMI responses of the PZT sensors, as depicted in Figure 2. Thus, any load-induced alterations to the EMI responses are considered negligible, and the proposed SHM scheme has identified only the irreversible damage sustained by FRC.

3. Results

This section presents the experimental results of three FRC specimens, as outlined in Section 2. It first examines the mechanical response under repeated compression loading and the resulting cracking patterns. This is followed by a thorough analysis of the damage detection outcomes obtained from the HCA of the EMI responses of PZT sensors for each specimen individually.

3.1. Specimen 1

3.1.1. Compression Behavior of Specimen 1

The mechanical response of Specimen 1 under repeated compressive loading is illustrated in Figure 3a through stress–strain curves. The horizontal axis represents the imposed strain, while the vertical axis represents the corresponding compressive stress. The FRC standard cylinder exhibited peak compressive stress of 38.5 MPa during the MAX loading phase, at which point surface cracks became evident. Subsequently, Specimen 1 demonstrated a notable decline in bearing capacity, which was observed during the final two loading steps. However, the discrete fibers sustained the width of the cracks, as illustrated in Figure 3b. The surface cracks initially manifested in the upper region of Specimen 1 and extended toward the lower area of the specimen during the rupture loading phase, leading to a swift deterioration of its bearing capacity without the desirable ductile behavior of FRC.
During the initial loading phase, minimal cracking occurred without the presence of visible surface fissures. Subsequently, during the loading step labeled “MAX,” the initial visible cracks emerged. However, the direct unloading of specimens prior to the onset of substantial plastic deformation inhibited critical cracks from progressing further in width during this loading step. In the fifth and sixth loading steps, new cracks developed in the surface of the specimen until the fatal crack propagated along the height of the cylinder, resulting in the loss of bearing capacity of the FRC. The combined effect of the well-spread fibers in the concrete matrix and repeated compression loading caused extensive micro-cracking in the specimens, as illustrated in Figure 3b. Furthermore, Specimen 1 exhibited initial crack formation in its upper regions, which progressed to the lower area and ultimately resulted in a fatal outcome.

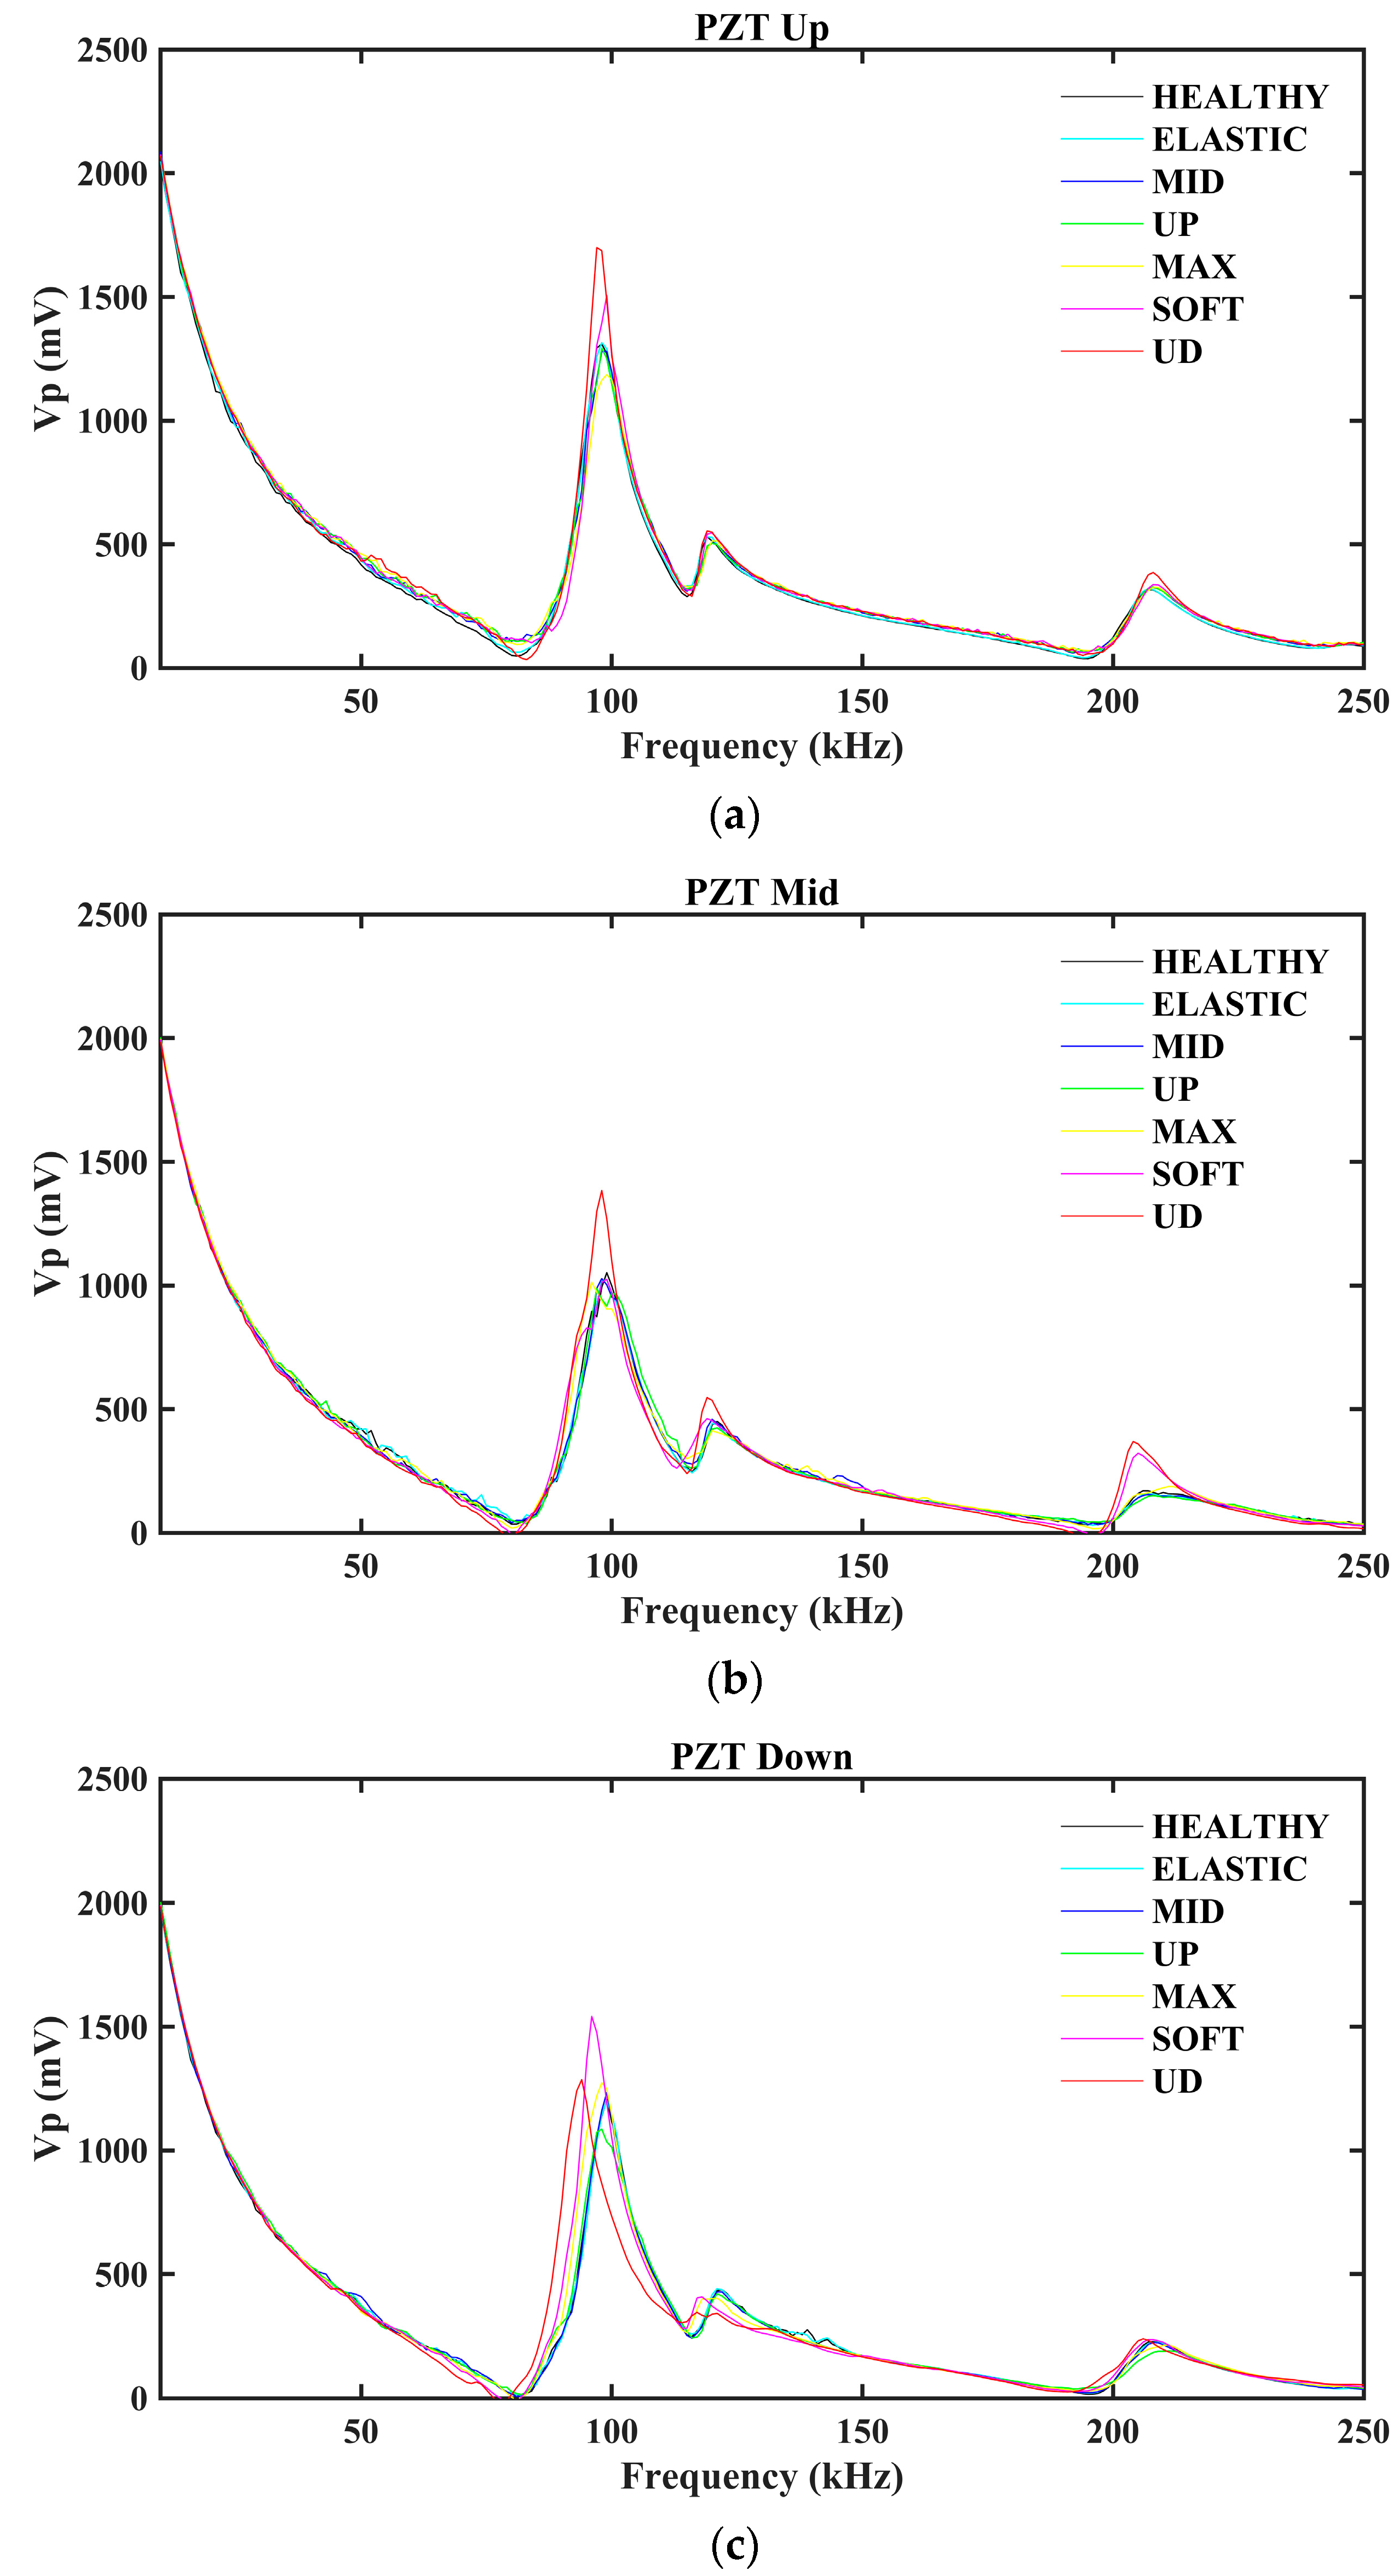
3.1.2. PZTs EMI Responses of Specimen 1

The EMI responses of the epoxy-bonded PZTs of Specimen 1 are illustrated in Figure 4. As previously indicated, the EMI response of each PZT transducer was measured subsequent to the conclusion of each loading step within the frequency range of 10 to 250 kHz. In accordance with the observed cracking pattern, the EMI responses of the PZT Up and PZT Mid exhibited a leftward shift during the maximum loading phase, which was subsequently further shifted in the ensuing steps, as shown in Figure 4a and Figure 4b, respectively. In contrast, the PZT Down (Figure 4c) demonstrated a latency in its shifting, which occurred during the SOFT and UD loading steps. This phenomenon is attributed to the formation of cracks in the specimen’s upper region, which propagate to the lower region of Specimen 1.

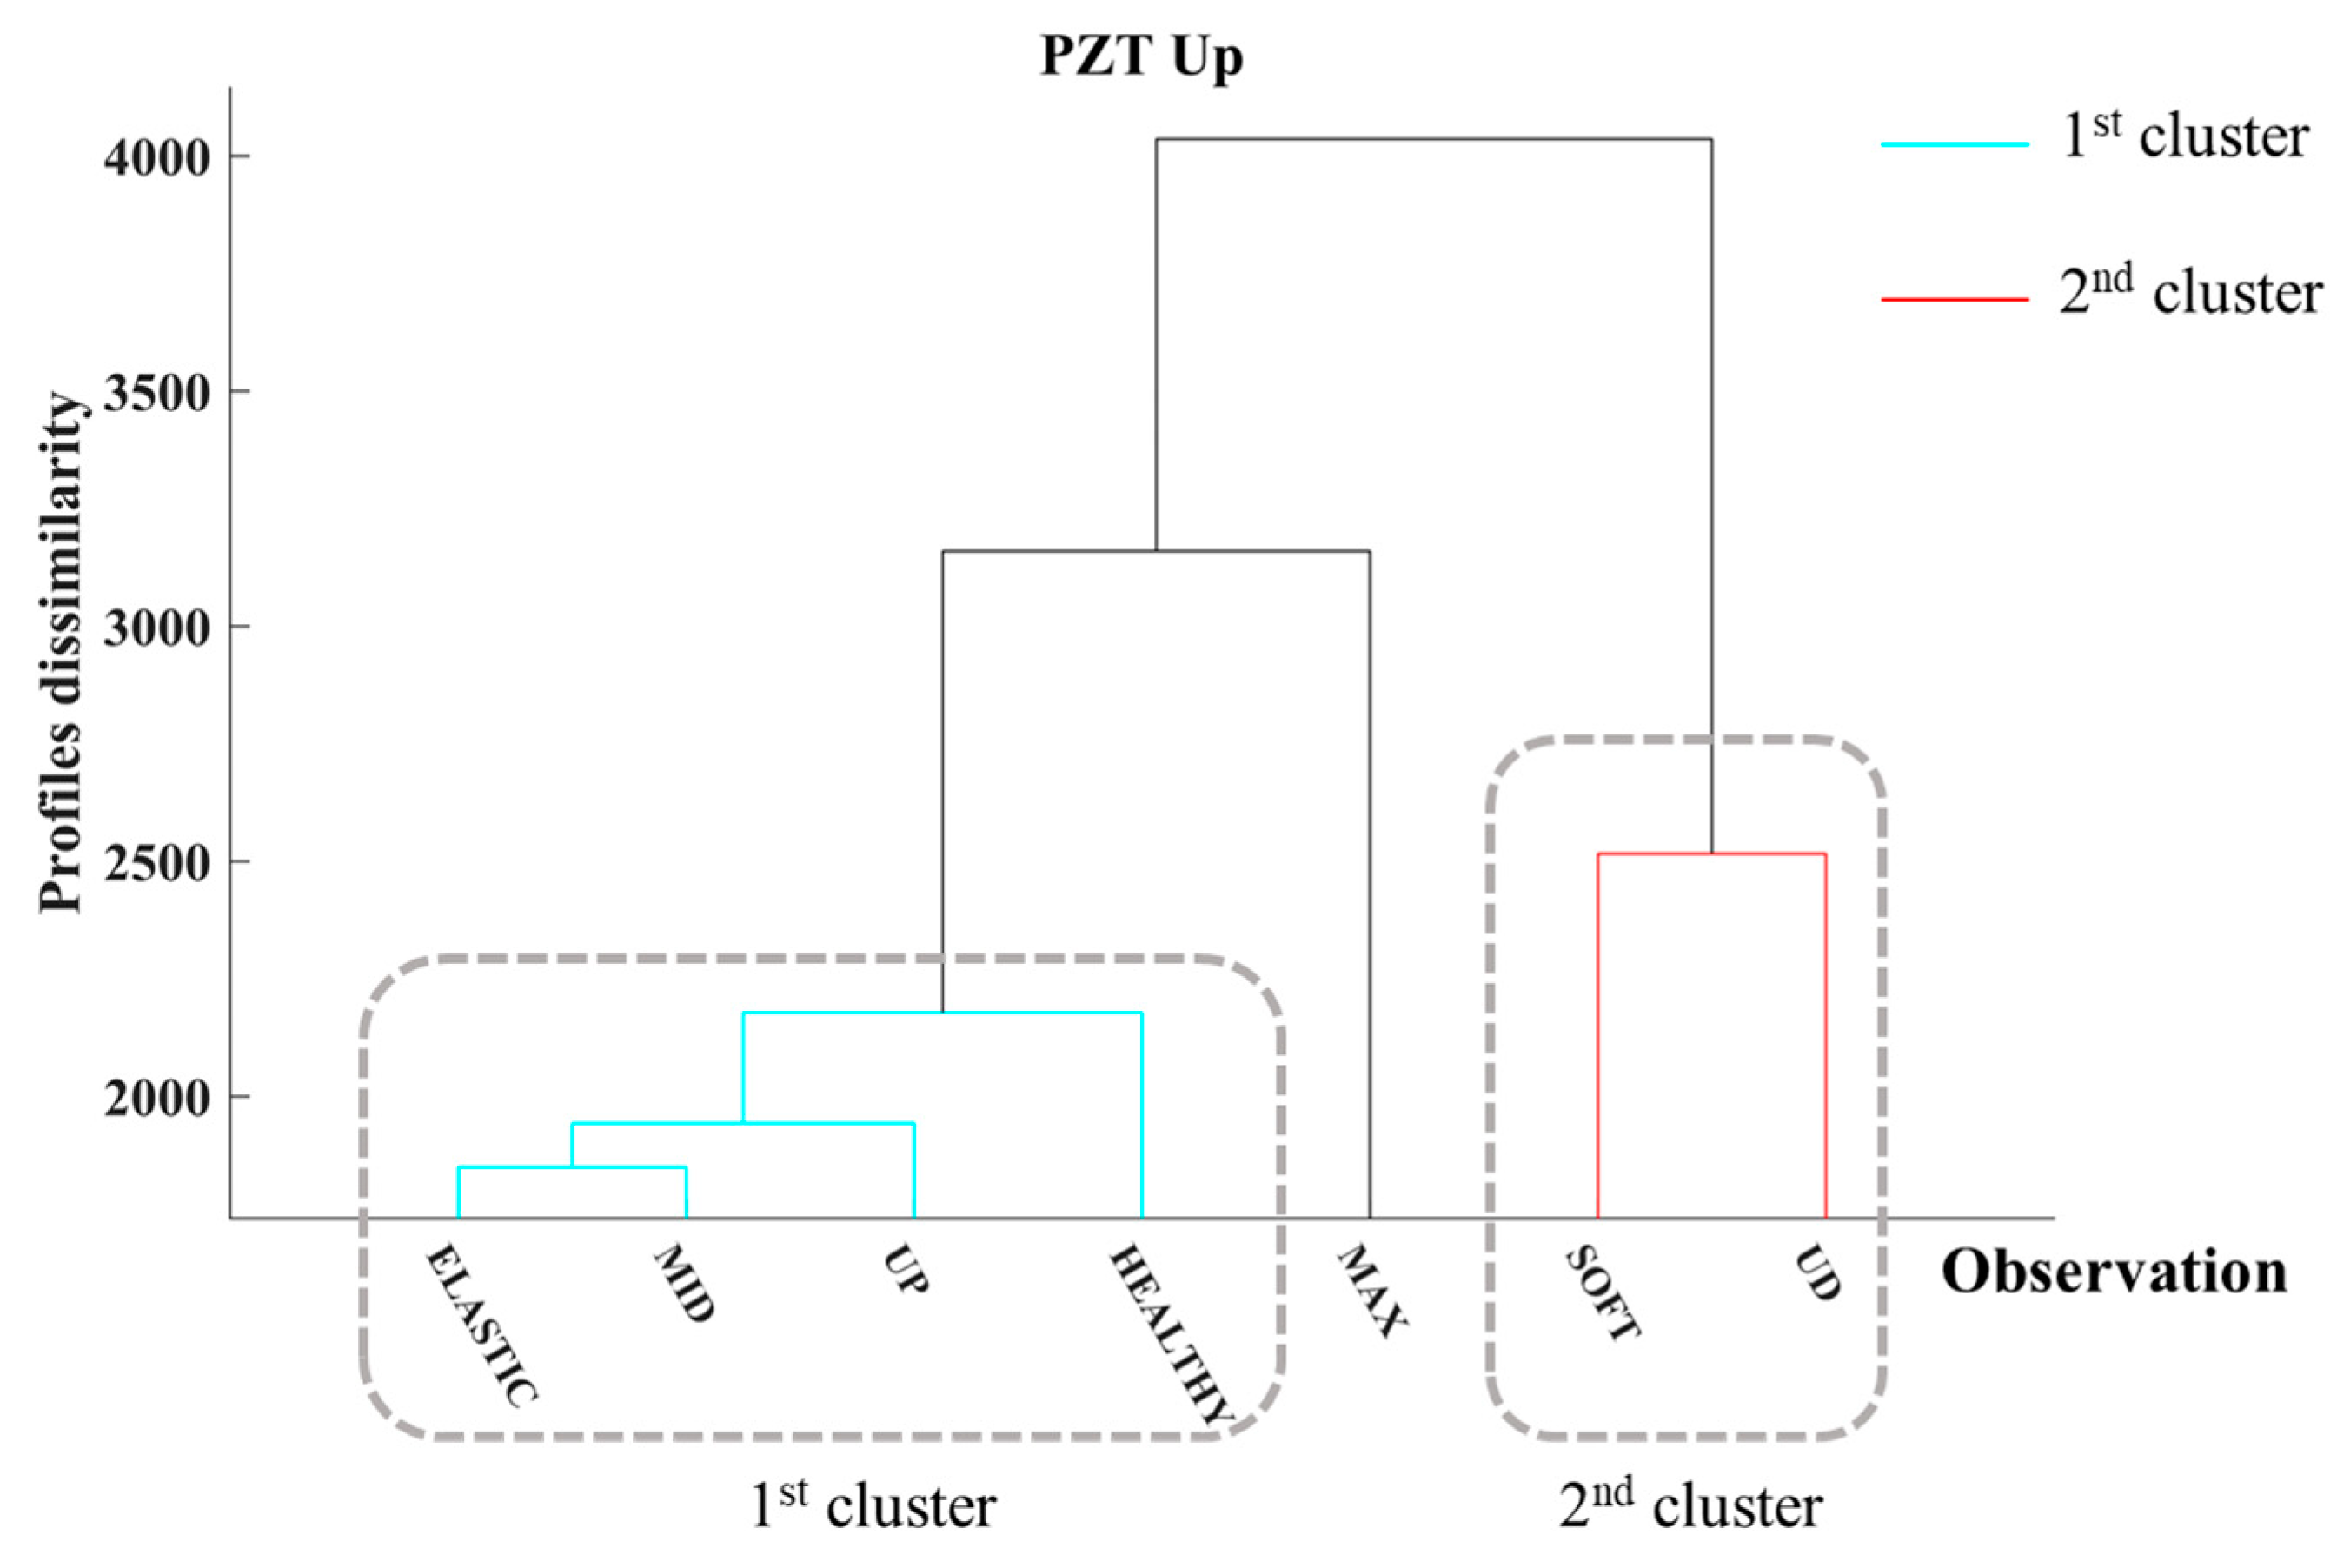
3.1.3. Damage Identification of Specimen 1

As previously mentioned, the CCC quantifies the extent to which a dendrogram accurately preserves the original pairwise distances between modeled data points and reflects how precisely the dendrogram represents the distinctions among observations. Thus, the metric distances with the higher CCC values were used to identify FRC damage. Figure 5 presents the CCC values acquired from all the PZTs of Specimen 1 across the various metric distances assessed in this study. According to Perera et al., CCC values surpassing 0.7 indicate a strong fit for a cluster [47]. Figure 5 underscores the robustness of the HCA for Specimen 1, with CCC values fluctuating between 0.89 and 0.99 across the three PZTs and the analyzed distance metrics.
This study presents the HCA results for each PZT transducer individually using dendrograms. The dendrograms illustrate the multilevel hierarchy of the EMI response observations, measured at the end of each loading step. Figure 6 depicts a dendrogram of the EMI responses of PZT Up, where two clusters formed according to HCA. The first cluster, which is illustrated using red lines, contains the EMI responses of PZT Up in the healthy condition and the observations captured at the end of the ELASTIC, MID, and UP loading steps. The EMI measurements captured at the end of the SOFT and the UD loading steps form the second cluster, which is depicted in cyan. The EMI response of the MAX loading step appears to be in a transitional structural state, reflecting the formation of severe cracking on the specimen’s surface. The HCA promptly identified the surface cracking development in the neighborhood of PZT Up. Further, HCA distinguishes the structural state of the FRC in three states based on the variations in EMI responses of PZT Up.
Additionally, Figure 7 depicts the dendrogram of PZT Mid, where HCA separates its EMI responses into two clusters. Consistent with the PZT Up, the initial cluster comprises the EMI responses of the PZT Mid, extending until the UP loading steps, which are depicted in red. Conversely, the second cluster, depicted in cyan, encompasses the final two loading steps. Compared to the PZT Up, the EMI response observed during the MAX loading phase exhibits diminished levels of dissimilarity relative to the initial clustering; however, it also indicates that the specimen resides in a transitional structural condition. This outcome may be attributed to the diminished cracking severity observed in the monitoring area of PZT Mid. However, the HCA was able to identify the accumulation of damage to the FRC throughout the loading sequence.
Finally, Figure 8 illustrates the dendrogram of the last PZT for Specimen 1, PZT Down. In this dendrogram, HCA separates the EMI responses into two clusters, showing a significant degree of dissimilarity between them. In contrast to the previously discussed PZTs, the first cluster, depicted in cyan, includes the first five observations prior to the MAX loading step. Additionally, the second cluster comprises the EMI responses recorded after the SOFT and UD loading steps, as illustrated in red. Consequently, the results from PZT Down indicate that significant cracking occurred during the SOFT loading step within the PZT Down monitoring area. This aligns with the cracking pattern observed in the specimen, where surface cracks initially developed in the upper region and propagated to the lower region of the specimen. Thus, the proposed approach effectively identifies FRC’s load-induced damage in terms of severe cracking. Furthermore, it suggests that implementing a network of PZT sensors can facilitate the localization of areas where significant damage has transpired.

3.2. Specimen 2

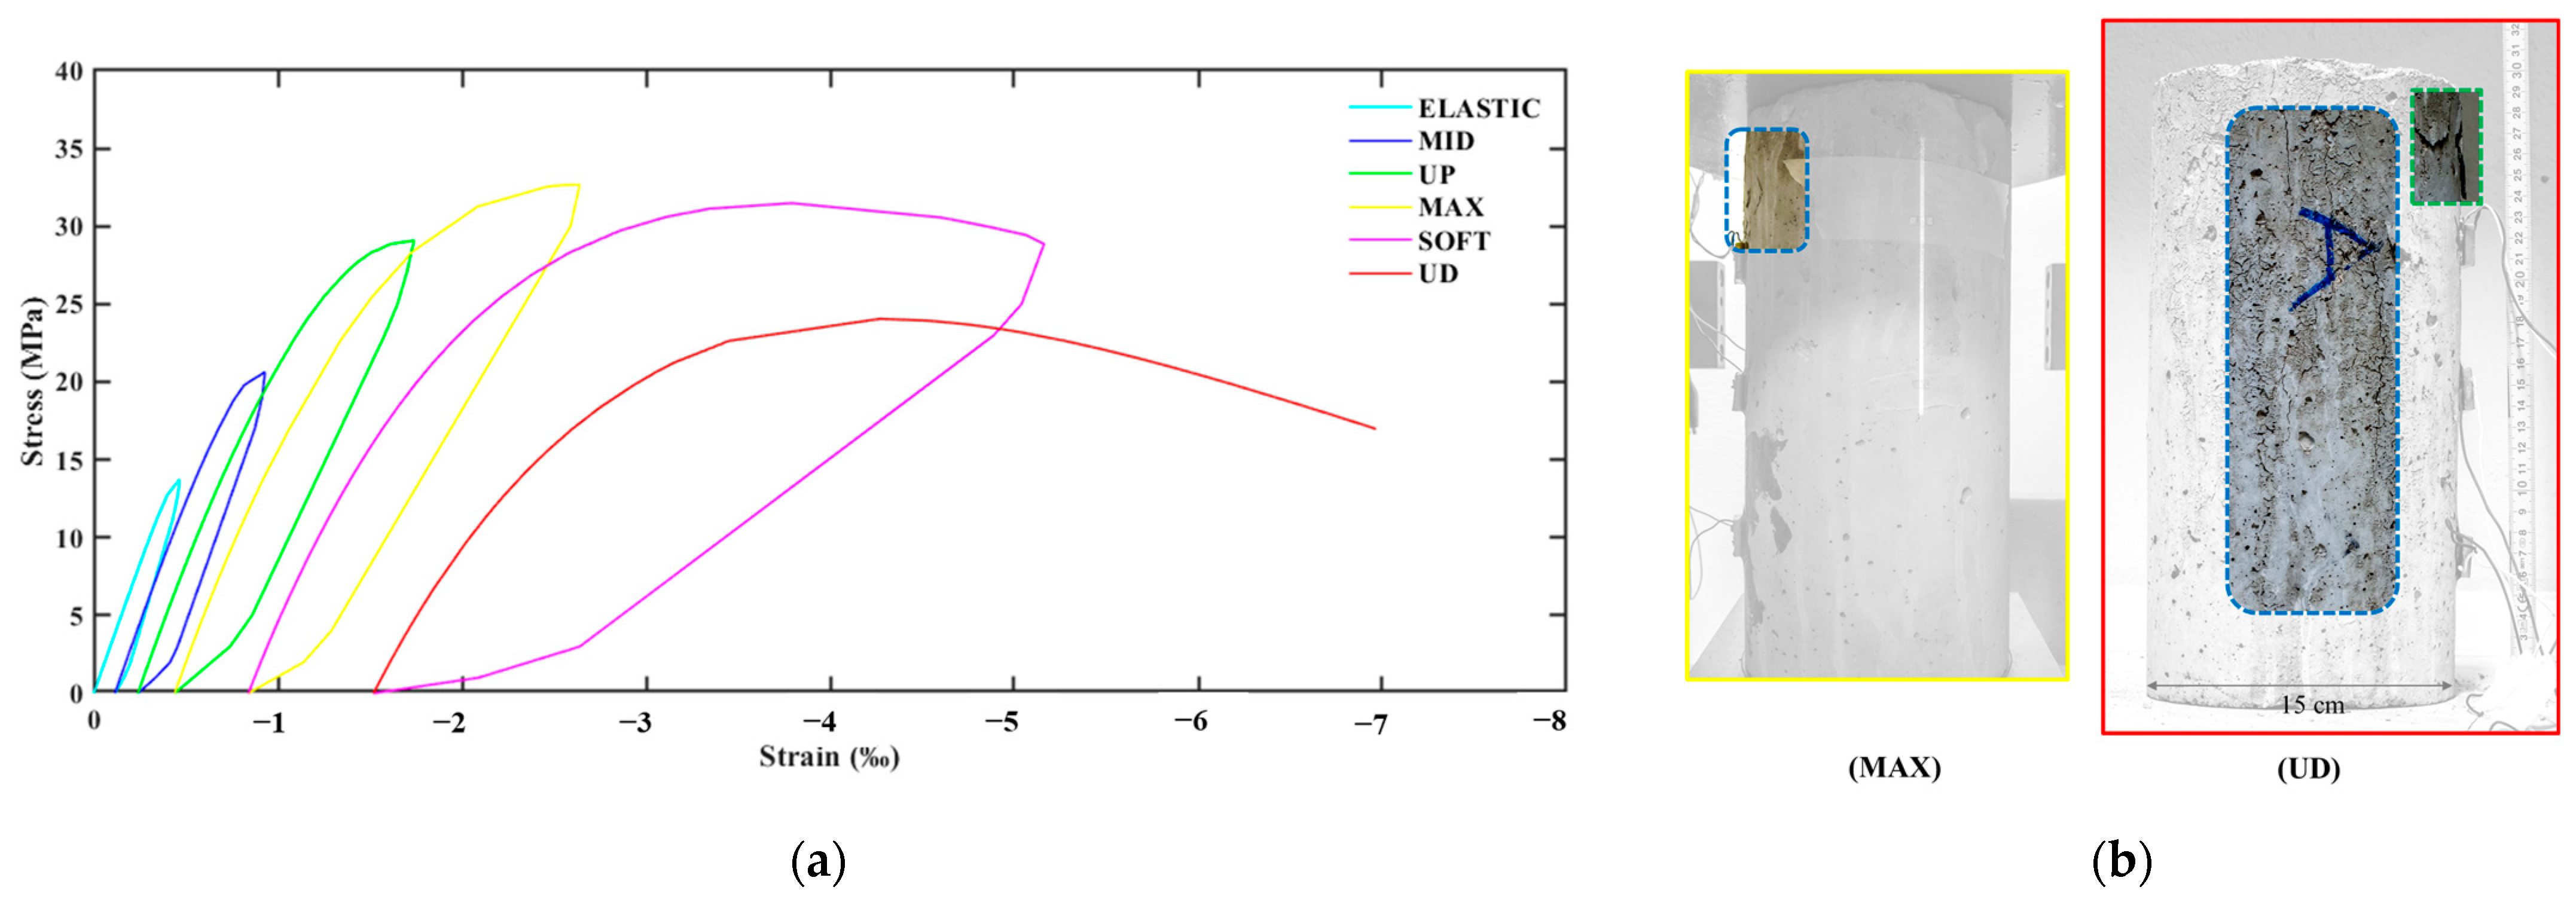
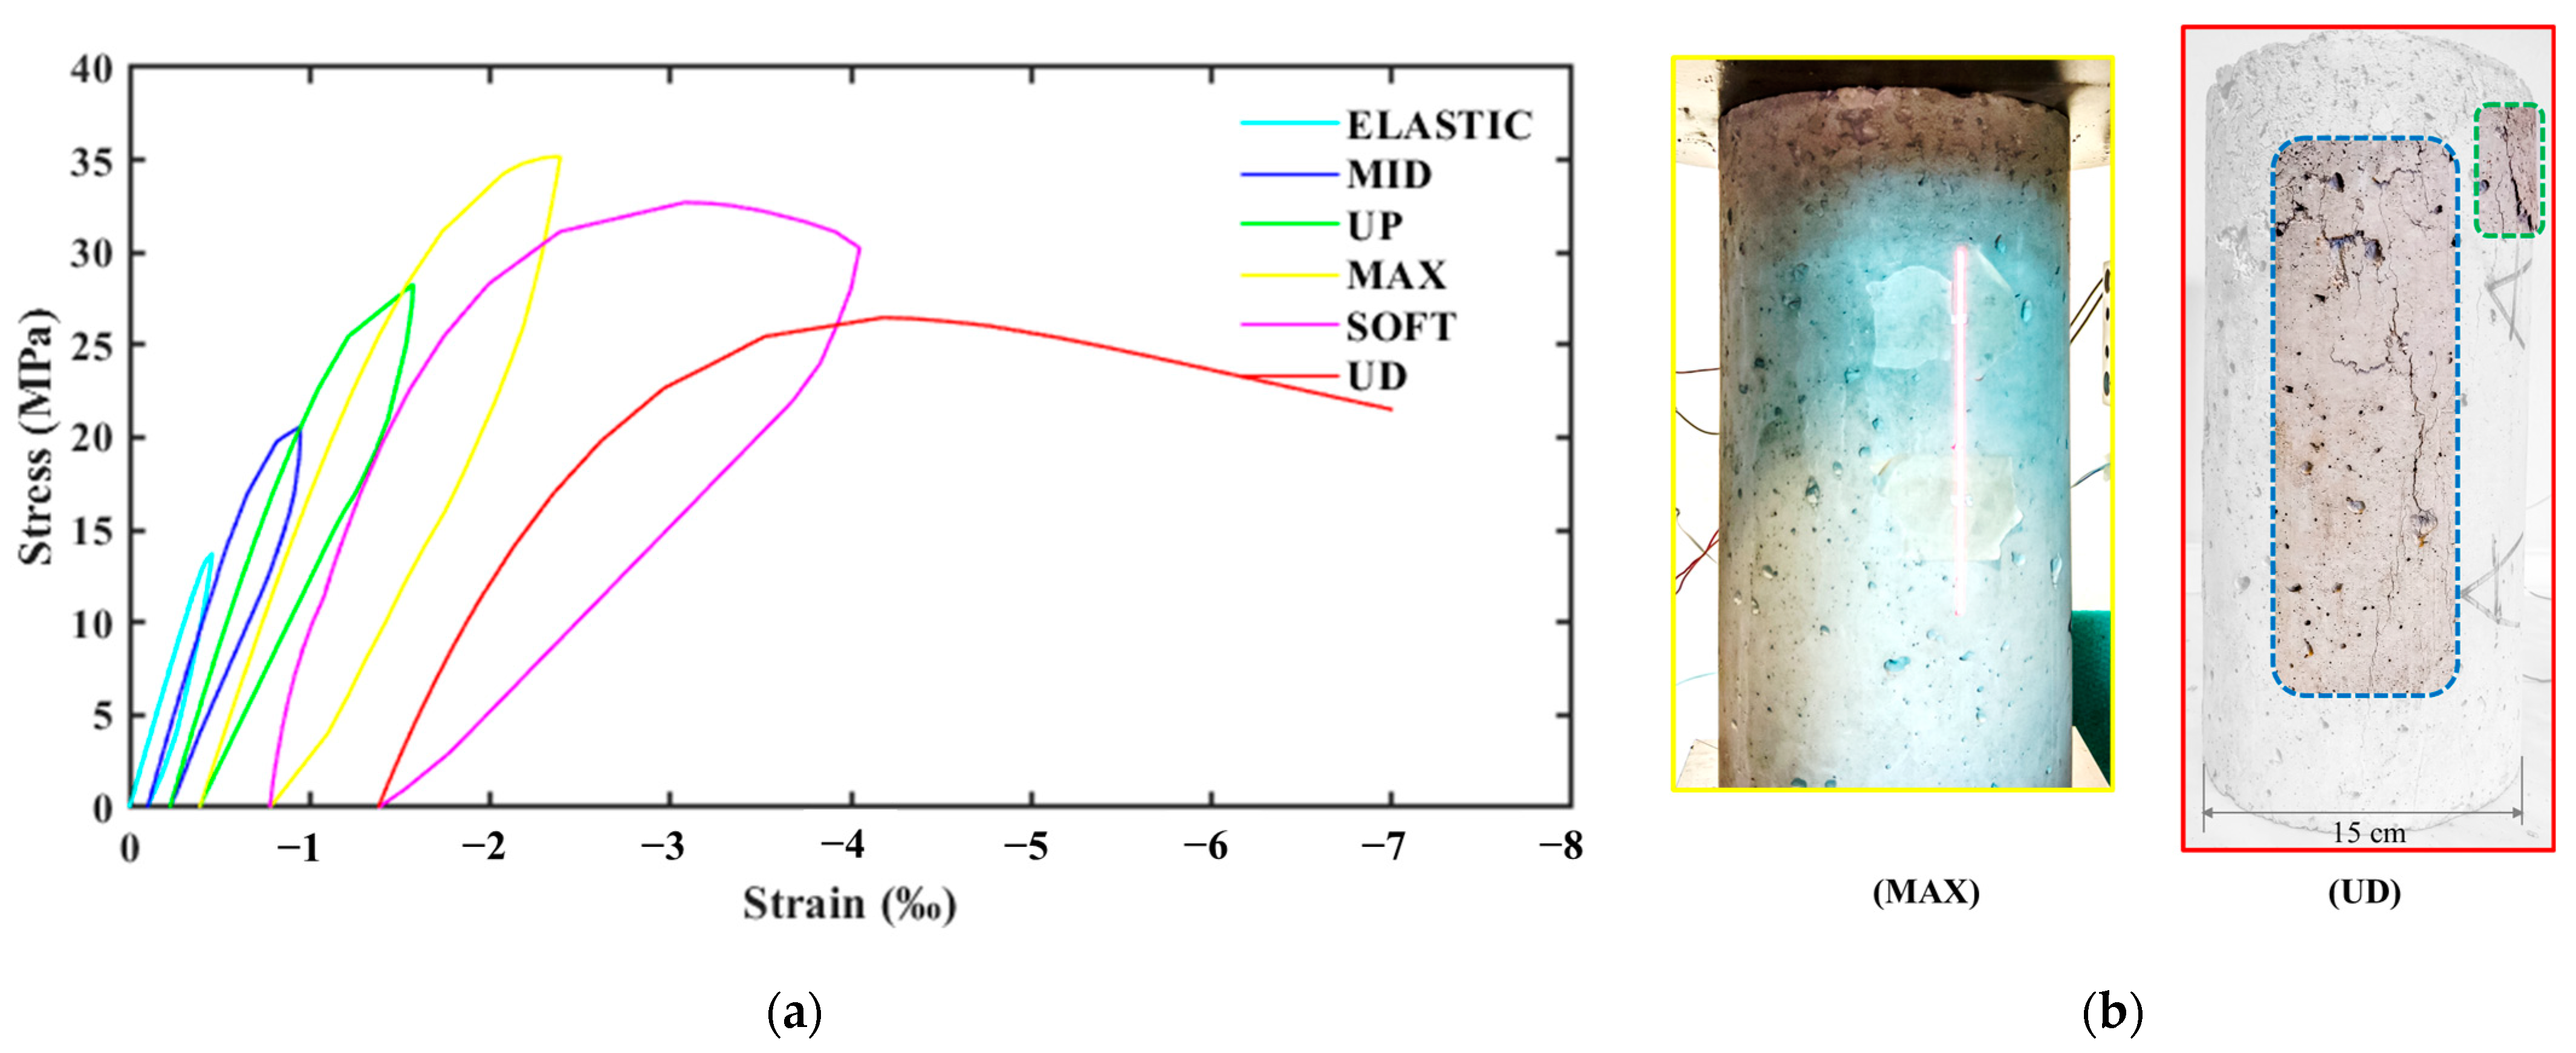
3.2.1. Compression Behavior of Specimen 2

The stress–strain compressive behavior of Specimen 2 is illustrated in Figure 9a. In contrast to Specimen 1, Specimen 2 achieved a peak stress of 32.5 MPa, accompanied by a pseudo-ductile mechanical response, thanks to the incorporation of district fibers within the concrete matrix. Consequently, the integration of macro-synthetic fibers resulted in a significant enhancement of both the ductility and deformation capacity of the FRC in Specimen 2. Similarly to Specimen 1, the visual surface emerged during the MAX loading step in the upper region of the specimen. Subsequently, during the final two loading stages, Specimen 2 exhibited cracks extending towards the specimen’s lower area; however, the fibers restrained the cracks’ width, enhancing the FRC’s deformability.

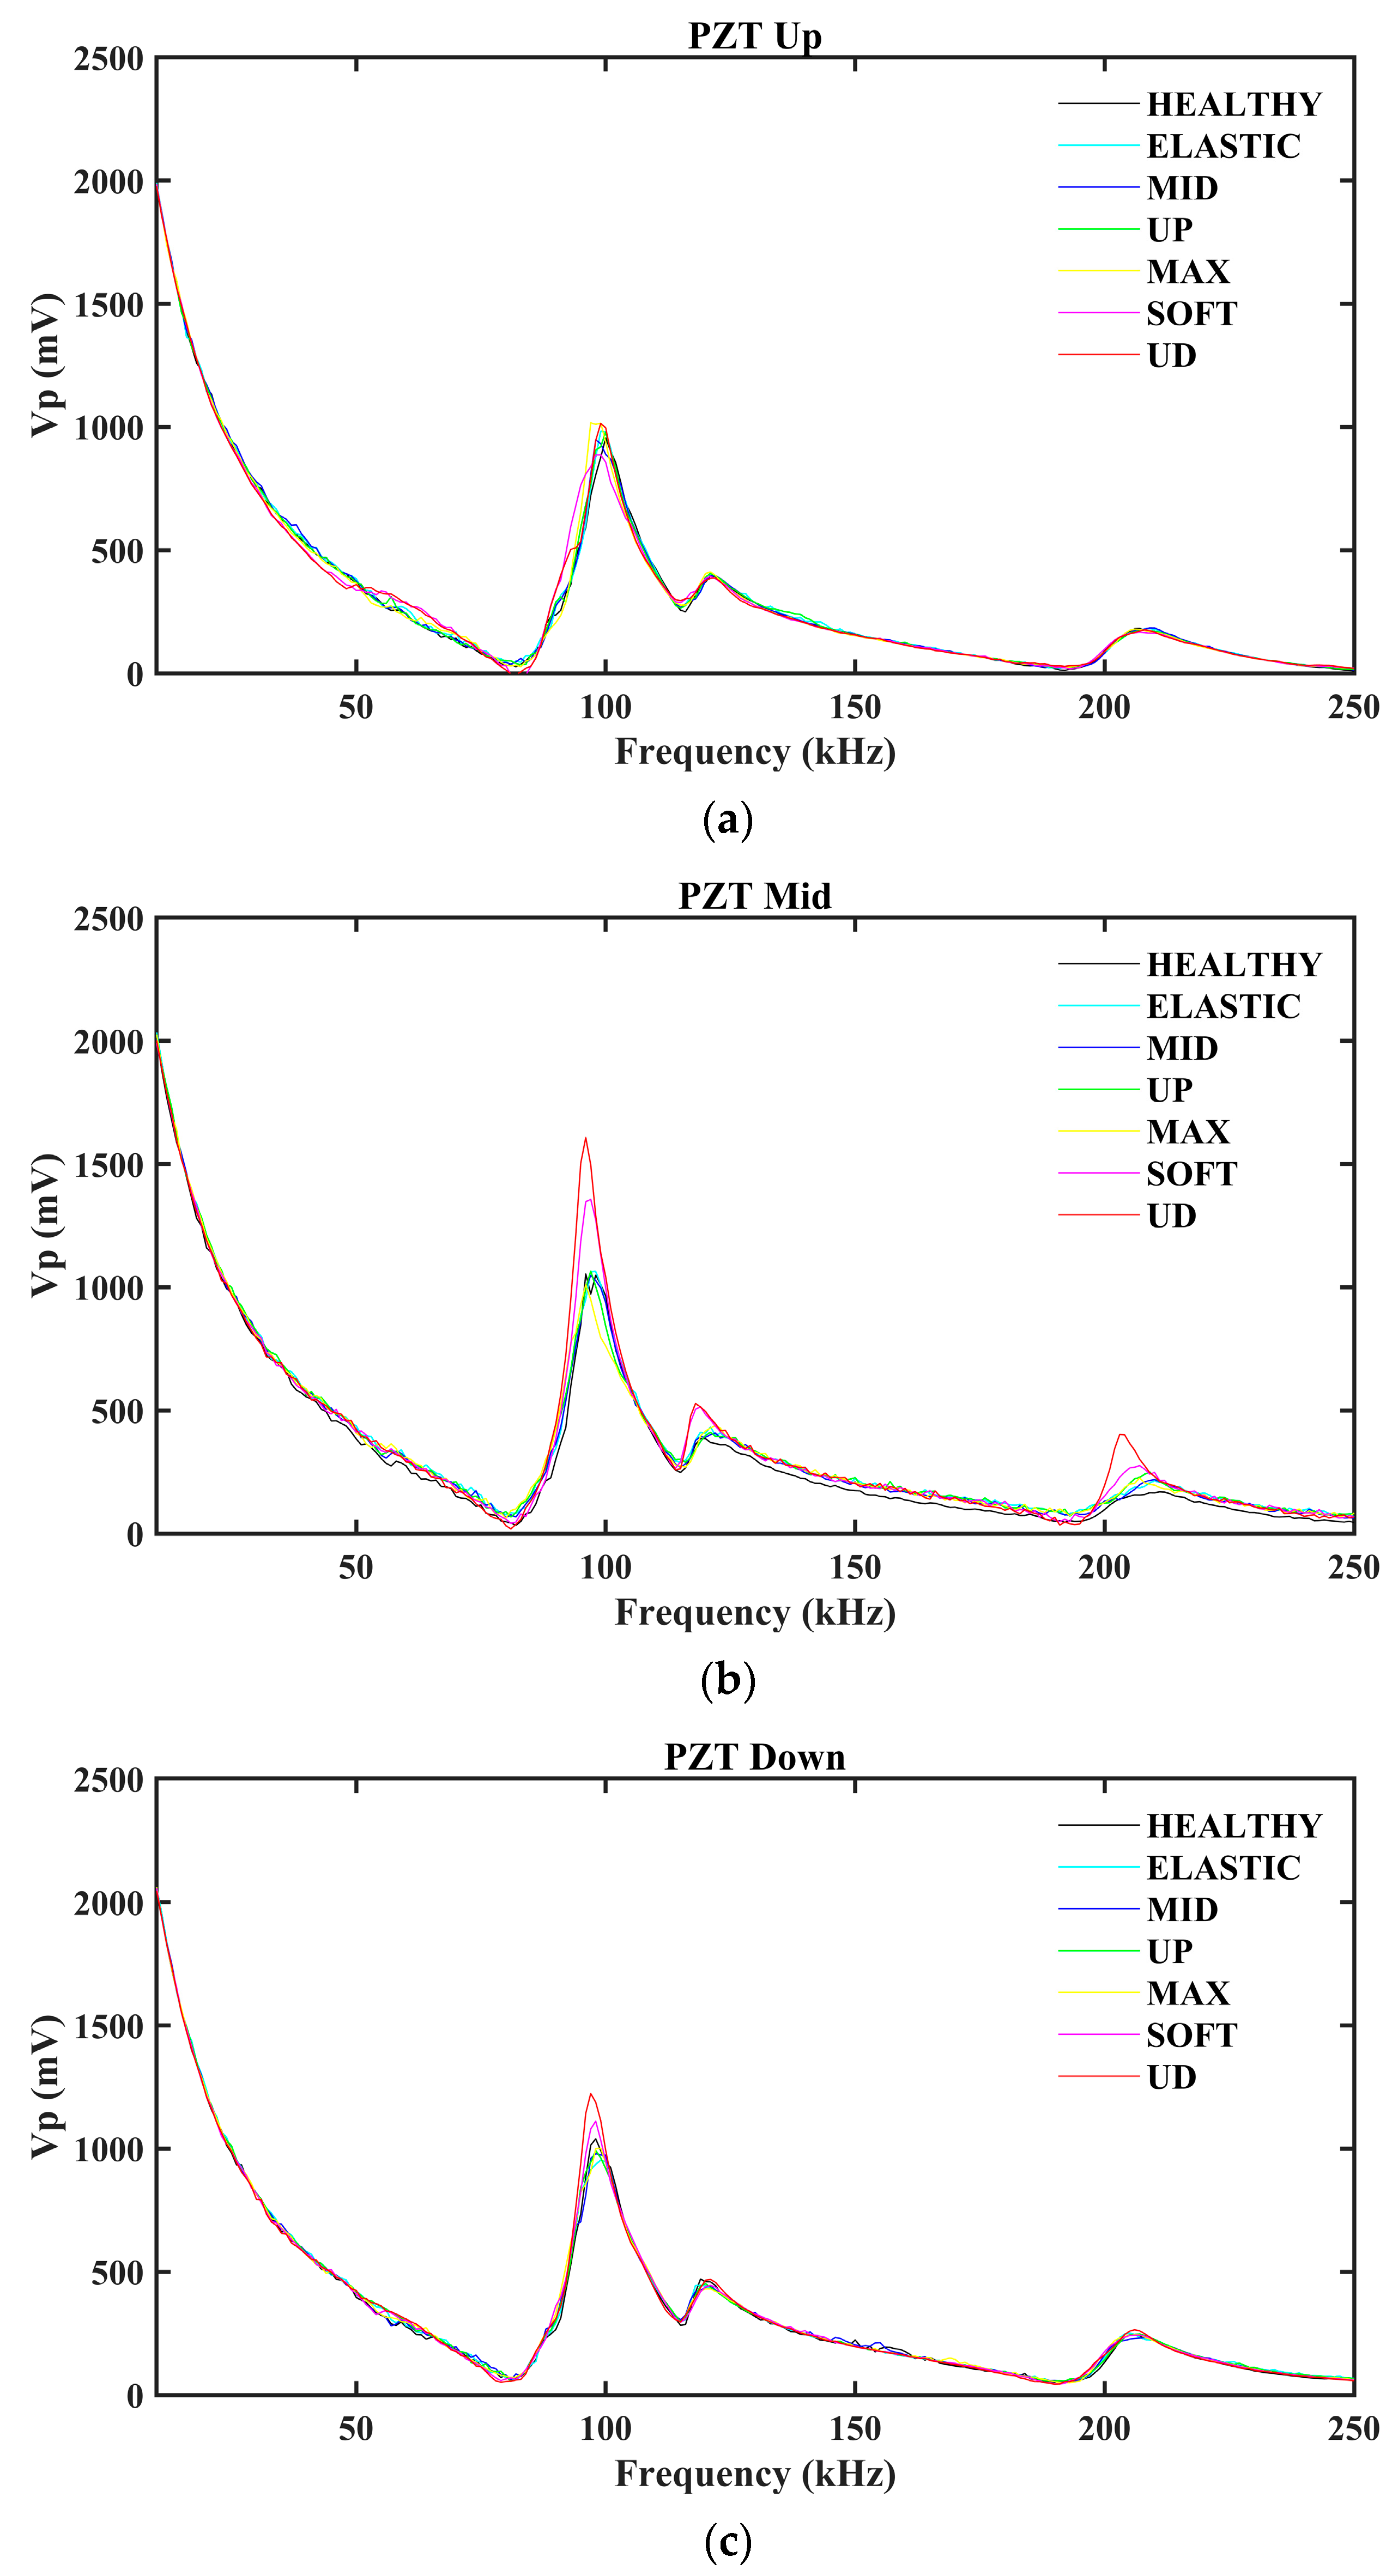
3.2.2. PZTs EMI Responses of Specimen 2

Additionally, the EMI responses of the Specimen’s 2 PZT transducers are illustrated in Figure 10. Specifically, Figure 10a depicts the EMI responses of PZT Up throughout the loading sequence. Although the EMI response of PZT Up does not show the typical shifting, there is an apparent alteration in the EMI responses, especially in the final loading steps. In contrast, the EMI response of PZT Mid, as depicted in Figure 10b, exhibits a significant peak shift during the SOFT loading phase, which is further altered during the UD loading phase. Similarly, the EMI response of PZT Down demonstrates a more gradual peak shift, as illustrated in Figure 10c.

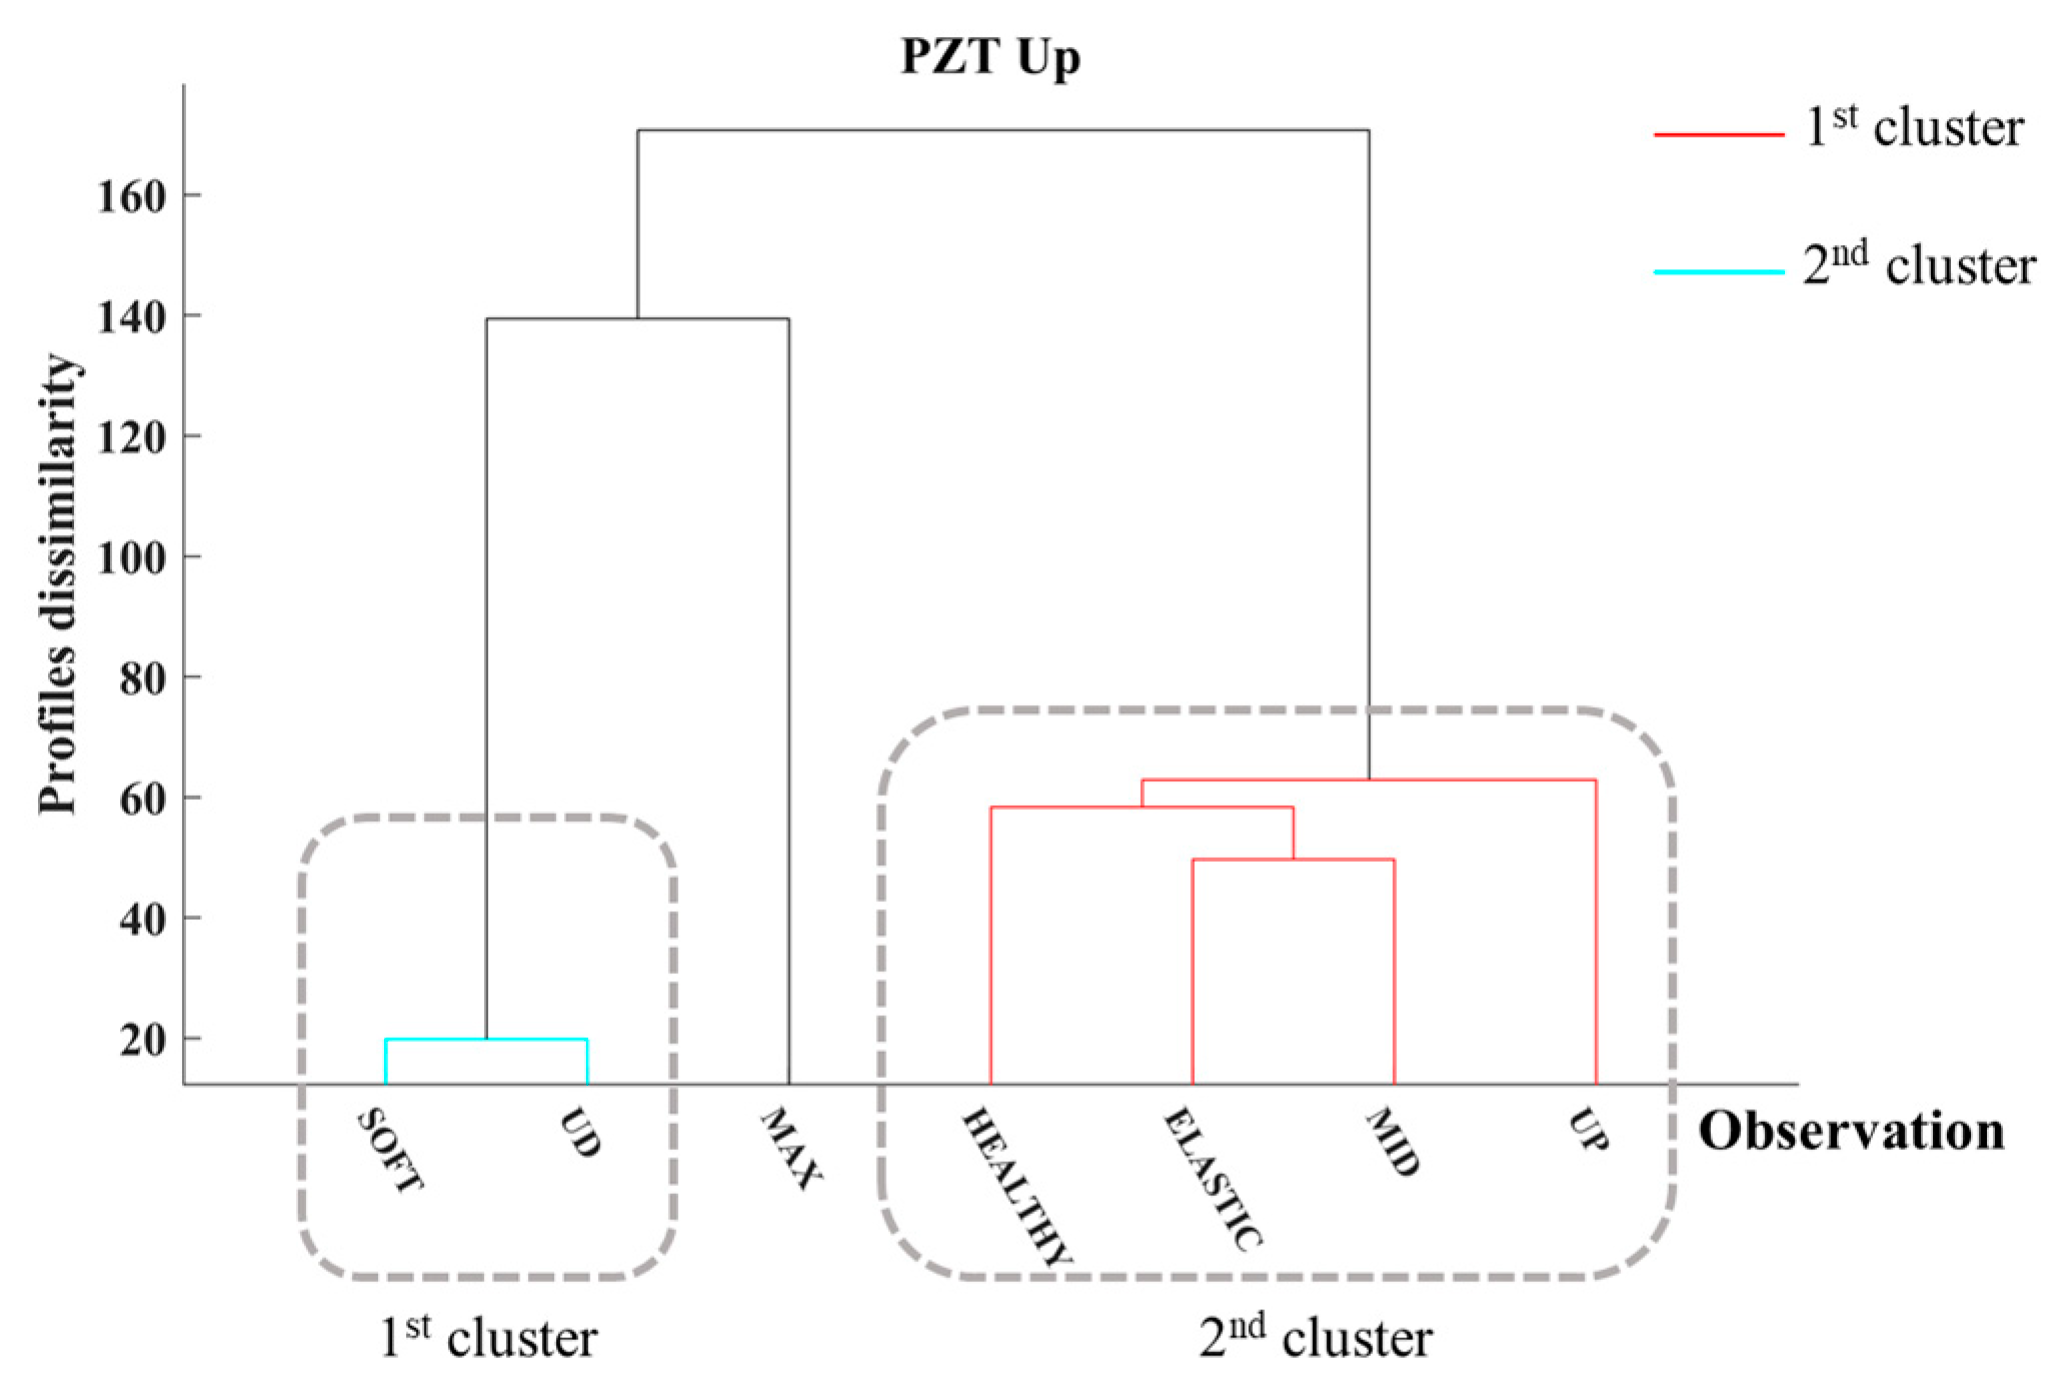
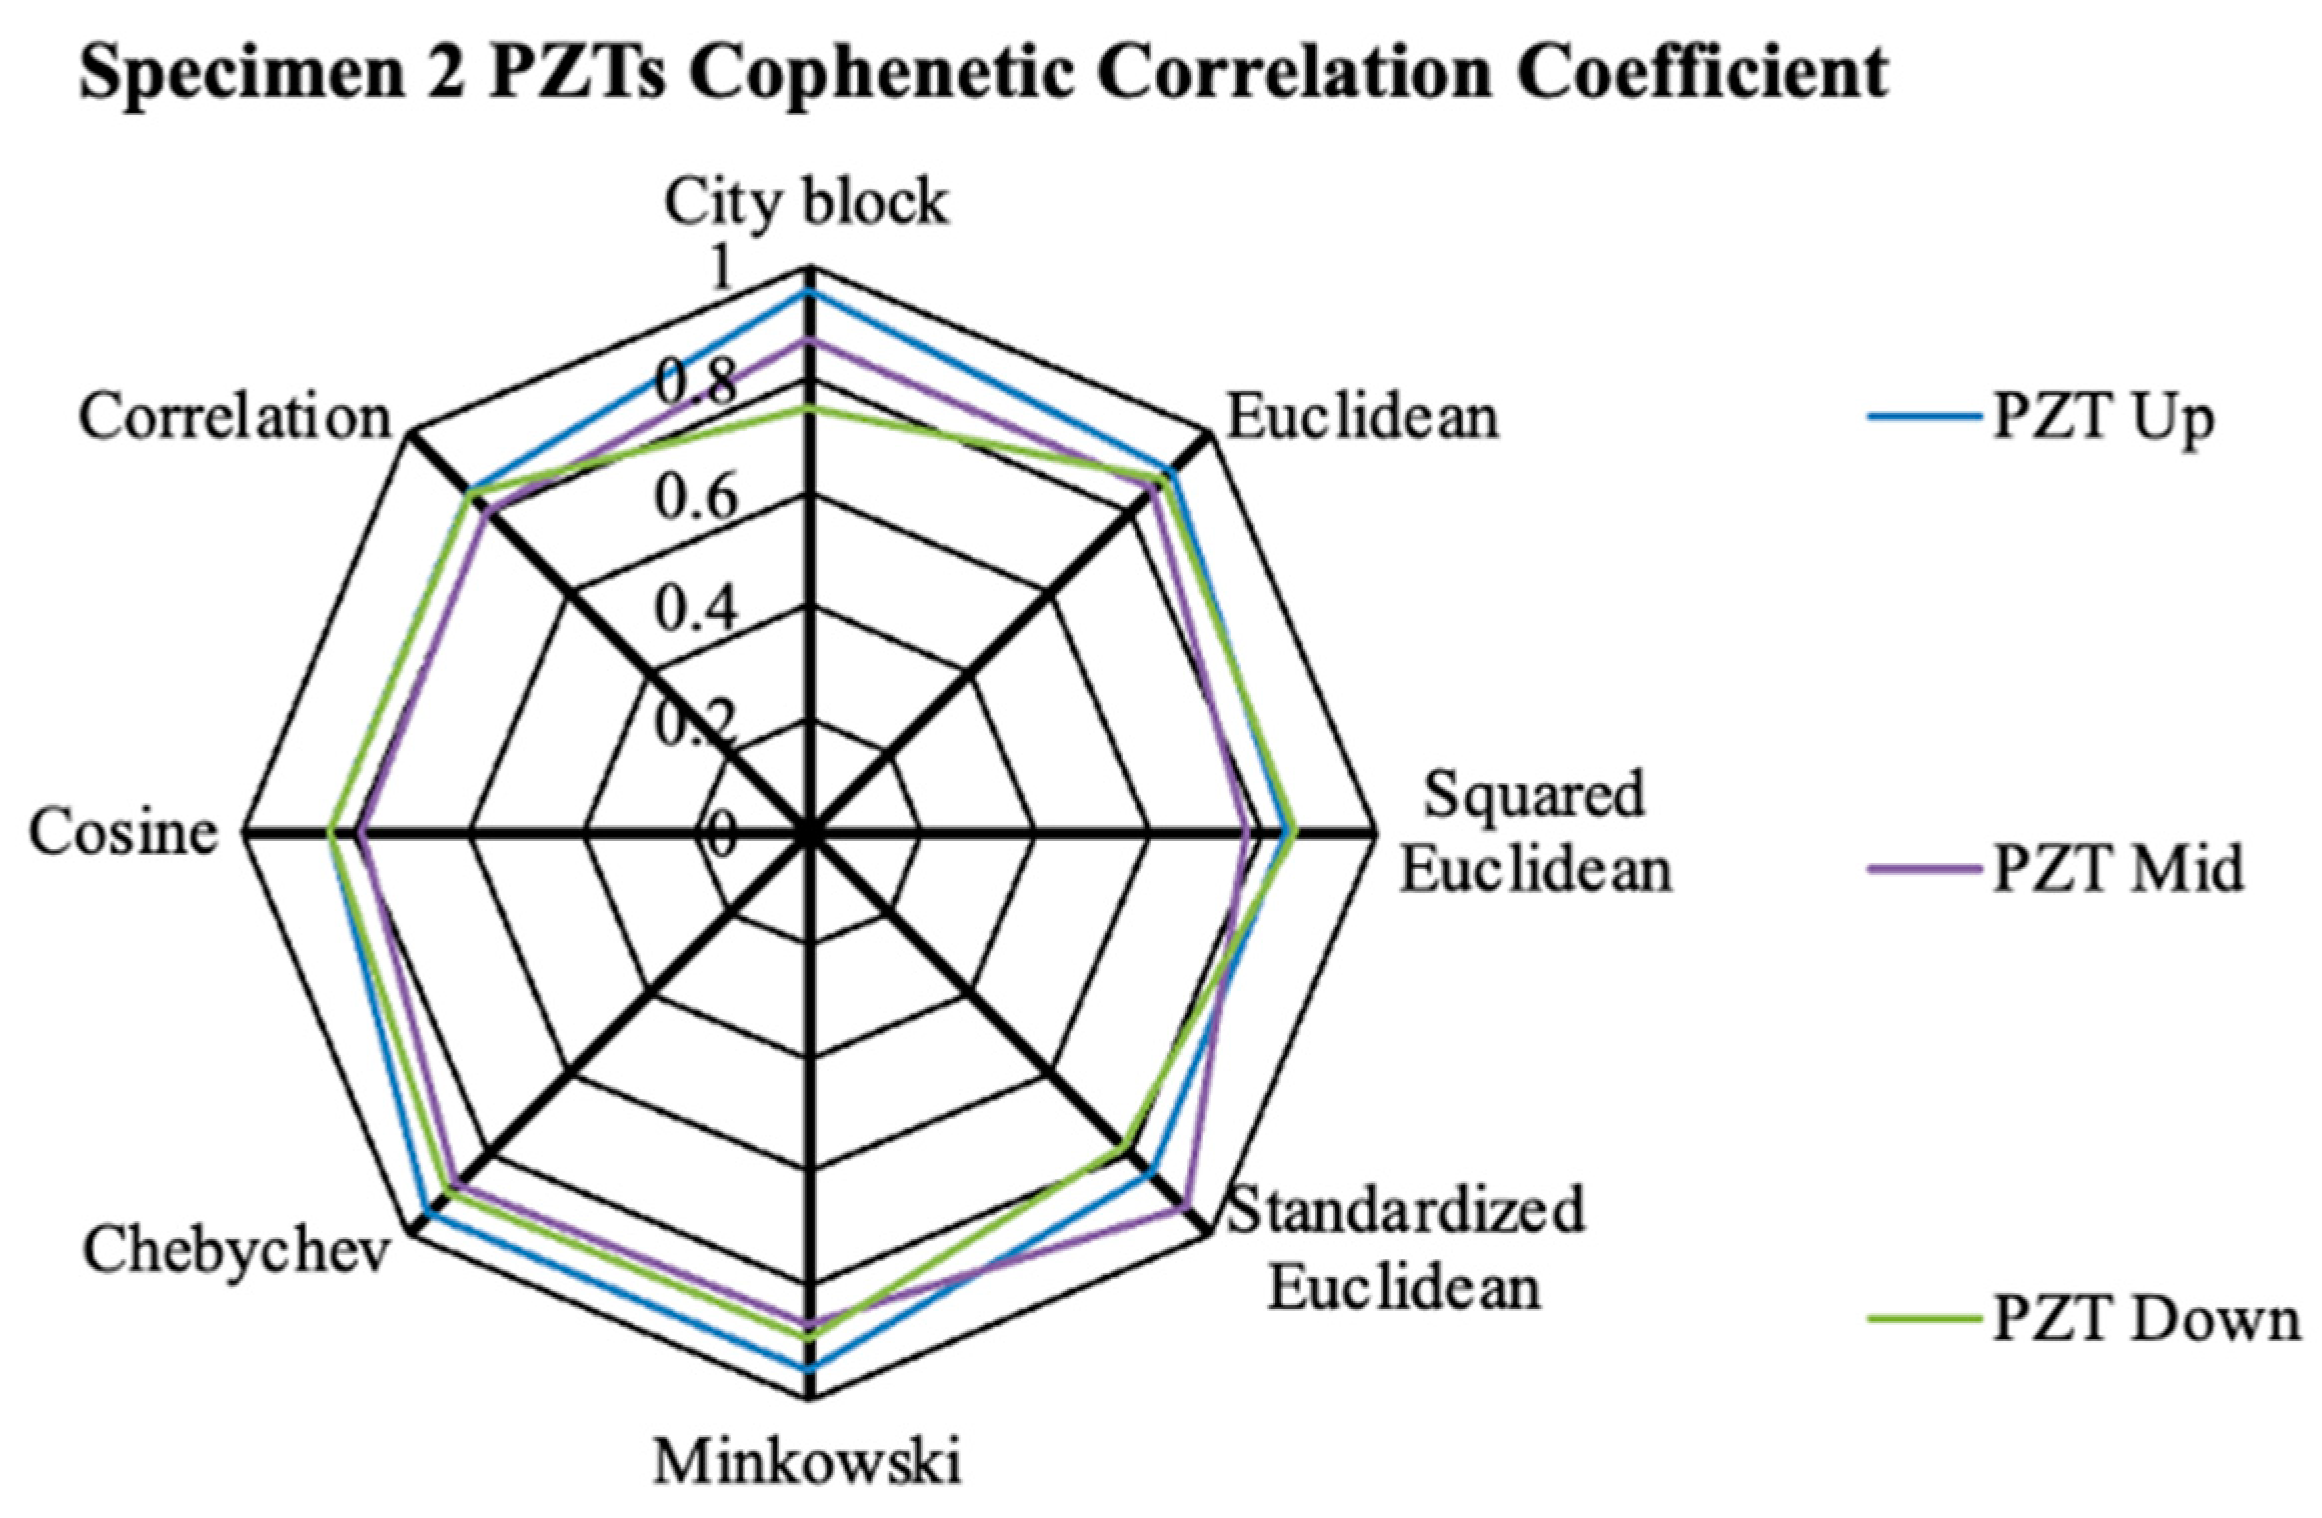
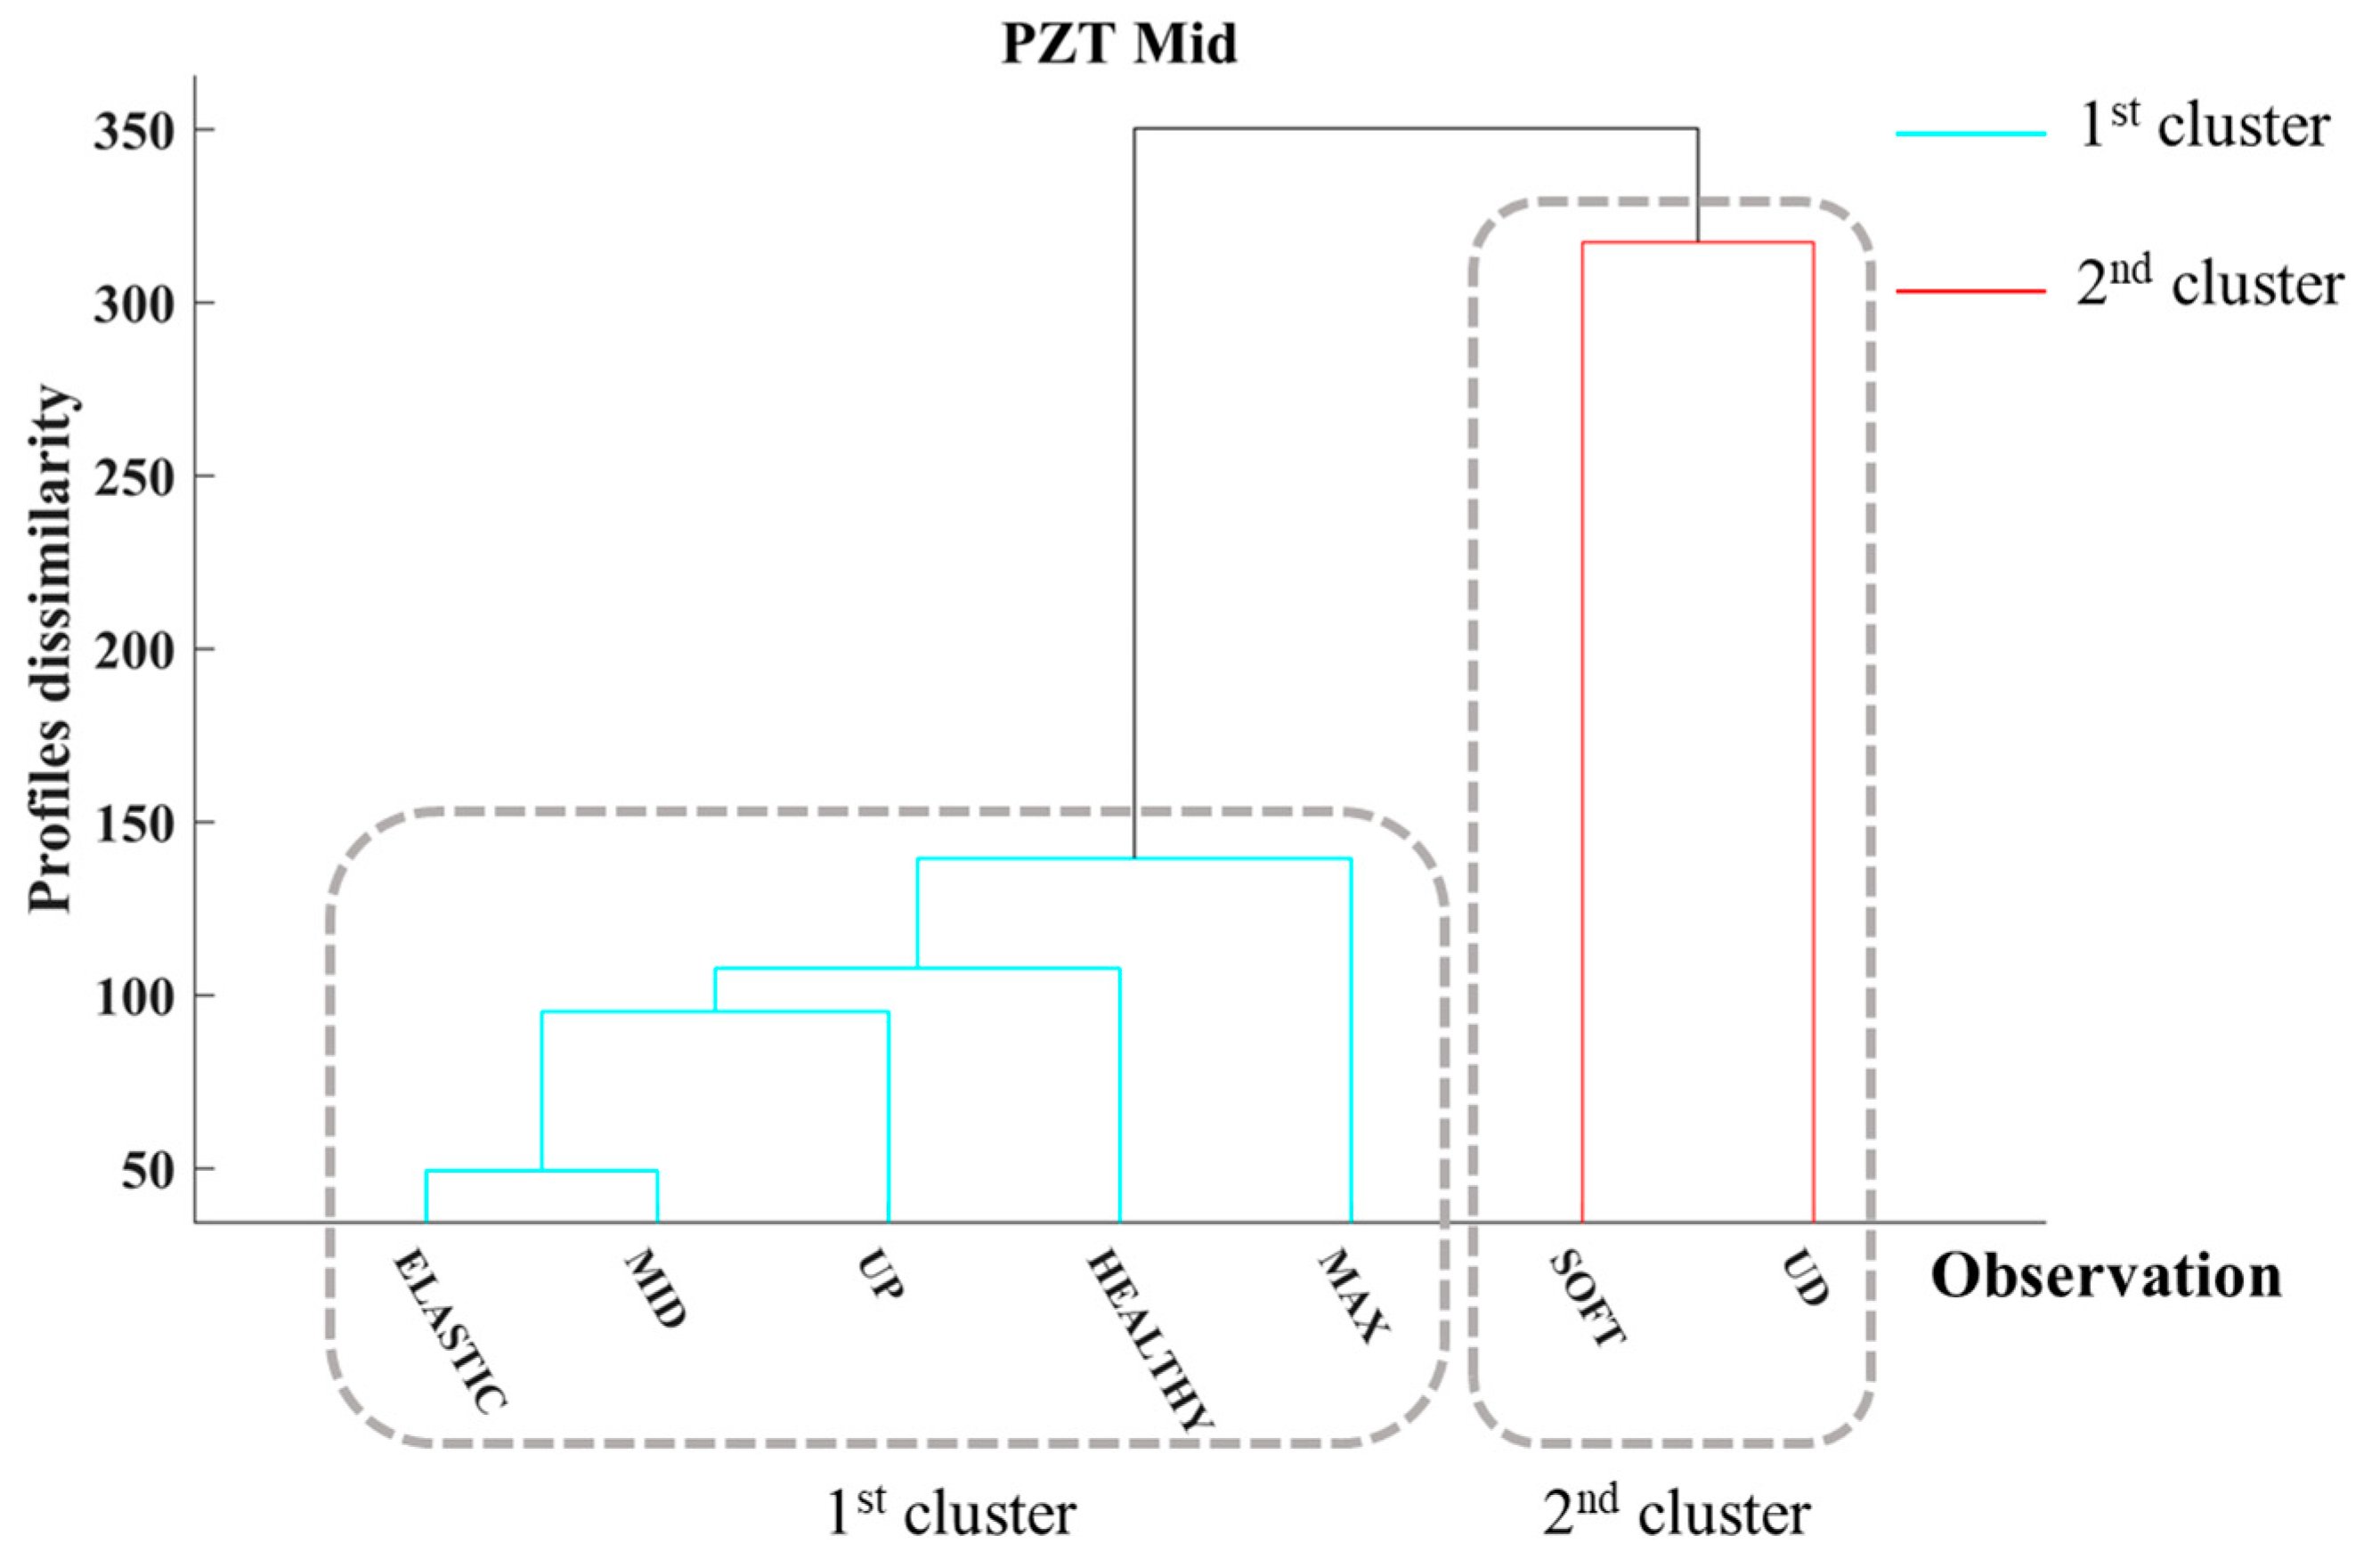
3.2.3. Damage Identification of Specimen 2

Figure 11 illustrates the CCC values obtained from all the PZTs of Specimen 2 across the various metric distances evaluated in this study. In a manner akin to Specimen 1, the CCC values highlight the HCA’s strength with regard to Specimen 2, where CCC values varied between 0.74 and 0.96 across the three PZTs and the examined distance metrics.
Additionally, this subsection discusses the HCA results of Specimen’s 2 PZTs. Figure 12 depicts the dendrogram of PZT Up, which formed two clusters. The first cluster, illustrated in cyan, represents the observations captured under healthy conditions along with those following the initial three loading steps, culminating in the loading step identified as UP. The second cluster, represented in red, is formed from the EMI measurements captured at the end of the SOFT and UD loading steps, where severe cracking has formed near PZT Up. Similarly to Specimen 1, the EMI response measured after the MAX loading step suggests that the structure is in a transitional state, which signifies substantial crack formation on the surface of the specimen during this loading step. Therefore, the HCA effectively detects the onset of damage near PZT Up and evaluates additional damage accumulation during the rupture loading phase.
Subsequently, Figure 13 illustrates the dendrogram of PZT Mid, in which two distinct clusters are discerned. The first cluster, depicted in cyan, consists of the EMI responses of PZT Mid measured in pristine condition and the EMI responses measured after the ELASTIC, MID, UP, and MAX loading steps. Throughout the first four loading steps, no surface cracking has been observed in the monitoring area of PZT Mid. The second cluster, represented in red, is constituted by the EMI responses corresponding to the SOFT and UD loading steps, during which cracks were formed in the vicinity of PZT Mid. Hence, HCA effectively identifies the progression of significant cracking of Specimen 2 and the associated accumulation of damage.
Furthermore, the HCA results concerning PZT Down are illustrated as a dendrogram, as shown in Figure 14. The HCA integrates all the EMI responses of PZT Down, except for the EMI response recorded following the UD loading step. As mentioned, the cracks formed in the upper region of Specimen 2 during the MAX loading step and propagated toward the lower area of Specimen 2 in the following loading steps. Therefore, a latency in identifying damage between the PZT Up and the other two PZTs is warranted. Furthermore, employing a PZT network could provide vital information regarding the location and orientation of structural cracks in FRC.

3.3. Specimen 3

3.3.1. Compression Behavior of Specimen 3

Specimen 3 exhibits pseudo-ductile behavior, as depicted in Figure 15a. The compressive strength of Specimen 3 reached 35.2 MPa during the fourth loading step. Subsequently, during the final two loading phases, Specimen 3 exhibited a marginal decrease in its bearing capacity, demonstrating a softening curve that can be attributed to the beneficial influence of the discrete fibers. The fissures developed in the upper section of the specimen and progressively extended towards its midsection, as depicted in Figure 15b.

3.3.2. PZTs EMI Responses of Specimen 3

Additionally, the EMI responses throughout the loading sequence of the Specimen’s 3 PZT transducers are illustrated in Figure 16. Specifically, Figure 16a depicts the EMI responses of PZT Up, which exhibits the typical peak shifting due to the formation of cracks in its neighborhood. Similarly, the EMI response of PZT Mid, as illustrated in Figure 16b, demonstrates the characteristic peak shifting observed during the UD loading phase. In contrast, the EMI response of PZT Down shows unexpected behavior; the resonant peak following the SOFT loading step demonstrates elevated values compared to UD. Nonetheless, the EMI response linked to the UD condition demonstrates a more pronounced resonant frequency shift than the EMI response noted following the SOFT loading phase.

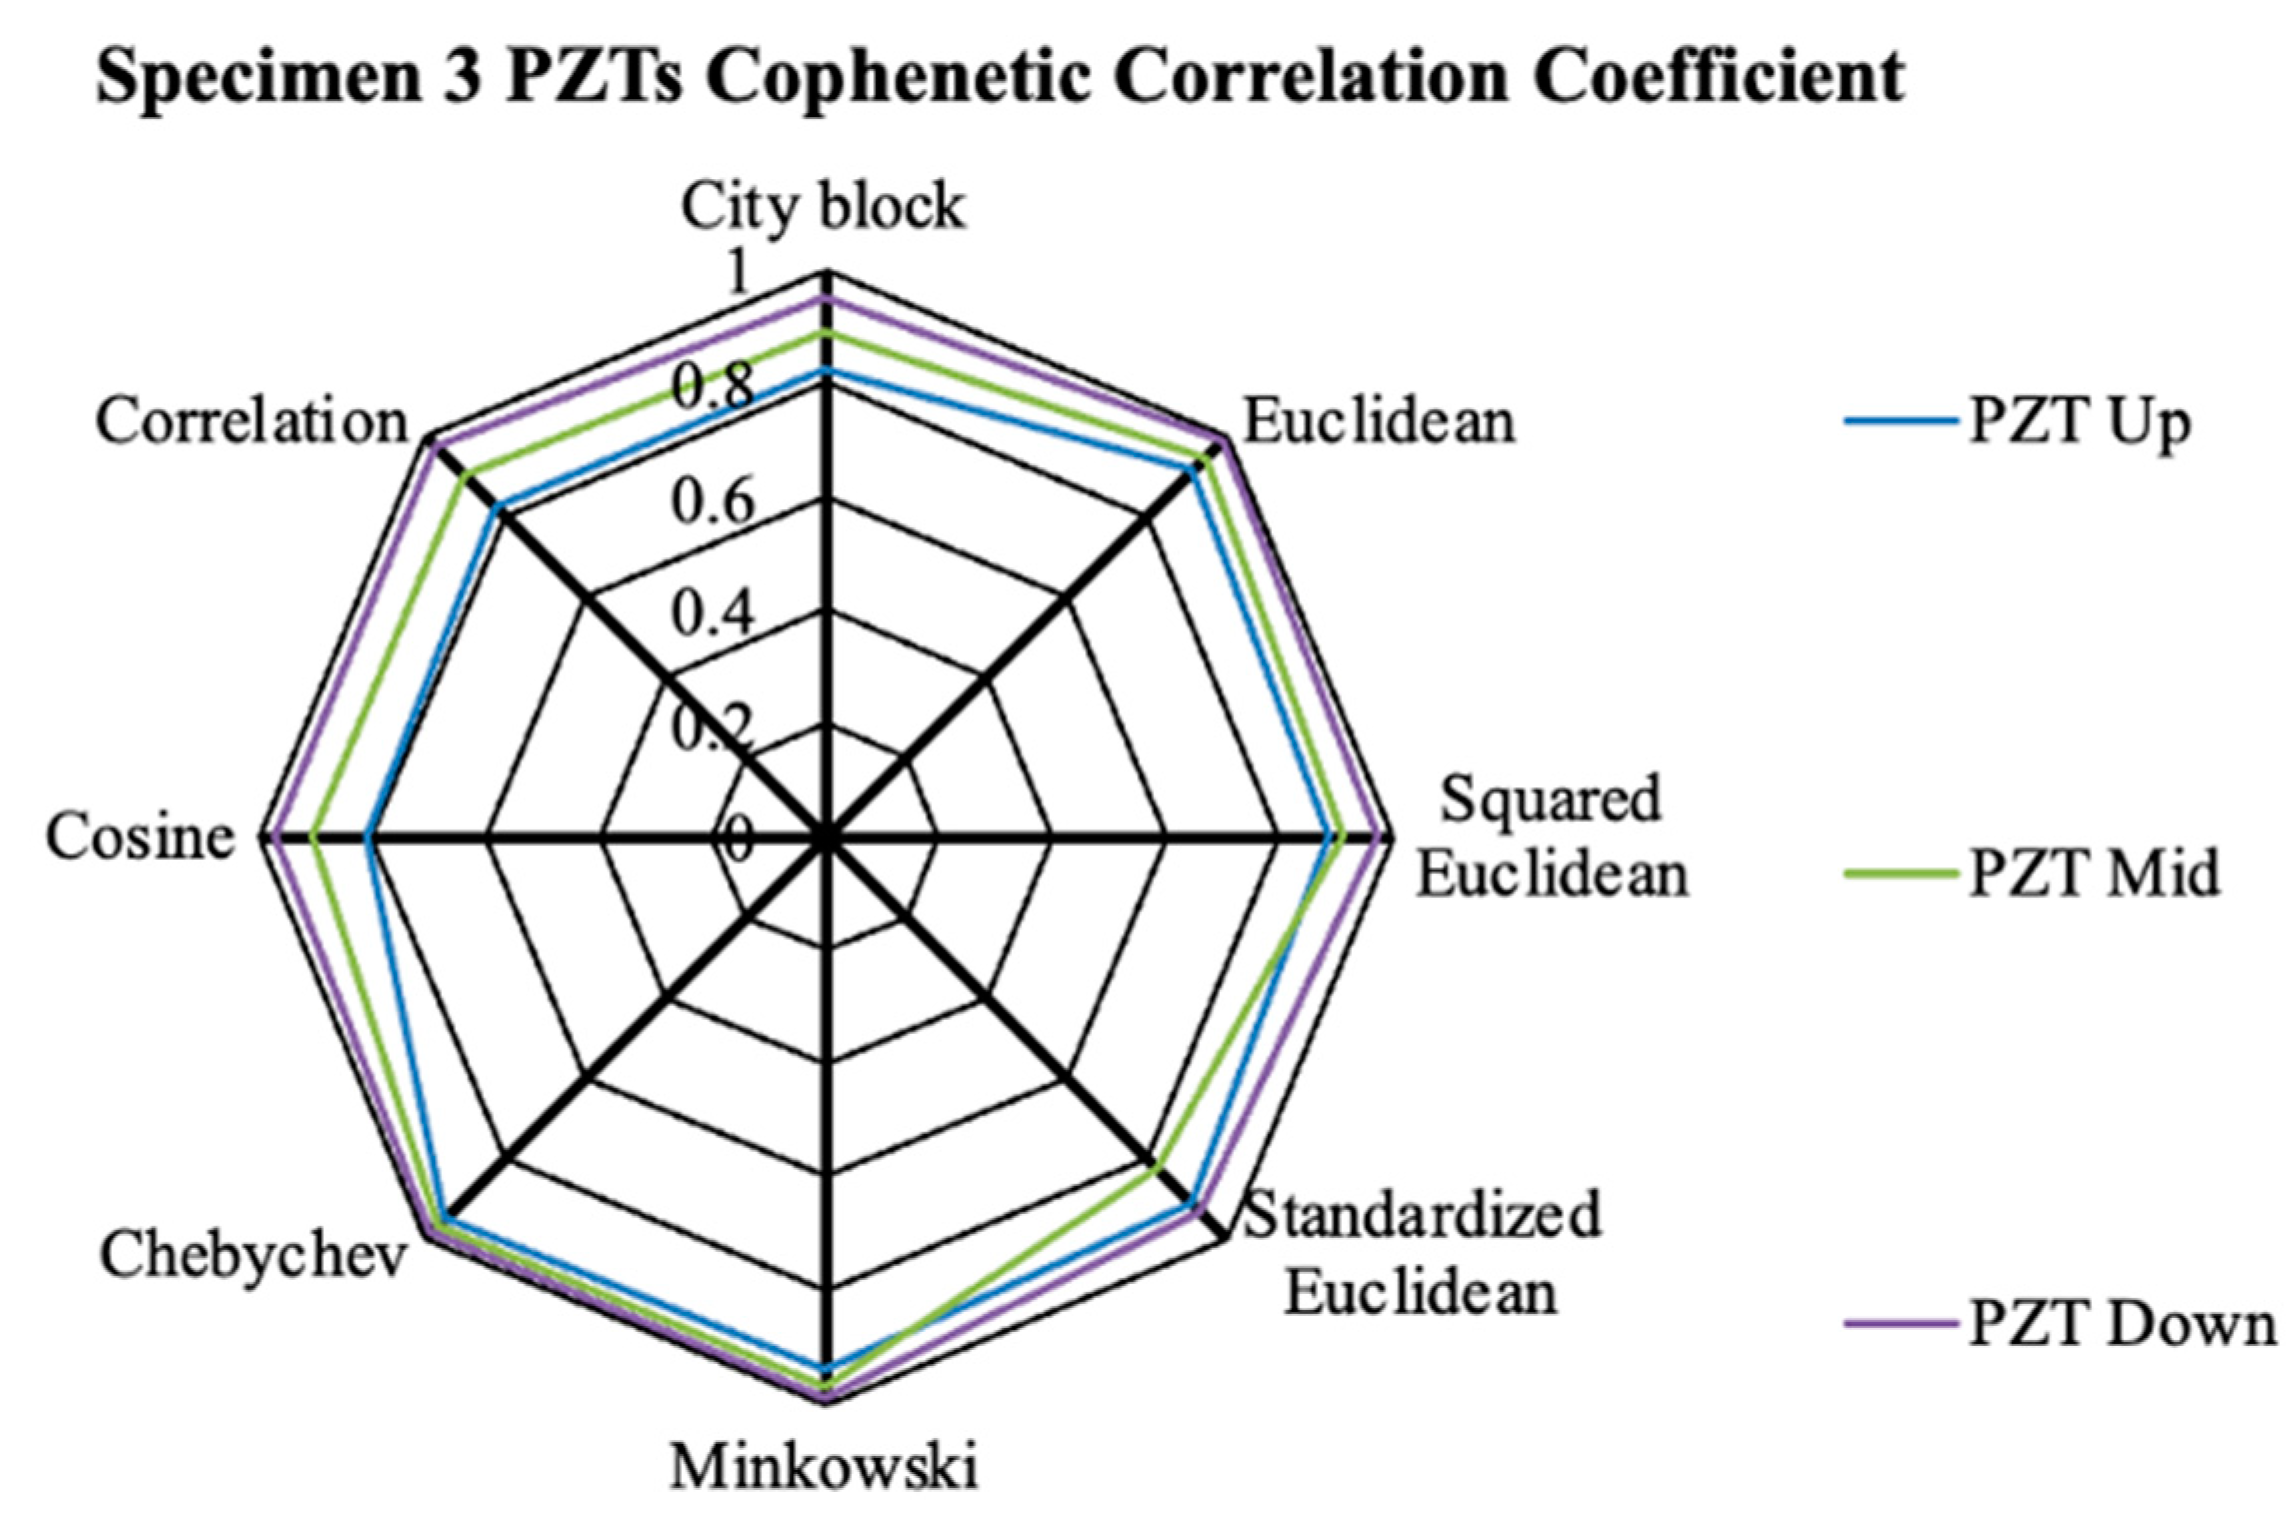
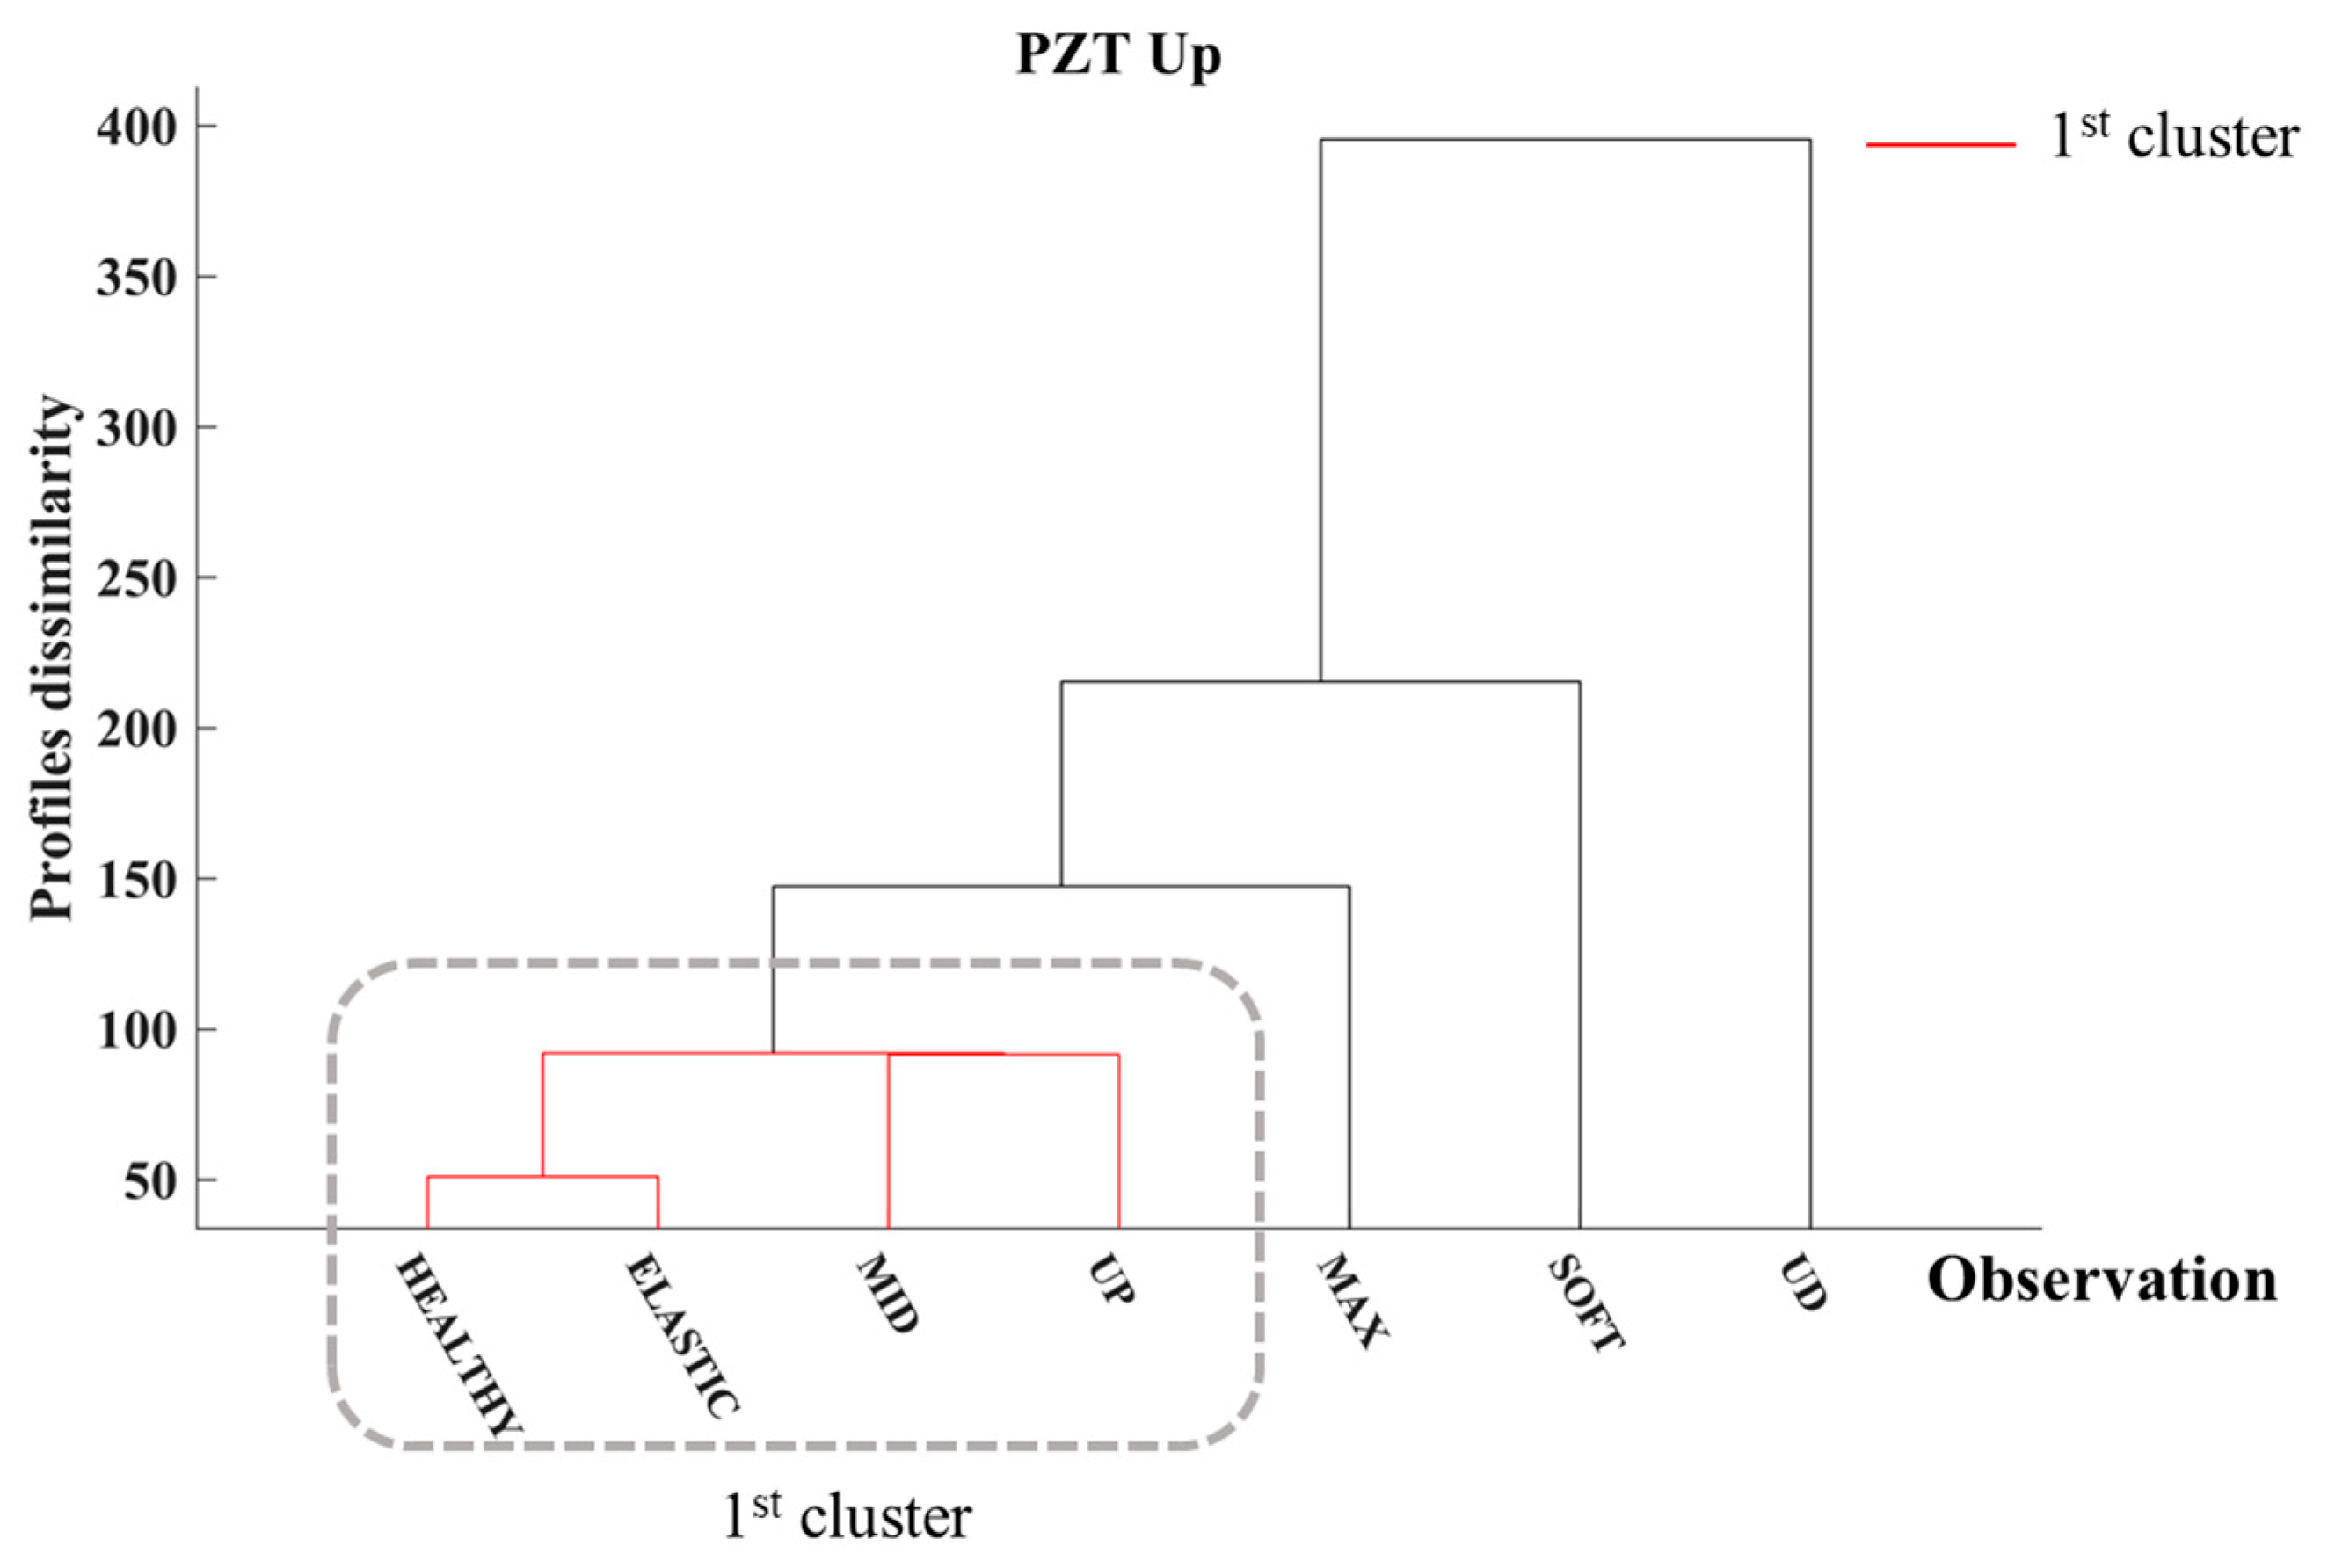
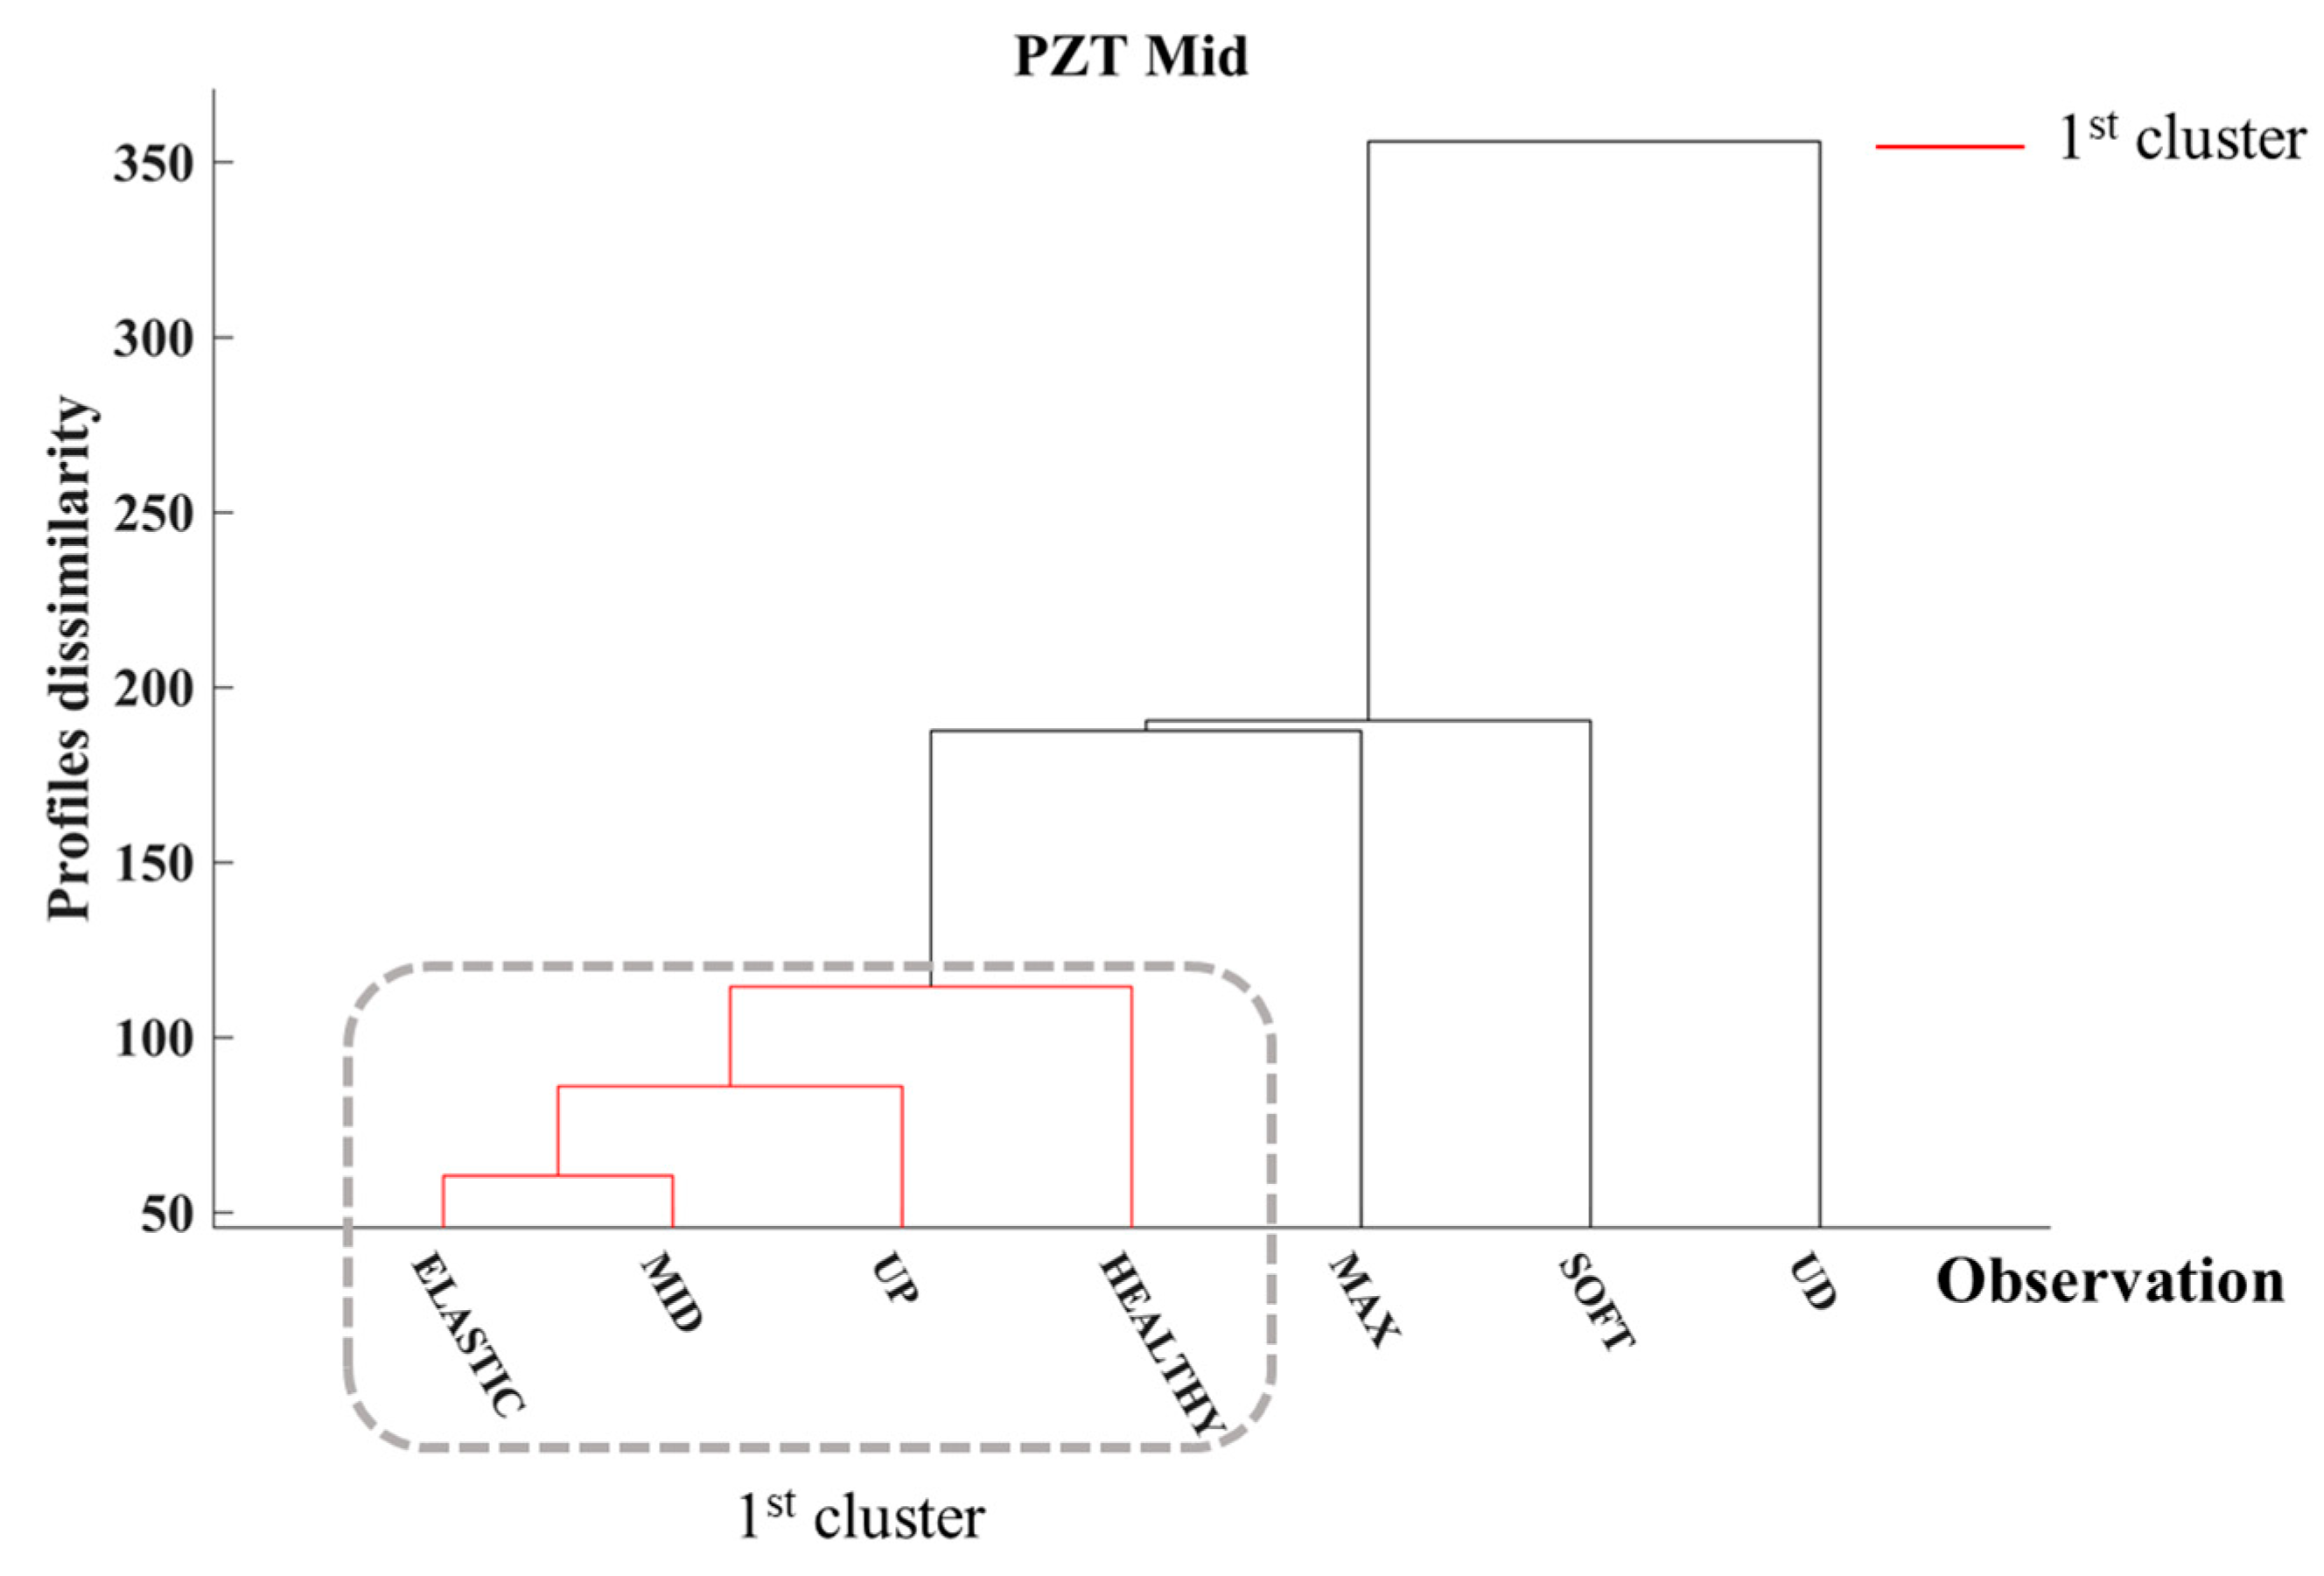
3.3.3. Damage Identification of Specimen 3

Figure 17 presents the CCC values derived from all the PZTs of Specimen 3 across the various metric distances assessed in this study. Consistent with the other specimens, the CCC values underscore the strength of the HCA for Specimen 3, wherein CCC values fluctuated between 0.81 and 0.99 across the three PZTs and the evaluated distance metrics.
Figure 18 illustrates the dendrogram of PZT Up, which was attached in the upper region of Specimen 3, where the initial loading steps formed one cluster, which is depicted in red. This cluster contains the EMI responses of PZT Up in the healthy condition and the observations captured at the end of the ELASTIC, MID, and UP loading steps, where no surface cracks were detected. Subsequently, the dissimilarity degree of the EMI responses captured at the end of the following loading steps exhibits vigorous growth, which the HCA detected. The EMI responses associated with these loading steps were recorded in the softening region of Specimen 3, where surface cracks developed and expanded within the monitoring vicinity of the PZT Up. Consequently, the HCA identifies the formation of cracking and the emergence of structural damage in Specimen 3 through the alterations observed in the EMI responses of PZT Up.
Additionally, Figure 19 depicts the dendrogram of PZT Mid, which was attached with epoxy to the midsection of Specimen 3. In this context, the initial loading steps led to the emergence of a singular cluster, represented in red, similar to that observed in PZT Up. Additionally, the degree of dissimilarity in the EMI responses recorded during the softening phase of Specimen 3 revealed a pronounced increase, which has been attributed to the development of significant damage. Nevertheless, in contrast with PZT Up, the degree of dissimilarity escalated dramatically following the UD loading phase. This phenomenon may be attributed to the rapid escalation of damage occurring in the midsection of the specimen towards the conclusion of the loading sequence, as illustrated in Figure 15b.
Subsequently, the dendrogram of PZT Down, which was placed in the lower region of Specimen 3, is depicted in Figure 20. Similarly to the other PZTs of Specimen 3, the EMI responses of the initial loading steps, where no apparent surface cracks have been detected, form one cluster. Additionally, the rest of the EMI responses, which correspond to the softening phase, exhibit an elevated dissimilarity. In contrast to the preceding results, the EMI response of PZT Down, corresponding to the SOFT loading step, demonstrates a greater degree of dissimilarity. This discrepancy may be attributed to external factors imposing elevated noise levels during the measurement of the EMI response of PZT Down.

4. Discussion

The recognition of load-induced deterioration of FRC, particularly under conditions of repeated compressive loading, constitutes a critical concern within civil engineering. Therefore, this study investigates the efficacy of HCA for EMI-based damage identification. The findings indicate that HCA accurately reflects the variations observed in the EMI responses recorded at distinct structural conditions, as determined by their CCC values. The CCC values of all the PZT transducers across the investigated distance metrics vary between 0.74 and 0.99. Further, HCA successfully distinguishes the structural condition of the FRC from the EMI measurements of the majority of PZTs. The conclusions derived from this study regarding HCA are consistent with the findings presented by Perera et al. [14,48], notwithstanding the intricacies involved in applying this study. Furthermore, the integration of synthetic fibers significantly improved the post-peak behavior of the FRC across all specimens, which exhibited a mean compressive strength of 35.4 MPa and a standard deviation of 3 MPa.
In summary, this study shows the feasibility of HCA for EMI-based SHM of FRC under repeated compression loading. Nonetheless, the proposed methodology necessitates the examination of full-scale FRC structural elements and jackets of RC members prior to its practical implementation. Furthermore, subsequent research endeavors may investigate the incorporation of regression methodologies to quantify the deterioration of FRC structural integrity.

5. Conclusions

This paper investigates the effectiveness of HCA in identifying load-induced damages through the EMI responses of externally bonded PZT transducers in FRC. The incorporation of discrete fibers and the pseudo-ductile behavior of FRC enhance the complexity of the monitoring challenge. Nevertheless, the experimental investigation yielded promising results for the proposed SHM scheme. The subsequent conclusions elucidate the fundamental findings of this study:
  • The EMI-based SHM method and the applied instrumental equipment identify the accumulation of load-induced damage of FRC.
  • The HCA can feasibly be used to identify damage in FRC.
  • A PZT network could provide critical insights pertaining to the location and propagation of load-induced fractures in FRC.
  • The HCA proficiently evaluates the accumulation of damage attributable to the pseudo-ductility exhibited by FRC in the majority of PZT transducers examined in this study.

Author Contributions

Conceptualization, G.M.S. and N.A.P.; methodology, G.M.S. and N.A.P.; software, G.M.S.; validation, G.M.S., N.A.P. and M.C.N.; investigation, G.M.S., N.A.P. and M.C.N.; resources, N.A.P. and M.C.N.; data curation, G.M.S.; writing—original draft preparation, G.M.S. and M.C.N.; writing—review and editing, G.M.S. and N.A.P.; visualization, M.C.N. All authors have read and agreed to the published version of the manuscript.

Funding

This research received no external funding.

Data Availability Statement

The data presented in this study are available on request from the corresponding author.

Acknowledgments

The authors wish to thank SIKA Hellas, particularly Nikos Anagnostopoulos, for supplying the synthetic fibers.

Conflicts of Interest

The authors declare no conflicts of interest.

References

  1. Woodward, R.J. Collapse of a Segmental Post-Tensioned Concrete Bridge. Transp. Res. Rec. 1989, 1211, 38–59. [Google Scholar]
  2. Kaur, N.; Goyal, S.; Anand, K.; Sahu, G.K. A Cost-Effective Approach for Assessment of Pre-Stressing Force in Bridges Using Piezoelectric Transducers. Measurement 2021, 168, 108324. [Google Scholar] [CrossRef]
  3. Chalioris, C.E. Analytical Approach for the Evaluation of Minimum Fibre Factor Required for Steel Fibrous Concrete Beams under Combined Shear and Flexure. Constr. Build. Mater. 2013, 43, 317–336. [Google Scholar] [CrossRef]
  4. Naoum, M.C.; Papadopoulos, N.A.; Sapidis, G.M.; Voutetaki, M.E. Efficacy of PZT Sensors Network Different Configurations in Damage Detection of Fiber-Reinforced Concrete Prisms under Repeated Loading. Sensors 2024, 24, 5660. [Google Scholar] [CrossRef]
  5. Huang, Y.; Grünewald, S.; Schlangen, E.; Luković, M. Strengthening of Concrete Structures with Ultra High Performance Fiber Reinforced Concrete (UHPFRC): A Critical Review. Constr. Build. Mater. 2022, 336, 127398. [Google Scholar] [CrossRef]
  6. Chalioris, C.E. Steel Fibrous RC Beams Subjected to Cyclic Deformations under Predominant Shear. Eng. Struct. 2013, 49, 104–118. [Google Scholar] [CrossRef]
  7. Tastani, S.; Ntampanli, E.; Savvidis, I.; Veneti, M.; Zapris, V. Strain Resilient Cementitious Composites of Unclassified Calcareous Fly Ash and PP Fibers: Performance by Also Considering Durability Effects. In Strain-Hardening Cement-Based Composites; Mechtcherine, V., Slowik, V., Kabele, P., Eds.; RILEM Bookseries; Springer: Dordrecht, The Netherlands, 2018; Volume 15, pp. 634–642. ISBN 978-94-024-1193-5. [Google Scholar]
  8. Tsonos, A.D.G.; Kalogeropoulos, G.I.; Iakovidis, P.E.; Konstantinidis, D. Seismic Retrofitting of Pre-1970 RC Bridge Columns Using Innovative Jackets. Int. J. Struct. Eng. 2017, 8, 133. [Google Scholar] [CrossRef]
  9. Mpalaskas, A.C.; Matikas, T.E.; Aggelis, D.G. Acoustic Emission of Fire Damaged Fiber Reinforced Concrete; Meyendorf, N.G., Matikas, T.E., Peters, K.J., Eds.; SPIE: Las Vegas, NV, USA, 2016; p. 980618. [Google Scholar]
  10. Abbas, A.M.; Hussain, H.K.; Ojaimi, M.F. Shear and Flexural Behavior of Flat Slabs Casted with Polyolefin Fiber-Reinforced Concrete. Fibers 2022, 10, 34. [Google Scholar] [CrossRef]
  11. Haq, M.; Bhalla, S.; Naqvi, T. Piezo-Impedance Based Fatigue Damage Monitoring of Restrengthened Concrete Frames. Compos. Struct. 2022, 280, 114868. [Google Scholar] [CrossRef]
  12. Chalioris, C.E.; Papadopoulos, N.A.; Sapidis, G.; Naoum, M.C.; Golias, E. EMA-Based Monitoring Method of Strengthened Beam-Column Joints; University of Nebraska at Omaha: Omaha, NE, USA, 2023; Volume 2023, pp. 853–873. [Google Scholar]
  13. Bhalla, S.; Yang, Y.W.; Xu, J.F.; Soh, C.K. Damage Quantification Using EMI Technique. In Smart Materials in Structural Health Monitoring, Control and Biomechanics; Advanced Topics in Science and Technology in China; Springer: Berlin/Heidelberg, Germany, 2012; pp. 129–186. ISBN 978-3-642-24462-9. [Google Scholar]
  14. Ai, D.; Yang, Z.; Li, H.; Zhu, H. Heating-Time Effect on Electromechanical Admittance of Surface-Bonded PZT Sensor for Concrete Structural Monitoring. Measurement 2021, 184, 109992. [Google Scholar] [CrossRef]
  15. Providakis, C.P.; Stefanaki, K.D.; Voutetaki, M.E.; Tsompanakis, J.; Stavroulaki, M. Developing a Multi-Mode PZT Sensing Solution for Active SHM in Concrete Structures; IEEE: Piscataway, NJ, USA, 2013; pp. 61–65. [Google Scholar]
  16. Mpalaskas, A.C.; Thanasia, O.V.; Matikas, T.E.; Aggelis, D.G. Mechanical and Fracture Behavior of Cement-Based Materials Characterized by Combined Elastic Wave Approaches. Constr. Build. Mater. 2014, 50, 649–656. [Google Scholar] [CrossRef]
  17. Jiang, T.; Yu, D.; Xiao, M.; Li, L.; Wang, L. Monitoring Bond-Slip Behavior of CFRP-RCESC Beams Using Piezoelectric Active Sensing Method. Adv. Bridge Eng. 2021, 2, 25. [Google Scholar] [CrossRef]
  18. Mpalaskas, A.C.; Matikas, T.E.; Aggelis, D.G.; Alver, N. Acoustic Emission for Evaluating the Reinforcement Effectiveness in Steel Fiber Reinforced Concrete. Appl. Sci. 2021, 11, 3850. [Google Scholar] [CrossRef]
  19. Aggelis, D.G.; Mpalaskas, A.C.; Matikas, T.E. Acoustic Monitoring for the Evaluation of Concrete Structures and Materials. In Acoustic Emission (AE) and Related Non-destructive Evaluation (NDE) Techniques in the Fracture Mechanics of Concrete: Fundamentals and Applications; Elsevier: Amsterdam, The Netherlands, 2015; pp. 269–286. [Google Scholar]
  20. Altammar, H.; Dhingra, A.; Salowitz, N. Ultrasonic Sensing and Actuation in Laminate Structures Using Bondline-Embedded D35 Piezoelectric Sensors. Sensors 2018, 18, 3885. [Google Scholar] [CrossRef]
  21. Erdogmus, E.; Garcia, E.; Amiri, A.S.; Schuller, M. A Novel Structural Health Monitoring Method for Reinforced Concrete Bridge Decks Using Ultrasonic Guided Waves. Infrastructures 2020, 5, 49. [Google Scholar] [CrossRef]
  22. Liang, C.; Sun, F.; Rogers, C.A. Electro-Mechanical Impedance Modeling of Active Material Systems. Smart Mater. Struct. 1996, 5, 171–186. [Google Scholar] [CrossRef]
  23. Perera, R.; Torres, L.; Díaz, F.J.; Barris, C.; Baena, M. Analysis of the Impact of Sustained Load and Temperature on the Performance of the Electromechanical Impedance Technique through Multilevel Machine Learning and FBG Sensors. Sensors 2021, 21, 5755. [Google Scholar] [CrossRef]
  24. Cao, P.; Zhang, S.; Wang, Z.; Zhou, K. Damage Identification Using Piezoelectric Electromechanical Impedance: A Brief Review from a Numerical Framework Perspective. Structures 2023, 50, 1906–1921. [Google Scholar] [CrossRef]
  25. Kocherla, A.; Duddi, M.; Subramaniam, K.V.L. Embedded PZT Sensors for Monitoring Formation and Crack Opening in Concrete Structures. Measurement 2021, 182, 109698. [Google Scholar] [CrossRef]
  26. Bhalla, S.; Soh, C.K. Electromechanical Impedance Modeling for Adhesively Bonded Piezo-Transducers. J. Intell. Mater. Syst. Struct. 2004, 15, 955–972. [Google Scholar] [CrossRef]
  27. Naoum, M.; Sapidis, G.; Papadopoulos, N.; Golias, E.; Chalioris, C. Structural Health Monitoring of Reinforced Concrete Beam-Column Joints Using Piezoelectric Transducers. In International RILEM Conference on Synergising Expertise towards Sustainability and Robustness of Cement-based Materials and Concrete Structures; Jędrzejewska, A., Kanavaris, F., Azenha, M., Benboudjema, F., Schlicke, D., Eds.; RILEM Bookseries; Springer: Cham, Switzerland, 2023; Volume 43, pp. 945–956. ISBN 978-3-031-33210-4. [Google Scholar]
  28. Papadopoulos, N.A.; Naoum, M.C.; Sapidis, G.M.; Chalioris, C.E. Cracking and Fiber Debonding Identification of Concrete Deep Beams Reinforced with C-FRP Ropes against Shear Using a Real-Time Monitoring System. Polymers 2023, 15, 473. [Google Scholar] [CrossRef]
  29. Ai, D.; Li, H.; Zhu, H. Flexure-Critical Stress and Damage Identification in RC Beam Structure Using Embedded Piezoelectric Transducers: 2D Modelling and Experimental Investigations. Constr. Build. Mater. 2023, 409, 134017. [Google Scholar] [CrossRef]
  30. Bhalla, S.; Kaur, N. Prognosis of Low-Strain Fatigue Induced Damage in Reinforced Concrete Structures Using Embedded Piezo-Transducers. Int. J. Fatigue 2018, 113, 98–112. [Google Scholar] [CrossRef]
  31. Ai, D.; Luo, H.; Wang, C.; Zhu, H. Monitoring of the Load-Induced RC Beam Structural Tension/Compression Stress and Damage Using Piezoelectric Transducers. Eng. Struct. 2018, 154, 38–51. [Google Scholar] [CrossRef]
  32. Pham, Q.-Q.; Dang, N.-L.; Kim, J.-T. Smart PZT-Embedded Sensors for Impedance Monitoring in Prestressed Concrete Anchorage. Sensors 2021, 21, 7918. [Google Scholar] [CrossRef]
  33. Dang, N.; Pham, Q.; Kim, J. Piezoelectric-based Hoop-type Interface for Impedance Monitoring of Local Strand Breakage in Prestressed Multi-strand Anchorage. Struct. Control. Heal. Monit. 2021, 28, e2649. [Google Scholar] [CrossRef]
  34. Yan, S.; Sun, W.; Song, G.; Gu, H.; Huo, L.-S.; Liu, B.; Zhang, Y.-G. Health Monitoring of Reinforced Concrete Shear Walls Using Smart Aggregates. Smart Mater. Struct. 2009, 18, 047001. [Google Scholar] [CrossRef]
  35. Papadopoulos, N.A.; Naoum, M.C.; Sapidis, G.M.; Chalioris, C.E. Resilient and Sustainable Structures through EMI-Based SHM Evaluation of an Innovative C-FRP Rope Strengthening Technique. Appl. Mech. 2024, 5, 405–419. [Google Scholar] [CrossRef]
  36. Divsholi, B.S.; Yang, Y.W.; Bing, L. Monitoring Beam-Column Joint in Concrete Structures Using Piezo-Impedance Sensors. Adv. Mater. Res. 2009, 79–82, 59–62. [Google Scholar] [CrossRef]
  37. Sapidis, G.M.; Naoum, M.C.; Papadopoulos, N.A.; Golias, E.; Karayannis, C.G.; Chalioris, C.E. A Novel Approach to Monitoring the Performance of Carbon-Fiber-Reinforced Polymer Retrofitting in Reinforced Concrete Beam–Column Joints. Appl. Sci. 2024, 14, 9173. [Google Scholar] [CrossRef]
  38. Kocherla, A.; Subramaniam, K.V.L. Stress and Damage Localization Monitoring in Fiber-Reinforced Concrete Using Surface-Mounted PZT Sensors. Meas. Sci. Technol. 2020, 31, 024004. [Google Scholar] [CrossRef]
  39. Sapidis, G.M.; Kansizoglou, I.; Naoum, M.C.; Papadopoulos, N.A.; Chalioris, C.E. A Deep Learning Approach for Autonomous Compression Damage Identification in Fiber-Reinforced Concrete Using Piezoelectric Lead Zirconate Titanate Transducers. Sensors 2024, 24, 386. [Google Scholar] [CrossRef]
  40. Wang, Z.; Chen, D.; Zheng, L.; Huo, L.; Song, G. Influence of Axial Load on Electromechanical Impedance (EMI) of Embedded Piezoceramic Transducers in Steel Fiber Concrete. Sensors 2018, 18, 1782. [Google Scholar] [CrossRef]
  41. Ai, D.; Mo, F.; Han, Y.; Wen, J. Automated Identification of Compressive Stress and Damage in Concrete Specimen Using Convolutional Neural Network Learned Electromechanical Admittance. Eng. Struct. 2022, 259, 114176. [Google Scholar] [CrossRef]
  42. Kocherla, A.; Subramaniam, K.V.L. Embedded Smart PZT-Based Sensor for Internal Damage Detection in Concrete under Applied Compression. Measurement 2020, 163, 108018. [Google Scholar] [CrossRef]
  43. Zhang, C.; Yan, Q.; Panda, G.P.; Wu, W.; Song, G.; Vipulanandan, C. Real-Time Monitoring Stiffness Degradation of Hardened Cement Paste under Uniaxial Compression Loading through Piezoceramic-Based Electromechanical Impedance Method. Constr. Build. Mater. 2020, 256, 119395. [Google Scholar] [CrossRef]
  44. Narayanan, A.; Subramaniam, K.V.L. Sensing of Damage and Substrate Stress in Concrete Using Electro-Mechanical Impedance Measurements of Bonded PZT Patches. Smart Mater. Struct. 2016, 25, 095011. [Google Scholar] [CrossRef]
  45. Naoum, M.C.; Sapidis, G.M.; Papadopoulos, N.A.; Voutetaki, M.E. An Electromechanical Impedance-Based Application of Realtime Monitoring for the Load-Induced Flexural Stress and Damage in Fiber-Reinforced Concrete. Fibers 2023, 11, 34. [Google Scholar] [CrossRef]
  46. Ai, D.; Mo, F.; Yang, F.; Zhu, H. Electromechanical Impedance-Based Concrete Structural Damage Detection Using Principal Component Analysis Incorporated with Neural Network. J. Intell. Mater. Syst. Struct. 2022, 33, 2241–2256. [Google Scholar] [CrossRef]
  47. Perera, R.; Torres, L.; Ruiz, A.; Barris, C.; Baena, M. An EMI-Based Clustering for Structural Health Monitoring of NSM FRP Strengthening Systems. Sensors 2019, 19, 3775. [Google Scholar] [CrossRef] [PubMed]
  48. Sevillano, E.; Sun, R.; Gil, A.; Perera, R. Interfacial Crack-Induced Debonding Identification in FRP-Strengthened RC Beams from PZT Signatures Using Hierarchical Clustering Analysis. Compos. Part B Eng. 2016, 87, 322–335. [Google Scholar] [CrossRef]
  49. Park, S.; Lee, J.-J.; Yun, C.-B.; Inman, D.J. Electro-Mechanical Impedance-Based Wireless Structural Health Monitoring Using PCA-Data Compression and k-Means Clustering Algorithms. J. Intell. Mater. Syst. Struct. 2008, 19, 509–520. [Google Scholar] [CrossRef]
  50. Jiang, X.; Zhang, X.; Zhang, Y. Piezoelectric Active Sensor Self-Diagnosis for Electromechanical Impedance Monitoring Using K-Means Clustering Analysis and Artificial Neural Network. Shock. Vib. 2021, 2021, 5574898. [Google Scholar] [CrossRef]
  51. Ai, D.; Zhang, R. Deep Learning of Electromechanical Admittance Data Augmented by Generative Adversarial Networks for Flexural Performance Evaluation of RC Beam Structure. Eng. Struct. 2023, 296, 116891. [Google Scholar] [CrossRef]
  52. de Oliveira, M.; Monteiro, A.; Vieira Filho, J. A New Structural Health Monitoring Strategy Based on PZT Sensors and Convolutional Neural Network. Sensors 2018, 18, 2955. [Google Scholar] [CrossRef]
  53. EN 934-2:2009+A1:2012; Admixtures for Concrete, Mortar and Grout—Part 2: Concrete Admixtures—Definitions, Requirements, Conformity, Marking and Labelling . CEN: Brussels, Belgium; European Committee for Standardization: Brussels, Belgium, 2012.
  54. ASTM C192; Standard Practice for Making and Curing Concrete Test Specimens in the Laboratory. ASTM International: Montgomery, PA, USA, 2024. [CrossRef]
  55. ASTM C39; Test Method for Compressive Strength of Cylindrical Concrete Specimens. ASTM International: Montgomery, PA, USA, 2023. [CrossRef]
  56. Voutetaki, M.E.; Naoum, M.C.; Papadopoulos, N.A.; Sapidis, G.; Chalioris, C.E. Cracking Diagnosis in Fibre Reinforced Concrete Cubes and Cylinders with Synthetic Fibres Using a PZT-Based Health Monitoring System. Sch. J. Eng. Tech. 2021, 9, 140–151. [Google Scholar] [CrossRef]
  57. Jin, H.; Xu, H.; Cai, C.; Chen, L.; Wang, T.; Shen, L.; Wang, Z.; Chen, T.; Ngo, T. Experimental Investigation and Model Analysis of Uniaxial Compressive Behavior, Micro Properties and Sustainability of Fiber-Reinforced Concrete Designed by Cost-Efficiency Fibers. Innov. Infrastruct. Solut. 2025, 10, 19. [Google Scholar] [CrossRef]
  58. Perera, R.; Huerta, M.C.; Baena, M.; Barris, C. Analysis of FRP-Strengthened Reinforced Concrete Beams Using Electromechanical Impedance Technique and Digital Image Correlation System. Sensors 2023, 23, 8933. [Google Scholar] [CrossRef]
  59. Providakis, C.; Tsistrakis, S.; Voutetaki, M.; Tsompanakis, J.; Stavroulaki, M.; Agadakos, J.; Kampianakis, E.; Pentes, G.; Liarakos, E. An Innovative Active Sensing Platform for Wireless Damage Monitoring of Concrete Structures. Curr. Smart Mater. 2016, 1, 49–62. [Google Scholar] [CrossRef]
Figure 1. Schematic representation of the experimental set-up and SHM method.
Infrastructures 10 00060 g001
Figure 2. A schematic representation of the loading sequence and EMI measurements.
Infrastructures 10 00060 g002
Figure 3. Mechanical response of Specimen 1: (a) stress–strain diagram of Specimen 1; (b) cracking pattern of Specimen 1.
Infrastructures 10 00060 g003
Figure 4. The EMI responses of (a) PZΤ Up; (b) PZΤ Mid; and (c) PZΤ Down of Specimen 1.
Infrastructures 10 00060 g004
Figure 5. The CCC values of utilized metric distances of Specimen 1 PZTs.
Infrastructures 10 00060 g005
Figure 6. Hierarchical clustering dendrogram of PZT Up of Specimen 1.
Infrastructures 10 00060 g006
Figure 7. Hierarchical clustering dendrogram of PZT Mid of Specimen 1.
Infrastructures 10 00060 g007
Figure 8. Hierarchical clustering dendrogram of PZT Down of Specimen 1.
Infrastructures 10 00060 g008
Figure 9. Mechanical response of Specimen 2: (a) stress–strain diagram of Specimen 2; (b) cracking pattern of Specimen 2.
Infrastructures 10 00060 g009
Figure 10. The EMI responses of (a) PZΤ Up; (b) PZΤ Mid; and (c) PZΤ Down of Specimen 2.
Infrastructures 10 00060 g010
Figure 11. The CCC values of utilized metric distances of Specimen 2 PZTs.
Infrastructures 10 00060 g011
Figure 12. Hierarchical clustering dendrogram of PZT Up of Specimen 2.
Infrastructures 10 00060 g012
Figure 13. Hierarchical clustering dendrogram of PZT Mid of Specimen 2.
Infrastructures 10 00060 g013
Figure 14. Hierarchical clustering dendrogram of PZT Down of Specimen 2.
Infrastructures 10 00060 g014
Figure 15. Mechanical response of Specimen 3: (a) stress–strain diagram of Specimen 3; (b) cracking pattern of Specimen 3.
Infrastructures 10 00060 g015
Figure 16. The EMI responses of: (a) PZΤ Up; (b) PZΤ Mid; and (c) PZΤ Down of Specimen 3.
Infrastructures 10 00060 g016
Figure 17. The CCC values of utilized metric distances of Specimen 3 PZTs.
Infrastructures 10 00060 g017
Figure 18. Hierarchical clustering dendrogram of PZT Up of Specimen 3.
Infrastructures 10 00060 g018
Figure 19. Hierarchical clustering dendrogram of PZT Mid of Specimen 3.
Infrastructures 10 00060 g019
Figure 20. Hierarchical clustering dendrogram of PZT Down of Specimen 3.
Infrastructures 10 00060 g020
Disclaimer/Publisher’s Note: The statements, opinions and data contained in all publications are solely those of the individual author(s) and contributor(s) and not of MDPI and/or the editor(s). MDPI and/or the editor(s) disclaim responsibility for any injury to people or property resulting from any ideas, methods, instructions or products referred to in the content.

