Article

The Importance of Structural Configuration in the Seismic Performance and Reliability of Buildings

by
Rodolfo J. Tirado-Gutiérrez
*,
Ramón González-Drigo
and
Yeudy F. Vargas-Alzate
Department of Civil and Environmental Engineering, Polytechnic University of Catalonia (UPC), Jordi Girona, 1-3, 08034 Barcelona, Spain
*
Author to whom correspondence should be addressed.
Infrastructures 2025, 10(12), 325; https://doi.org/10.3390/infrastructures10120325
Submission received: 24 October 2025 / Revised: 16 November 2025 / Accepted: 21 November 2025 / Published: 26 November 2025
(This article belongs to the Topic Resilient Civil Infrastructure, 2nd Edition)

Abstract

The optimal performance of buildings strongly depends on their structural configuration, as it influences the structural response to expected loads during life service. For instance, structural arrangements oriented to reduce torsional effects increase performance and, in turn, mitigate vulnerability to seismic events. However, several structural analyses should be performed to ensure that these structural arrangements are robust This can be computationally expensive depending on the type of analysis. The objective of this research is twofold. The first objective is to compare the dynamic response of two reinforced concrete buildings that are almost identical in height and floor area but whose structural elements are placed differently. The dynamic response of both structures was calculated via nonlinear dynamic analysis (NLDA) by considering a large set of ground motion records. Second, NLDA results were compared with those stemming from a spectral-based methodology. The comparison is made on the basis of the fragility and damage functions given different return periods. The results show that an adequate spatial distribution of structural elements reduces materials and increases safety and stability, since the expected damage is lower. Likewise, it is observed that the results based on reduced-order procedures accurately represent those obtained from NLDA while entailing a significantly lower computational cost.

1. Introduction

The current geopolitical panorama has had a global impact on the costs of raw materials for the construction industry [1]. Wars not only have devastating consequences in human and social terms, they also have a direct impact on the rise, availability and accessibility to raw materials [2]. The inflation of the prices of steel, cement, wood and other essential resources in construction has become one of the most important obstacles in the development of housing units. Therefore, any effort to address this housing crisis must adopt an integral approach, prioritizing structural safety as a fundamental element [3]. The latter refers to the capacity to withstand loads to which a structure could be potentially subjected without failing or collapsing [4]. It involves the consideration of factors such as stability, strength, durability and ability to withstand emergency situations [5]. To ensure structural safety, specific practices and regulations must be implemented in the design and construction of buildings. This may include the use of sophisticated analyses and evaluation techniques to perform a detailed study of the structural configuration [6]. The incorporation of protection systems against natural hazards should also be considered in the analysis [7]. The introduction of innovative technologies such as low-cost and highly durable composite materials, as well as the promotion of efficient and environmentally friendly construction techniques, emerges as a crucial response to the challenge [8]. The search for such solutions minimizes dependence on exhaustible resources and fosters structural resilience [9]. In this context, the need to adopt sustainable design and construction approaches becomes even more pressing [10].
To achieve the latter objective, on the one hand, it should be born in mind that proper modeling is a fundamental part of structural design and evaluation, especially in earthquake-prone areas. Throughout history, structural analysis has undergone a continuous evolution in an effort to understand and predict the behavior of buildings during seismic events. Initial applications emerged at the end of the 19th century, when various regulations began to incorporate static analyses that considered lateral loads from 10% of the weight of the structure [11]. For a long period of time, such seismic forces remained in seismic codes. However, toward the middle of the 20th century, more advanced analyses approaches emerged, such as the Response Spectrum Method (RSM) [12]. Although this method is dynamically more rigorous than simply considering a static force based on the weight of the structure, it falls short as the structure under analysis becomes taller or more torsional—not to mention that nonlinear considerations are adopted in an indirect manner [12]. Subsequently, methods such as nonlinear static analysis (pushover analysis, PA) began to address the nonlinearity that structures experience when faced with high load demands, such as those potentially generated by an earthquake [13]. As a counterpart, classic PA is not able to properly capture the participation of higher modes. Modifications of PA methods to overcome this limitation have been a topic of interest. Nowadays, the application of sophisticated approaches, such as nonlinear dynamic analysis (NLDA), has made it possible to adequately consider not only the nonlinearity but also the stochastic character of seismic actions and their influence on the dynamic response of the system [14]. Numerically, the results obtained from the NLDA should be considered as a reference for any other type of structural analysis that intends to calculate the seismic response of a structure.
On the other hand, structural configuration refers to the arrangement and connection of structural elements and is of central importance in this article. The way in which the components are arranged and linked together determines the ability of the structure to resist loads, redistribute forces and maintain overall stability. Moreover, the structural configuration influences the design efficiency and economy, as a proper layout can minimize the use of materials without compromising structural integrity. For instance, a well-configured structural design can improve the response to seismic events, reducing the risk of severe damage. In summary, both the type of structural analysis and the structural configuration are fundamental elements in the seismic design of structures. A thorough understanding of these aspects not only improves the safety and stability of buildings but also contributes to the efficient and sustainable use of resources. In a society where infrastructure plays a crucial role, the careful application of these principles becomes imperative for the long-term development and safety of urban environments [15].
In line with the above, one of the main objectives of this paper is to compare, in a probabilistic manner, the seismic vulnerability of two reinforced concrete buildings constructed in a high seismicity zone. Particularly, these buildings have been designed under the Colombian seismic resistant design code, NSR-10 [16]; the structural analysis employed for design has been the NLDA. What is most important of these buildings, for the purpose of this study, is that they have similar architecture (spaces, shapes) but different structural configurations, as detailed below.
The randomness of the seismic action has been taken into account in the analysis using real ground motion records. As a first stage, the results have been compared to show the importance of the structural configuration. It has been observed that a building planned with the aim of avoiding torsional effects is always a less vulnerable configuration. The above conclusion has been developed after assessing the probability of damage that a structure may experience when it is subjected to natural phenomena such as an earthquake. The vulnerability of the buildings has been evaluated by means of the probability of exceeding different damage states thresholds (fragility functions) for different intensity levels. Fragility functions have been derived with respect to an engineering demand parameter (EDP), in this particular case, the maximum inter story drift (MIDR). The latter has been estimated by means of NLDA. Notwithstanding, the computational effort associated with NLDA is very high, especially when probabilistic analyses are required [11,13]. For this reason, the second objective of this paper is to compare the structural response estimated from the NLDA and a recently proposed reduced-order method (ROM) [17], which is based on the generation of transfer functions. Its main basis is the analysis of the Fourier’s spectra [18] of time–history records representing both seismic action and structural response. This approach allows analyzing, in a probabilistic way and without losing statistical efficiency, complex systems with a low computational cost. The comparison between these two methods has also been carried out in terms of fragility functions [19]. This assessment confirms the good approximation of the results obtained by applying the ROM with respect to those obtained by using sophisticated methods such as NLDA. This computational reduction allows assessing several structural configurations in a fraction of time whilst providing similar results to the most advanced NLDA.

2. Buildings Description and Modeling Considerations

In this research, two buildings located in the city of Pereira, Colombia, are examined. This city is near the “Romeral Fault System” [20], where in January 1999 one of the most devastating earthquakes in the history of the country occurred, causing a significant number of fatalities as well as having a major socio-economic impact. The structural system of the buildings is “combined” between frames (columns and beams) and reinforced concrete walls, which is an extended design solution in the region due to its structural strength, stability and ductility. The buildings share the same use (residential occupancy); therefore, their importance factor is equal to one (see NSR-10) [16]. They also have an identical number of floors (22), equal height (approximately 71.00 m), and the same number of housing units (160). However, the spatial arrangement of the structural elements is different. The analysis and design of both structures have been carried out considering the design spectrum of the region, which is defined within the requirements of the Colombian seismic-resistant design regulation, NSR-10 [16]. Since the NLDA has been employed in the design stage, requirements for compatibility between the spectra of the selected ground motions and the design spectrum have been considered according to ASCE-7-16 [21]. Further details can be seen in the following sections. Regarding the design of the structural elements, the requirements stated in ACI-318 [22] have been considered. Note that both structures have been designed using the same acceleration records, since they share the same location (same construction site, same geotechnical study) and have a similar fundamental period. It is worth mentioning that the buildings under study present dynamic characteristics of tall buildings, i.e., vibration periods longer than 2 s, as well as an important participation of mass in higher modes [23], as shown in Table 1. This table shows the fundamental periods in the main directions ( T t x and T t y ), which are translational modes, and also the fundamental period related to the rotational mode around the z-axis ( T r z ). It can be seen that in building 1 (B1), T t y and T r z are closer together than in building 2 (B2), which increases the coupling between the translational and the rotational response. This can be particularly problematic during seismic events, where coupling can amplify the response and cause potential structural damage. Furthermore, the mass participation factor associated with the rotational mode is greater in B2 than in B1, which means that B1 is more affected by the higher modes. For this reason, a key aspect of this research is the use of NLDA, as this approach has the ability to adequately consider the effect of higher modes within the structural response. In seismic codes, for example, when NLDA is not applied, it is necessary to increase the seismic demand for torsional effects associated with irregularities in the floor plan.
Three-dimensional models have been created to assess the dynamic response of the structures, one for each building, using the finite element software Etabs ultimate 2017 [24], through which the spatial distribution of the mass and the stiffness of the structure are represented. Both models have been elaborated using frame elements to represent beams and columns and shell elements to represent shear walls; floors have been modeled by using membrane elements. As for the shear walls, their main contribution is to provide stiffness to the system. At the foundation level, it is hypothesized that the elements are fixed (see the Tall Buildings Initiative (TBI—Guidelines for Performance-Based Seismic Design of Tall Buildings) [23]. One of the reasons for fixing the models at the base arises from the complexity of calculating the structural response. It should be noted that when performing soil–structure interaction analysis (e.g., using piers at the base), the period of the building undergoes a natural elongation due to the increased flexibility of the system. Also, damping is compromised, since in many cases, the structure is overdamped. In line with the above, an elongation of the fundamental period of the SSI models of about 10% compared to the fixed base has been observed in the design phase of these structures. This elongation in the dynamic properties of the structure has been considered negligible, especially since the resultant dynamic force that would act on the structure was smaller. As for the maximum drift ratio between floors, the results have also been similar in both modeling approaches. These results are consistent with the observations provided by the Tall Buildings Initiative [23]. A detailed description of the design of each building is presented below, including geometric and material features (total quantities), loading considerations, and performance objectives, among other characteristics.

2.1. Nonlinear Dynamic Analysis

The intense phase of an earthquake can last up to tens of seconds, in which the masses rapidly change direction with sudden movements that can generate degradation and the loss of capacity of a structure. This nonlinear process can be modeled using numerical analyses such as NLDA [14]. This consists of solving the dynamic equation of motion, which considers modifications in the stiffness and damping matrices if any structural element enters the nonlinear range. This equation is given by the following expression:
M u ¨ ( t ) + C ( u )   u ˙ ( t ) + K ( u )   u ( t ) = f ( t )
where M, C and K are the mass, damping and stiffness matrices, respectively; f(t) is the dynamic input force; u (t), u ˙ (t) and u ¨ (t) are vectors representing displacement, velocity and acceleration, respectively. It is worth mentioning the dependence of the damping and stiffness matrices on the deformation field of the structure; these terms (C and K) condense the nonlinear effects. When performing NLDAs, it is necessary to know the moment–curvature or moment–rotation relationships of the structural elements, either in biaxial bending or in biaxial flexo-compression [25]. Figure 1 shows an idealization of the load–deformation diagram used to model the plasticization mechanisms according to ASCE 41-17 [26] and FEMA 356 [27].
The hysteretic properties of reinforced concrete are defined through the pivot hysteresis model, which is efficiently adjusted to represent the nonlinear response of elements built with this material [28]. This model allows the incorporation of effects such as cyclic axial loads, asymmetric sections and biaxial bending, among other features. The main advantage lies in its ability to capture the predominant nonlinear characteristics of the dynamic response by means of geometry-based rules. The results derived from this model adequately match the ones observed when using more refined, although computationally more demanding, assumptions such as those based on the fiber concept. Another important aspect to take into account when estimating the dynamic response of a structure is the damping model. In this research, Rayleigh’s proportional damping has been used to this end [29].

2.2. Geometric Nonlinearity (P-Delta Effects)

P-delta represents the effect of a compressive load affecting the transverse stiffness of an element subjected to horizontal displacements, increasing the expected deformation and consequent damage [30]. In tall buildings, it is important to take this effect into account as it can significantly increase the effective shear stress at each floor [31]. The new provisions of ASCE 7-16 [21] address geometric nonlinearity by requiring that P-delta effects be included in the structural analysis. In general, this approach is acceptable if applied correctly, but some precautions must be taken into account as different mathematical models can be used to account for geometric nonlinearity [32]. At this regard, different approaches to capture second-order effects are presented in [33]. In the present investigation, p-delta effects have been taken into account in the modeling of the two buildings from the consistent model described in [34].

2.3. Performance Levels

The behavior of a structure exposed to a seismic event can be described by the maximum allowable damage state (represented by the rotations of the hinges) [35,36]. This structural behavior can be defined based on three specific performance levels: Immediate Occupancy (IO), Life Safety (LS) and Collapse Prevention (CP), and two intermediate performance ranges, Damage Control (Dc) and Limited Safety Level (Ls) (see Figure 1) [32]. In terms of design, it is expected that for a structure subjected to a set of ground motions matched to the design spectrum (return period equal to 475 years), the LS cannot be exceeded. This criterion has been applied when designing both structures [37]. For the buildings analyzed, using the design software (Etabs 17), it has been verified that the seismic demand on structural elements (beams, columns, and walls) remains below the LS. Likewise, the damage thresholds for deriving fragility functions can be defined based on four damage states: Slight (ds1 = 0.5%), Moderate (ds2 = 1.0%), Extensive (ds3 = 2.0%) and Complete (ds4 = 3.0%). These thresholds have been defined in terms of the maximum inter-story drift ratio (see Table C1-3 of FEMA 356) [27], which was deployed to understand the probability of damage that structures can reach when subjected to different intensity levels.

2.4. Building 1 (B1)

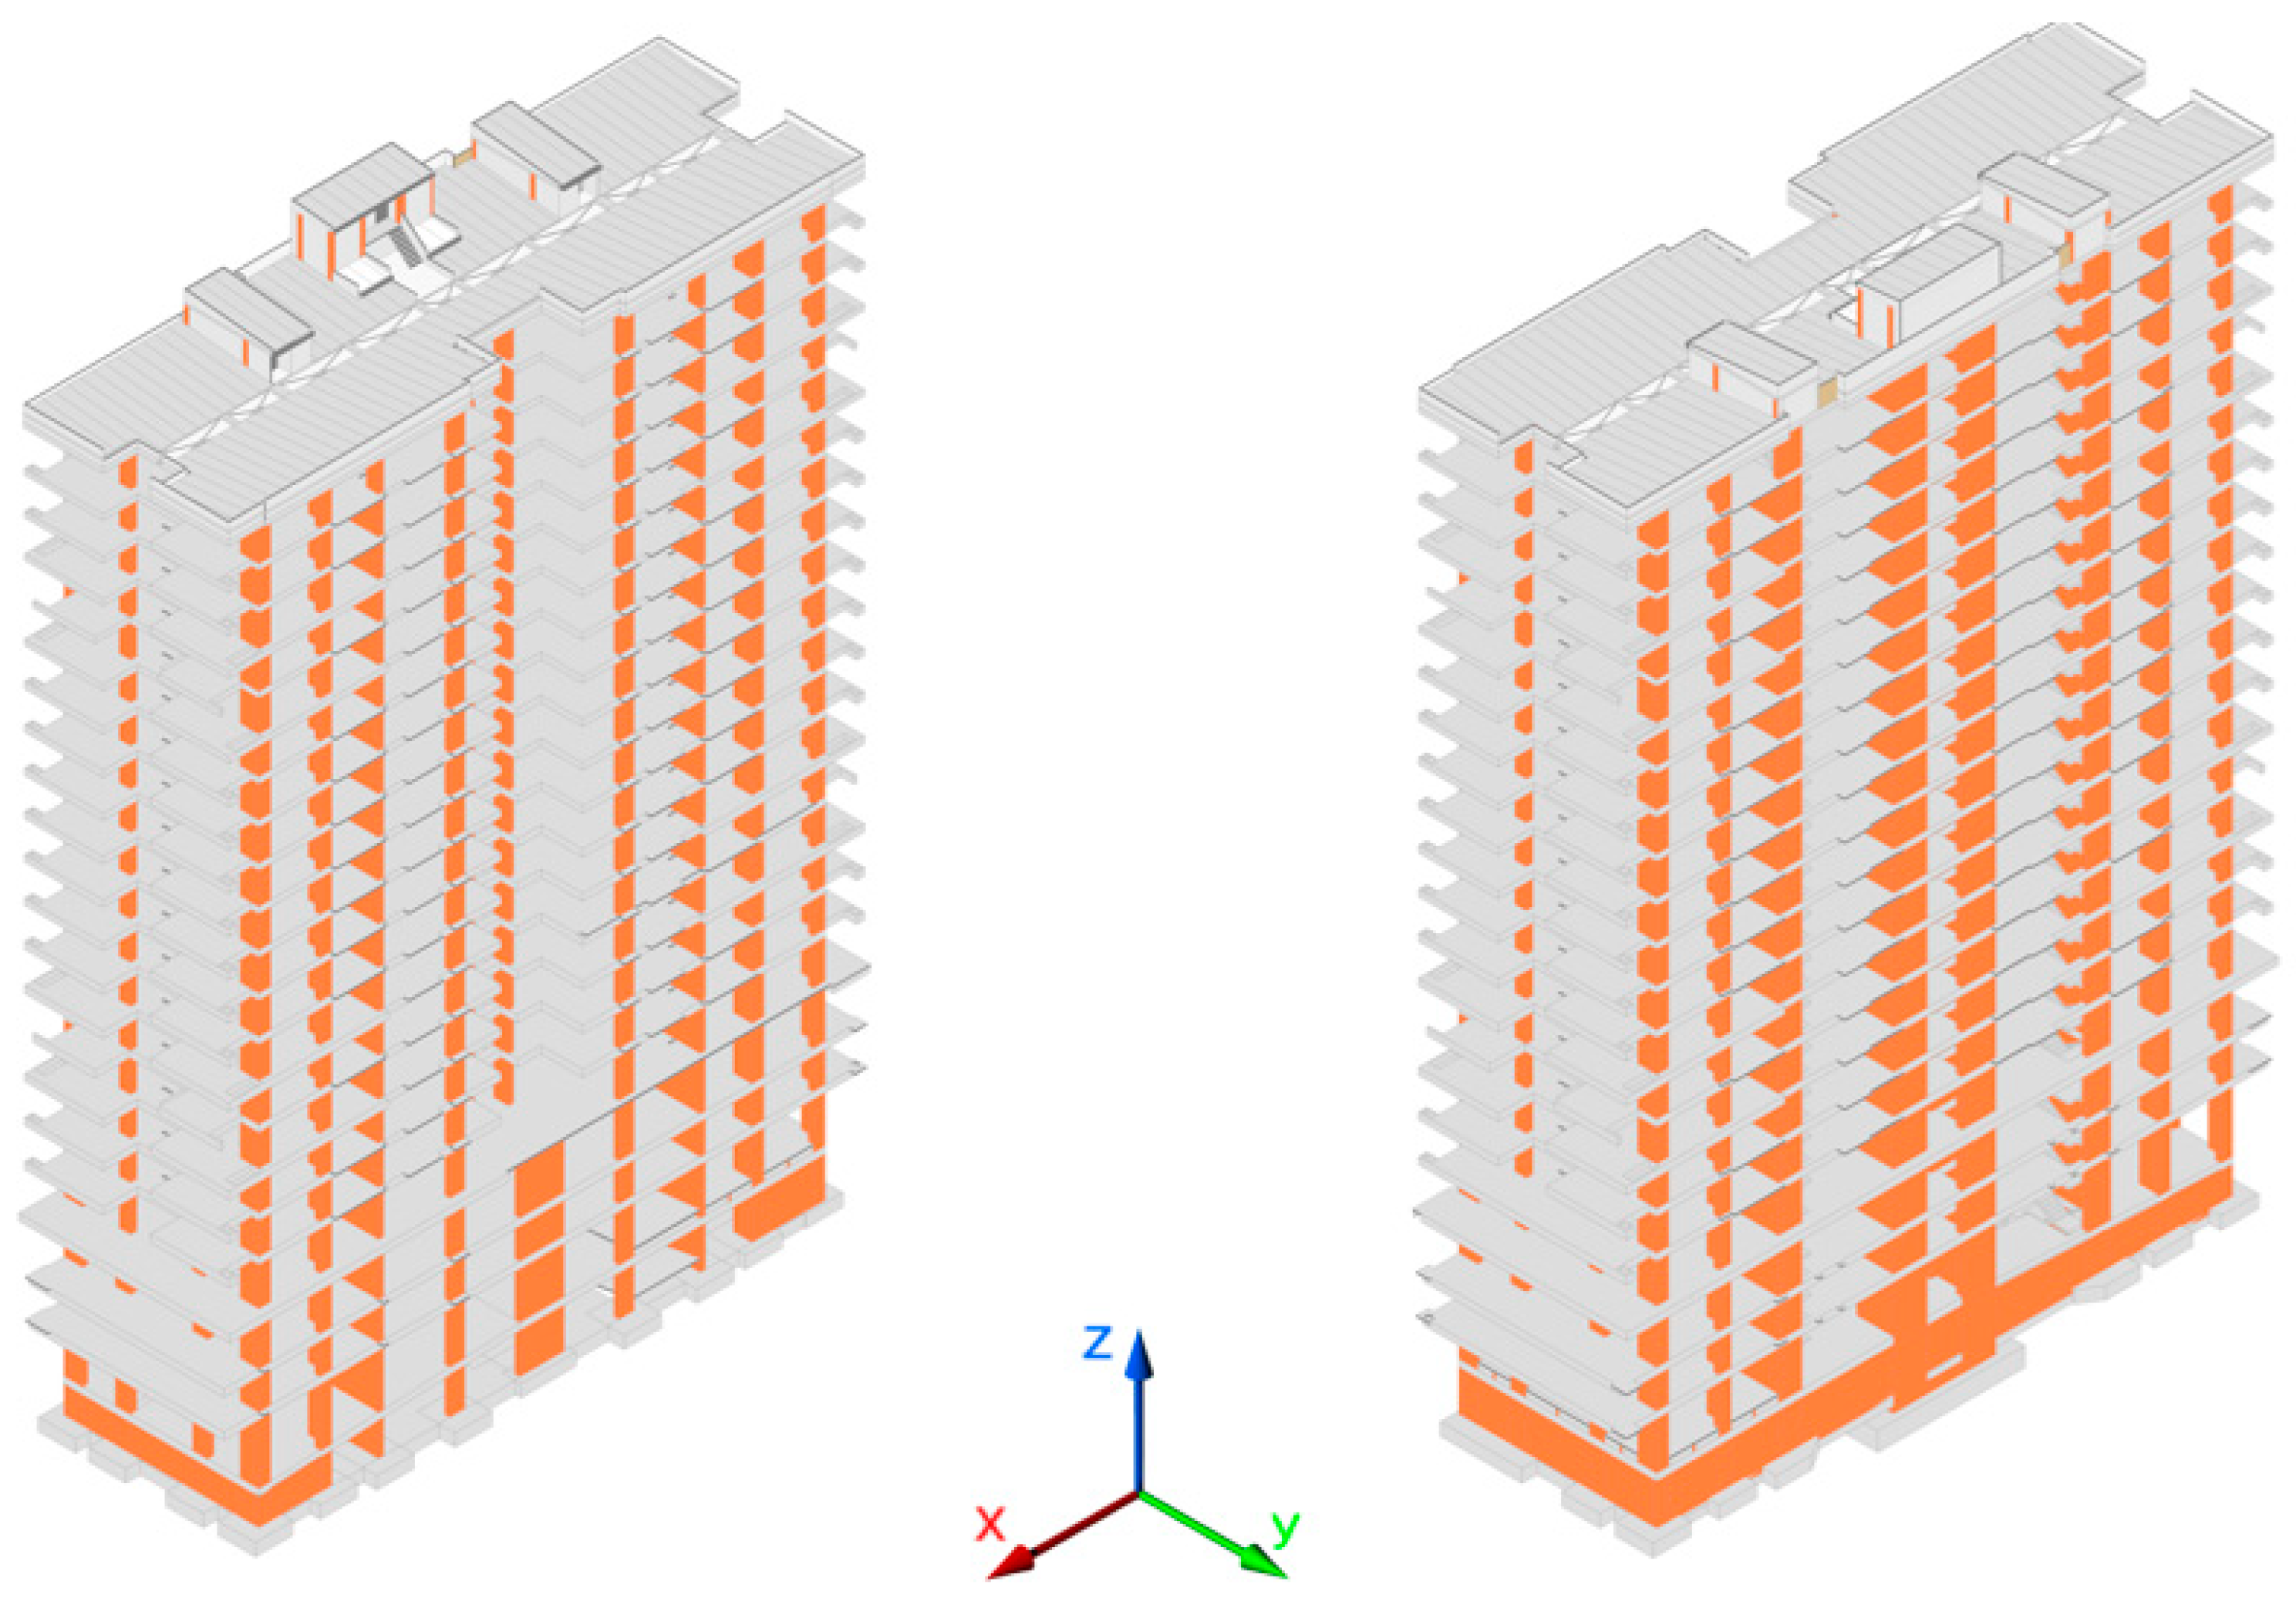
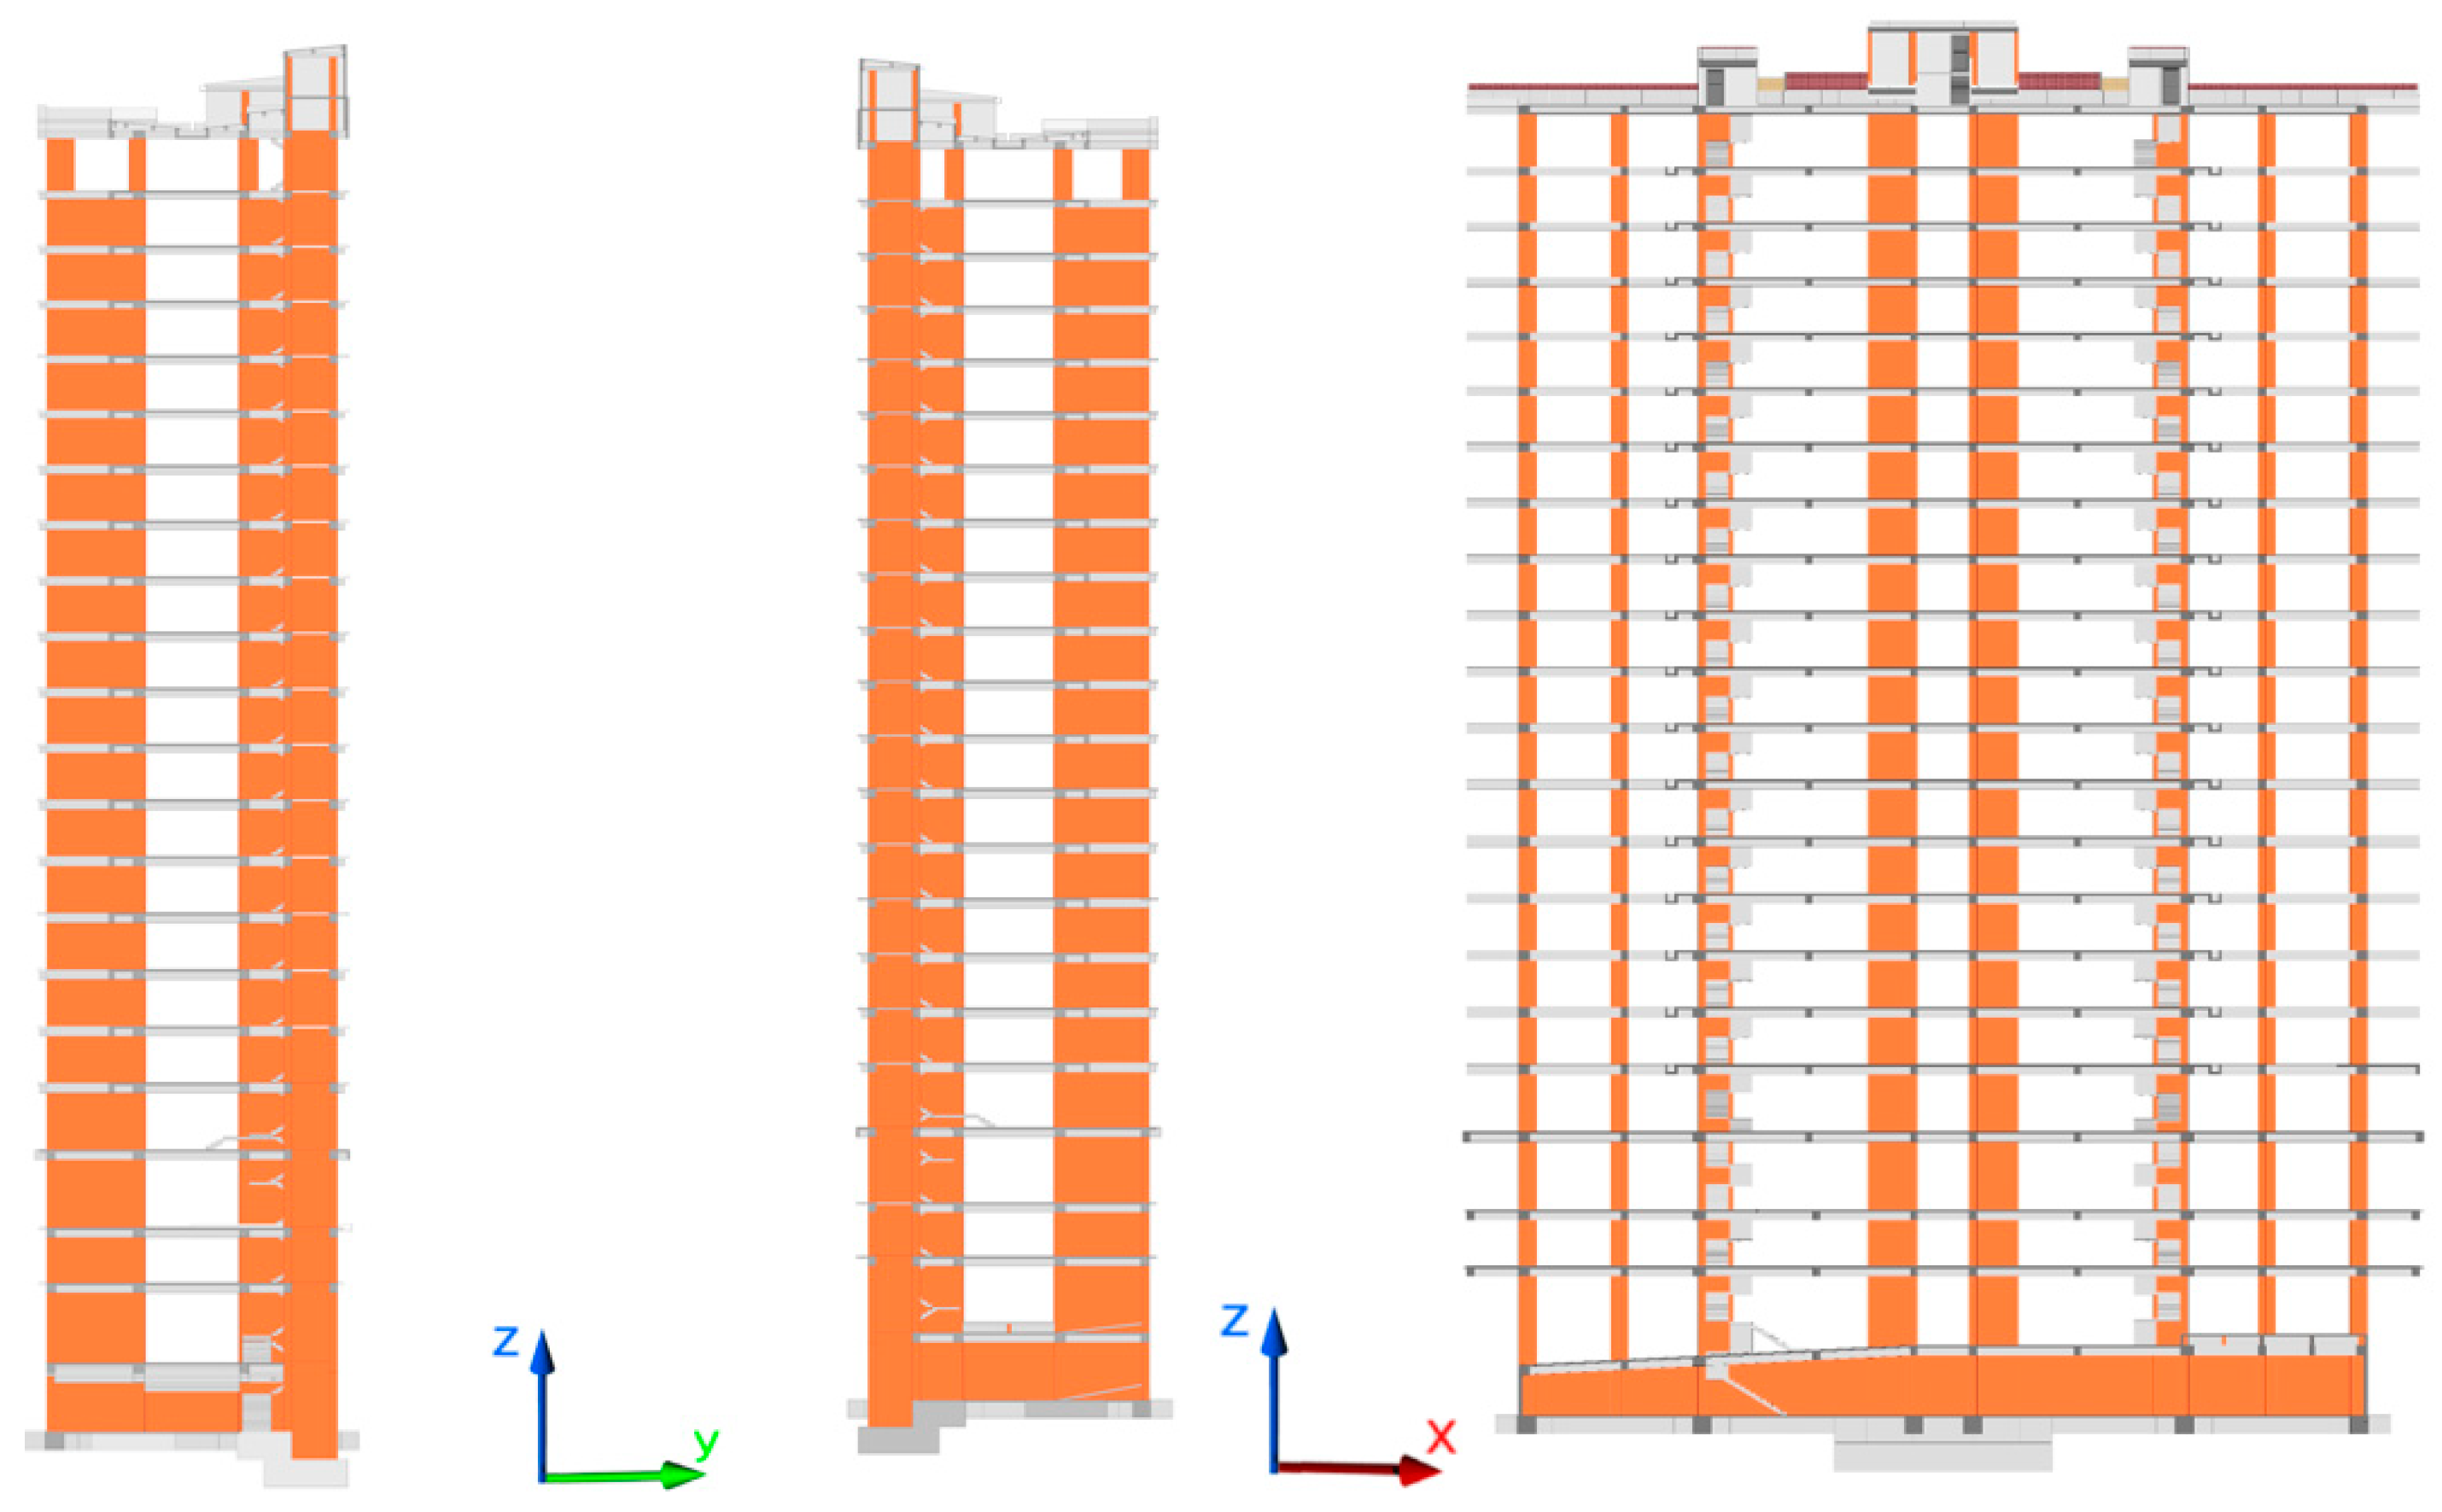
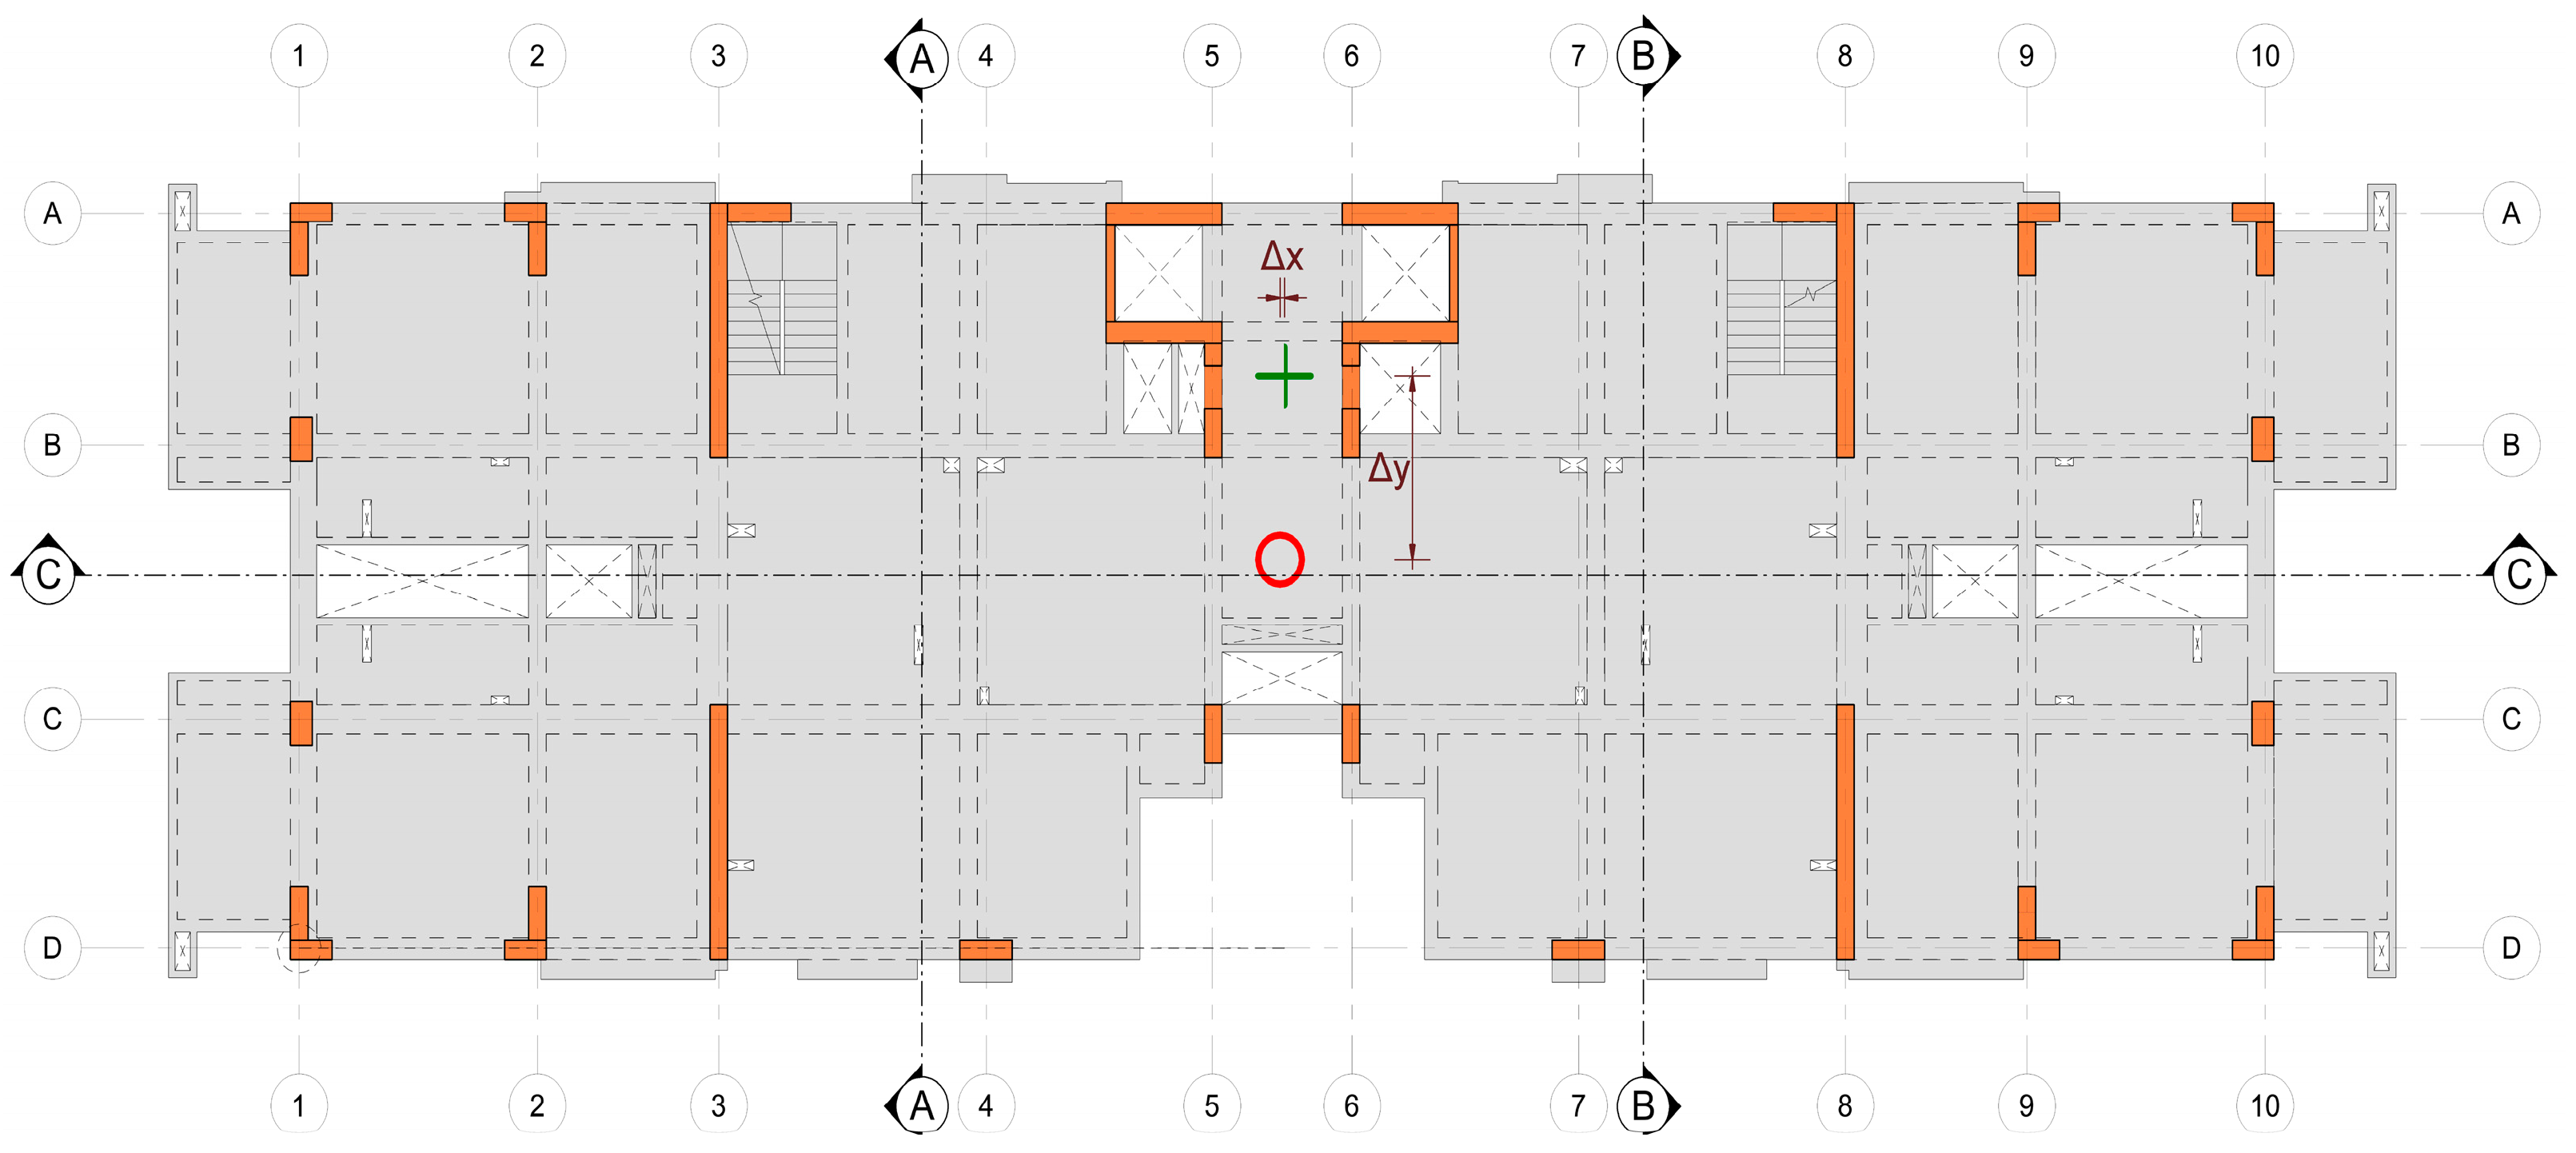
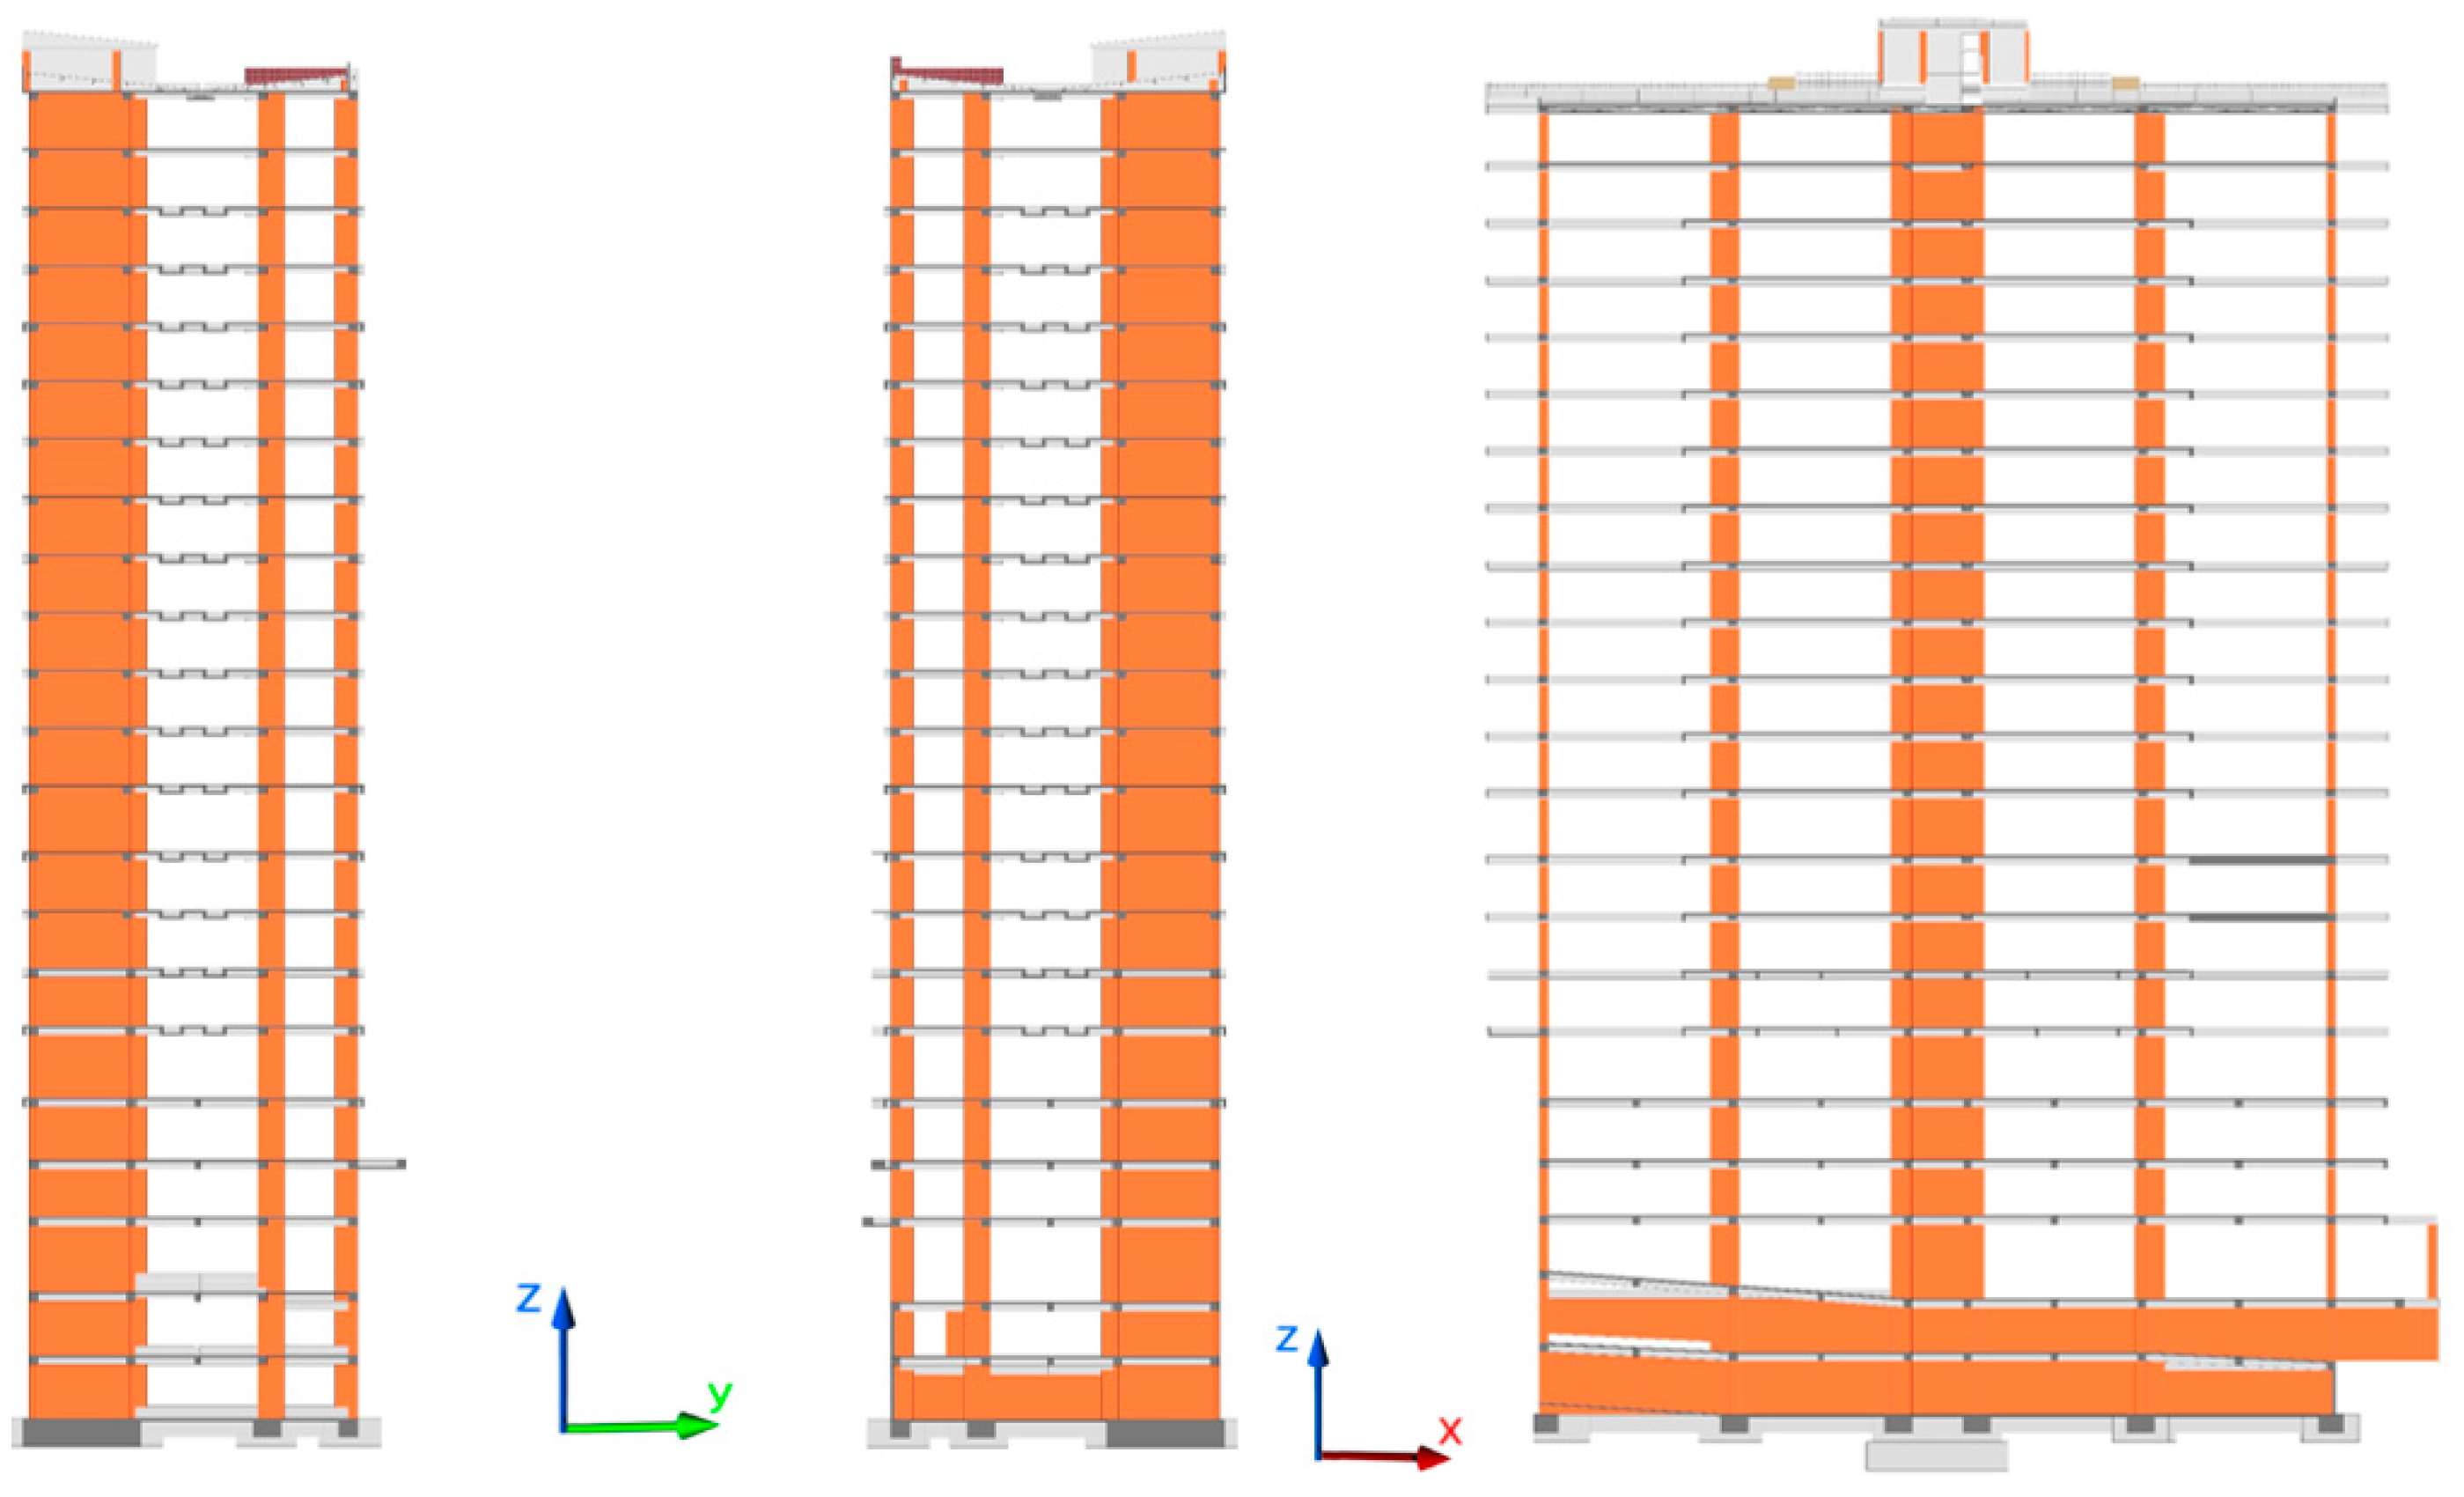
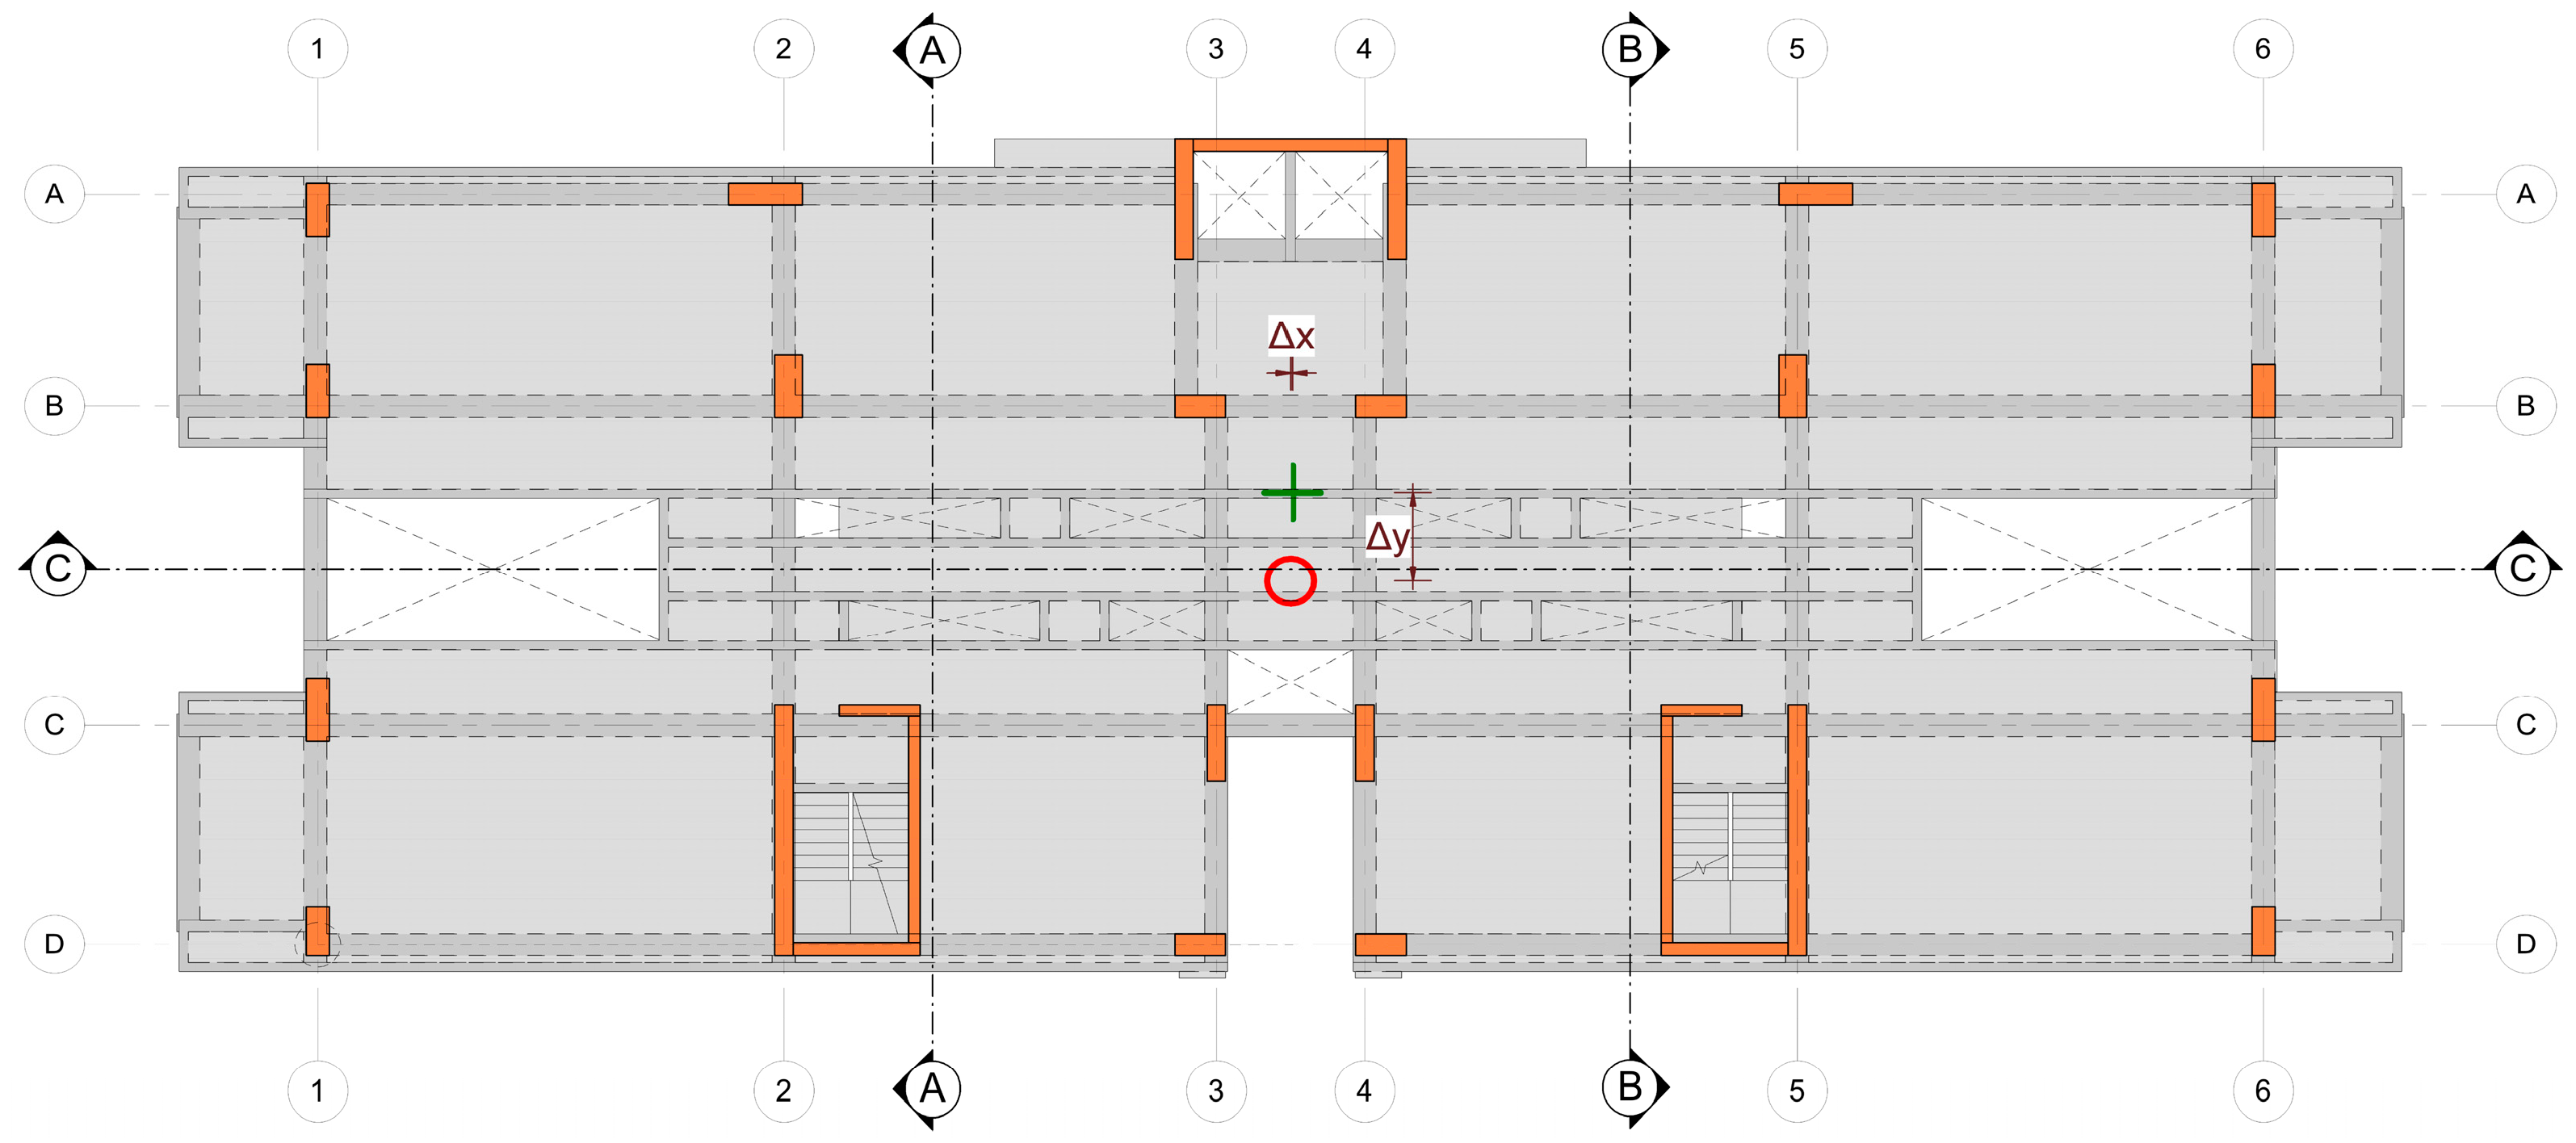
Figure 2 shows the three-dimensional model of the first building under study, which is denoted as B1. This sketch visualizes the main façade and the rear view of the structure. It is worth mentioning that this building has also been studied in Tirado-Gutiérrez et al., 2024 [17]. Figure 3 shows both transverse and longitudinal sections, where the intrinsic connection between the different elements that make up the earthquake-resistant system can be seen. B1 has a floor plan layout (columns and walls) consisting of ten axes in the X direction and five axes in the Y direction (see Figure 4). It can be seen how in axes 1, 2, 9 and 10, “L”-shaped elements are arranged as well as two rectangular columns. This is largely due to the need to increase the stiffness at the corners of the structure. Axes 3 and 8 present two walls of significant length in relation to the width of the building. The upper wall is topped by another perpendicular wall (see staircase area), contributing an important percentage to the overall stiffness of the building, especially in the Y direction. On the lower side, on axes 4 and 7, two rectangular columns stand out. These columns are provided by the need to collect the cantilever loads. Finally, axes 5 and 6 are composed of columns and walls in the shape of a “C” (see elevator area). This zone represents an important stiffness in the two main directions of the structure with respect to the aforementioned areas. However, this stiffness is concentrated on the upper side of the building, causing the torsional component to increase considerably. The latter is confirmed after verifying the distance between the centers of masses (red circular point) and the center of stiffness (green cross-point), (Δx = 0.10 m, Δy = 3.77 m, see Figure 4). These points represent, respectively, the location of the resultant of the inertial forces developed when the structure undergoes horizontal excitation and the way in which it responds to these loads taking into account its stiffness distribution. Due to the significant distance between the two points, torsional effects can be expected to strongly condition the structural design. Table 2, which can also be found in Tirado-Gutiérrez et al., 2024 [17], summarizes the most relevant characteristics of the structural design of B1, showing, among others, the floor-to-ceiling heights, dimensions, percentages, and strengths of the materials that make up the structural elements.

2.5. Building 2 (B2)

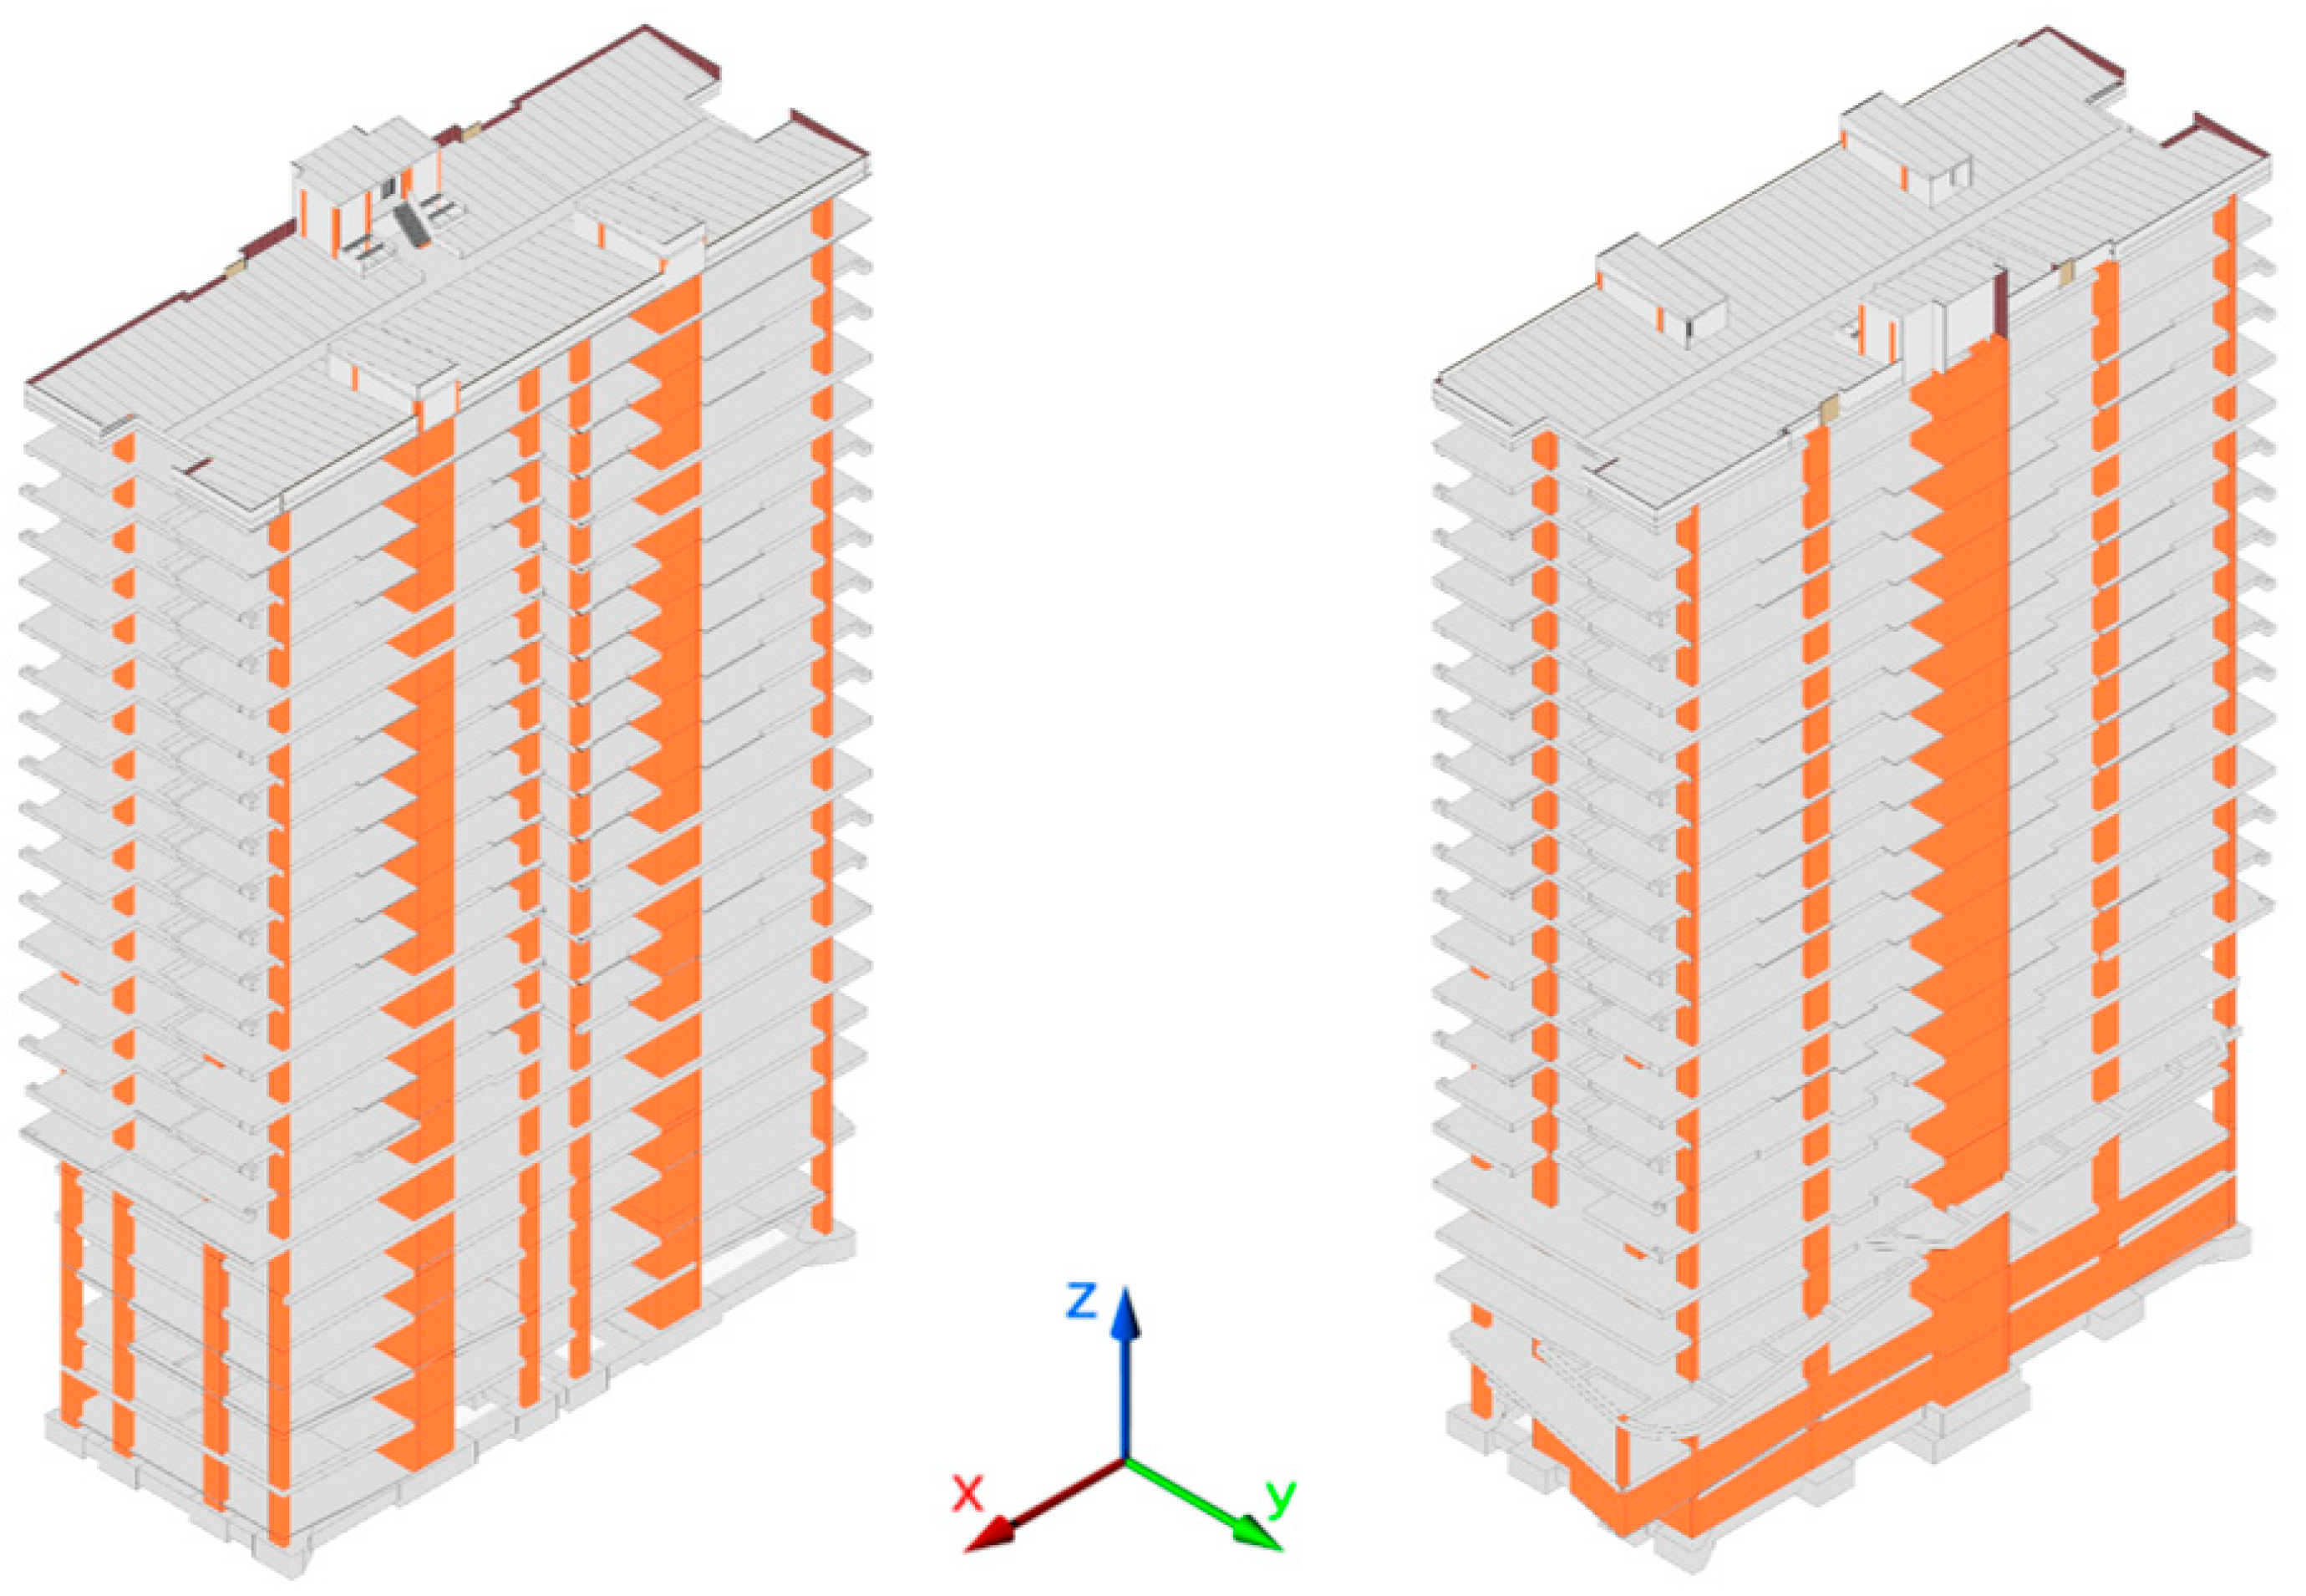
The second building under study, B2, has the same “combined” structural system but a different structural configuration compared to B1. Figure 5 shows the structural system in three dimensions; Figure 6 shows both longitudinal and transversal views, where the union of the column and wall elements with beam-type collector elements can be observed. The distribution of the vertical elements (columns and walls) has been modified for a more efficient structural configuration while maintaining the same architecture and functionality. This structure has six axes in the X direction and four in the Y direction (see Figure 7). The stiffest elements (elevator shafts and stairs) are distributed at the vertices of a triangular area. This composition condenses a high percentage of the overall stiffness of the structure. In addition, this configuration considerably reduces the torsional component due to there being a smaller distance between the center of stiffness and the center of mass (Δx = 0.04 m, Δy = 1.98 m). This results in a reduction of the torque arm between the application point of the resulting inertia forces and the center of stiffness of the building, which in turn leads to a smaller torsional moment.
The axes 1, 2, 5 and 6 present rectangular columns with a smaller section than that of B1. Also, the foundation is composed of piles, heads, and tie beams. As in the case of B1, this model has been idealized as fixed or embedded at the base level [23]. It is worth mentioning that the structural elements composing B2 have the capacity to withstand both gravity loads (finishes and nonstructural elements, among others) and horizontal forces that may occur due to wind or an earthquake according to prescriptions provided by regulations of the studied area. Table 3 summarizes the most relevant characteristics of the structural design of B2, showing, among others, the floor-to-ceiling heights, dimensions, percentages and strengths of the materials, that make up the structural elements.
After comparing Table 2 and Table 3, a reduction in the construction materials used in B2 with respect to B1 can be observed. Since both structures have already been built, the question arises at this point as to why B1 was not designed similarly to B2. To answer this question, it should be noted that although they are part of the same housing project, B1 was built at an earlier stage with respect to B2. In fact, B1 and B2 are next to each other and, originally, the blueprints for B2 were almost identical to those for B1. However, some of the authors of this paper, before the construction of B2, made a proposal to redefine this building in order to reduce the torsional effects. As a result, not only the amount of materials decreases, but also a slight increase in structural performance is observed, as shown in subsequent sections.

2.6. Construction Material Quantities

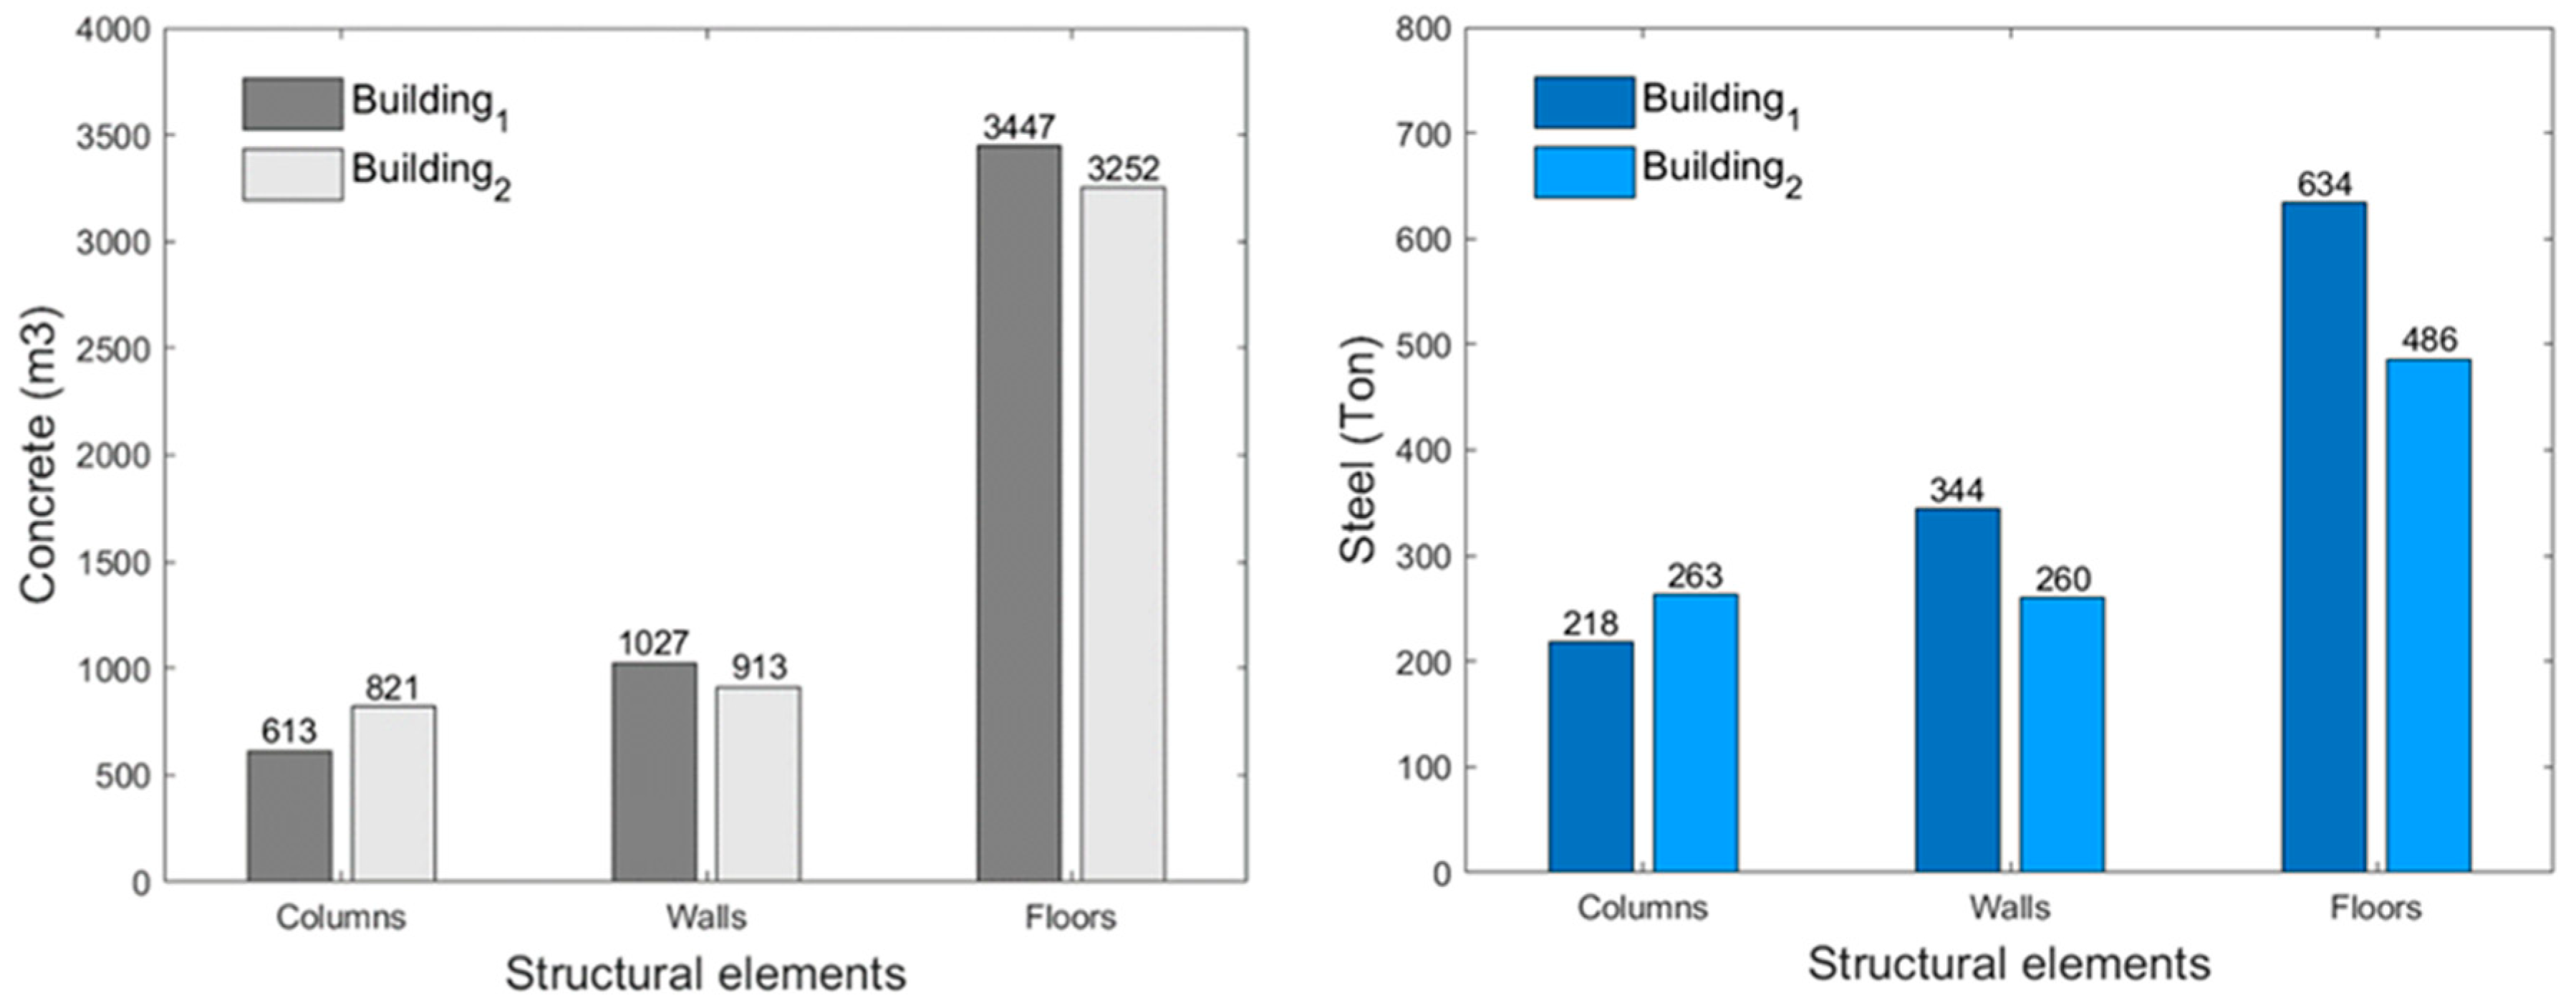
One of the main objectives of this study is to make a comparison between two structural configurations given, in terms of functionality, a similar housing project. This implies contrasting the quantities of materials that make up both systems. Figure 8 details the quantity of the most important materials of the buildings (concrete and steel), which are the result of the structural design. This figure also shows that the configuration of B2 leads to an optimization with regard to the materials employed in B1. Note that B1 has 5087 cubic meters of concrete compared to the 4986 cubic meters of B2. As for steel, B1 has 1196 tons, which compared to the 1009 tons of B2 reflects a significant difference between both configurations. Overall, the result reflects a reduction of 2% and 16% in concrete and steel consumption, respectively. In brief, B2 is more efficient in terms of material consumption, which leads to cost–benefit optimization. As shown below, this optimization is achieved without loss of performance in terms of strength, ductility, functionality and, in general, structural reliability.

3. Seismic Hazard

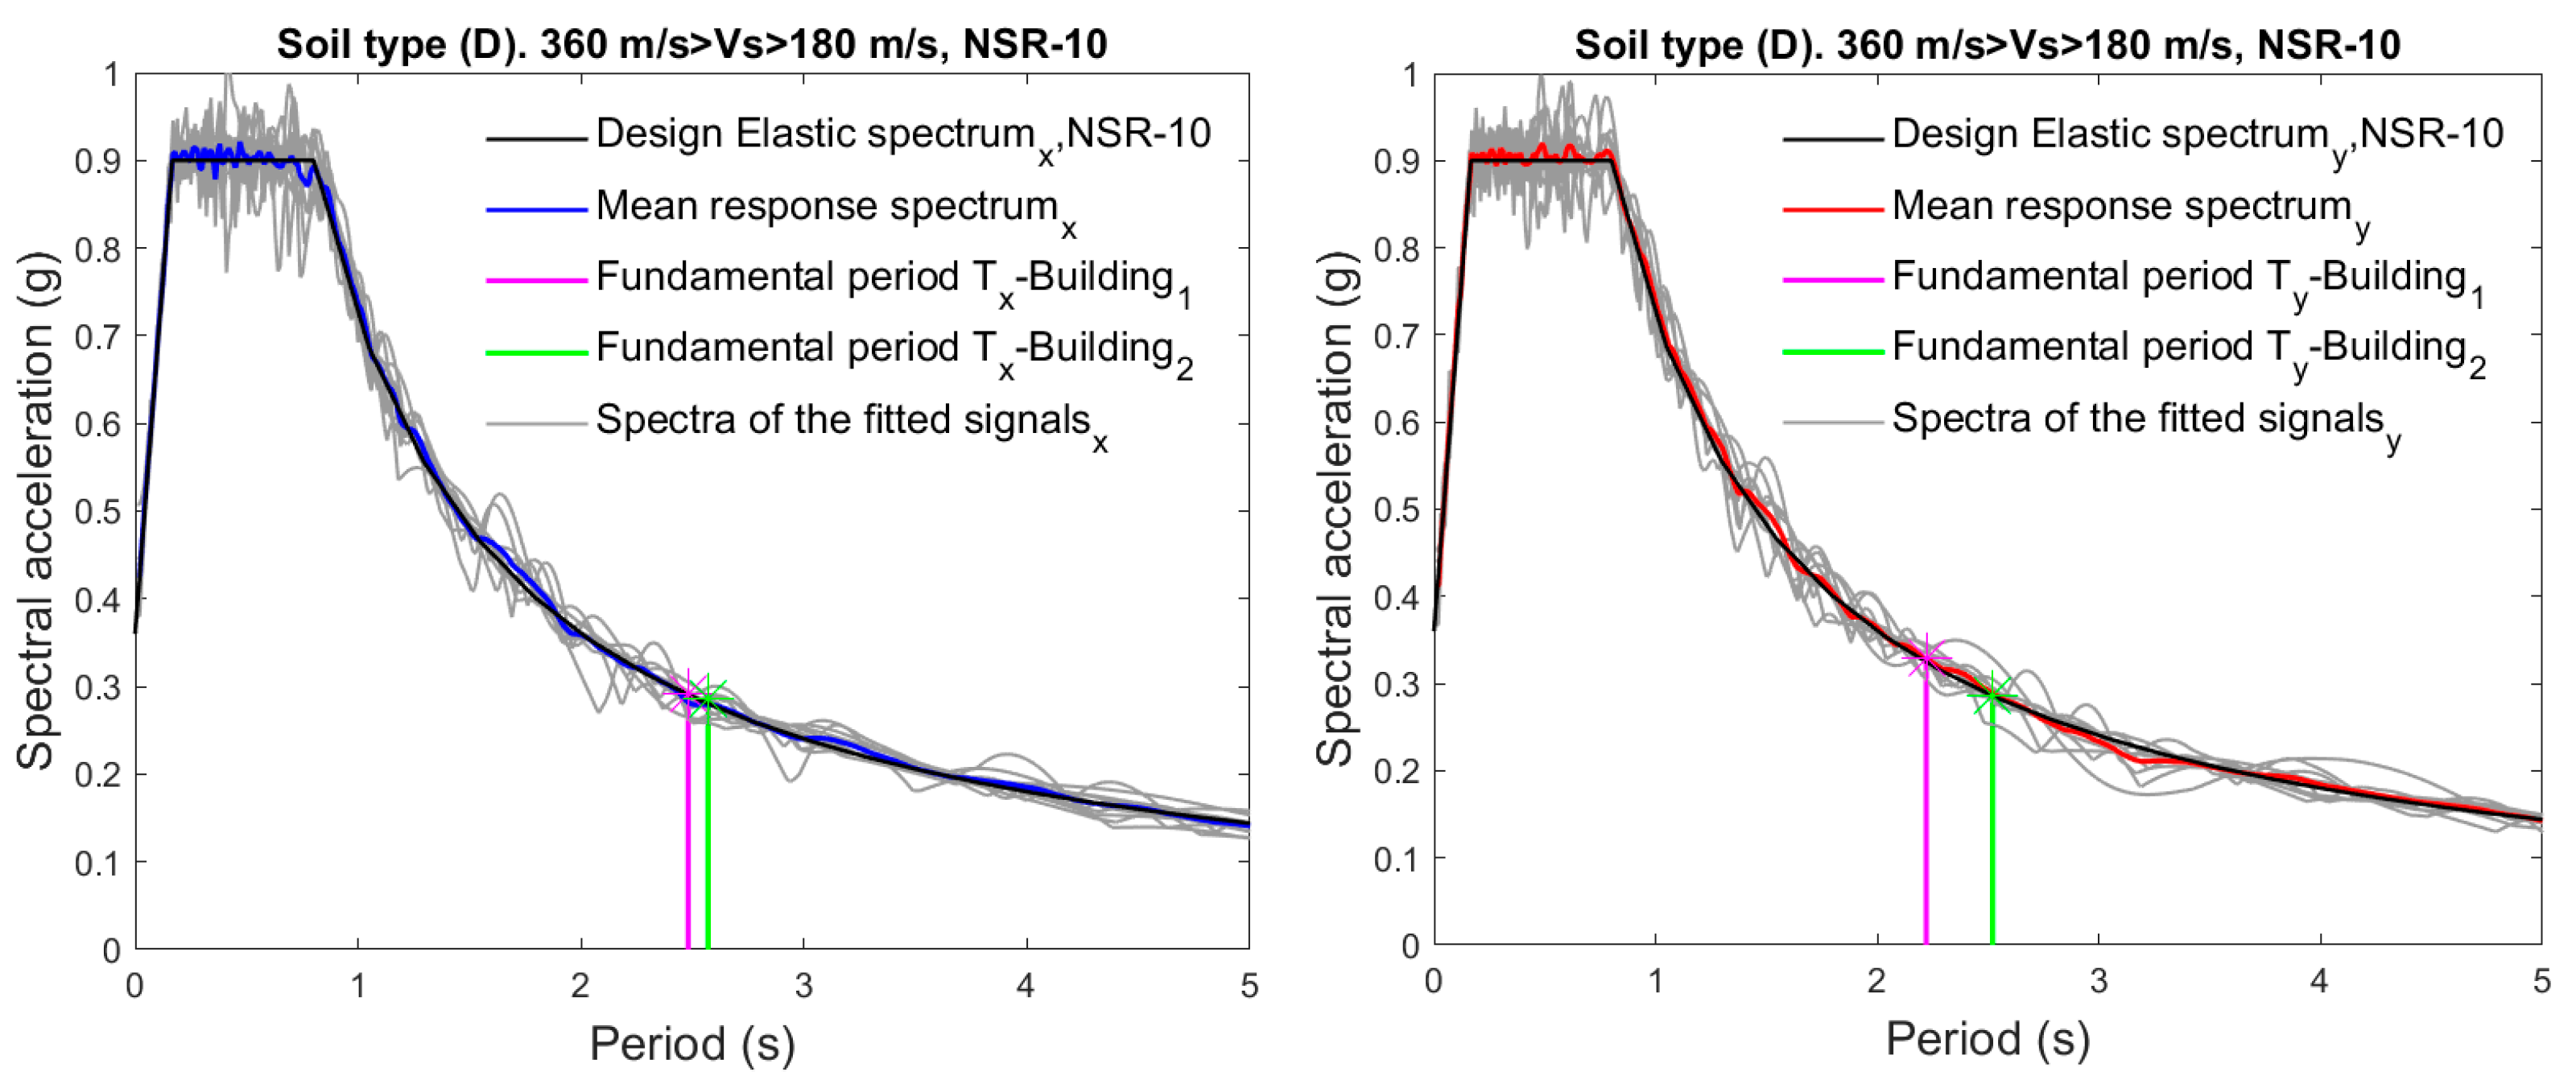
Seismic hazard is a fundamental component in the assessment of risk for a region or structure. When performing NLDAs, it is closely related to the selection and analysis of ground motion records [38]. Assessing the probability of occurrence of earthquakes and their expected intensities at the surface is essential for developing effective risk mitigation strategies [39]. Two approaches have been applied in this study to define seismic hazard. First, the use of hybrid accelerograms has been chosen for the design stage. Starting from actual accelerograms extracted from the Colombian Geological Service database [40] ensures that the frequency content of the signals faithfully reproduces the hazard of the area, and their response spectra are adjusted, in a given range of periods, to a target spectrum prescribed in the building construction code. Note that the actual accelerograms are obtained for the area where the buildings are located (Pereira city). It is worth noting that the Colombian code NSR-10 [16] and the ASCE 7-16 [21] establish a minimum of seven seismic records when applying the NLDA procedure in the design stage. To achieve compatibility, the design spectrum described in the geotechnical study of the buildings has been used to select a set of 10 ground motions records by applying a technique proposed by Vargas-Alzate [13]. This technique allows finding an optimal number of real accelerograms whose mean response spectrum tends to be as similar as possible to the target design spectrum. Then, spectral matching techniques are applied to increase the fidelity between the design spectrum and the spectra of the selected signals. Figure 9 shows both the design elastic spectrum and the response spectra of the ten signals selected and adjusted for designing the structures under study. Based on these adjusted signals, the design of both structures has been performed. Note that the spectra shown in Figure 9 (Left) can also be found in Tirado-Gutiérrez et al. (2024) [17], for the same structure.
The second approach for assessing seismic hazard involves selecting and scaling records of actual ground motions taking into consideration a specific intensity measure (IM). This approach has been oriented to assess vulnerability rather than to design. Yet, some conclusions can also be drawn at a design stage. The purpose of the scaling process is to ensure that the structure reaches different performance levels. In the present investigation, one hundred ground motion records have been used to this end. Note that the same record has not been scaled to different intensity levels. This avoids introducing a spurious correlation between IMs and structural response.
The selecting and scaling procedure applied to the one hundred ground motion records is summarized below:
-
Identify the IM to scale. In this case, the average spectral acceleration around the fundamental period of the building, AvSa, has been used.
-
Define the maximum value of the IM in order to select the scaling bands (ten in this case). This maximum value depends on the level of intensity used for the building design.
-
Select one hundred ground motion records from a database, which have been previously sorted with respect to AvSa. This average acceleration has been taken between 0.1 T and 1.8 T (T is the fundamental period of the structure) as lower and upper limits, respectively. The purpose is to include the contribution of higher modes as well as the softening of the structure due to the accumulation of damage [17].
-
After the sorting performed in the previous step, the ground motion record with the highest IM was scaled so that its new IM value belongs to the highest scaling interval. If the IM naturally fulfills the interval condition, no scale factor is considered. This step is repeated with the subsequent records, according to the sorted list, until the desirable number of records (ten) belonging to the highest interval is obtained.
-
The previous step is repeated for all intervals. Note that the scale factor in step 4 is calculated having in mind that the IM values are uniformly distributed within each interval.
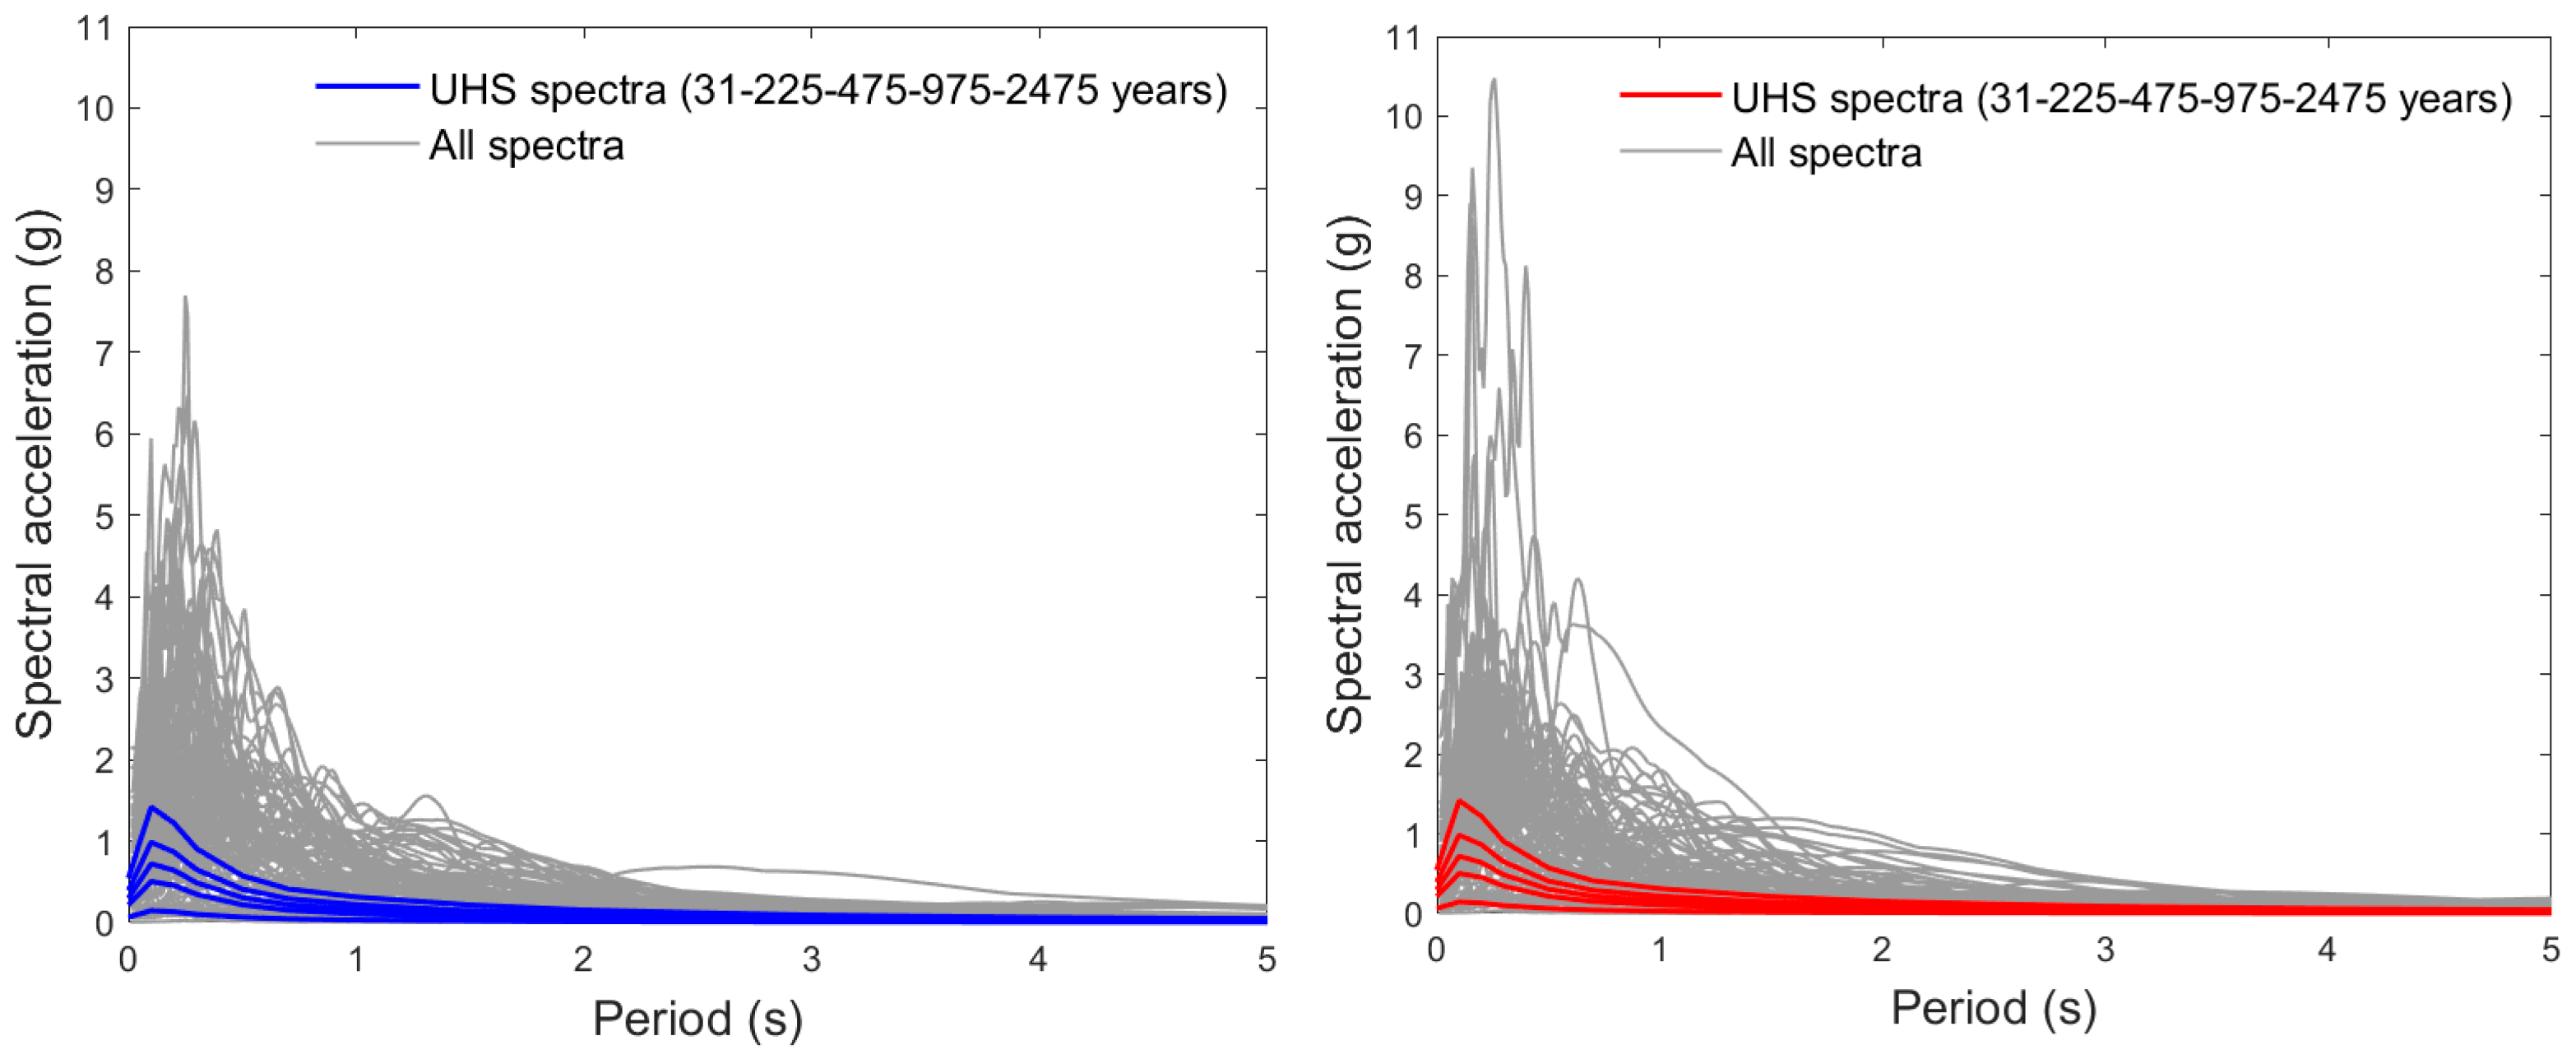
It is important to mention that in a cloud analysis, it is essential to have enough IM–EDP pairs, with the purpose of calculating fragility functions. According to [41], the optimal number of pairs can be estimated by analyzing the evolution of the parameters involved in deriving fragility functions when the number of records increases. These parameters are the vertical intercept, the slope of the regression line, and the standard deviation of the residuals. What is sought is the number of records that stabilize the aforementioned parameters. In that study, it has been observed that from sixty records onwards, the vertical intercept and the slope of the regression curve stabilize, and that from seventy records onwards, the standard deviation of the residuals also stabilizes. For these reasons, in this research, one hundred records have been used to verify the efficiency of the proposed comparison. Figure 10 shows the response spectra of the horizontal components of the selected records, according to the steps described above. The uniform hazard spectra (UHS) of the area have also been plotted for return periods equal to 31, 225, 475, 975 and 2475 years.

4. Comparison Between Structural Configurations

The structural models under study have been subjected to the wide set of one hundred ground motion records, which have been scaled with the purpose of assessing different performance levels; NLDAs have been performed to this end. The damage observed was mainly due to bending. In general, it occurred in beams, while the columns and walls remained mostly in the elastic range. Regarding the most demanded story, it varied from simulation to simulation. In terms of inelastic deformation, approximately 70% of the NLDA performed exceeded the elastic range in both structures.
The response of each building and their vulnerability have been studied through comparing their probability of exceeding different damage states as well as a global damage index. As a first step, it is essential to analyze the bivariate distribution between IM–EDP pairs [42]. To properly define variables representing IMs and EDPs, on the one hand, different studies have shown that the most efficient and steadfastness IM (with respect to the MIDR) is the average spectral velocity around the fundamental period, AvSv [43]. On the other hand, the MIDR is probably the most commonly used EDP to analyze buildings subjected to horizontal ground motions [44]. Accordingly, fragility functions have been derived based on AvSv–MIDR pairs. The following expressions describe in detail how to obtain the selected EDP, in this case the MIDR.
For a story i, the time–history evolution of the inter-story drift is given by the following:
I D R i , n ( t ) = δ i , n ( t ) δ i 1 , n ( t ) h i
where δ i , n ( t ) is the displacement at the floor i in the n-direction of the structure; h i represents the height of the story i. The maximum inter-story drift ratio, at the story i, and n direction, M I D R i , n , can be calculated as follows:
M I D R i , n = m a x ( I D R i , n ( t ) )
The maximum inter-story drift ratio observed in the building, for the n direction, M I D R n , is given by the following:
M I D R n = m a x M I D R 1 , n , M I D R 2 , n M I D R N s t , n
where N s t stands for the number of stories. In this manner, the M I D R x and M I D R y have been calculated for both buildings. Table 4 shows the average MIDR values in both directions. As expected, similar average values can be observed in the Y direction. In the X direction, a significant reduction in the average MIDR value has been observed in Building 2 compared to Building 1. The latter reflects the improved performance of Building 2.
In the next section, fragility functions have been derived considering these results.

4.1. Fragility Functions

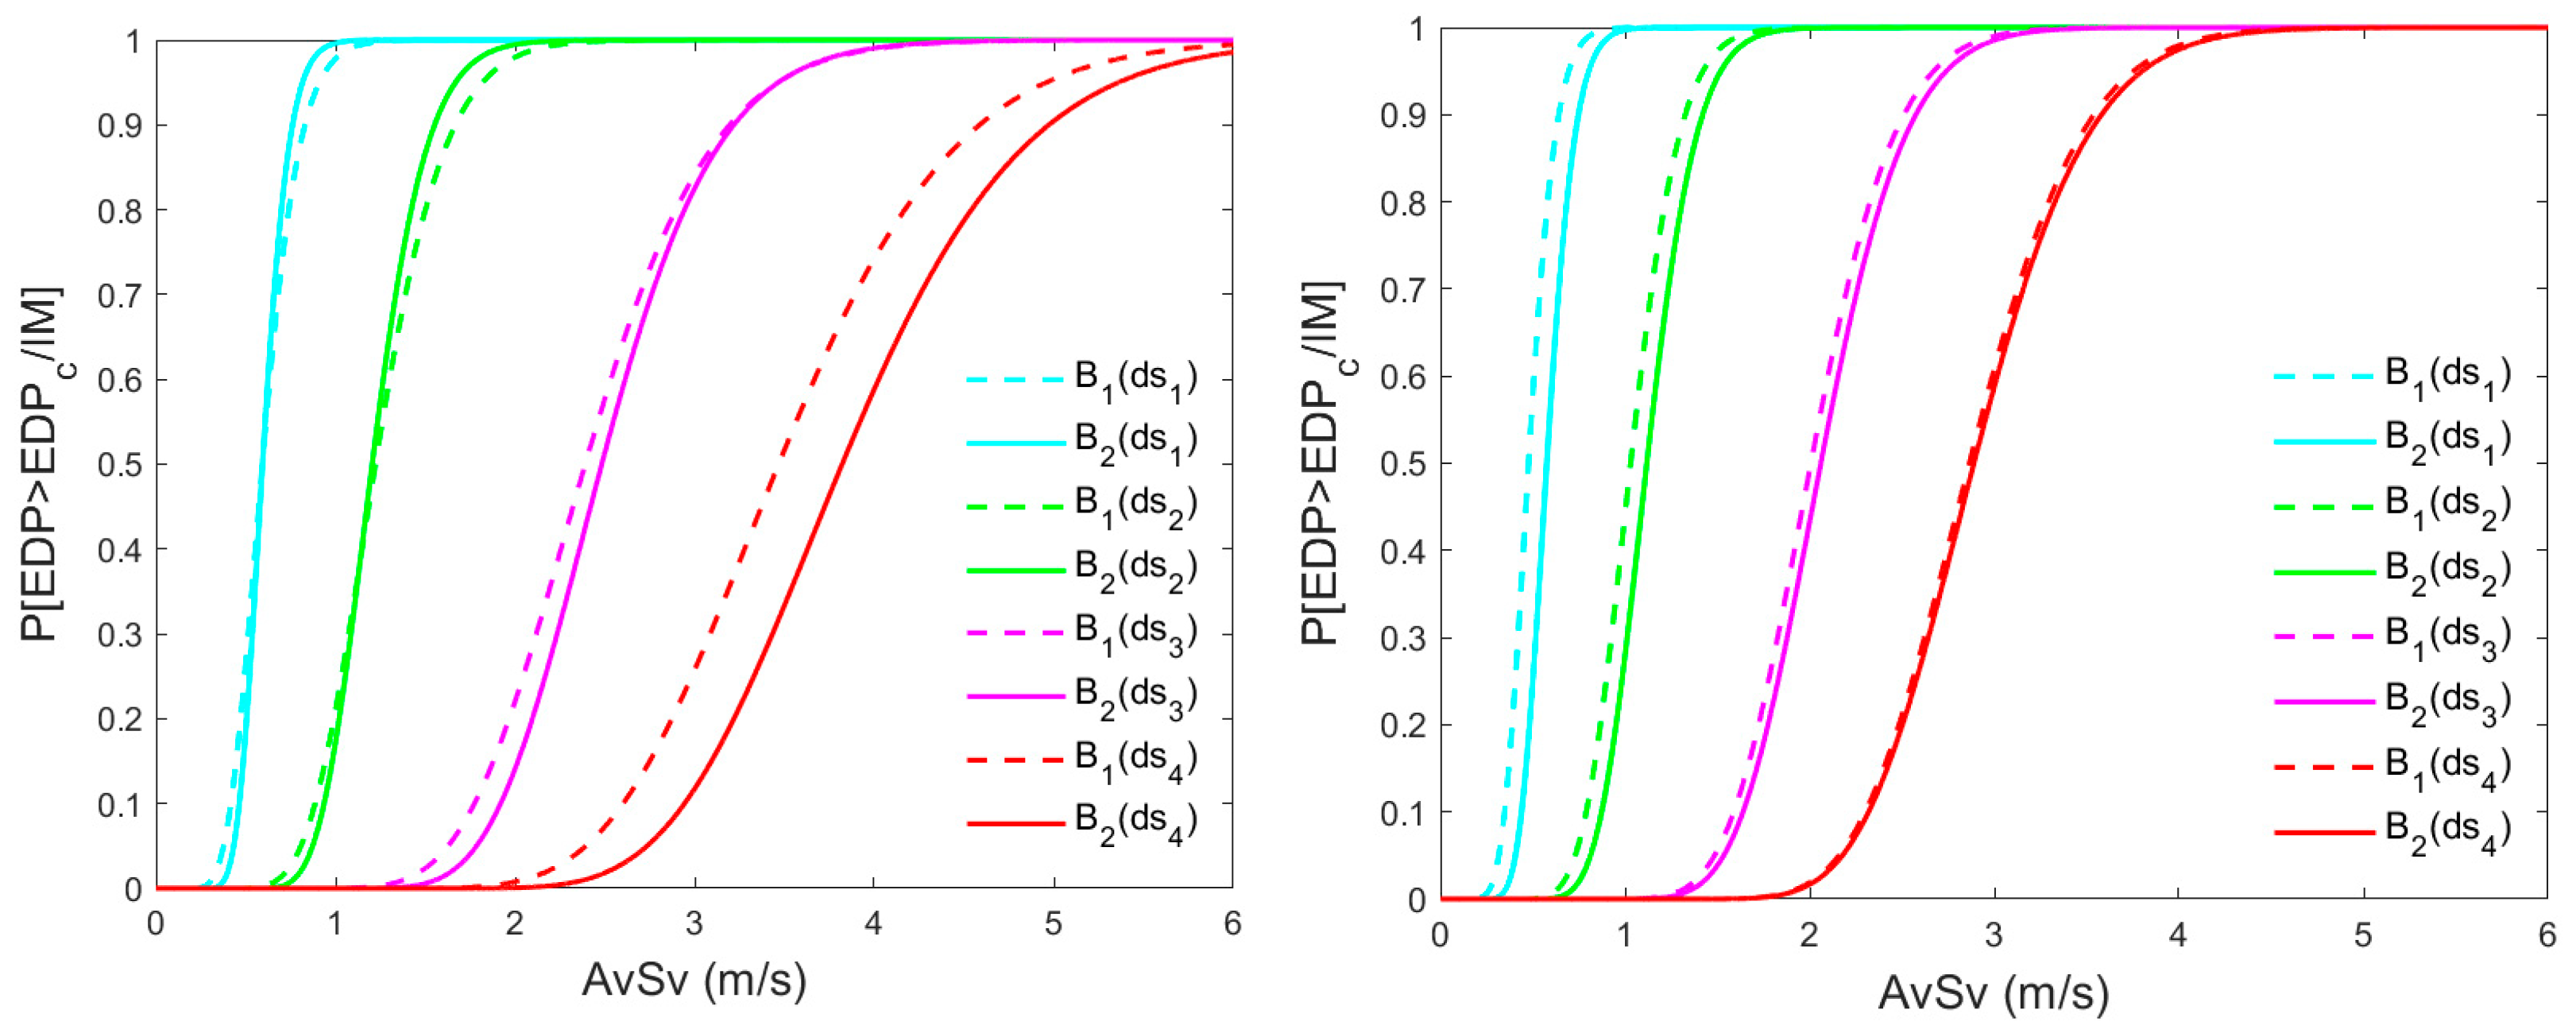
The vulnerability of different buildings was compared through measuring their performance. Starting from the set of one hundred IM–EDP pairs, fragility curves were calculated for both structures [45,46,47]. Figure 11 shows these curves for different damage thresholds (0.5%, 1.0%, 1.5%, and 3.0% for ds1, ds2, ds3, ds4, respectively), according to the following expression:
P ( log ( d s i ) > 0 | IM ) = Φ ( log   η d s i | IM σ log d s i | I M )
where η d s i | IM is the median for d s i given IM and σ log d s i | I M is the logarithmic standard deviation for d s i given IM; in this case IM = AvSv.
Figure 11 show how B2 exhibits better performance with respect to B1, especially in the X direction (Figure 11, left), which is largely because the torsional component is greater in B1 than it is in B2. Therefore, it can be concluded that B2 has a better performance compared to B1, since for the same intensity level, lower probabilities of exceedance are expected. It is important to mention that although the standard deviations associated with the fragility curves are similar, the differences lie in the mean values of the fitted distributions. These differences derive in a shift of the fragility curves, which can be attributed to the structural configuration. Thus, for instance, given an AvSv value equal to 3 m/s in the X direction, the probability of exceeding ds4 is around 0.1 in B1 whilst, for the same intensity level, this probability increases to 0.25 in B2.

4.2. Probabilities of Occurrence of the Damage States

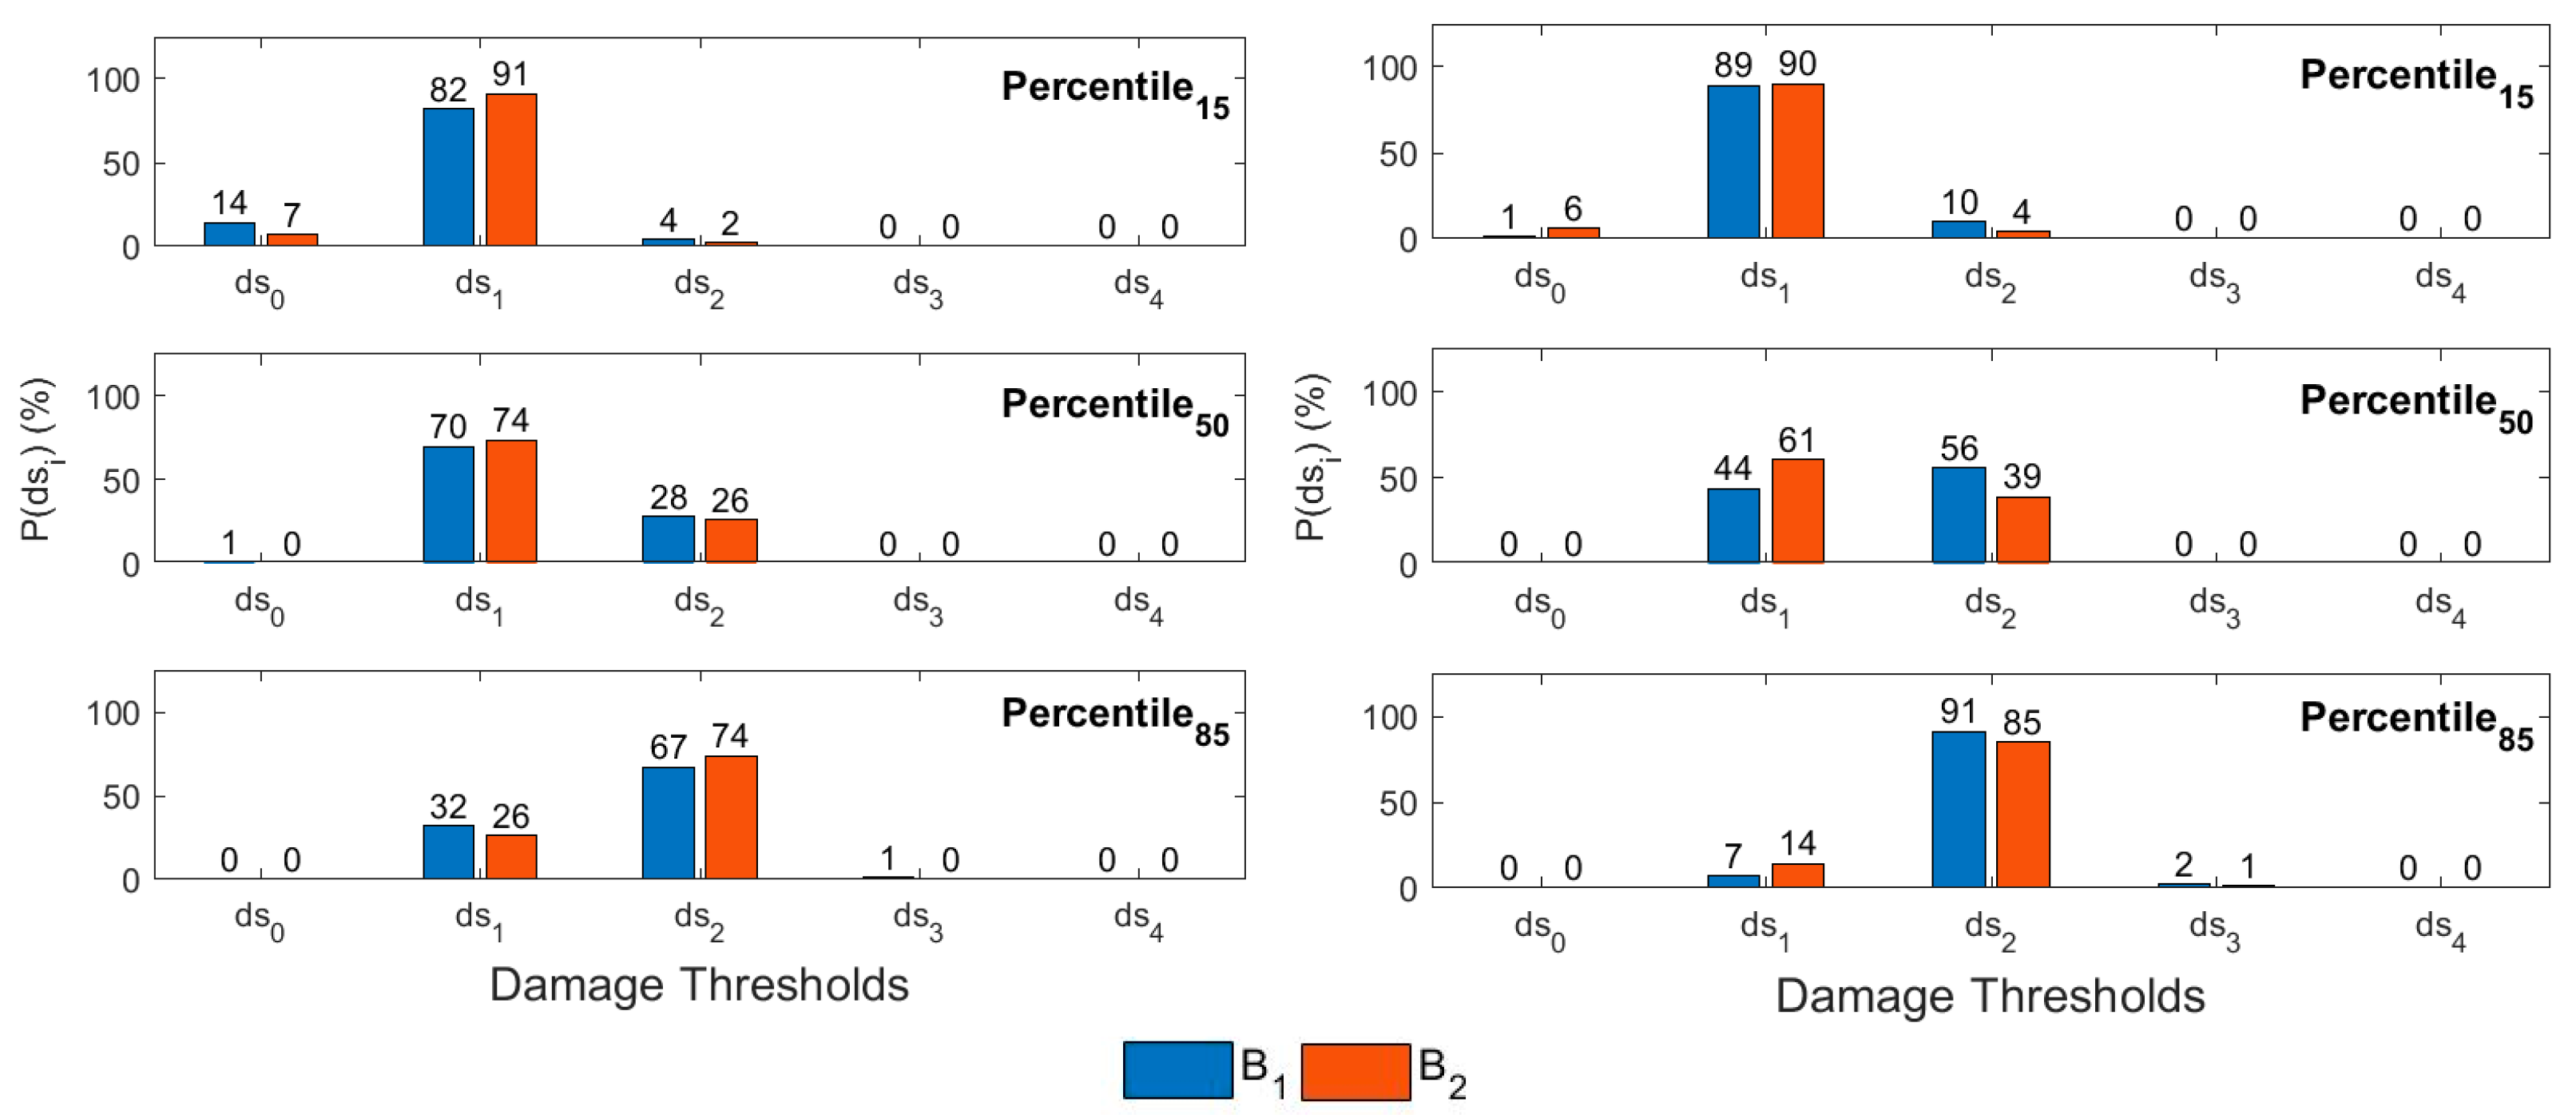
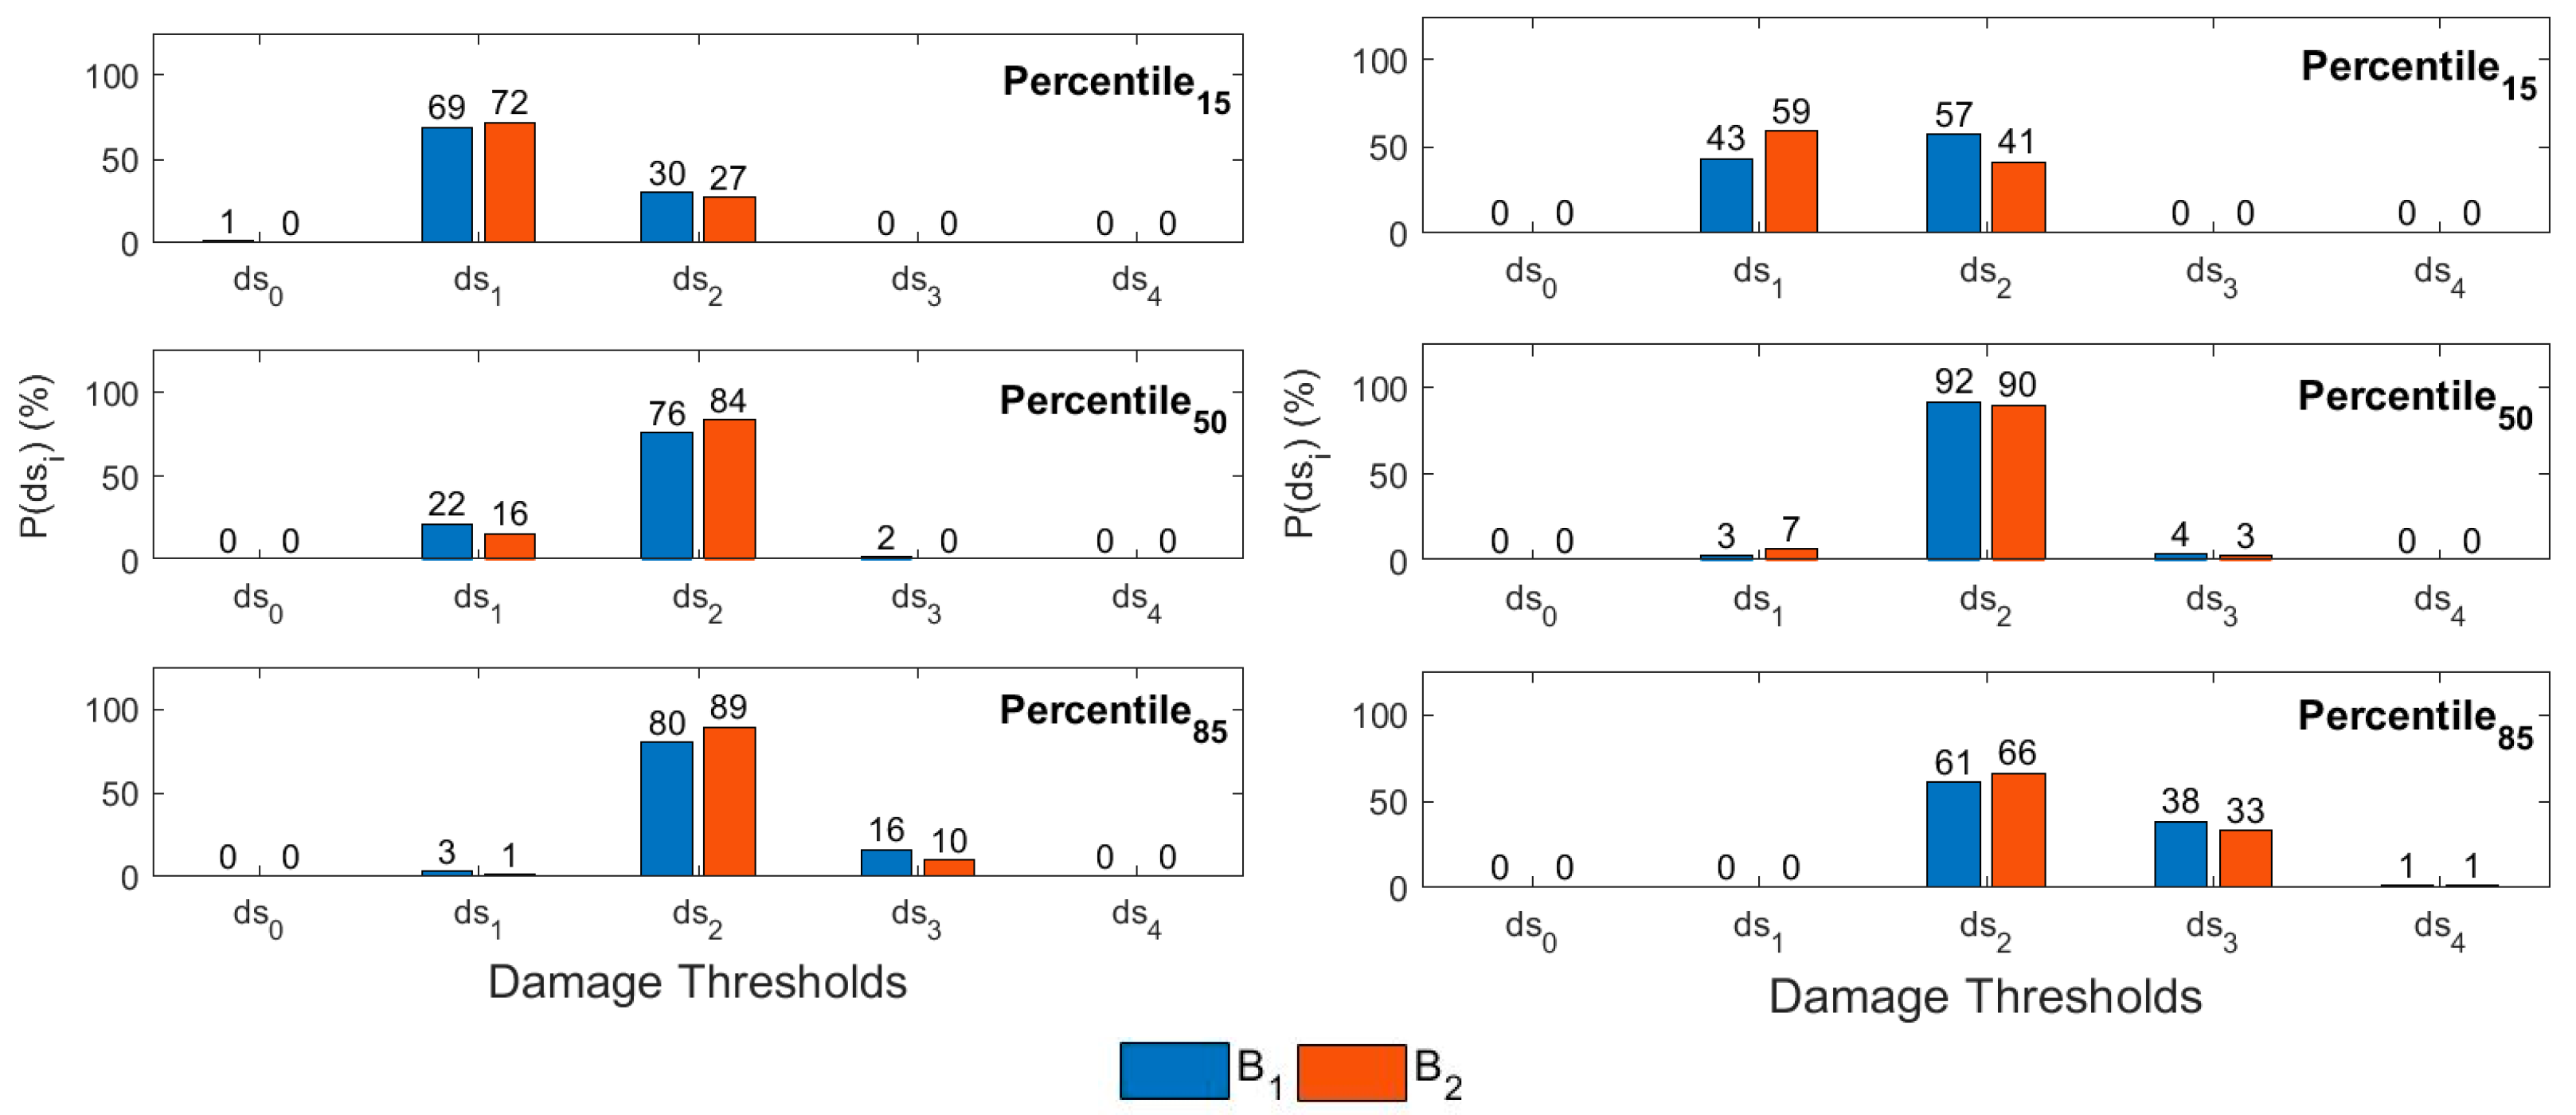
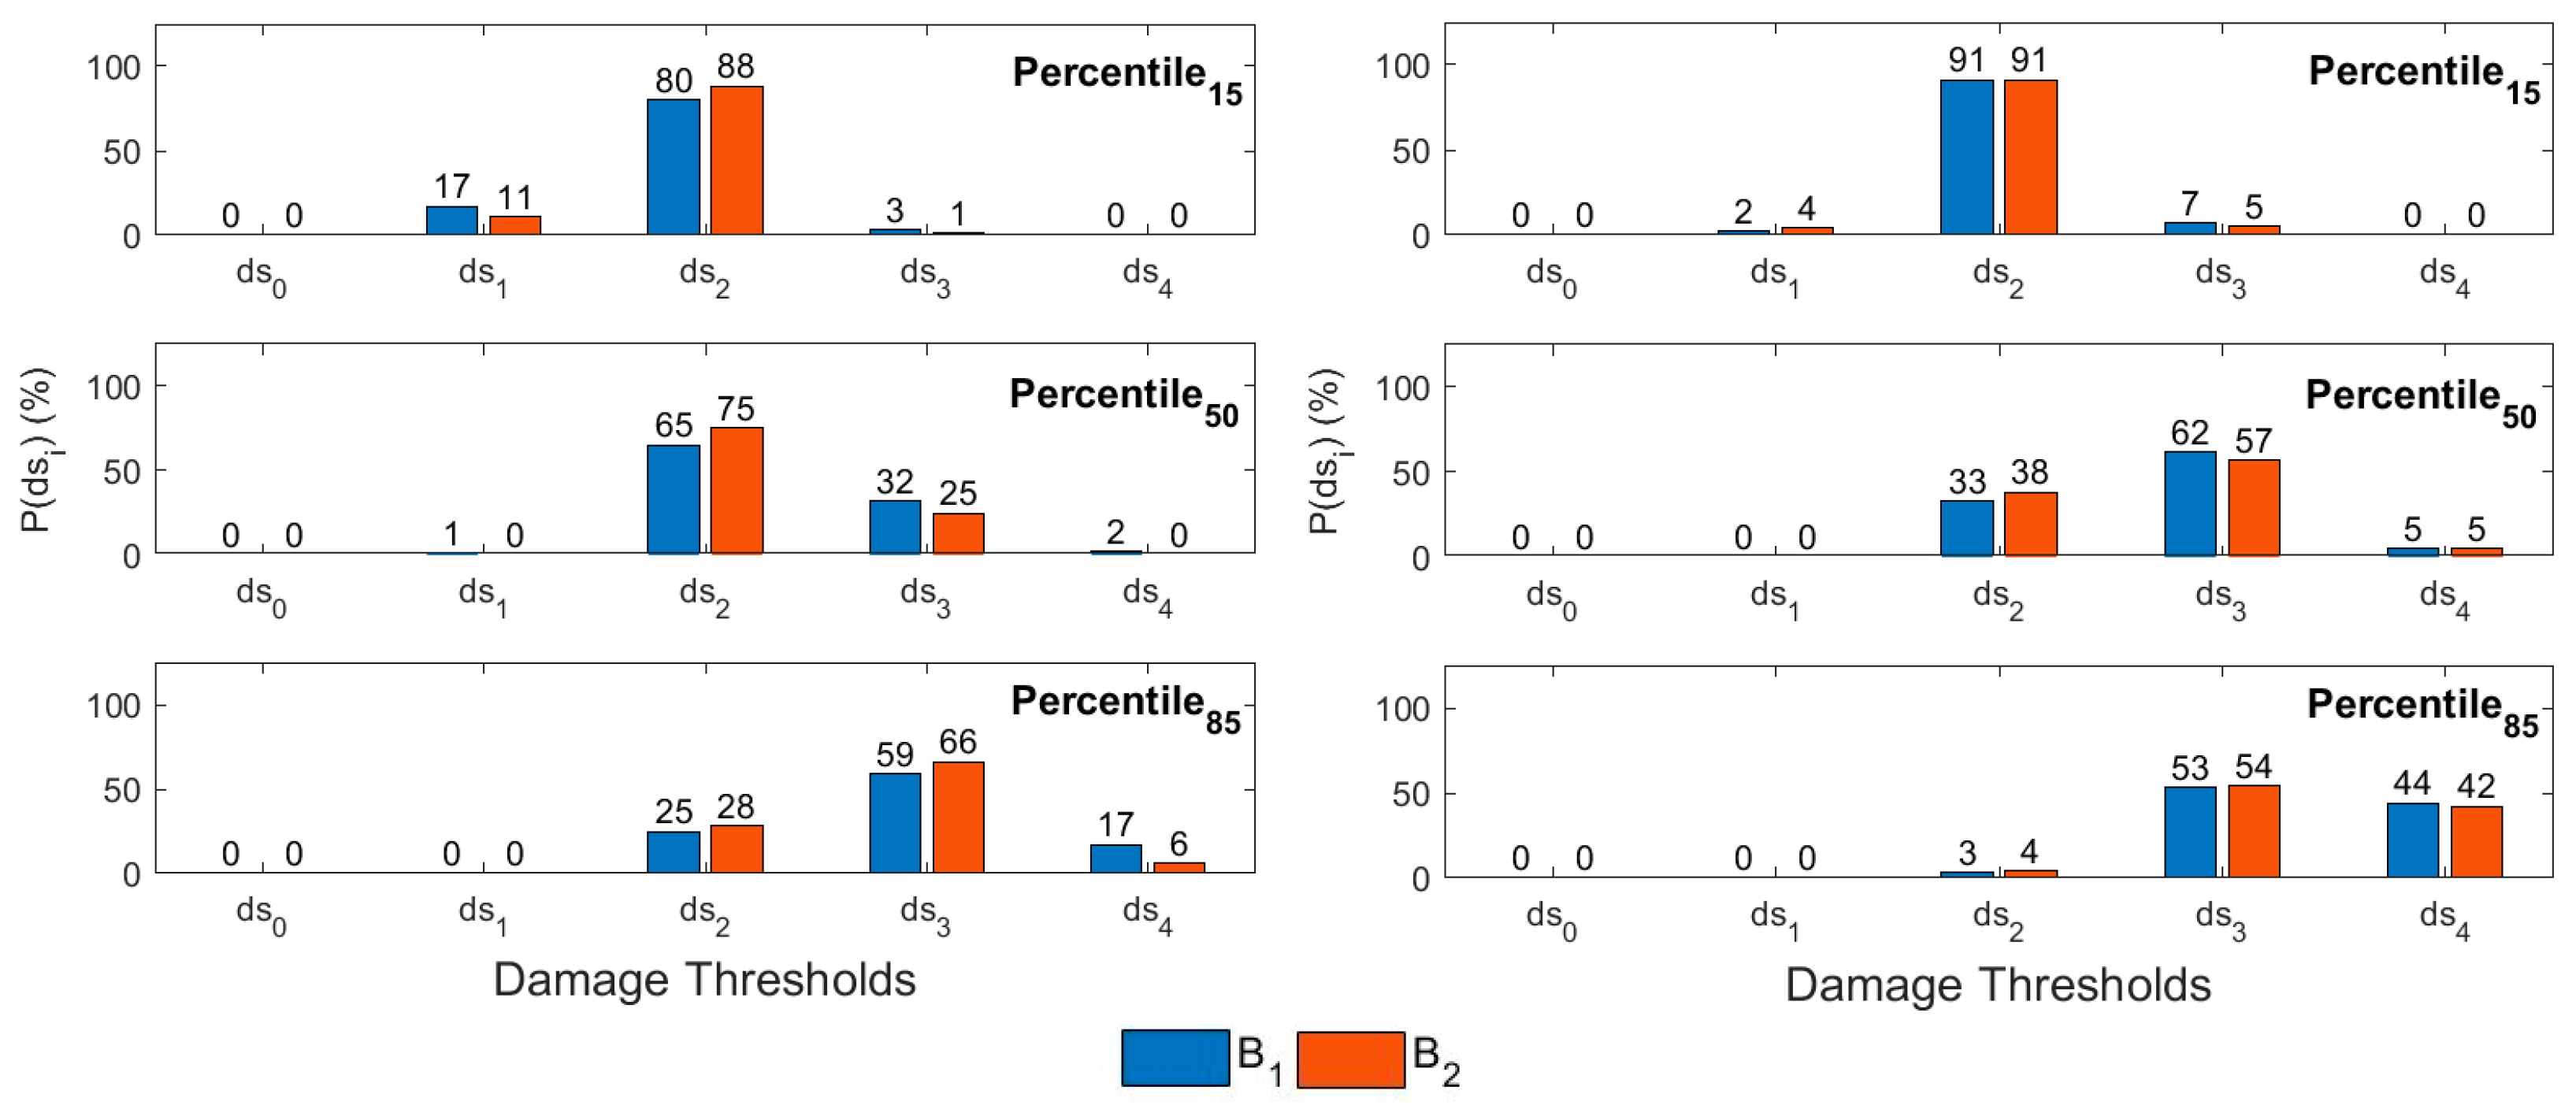
The next step is to calculate the probability of occurrence of each damage state when the buildings are subjected to different intensity levels. To this end, five intensity levels have been selected based on the UHS calculated for the studied area [48]. These spectra (Figure 10) have been extracted from the Colombian Geological Service database [30] for different return periods (31, 225, 475, 975, 2475 years) and for different percentiles (15, 50 and 85). For all these spectra, the IM identified as AvSv has been calculated through employing the fundamental periods of the structures. As a result of these values, the next step was to calculate the respective probabilities of damage from the fragility functions (Figure 11). The way to calculate these probabilities, for each damage state, is given from the following expression:
P ( d s i ) = 1 C F i + 1 ,                                     f o r   i = 0 C F i + 1 C F i ,               1 < i < 4   i     1 , , 4 C F i ,                                                         i = 4
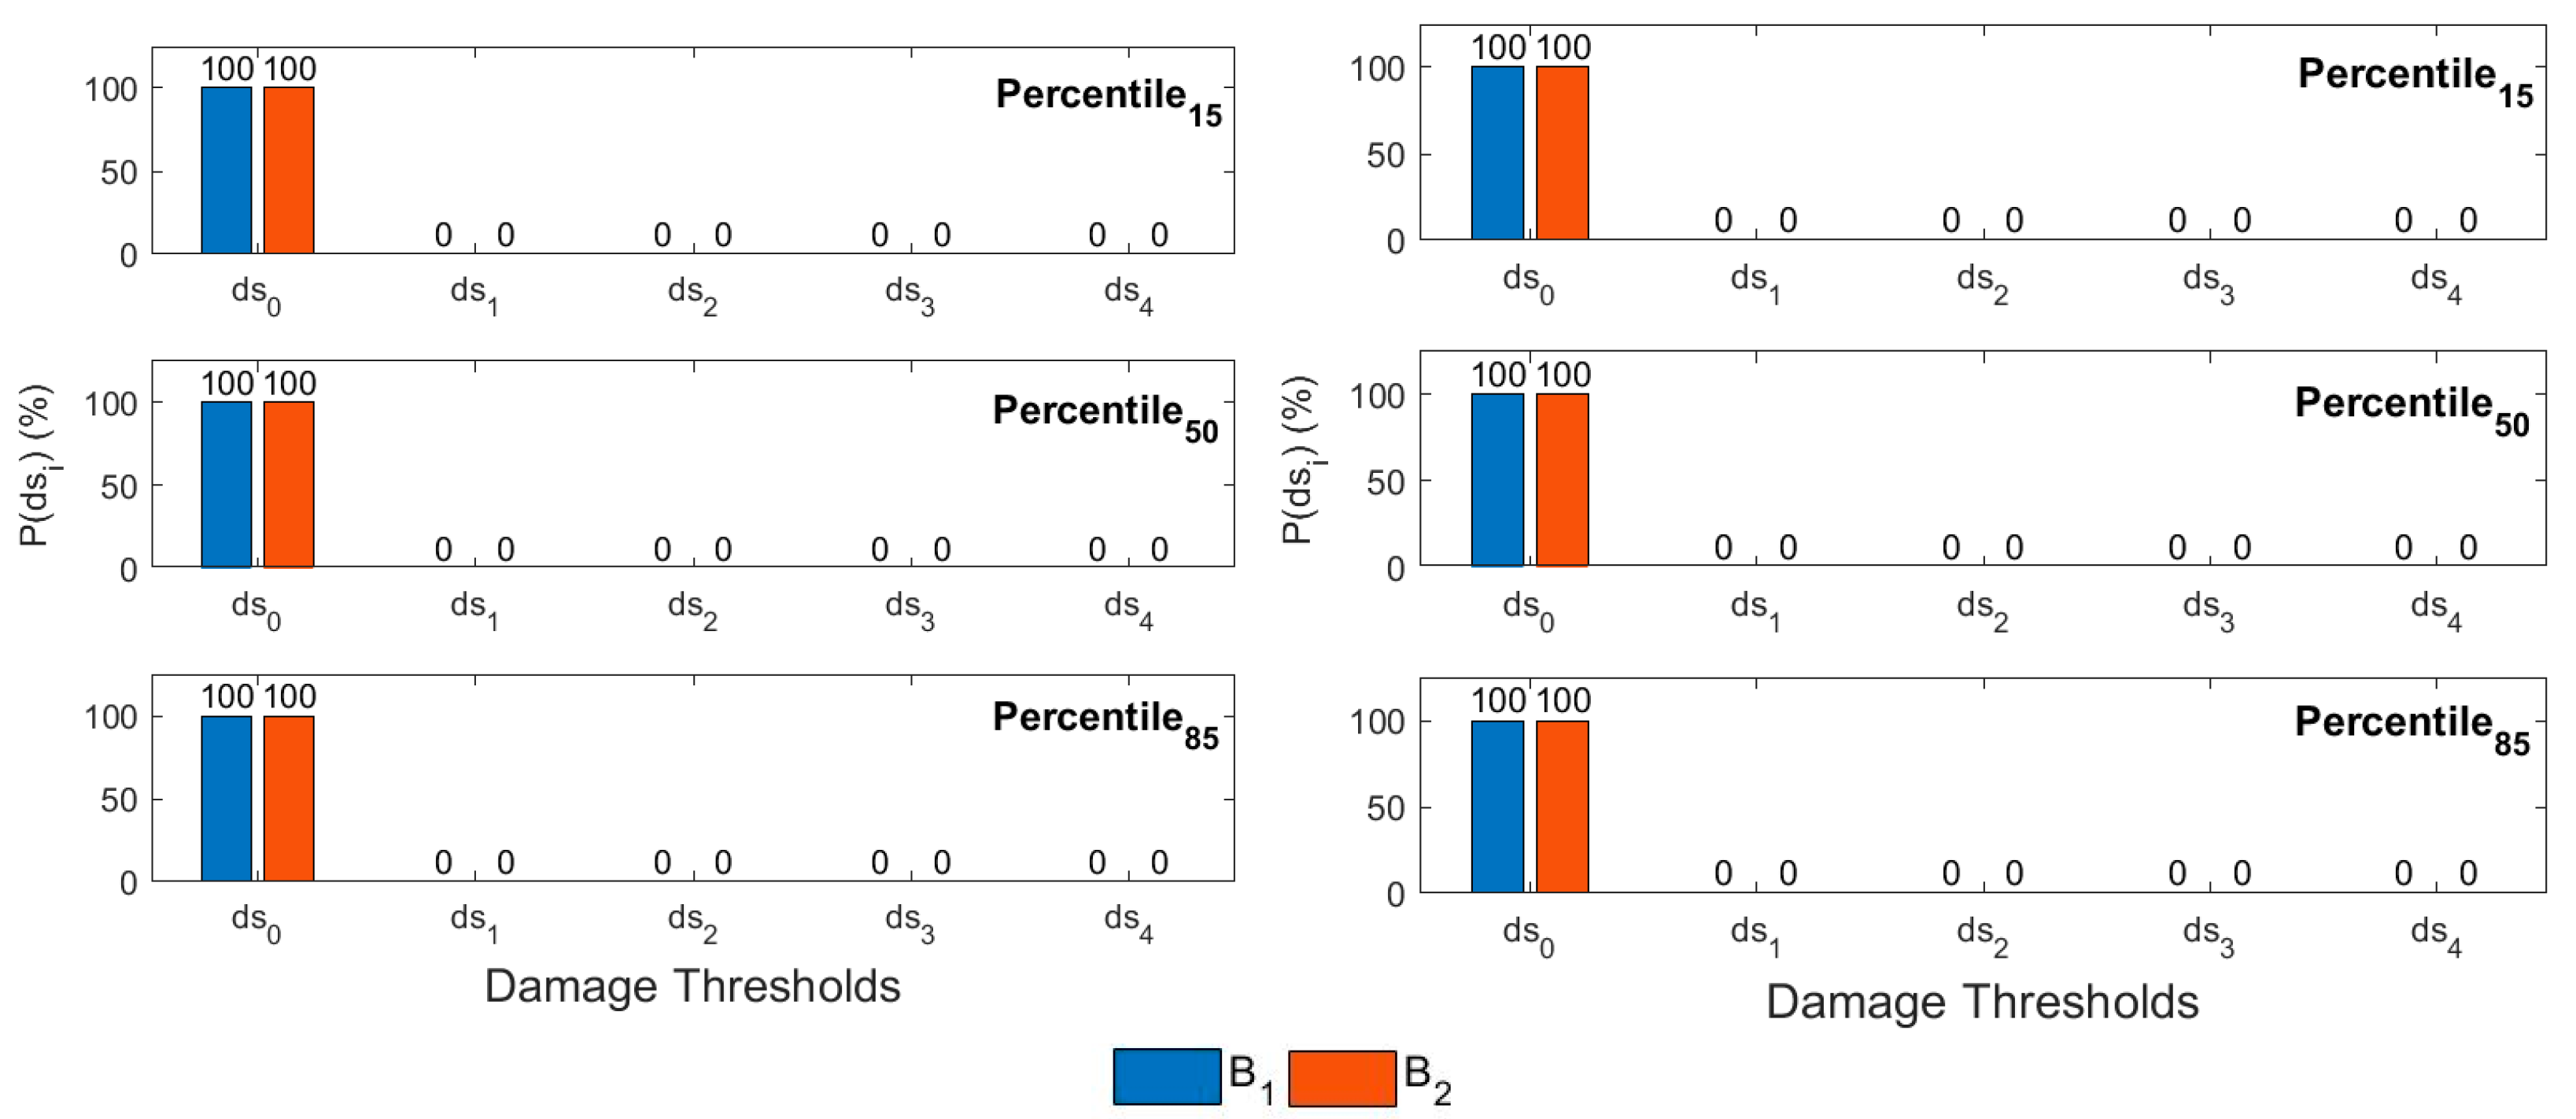
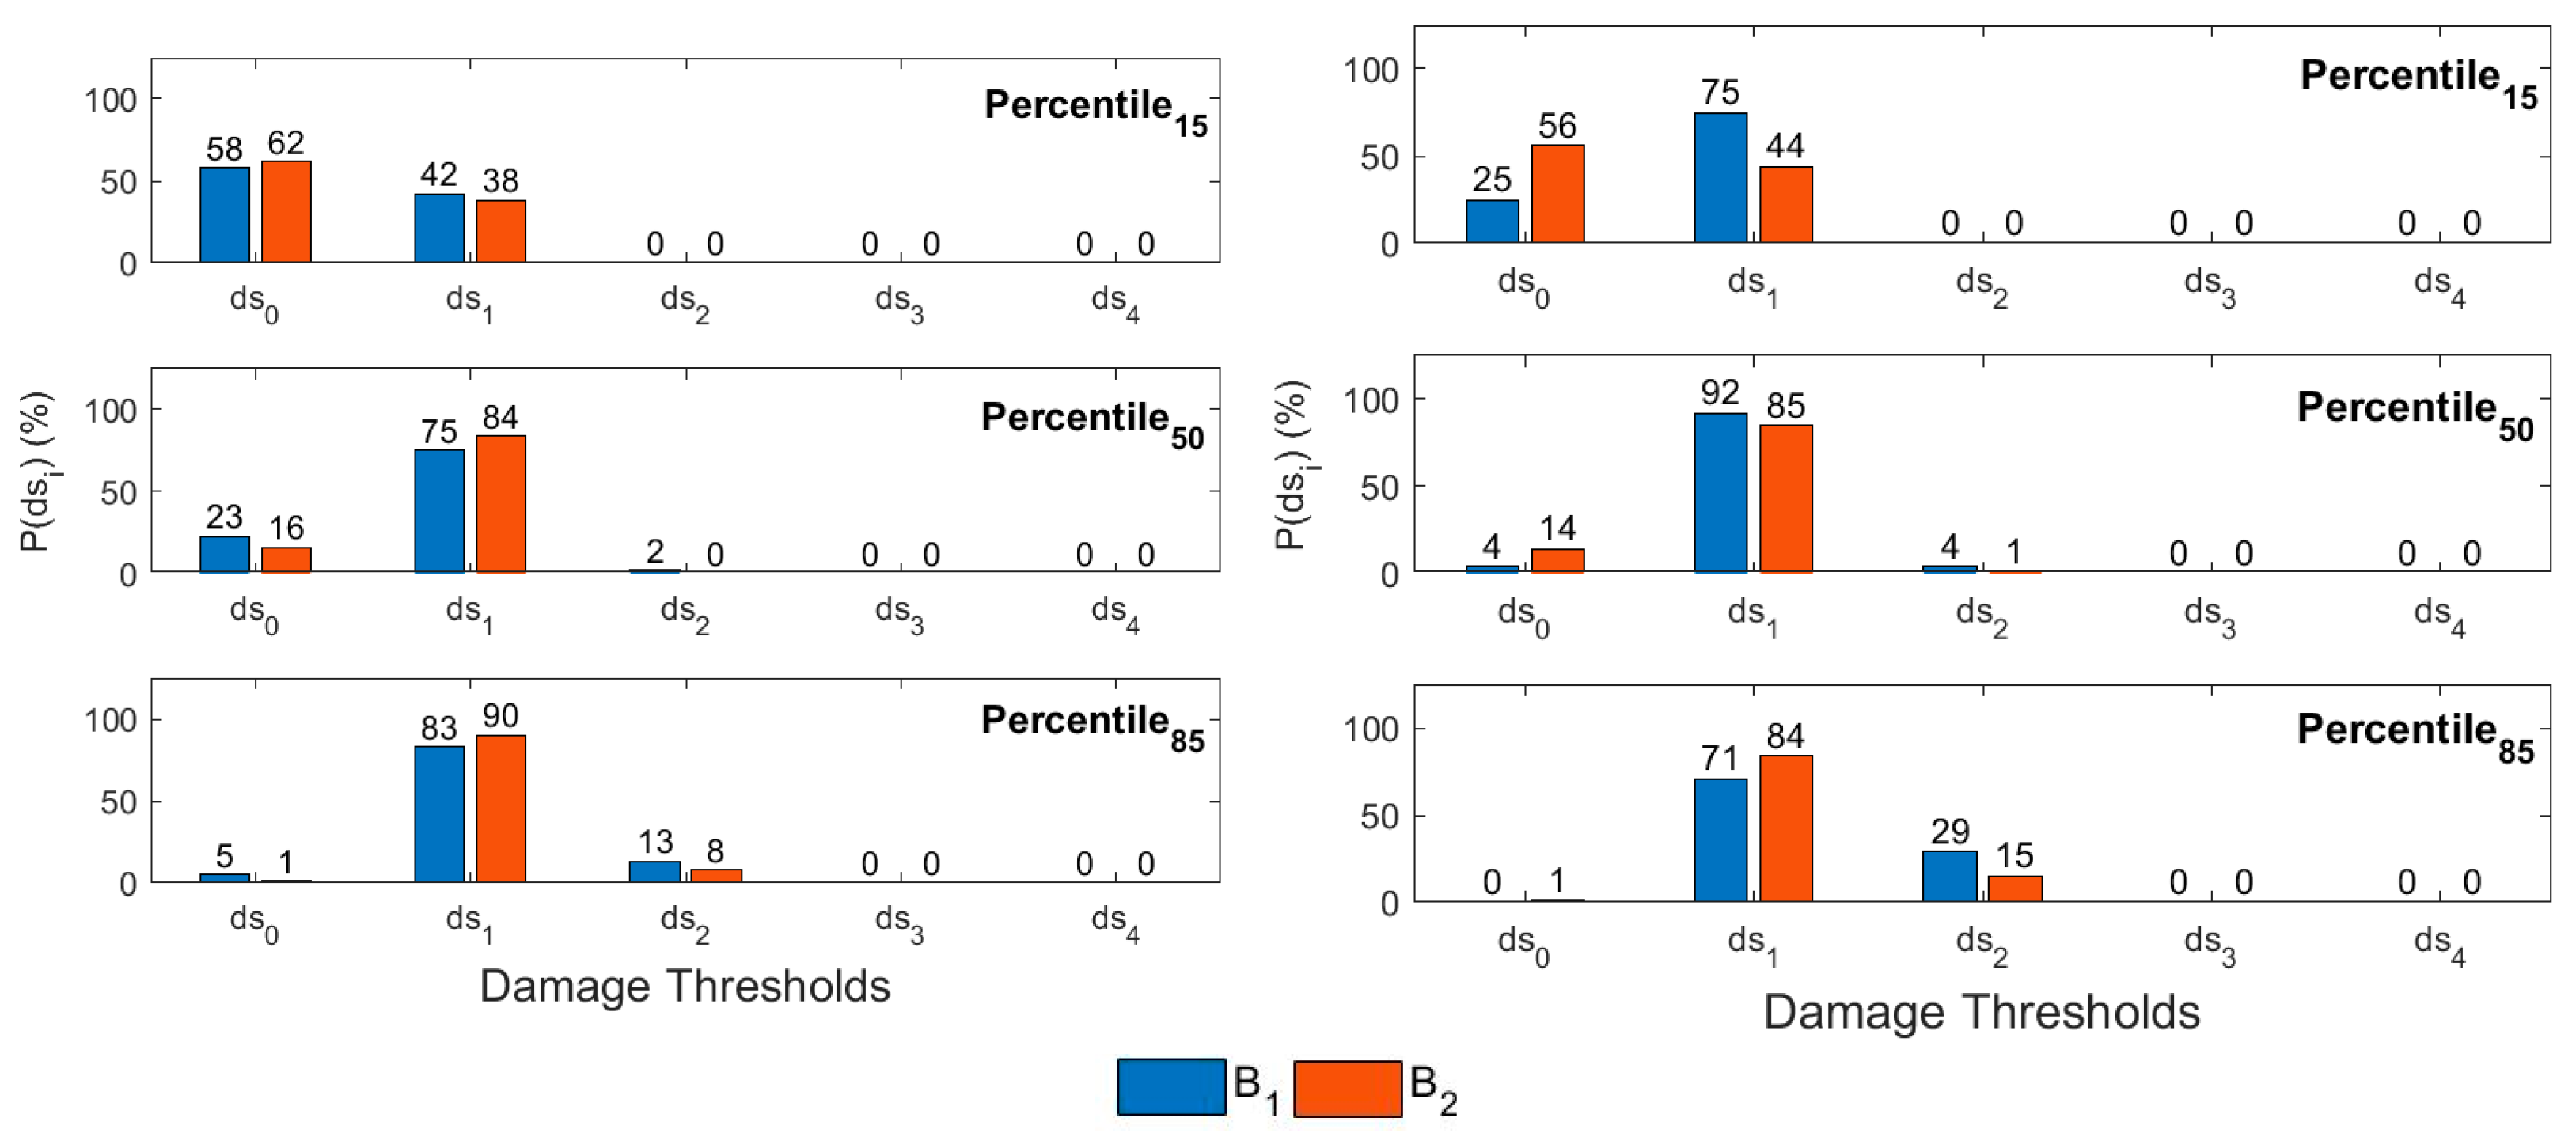
where P(dsi) is the probability of occurrence of the damage state i; CFi is the probability value extracted from the fragility curve associated with the damage state i. Figure 12, Figure 13, Figure 14, Figure 15 and Figure 16 depict these probabilities for both structures.
It is important to note that some design guidelines establish that a building that experiences ground motions, whose return period is equal to 475 years, should not exceed a probability of damage of 10% for a complete damage state (ds4). Figure 14 shows that the two structures meet this requirement, since the probability of exceeding the complete damage state is close to zero. This information is valuable when defining seismic damage scenarios.
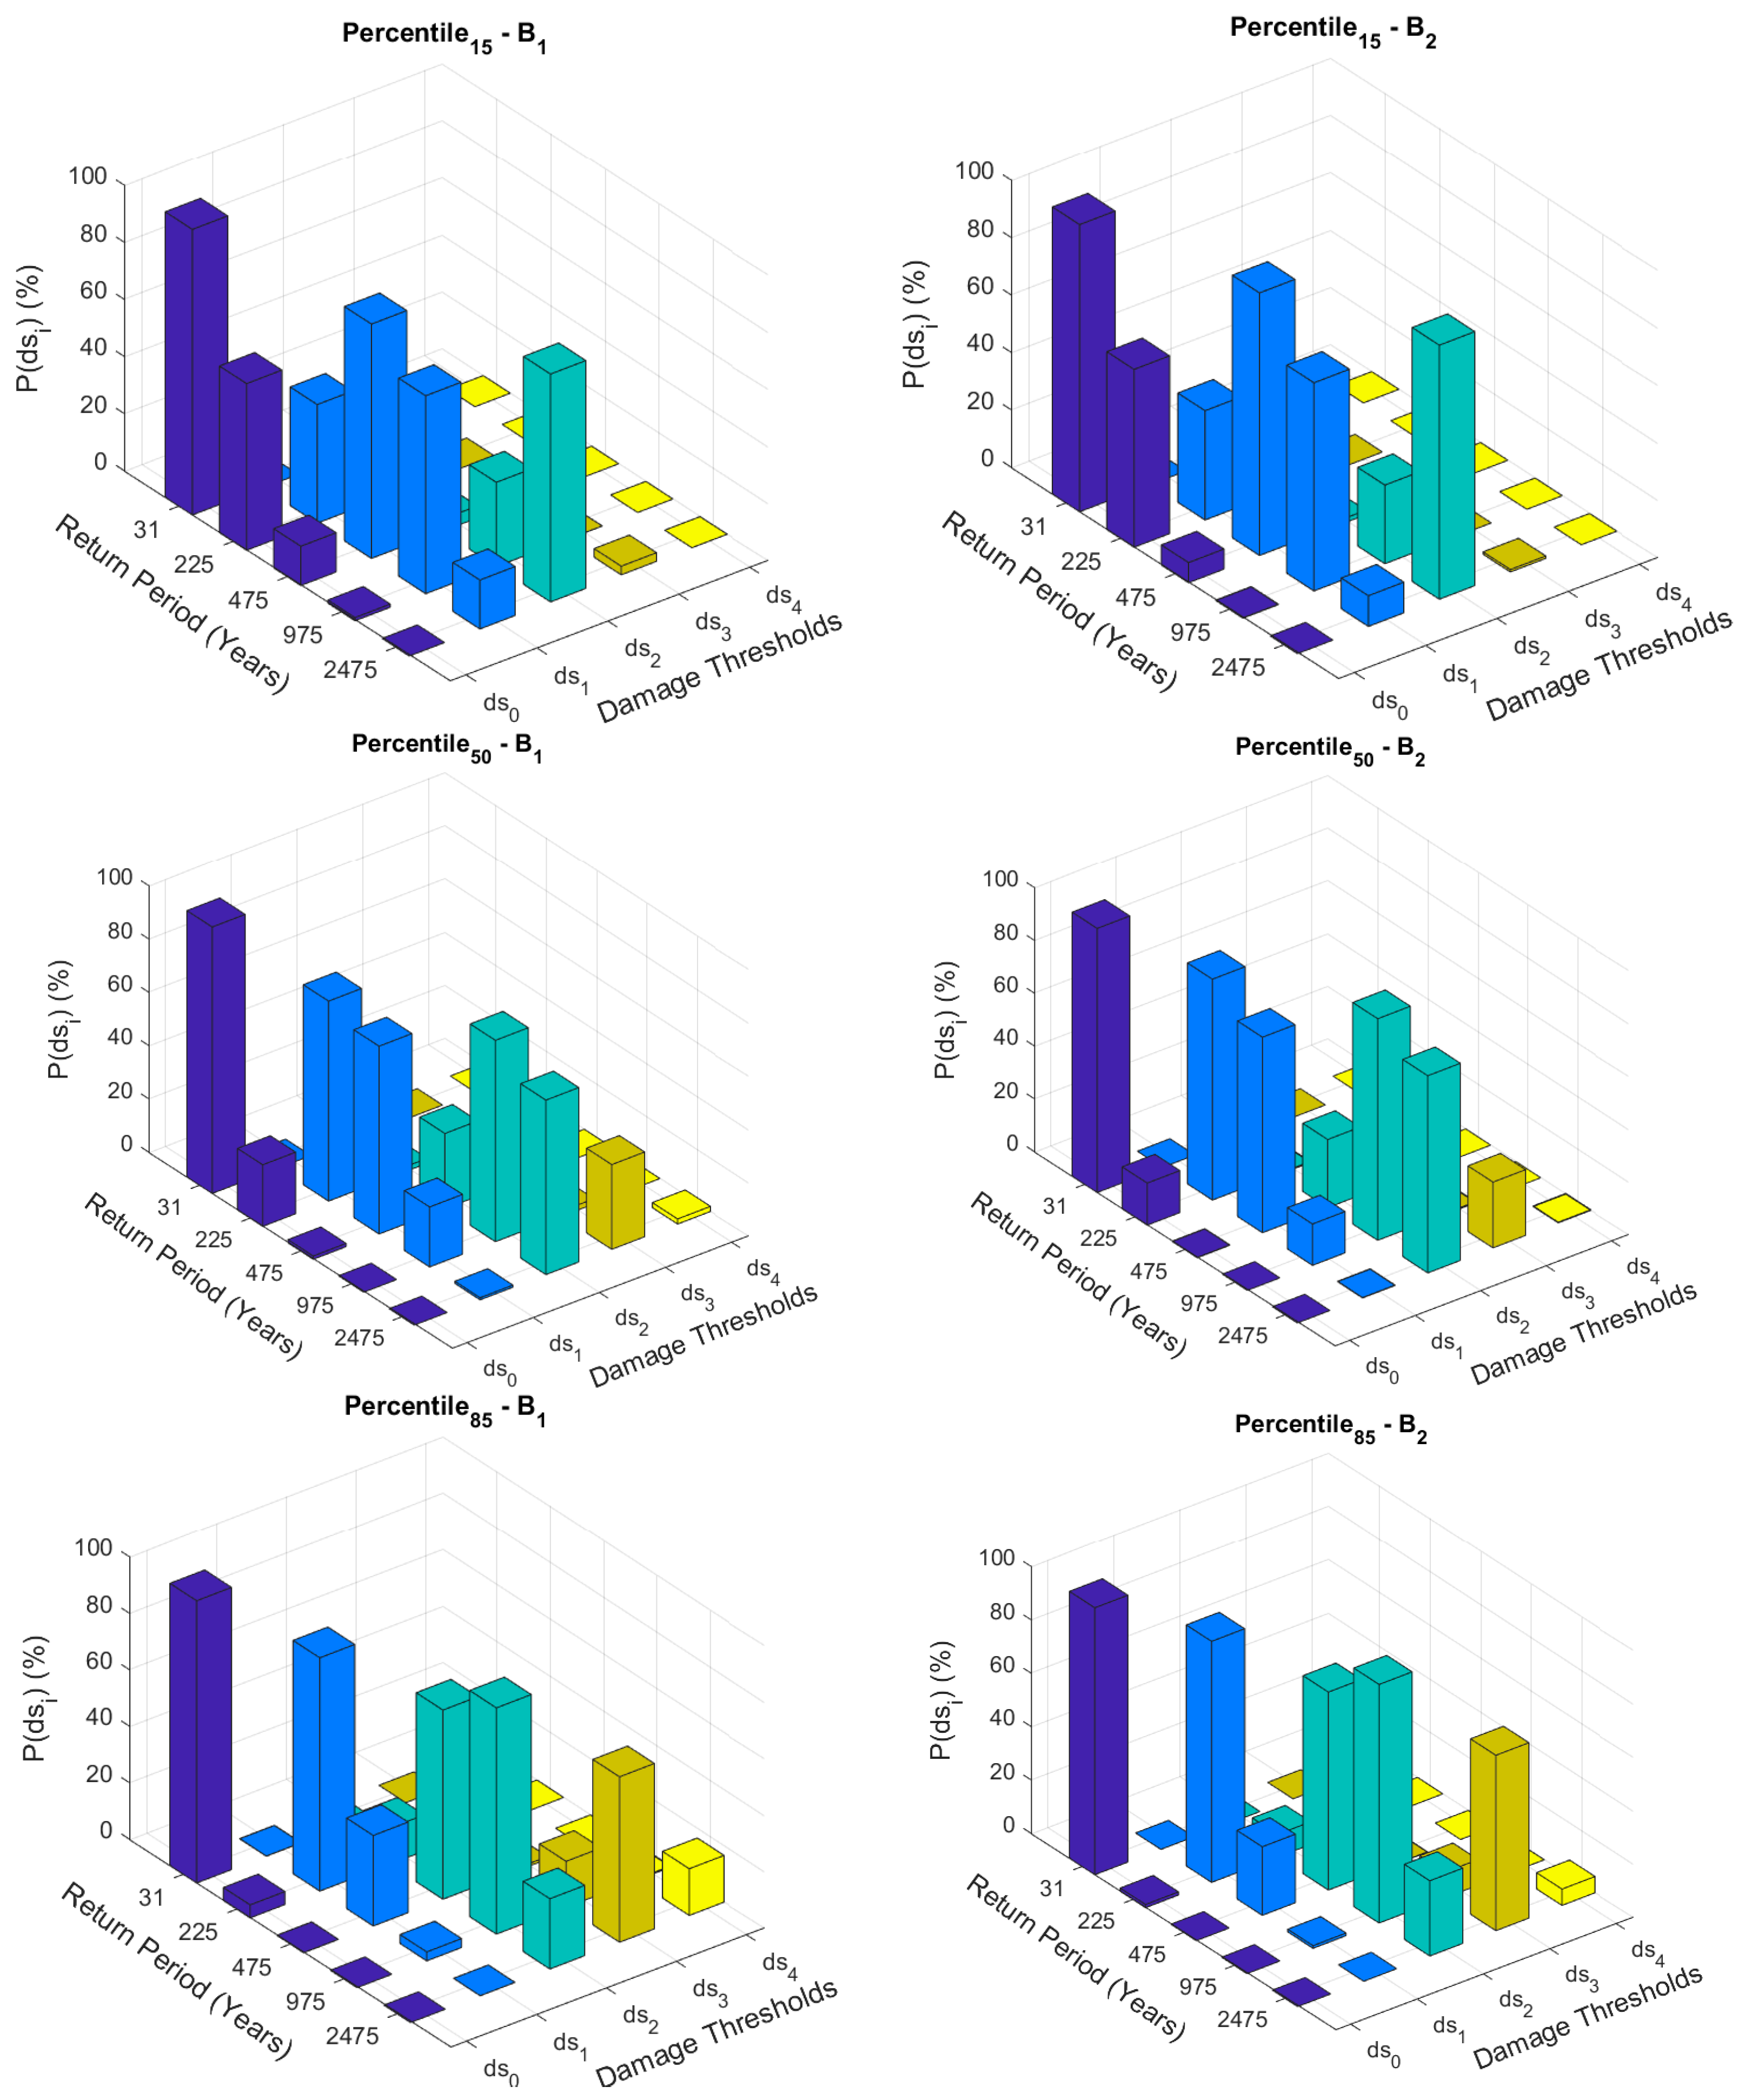
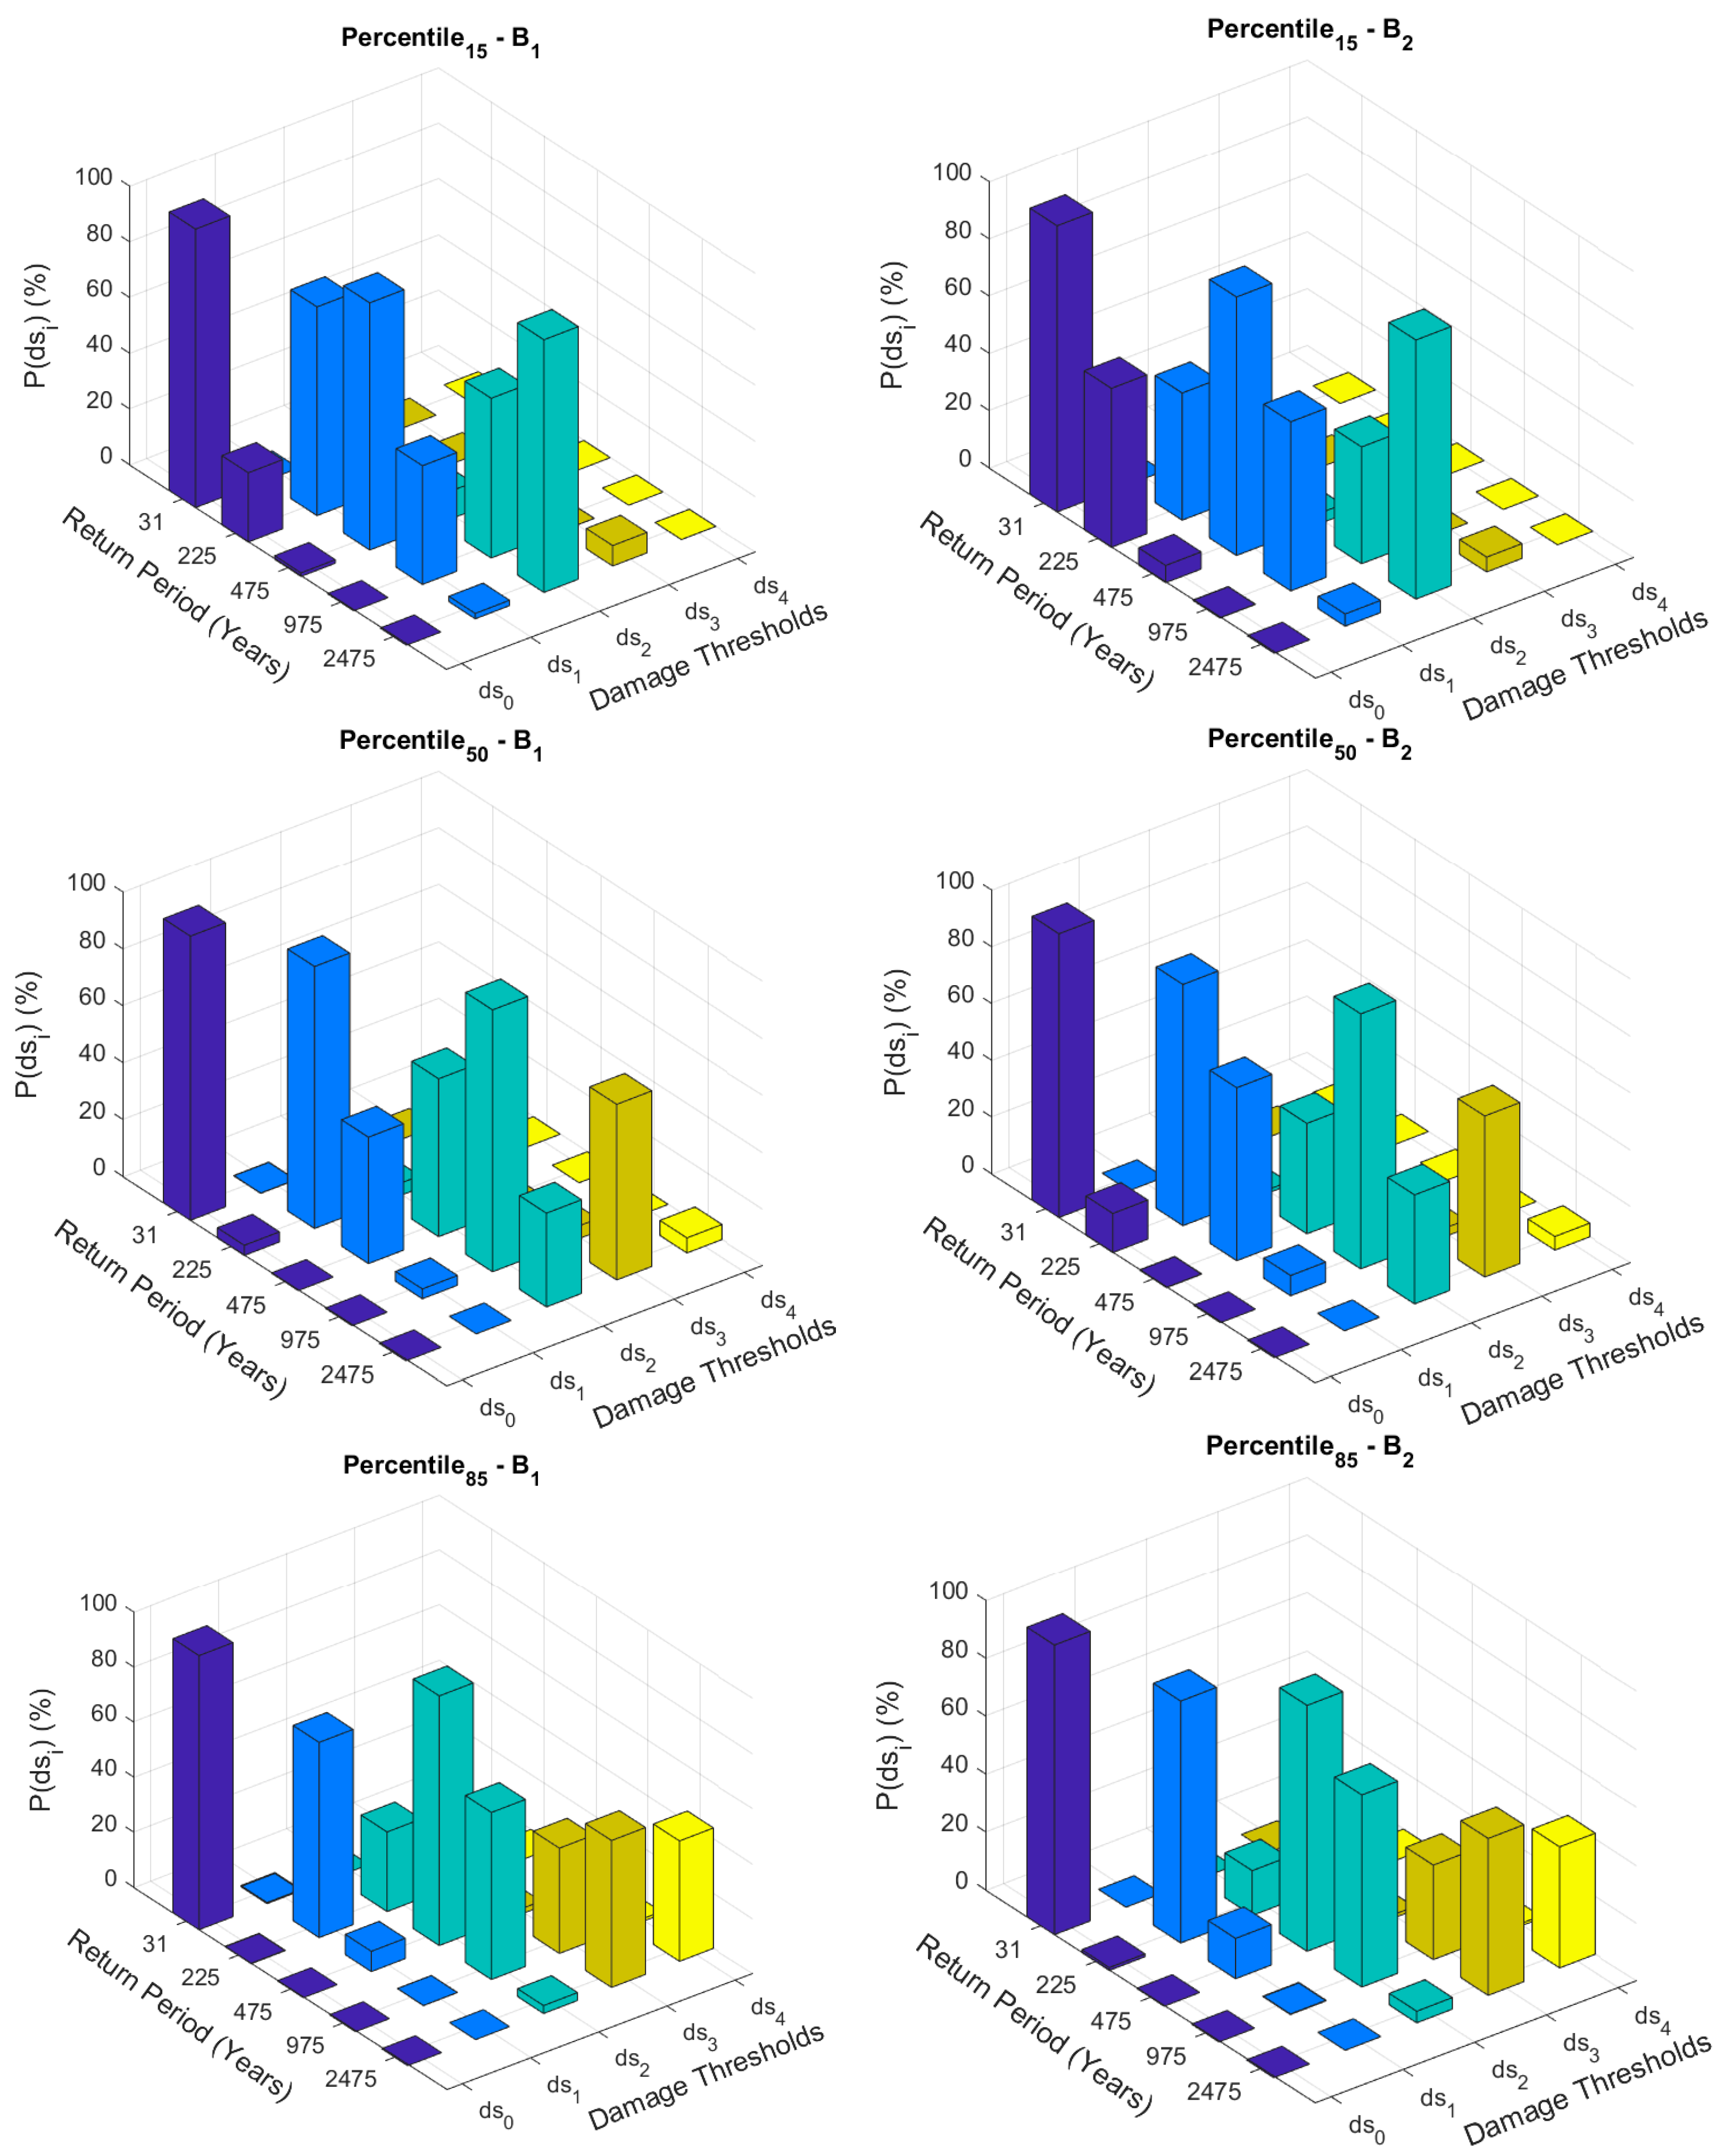
The evolution of the probability of exceeding the different damage state thresholds is shown in Figure 17 and Figure 18. It is observed that as the intensity increases, the probability of occurrence of the collapse damage state increases whilst the probability of other damage states decreases. These figures show how B2, for instance, in the Y direction and for the 50th percentile of an earthquake with a return period of 2475 years, presents a probability of damage that does not exceed 5%. This result highlights the importance of a structural configuration that avoids torsional effect.
It can be observed in Figure 12, Figure 13, Figure 14, Figure 15, Figure 16, Figure 17 and Figure 18 that both buildings show good overall structural performance, responding appropriately to the evaluated seismic loads. However, when analyzing the data, it becomes clear that B2 exhibits superior behavior despite the use of fewer materials, which is due to its structural configuration. Recall that in this building, the center of rigidity and the center of mass are located closer to each other, which reduces torsion and optimizes the seismic response. Therefore, it is essential to emphasize the importance of structural configuration, as a proper arrangement of elements can significantly improve structural performance. The correct placement of the components of the seismic resistance system plays a crucial role in the stability and behavior of a building. This should be considered when designing such structures to enhance both safety and performance. Moreover, in the elastic domain, the locations of the center of mass and the center of stiffness depend on the disposition of the structural and nonstructural elements and permanent loads acting on the structure. However, in the inelastic domain, these locations may change depending on the stiffness degradation of the structural elements. For this reason, it is of paramount importance to consider the inelastic response of the structures via NLDA. In this manner, the inherent modification of both the center of mass and the center of stiffness can be properly captured.

4.3. Global Damage Index

A global damage index (DI) represents the general damage in a structure when it is subjected to an earthquake [49]. This measure can be calculated from the probabilities of overcoming the different damage states (see Equation (7)).
D I = 1 m i = 1 m i P ( d s i )
where m represents the number of damage states (four non-null damage states have been considered whose probabilities of occurrence have been calculated from Equation (6).
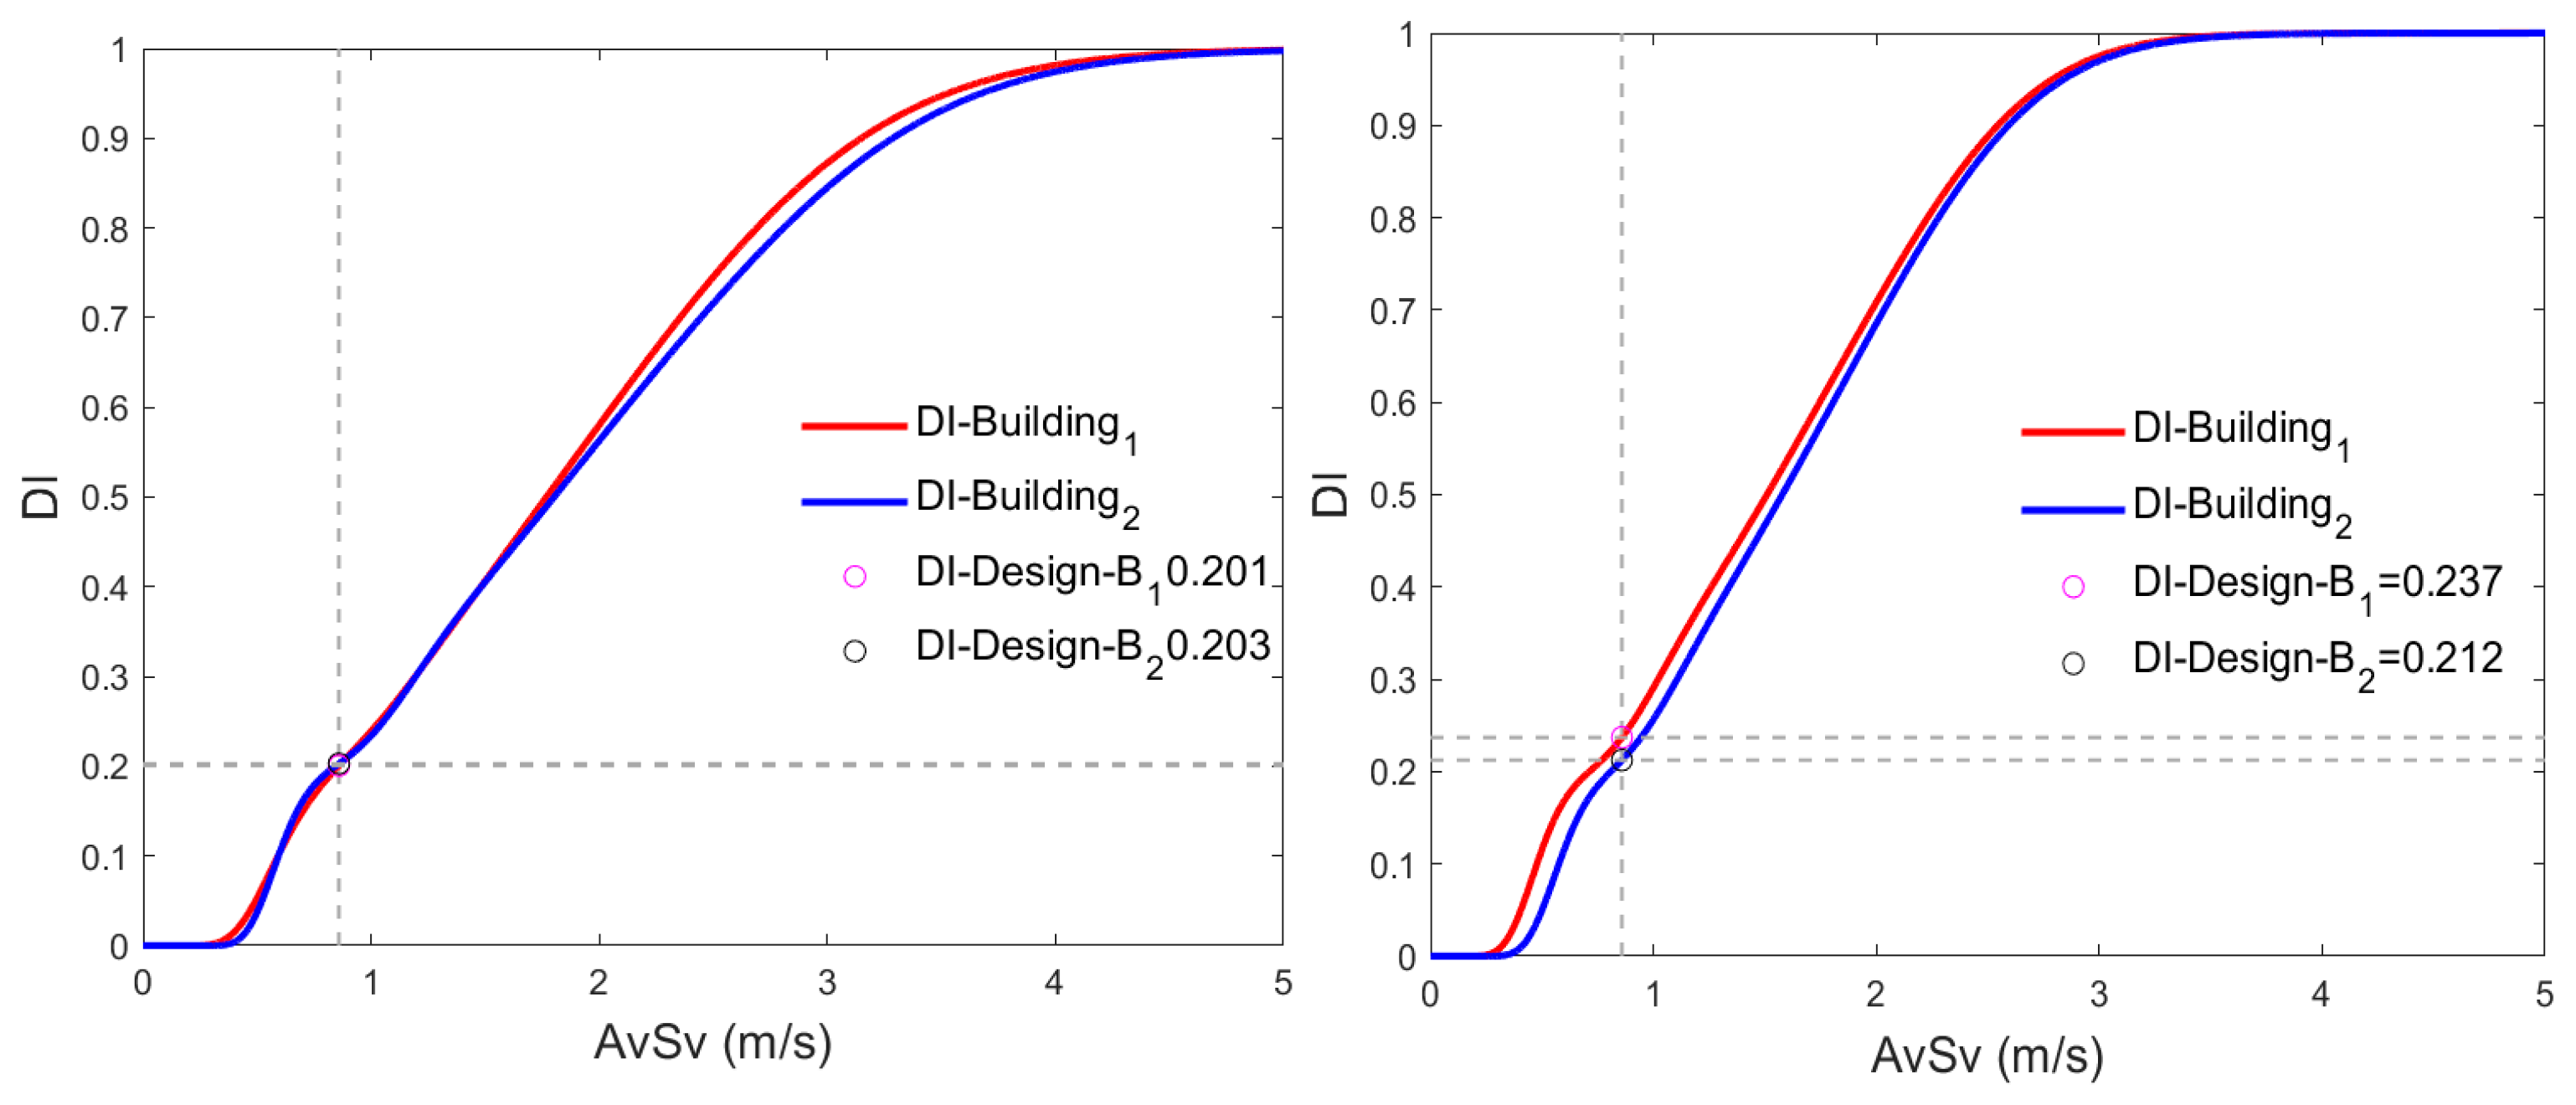
Figure 19 shows the global damage curves calculated for the buildings under study. Note that the global damage index, calculated from an earthquake with a return period of 475 years (see dashed lines), is very similar for the two structures. However, some differences can be observed for the Y direction. It is worth recalling that B2 uses less material than B1. Table 5 summarizes the damage indices for the seismic intensities given by the different return periods.
So far, the importance of structural configuration in the seismic design of buildings has been demonstrated. However, if NLDAs are used to calculate the structural response of a specific configuration, which is recommended for buildings of the height analyzed here, verifications of structural behavior in terms of fragility functions can be computationally expensive. For example, the one hundred NLDAs performed on both structures took about 3 months to complete. The following section presents an application to overcome this limitation.

5. Comparison Between NLDA and ROM

Because of the large computational cost involved in performing NLDAs, the final objective of this work is to compare the structural response of the buildings calculated from the NLDA and ROM. The latter seeks to characterize the specific dynamic response of a structure from a transfer function (TF). Equation (8) shows the mathematical form that characterizes a TF:
T F i , j ( ω ) = f i , j ( ω ) g j ( ω )
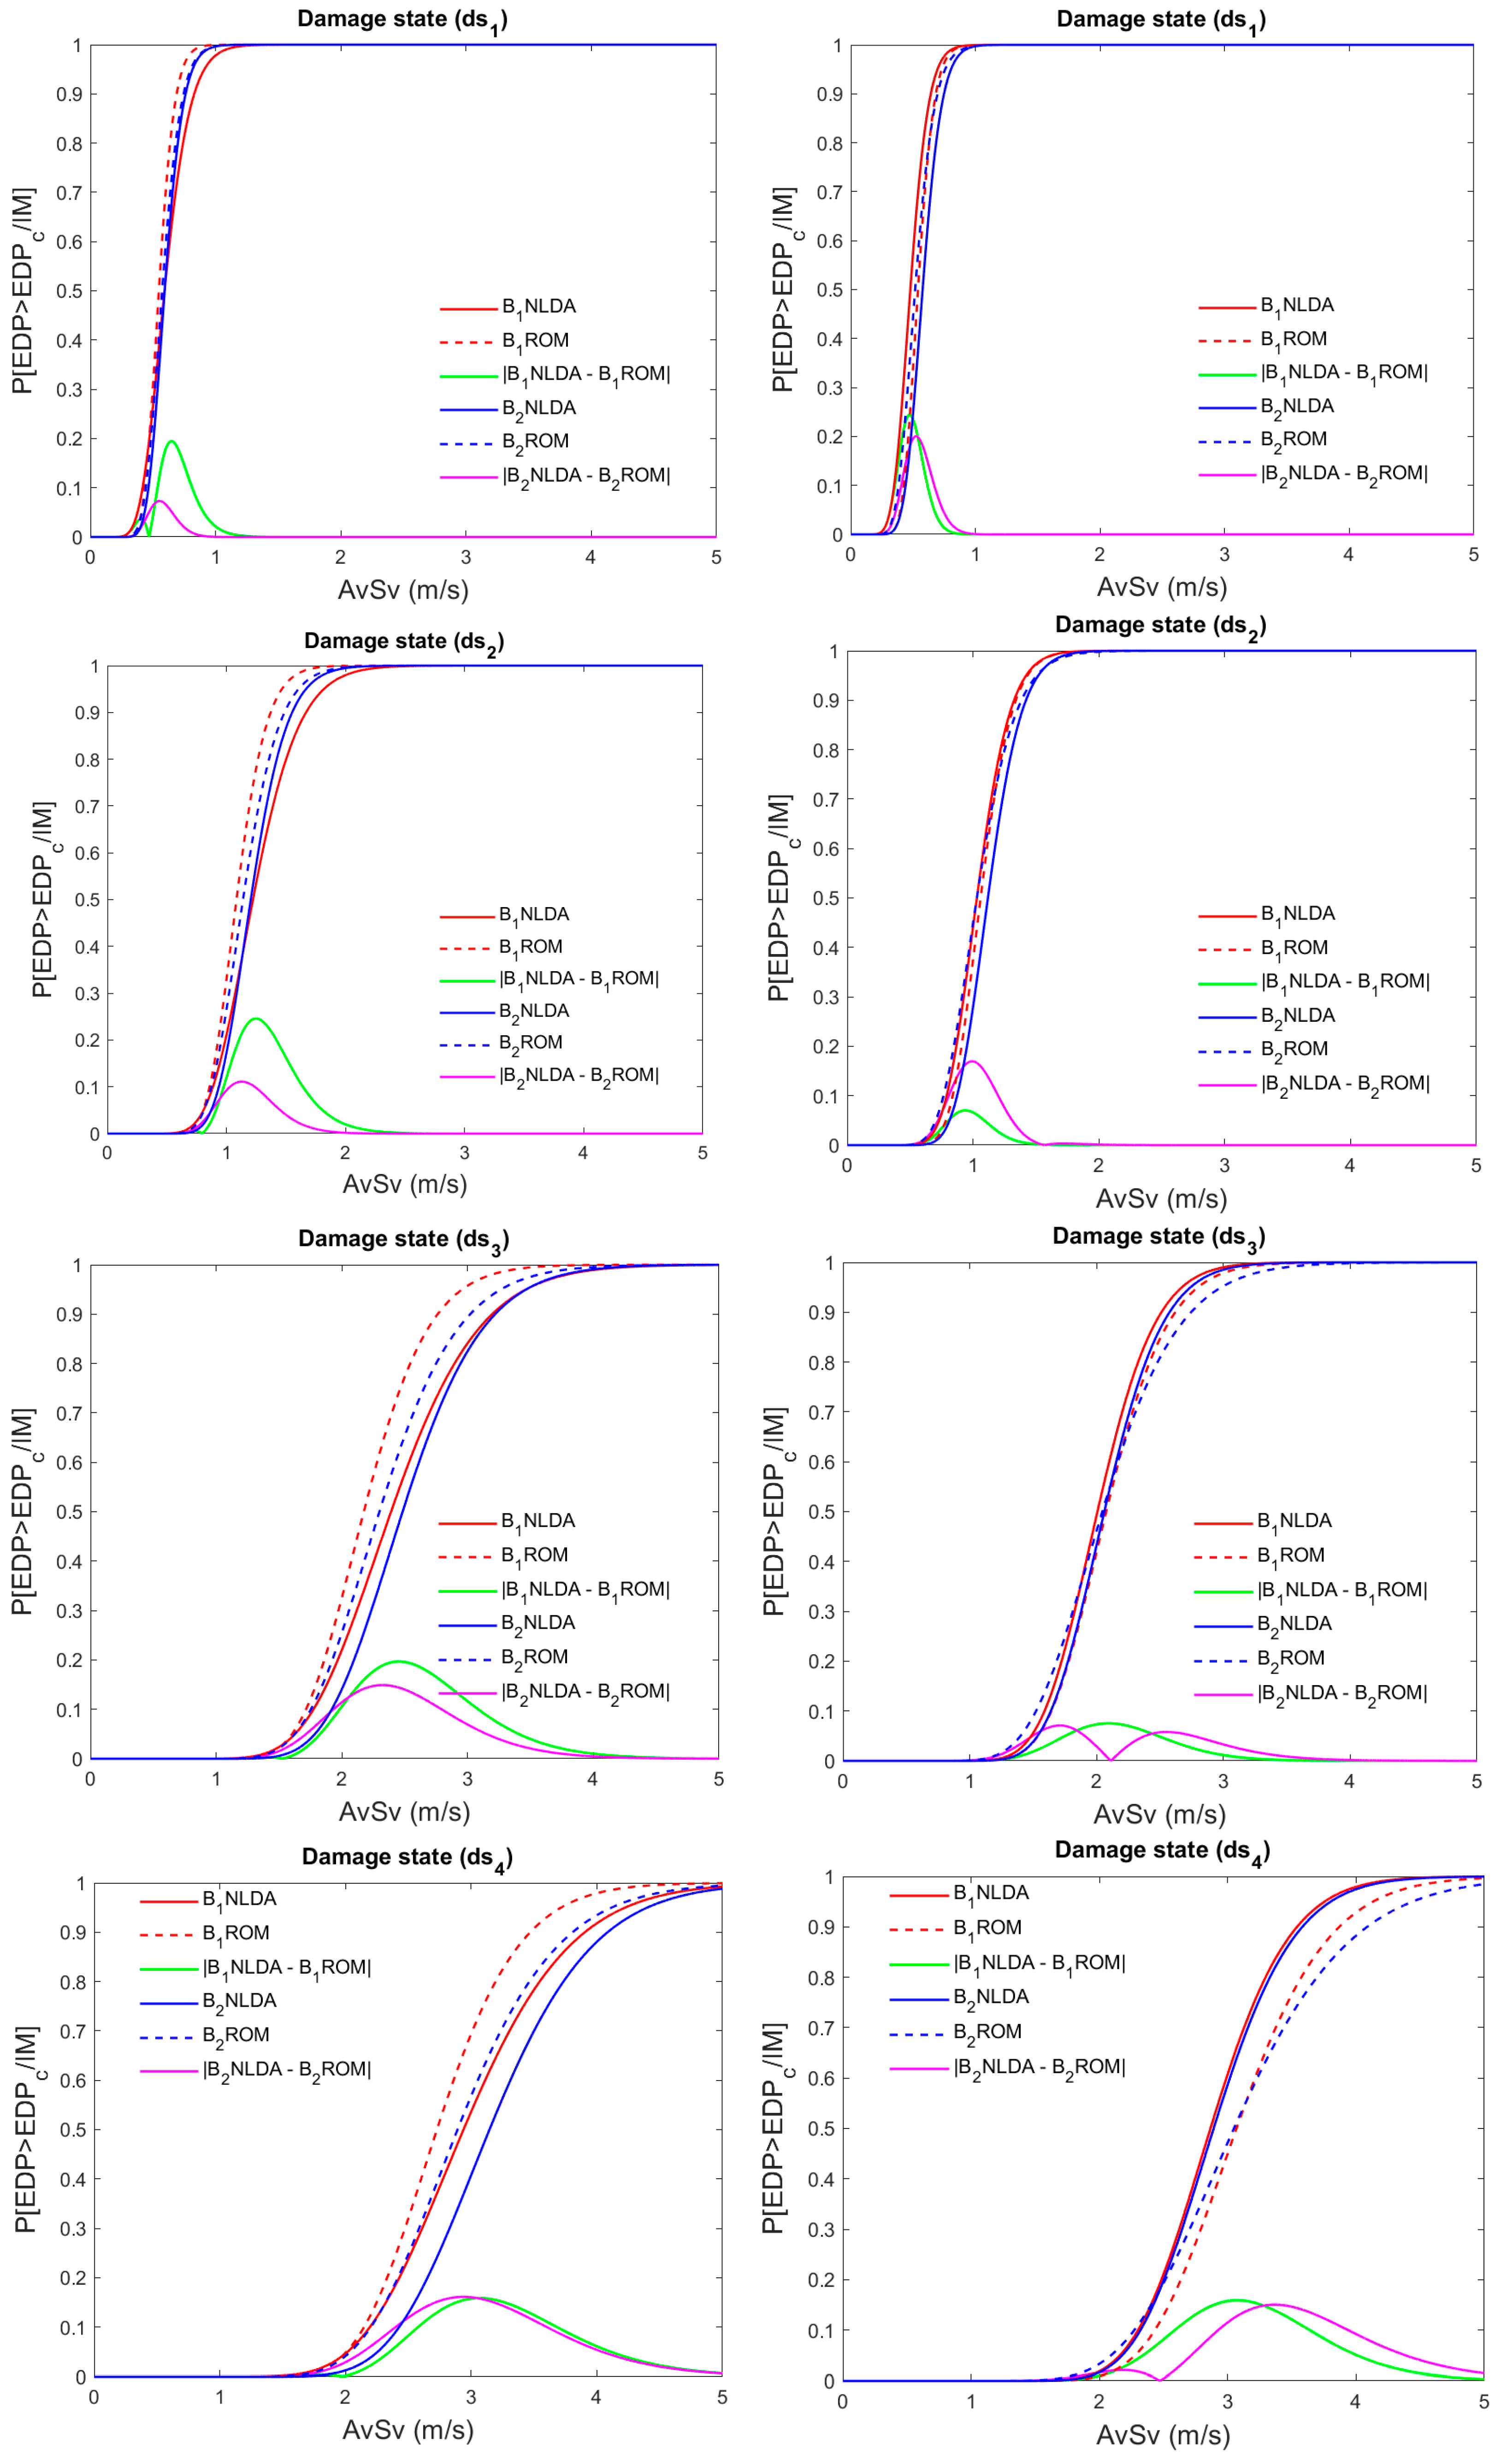
where f i , j ( ω ) represents the Fourier amplitude spectrum of the response variable (EDP) of the structure; g j ( ω ) is the Fourier amplitude spectrum of the accelerogram; subscripts i and j stand for a specific response of the structure and for an input ground motion record, respectively. Accordingly, the transfer function can be obtained from the time–history response of the structure to a ground motion record. In this study, since one hundred NLDAs have been performed per structure, it is possible to obtain the same number of TFs. However, not all of them are optimal for predicting the dynamic response of a structure in a statistical sense. Therefore, the procedure proposed in [17] has been employed to identify a so-called ‘optimal TF’. In this manner, the structural response has been estimated using ROM in the X and Y direction of the two buildings. For comparison purposes, Figure 20 shows the fragility curves for the different damage states, using both NLDA and ROM approaches. It is worth highlighting that due to the complexity of the structures under study, the dynamic response is strongly affected by higher modes that often become torsional. Notwithstanding, Figure 20 shows a good approximation between the curves obtained from NLDA and ROM (blue and red curves, for X and Y, respectively). The same figure shows the absolute difference in probability between the curves obtained considering both methods (green and magenta lines). It is noteworthy that both methods provide similar fragility functions. However, there are cases in which the differences between the estimated probabilities based on both methods increase, especially for higher damage states. This is largely due to the high degree of damage associated. In any case, it is general that for both methods (NLDA and ROM), B2 tends to show a better performance compared to B1. In this way, not only can good estimates of the expected performance of a structure be made using ROM, but also the best structural configuration can be identified.
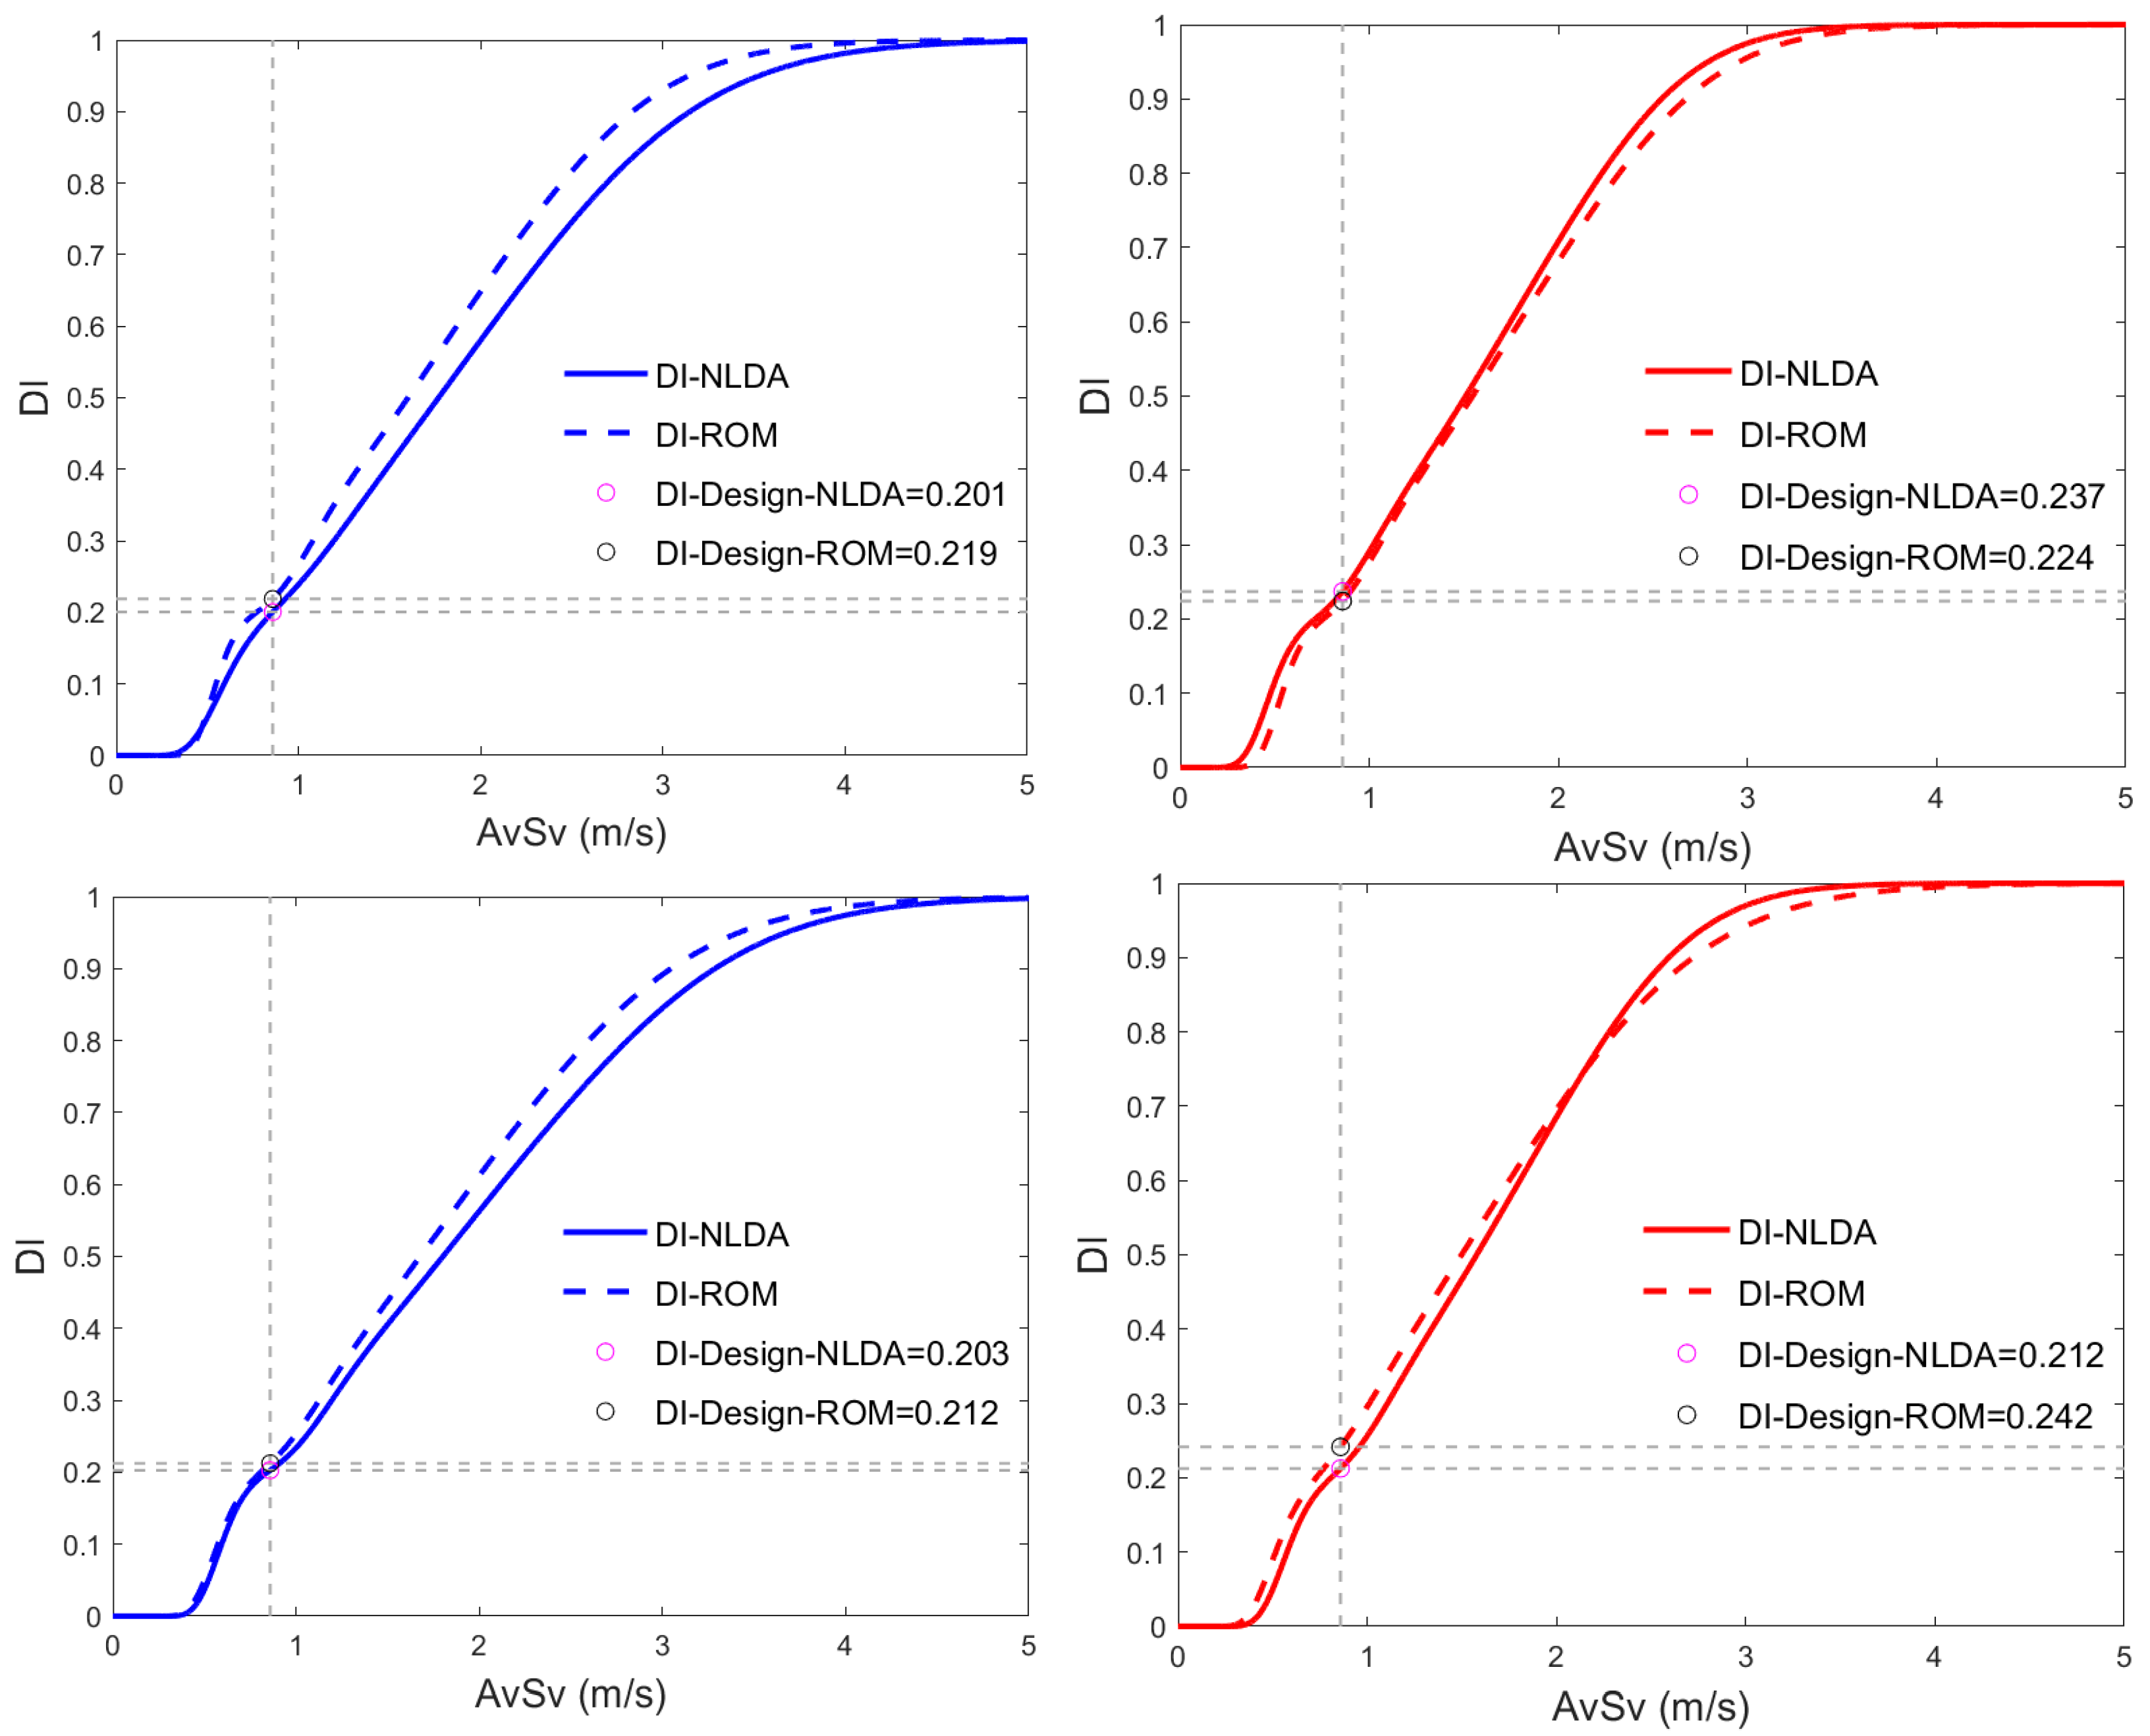
Finally, damage curves are compared based on both methods. Figure 21 shows these damage functions for each building and for each direction under study. It should be noted that the results derived from the ROM fit quite well when compared to the NLDA calculation. This is reflected in each of the main directions of the buildings. As a matter of example, the damage index of the structures has been highlighted for both buildings when they are subjected to an average intensity (AvSv = 0.85, calculated from the design elastic spectrum) given an earthquake with a return period of 475 years.

6. Conclusions

Sustainability involves the consideration of renewable materials and environmentally friendly construction practices. In this regard, the implementation of strategies to reduce dependence on raw materials, which are susceptible to global market fluctuations, is a key aspect. Addressing this urgent need requires the adoption of design and construction practices that produce reliable, sustainable and affordable structures. The latter is closely tied to the development of resilient structures that mitigate the impact of natural phenomena such as wind and seismic events. This research can contribute to strategies that reduce the carbon footprint by optimizing materials and using appropriate structural configurations in terms of mass distribution and stiffness. Additionally, the use of analytical methodologies such as ROM provides a valuable opportunity to improve seismic risk assessment without significantly increasing computational time.
The first objective of this research has been the comparison of the seismic performance of two buildings with similar architecture, as well as the same use and functionality, but a different structural configuration. This comparison has been presented in terms of fragility functions derived for an IM identified as average spectral velocity (AvSv). That is, vulnerability has been calculated based on the probability of exceeding different damage thresholds conditioned to AvSv. Particular values have been calculated for different return periods and percentiles. The MIDR has been used as the EDP to represent the structural response. The latter is the most common variable employed in the seismic performance evaluation of a structure. The results show that the efficiency of a structural system is directly influenced by its geometric configuration, particularly in the distribution of the stiffness of the elements that make up the primary load-bearing system. A well-designed structural configuration must achieve a balance between form and function and properly distributing the elements from the foundations to the connection of beams and columns. Each of these components plays a crucial role in the safety, stability, and reliability of the structure. Therefore, an appropriate layout of the structural configuration is essential to ensure safe, functional, economical, sustainable, and durable buildings. It has been observed that a configuration where a low percentage of mass is mobilized in torsional modes is essential, especially in earthquake-prone areas [50].
The source that presents the greatest uncertainty, when calculating the dynamic response of a structure, comes from seismic action; this is a doubly stochastic and non-stationary phenomenon. For this reason, it is important to have a significant number of seismic records that allow an adequate characterization of the seismic hazard. In this research, one hundred ground motion records have been selected to calculate the nonlinear dynamic response of each structure. That is, two hundred ground motion records (one hundred records per main direction) have been used to adequately characterize the seismic hazard. This high number of calculations significantly increases the computational time if NLDA is used as the type of structural analysis. For this reason, the second objective of this research has been the comparison of the structural response calculated from two different methods: NLDA and ROM. This has been carried out through fragility functions and damage curves. Note that the differences observed between the evaluation methods and between two different building configuration cases are apparently negligible. Regarding the evaluation methods, it is really positive that both methods, NLDA and ROM, show insignificant differences. This demonstrates that the ROM methodology can be used to meaningfully reduce the computational effort associated with NLDA. As for the difference between the performance of both structures (Figure 21), it should be noted that B2 not only performs slightly better than B1, it also uses less material (i.e., concrete and steel). This demonstrates the economic and safety impact of carefully considering the structural configuration during the design phase. Therefore, it can be concluded that the results estimated from both approaches represent adequately the vulnerability of the two studied buildings. It is important to highlight the reduction in computational time provided by the ROM procedure when compared to the time associated with the NLDA. Differences in computational time between both procedures have been presented: 3 months for performing the NLDAs calculations whilst 10 days for the ROM. The comparison of both procedures provides insights into the limitations and opportunities of using reduced-order methods as a complement to dynamic analyses. Finally, the conclusions presented are drawn from two specific case studies. For this reason, caution should be exercised when generalizing the results of this research. However, what is clear is that the reduction of torsional effects (for example, by centralizing rigid cores) is a key conclusion that can be applied broadly to other designs for tall reinforced concrete buildings in seismic regions. In any case, future research should focus on analyzing a larger number of structures, which would allow for a more accurate understanding of the results obtained.

Author Contributions

Conceptualization, R.J.T.-G. and Y.F.V.-A.; methodology, R.J.T.-G. and Y.F.V.-A.; software, R.J.T.-G.; validation, R.J.T.-G., Y.F.V.-A. and R.G.-D.; formal analysis, R.J.T.-G. and Y.F.V.-A.; investigation, R.J.T.-G., Y.F.V.-A. and R.G.-D.; resources, Y.F.V.-A. and R.G.-D.; data curation, Y.F.V.-A.; writing—original draft preparation, R.J.T.-G. and Y.F.V.-A.; writing—review and editing, Y.F.V.-A. and R.G.-D.; visualization, R.J.T.-G., Y.F.V.-A. and R.G.-D.; supervision, Y.F.V.-A. and R.G.-D.; funding acquisition, Y.F.V.-A. and R.G.-D. All authors have read and agreed to the published version of the manuscript.

Funding

The authors wish to thank the building company “Constructora Triple A”, as well as the architects Augusto Acuña and Carlos García, for having allowed the use of the results of the studied buildings. This research has been partially funded by the Spanish Research Agency (AEI) of the Spanish Ministry of Science and Innovation (MICIN) through project with reference: PID2020-117374RB- I00/AEI/10.13039/501100011033.

Data Availability Statement

In accordance with MDPI Research Data Policies, no new data were created or analyzed in this study. Therefore, data sharing is not applicable.

Conflicts of Interest

The authors declare that they have no known competing financial interests or personal relationships that could have appeared to influence the work reported in this manuscript. No conflicts of interest exist.

References

  1. Millward-Hopkins, J.; Steinberger, J.K.; Rao, N.D.; Oswald, Y. Providing decent living with minimum energy: A global scenario. Glob. Environ. Change 2020, 65, 102168. [Google Scholar] [CrossRef]
  2. Storm, S. Inflation in the Time of Corona and War; Institute for New Economic Thinking Working Paper Series; Institute for New Economic Thinking: New York, NY, USA, 2022. [Google Scholar]
  3. Melchers, R.E. Structural reliability theory in the context of structural safety. Civ. Eng. Environ. Syst. 2007, 24, 55–69. [Google Scholar] [CrossRef]
  4. Rackwitz, R. Structural Reliability—Analysis and Prediction. Struct. Saf. 2001, 23, 194–195. [Google Scholar] [CrossRef]
  5. Ramli, A.; Akasah, Z.A.; Masirin, M.I.M. Factors Contributing Building Safety and Health Performance of Low Cost Housing in Malaysia. J. Saf. Eng. 2013, 2, 1–9. [Google Scholar]
  6. Moon, K. Optimal structural configurations for tall buildings. In Proceedings of the 13th East Asia-Pacific Conference on Structural Engineering and Construction, EASEC 2013, Sapporo, Japan, 11–13 September 2013. [Google Scholar]
  7. Mishra, A.K. Role of Reliability Analysis in Structural Design. Hydro Nepal J. Water Energy Environ. 2019, 24, 6–9. [Google Scholar] [CrossRef]
  8. Rajak, D.K.; Pagar, D.D.; Kumar, R.; Pruncu, C.I. Recent progress of reinforcement materials: A comprehensive overview of composite materials. J. Mater. Res. Technol. 2019, 8, 6354–6374. [Google Scholar] [CrossRef]
  9. Chiaia, B.; Barchiesi, E.; De Biagi, V.; Placidi, L. A novel structural resilience index: Definition and applications to frame structures. Mech. Res. Commun. 2019, 99, 52–57. [Google Scholar] [CrossRef]
  10. van de Lindt, J.W.; Sasani, M.; Warn, G.; Esteghamati, M.Z. (Eds) Resilient and Sustainable Buildings; American Society of Civil Engineers: Reston, VA, USA, 2023. [Google Scholar] [CrossRef]
  11. Fajfar, P. Analysis in seismic provisions for buildings: Past, present and future. In Geotechnical, Geological and Earthquake Engineering; Springer: Cham, Switzerland, 2018. [Google Scholar] [CrossRef]
  12. Wilson, E.L. Three Dimensional Static and Dynamic Analysis of Structures: A Physical Approach with Emphasis on Earthquake Engineering; Computers & Structures, Inc.: Berkeley, CA, USA, 2002. [Google Scholar]
  13. Vargas-Alzate, Y.F. Análisis Estructural Estático y Dinámico Probabilista de Edificios de Hormigón Armado. Aspectos Metodológicos y Aplicaciones a la Evaluación del Daño. Ph.D. Thesis, Universitat Politècnica de Catalunya, Barcelona, Spain, 2013. (In Spanish). [Google Scholar]
  14. Deierlein, G.; Reinhorn, A.; Willford, M. Nonlinear Structural Analysis For Seismic Design. NEHRP Seism. Des. Tech. Brief 2010, 4, 1–36. [Google Scholar]
  15. de Almeida, N.M.; Silva, M.J.F.; Salvado, F.; Rodrigues, H.; Maletič, D. Risk-informed performance-based metrics for evaluating the structural safety and serviceability of constructed assets against natural disasters. Sustainability 2021, 13, 5925. [Google Scholar] [CrossRef]
  16. Asociación Colombiana de Ingeniería Sismica (AIS). Reglamento Colombiano de Construcción Sismo Resitente NSR-10; AIS: Bogotá, Colombia, 2010. (In Spanish) [Google Scholar]
  17. Tirado-Gutiérrez, R.J.; Vargas-Alzate, Y.F.; González-Drigo, R. Probabilistic estimation of the dynamic response of high-rise buildings via transfer functions. Eng. Struct. 2024, 302, 117299. [Google Scholar] [CrossRef]
  18. Cooley, J.W.; Lewis, P.A.W.; Welch, P.D. Application of the Fast Fourier Transform to Computation of Fourier Integrals, Fourier Series, and Convolution Integrals. IEEE Trans. Audio Electroacoust. 1967, 15, 79–84. [Google Scholar] [CrossRef]
  19. Vielma, J. Damage Trhesholds for Limit States of Reinforced Concrete Framed Buildings Designed According To Aci- 318/Ibc-2006. Rev. Int. De Desastres Nat. Accid. E Infraestruct. Civ. 2008, 8, 119–134. (In Spanish) [Google Scholar]
  20. Correa-Martínez, A.M.; Martens, U.; Rodríguez, G. Collage of tectonic slivers abutting the eastern Romeral Fault System in central Colombia. J. South Am. Earth Sci. 2020, 104, 102794. [Google Scholar] [CrossRef]
  21. ASCE 7-16; Minimum Design Loads and Associated Criteria for Buildings and Other Structures. American Society of Civil Engineers: Reston, VA, USA, 2017. [CrossRef]
  22. ACI 318; Building Code Requeriments for Reinforced Concrete. American Concrete Institute: Detroit, MI, USA, 2019.
  23. Moehle, J.; Bozorgnia, Y.; Yang, T.Y. The Tall Buildings Initiative. In Proceedings of the SEAOC Convention, Squaw Creek, CA, USA, 26–29 September 2007. [Google Scholar]
  24. CSI Computers & Structural, INC. Structural and Earthquake Engineering Software. 2017. Available online: www.csiamerica.com (accessed on 27 November 2023).
  25. Aguiar, R. Análisis Sísmico por Desempeño; Centro de Investigaciones Científicas, Escuela Politécnica del Ejército: Quito, Ecuador, 2003. (In Spanish) [Google Scholar]
  26. ASCE 41-17; Seismic Evaluation and Retrofit of Existing Buildings: ASCE/SEI, 41-17. American Society of Civil Engineers Institute, Structural Engineering: Reston, VA, USA, 2017.
  27. FEMA. Prestandard and Commentary for the Seismic Rehabilitation of Buildings; FEMA 356; Federal Emergency Management Agency: Washington, DC, USA, 2000. [Google Scholar]
  28. Dowell, R.K.; Seible, F.; Wilson, E.L. Pivot Hysteresis Model -Dowell, Seible & Wilson ACI 1998. ACI Struct. J. 1988, 95, 607–617. [Google Scholar]
  29. Charney, F.; Lopez-Garcia, D.; Hardyniec, A.; Ugalde, D. Modeling inherent damping in nonlinear dynamic analysis. In Proceedings of the 16th World Conference on Earthquake Engineering, Santiago, Chile, 9–13 January 2017. [Google Scholar]
  30. Asimakopoulos, A.V.; Karabalis, D.L.; Beskos, D.E. Inclusion of P-Δ effect in displacement-based seismic design of steel moment resisting frames. Earthq. Eng. Struct. Dyn. 2007, 36, 2171–2188. [Google Scholar] [CrossRef]
  31. Akhter, R.; Prakash, S.; Baig, M.A. P-Delta Effect on High Rise Building Subjected to Earthquake and Wind Load. Int. J. Eng. Sci. Comput. 2017, 7, 14441–14446. [Google Scholar]
  32. Taranath, B.S. Tall Building Design; CRC Press: Boca Raton, FL, USA, 2016. [Google Scholar] [CrossRef]
  33. Charney, F.A. Seismic Loads-Guide to the Seismic Provisions of ASCE 7-10; American Society of Civil Engineers: Reston, VA, USA, 2015. [Google Scholar]
  34. Charney, F.A. Use of nonlinear analysis in the context of the ASCE 7 seismic load provisions. In Structures Congress 2011—Proceedings of the 2011 Structures Congress; American Society of Civil Engineers: Reston, VA, USA, 2011. [Google Scholar] [CrossRef]
  35. ATC-40; Seismic Evaluation and Retrofit of Concrete Buildings. Applied Technology Council: Redwood City, CA, USA, 1996.
  36. Fragiadakis, M.; Papadrakakis, M. Performance-based optimum seismic design of reinforced concrete structures. Earthq. Eng. Struct. Dyn. 2008, 37, 825–844. [Google Scholar] [CrossRef]
  37. Hanganu, A.D.; Oñate, E.; Barbat, A.H. A finite element methodology for local/global damage evaluation in civil engineering structures. Comput. Struct. 2002, 80, 1667–1687. [Google Scholar] [CrossRef]
  38. Haselton, C.B.; Whittaker, A.S.; Hortascu, A.; Baker, J.W.; Bray, J.; Grant, D.N. Selecting and scaling ground motions for performing response-history analyses. In Proceedings of the 15th World Conference on Earthquake Engineering, Lisbon, Portugal, 24–28 September 2012. [Google Scholar]
  39. Shedlock, K.M. California Earthquakes: Science, Risks, and the Politics of Hazard Mitigation. Eos Trans. Am. Geophys. Union 2002, 83, 39–40. [Google Scholar] [CrossRef]
  40. Servicio Geológico Colombiano. SGC. Sistema de Consulta de la Amenaza Sísmica de Colombia. 2020. Available online: https://amenazasismica.sgc.gov.co/ (accessed on 20 November 2025).
  41. Vargas-Alzate, Y.F.; Silva, V.; Vamvatsikos, D.; Pujades, L.G. A simplified approach for including the incidence angle effect in seismic risk assessment. Earthq. Eng. Struct. Dyn. 2022, 51, 191–212. [Google Scholar] [CrossRef]
  42. Martins, L.; Silva, V. Development of a fragility and vulnerability model for global seismic risk analyses. Bull. Earthq. Eng. 2021, 19, 6719–6745. [Google Scholar] [CrossRef]
  43. Vargas-Alzate, Y.F.; Hurtado, J.E.; Pujades, L.G. New Insights into the Relationship Between Seismic Intensity Measures and Nonlinear Structural Response; Springer: Dordrecht, The Netherlands, 2022. [Google Scholar] [CrossRef]
  44. Mayes, R.L. Interstory drift design and damage control issues. Struct. Des. Tall Build. 1995, 4, 15–25. [Google Scholar] [CrossRef]
  45. Vargas-Alzate, Y.F.; Pujades, L.G.; Barbat, A.H.; Hurtado, J.E. An Efficient Methodology to Estimate Probabilistic Seismic Damage Curves. J. Struct. Eng. 2019, 145, 04019010. [Google Scholar] [CrossRef]
  46. Ebrahimian, H.; Jalayer, F. Selection of seismic intensity measures for prescribed limit states using alternative nonlinear dynamic analysis methods. Earthq. Eng. Struct. Dyn. 2021, 50, 1235–1250. [Google Scholar] [CrossRef]
  47. Bakalis, K.; Vamvatsikos, D. Seismic Fragility Functions via Nonlinear Response History Analysis. J. Struct. Eng. 2018, 144, 04018181. [Google Scholar] [CrossRef]
  48. Sokolov, V.Y. Hazard-Consistent Ground Motions: Generation on the Basis of Uniform Hazard Fourier Spectra. Bull. Seismol. Soc. Am. 2000, 90, 1010–1027. [Google Scholar] [CrossRef]
  49. Park, Y.; Ang, A.H.-S. Mechanistic Seismic Damage Model for Reinforced Concrete. J. Struct. Eng. 1985, 111, 722–739. [Google Scholar] [CrossRef]
  50. Surana, M.; Singh, Y.; Lang, D.H. Effect of irregular structural configuration on floor acceleration demand in hill-side buildings. Earthq. Eng. Struct. Dyn. 2018, 47, 2032–2054. [Google Scholar] [CrossRef]
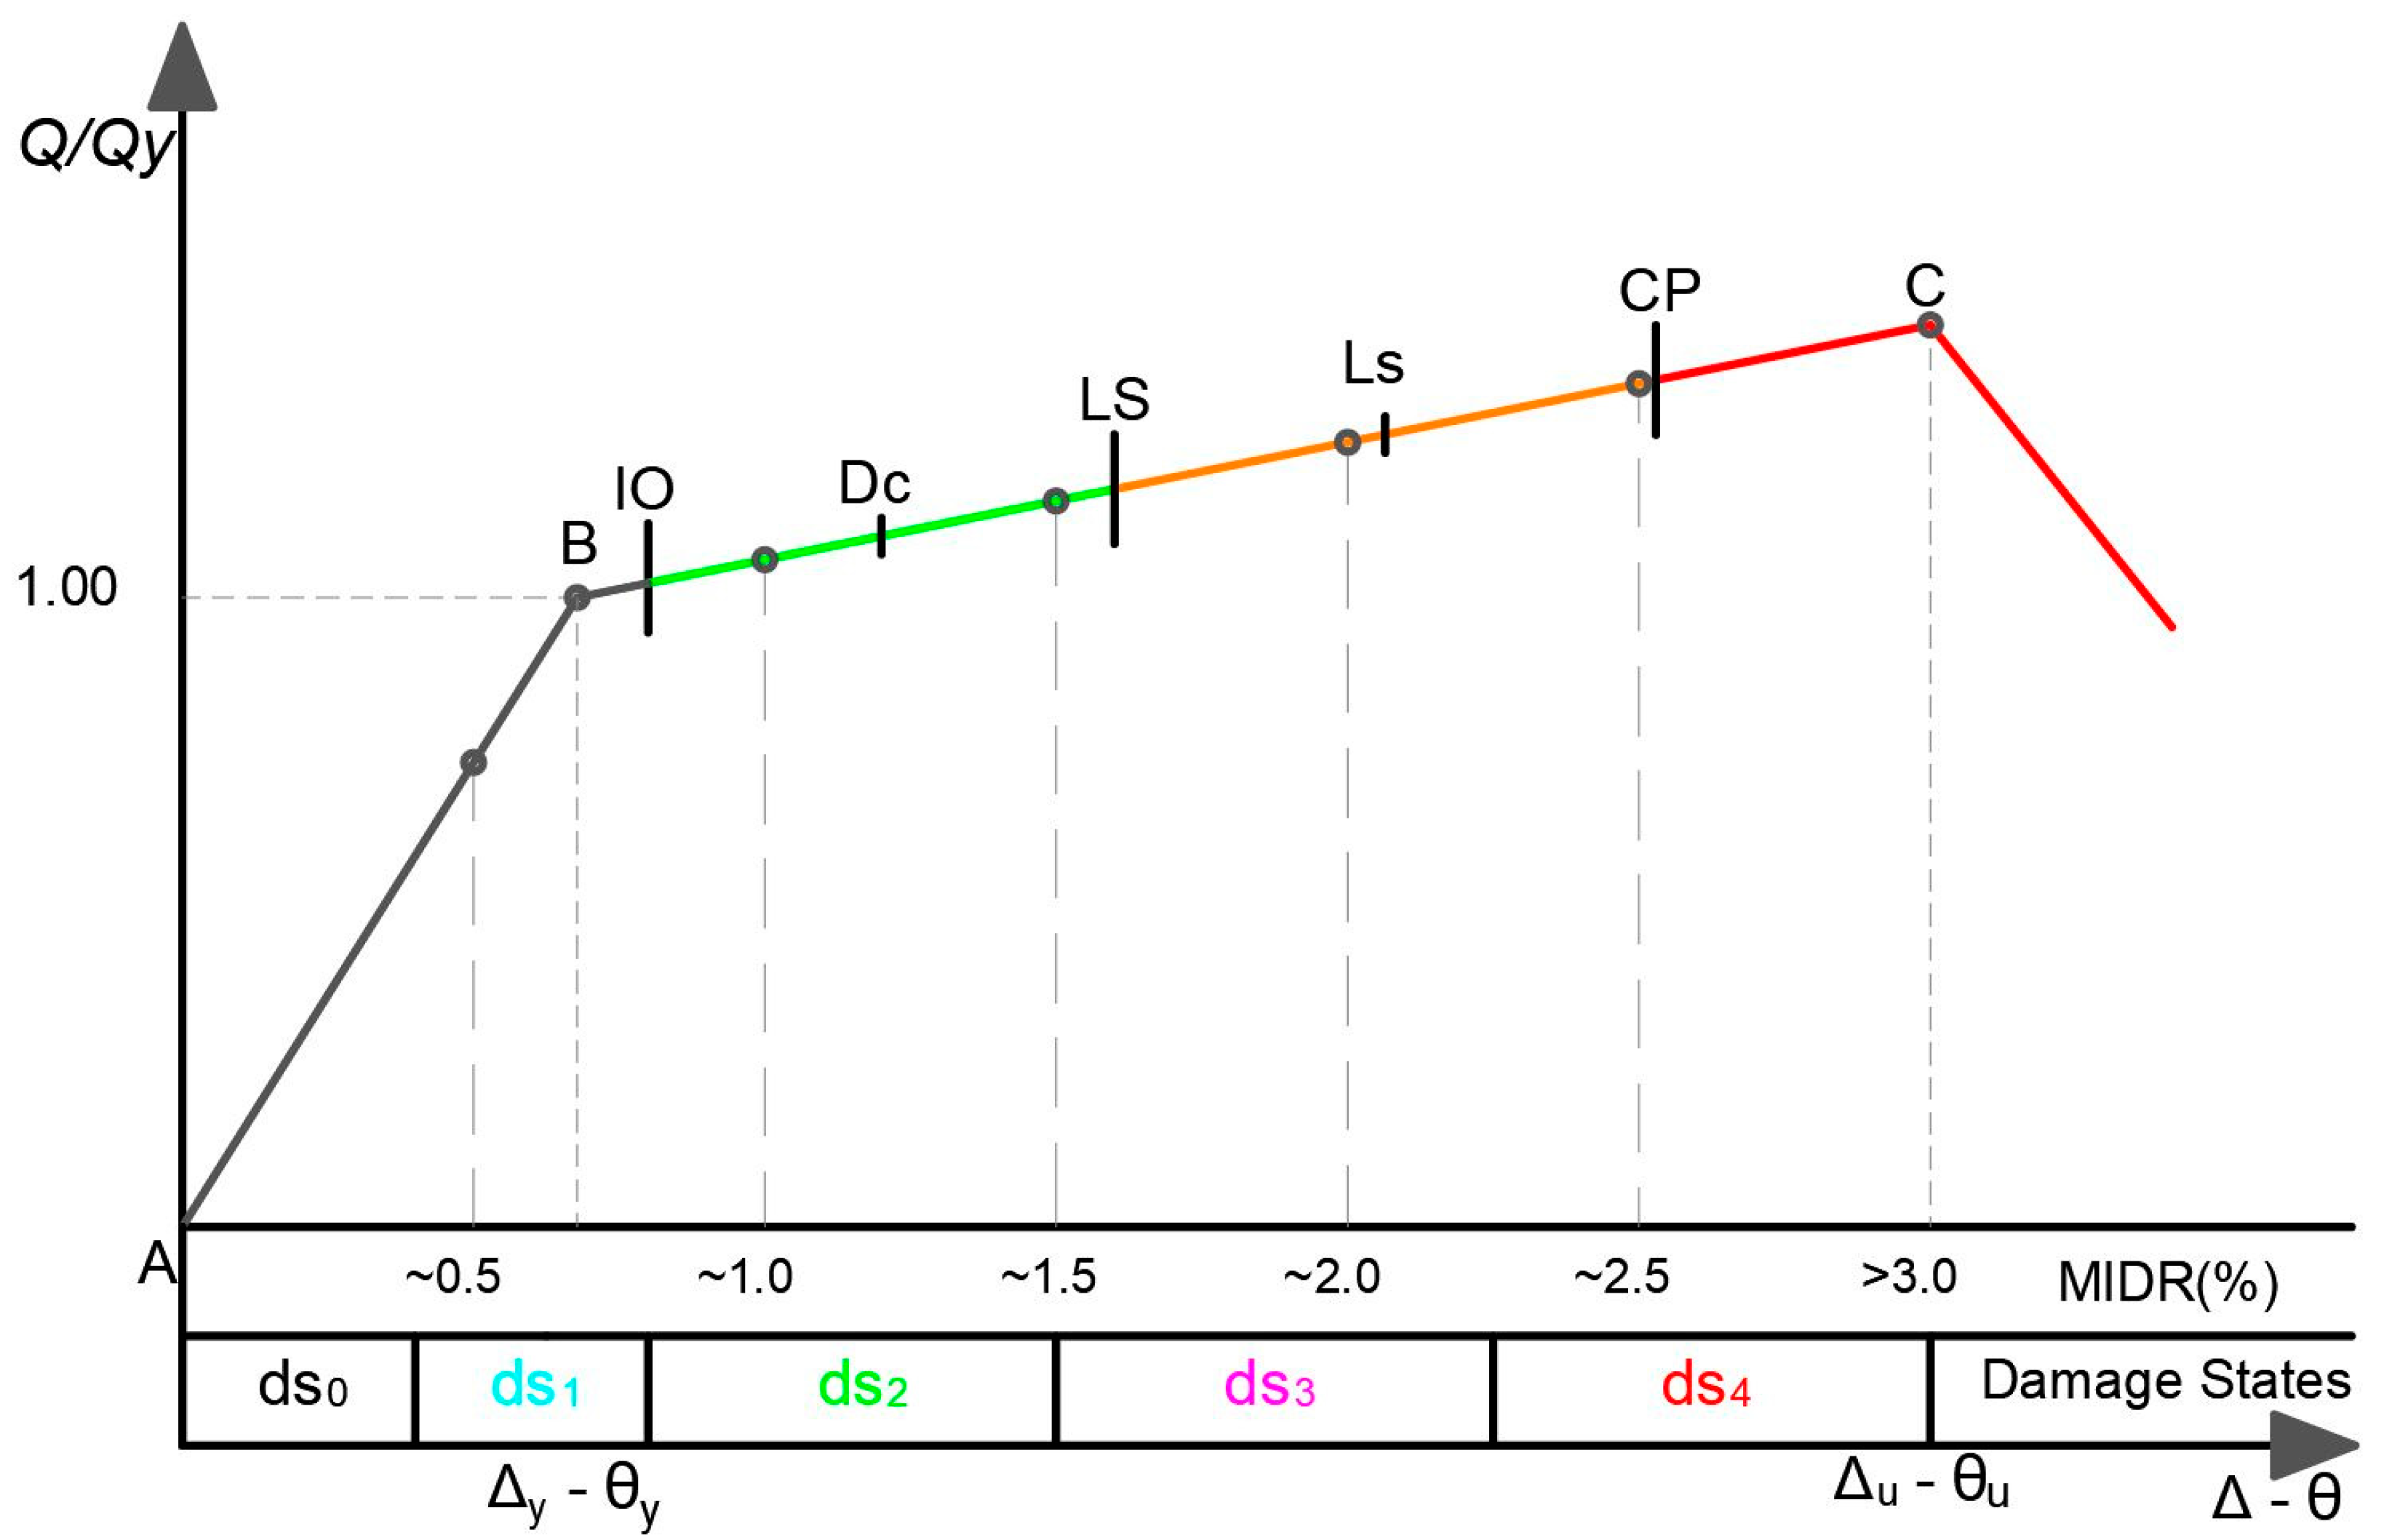
Figure 1. Idealized force–deformation relations and levels of structural performance (source: American Society of Civil Engineers, ASCE 7-16, and Federal Emergency Management Agency, FEMA 356).
Infrastructures 10 00325 g001
Figure 2. A 3D model, front (left) and back (right) view of Building 1.
Infrastructures 10 00325 g002
Figure 3. Front (left) and side (right) frames elevations of Building 1.
Infrastructures 10 00325 g003
Figure 4. Structural floor plan of representative Building 1. The red point represents the center of mass, and the green cross represents the center of stiffness.
Infrastructures 10 00325 g004
Figure 5. A 3D model, front (left) and back (right) view of Building 2.
Infrastructures 10 00325 g005
Figure 6. Front (left) and side (right) frames elevations of Building 2.
Infrastructures 10 00325 g006
Figure 7. Structural floor plan of representative Building 2. The red point represents the center of mass, and the green cross represents the center of stiffness.
Infrastructures 10 00325 g007
Figure 8. Comparison between concrete (left) and steel (right) quantities for buildings 1 and 2.
Infrastructures 10 00325 g008
Figure 9. Spectra of the fitted signals and elastic design spectra of the studied buildings (Left: X direction; Right: Y direction).
Infrastructures 10 00325 g009
Figure 10. Response spectra of the 100 ground motion records selected to perform NLDA (gray). Uniform spectra for return periods of 31, 225, 475, 975 and 2475 years. Blue for X direction and red for Y direction (data source: Colombian Geological Service).
Infrastructures 10 00325 g010
Figure 11. Fragility curves for the different damage states of Buildings 1 and 2 (left: X and right: Y).
Infrastructures 10 00325 g011
Figure 12. Building damage probabilities for the 31-year return period earthquake (left: X direction and right: Y direction).
Infrastructures 10 00325 g012
Figure 13. Building damage probabilities for the 225-year return period earthquake (left: X direction and right: Y direction).
Infrastructures 10 00325 g013
Figure 14. Building damage probabilities for the 475-year return period earthquake (left: X direction and right: Y direction).
Infrastructures 10 00325 g014
Figure 15. Building damage probabilities for the 975-year return period earthquake (left: X direction and right: Y direction).
Infrastructures 10 00325 g015
Figure 16. Building damage probabilities for the 2475-year return period earthquake (left: X direction and right: Y direction).
Infrastructures 10 00325 g016
Figure 17. The 15th, 50th and 85th percentiles of damage probabilities of the buildings under study for different intensity measures (earthquakes with return periods of 31, 225, 475, 975 and 2475 years; X direction).
Infrastructures 10 00325 g017
Figure 18. The 15th, 50th and 85th percentiles of damage probabilities of the buildings under study for different measures of intensity (earthquakes with return periods of 31, 225, 475, 975 and 2475 years; Y direction).
Infrastructures 10 00325 g018
Figure 19. The 15th percentile of the damage indices of the studied buildings calculated in both directions (left: X direction and right: Y direction).
Infrastructures 10 00325 g019
Figure 20. Fragility curves for the different damage states and for the X (left) and Y (right) directions.
Infrastructures 10 00325 g020
Figure 21. Damage indices for the B1 (Top) and B2 (bottom) in both directions (left: X and right: Y).
Infrastructures 10 00325 g021
Table 1. Dynamics characteristics of the structural systems.
BuildingStoriesH
(m)
W
(Ton)
Vsx
(Ton)
Vsy
(Ton)
T t x
(s)
T t y
(s)
T r z
(s)
Mass
(Ton/g)
M t x
%
M t y
%
M r z
%
12372.1019,574.54587.45452.72.452.191.951995.4656965
22371.1019,156.14244.65522.72.572.522.091952.7676972
H is the height of structures, W represents the weight of the building; Vsx and Vsy represent the base shear reactions in both directions (calculated from RSM); T t x and T t y are the fundamental translational periods of vibration for the two main directions; T r z is the fundamental period related to the rotational mode around the z-axis; Mass is the total mass of the building, and M t x , M t y and M r z are the mass participation factors of the fundamental modes.
Table 2. Geometric and material characteristics of the structural elements (Building 1).
BeamsColumnsWalls
Levelfc
(MPa)
h i (m)b
(cm)
h
(cm)
ρ
(%)
b
(cm)
h
(cm)
ρ
(%)
b
(cm)
h
(cm)
ρ
(%)
1–2354.2540–6055>0.3340–50Variable1–340Variable1–2
3353.0040–6055>0.3340–50Variable1–340Variable1–2
4354.2040–6055>0.3340–50Variable1–340Variable1–2
5353.6040–6055>0.3340–50Variable1–340Variable1–2
6–10353.0540–6055>0.3340–50Variable1–340Variable1–2
11–1628–353.0040–6050>0.3340–50Variable1–240Variable1–2
17–22282.9540–6045>0.3340–50Variable140Variable1
fc represents the compressive concrete strength; h i is the story height; b and h are the width and height of the cross-sections; ρ is the steel percentage.
Table 3. Geometric and material characteristics of the structural elements of Building 2.
BeamsColumnsWalls
Levelfc
(MPa)
h i (m)b
(cm)
h
(cm)
ρ
(%)
b
(cm)
h
(cm)
ρ
(%)
b
(cm)
h
(cm)
ρ
(%)
1–2353.8540–6050>0.3340–60Variable1–325–40Variable1–2
3354.4540–6050>0.3340–60Variable1–325–40Variable1–2
4353.0040–6050>0.3340–60Variable1–325–40Variable1–2
5353.3040–6050>0.3340–60Variable1–325–40Variable1–2
6353.8040–6050>0.3340–60Variable1–325–40Variable1–2
7–15353.0540–6050>0.3340–50Variable1–325–40Variable1–2
16–22283.0540–5050>0.3340–50Variable1–225–40Variable1
fc represents the compressive concrete strength; h i is the story height; b and h are the width and height of the cross-sections; ρ is the amount of steel (percentage).
Table 4. Statistical Mean of the MIDR.
Building M I D R x ¯ M I D R y ¯
B10.00790.0067
B20.00720.0067
Table 5. Damage indices (DI) for the different uniform hazard spectra.
Percentile 15
RP (years)312254759752475
DI_B1_x0.000.080.200.260.42
DI_B1_y0.000.150.240.320.51
DI_B2_x0.000.080.200.260.42
DI_B2_y0.000.090.210.280.48
Percentile 50
RP (years)312254759752475
DI_B1_x0.000.160.260.400.64
DI_B1_y0.000.200.320.480.78
DI_B2_x0.000.170.250.400.61
DI_B2_y0.000.180.280.450.76
Percentile 85
RP (years)312254759752475
DI_B1_x0.000.220.360.550.82
DI_B1_y0.000.260.440.670.95
DI_B2_x0.000.220.360.540.79
DI_B2_y0.000.230.410.650.94
In this table, RP is the return period.
Disclaimer/Publisher’s Note: The statements, opinions and data contained in all publications are solely those of the individual author(s) and contributor(s) and not of MDPI and/or the editor(s). MDPI and/or the editor(s) disclaim responsibility for any injury to people or property resulting from any ideas, methods, instructions or products referred to in the content.