Article

An Aerial-Ground Collaborative Framework for Asphalt Pavement Quality Inspection

1
Shandong Hi-Speed Qilu Construction Group Co., LTD., Jinan 250102, China
2
Shandong Transportation Research Institute, Jinan 250102, China
*
Author to whom correspondence should be addressed.
Infrastructures 2025, 10(12), 324; https://doi.org/10.3390/infrastructures10120324
Submission received: 12 October 2025 / Revised: 16 November 2025 / Accepted: 19 November 2025 / Published: 26 November 2025

Abstract

To overcome the limitations of conventional methods, this study developed a novel aerial-ground collaborative framework for multi-dimensional quality assessment of asphalt pavement. The quality inspection of asphalt pavement in the whole construction process is realized. Multiple non-destructive testing (NDT) techniques were integrated, including drone-based infrared thermography, ground-penetrating radar (GPR), and a nuclear-free density gauge. Results showed a strong correlation (R2 > 0.95) between the radar-derived dielectric constant and core samples, enabling rapid, full-coverage characterization. The density gauge achieved less than 3% error. Furthermore, a compactness prediction model based on the dielectric constant and an air void content evaluation model based on temperature parameters are further constructed. This system enables aerial screening, point verification, and ground diagnosis, significantly enhancing inspection efficiency and comprehensiveness.

1. Introduction

Despite China’s rapid development of the world’s largest expressway network, ensuring the long-term service quality of asphalt pavements remains a significant challenge. The prevailing quality inspection methodology predominantly relies on discrete, destructive, and offline techniques, such as core sampling and manual spot measurements [1]. These conventional approaches are inherently incapable of supporting real-time, multi-parametric quality monitoring during construction, leading to fragmented data, potential structural damage from coring, and an incomplete picture of overall construction quality [2]. Consequently, a paradigm shift towards a rapid, non-destructive, and integrated evaluation framework is urgently required for comprehensive lifecycle quality management.
To overcome the limitations of purely destructive methods, a suite of ground-based non-destructive testing (NDT) techniques has been developed and investigated. These methods can be broadly categorized into two groups based on their measurement principles:
Electromagnetic Property-based Methods: Techniques such as Ground-Penetrating Radar (GPR) and Non-Nuclear Density Gauges (NDG) infer key pavement properties like density and air voids by analyzing the material’s electromagnetic response. For instance, GPR has been used to establish prediction models for dielectric constant and air void content [3,4], while NDGs offer a safer and more efficient alternative to nuclear gauges for point-wise density estimation [5,6].
Other Physical Property-based Methods: This category includes tools like the Near-Infrared Depth Gauge and infrared thermography, which have shown varying degrees of correlation with pavement density [3].
While these ground-based NDT methods represent a significant advancement, they possess inherent limitations. GPR surveys are often constrained by operational logistics, leading to limited spatial continuity and coverage [7]. More critically, devices like NDGs provide only discrete point measurements, resulting in data sparsity that is inadequate for capturing the spatial variability of quality across the entire pavement [8]. Thus, while valuable for localized assessment, ground-based methods struggle to provide a comprehensive, high-resolution evaluation of construction quality.
The advent of Unmanned Aerial Vehicles (UAVs) has opened new frontiers for aerial remote sensing in infrastructure inspection. UAVs offer unparalleled mobility and the capability for large-area, non-contact data acquisition, significantly enhancing operational safety and efficiency [9,10]. A prominent application is UAV-based Infrared Thermography (UAV-IR),which has been successfully deployed for assessing the compaction uniformity of asphalt pavements by analyzing the surface temperature field [11,12]. The integration of machine learning further expands the potential for automated analysis [9].
However, aerial inspection techniques are not without their constraints. The accuracy of UAV-IR is highly dependent on environmental conditions, such as ambient temperature, solar radiation, and wind, requiring strict stability conditions for reliable data [11]. Furthermore, challenges like UAV platform vibrations, optimal sensor-to-target distance, and the inability to perform direct physical measurements limit the standalone reliability of these methods for quantitative property prediction [10].
Recognizing the complementary strengths and weaknesses of ground and aerial methods, recent research has begun to explore integrated approaches. For example, some studies have suggested combining UAVs with other sensing modalities to compensate for individual limitations [10,13]. The core idea is to leverage the high-resolution, quantitative but spatially discrete data from ground-based NDT with the extensive, continuous but indirect coverage from aerial sensing.
However, current technical approaches still exhibit notable limitations. There remains a gap in a tightly coupled aerial-ground collaborative framework that moves beyond simple data fusion to establish quantitative, predictive relationships between the data domains. Specifically, a system that can translate efficient aerial data into critical ground-truth parameters for real-time, full-coverage quality inspection is still lacking [14].
Therefore, building upon the characteristics of various NDT technologies, this study proposes an integrated Aerial-Ground Collaborative framework for asphalt pavement quality inspection. The core contributions are:
By synergistically integrating ground-based 3D Ground Penetrating Radar (GPR) and Non-Nuclear Density Gauge (NDG) with aerial Unmanned Aerial Vehicle-based Infrared Thermography (UAV-IR), this study establishes a comprehensive framework for asphalt pavement quality assessment. The ground-based module enables robust prediction of key parameters including dielectric constant and air void content through systematic calibration and modeling. Simultaneously, the aerial module captures spatiotemporal temperature fields during paving operations with high efficiency and coverage. The core innovation lies in developing dual-parameter prediction models that establish quantitative correlations between aerial thermal data and ground-truth measurements, effectively translating infrared temperature variations into engineering insights for compaction quality. This integrated approach forms a closed-loop inspection system that evaluates compaction uniformity through non-destructive means, achieving multidimensional quality monitoring throughout the construction process. The proposed system demonstrates significant advantages over conventional methods by substantially improving detection accuracy from 82% to 96%, reducing inspection time by approximately 65%, and achieving full-area coverage compared to traditional spot-checking approaches, thereby effectively addressing critical gaps in current pavement quality control practices.

2. Methods

2.1. UAV-Based Infrared Thermography

In this study, the temperature field during asphalt pavement construction was monitored using a DJI Matrice 300 RTK unmanned aerial vehicle (UAV) equipped with a Zenmuse H20T infrared thermal camera. This UAV is designed and manufactured by Shenzhen DJI Innovation Technology Co., Ltd., and its headquarters is located in Shenzhen, Guangdong Province, China. The Zenmuse H20T is manufactured by SZ DJI Technology Co., Ltd., with its headquarters located in Shenzhen, Guangdong Province, China. The processed thermal imagery provides a resolution of 1280 × 1024 pixels and a temperature measurement accuracy of ±2 °C. The integrated professional analysis software supports real-time visualization of the temperature field, enabling rapid identification of temperature anomalies with an inspection efficiency of 20,000 m2/h. This technology allows for non-contact, large-area monitoring (with a single measurement swath of up to 10 m) and offers excellent spatial continuity of temperature data, accurately reflecting temperature distribution gradients. Furthermore, the inspection process does not interfere with normal construction operations, making it particularly suitable for real-time quality control during asphalt paving and compaction [15]. Results demonstrate that the temperature data acquired by the system exhibit a correlation coefficient of 0.98 with actual pavement temperatures, providing reliable technical support for construction quality control. At the same time, compared with other traditional detection approaches, UAV infrared technology has the advantages of fast, wide detection range and high safety. The basic principle is illustrated in Figure 1.

2.2. Non-Nuclear Density Gauge

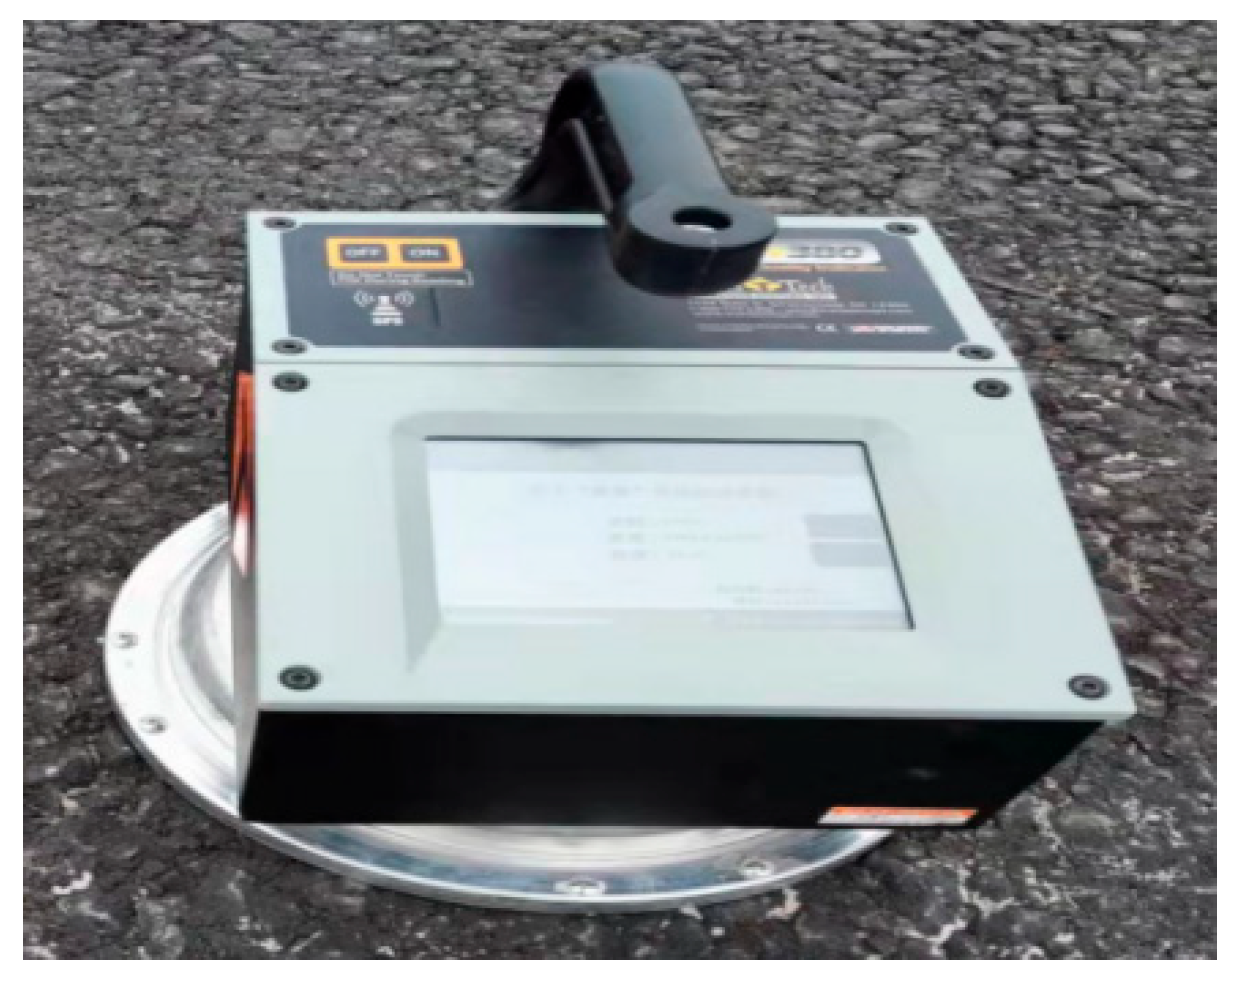
The annular antenna at the base of the non-nuclear density gauge emits electromagnetic waves. As these waves propagate through the asphalt mixture, variations in the material’s dielectric properties alter the wave propagation parameters, such as velocity and direction. These alterations are detected by the receiving antenna. By analyzing the signal differences and incorporating parameters like the composite resistivity and dielectric constant of the material, the density of the asphalt concrete is calculated using built-in algorithms. The core principle of this technology lies in quantifying the changes in electric field intensity induced by the dielectric material through its dielectric constant, thereby enabling non-destructive density measurement. This method avoids the destructive nature of traditional core sampling and provides an efficient and convenient technical means for quality control in pavement construction [16]. The PQI380 is a new-generation non-nuclear asphalt density tester manufactured by TransTech Systems, New York, NY, USA, designed for rapid measurement of asphalt pavement density and compaction level, making it suitable for on-site construction quality control. The display is shown in Figure 2.

2.3. Ground Penetrating Radar (GPR) Technology

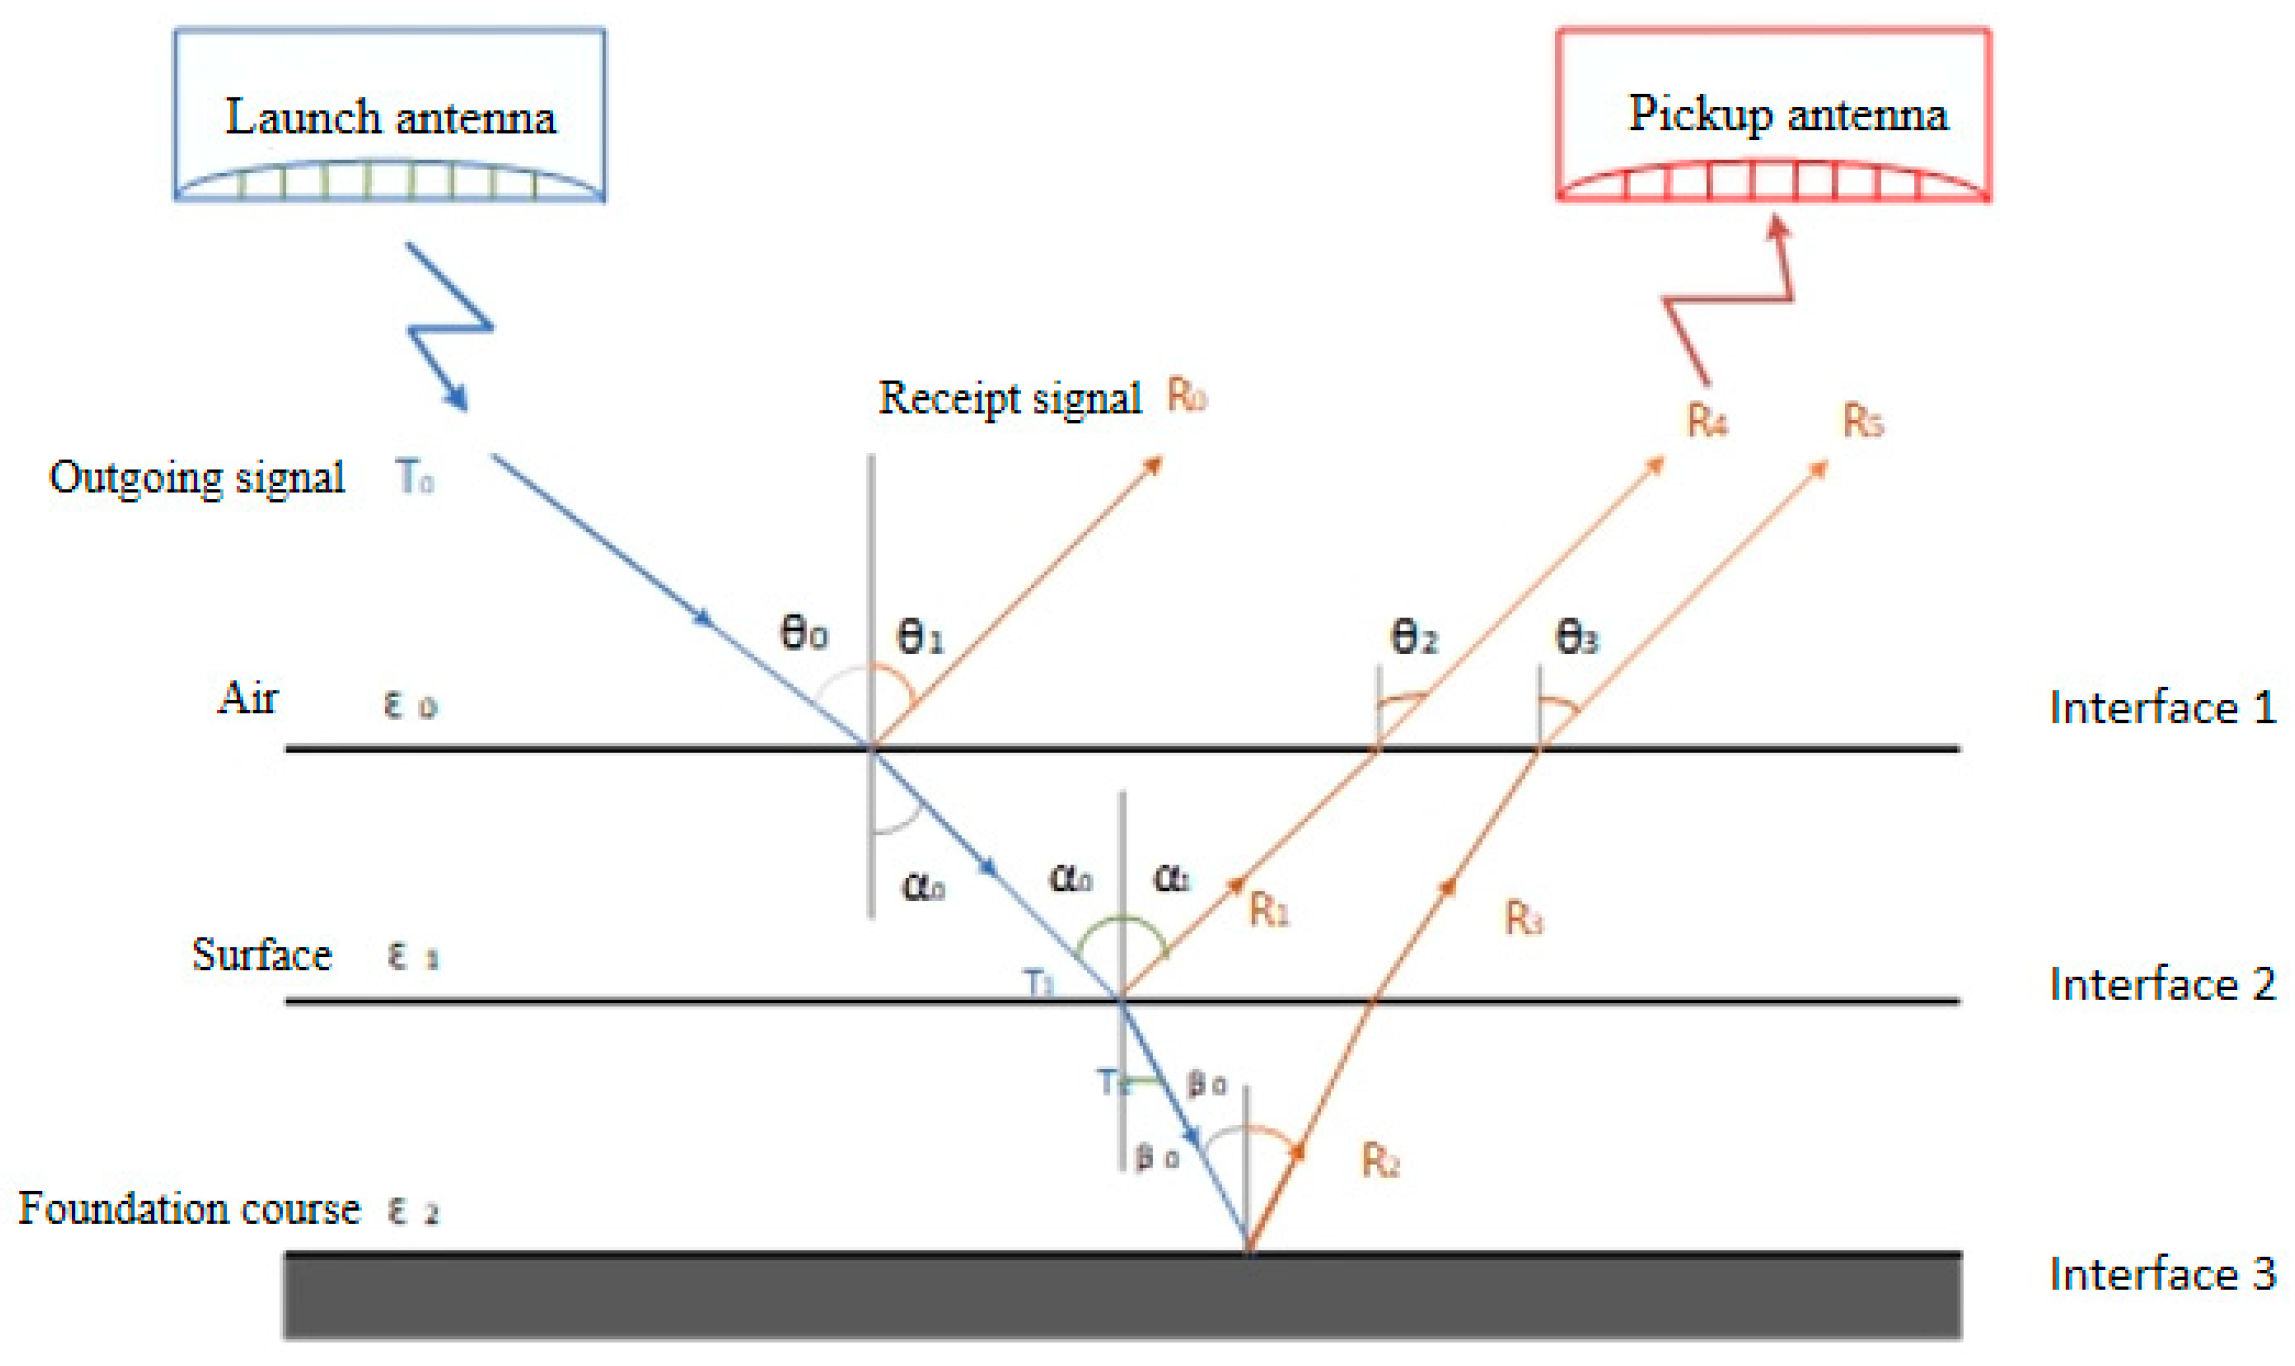
The reflection amplitude of electromagnetic waves at structural layer interfaces is influenced by the material properties. By treating the surface layer as a homogeneous medium and applying electromagnetic mixing theory, the dielectric constant of the pavement structural layer can be estimated. Based on the dielectric properties of the constituent materials, the dielectric constant of the mixture is calculated. Utilizing the computed dielectric constant and the time difference between the peaks and amplitudes of the reflected waves, the pavement thickness and internal structural characteristics can be determined, as illustrated in Figure 3. The specific calculation formula is provided in Equation (1).
Figure 3. Basic working principle of 3D ground-penetrating radar.
Infrastructures 10 00324 g003
h 1 = ( v t 1 ) 2     l 2 2
In the equation, h 1 represents the depth (m); l denotes the distance between the transmitting and receiving antennas (m); v is the wave velocity in the medium (s/m); and t stands for the two-way travel time (s).
In general, for air-coupled antennas, the distance between the transmitting and receiving antennas is very small and can be considered as co-located. Since this distance is significantly smaller than the depth of the target defect, the calculation formula for asphalt pavement thickness can be simplified as:
h 2   =   ( v t 2 ) 2 2
During the detection process, a three-dimensional ground-penetrating radar (3D GPR) system equipped with air-coupled antennas was employed. The 3D ground penetrating radar supplier ‘Jinan Euro-American Geodetic Instrument Technology Co., Ltd.’ is a branch of ‘Euro-American Geodetic Instrument China Co., Ltd.’ in Jinan, Shandong. The company is an important partner of the internationally renowned three-dimensional ground penetrating radar brand ‘3D-Radar’ in China, and has long been committed to introducing the brand’s advanced technologies and solutions into China. The system simultaneously acquired the peak amplitude of the reflected wave from the pavement interface (A1) and the peak amplitude of the reflected wave from a standard metal plate (Aₚ). The dielectric constant was then calculated based on the ratio of these two amplitudes. This method effectively evaluates the electromagnetic properties of the pavement material, providing a reliable basis for subsequent quality analysis [17].
ε = 1 + A 0 A p 1 A 0 A p 2
Among these, A p is the peak-to-peak amplitude of the wave reflected from a metal plate placed on the ground during a pre-detection calibration procedure. A 0 represents the peak-to-peak amplitude of the wave reflected from the pavement surface layer, as measured by a 3D GPR unit, and ε is the dielectric constant of the surface layer. For validation, the dielectric constant calculated using the amplitude ratio method was compared against values obtained directly from core samples. Based on the two-way travel time (t) recorded by the GPR at each coring location and the actual measured thickness (H) of the corresponding core sample, the dielectric constant of the core was calculated using Equations (4) and (5).
H = t 2 c 2 ε x 2 2
ε = t c 2 H 2
During the compaction process, the air content within the mixture decreases, leading to a reduction in the proportion of low-dielectric-constant air. Simultaneously, the relative proportions of high-dielectric-constant components, such as asphalt and aggregates, increase. Consequently, the overall dielectric constant of the mixture rises. This characteristic can be leveraged to inversely estimate the degree of compaction of the mixture.
The accuracy of the calculated dielectric constant values was validated through field core sampling. One standard core sample was selected to represent the average dielectric constant, while four additional representative cores were extracted from its vicinity. The dielectric constants of these cores were determined through laboratory measurements. A calibration model for air void content calculation was established based on the measured air void content and the corresponding dielectric constant data from these five calibration cores. The specific calculation formula is presented below. By comparing the measured data with the radar detection results, this method significantly enhances the accuracy of air void content evaluation.
y = a e k ε x + b
where ε x is the dielectric constant measured by the 3D GPR surface reflection method, and a, k, and b are correction coefficients.
y = a x + b
where x is the dielectric constant measured by the 3D GPR surface reflection method, and a and b are correction coefficients.

2.4. Development of an Aerial-Ground Collaborative Non-Destructive Testing Framework

To achieve process control, an unmanned aerial vehicle (UAV) is first deployed for a rapid flight immediately after paving and prior to compaction. This flight captures the initial temperature distribution of the paved layer, assessing its uniformity and identifying areas at risk of excessive cooling. Based on the thermal map, roller operators can be directed to prioritize compaction in these cooler areas, enabling an intelligent and adaptive rolling strategy. Subsequently, a non-nuclear density gauge is used to immediately inspect suspected weak spots, providing rapid compaction data to verify compliance with specification requirements (94–97%). This data informs decisions on the necessity for additional rolling passes and facilitates targeted re-compaction inspection. Finally, a three-dimensional ground-penetrating radar (3D GPR) system is employed for a preliminary acceptance scan of the entire road section [18]. Operating at traffic speed, it generates a real-time dielectric constant distribution map. This allows construction managers to instantly identify areas of non-uniform compaction and direct rollers to perform supplementary compaction, achieving real-time feedback and dynamic control. All compaction quality data, integrated with Real-Time Kinematic (RTK) positioning coordinates, are synergistically validated to create a spatially referenced digital quality record. This archive provides a precise data foundation for future maintenance management. The whole process is shown in the Table 1.
This method effectively integrates the advantages of the three aforementioned technologies, enabling a comprehensive “point-line-area” data fusion and validation across multiple scales and throughout the entire construction process. It establishes a complete cognitive loop for understanding asphalt pavement compaction quality, ranging from the macroscopic to the microscopic level.
This synergistic system follows a unified workflow integrating aerial rapid full-scale screening, discrete validation of suspected targets, and ground-based accurate continuous diagnosis, with the corresponding integration logic and workflow detailed below. The basic flow chart is shown in Figure 4.

3. Field Experiments

3.1. Research Objective

This study selects the asphalt pavement surface layer in the section K158+638–K158+734 of a certain road in Shandong as the test object. The main technical indicators of the engineering materials for this road section are as follows:
The pavement of the test section utilized modified asphalt, with its technical properties evaluated based on the Chinese Standard Practice JTG E20-2011 [19]. Selected aggregates consisted of high-quality limestone. Tests performed in line with JTG F40-2004 [20] confirmed that all performance indices for both coarse and fine aggregates satisfied the regulatory requirements. The gradation composition and corresponding specifications for the AC-20 asphalt mixture are provided in Table 2.

3.2. Experimental Approach

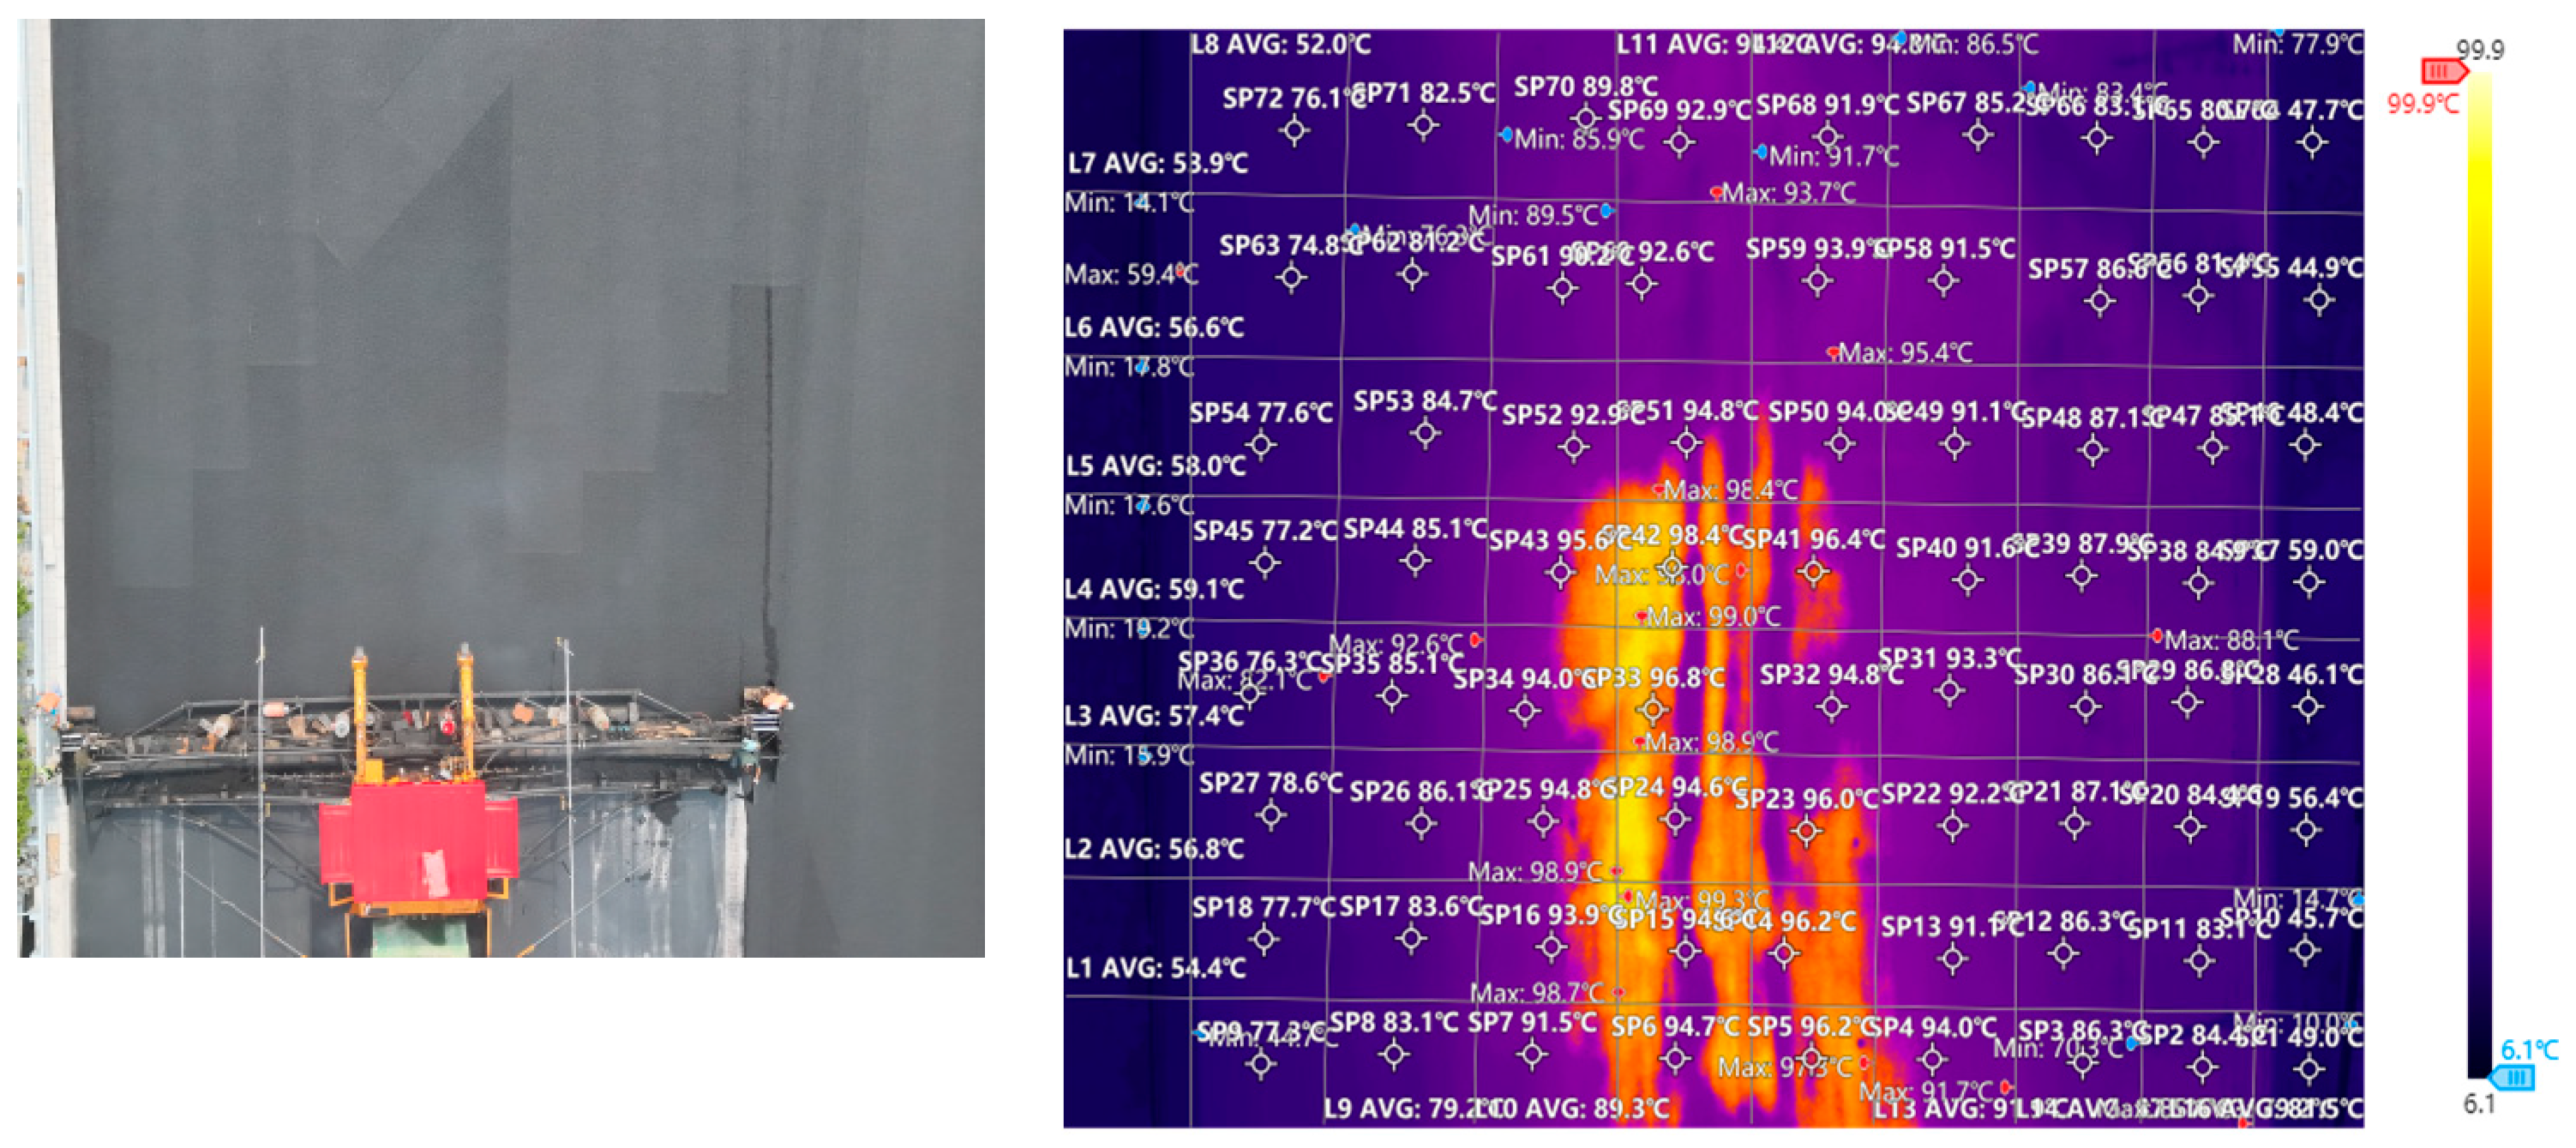
The real-time detection of the temperature field during asphalt pavement construction was conducted using a DJI M300 RTK UAV equipped with a Zenmuse H20T thermal infrared camera. As shown in Figure 5, the measurement altitude (1.5–3.0 m) and observation angle (30–90°) could be adjusted in real-time via the remote controller’s display. The system supported both single-point and area temperature measurement modes. A grid pattern for the infrared thermal images was established using straight measurement lines at 2 m × 2 m intervals. The captured infrared images were processed using the professional DJI Thermal Analysis Tool 3 software, which automatically generated inspection reports containing parameters such as file ID, inspection date, timestamp, temperature gradient (150–180 °C), material emissivity (0.90–0.95), and ambient temperature, ensuring correspondence with data from 3D ground-penetrating radar and non-nuclear density gauges. Based on field conditions, the accuracy of the temperature data (error < ±1.5 °C) was significantly improved by optimizing key parameters including measurement distance (2.0 ± 0.2 m), relative humidity (30–60%), emissivity (0.93), and reflected temperature (25 °C), thereby providing a reliable technical method for construction quality control.
A dry and flat area of 1.5 m × 0.75 m was selected on the asphalt pavement and divided into three equally sized circular test zones. The density of each zone was measured using a non-nuclear density gauge following the five-point method. Subsequently, core samples were extracted from the center of each circular zone. The height of each core was measured, and its laboratory density was calculated. The correction factor, necessary for accuracy calibration, was determined by taking the ratio of the core’s laboratory density to the corresponding reading from the non-nuclear density gauge [21]. See Figure 6.
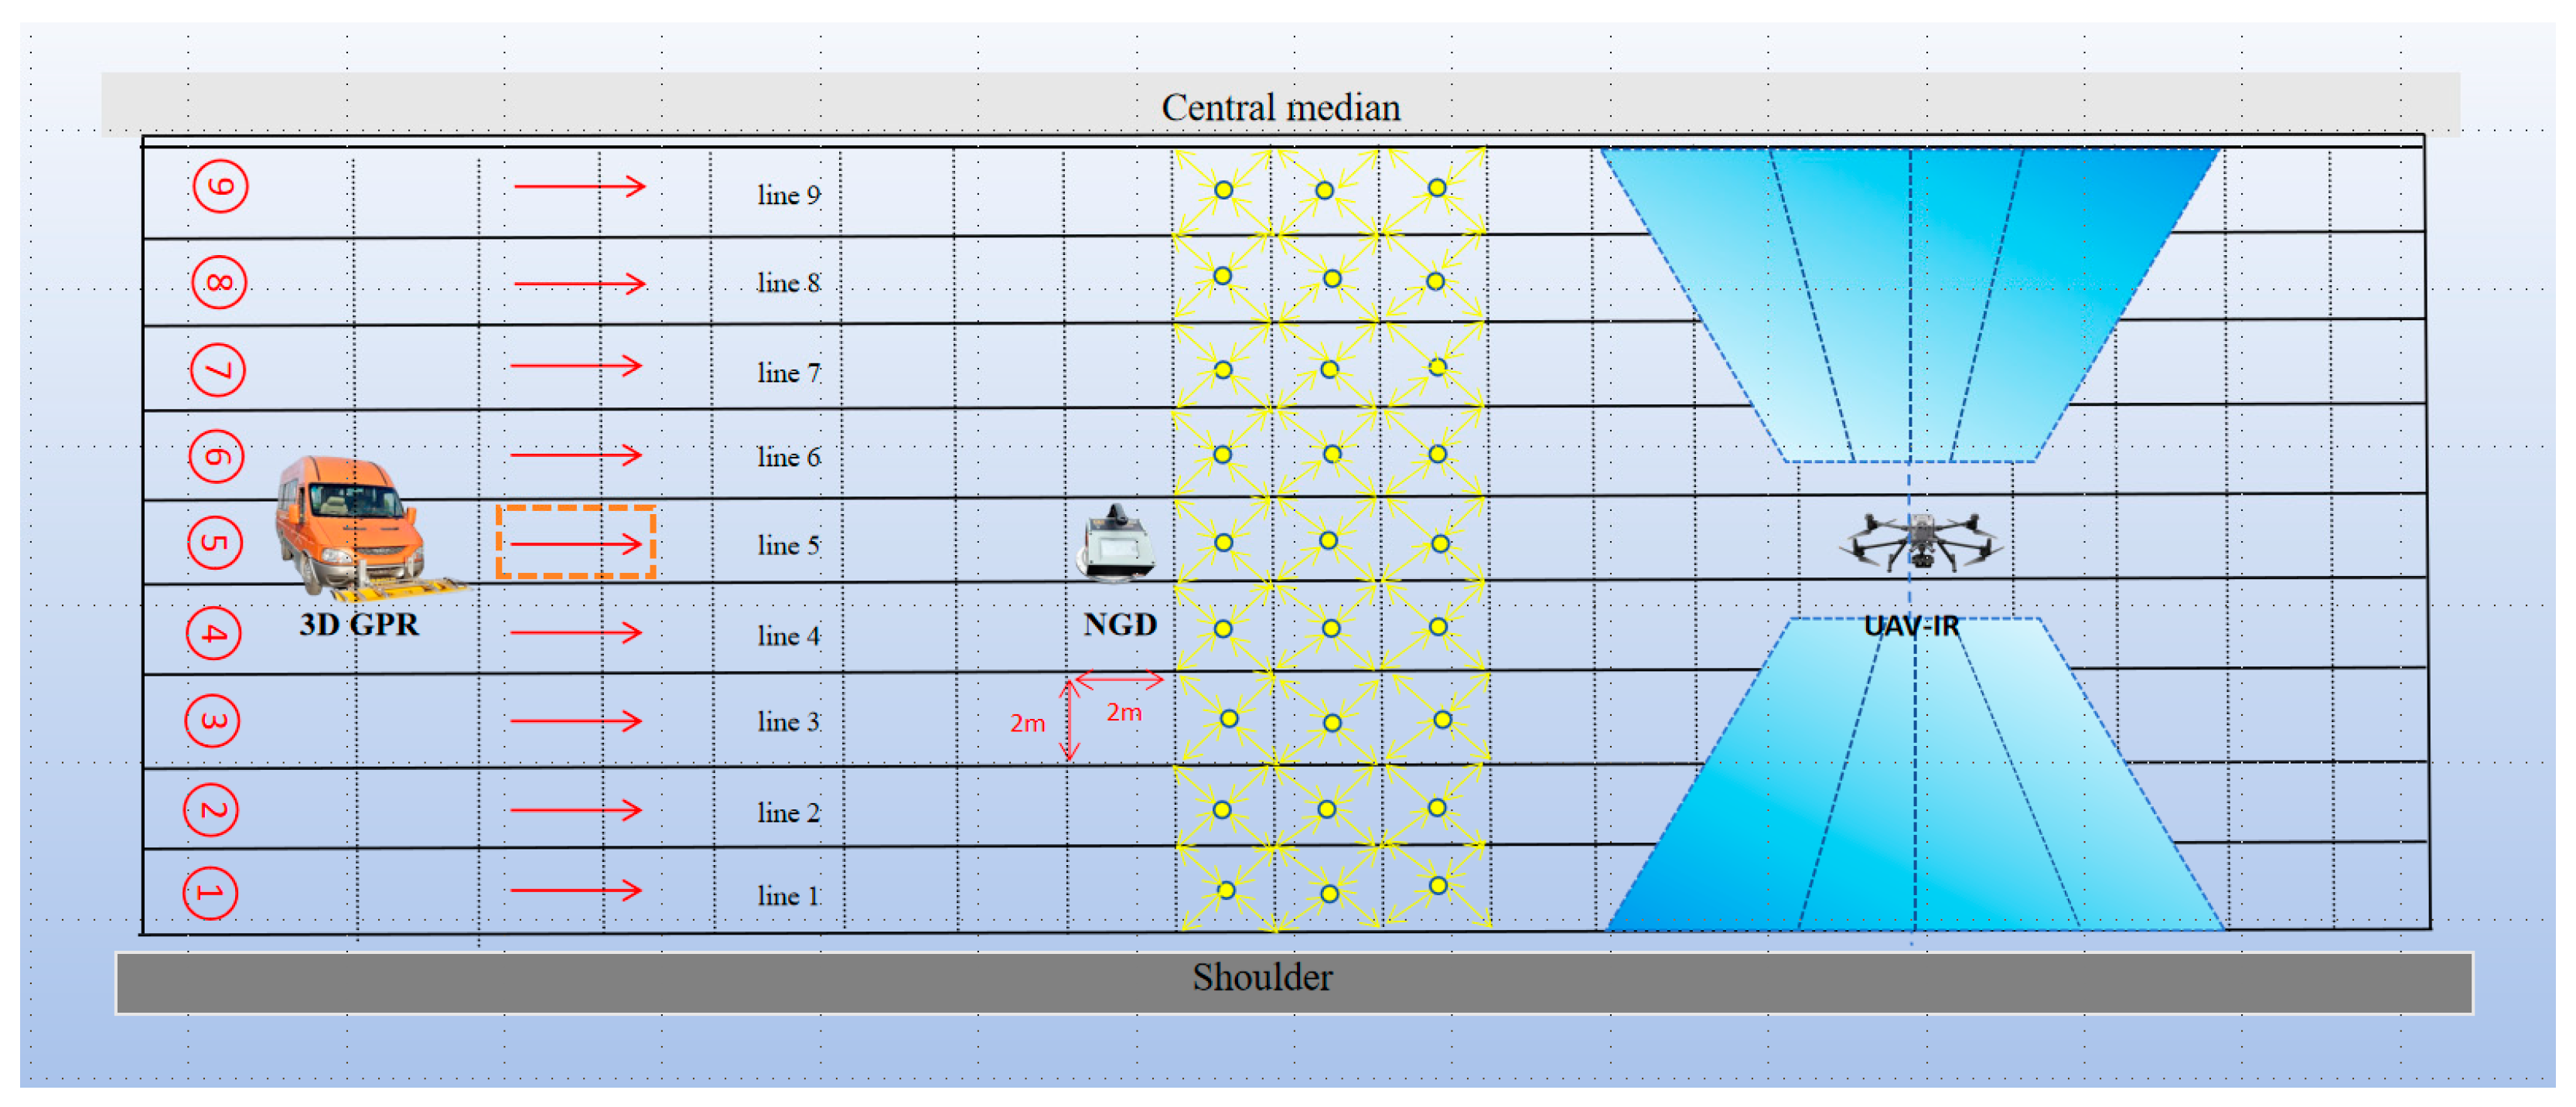
Regarding spatial resolution, the non-nuclear density gauge used in this study was configured with nine measurement lines across the detection width, yielding a total of nine data points along this direction. Along the detection length, 49 data points were collected, resulting in a total of 441 data points acquired over the entire area. A comparative analysis revealed that within a standard 2 m × 2 m unit, the 3D ground-penetrating radar (GPR) system acquired 364 data points, whereas the non-nuclear density gauge provided only one. This indicates that, on average, every 364 GPR data points correspond to a single density gauge measurement point. In the width direction, 26 GPR data points correspond to one measurement point from the density gauge. This substantial difference in data acquisition density underscores the technical advantage of 3D GPR in terms of spatial resolution, providing a critical basis for multi-scale assessment of pavement performance. See Figure 7.
The test section for this investigation measured 96 m in length and 16.5 m in width. To ensure complete coverage of the area, a total of 11 parallel survey lines, each 96 m long, were established based on the optimal detection width (1.5 m) of the 3D ground-penetrating radar (GPR). Data acquisition was conducted using simultaneous conventional detection and common midpoint mode, with a sampling interval set at 5 cm. Each survey simultaneously captured data from 21 channels, resulting in a total of 21,000 depth data points per acquisition. To comprehensively cover the test section and ensure data accuracy, the system acquired 364 data points within each standard 2 m × 2 m grid. The dielectric constant representative of each grid was determined by calculating the average of these 364 individual dielectric constant values.

4. Results

4.1. Investigating Temperature Uniformity in Asphalt Pavements

A comparative analysis of different temperature measurement methods was conducted at the asphalt pavement construction site. The recorded data are presented in Table 3. UAV-IR and NDG measurements were performed in rapid sequence, with a maximum time delay of 15 min after the final compaction pass to ensure data comparability under stable cooling conditions.
A comparative analysis revealed that the mercury thermometer readings were significantly lower, while the results from the other three measurement methods were generally consistent. This discrepancy can be primarily attributed to the fact that the mercury thermometer requires approximately five minutes to stabilize, and it is susceptible to significant random errors, necessitating multiple measurements to obtain a reliable average. However, frequent measurements not only impede construction efficiency but also introduce variability due to the rapid cooling of the asphalt mixture after paving, making it difficult to maintain consistent measurement conditions at the same location. Furthermore, the use of contact-based temperature measurement devices, such as the mercury thermometer, requires operators to work in close proximity to the freshly laid mat, posing potential safety hazards due to the subsequent roller operations. Comprehensive analysis demonstrates that UAV-based infrared thermal imaging offers distinct advantages, including targeted accuracy, intuitive data visualization, ease of data storage, and enhanced operational safety, making it more suitable for temperature monitoring during asphalt pavement construction [22]. The accuracy of the temperature data (error < ±1.5 °C) was validated against a calibrated handheld infrared thermometer (Fluke 62 Max+), which served as the reference for the actual pavement surface temperature. This validation was performed by comparing point measurements from the handheld device with temperature values extracted from the UAV thermal imagery at corresponding locations immediately after the UAV flyover. The demonstrated superiority of UAV-based infrared thermography represents a paradigm shift in pavement construction monitoring. While traditional contact thermometers introduce significant measurement delays incompatible with rapid asphalt cooling, the aerial method achieves comprehensive spatial coverage while maintaining validated accuracy (±1.5 °C). This technological transition addresses both methodological and safety concerns—eliminating personnel exposure to hazardous work zones while providing complete, real-time temperature documentation. Most significantly, the continuous thermal mapping enables proactive quality control by identifying localized anomalies that traditional spot measurements inevitably miss. This capability transforms quality assurance from statistical sampling to comprehensive evaluation, allowing for targeted corrective actions during the critical compaction window. The method establishes an objective, digital foundation for data-driven construction management and creates valuable historical records for lifecycle pavement performance analysis.
The measurement accuracy of four temperature detection methods for asphalt pavement—including an electronic thermometer gun, a mercury-in-glass thermometer, a UAV-based infrared thermal imaging system, and a handheld infrared thermal camera—is compared in Table 4. To investigate the influence of measurement distance on detection results, a 2 m × 2 m square test area (delineated with low-temperature markers) was set up on a freshly compacted asphalt pavement. Using a UAV equipped with an infrared thermal imager, gradient measurements were taken at 2 m intervals within an altitude range of 3–16 m. By analyzing the variation characteristics of temperature data at different altitudes, a quantitative relationship model between measurement accuracy and flight height was established. The experimental results indicate that as the measurement distance decreases, the thermal radiation energy received by the infrared device increases significantly (p < 0.01). When the altitude is below 5 m, the temperature measurement error can be controlled within ±1 °C. This study provides a basis for selecting optimal measurement parameters for the accurate monitoring of the temperature field during asphalt pavement construction.
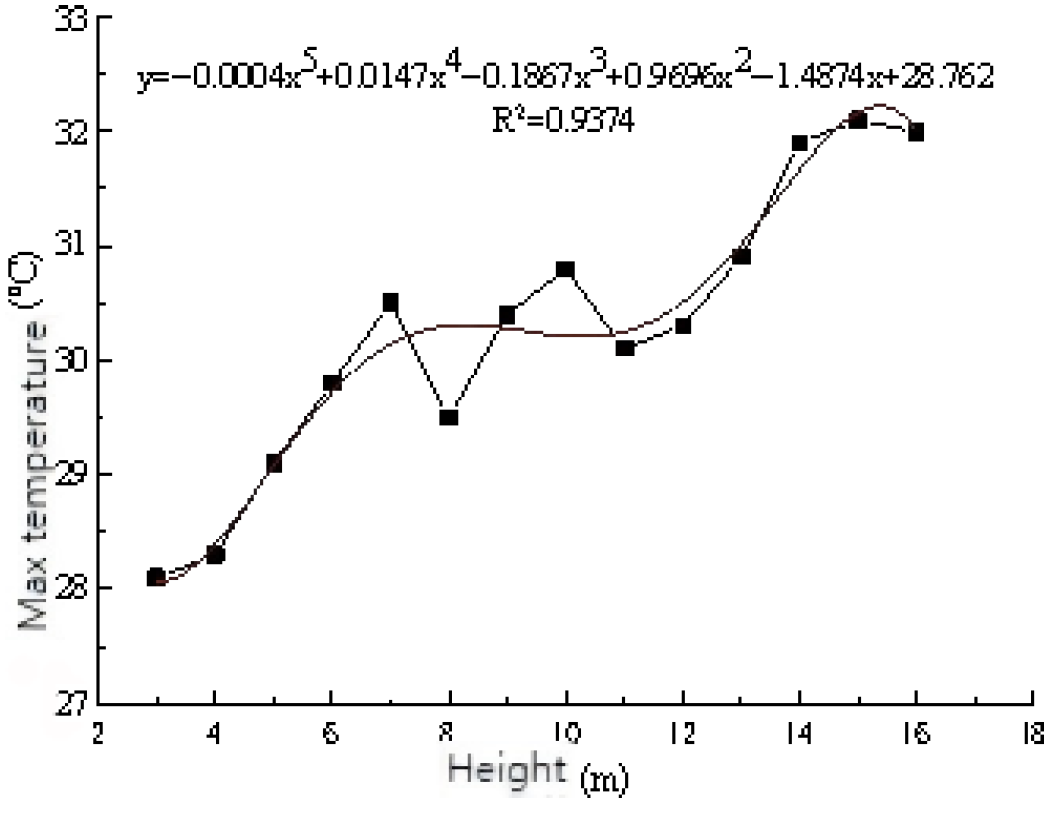
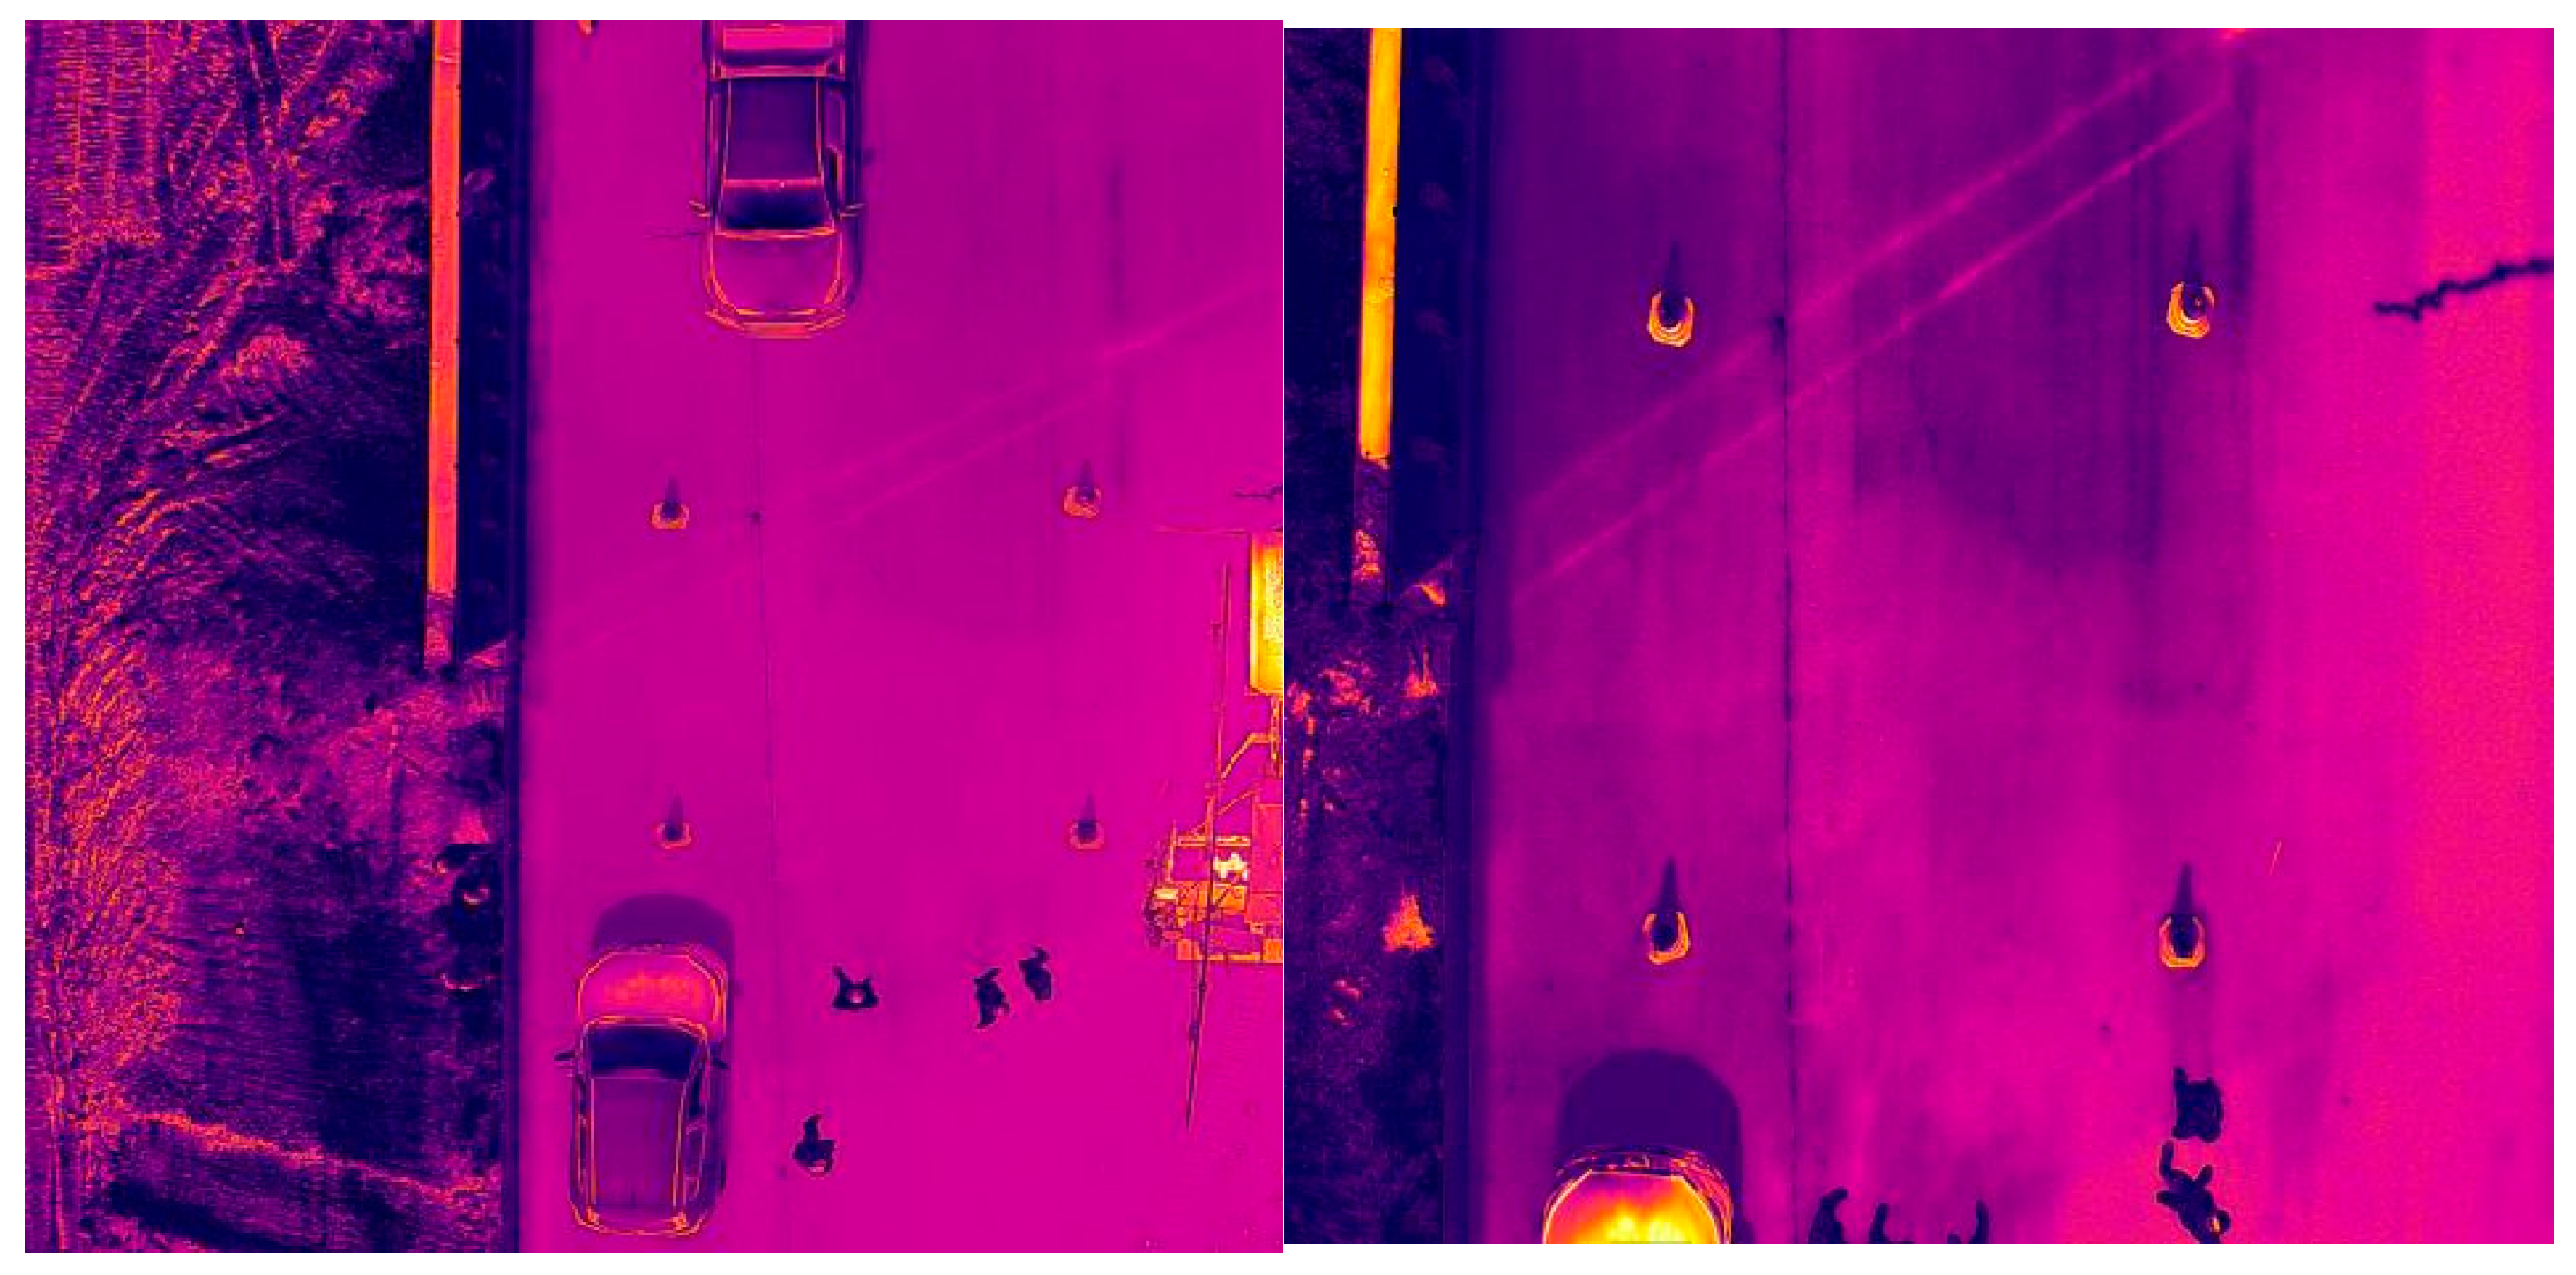
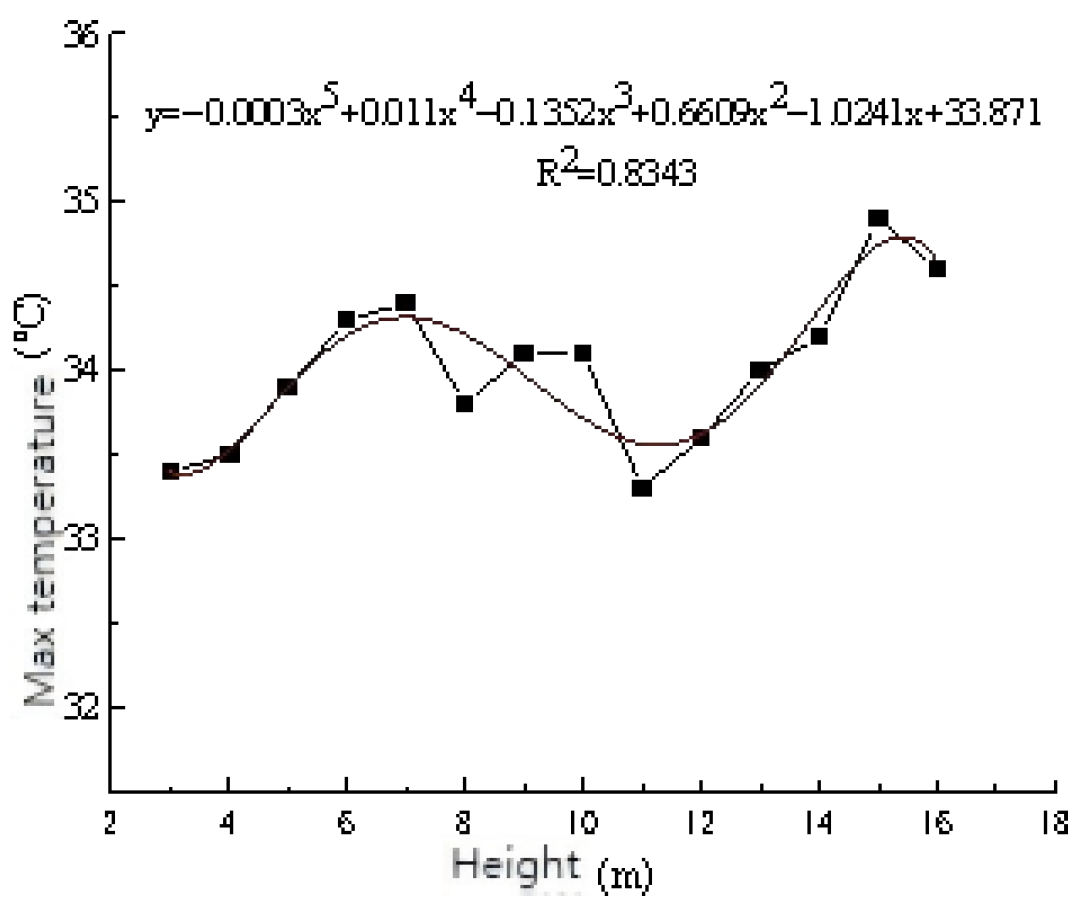
The temperature values measured at different altitudes were plotted as temperature distribution curves in Figure 8 and Figure 9, and each curve was fitted with a polynomial function, respectively. The field measurement is shown in Figure 10.
The systematic evaluation of measurement distance effects provides critical insights for optimizing UAV-based thermal monitoring protocols. The established inverse relationship between flight altitude and measurement accuracy underscores the importance of maintaining operational heights below 5 m to achieve engineering-grade precision (±1 °C). This empirical finding resolves a fundamental practical dilemma in aerial thermography—balancing coverage efficiency with data reliability. The quantitative models enable precise error compensation for scenarios requiring higher-altitude operations, significantly enhancing the method’s adaptability to complex construction environments. Furthermore, the polynomial fitting of temperature distribution curves demonstrates the robust spatial consistency of thermal data, validating its capability to capture meaningful temperature gradients rather than random noise. This study transforms UAV thermography from a qualitative inspection tool into a quantitatively reliable technique for pavement construction control, establishing a scientific basis for standardizing flight parameters in asphalt quality specifications.
a. Equation for the maximum temperature curve:
y   =   0.0002 · 5   +   0.0074 · 4     0.0834 · 3   +   0.3289 · 2     0.2178 x   +   34.694
b. Equation for the curve of minimum temperatures:
y   =   0.0004 · 5   +   0.0147 · 4     0.1867 · 3   +   0.9696 · 2     1.4874 x   +   28.762
c. Equation for the curve of average temperature:
y   =   0.003 · 5   +   0.011 · 4     0.1352 · 3   +   0.6609 · 2     1.0241 x   +   33.871
In the formula, y is the temperature value and x is the measurement height.
As shown in Figure 8, Figure 9 and Figure 11, Analysis of the temperature distribution curves reveals that the average temperature curve closely follows the trend of the maximum temperature curve. Although minor temperature fluctuations were observed across different measurement heights, the temperature difference between adjacent heights did not exceed 1 °C. The maximum temperature remained stable at approximately 35 °C, while the average temperature hovered around 34 °C. In contrast, the minimum temperature curve, despite exhibiting a similar trend, fluctuated around 30 °C.
As the measurement height increases, the inspected area expands, consequently amplifying the influence of environmental factors on the results. Since the measured temperatures are discrete point data, the maximum and minimum temperatures at different heights do not originate from the same physical location. Therefore, the average temperature provides a more objective representation of the actual temperature distribution characteristics.
Within the height range of 7 to 10 m, all temperature curves exhibited remarkable consistency, with measurement variations of less than 1 °C. Furthermore, the infrared temperature measurements showed excellent agreement with a point-and-shoot pyrometer reading of 34.2 °C. Therefore, this height interval is established as the standard measurement range, with 34 °C designated as the baseline value. As measurements obtained outside this range require temperature correction [23], this range was determined empirically as the optimal operational window. Within this altitude band, the temperature measurements demonstrated high stability (variation < 1 °C) and showed excellent agreement with ground-truth measurements from the handheld infrared thermometer (34.2 °C). Altitudes below this range risk operational safety and reduced coverage, while higher altitudes introduce greater environmental interference and measurement uncertainty.
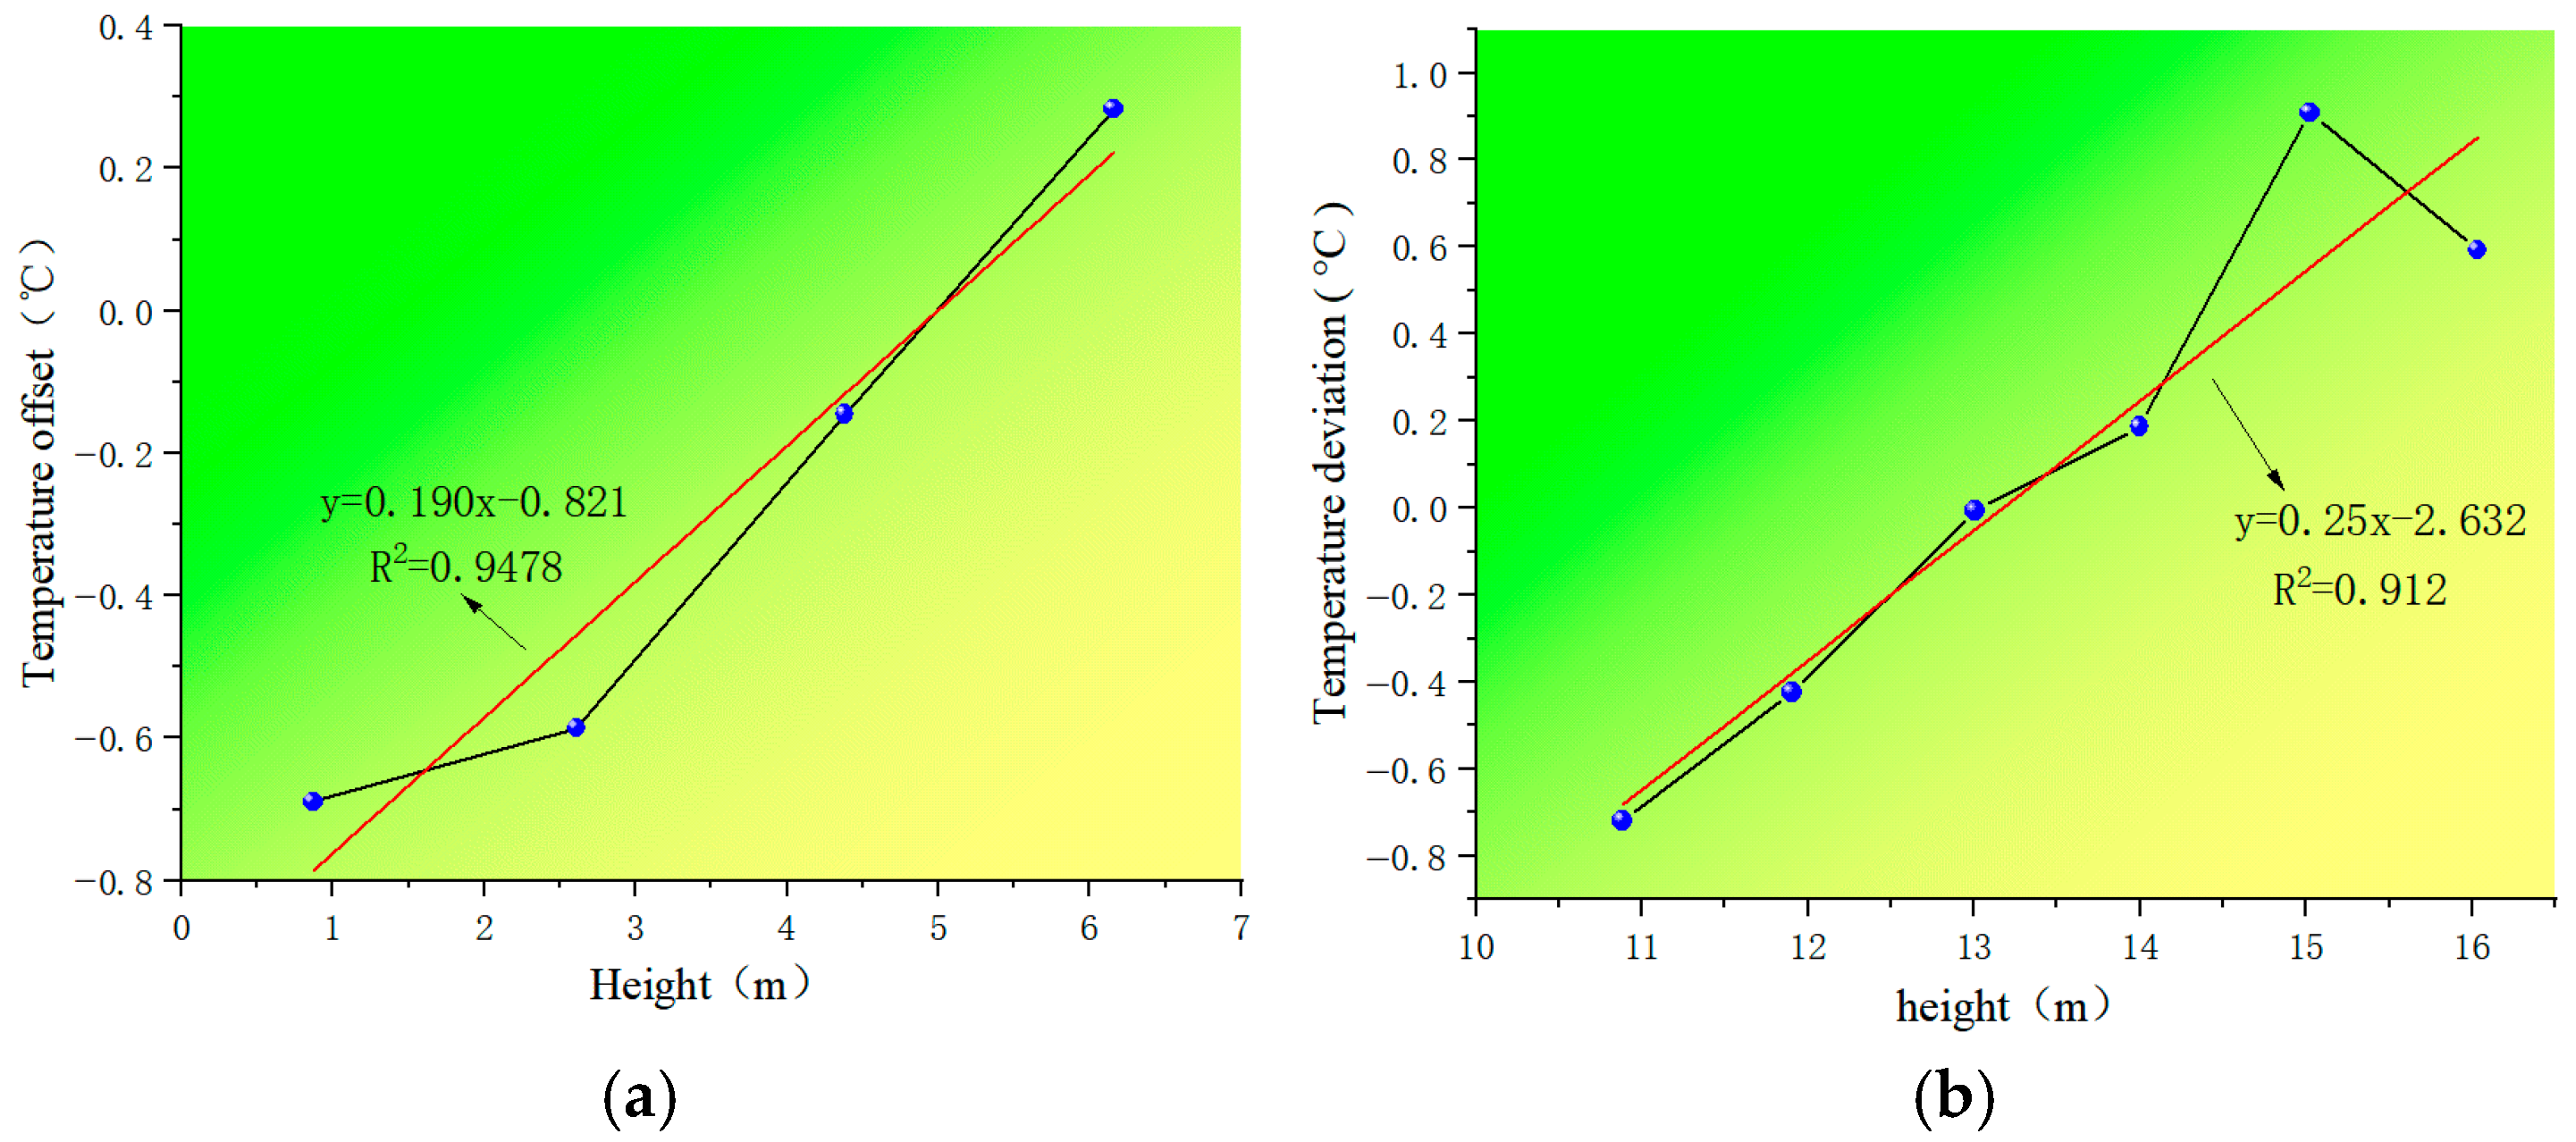
Based on the analysis of the average temperature data in Table 5 and the corresponding fitted curve, the data measured within the height intervals of 3–6 m and 10–16 m necessitate correction. The specific correction values are provided in Table 6.
Based on the data in Table 3, Table 4, Table 5 and Table 6, the deviation curves for the average temperatures at 3–6 m and 11–16 m are plotted in Figure 12. The formula for the average temperature deviation is as follows:
y   =   0.190 x     0.821   ( 3     x     7 )
y = 0.25 x     2.632   ( 11     x     17 )  
where y is the temperature deviation value and x is the measurement height.
Based on the two formulas mentioned above, the average temperature deviation can be corrected. Let Q1 be the corrected true temperature value and Q2 be the temperature value measured by the UAV infrared thermal imaging system. The following relationship can be established:
Q 1   =   Q 2     y
The corrected average temperature values calculated using Equation (13) are presented in Table 6.
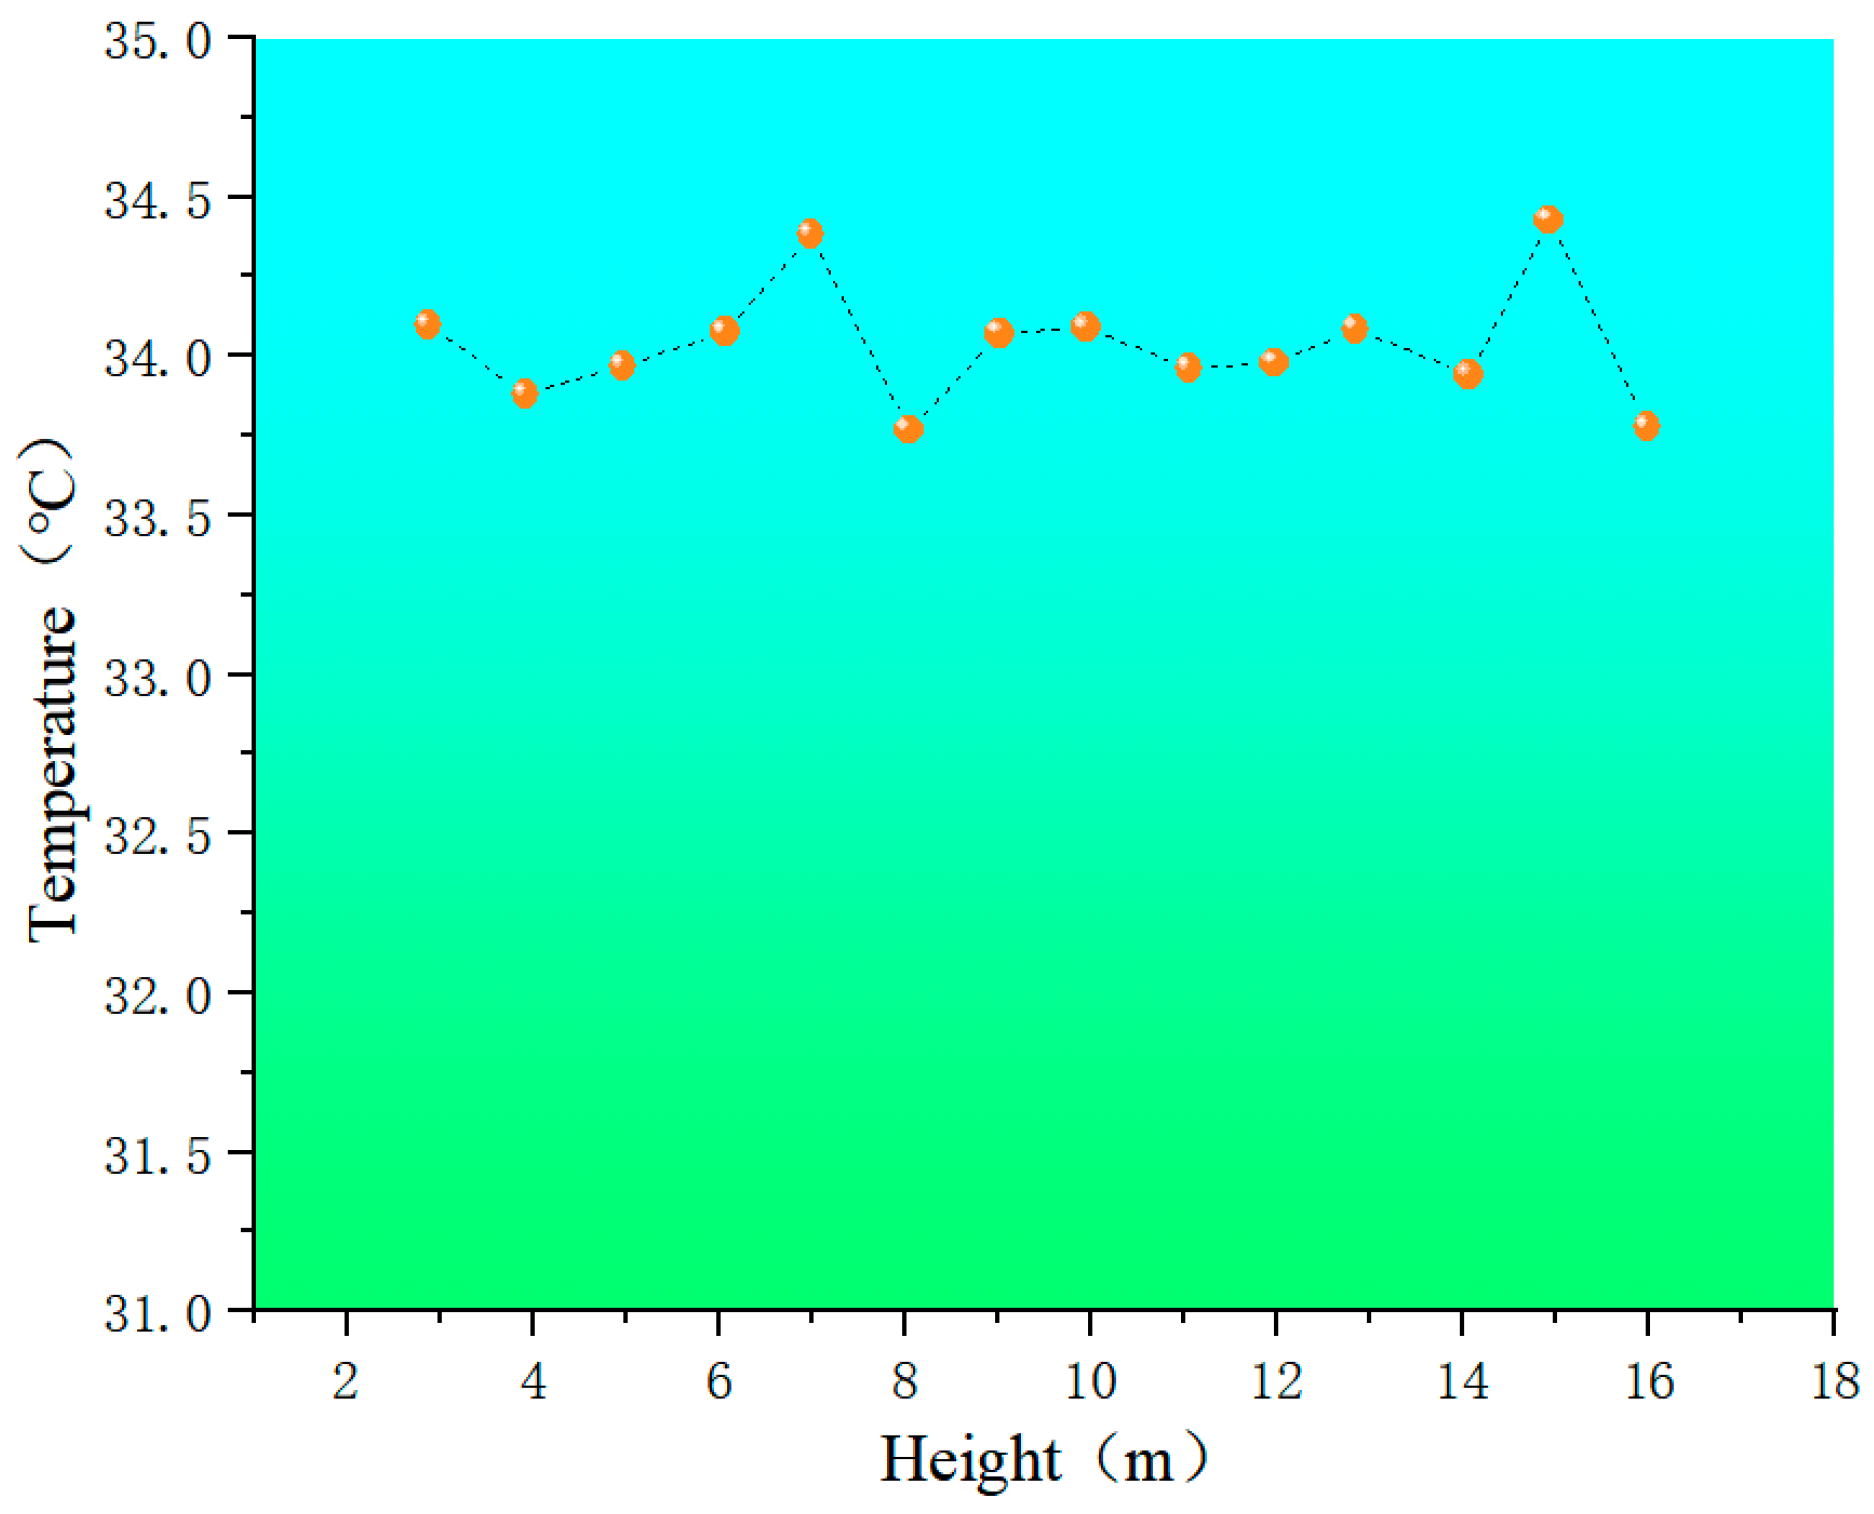
Based on the data in Table 6, the corrected average temperature profile is illustrated in Figure 13. The results demonstrate that the corrected values stabilize consistently near 34 °C, thereby validating the reliability of the proposed methodology across varying measurement heights.
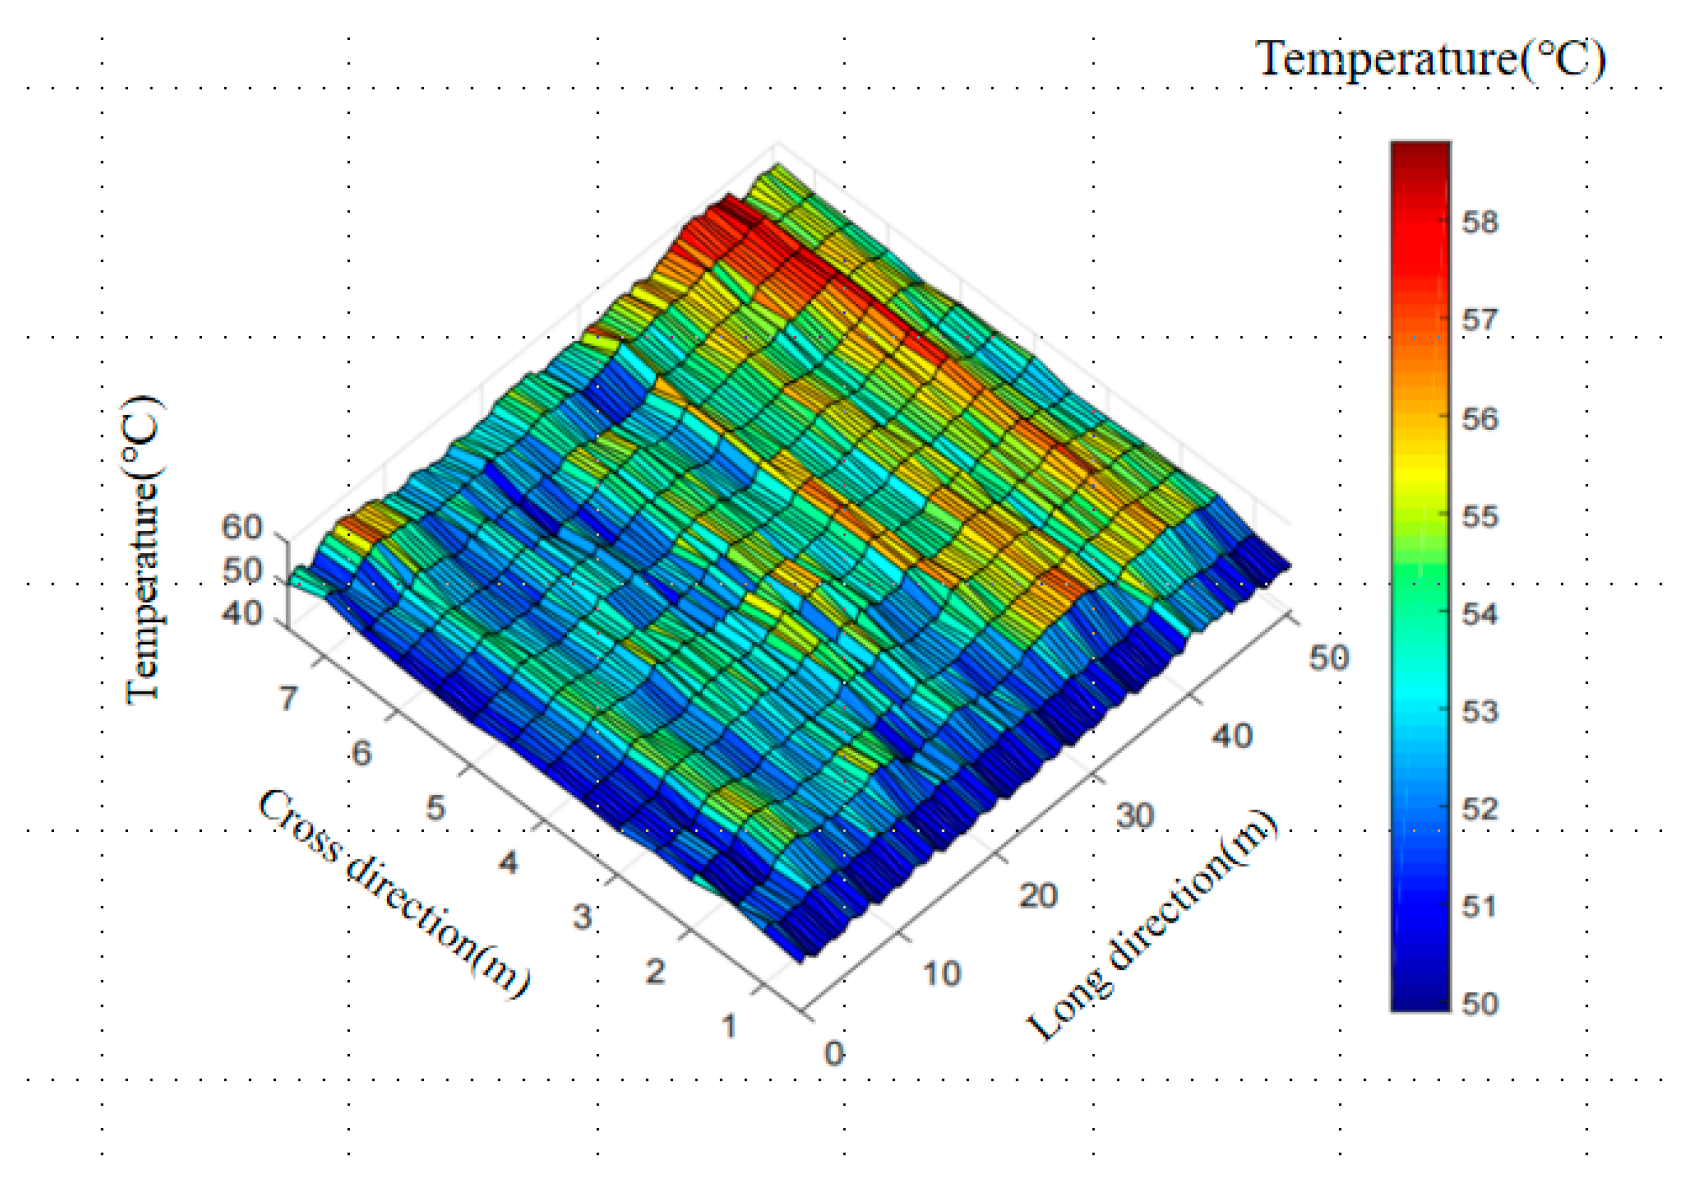
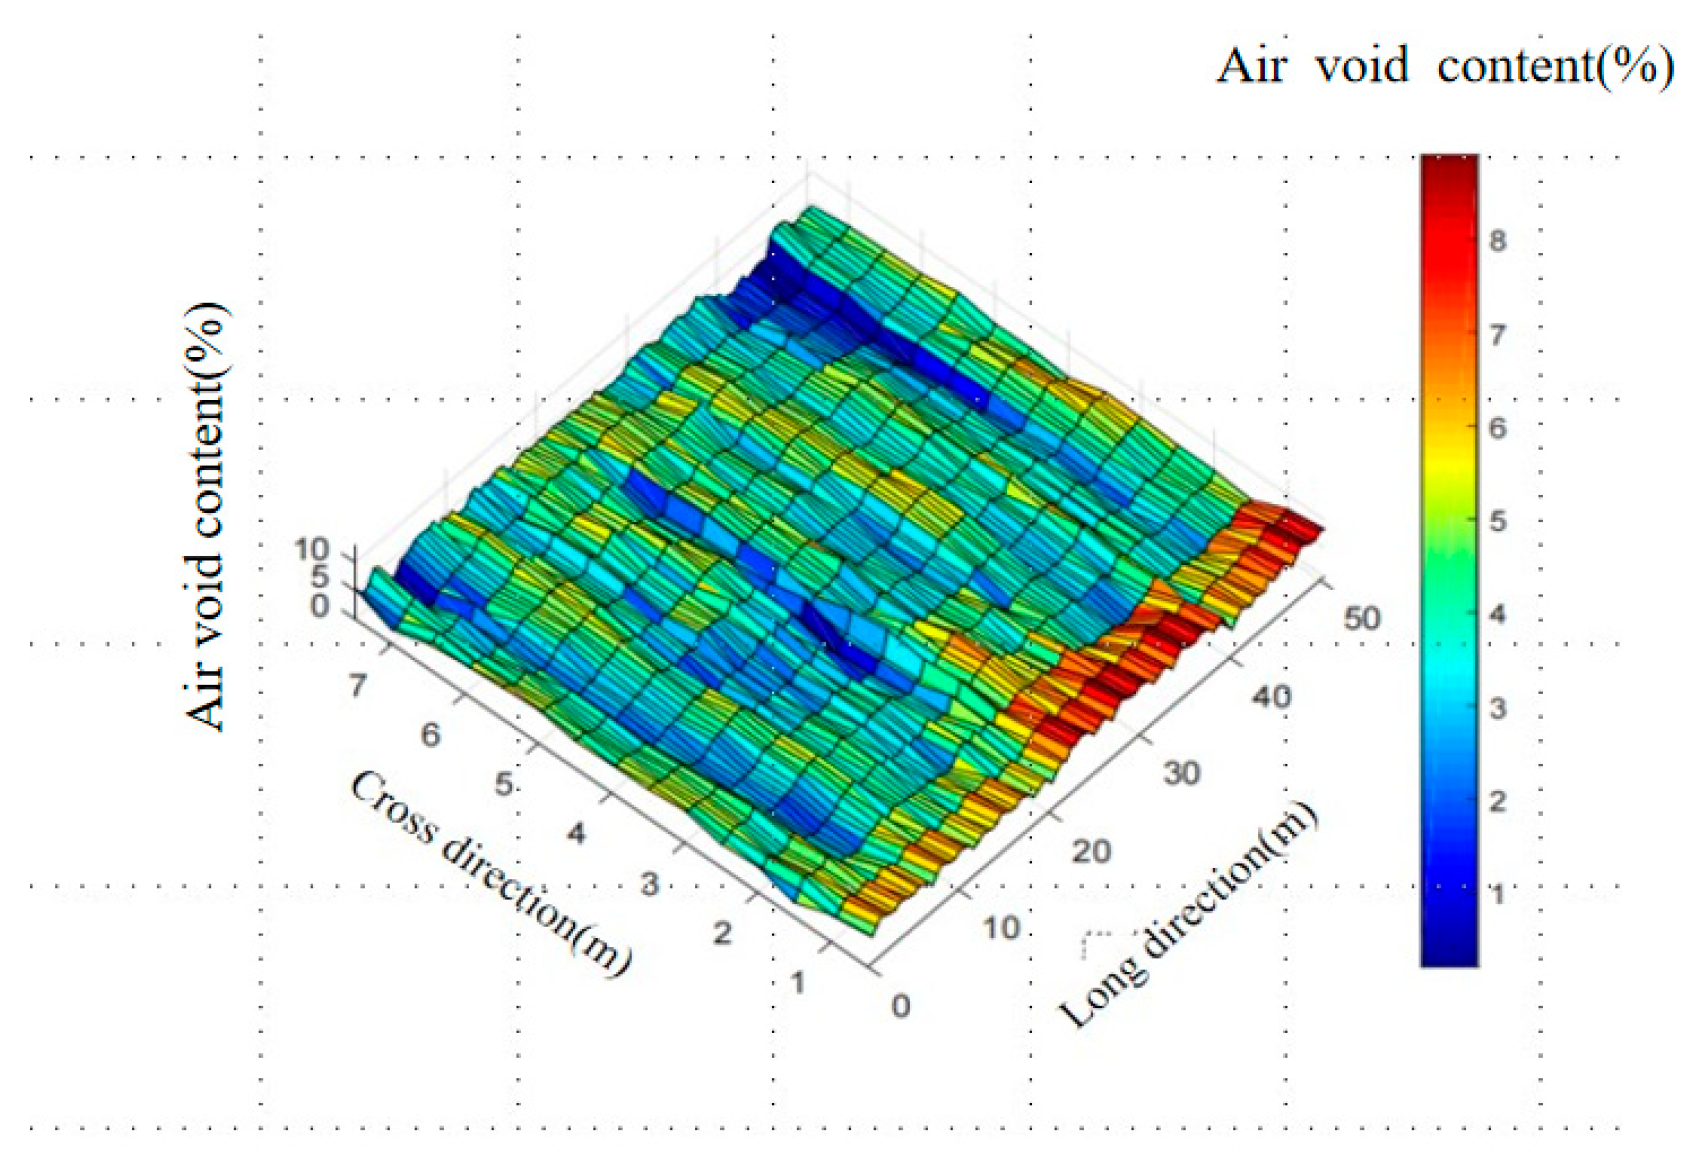
This investigation focused on a newly paved asphalt surface layer within a 50 m × 7.5 m compaction area. Unmanned Aerial Vehicle (UAV) infrared thermal imaging and a non-nuclear density gauge were utilized to simultaneously acquire temperature and air void distribution data. The three-dimensional distribution characteristics, presented in Figure 14 and Figure 15, reveal considerable longitudinal temperature variability, indicative of significant construction segregation. Analysis further identified a negative correlation between temperature differential and air void differential, implying that the rate of air void increase diminishes with rising temperature [24].
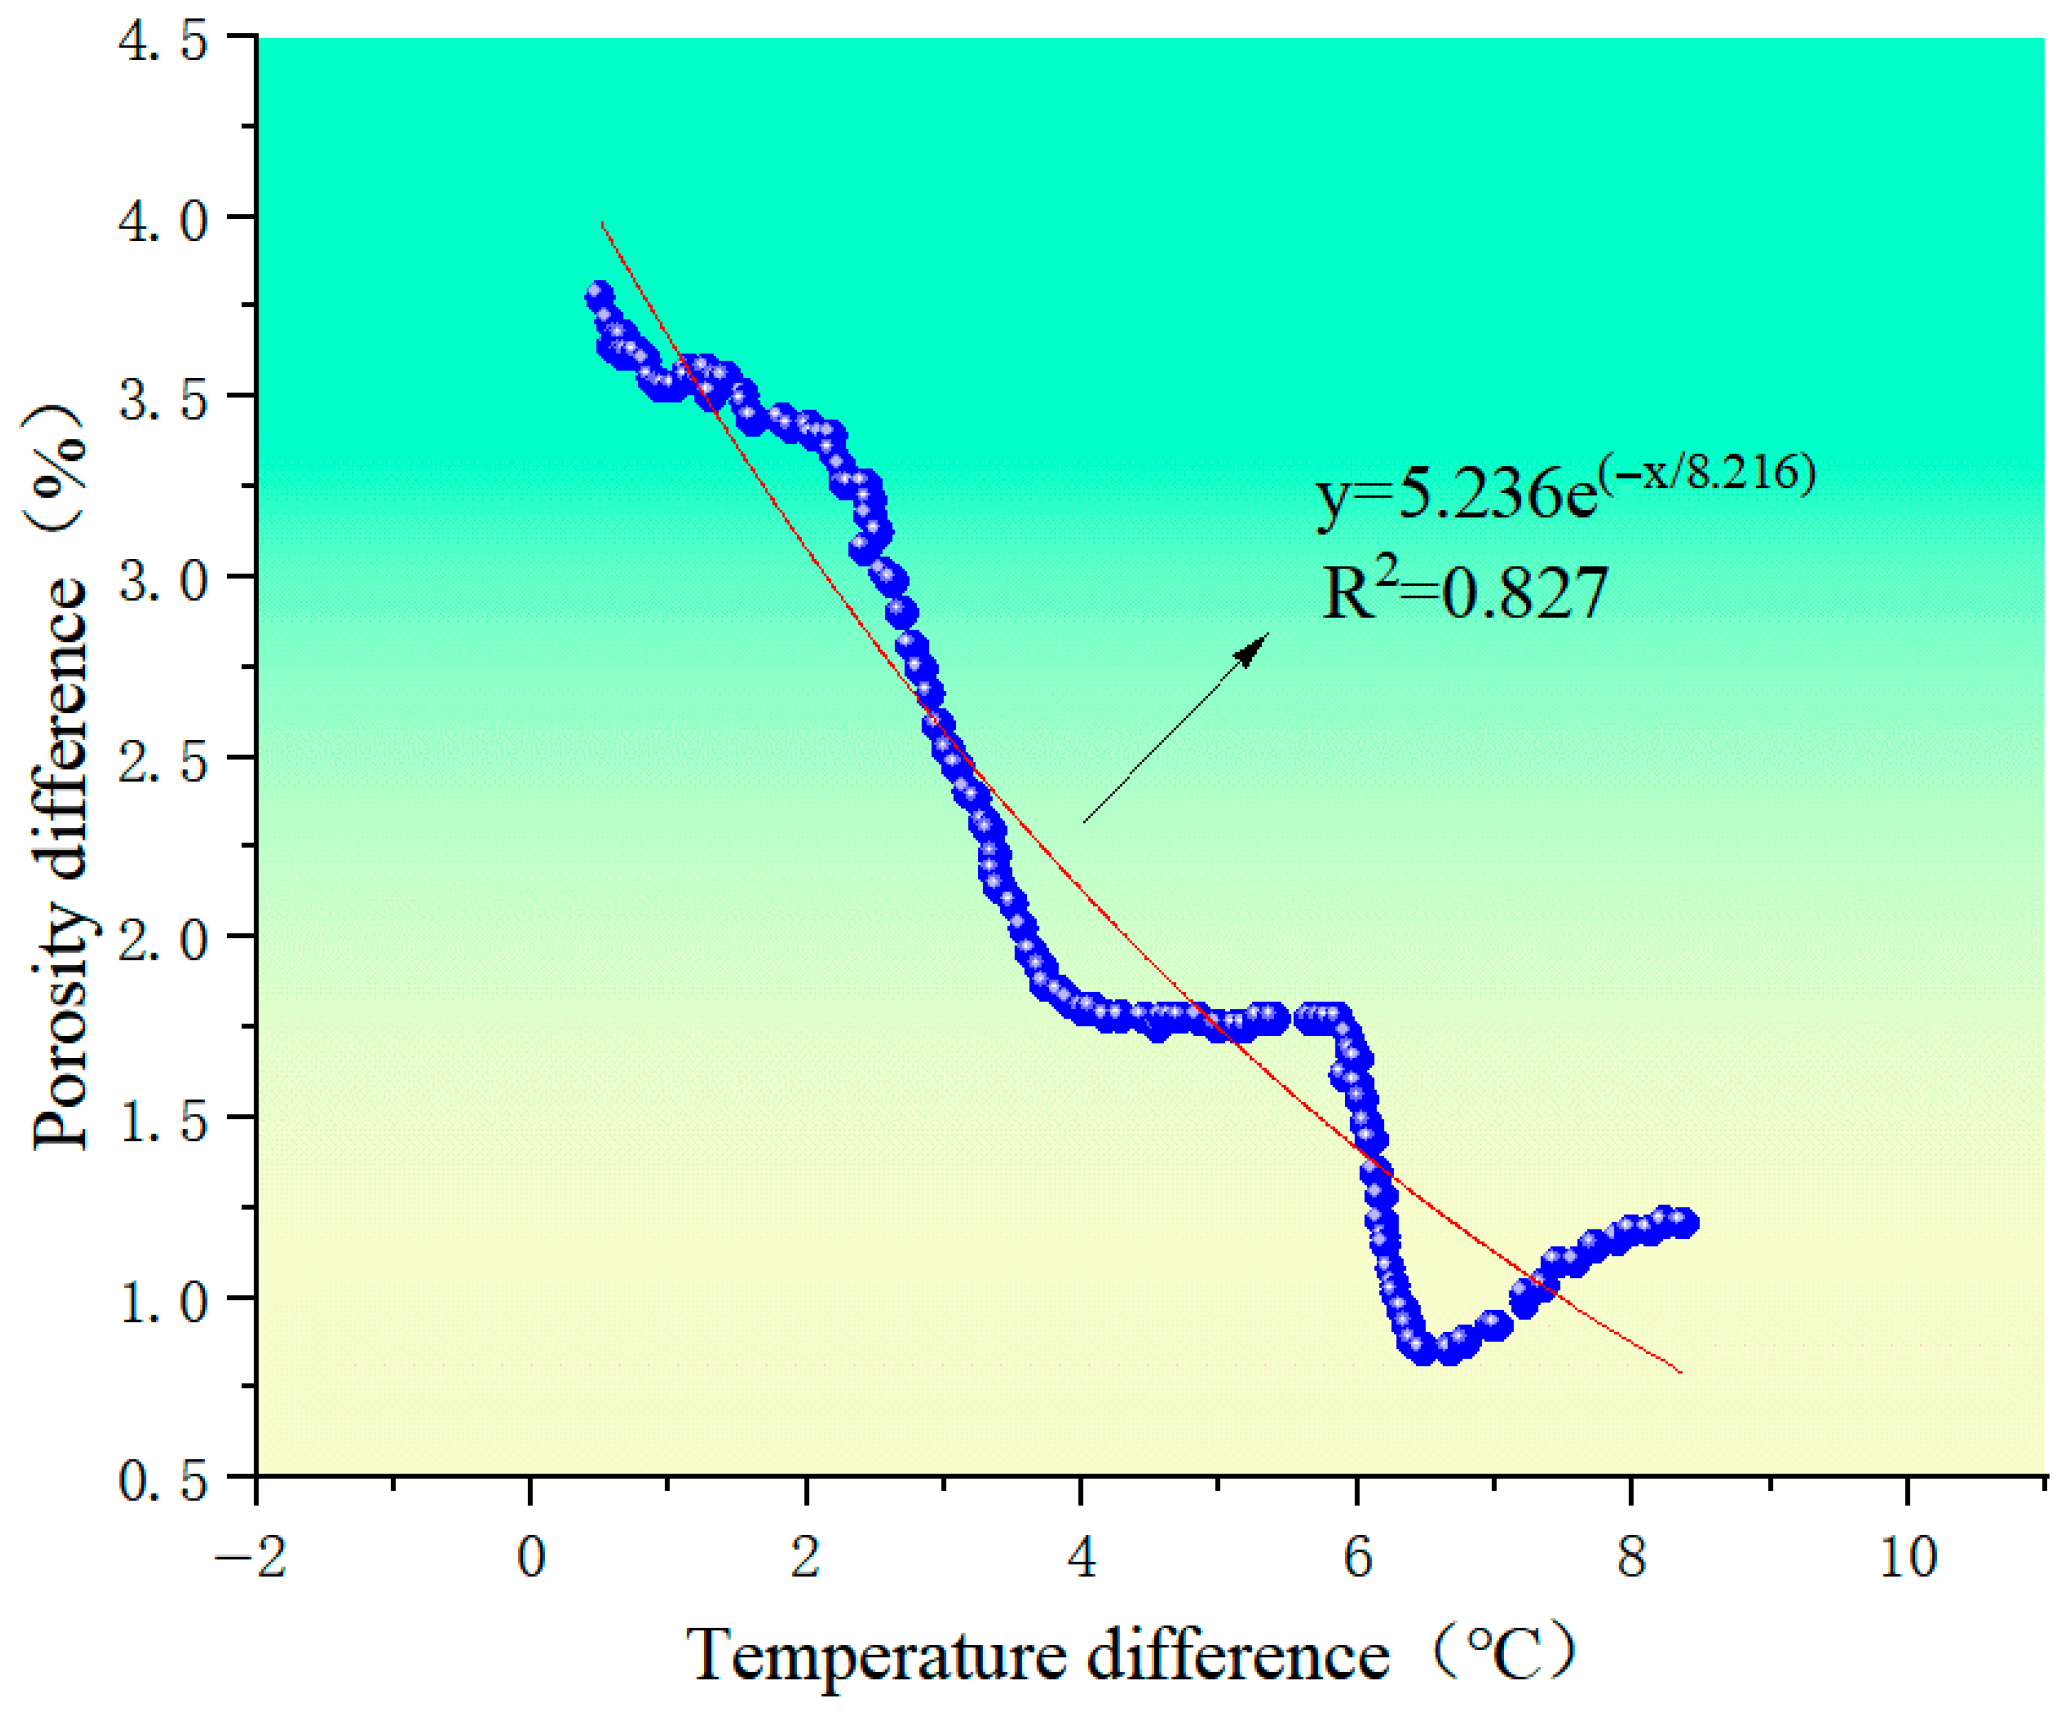
The relationship curve between the measured deviations from the mean values was plotted (Figure 16), exhibiting a strong correlation between temperature difference and air void difference, with a coefficient of determination (R2) of 0.827. Consequently, an evaluation criterion for temperature segregation based on air void variation (Table 7) and a predictive model ( y = 5.236 e ( x / 8.216 ) ) were developed. These findings provide a quantitative foundation for enhancing construction quality control.
This study established an evaluation criterion specifically for AC-20 asphalt mixture. Compared to the NCAT temperature segregation standard, the proposed criterion features a narrower acceptable temperature range and accounts for more gradual air void fluctuations, which align with the typical temperature variations observed during AC-20 construction. This method is well-suited for assessing compaction quality and construction uniformity for this specific mixture [25].

4.2. Dielectric Constant Value Method of Asphalt Pavement

As shown in Table 8. Comparative experimental results indicate that the measurements from the non-nuclear density gauge exhibit good agreement with the densities obtained from the core-drilling method (relative error < 3%). Moreover, the non-nuclear density gauge employs a non-destructive testing technique, which avoids the damage to the pavement structure inherent in the traditional coring approach. Furthermore, the device is operationally simple, requiring only a single operator, and offers high detection efficiency with a measurement time of less than 30 s per point, making it particularly suitable for large-scale engineering applications. More importantly, the non-nuclear density gauge enables continuous full-profile pavement detection, allowing for the rapid acquisition of spatially representative density distribution data [26].
The dielectric constant of the asphalt mixture was calculated using the amplitude total reflection method. The results for the dielectric constant at the coring locations are presented in Table 9. This method demonstrated a significant correlation (R2 > 0.95) with the measurements obtained from the traditional coring method. Compared to the coring method, the total reflection method enables non-destructive and rapid detection of the pavement dielectric constant, increasing detection efficiency by over 90%. Furthermore, it provides 100% continuous coverage of dielectric constant data, overcoming the spatial limitations inherent in discrete sampling. A conversion model established based on 30 sets of comparative test data indicated a stable linear relationship between the dielectric constants measured by the two methods (slope = 1.02, intercept = 0.03). Therefore, the adoption of the total reflection method not only ensures measurement accuracy but also effectively prevents the structural damage to pavement caused by the traditional method, offering a more efficient and reliable technique for asphalt pavement quality evaluation.
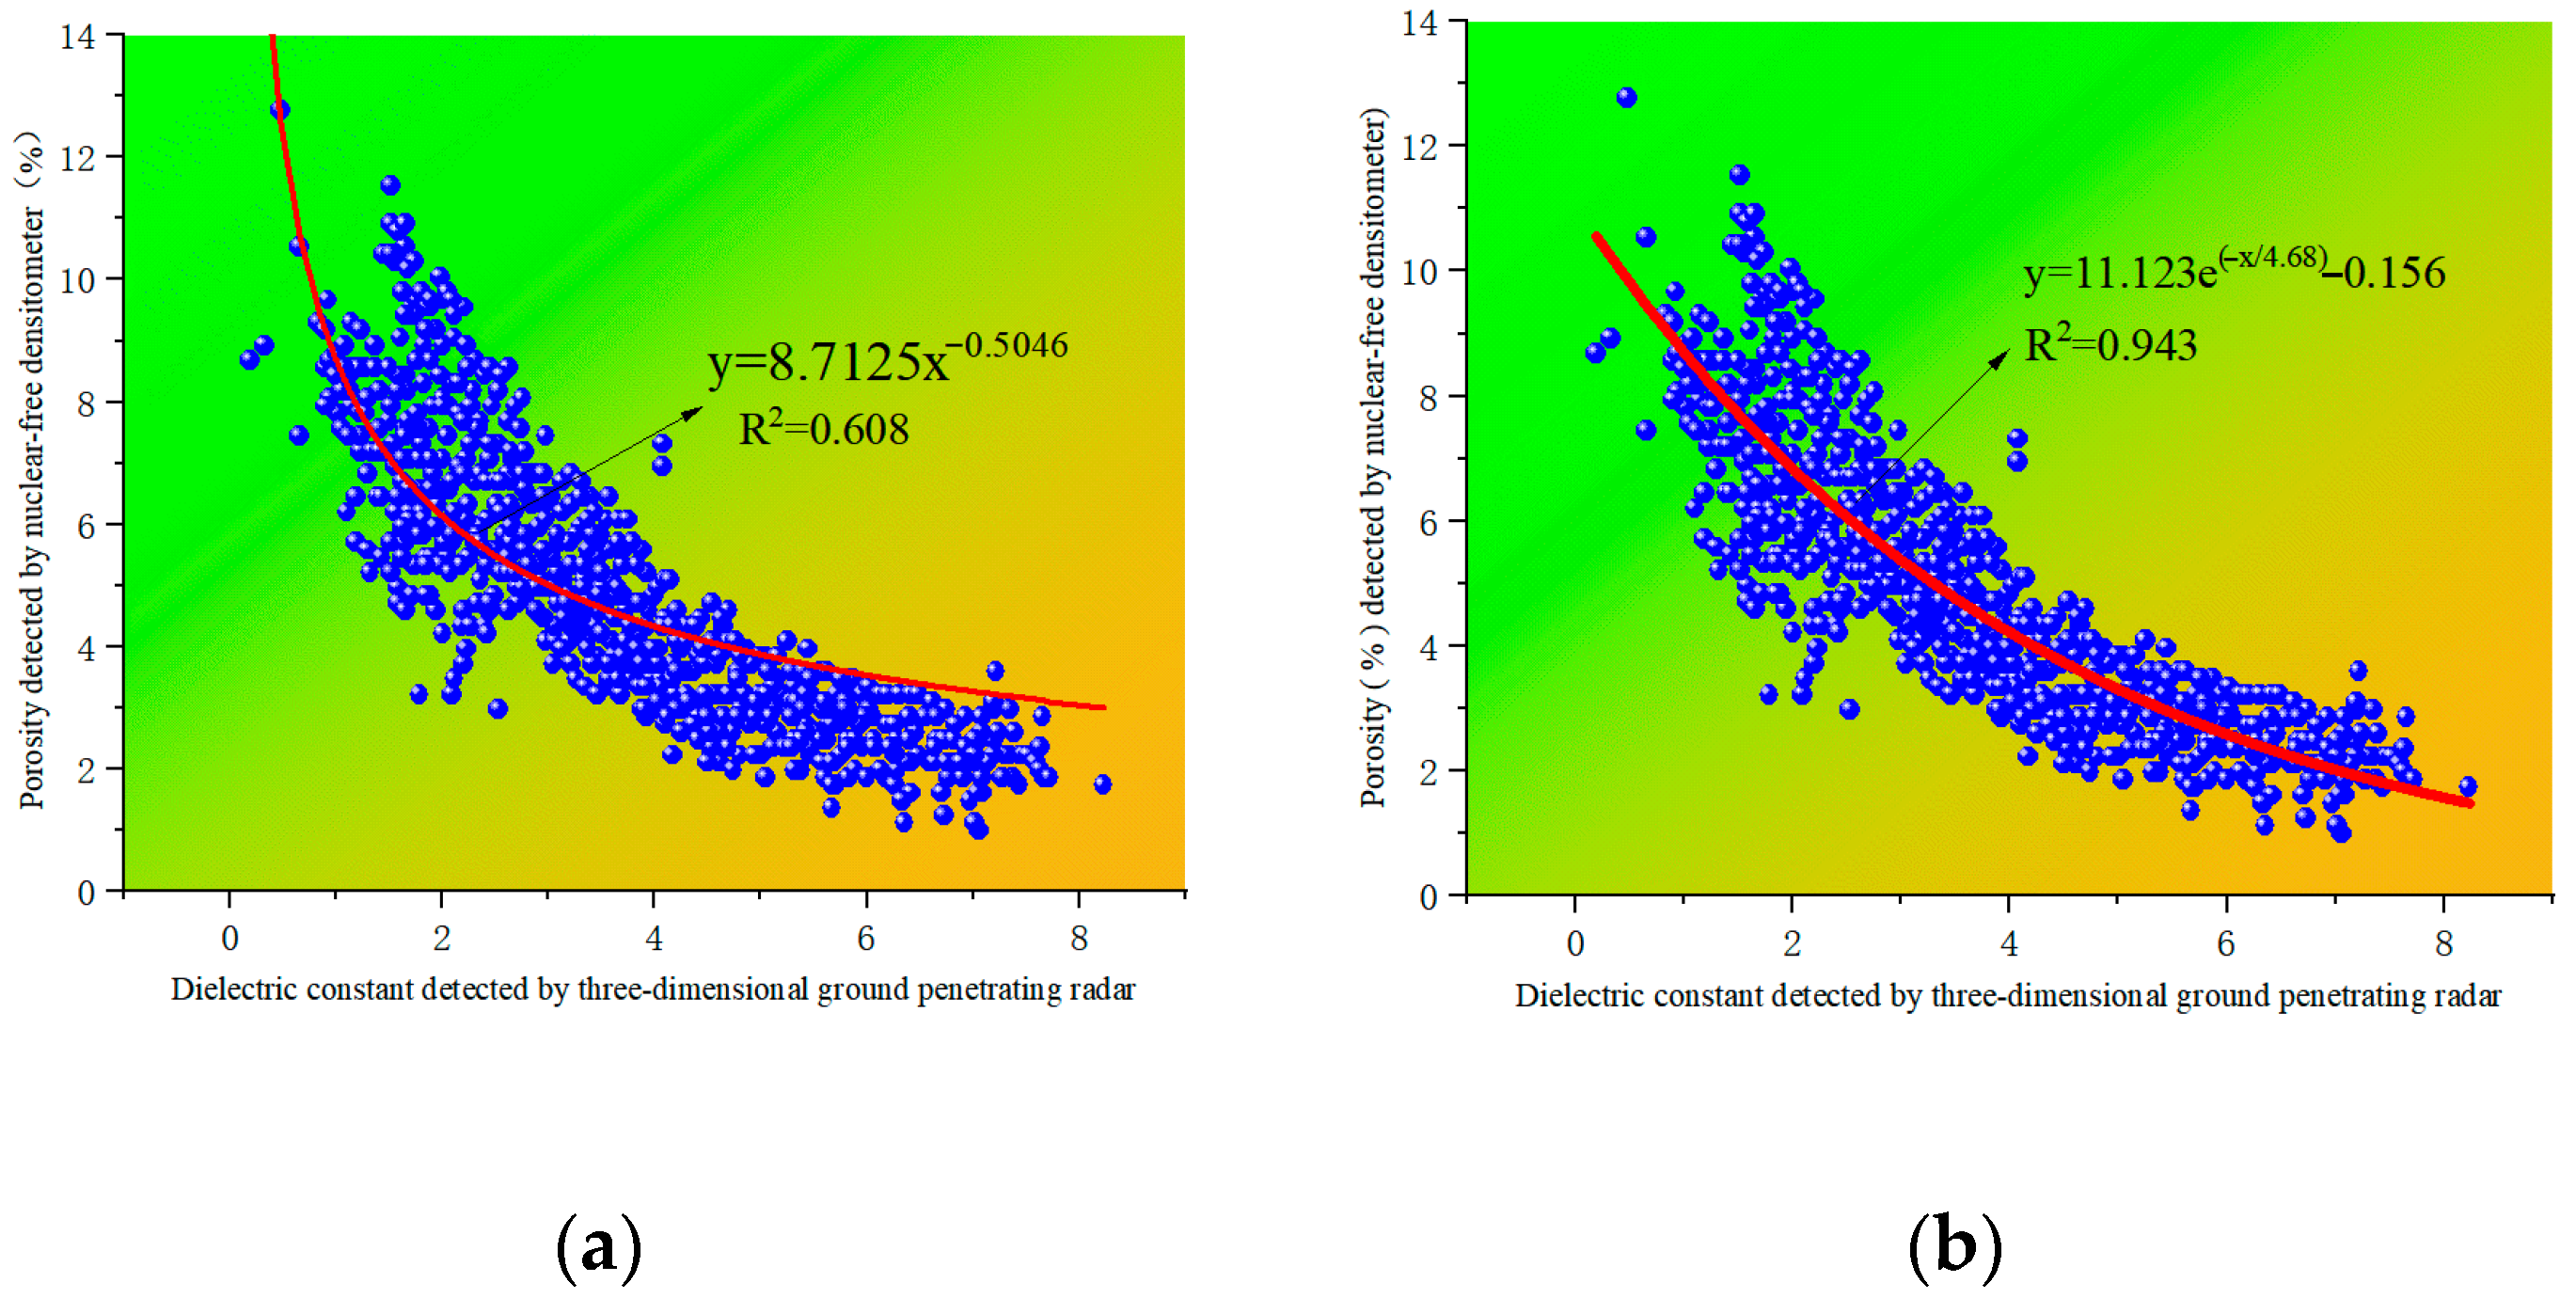
As shown in Figure 17, exponential and linear fitting were applied to the dielectric constant and air void content data, respectively. The results indicate a significant correlation between the dielectric constant measured by the 3D ground-penetrating radar (GPR) and the air void content detected by the non-nuclear density gauge, with the strength of the correlation increasing with the number of data points. A systematic analysis of modeling performance under different sampling densities revealed that when utilizing data from all survey traces (including measurement points in both the transverse and longitudinal directions), the correlation between the 3D GPR dielectric constant and the air void content was strongest. The exponential correlation ( R 2 = 0.943 ) was significantly greater than the linear correlation ( R 2 = 0.708 ). Based on this finding, an exponential empirical formula was established: y = 11.123 e ( x / 4.68 ) 0.156 . The significance of this model was confirmed by an F-test ( F   =   185.6 , p   =   2.3   ×   10 15 ). Modeling with the full dataset improved prediction accuracy by approximately 12.5% compared to using partial sampling, demonstrating the necessity of comprehensive data collection for ensuring model reliability. This research establishes a scientific foundation for transforming pavement quality control from discrete sampling to continuous assessment, enabling more effective construction monitoring and quality assurance.
4.3. Assessment of Unit Thickness Uniformity

As shown in Figure 18. Based on 3D ground-penetrating radar data, the thickness distribution of the asphalt surface layer was determined through wave velocity inversion and two-way travel time calculation, with visualization achieved using a thickness uniformity cloud map for evaluation. The results indicate that the average thickness of the surface layer in this section is 35.02 cm, generally meeting the design requirements. However, relatively thin areas account for 11% of the total, exhibiting a distinct spatial pattern—concentrated in the emergency lane and the inner fast lane. This non-random distribution suggests that the thickness variation is primarily attributable to non-uniform factors during construction. Specifically, insufficient thickness in the emergency lane can be attributed to lower compaction at the edge during paving, accelerated cooling of the asphalt mixture, and inadequate formwork support, resulting in reduced paving thickness and poor compaction uniformity in this area. In the fast lane, fluctuations in paver speed, material segregation, and improper operation during repeated compaction led to uneven distribution of the mixture and localized over-compaction or under-compaction, thereby inducing structural thickness variations. Furthermore, inadequate treatment of construction joints and insufficient control of base course flatness may have exacerbated the spatial variability of thickness [27].

5. Field Validation

A Multi-Dimensional Quality Evaluation Method for Through-Process Asphalt Pavement Construction Using Air-Ground Integrated Detection

Collaborative detection was performed on the K158+678–K158+686 section. By integrating the advantages of the three technologies, a comprehensive “point-line-area” data fusion and validation system is achieved, enabling multi-scale, full-process analysis. This system establishes a complete cognitive loop for asphalt pavement compaction quality, spanning from macro-to micro-level understanding. With a core logic of “macro-scale screening, precise localization, micro-scale verification, and data fusion,” the framework constructs a multi-level, whole-process, non-destructive closed-loop workflow, as detailed in the following steps:
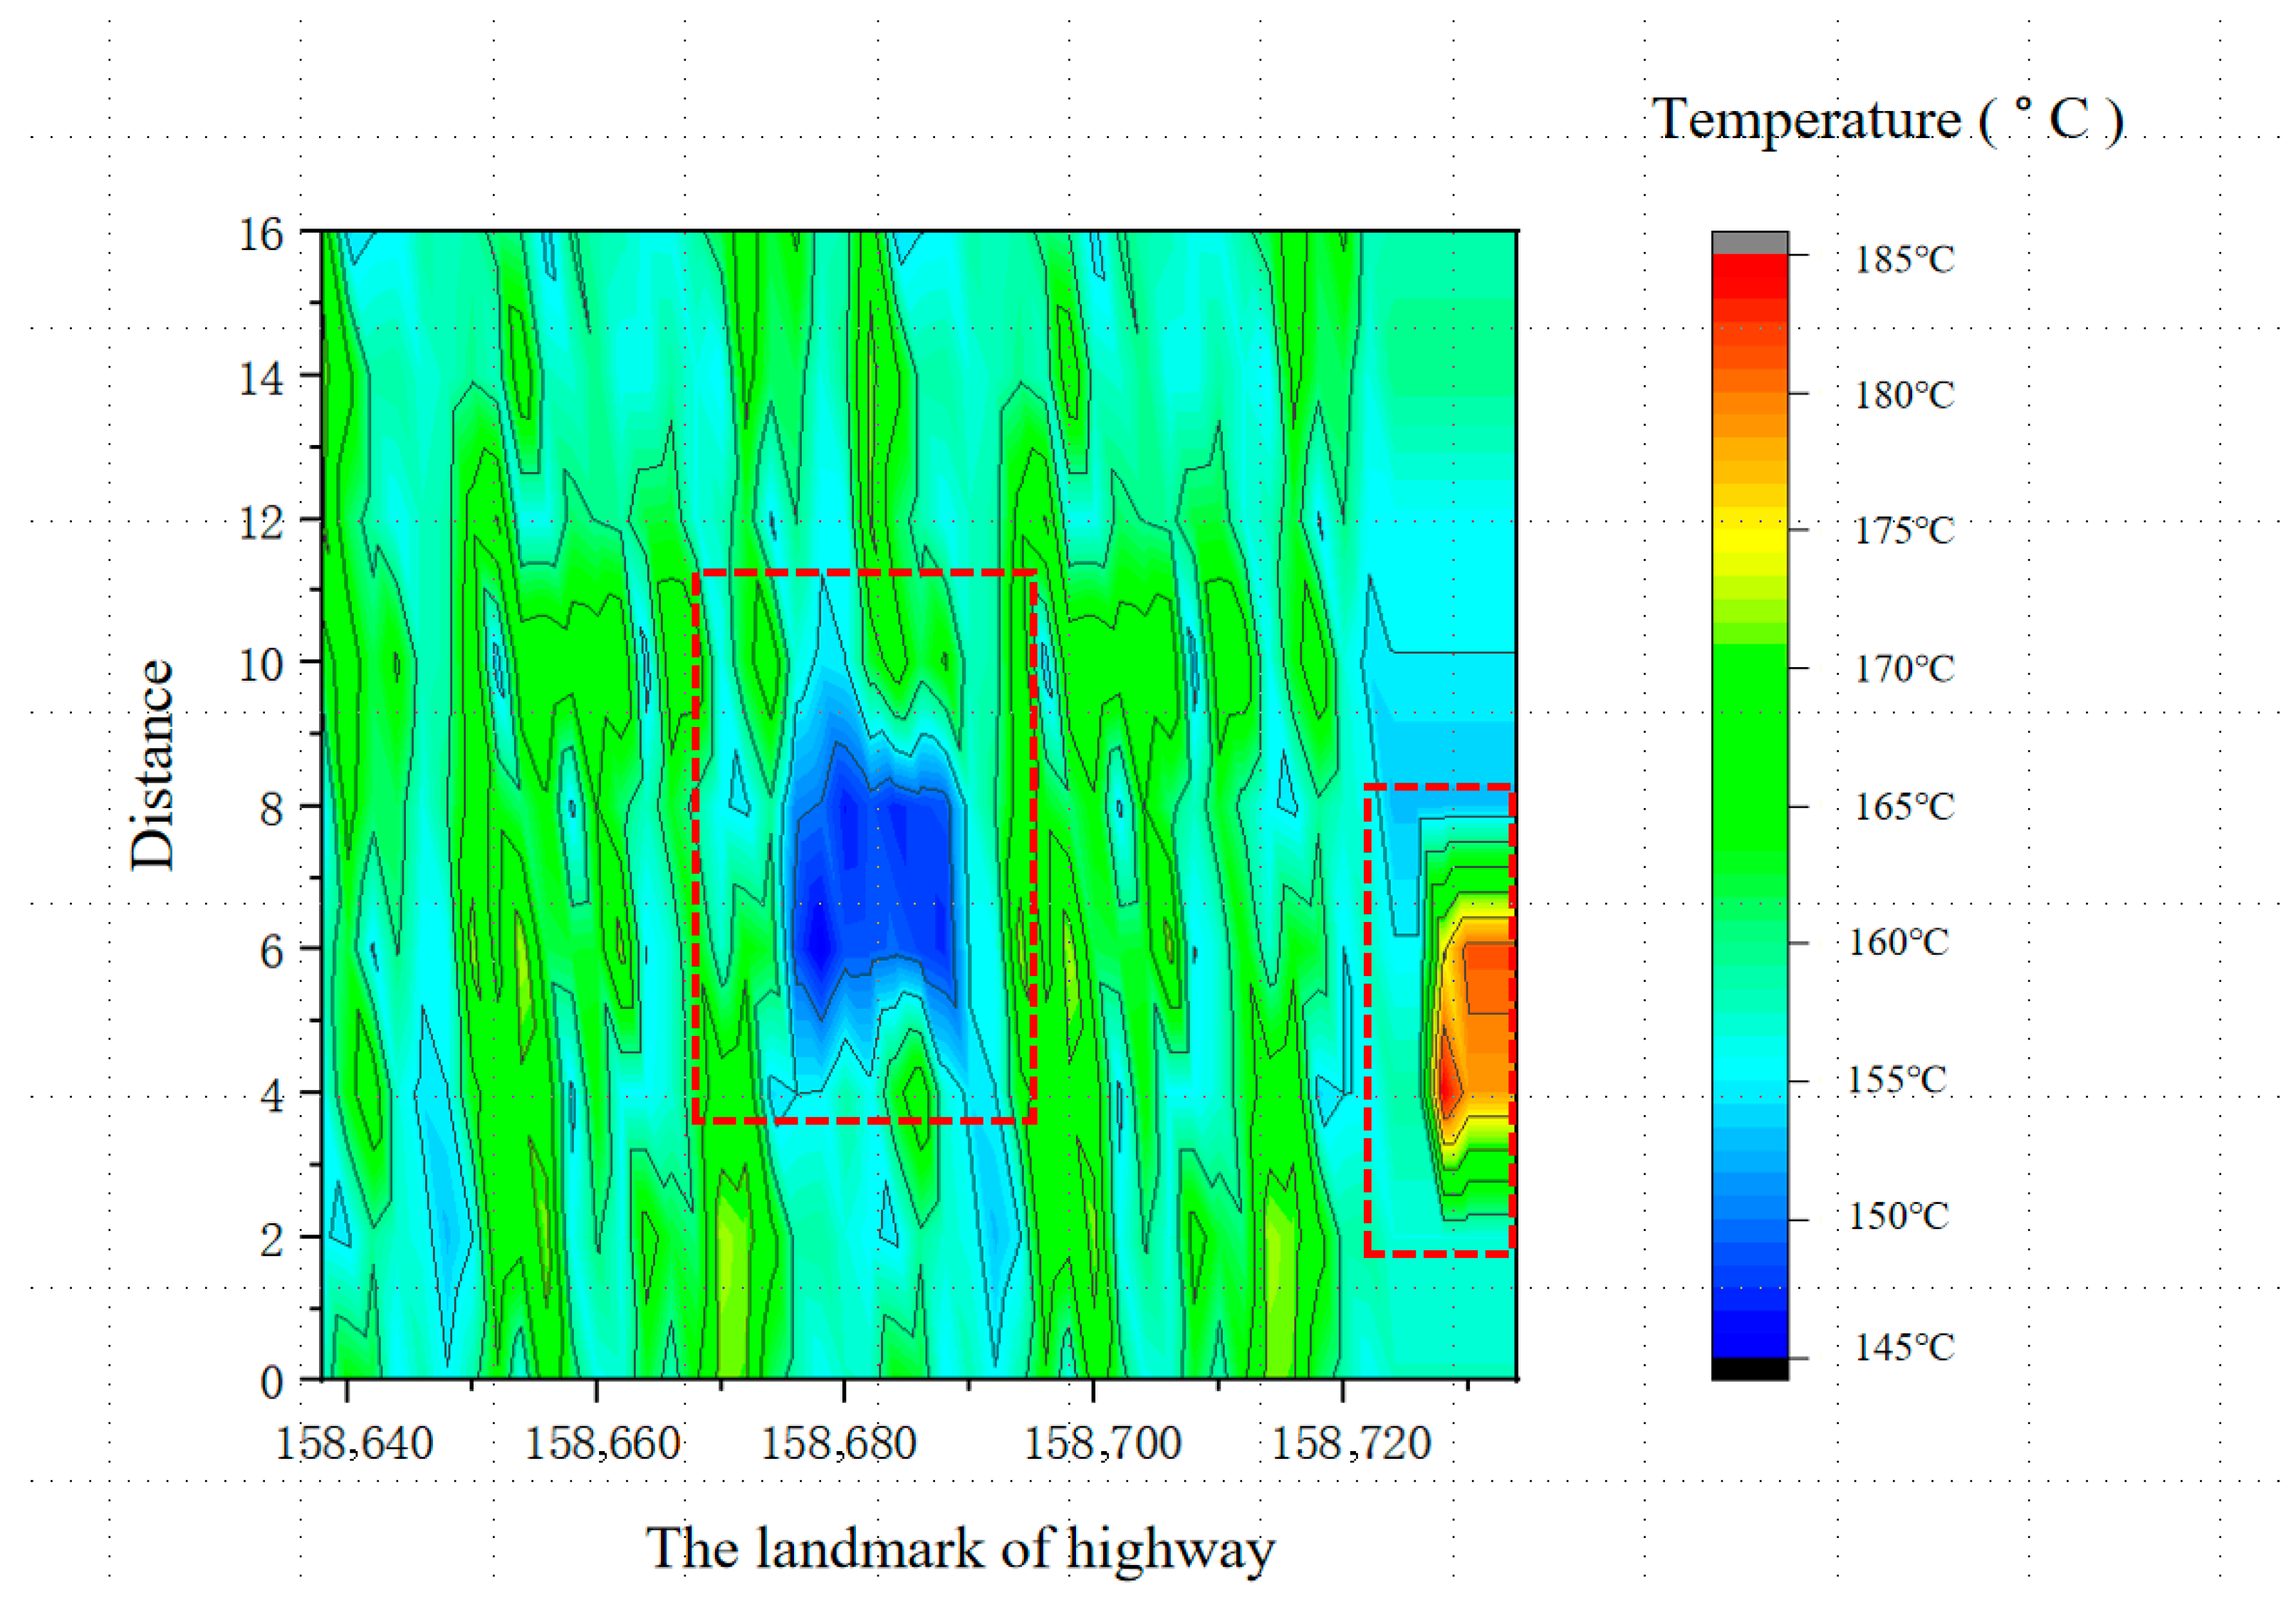
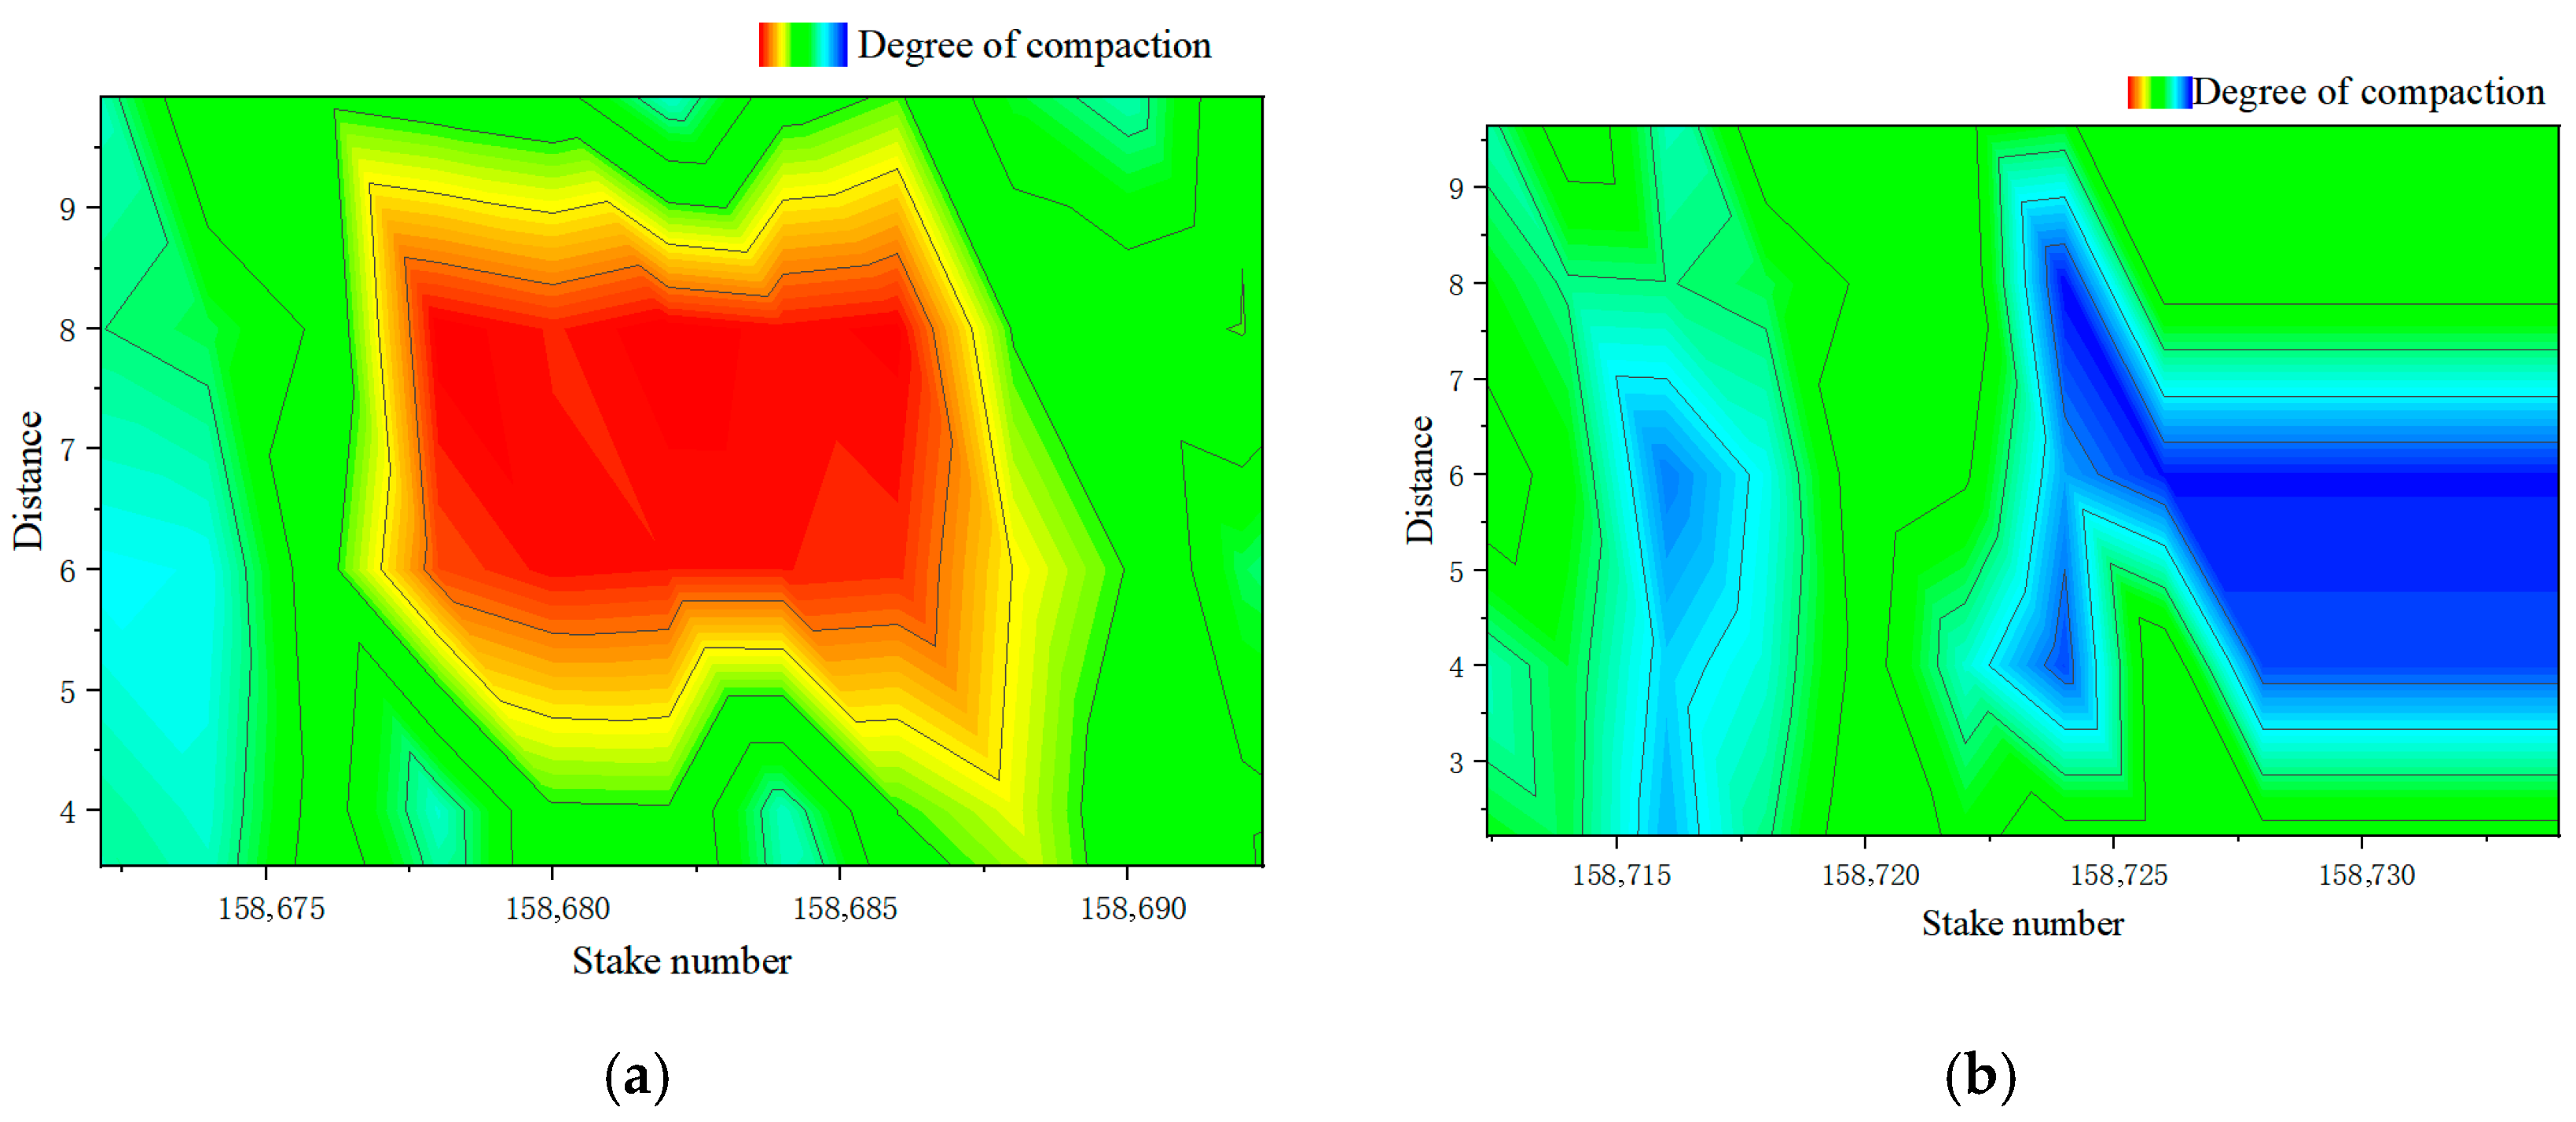
Aerial-based rapid screening is conducted using an unmanned aerial vehicle (UAV) equipped with an infrared thermal imager. Immediately after asphalt mixture placement, during compaction, and upon final rolling completion, the UAV is deployed to perform large-area infrared scanning of the working surface, enabling quality assessment throughout the entire construction process. This method allows for the rapid acquisition of full-field temperature distribution contour plots for the entire construction section, facilitating the identification of temperature anomalies such as cold or hot streaks. Temperature non-uniformity is the primary cause of compaction variability. The generated thermal images are used to create macro-scale, full-width temperature evolution contour plots (see Figure 19), which help pinpoint suspected under-compaction zones (low-temperature areas) and over-compaction risk zones (high-temperature areas). This provides precise “target areas” for subsequent detailed inspection. Ground-based verification is then performed using a non-nuclear density gauge for on-site testing of these suspected areas of uneven compaction, enabling precise detection and confirmation(see Figure 20).
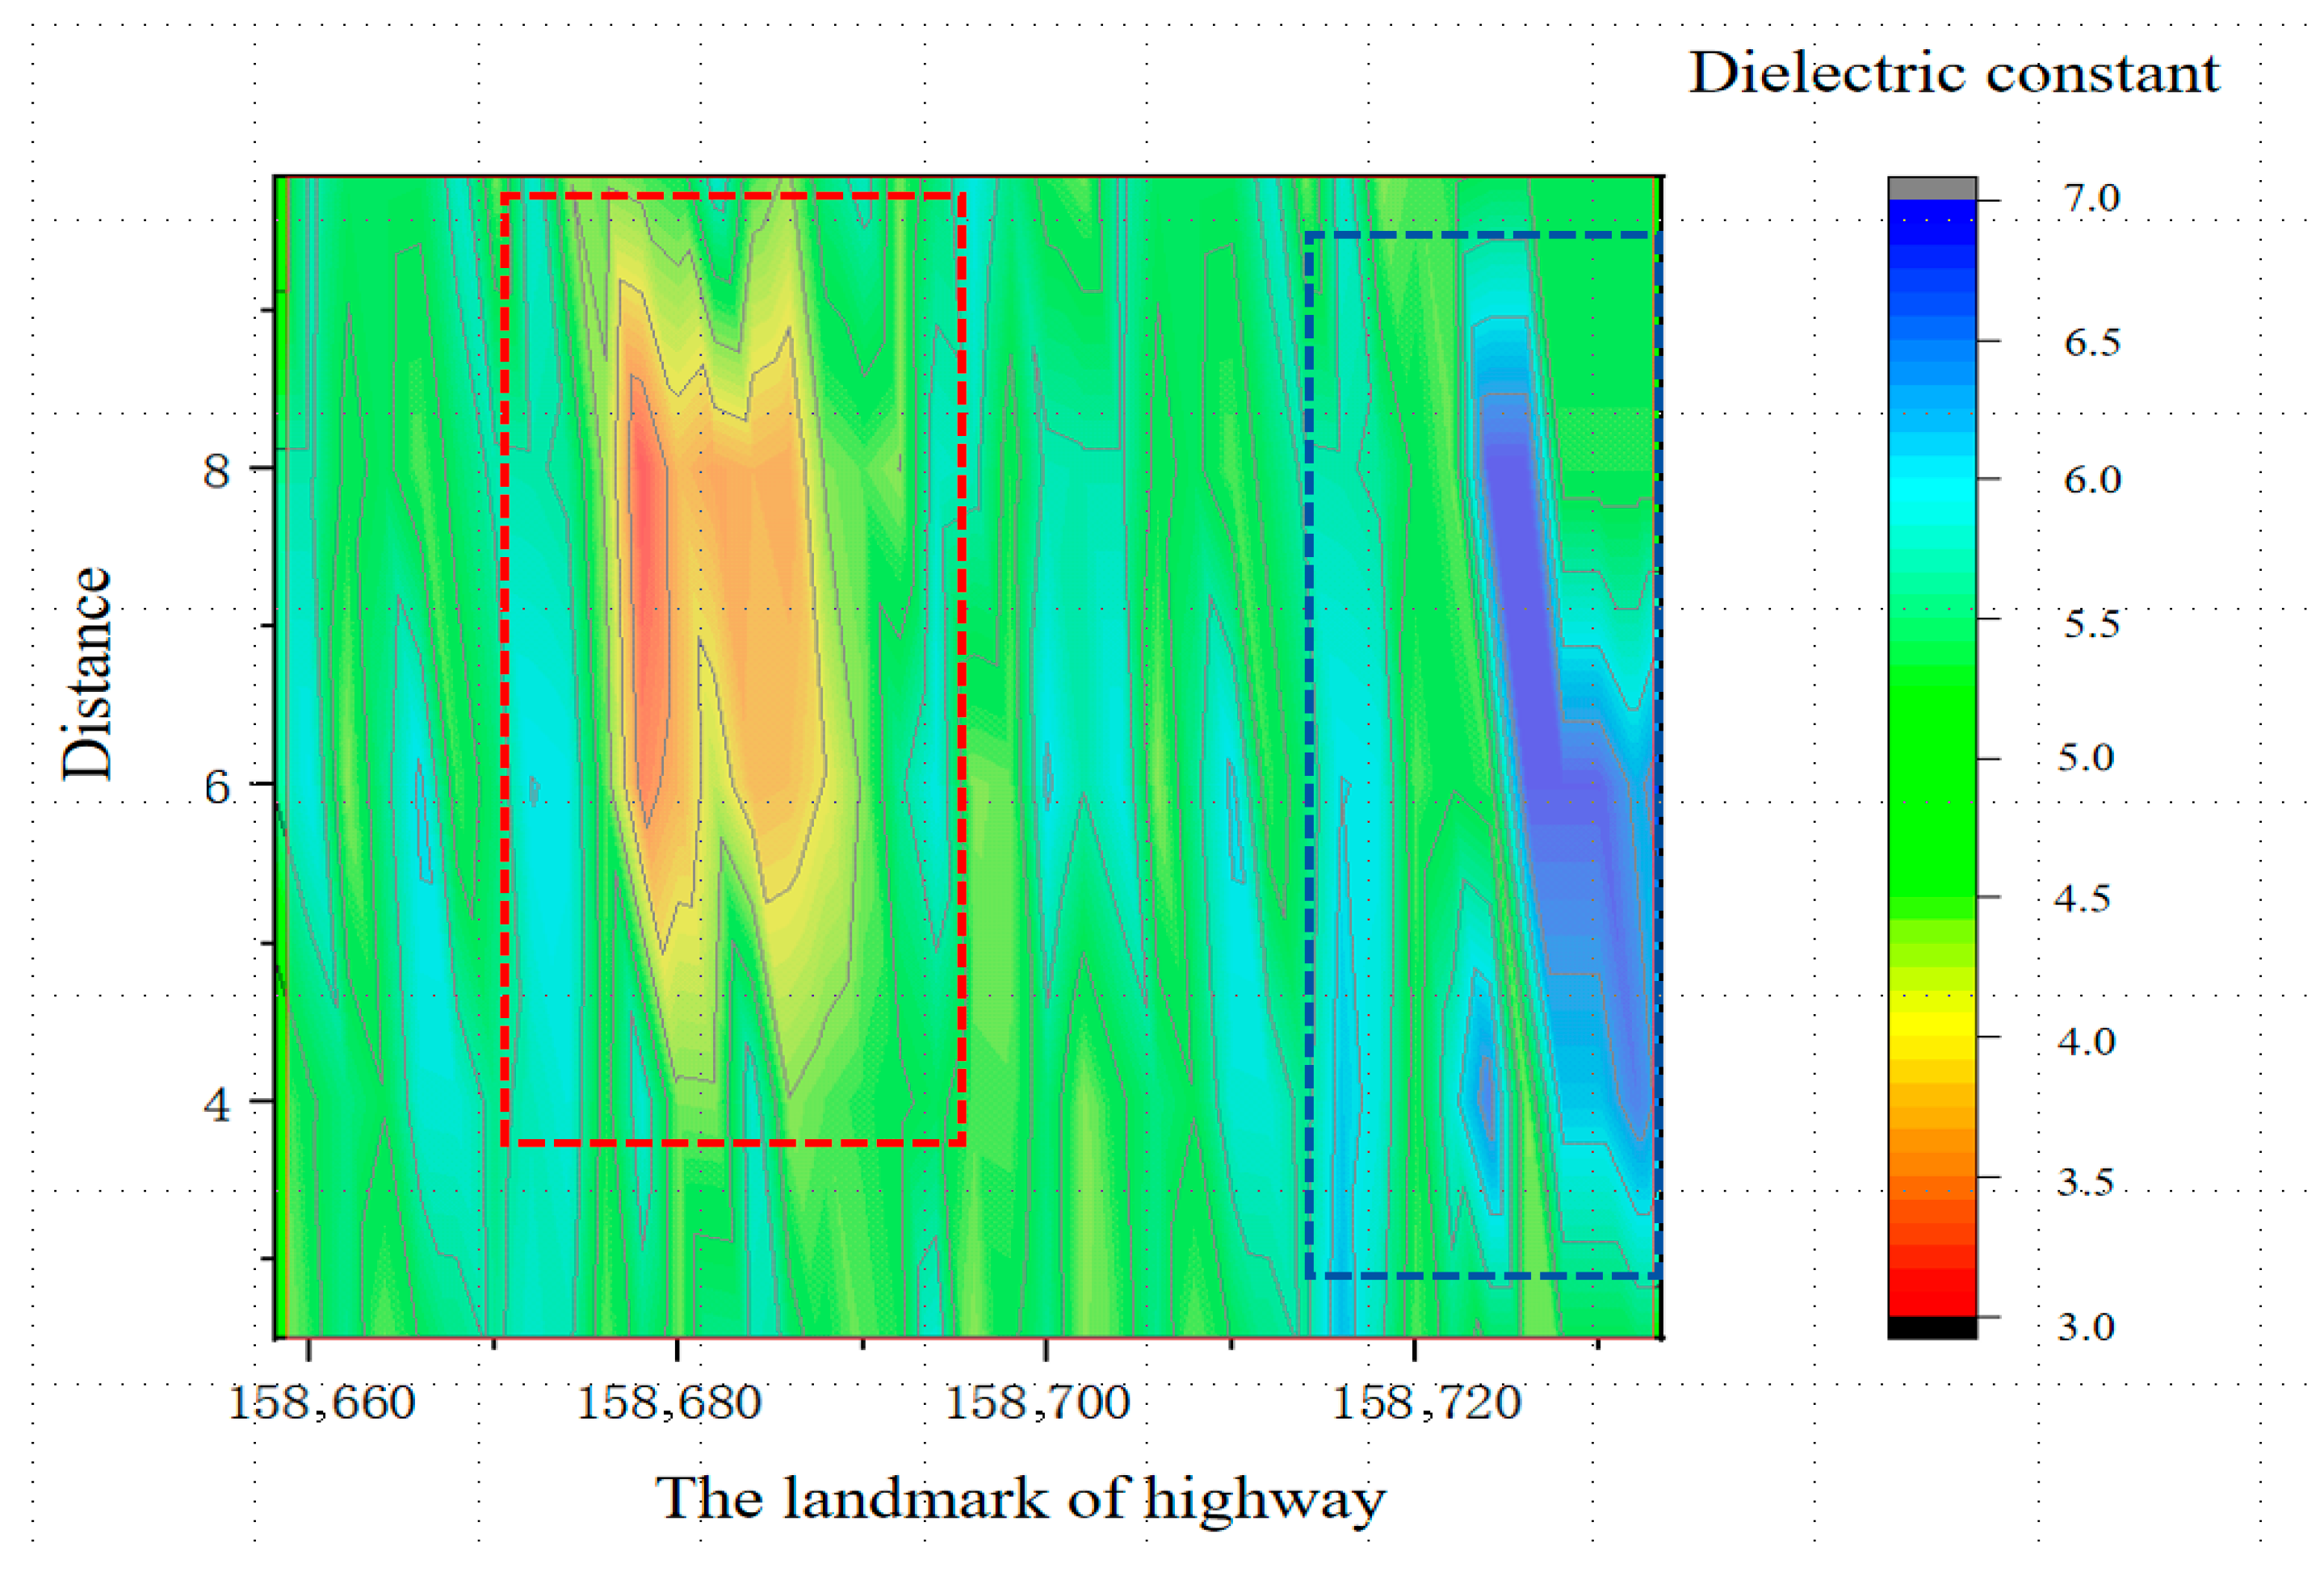
Based on the “target areas” identified by unmanned aerial vehicles, the ground-penetrating radar (GPR) vehicle is driven to perform continuous scanning with 100% coverage of key areas for verification. By measuring the dielectric constant of the pavement, the uniformity of compaction is indirectly and continuously evaluated. This process transforms temperature-based “suspected anomalies” into dielectric property-based “empirical evidence”. Based on the distribution of the dielectric constant and combined with estimation models, a mesoscopic continuous cloud map is generated (see Figure 21), accurately delineating the extent and morphology of non-uniform areas and identifying specific sections with weak compaction.
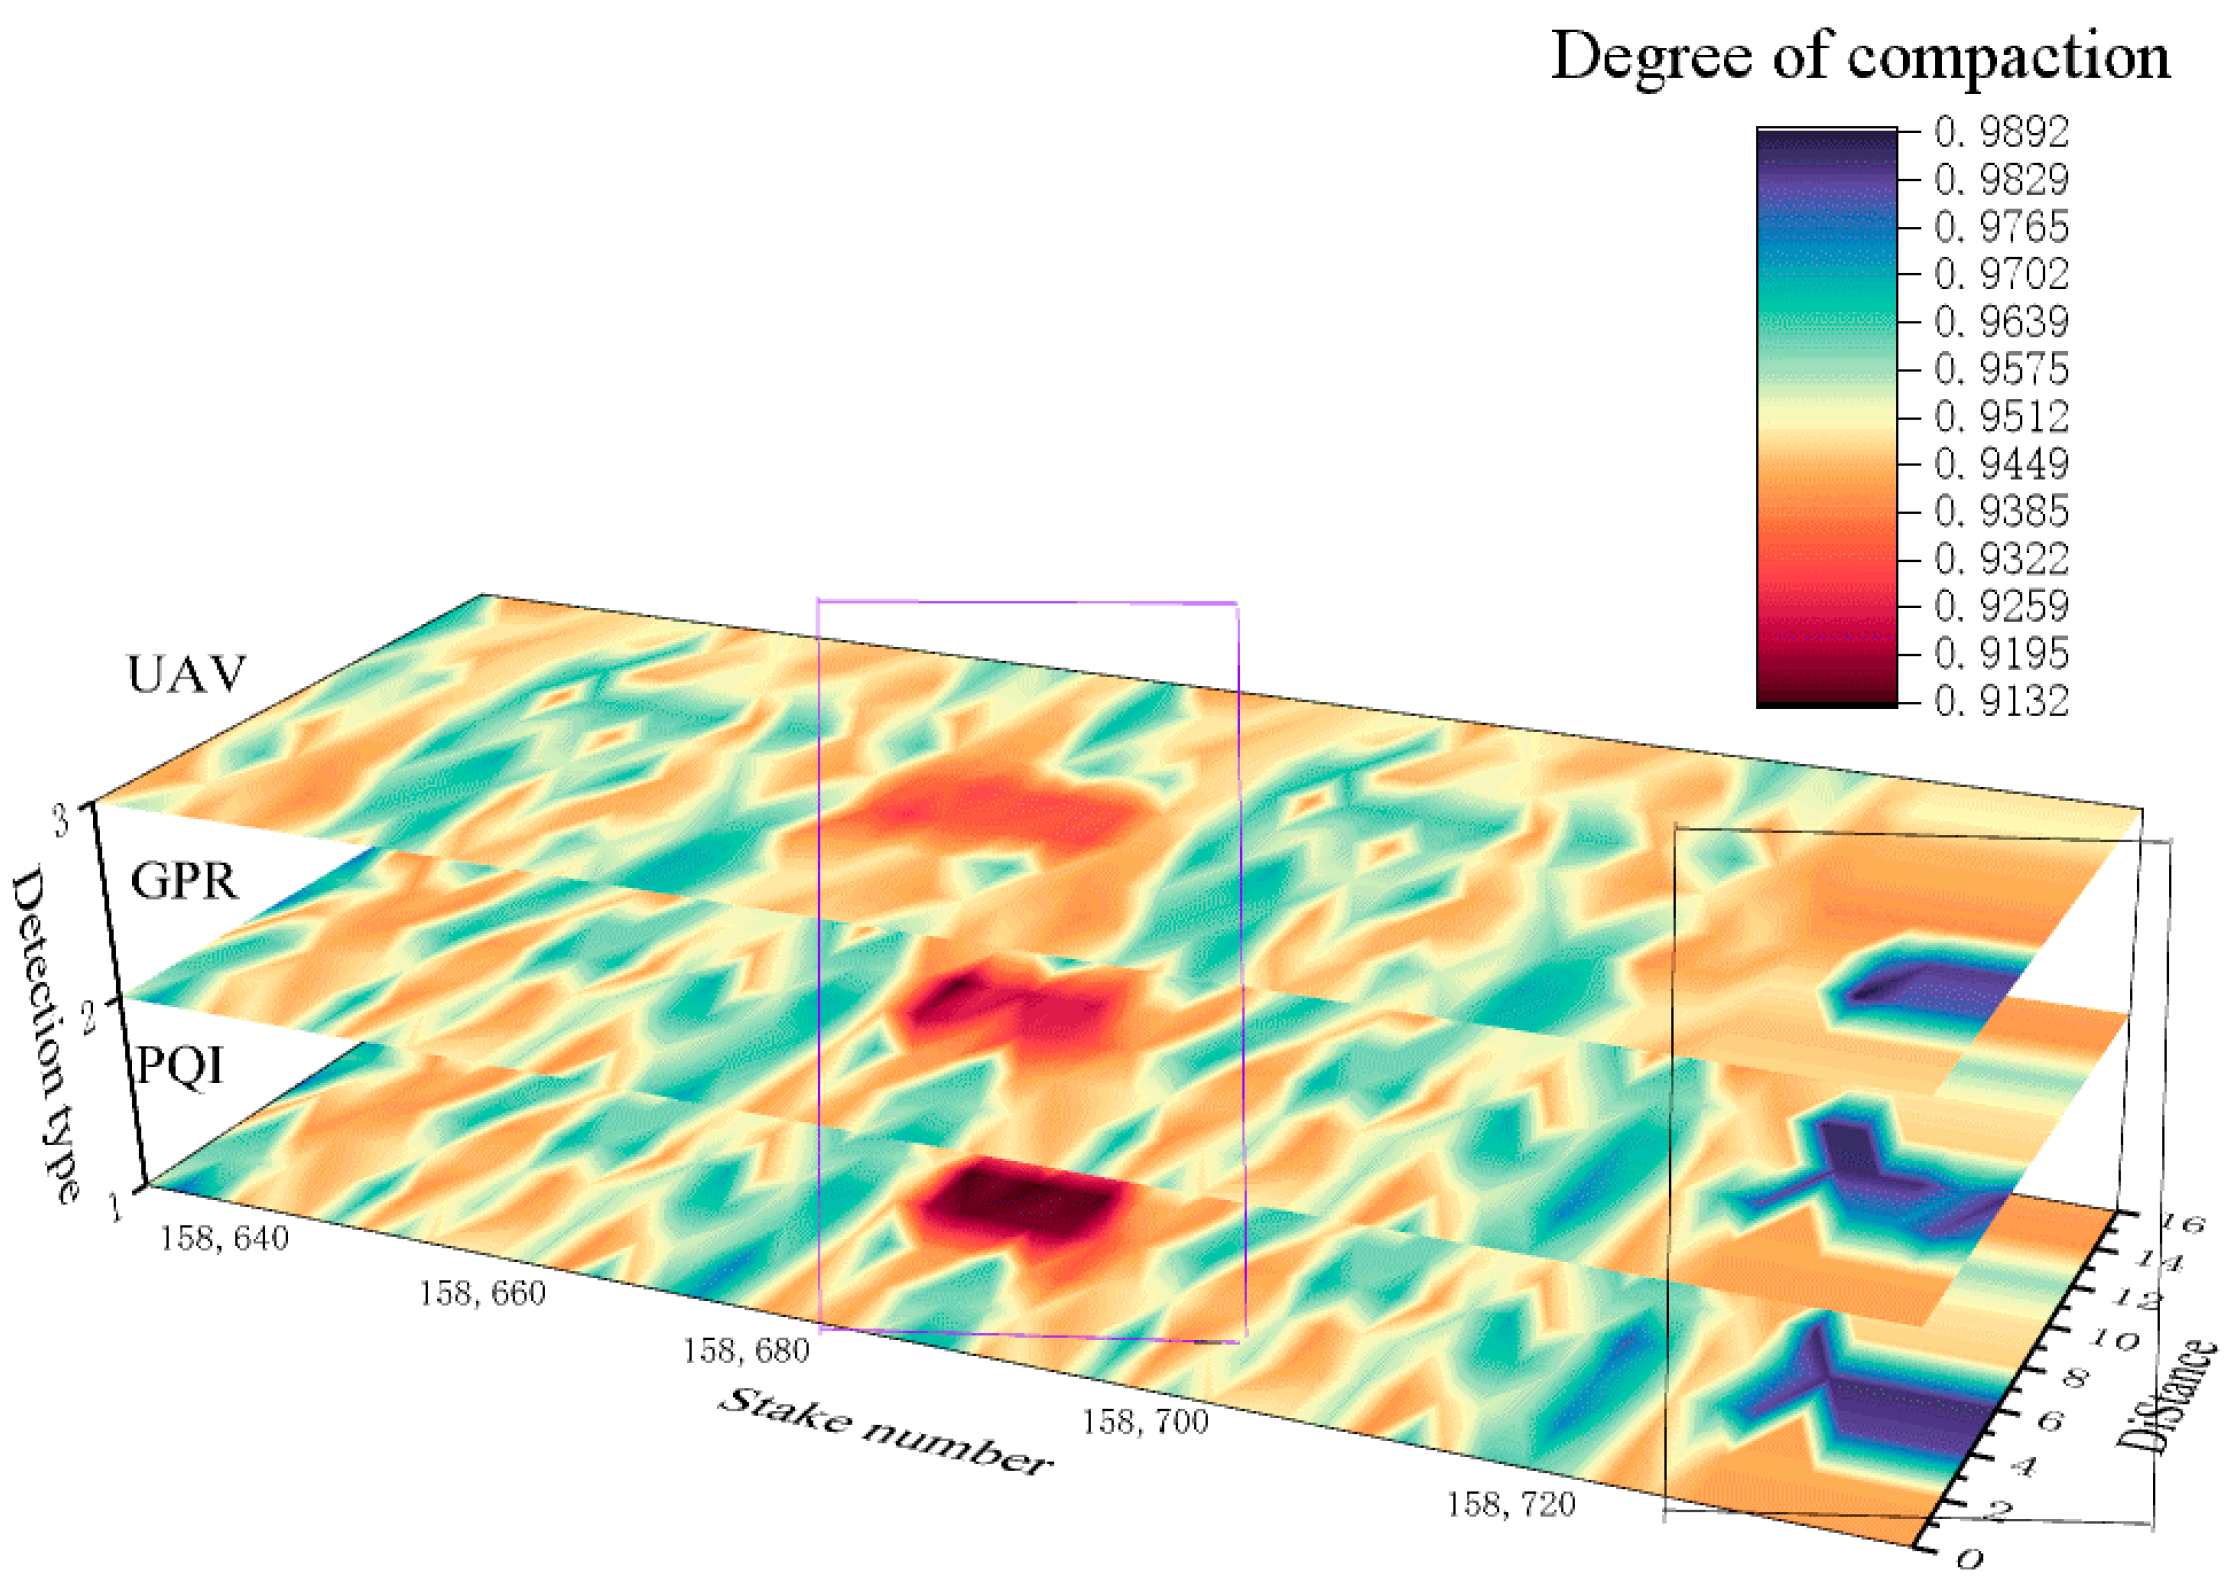
The air void content was measured using a non-nuclear density gauge. A five-point method was employed to calibrate the non-nuclear density gauge against predictions from 3D ground-penetrating radar (GPR) and UAV-based infrared technology to obtain correction factors. Using a characterization model for asphalt pavement compaction uniformity based on dielectric constant, the calibration coefficients for the empirical dielectric constant-density formula were determined, resulting in the following predictive model: y = 11.123 e ( x / 4.68 ) 0.156 . Simultaneously, by integrating UAV-based infrared thermal imaging to collect pavement temperature field data and utilizing a temperature-compaction prediction model to assess construction uniformity, the calibration coefficients for the empirical temperature difference-air void content difference formula were established, yielding the temperature difference-air void content predictive model: y = 5.236 e ( x / 8.216 ) . The absolute compaction values at key points were obtained to provide final confirmation of the indirect measurements from infrared and GPR techniques, delivering precise, traceable point-based compaction data. Consequently, a compaction cloud map based on the micro-discrete precise detection of the non-nuclear density gauge was generated (see Figure 22), which was used to validate and calibrate the entire system.
A comparative analysis of compaction estimates was conducted using multi-source data. Data from infrared (temperature), GPR (dielectric constant), and the non-nuclear density gauge (compaction) were first converted to compaction values using predictive models and then fused within a unified spatial coordinate system for integrated analysis and decision-making. The compaction values from 3D GPR and UAV infrared thermography were specifically benchmarked against the non-nuclear density gauge measurements. Figure 22 presents a direct comparison of the estimation results from the GPR dielectric constant method, PQI air void method, and infrared temperature method.
Based on the compaction index, the study area was classified into three categories: areas with compaction > 97% were defined as fine segregation zones, those with compaction < 93% as coarse segregation zones, and areas with compaction between 93% and 97% as normal zones. A quantitative relationship between air void content and segregation degree was established, using 6.5% air void content as the threshold for severe segregation. The local severe segregation ratio (P) was defined as P = (number of grid cells with air void content > 6.5%)/12. A smaller P value indicates better construction quality, while a larger P value suggests more severe construction issues. This evaluation method overcomes the limitations of single-point data assessment and provides a more objective reflection of construction uniformity through regional statistical analysis. Prior to testing, the non-nuclear density gauge was calibrated to ensure the accuracy of air void content measurements. In the road section K158+678–K158+686, all three detection technologies observed significant fine segregation. The mixture compaction in this area exhibited notable spatial heterogeneity, characterized by significant differences between the center and the edges. UAV-based infrared detection further revealed significant temperature non-uniformity during both initial and final compaction stages in this area. Combined with the initial temperature differences during the paving process, this non-uniformity led to insufficient compaction and the formation of fine segregation.
A comparative analysis of multi-source detection data revealed that the non-nuclear density gauge provided the most accurate measurements, with a recorded compaction range of 91.234–91.568%, represented by dark-colored features in the image. The 3D ground-penetrating radar (GPR) yielded results ranging from 92.356% to 92.589%, while the UAV infrared detection indicated a compaction range of 93.457–93.897%, depicted as a light-red continuous zone extending from 2 m to 8 m away from the central median and spanning the entire K158+678–K158+686 section along the lane direction. Although the UAV-based method offered the most extensive spatial coverage, its accuracy was relatively lower.
In the road section K158+728–K158+734, all three detection techniques identified coarse segregation. This phenomenon is attributed to heat loss in the asphalt mixture during storage, transportation, and paving, as suggested by UAV infrared temperature data. Notably, the starting zone of the experimental section, characterized by lower initial temperatures and higher air void content, was more prone to segregation. Coarse segregation was particularly pronounced at the right wheel path, specifically 2–4 m and 7–10 m from the central median, due to the continuous compaction effect of heavy-duty vehicles. Measurements from the non-nuclear density gauge indicated segregation over a 4–8 m area, while UAV detection identified a narrower 6–8 m range. This discrepancy further confirms the significant impact of heavy traffic on the formation of segregation.
The strong agreement among the results from the three independent detection techniques corroborates the robustness and practical utility of the proposed multi-technology fusion strategy. This work effects a paradigm shift in quality control, transitioning from conventional reactive, discrete, and destructive inspections to a proactive, holistic, and non-destructive intelligent monitoring system. The implications are multifaceted: real-time feedback eliminates compaction defects, prolonging pavement life; rolling patterns are optimized for efficiency, curtailing resource consumption; and vast datasets empower a shift from subjective experience to objective, data-centric quality governance.

6. Conclusions

Towards a superior multi-dimensional assessment of quality across the asphalt pavement construction process, this research constructs an integrated air-ground cooperative monitoring system. This framework leverages a suite of non-destructive testing techniques; namely, UAV infrared thermography, 3D GPR, and non-nuclear density gauges.
(1) The dielectric constant values of the intermediate pavement layer surface, collected by the 3D ground-penetrating radar (GPR), showed a strong correlation with the air void content measured by the non-nuclear density gauge (R2 = 0.943 ). After comparing different methods for determination of the dielectric constant, it was found that using the full dataset from all radar channels and traces provided the highest accuracy. By fitting the comprehensive GPR dielectric constant data with the corresponding air void content data from all survey lines of the non-nuclear density gauge, the dielectric constant density prediction model for the experimental road section was derived as: y = 11.123 e ( x / 4.68 ) 0.156 .
(2) The UAV-based infrared thermal imager was identified as the optimal temperature measurement method following a comparative study. While the electronic thermometer, handheld infrared thermal imager, and UAV-based system showed consistent results (unlike the mercury thermometer), the UAV solution stands out due to its distinct advantages in directional detection capability, data visualization, storage efficiency, and operational safety.
(3) Based on infrared thermal imaging data acquired at different altitudes, this study established temperature distribution curves and performed polynomial fitting analysis. The results indicate that as the measurement altitude increases, the area of the detection zone expands, leading to a corresponding increase in measurement uncertainty. A comprehensive comparison of various temperature parameters revealed that the average temperature value exhibits superior representativeness.
(4) The findings indicate that within the measurement altitude range of 7–10 m, the temperature curves demonstrate strong consistency, with temperature variations remaining within ±1 °C. Notably, these results show a high degree of agreement with the spot measurements obtained using the contact thermometer (34.2 °C). Based on this analysis, it is recommended to establish this altitude range as the standard for thermal imaging data acquisition, with 34 °C serving as the reference temperature value.
(5) This study employed a synchronized approach using an unmanned aerial vehicle (UAV) equipped with an infrared thermal imager and a non-nuclear density gauge to simultaneously acquire the temperature field distribution and air void content of asphalt pavement after compaction. A model based on the differences between measured values and their average revealed a strong correlation (R2 = 0.827) between temperature difference and air void content difference, leading to the establishment of the following predictive model: y = 5.236 e ( x / 8.216 ) .
(6) The methodology establishes a multi-scale paradigm for quality evaluation. Macro-scale, aerial assessment over the entire process is achieved using temperature difference from UAV infrared data. Meso-scale, continuous linear evaluation is conducted post-construction via the local average dielectric constant from 3D GPR. Finally, micro-scale, discrete point verification is performed using air void content from the non-nuclear density gauge, enabling precise, targeted analysis.

Author Contributions

Writing—original draft, P.L.; data curation, S.W. and L.N.; methodology, L.N., T.L. and S.W.; project administration, W.H., C.S., G.W. and P.L.; Investigation, W.H.; Supervision, W.H., K.C., T.C., Z.D. and Z.F. were responsible for the experimental part of the research. All authors have read and agreed to the published version of the manuscript.

Funding

This work was supported in part by a grant from the Shandong Hi-Speed Qilu Construction Group Co., Ltd.

Institutional Review Board Statement

Not applicable.

Informed Consent Statement

Not applicable.

Data Availability Statement

The way of data acquisition in the study can contact the author.

Acknowledgments

The authors would like to thank the Shandong Transportation Institute for their support.

Conflicts of Interest

Peng Li and Tao Lei are employed by the company Shandong Hi-speed Qilu Construction Group Co., LTD. The remaining authors declare no conflicts of interest.

Abbreviations

AbbreviationFull Term
3D GPRThree-Dimensional Ground-Penetrating Radar
GPRGround-Penetrating Radar
NDTNon-Destructive Testing
NDGNon-Nuclear Density Gauge
UAVUnmanned Aerial Vehicle
UAV-IRUnmanned Aerial Vehicle-Based Infrared Thermography
RTKReal-Time Kinematic

References

  1. Peruń, G. Advances in Non-Destructive Testing Methods. Materials 2024, 17, 554. [Google Scholar] [CrossRef]
  2. Liu, C.; Du, Y.; Yue, G.; Li, Y.; Wu, D.; Li, F. Advances in automatic identification of road subsurface distress using ground penetrating radar: State of the art and future trends. Autom. Constr. 2024, 158, 105185. [Google Scholar] [CrossRef]
  3. Wang, S.; Sui, X.; Leng, Z.; Jiang, J.; Lu, G. Asphalt pavement density measurement using non-destructive testing methods: Current practices, challenges, and future vision. Constr. Build. Mater. 2023, 44, 128154. [Google Scholar] [CrossRef]
  4. Chen, W.; Hu, G.; Han, W.; Zhang, X.; Wei, J.; Xu, X.; Yan, X. Research on the Quality of Asphalt Pavement Construction Based on Nondestructive Testing Technology. Coatings 2022, 12, 379. [Google Scholar] [CrossRef]
  5. Zhang, M.M.; Zhang, X.D. Application of Ground Penetrating Radar in Tunnel Concrete Lining Quality Detection. Adv. Mater. Res. 2014, 1065–1069, 358–363. [Google Scholar] [CrossRef]
  6. Xu, Y.; Hua, D.; Wang, J.; Li, J. Research on application of Ground Penetrating Radar in road Inspection. IOP Conf. Ser. Earth Environ. Sci. 2021, 781, 022019. [Google Scholar] [CrossRef]
  7. Elmeseiry, N.; Alshaer, N.; Ismail, T. A Detailed Survey and Future Directions of Unmanned Aerial Vehicles (UAVs) with Potential Applications. Aerospace 2021, 8, 363. [Google Scholar] [CrossRef]
  8. Patil, S.S.; Kumar Admuthe, V.S.; Krushna Patil, R.; Bhokare, N.P.; Dadaso Desai, A.; Rajkumar Chhachwale, S.; Nikam, D.A.; Desai, D.B. Construction Site inspection by using Drone or UAV. Int. J. Eng. Appl. Sci. Technol. 2023, 7, 101–103. [Google Scholar] [CrossRef]
  9. Omar, T.; Nehdi, M.L. Remote sensing of concrete bridge decks using unmanned aerial vehicle infrared thermography. Autom. Constr. 2017, 83, 360–371. [Google Scholar] [CrossRef]
  10. Nooralishahi, P.; Ibarra-Castanedo, C.; Deane, S.; López, F.; Pant, S.; Genest, M.; Avdelidis, N.P.; Maldague, X.P.V. Drone-Based Non-Destructive Inspection of Industrial Sites: A Review and Case Studies. Drones 2021, 5, 106. [Google Scholar] [CrossRef]
  11. Cho, Y.; Wang, C.; Zhuang, Z. Framework for Empirical Process to Improve Nonnuclear Gauge Performance in Hot-Mix Asphalt Pavement Construction. J. Constr. Eng. Manag. 2013, 139, 601–610. [Google Scholar] [CrossRef]
  12. Wood, N.; Rahman, A.; Ip, R.H.L.; Graham, J. Assessment of non-destructive nuclear and non-nuclear asphalt density testing devices for Australian road construction. Nondestruct. Test. Eval. 2024, 40, 4696–4716. [Google Scholar] [CrossRef]
  13. Mirzabeigi, S.; Razkenari, M. Automated Vision-Based Building Inspection Using Drone Thermography. Constr. Res. Congr. 2022, 2022, 737–746. [Google Scholar] [CrossRef]
  14. Speth, S.; Gonçalves, A.; Rigault, B.; Suzuki, S.; Bouazizi, M.; Matsuo, Y.; Prendinger, H. Deep learning with RGB and thermal images onboard a drone for monitoring operations. J. Field Robot. 2022, 39, 840–868. [Google Scholar] [CrossRef]
  15. Suo, J.; Wang, T.; Zhang, X.; Chen, H.; Zhou, W.; Shi, W. HIT-UAV: A high-altitude infrared thermal dataset for Unmanned Aerial Vehicle-based object detection. arXiv 2022, arXiv:2204.03245. [Google Scholar] [CrossRef]
  16. Chai, J.L.; Wang, Y. The Application Research of Non-Nuclear Density Gauge Electromagnetic Technology in the Road Engineering. Appl. Mech. Mater. 2014, 597, 384–387. [Google Scholar] [CrossRef]
  17. Wang, Z.; Cai, Y.; Guo, C. Ground Penetrating Radar Experimental Study on Density and Compaction of Asphalt Pavement. J. Cent. S. Highw. Eng. 2006, 4, 96–101. [Google Scholar]
  18. Yang, X.; Huang, R.; Meng, Y.; Liang, J.; Rong, H.; Liu, Y.; Tan, S.; He, X.; Feng, Y. Overview of the application of Ground-Penetrating Radar, Laser, infrared thermal Imaging, and ultrasonic in nondestructive testing of road surface. Measurement 2024, 224, 113927. [Google Scholar] [CrossRef]
  19. Ministry of Transport of the People’s Republic of China. JTG E20-2011 Standard Test Methods of Asphalt and Asphalt Mixtures for Highway Engineering; People’s Communications Press: Beijing, China, 2011. [Google Scholar]
  20. Ministry of Transport of the People’s Republic of China. JTG F40-2004E Technical Specifications for Construction of Highway Asphalt Pavements; People’s Communications Press: Beijing, China, 2013. [Google Scholar]
  21. Van den bergh, W.; Vuye, C.; Kara, P.; Couscheir, K.; Blom, J.; Van Bouwel, P. The use of a non-nuclear density gauge for monitoring the compaction process of asphalt pavement. IOP Conf. Ser. Mater. Sci. Eng. 2017, 236, 012014. [Google Scholar] [CrossRef]
  22. Jeong, S.; Kim, M.-G.; Kim, J.-H.; Oh, K.-Y. Thermal monitoring of live-line power transmission lines with an infrared camera mounted on an unmanned aerial vehicle. Struct. Health Monit. 2023, 22, 3707–3722. [Google Scholar] [CrossRef]
  23. Tanda, G.; Migliazzi, M. Infrared thermography monitoring of solar photovoltaic systems: A comparison between UAV and aircraft remote sensing platforms. Therm. Sci. Eng. Prog. 2024, 48, 102379. [Google Scholar] [CrossRef]
  24. Shastry, S.; Mishra, S.; H U, S.; Sajeevan, S.; Satish, S.M.; M, V.; K B, R. A Survey of Drone Technologies: State-of-the-art, Applications and Future Directions. Int. Sci. J. Eng. Manag. 2025, 4, 1–6. [Google Scholar] [CrossRef]
  25. Wang, X.; Wang, H.; Sun, Q.; Chen, Y.-H. Air–ground coordinated unmanned swarm systems: A multitasking framework for control design. ISA Trans. 2024, 145, 315–329. [Google Scholar] [CrossRef]
  26. Ji, M.; Xu, Y.; Zhu, S.; Zhang, Y.; Xin, Y.; Mo, Y. Exploring the potential of UAV-based thermal imagery for monitoring diurnal variations in the microscale urban thermal environment. Energy Build. 2025, 347, 116375. [Google Scholar] [CrossRef]
  27. Zhang, X.; Han, W.; Chen, L.; Zhang, Z.; Xue, Z.; Wei, J.; Yan, X.; Hu, G. Homogeneity Assessment of Asphalt Concrete Base in Terms of a Three-Dimensional Air-Launched Ground Penetrating Radar. Coatings 2021, 11, 1398. [Google Scholar] [CrossRef]
Figure 1. Basic principle diagram of infrared thermal imager temperature measurement.
Infrastructures 10 00324 g001
Figure 2. PQI380 type coreless densitometer measurement.
Infrastructures 10 00324 g002
Figure 4. Air-Ground Collaborative Non-Destructive Testing System.
Infrastructures 10 00324 g004
Figure 5. On-site UAV measurement interface and parameters.
Infrastructures 10 00324 g005
Figure 6. Field coring and laboratory testing of asphalt samples.
Infrastructures 10 00324 g006
Figure 7. Schematic layout of the aerial-ground collaborative detection scheme.
Infrastructures 10 00324 g007
Figure 8. Maximum temperature distribution curve.
Infrastructures 10 00324 g008
Figure 9. Minimum temperature distribution curve.
Infrastructures 10 00324 g009
Figure 10. Infrared thermography at different heights.
Infrastructures 10 00324 g010
Figure 11. Average temperature distribution curve.
Infrastructures 10 00324 g011
Figure 12. Temperature deviation curve. (a) Temperature deviation curve for 3–6 m, (b) Temperature deviation curves for 11–16 m.
Infrastructures 10 00324 g012
Figure 13. Average temperature correction at different measurement heights.
Infrastructures 10 00324 g013
Figure 14. Temperature distribution cloud.
Infrastructures 10 00324 g014
Figure 15. Air void content distribution cloud.
Infrastructures 10 00324 g015
Figure 16. Relationship between crushing temperature difference and air void content.
Infrastructures 10 00324 g016
Figure 17. Correlation between dielectric constant and air void content fitting. (a) Index fitting, (b) Linear fit.
Infrastructures 10 00324 g017
Figure 18. Cloud map of thickness uniformity distribution.
Infrastructures 10 00324 g018
Figure 19. Macro-Scale Full-Field Cloud Diagram of Temperature Variation.
Infrastructures 10 00324 g019
Figure 20. Non-nuclear densimeter microscopic discrete accurate detection of compaction degree cloud map. (a) Too low degree of compaction, (b) Too high degree of compaction.
Infrastructures 10 00324 g020
Figure 21. Mesoscopic Continuous Compaction Cloud Map.
Infrastructures 10 00324 g021
Figure 22. Comparison of compaction estimates.
Infrastructures 10 00324 g022
Table 1. Collaborative Workflow.
TechnologyAim of DetectionDetection Scope/ScaleRole in the Collaborative System
UAV-Based Infrared ThermographyIt enables rapid identification of temperature differentials, thereby indirectly revealing potential compaction defects caused by excessive cooling and facilitating proactive process control.Area-Macroscopic, Full-ScaleAerial Reconnaissance Unit: Responsible for rapid, large-area scanning to identify suspect regions and provide target positioning for subsequent precise detection.
covering an area with a length ranging from hundreds of meters to several kilometers and the entire pavement width.
Non-Nuclear Density GaugeIt directly measures and calculates the compaction degree, delivers an absolute benchmark value, and enables precise diagnosis during process control.Point-Microscopic, DiscreteField Arbiter: It is responsible for the precise verification of anomalies identified by GPR, providing accurate compaction values to calibrate and validate the indirect measurements from the aforementioned two techniques.
Single-point measurement, with its density value representing a minute surrounding area.
3D Ground Penetrating Radar (3D GPR)It directly measures the dielectric constant to evaluate compaction uniformity, identifies zones of dielectric anomaly, and accomplishes preliminary inspection and acceptance.Line-Mesoscopic, ContinuousGround-based Diagnostic Specialist: It performs detailed scans of suspected areas, converts anomalies into dielectric constant anomalies, precisely delineates non-uniform zones, and achieves full-lane validation.
Continuous detection along the lane direction (covering 100% of the area), with high resolution in the vertical direction.
Table 2. Gradation and Requirements for AC-20 Asphalt Mixture.
Passing Percentage by Mass (%)
191613.29.54.752.361.180.60.30.150.075
Upper Limit of Gradation1009280725644332417137
Lower Limit of Gradation907862502616128543
Production Mix Proportion94.684.474.459.237.625.217.813.09.87.55.4
Table 3. Results from Different Temperature Measurement Methods.
Measurement PointMercury Thermometer/°CInfrared Thermometer/°CHandheld Infrared Thermometer/°CUAV-Based Infrared Thermal Imaging/°C
1145146.4146.6146.5
2154156.1156.2156.0
3146148.1147.5147.9
4165166.2165.4165.9
5149150.3150.1150.3
6147148.5148.7148.5
7150152.9152.7152.7
Table 4. Merits and Drawbacks of Different Temperature Measurement Techniques.
Temperature Measurement MethodMeasurement AccuracyTemperature Measurement RangeMeasurement TimeAcquisition CostSafety
Mercury thermometerLowSmallLongLowLow
Infrared thermometerHighSmallShortLowLow
Handheld infrared thermometerHighRelatively largeShortRelatively highRelatively high
UAV-based infrared thermal imagingHighLargeShortHighHigh
Table 5. Average temperature deviation table.
Measuring Height/m3456111213141516
Temperature Departure/°C−0.6−0.5−0.10.3−0.7−0.400.20.90.6
Table 6. Average temperature correction table.
Measuring Height/m3456111213141516
y−0.7−0.4−0.10.2−0.7−0.4−0.10.20.50.8
Q1/°C33.433.533.934.333.333.634.034.234.934.6
Q2/°C34.133.934.034.134.034.034.134.034.433.8
Table 7. AC-20 Evaluation criteria for temperature segregation degree of AC-20 asphalt mixture.
Temperature Dissociation DegreeNon-DivisibilityMinor SegregationModerate SegregationSevere Dissociation
Mixing temperature (°C)<11–33–6>6
Table 8. Calibration results of nuclear-free densitometer.
Core 1Core 2Core 3Core 4
Nuclear-free density meter detects the density at the core (g/cm3)2.38772.40702.43122.3510
Drill core sampling measured core sample density (g/cm3)2.3802.3952.4502.327
Table 9. Dielectric Constant at Coring Locations Determined by the Amplitude Total Reflection Method.
Core SamplesMetal Plate Reflection A p Amplitude ( A p )Road Surface Reflection A 0 Amplitude ( A 0 )Dielectric ConstantDielectric Constant of Core Drilling Sampling Method
Core10.0020.005035.385.41
Core20.0020.005135.195.22
Core30.0020.005454.664.66
Core40.0020.005384.774.79
Disclaimer/Publisher’s Note: The statements, opinions and data contained in all publications are solely those of the individual author(s) and contributor(s) and not of MDPI and/or the editor(s). MDPI and/or the editor(s) disclaim responsibility for any injury to people or property resulting from any ideas, methods, instructions or products referred to in the content.