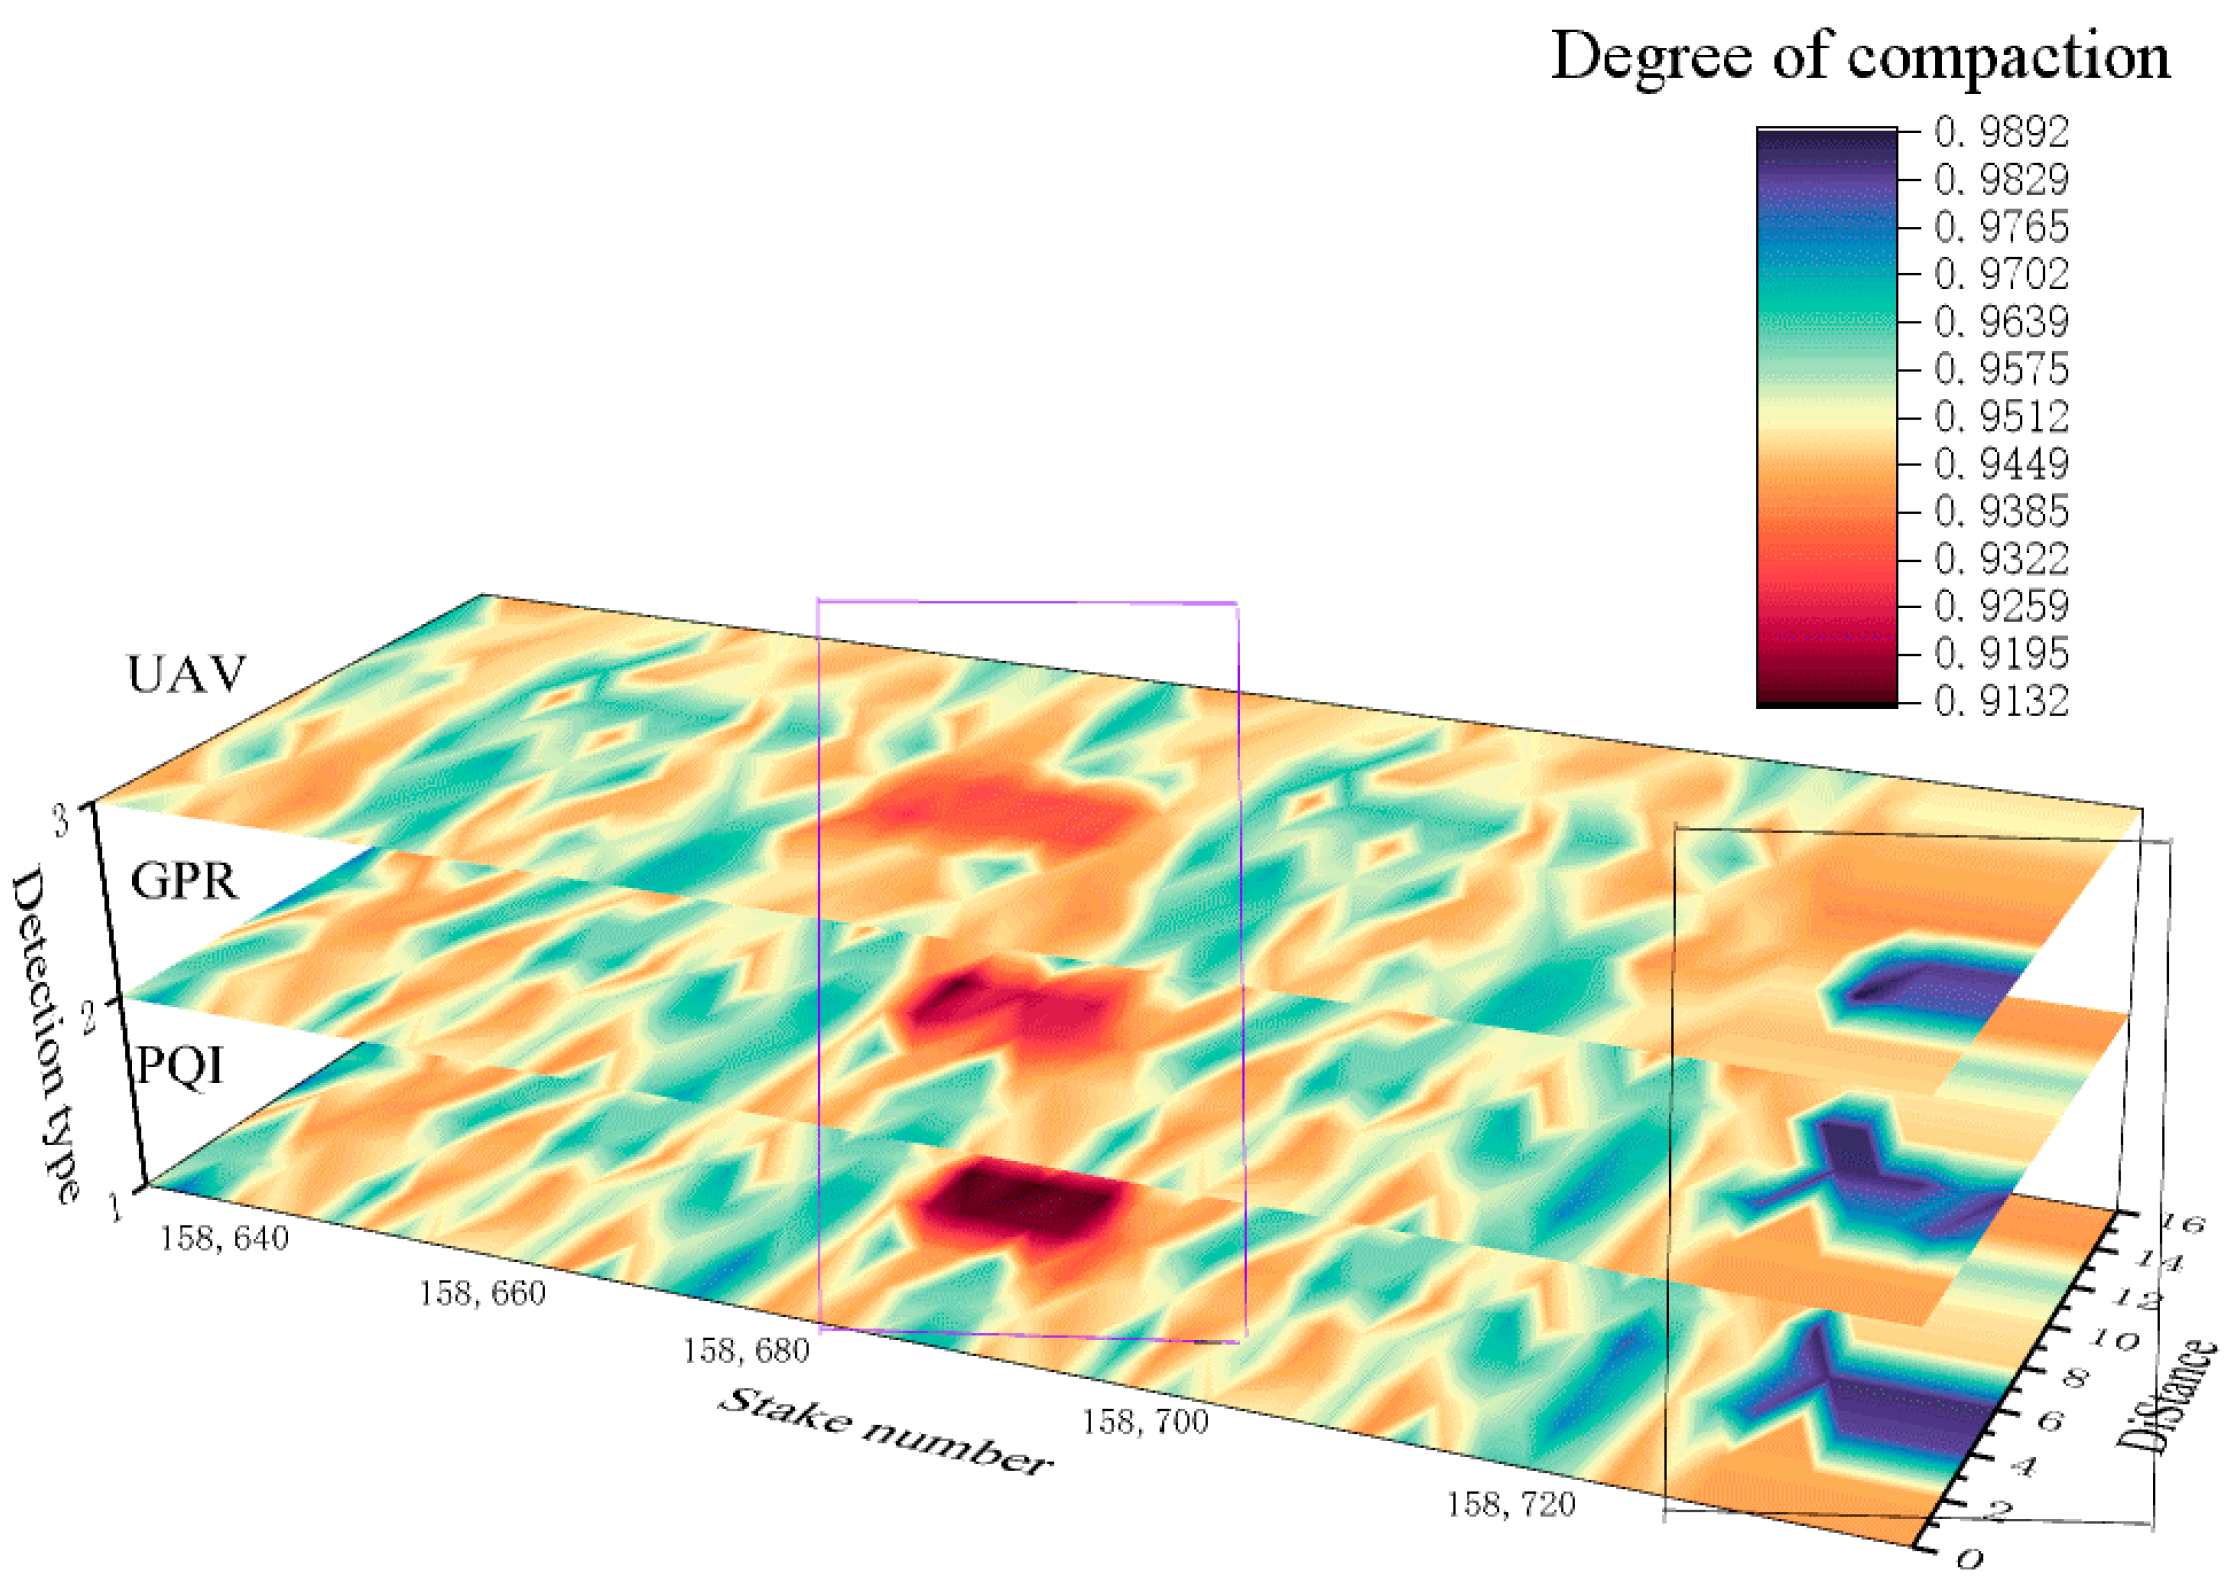
4.1. Investigating Temperature Uniformity in Asphalt Pavements
A comparative analysis of different temperature measurement methods was conducted at the asphalt pavement construction site. The recorded data are presented in
Table 3. UAV-IR and NDG measurements were performed in rapid sequence, with a maximum time delay of 15 min after the final compaction pass to ensure data comparability under stable cooling conditions.
A comparative analysis revealed that the mercury thermometer readings were significantly lower, while the results from the other three measurement methods were generally consistent. This discrepancy can be primarily attributed to the fact that the mercury thermometer requires approximately five minutes to stabilize, and it is susceptible to significant random errors, necessitating multiple measurements to obtain a reliable average. However, frequent measurements not only impede construction efficiency but also introduce variability due to the rapid cooling of the asphalt mixture after paving, making it difficult to maintain consistent measurement conditions at the same location. Furthermore, the use of contact-based temperature measurement devices, such as the mercury thermometer, requires operators to work in close proximity to the freshly laid mat, posing potential safety hazards due to the subsequent roller operations. Comprehensive analysis demonstrates that UAV-based infrared thermal imaging offers distinct advantages, including targeted accuracy, intuitive data visualization, ease of data storage, and enhanced operational safety, making it more suitable for temperature monitoring during asphalt pavement construction [
22]. The accuracy of the temperature data (error < ±1.5 °C) was validated against a calibrated handheld infrared thermometer (Fluke 62 Max+), which served as the reference for the actual pavement surface temperature. This validation was performed by comparing point measurements from the handheld device with temperature values extracted from the UAV thermal imagery at corresponding locations immediately after the UAV flyover. The demonstrated superiority of UAV-based infrared thermography represents a paradigm shift in pavement construction monitoring. While traditional contact thermometers introduce significant measurement delays incompatible with rapid asphalt cooling, the aerial method achieves comprehensive spatial coverage while maintaining validated accuracy (±1.5 °C). This technological transition addresses both methodological and safety concerns—eliminating personnel exposure to hazardous work zones while providing complete, real-time temperature documentation. Most significantly, the continuous thermal mapping enables proactive quality control by identifying localized anomalies that traditional spot measurements inevitably miss. This capability transforms quality assurance from statistical sampling to comprehensive evaluation, allowing for targeted corrective actions during the critical compaction window. The method establishes an objective, digital foundation for data-driven construction management and creates valuable historical records for lifecycle pavement performance analysis.
The measurement accuracy of four temperature detection methods for asphalt pavement—including an electronic thermometer gun, a mercury-in-glass thermometer, a UAV-based infrared thermal imaging system, and a handheld infrared thermal camera—is compared in
Table 4. To investigate the influence of measurement distance on detection results, a 2 m × 2 m square test area (delineated with low-temperature markers) was set up on a freshly compacted asphalt pavement. Using a UAV equipped with an infrared thermal imager, gradient measurements were taken at 2 m intervals within an altitude range of 3–16 m. By analyzing the variation characteristics of temperature data at different altitudes, a quantitative relationship model between measurement accuracy and flight height was established. The experimental results indicate that as the measurement distance decreases, the thermal radiation energy received by the infrared device increases significantly (
p < 0.01). When the altitude is below 5 m, the temperature measurement error can be controlled within ±1 °C. This study provides a basis for selecting optimal measurement parameters for the accurate monitoring of the temperature field during asphalt pavement construction.
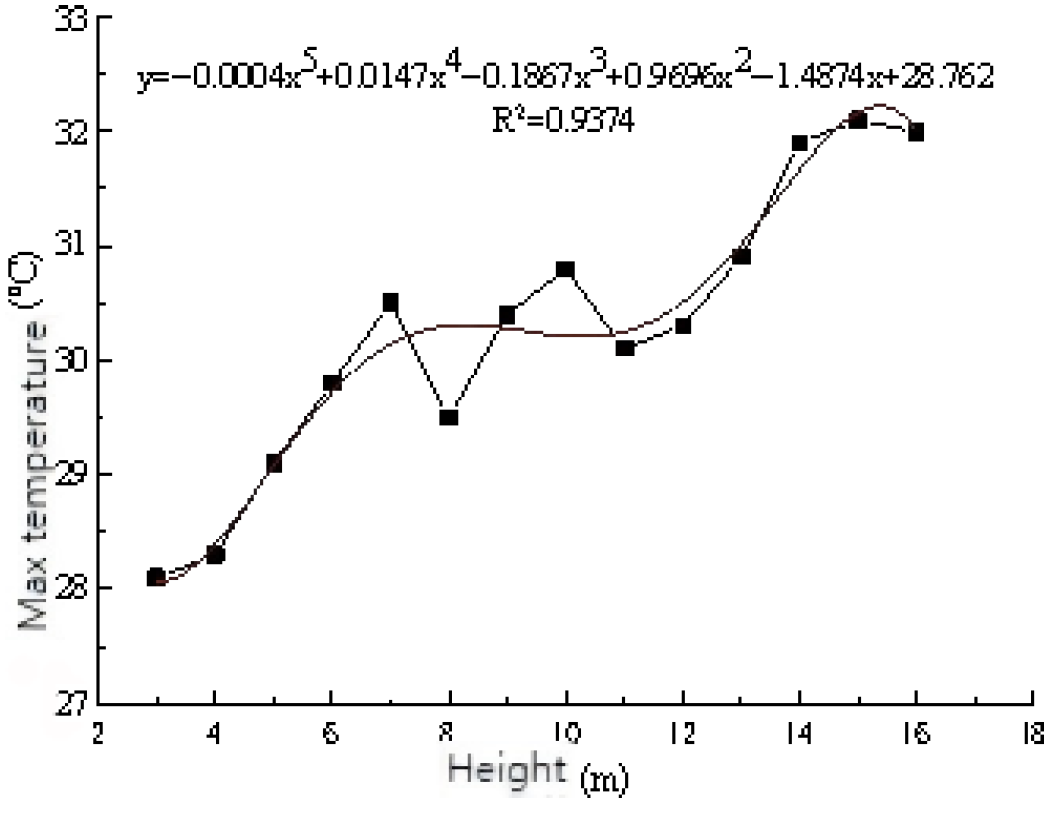
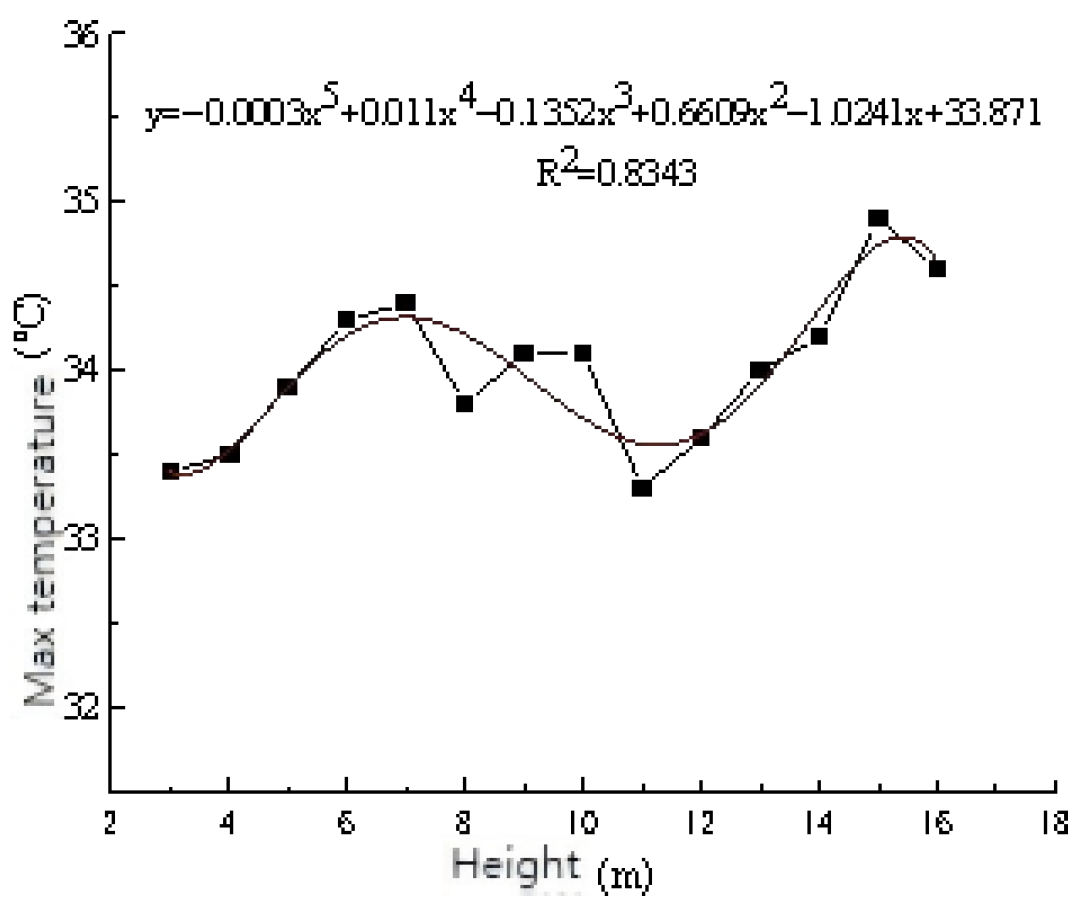
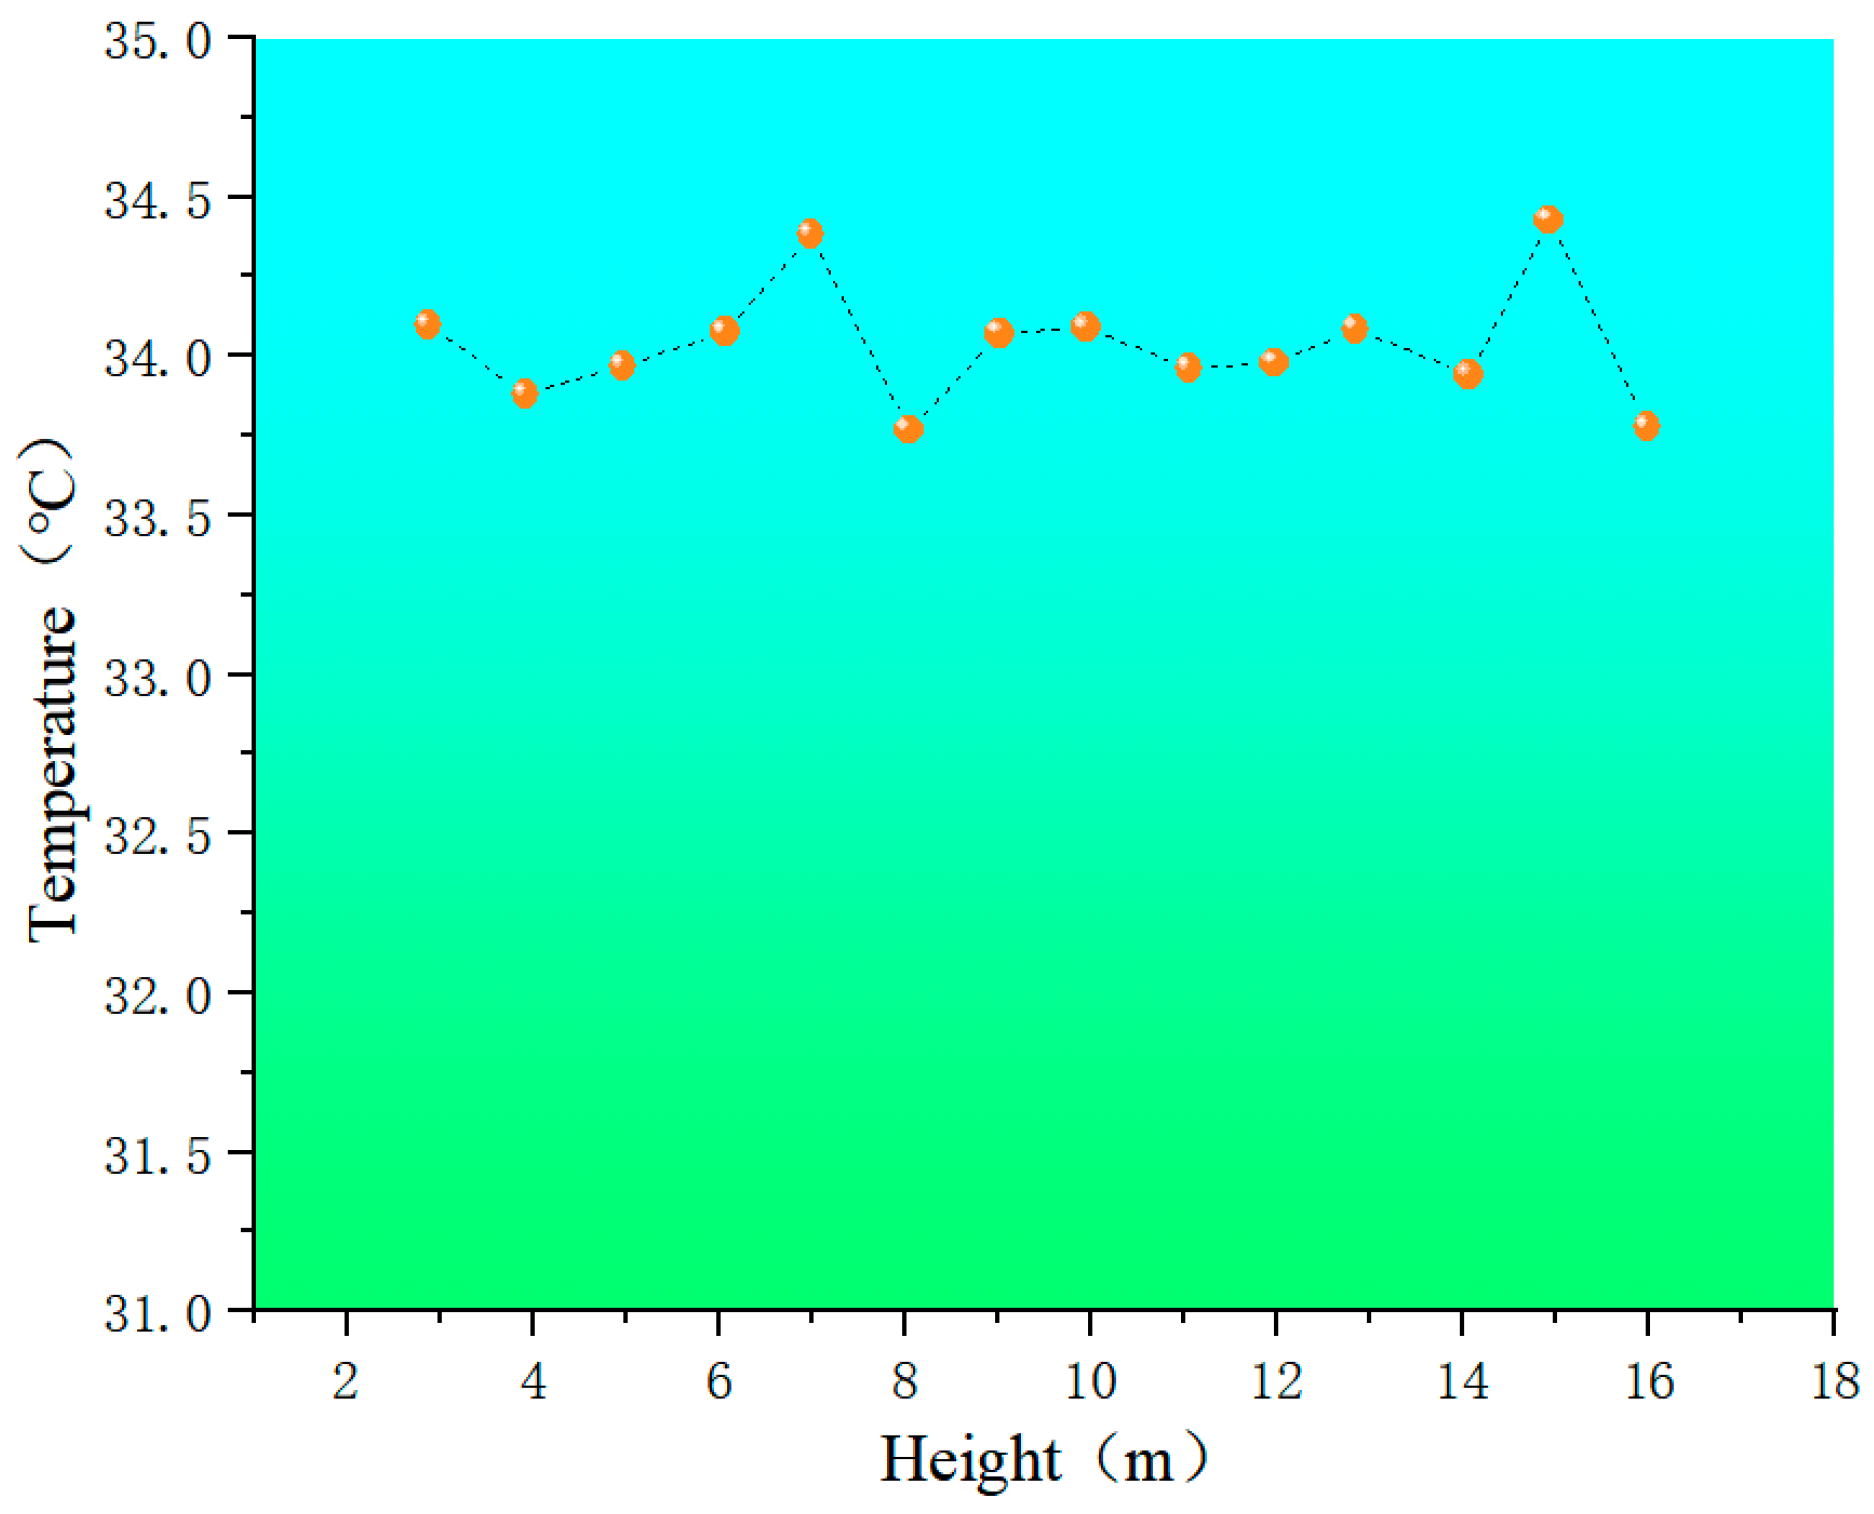
The temperature values measured at different altitudes were plotted as temperature distribution curves in
Figure 8 and
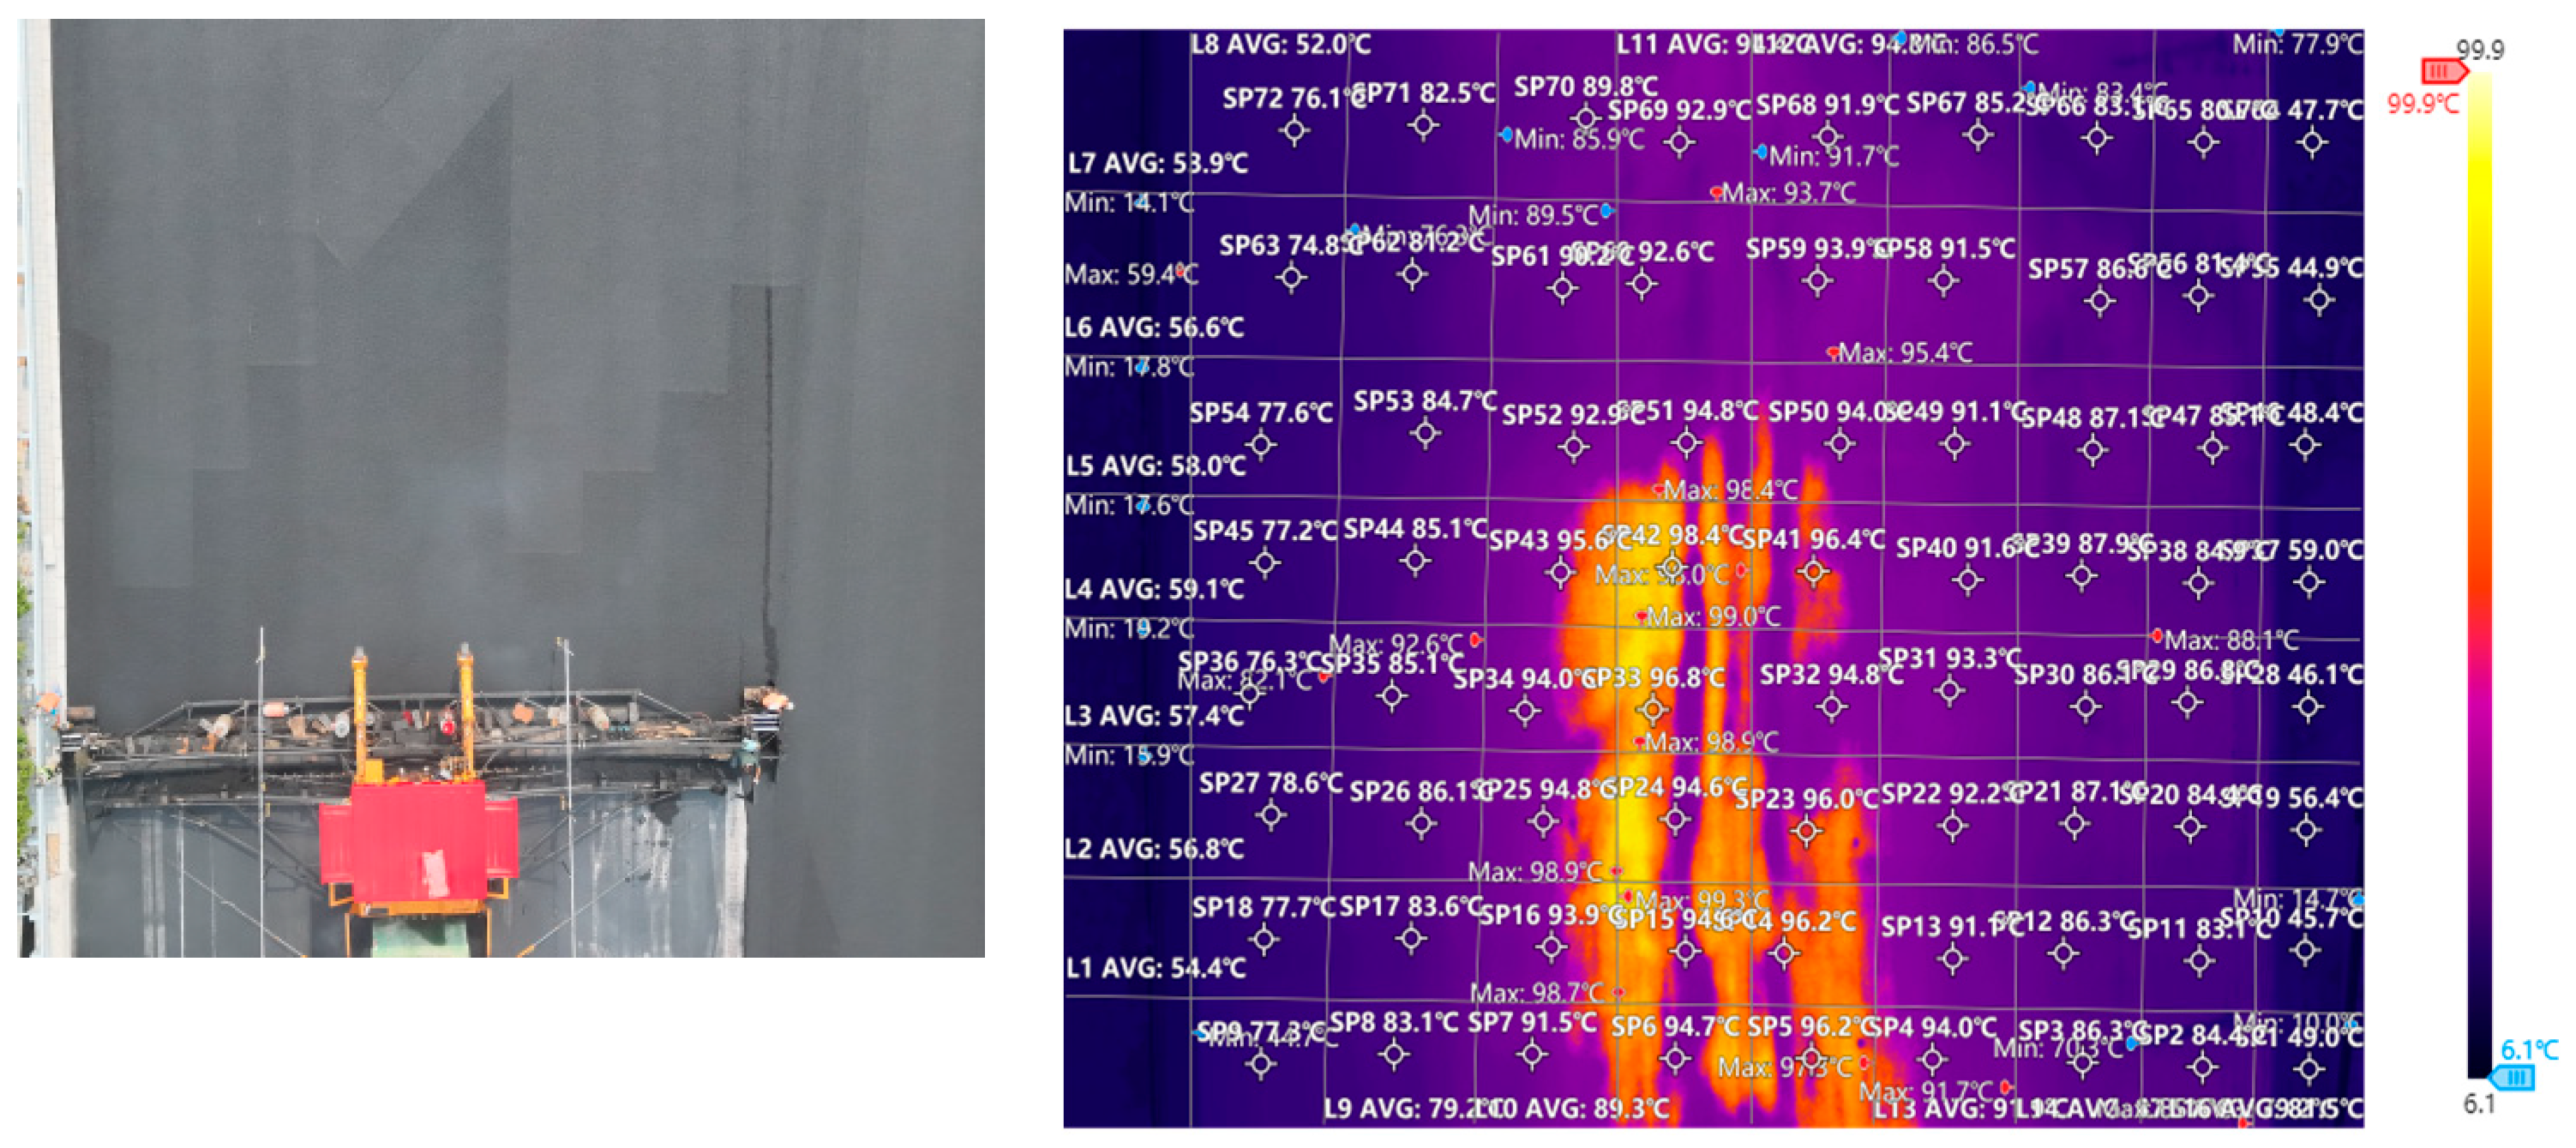
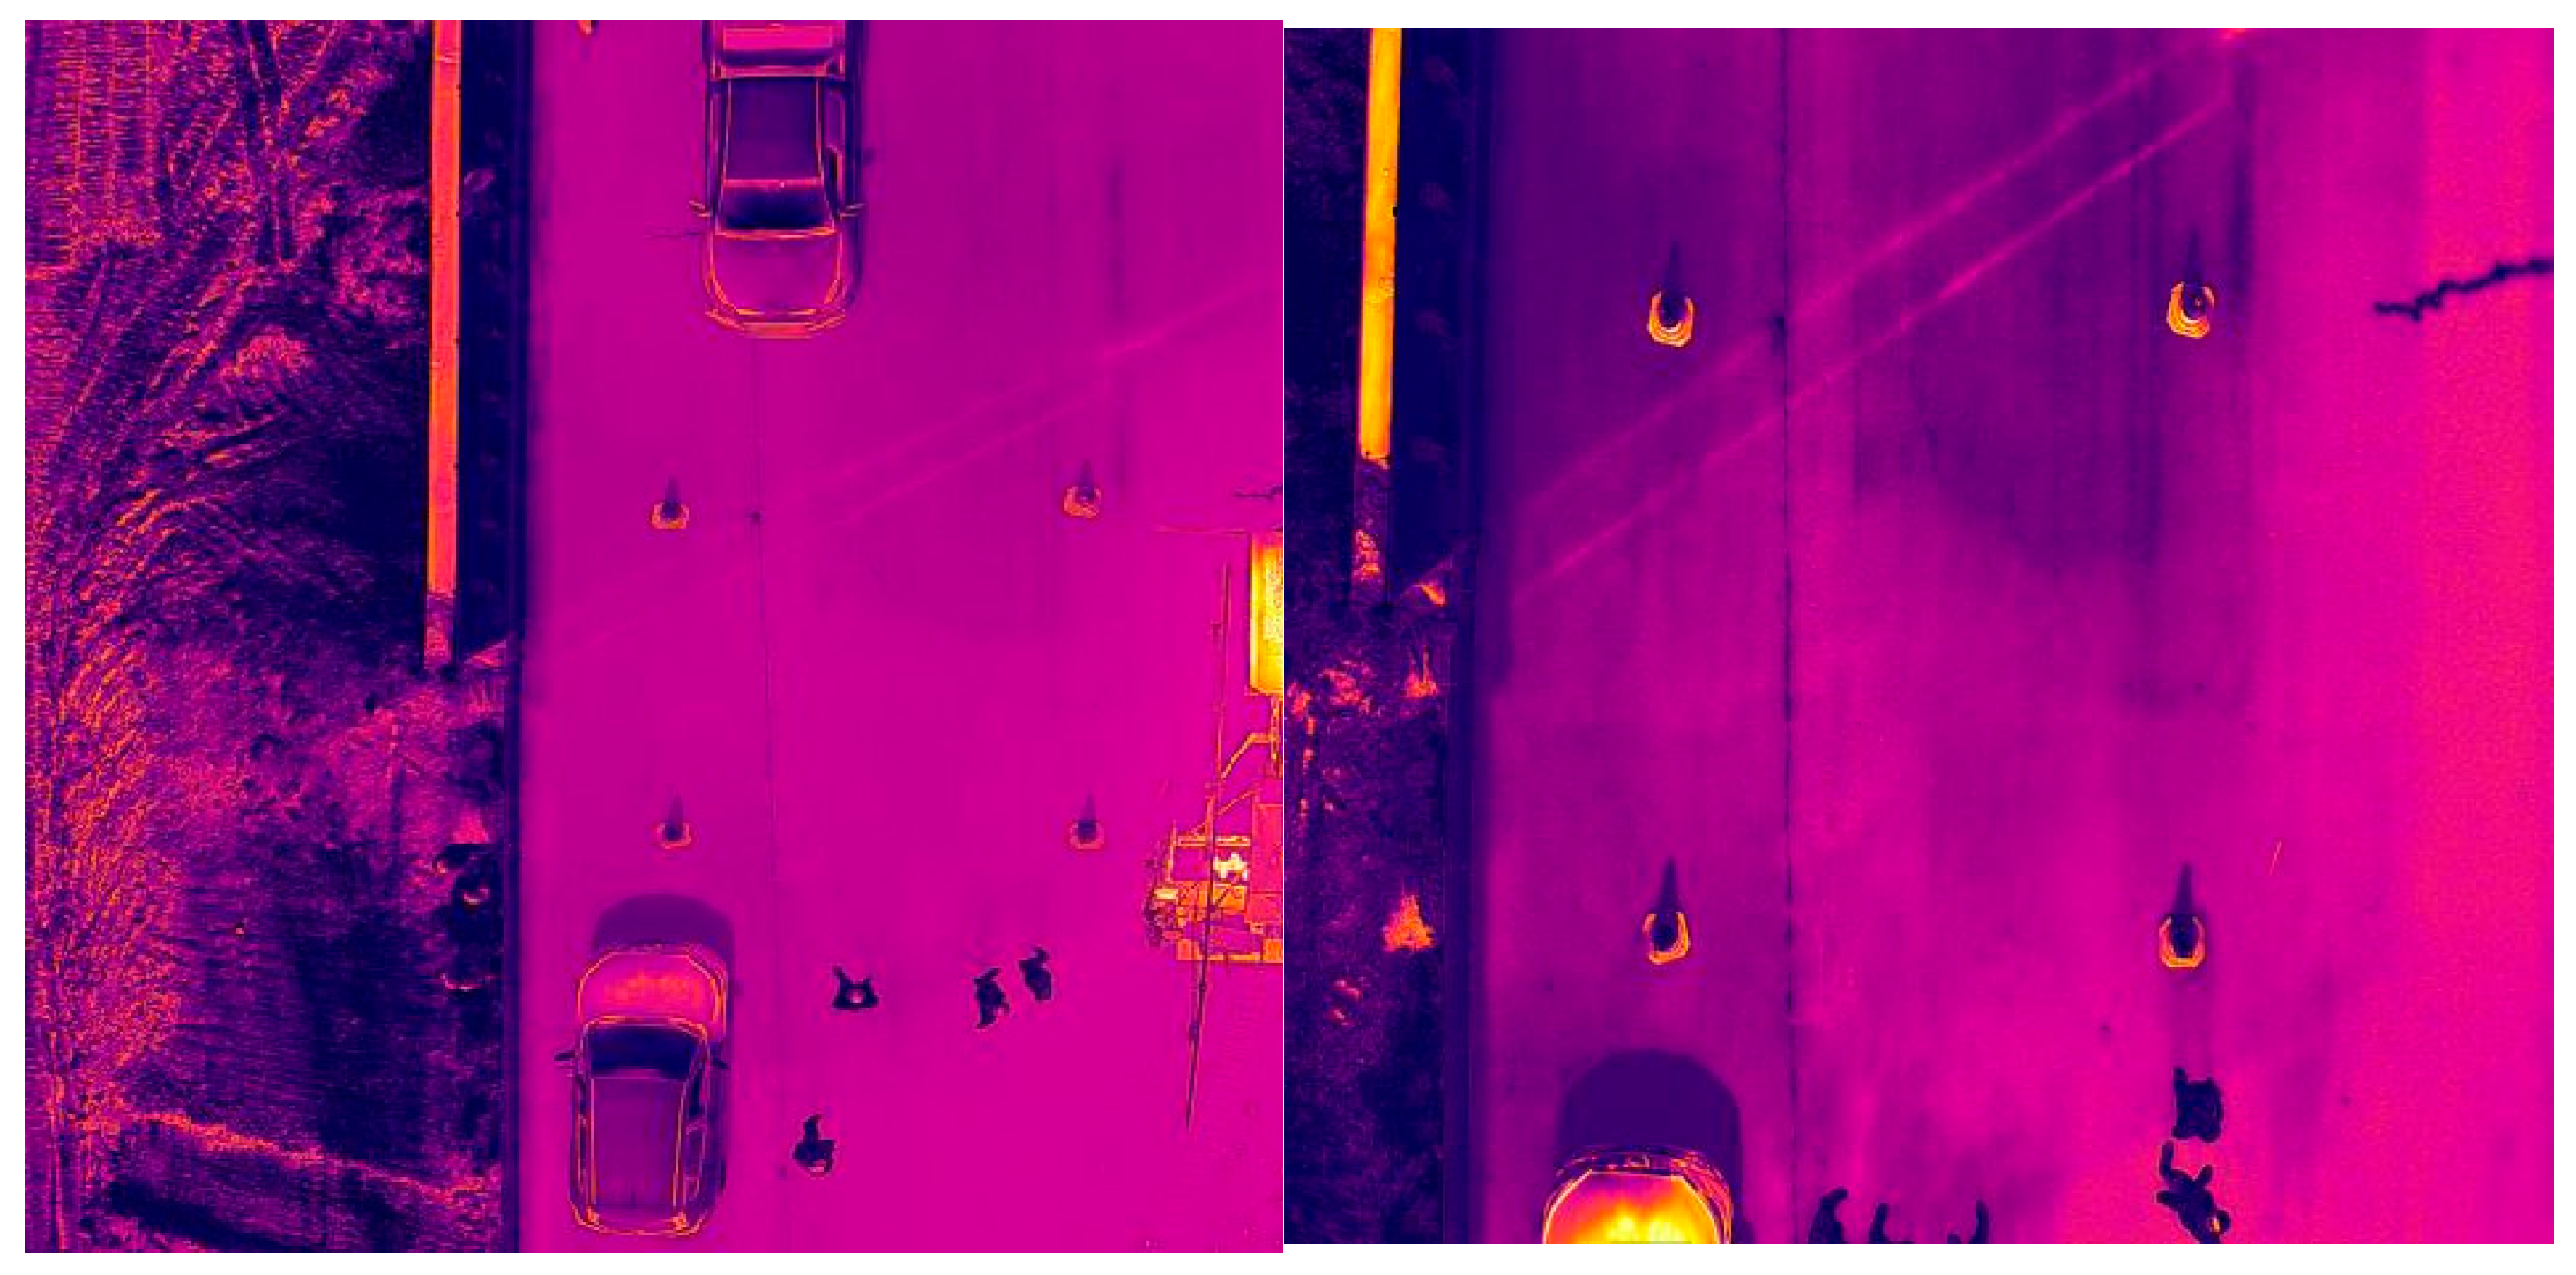
Figure 9, and each curve was fitted with a polynomial function, respectively. The field measurement is shown in
Figure 10.
The systematic evaluation of measurement distance effects provides critical insights for optimizing UAV-based thermal monitoring protocols. The established inverse relationship between flight altitude and measurement accuracy underscores the importance of maintaining operational heights below 5 m to achieve engineering-grade precision (±1 °C). This empirical finding resolves a fundamental practical dilemma in aerial thermography—balancing coverage efficiency with data reliability. The quantitative models enable precise error compensation for scenarios requiring higher-altitude operations, significantly enhancing the method’s adaptability to complex construction environments. Furthermore, the polynomial fitting of temperature distribution curves demonstrates the robust spatial consistency of thermal data, validating its capability to capture meaningful temperature gradients rather than random noise. This study transforms UAV thermography from a qualitative inspection tool into a quantitatively reliable technique for pavement construction control, establishing a scientific basis for standardizing flight parameters in asphalt quality specifications.
a. Equation for the maximum temperature curve:
b. Equation for the curve of minimum temperatures:
c. Equation for the curve of average temperature:
In the formula, is the temperature value and is the measurement height.
As shown in
Figure 8,
Figure 9 and
Figure 11, Analysis of the temperature distribution curves reveals that the average temperature curve closely follows the trend of the maximum temperature curve. Although minor temperature fluctuations were observed across different measurement heights, the temperature difference between adjacent heights did not exceed 1 °C. The maximum temperature remained stable at approximately 35 °C, while the average temperature hovered around 34 °C. In contrast, the minimum temperature curve, despite exhibiting a similar trend, fluctuated around 30 °C.
As the measurement height increases, the inspected area expands, consequently amplifying the influence of environmental factors on the results. Since the measured temperatures are discrete point data, the maximum and minimum temperatures at different heights do not originate from the same physical location. Therefore, the average temperature provides a more objective representation of the actual temperature distribution characteristics.
Within the height range of 7 to 10 m, all temperature curves exhibited remarkable consistency, with measurement variations of less than 1 °C. Furthermore, the infrared temperature measurements showed excellent agreement with a point-and-shoot pyrometer reading of 34.2 °C. Therefore, this height interval is established as the standard measurement range, with 34 °C designated as the baseline value. As measurements obtained outside this range require temperature correction [
23], this range was determined empirically as the optimal operational window. Within this altitude band, the temperature measurements demonstrated high stability (variation < 1 °C) and showed excellent agreement with ground-truth measurements from the handheld infrared thermometer (34.2 °C). Altitudes below this range risk operational safety and reduced coverage, while higher altitudes introduce greater environmental interference and measurement uncertainty.
Based on the analysis of the average temperature data in
Table 5 and the corresponding fitted curve, the data measured within the height intervals of 3–6 m and 10–16 m necessitate correction. The specific correction values are provided in
Table 6.
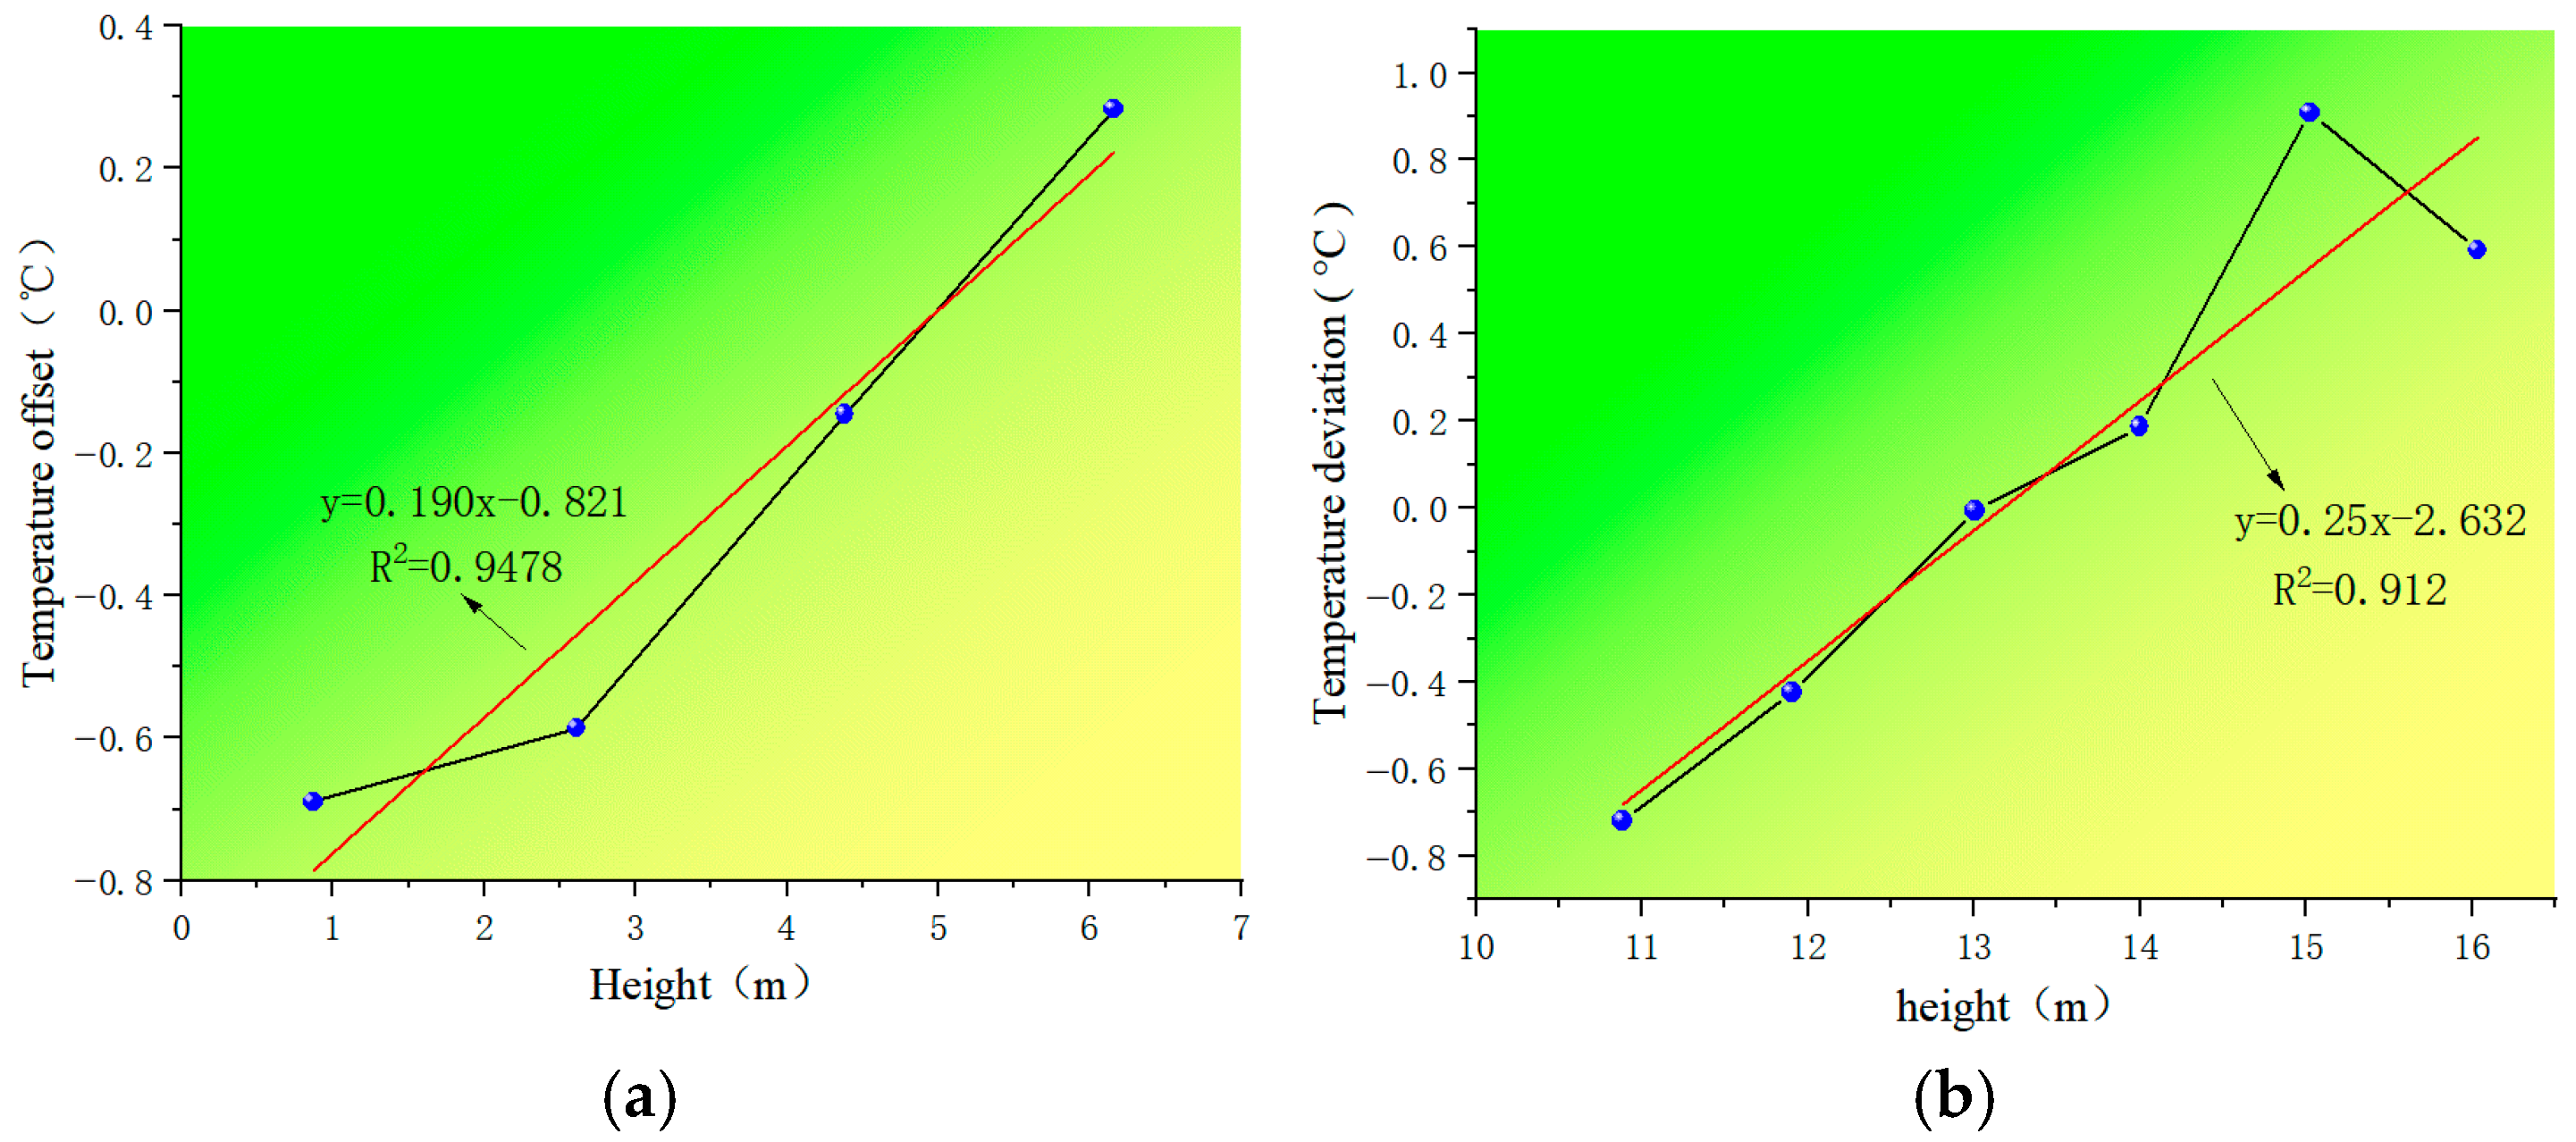
Based on the data in
Table 3,
Table 4,
Table 5 and
Table 6, the deviation curves for the average temperatures at 3–6 m and 11–16 m are plotted in
Figure 12. The formula for the average temperature deviation is as follows:
where y is the temperature deviation value and x is the measurement height.
Based on the two formulas mentioned above, the average temperature deviation can be corrected. Let Q1 be the corrected true temperature value and Q2 be the temperature value measured by the UAV infrared thermal imaging system. The following relationship can be established:
The corrected average temperature values calculated using Equation (13) are presented in
Table 6.
Based on the data in
Table 6, the corrected average temperature profile is illustrated in
Figure 13. The results demonstrate that the corrected values stabilize consistently near 34 °C, thereby validating the reliability of the proposed methodology across varying measurement heights.
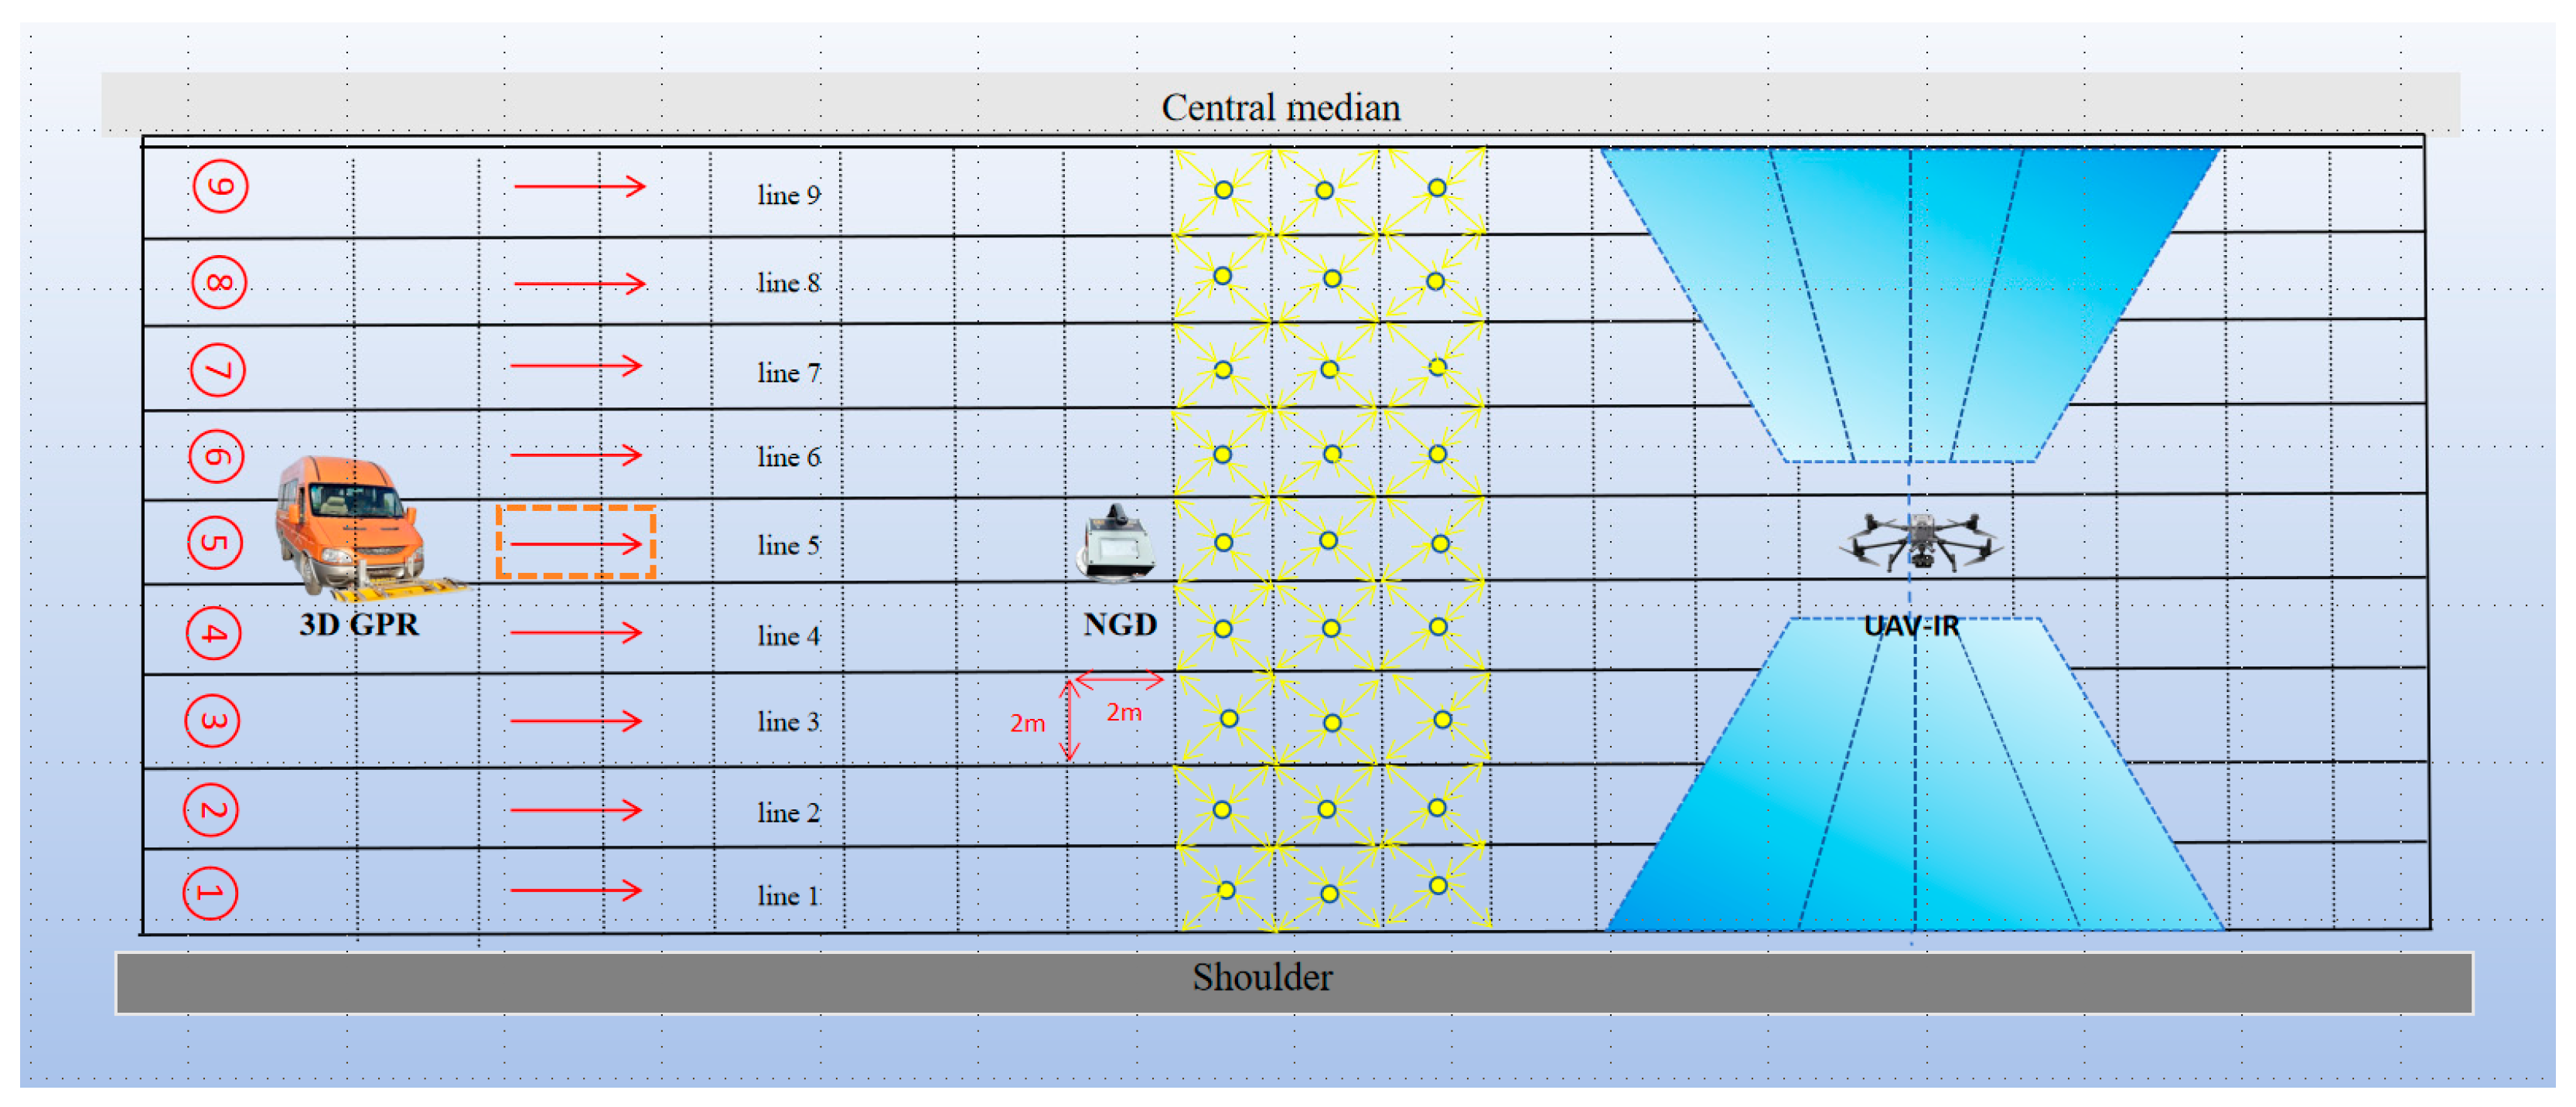
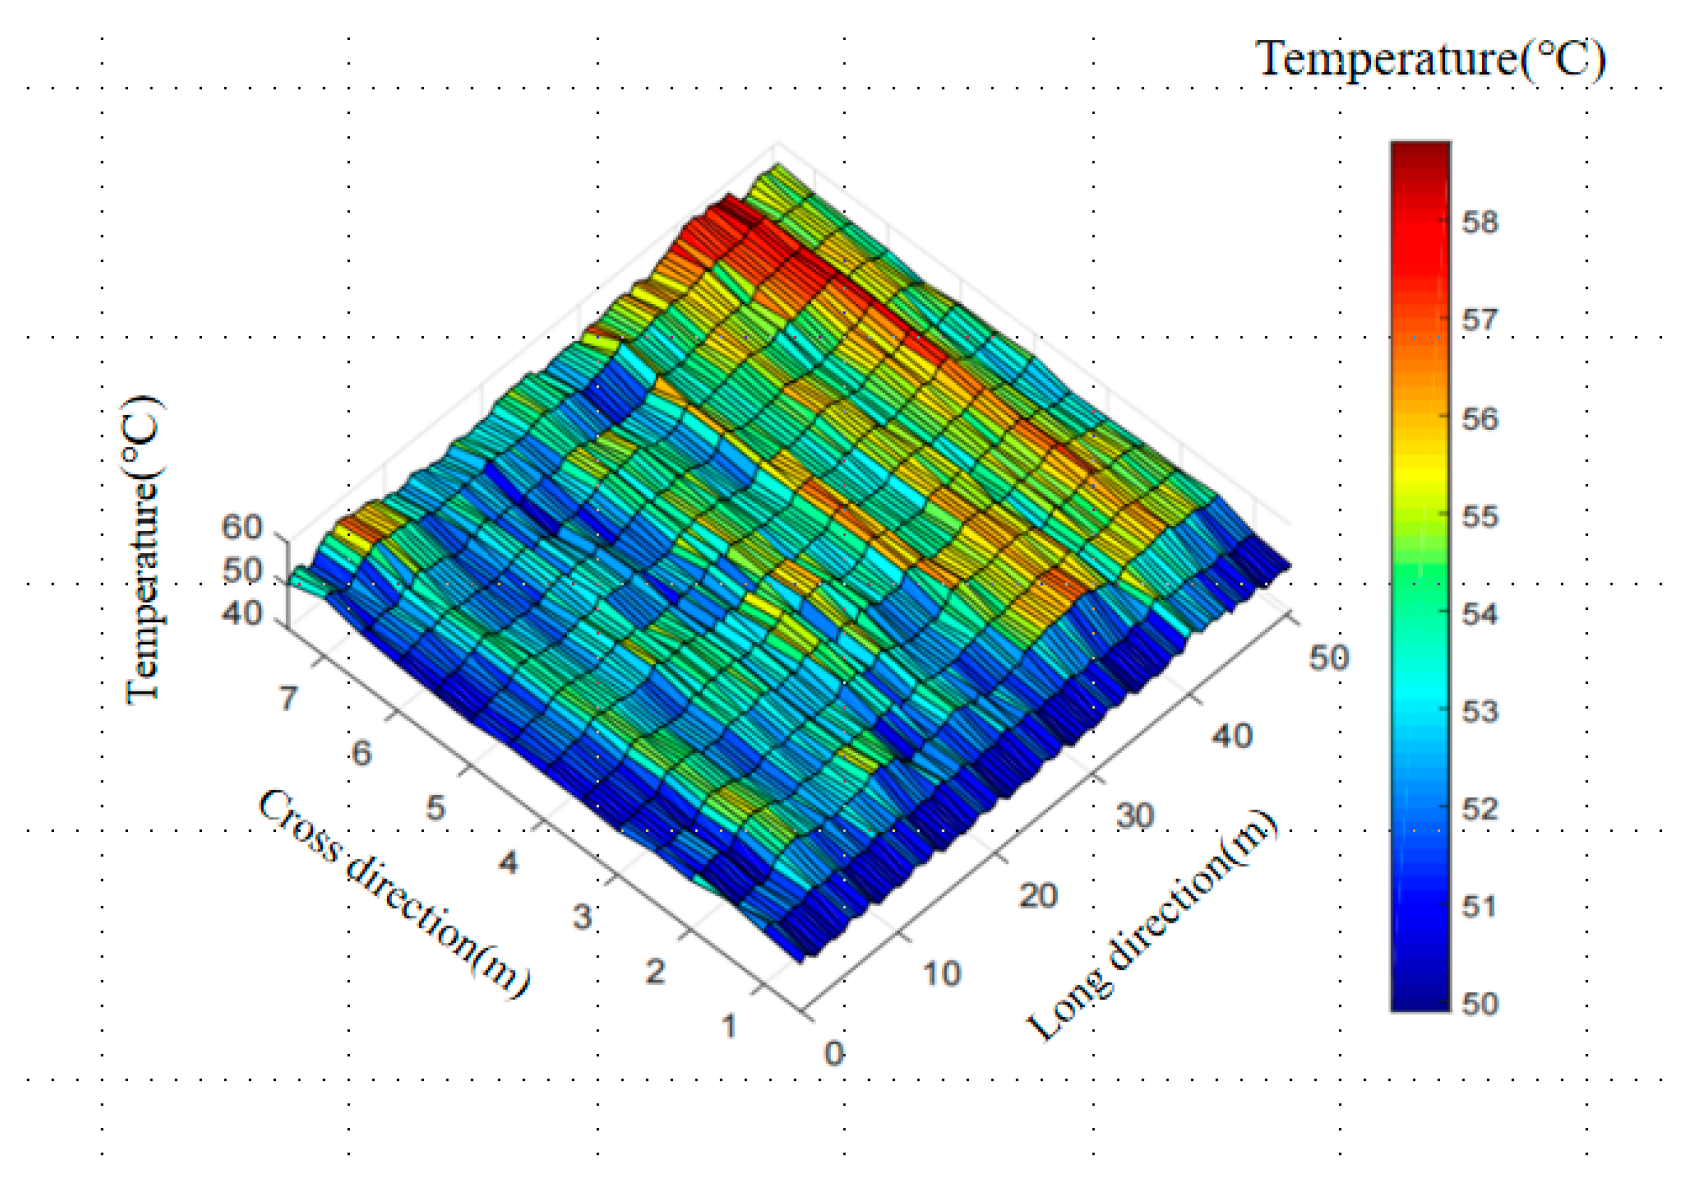
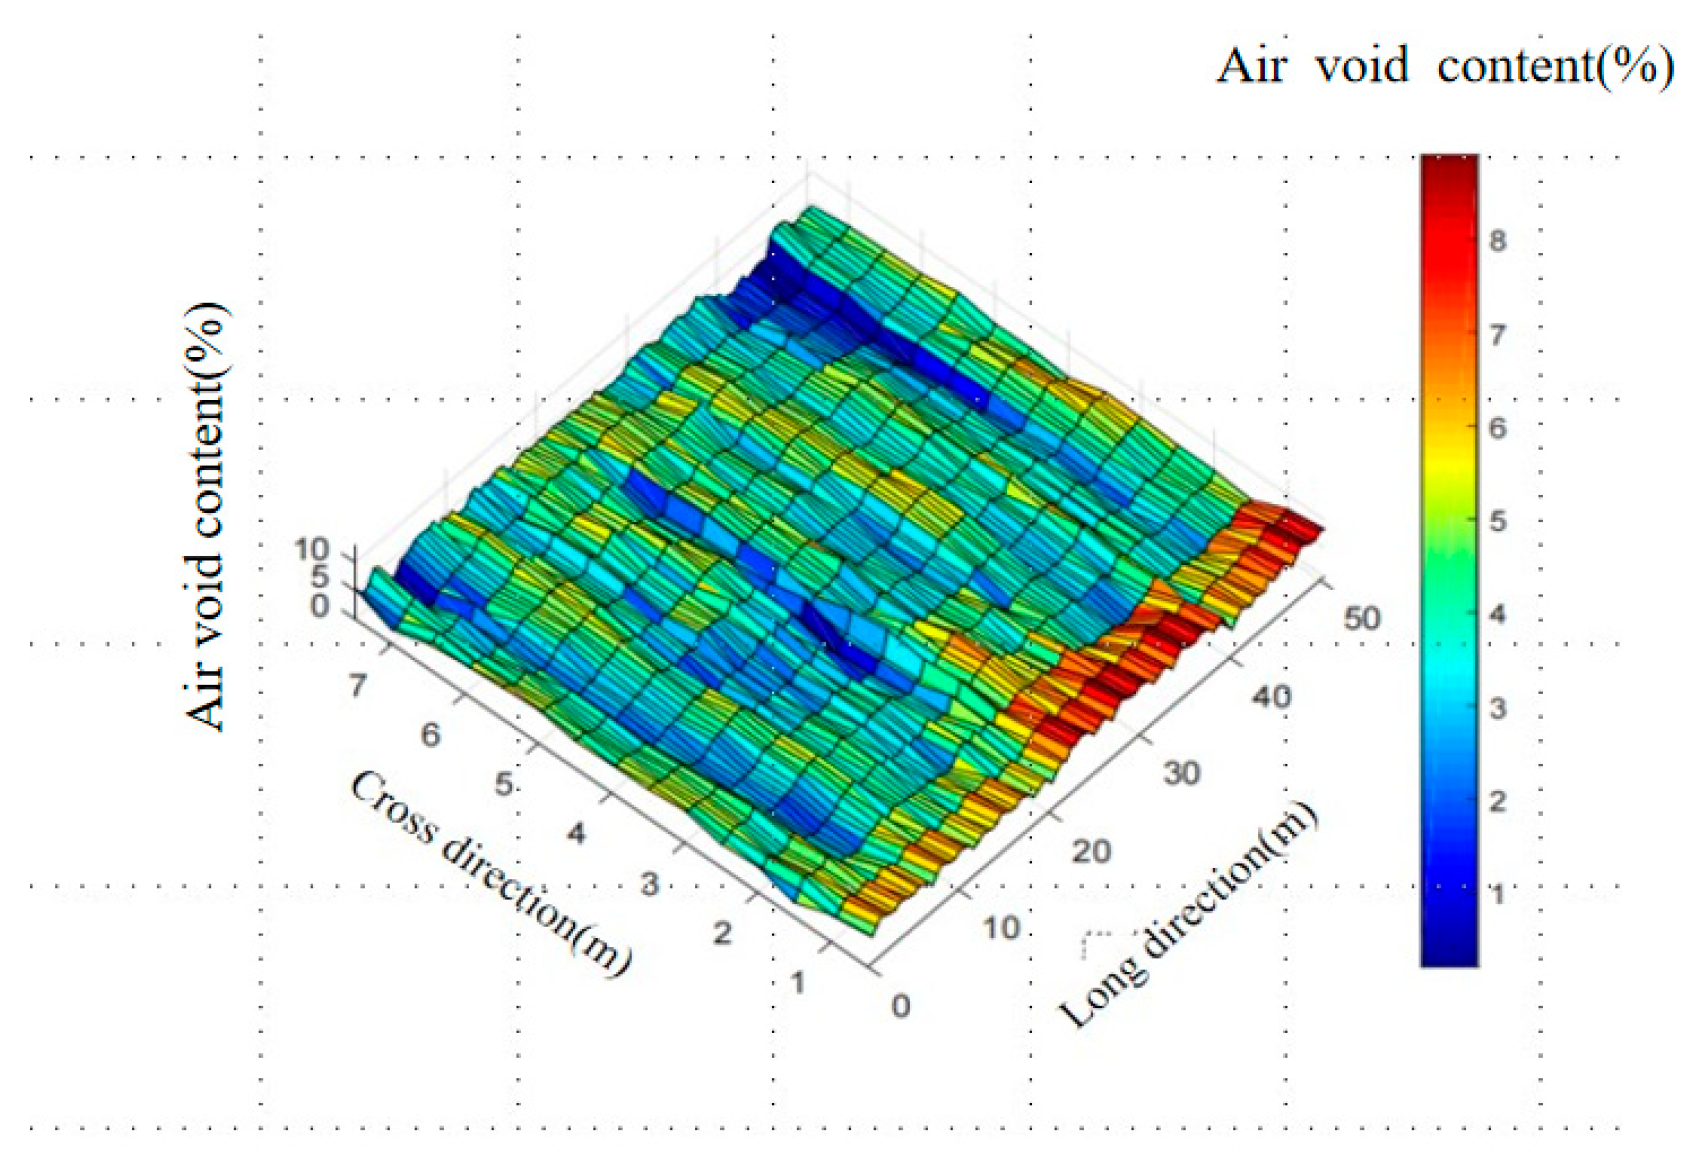
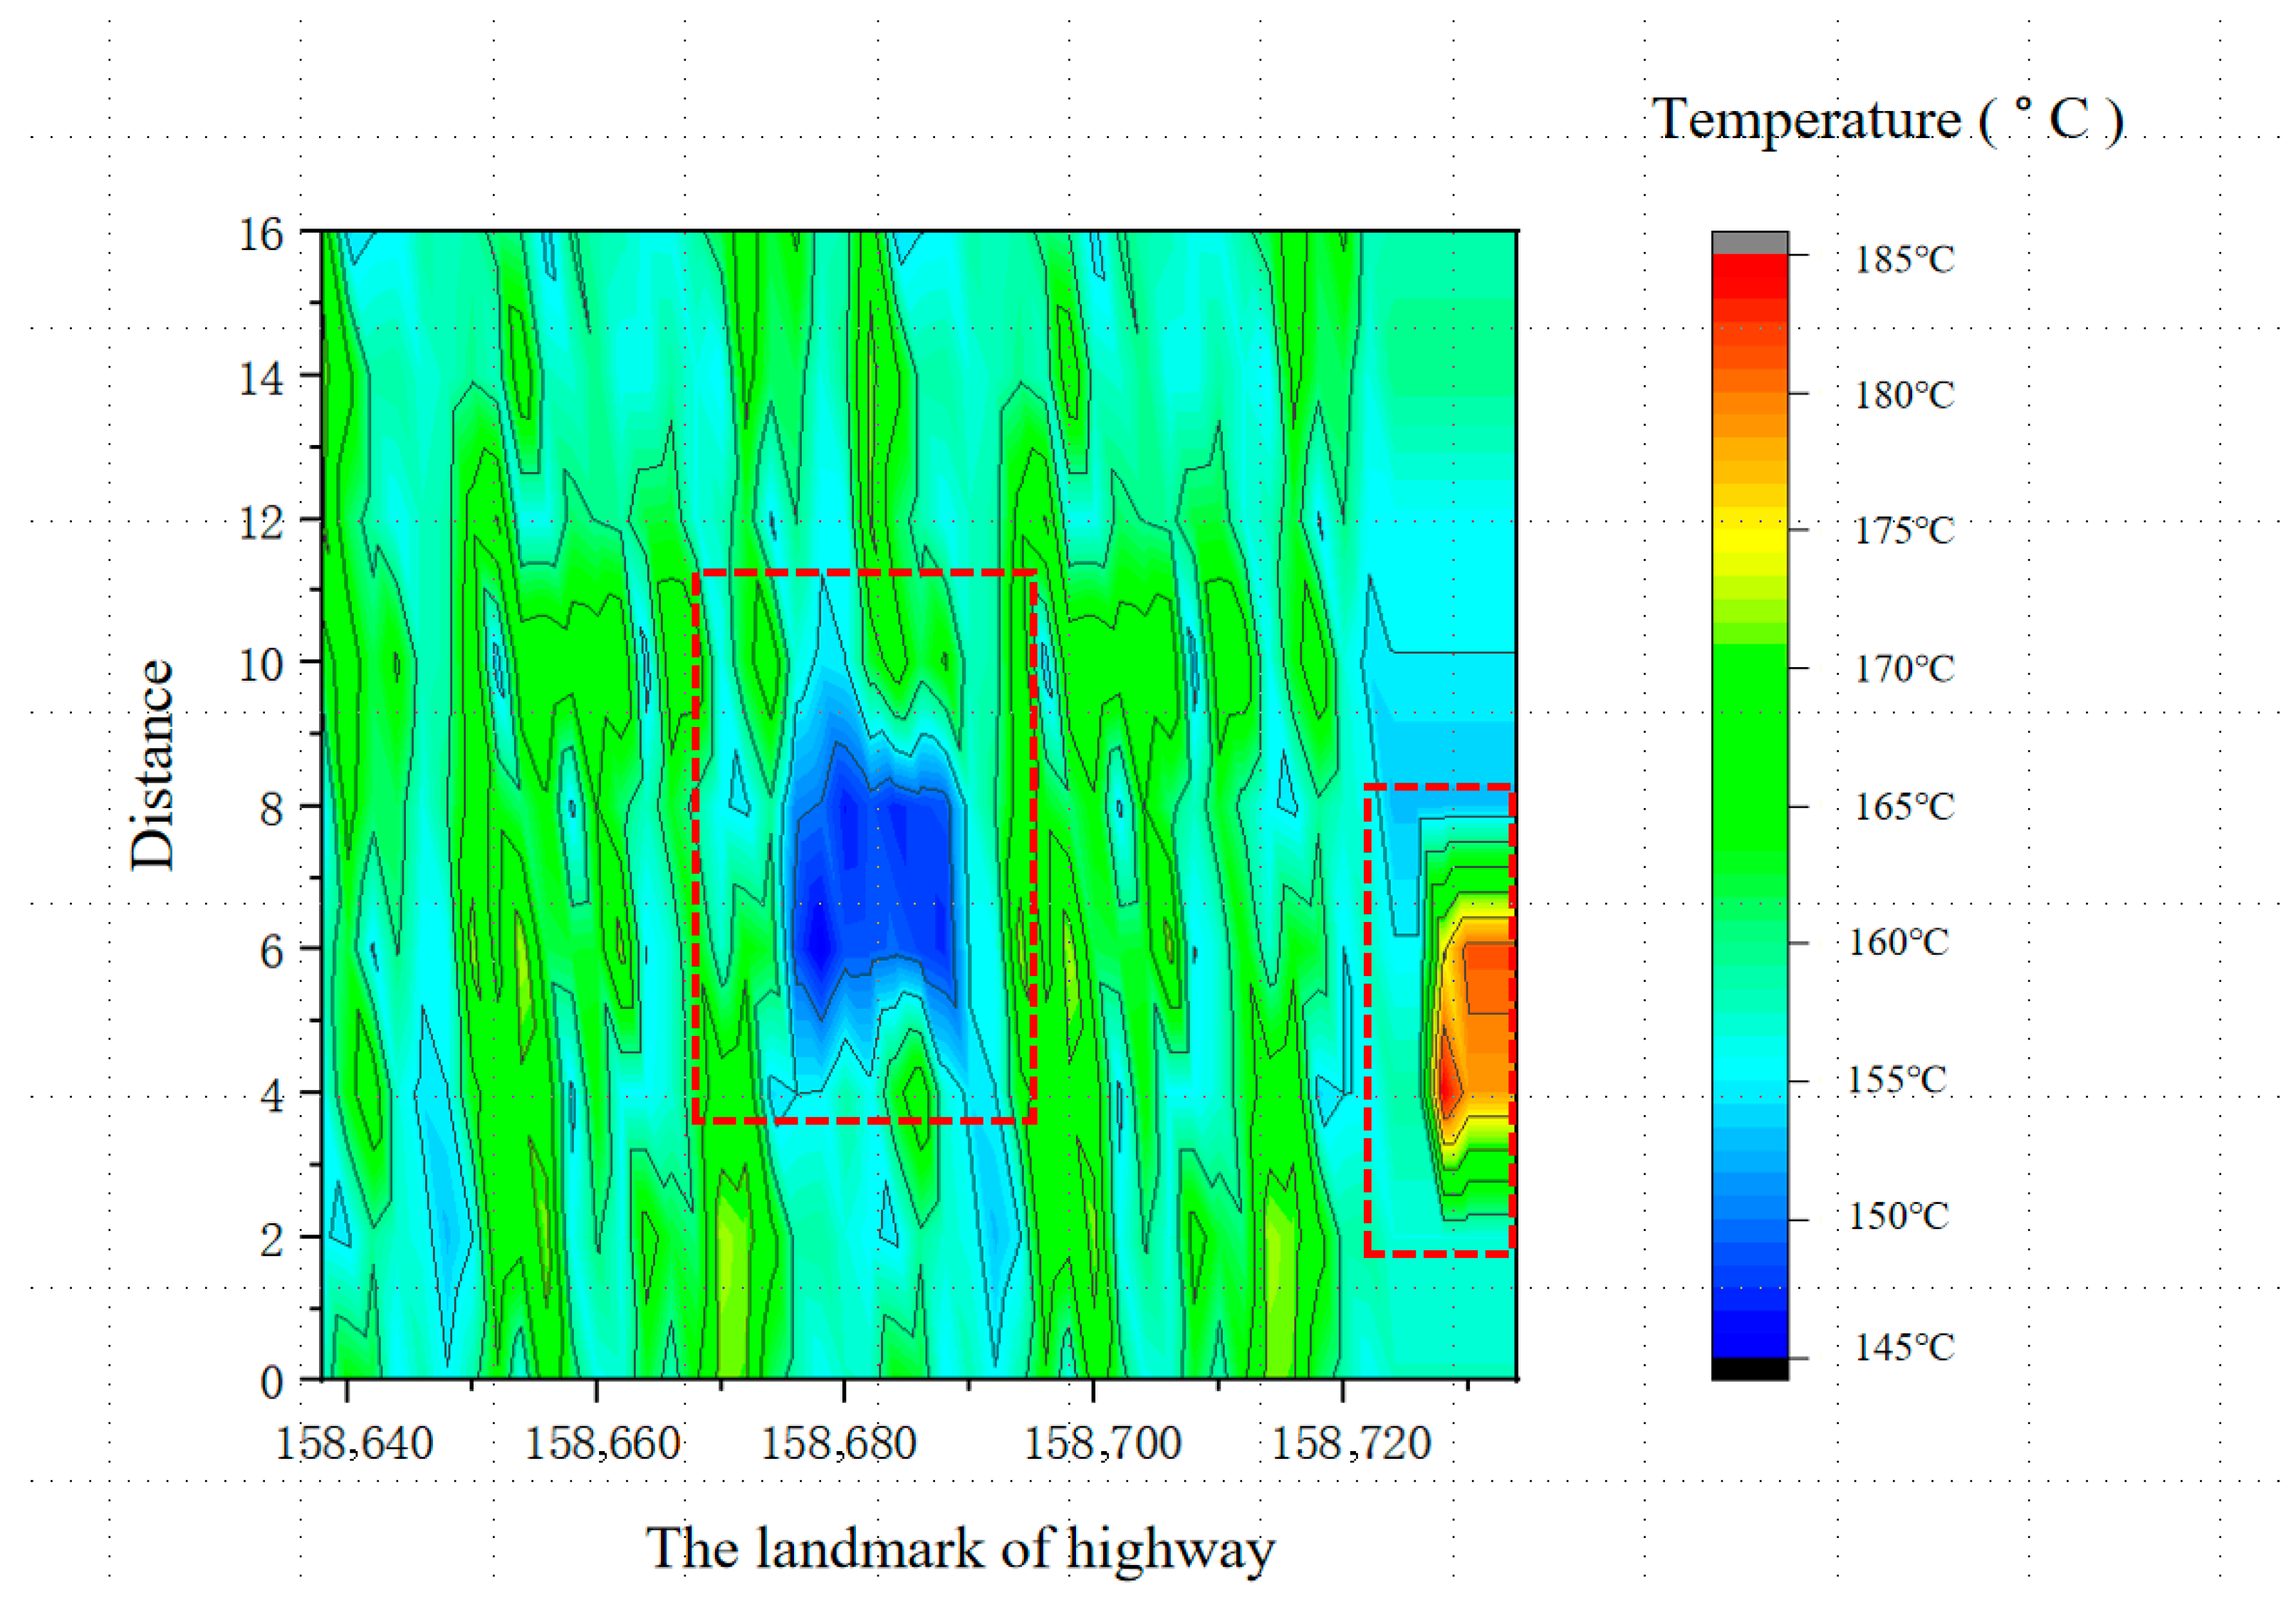
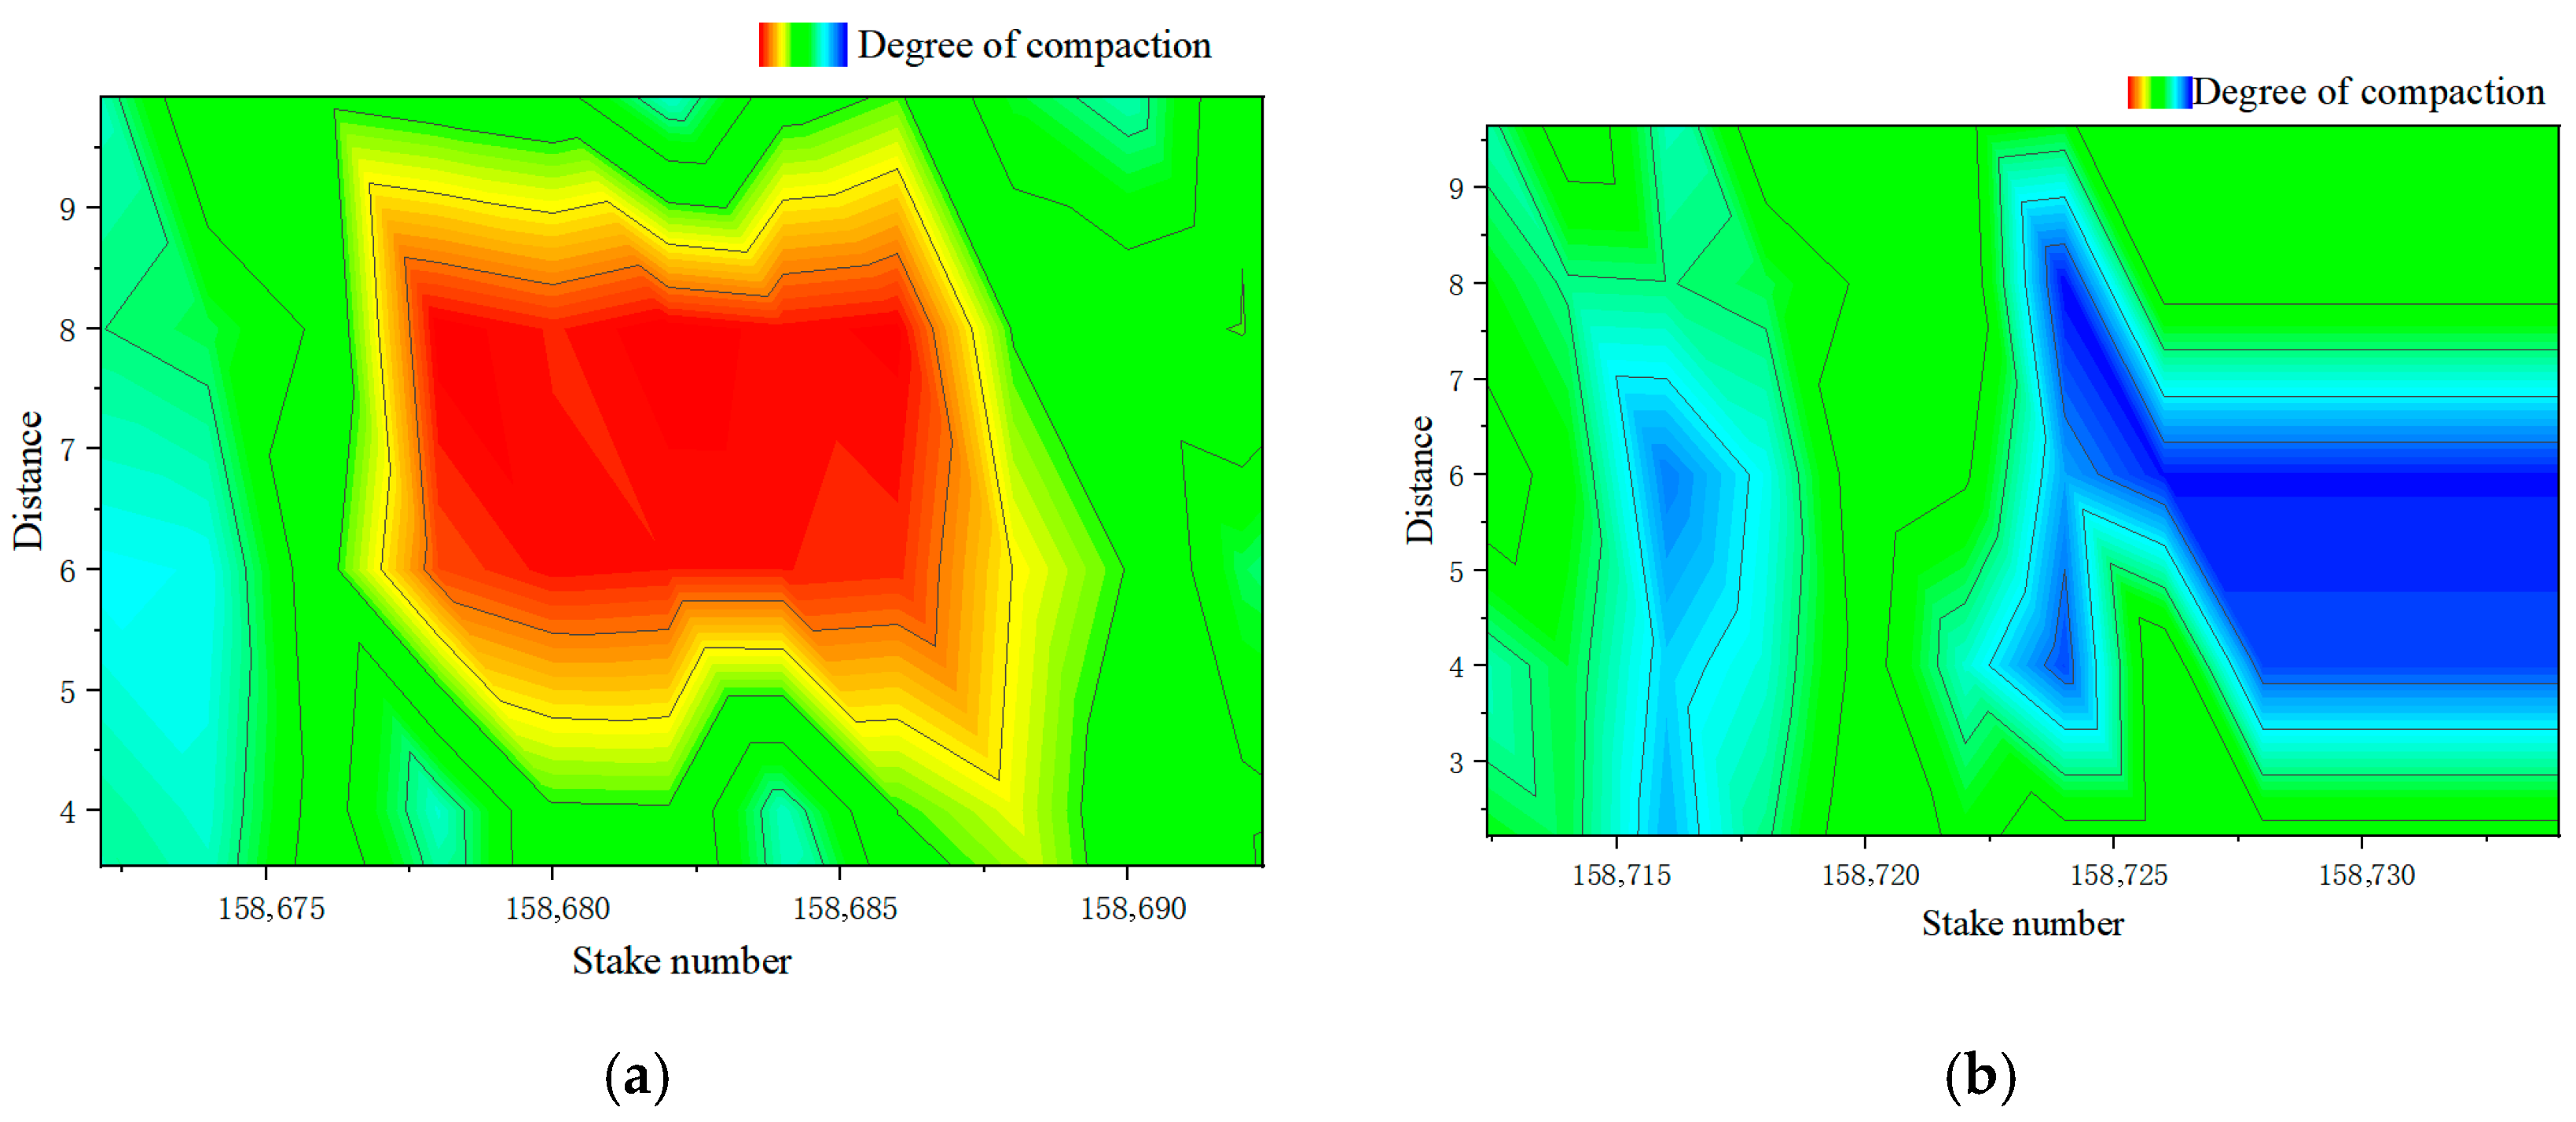
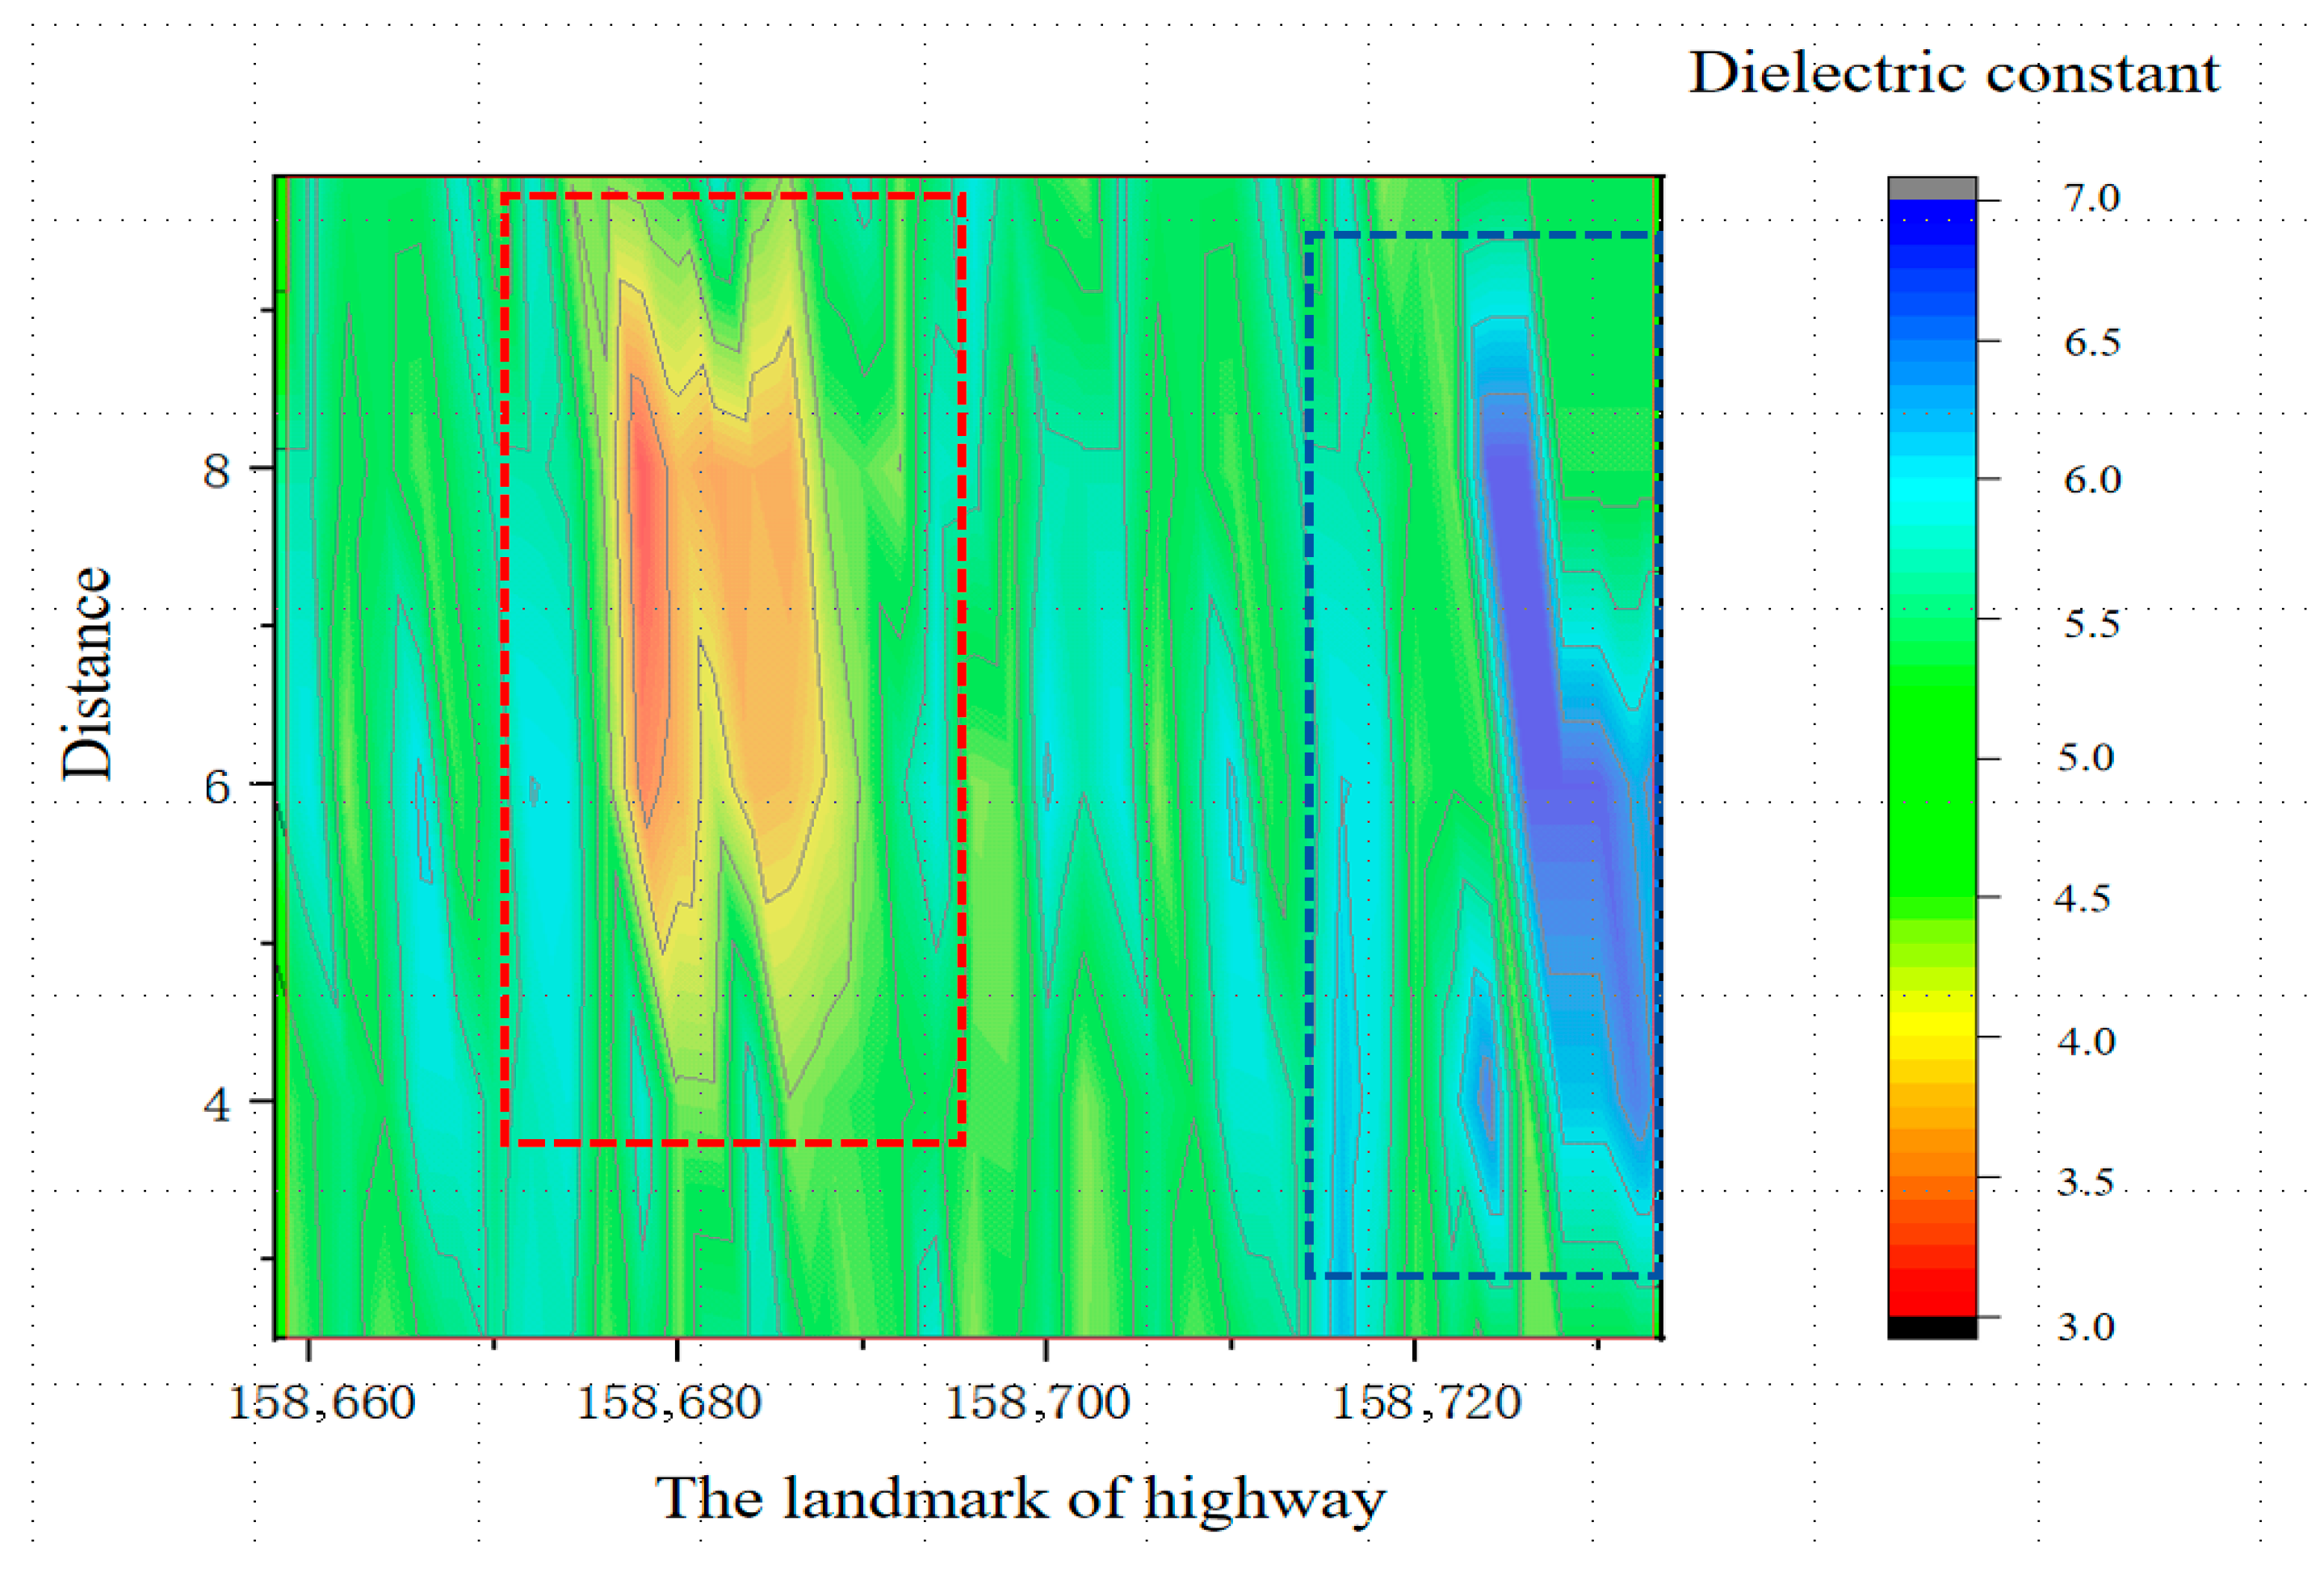
This investigation focused on a newly paved asphalt surface layer within a 50 m × 7.5 m compaction area. Unmanned Aerial Vehicle (UAV) infrared thermal imaging and a non-nuclear density gauge were utilized to simultaneously acquire temperature and air void distribution data. The three-dimensional distribution characteristics, presented in
Figure 14 and
Figure 15, reveal considerable longitudinal temperature variability, indicative of significant construction segregation. Analysis further identified a negative correlation between temperature differential and air void differential, implying that the rate of air void increase diminishes with rising temperature [
24].
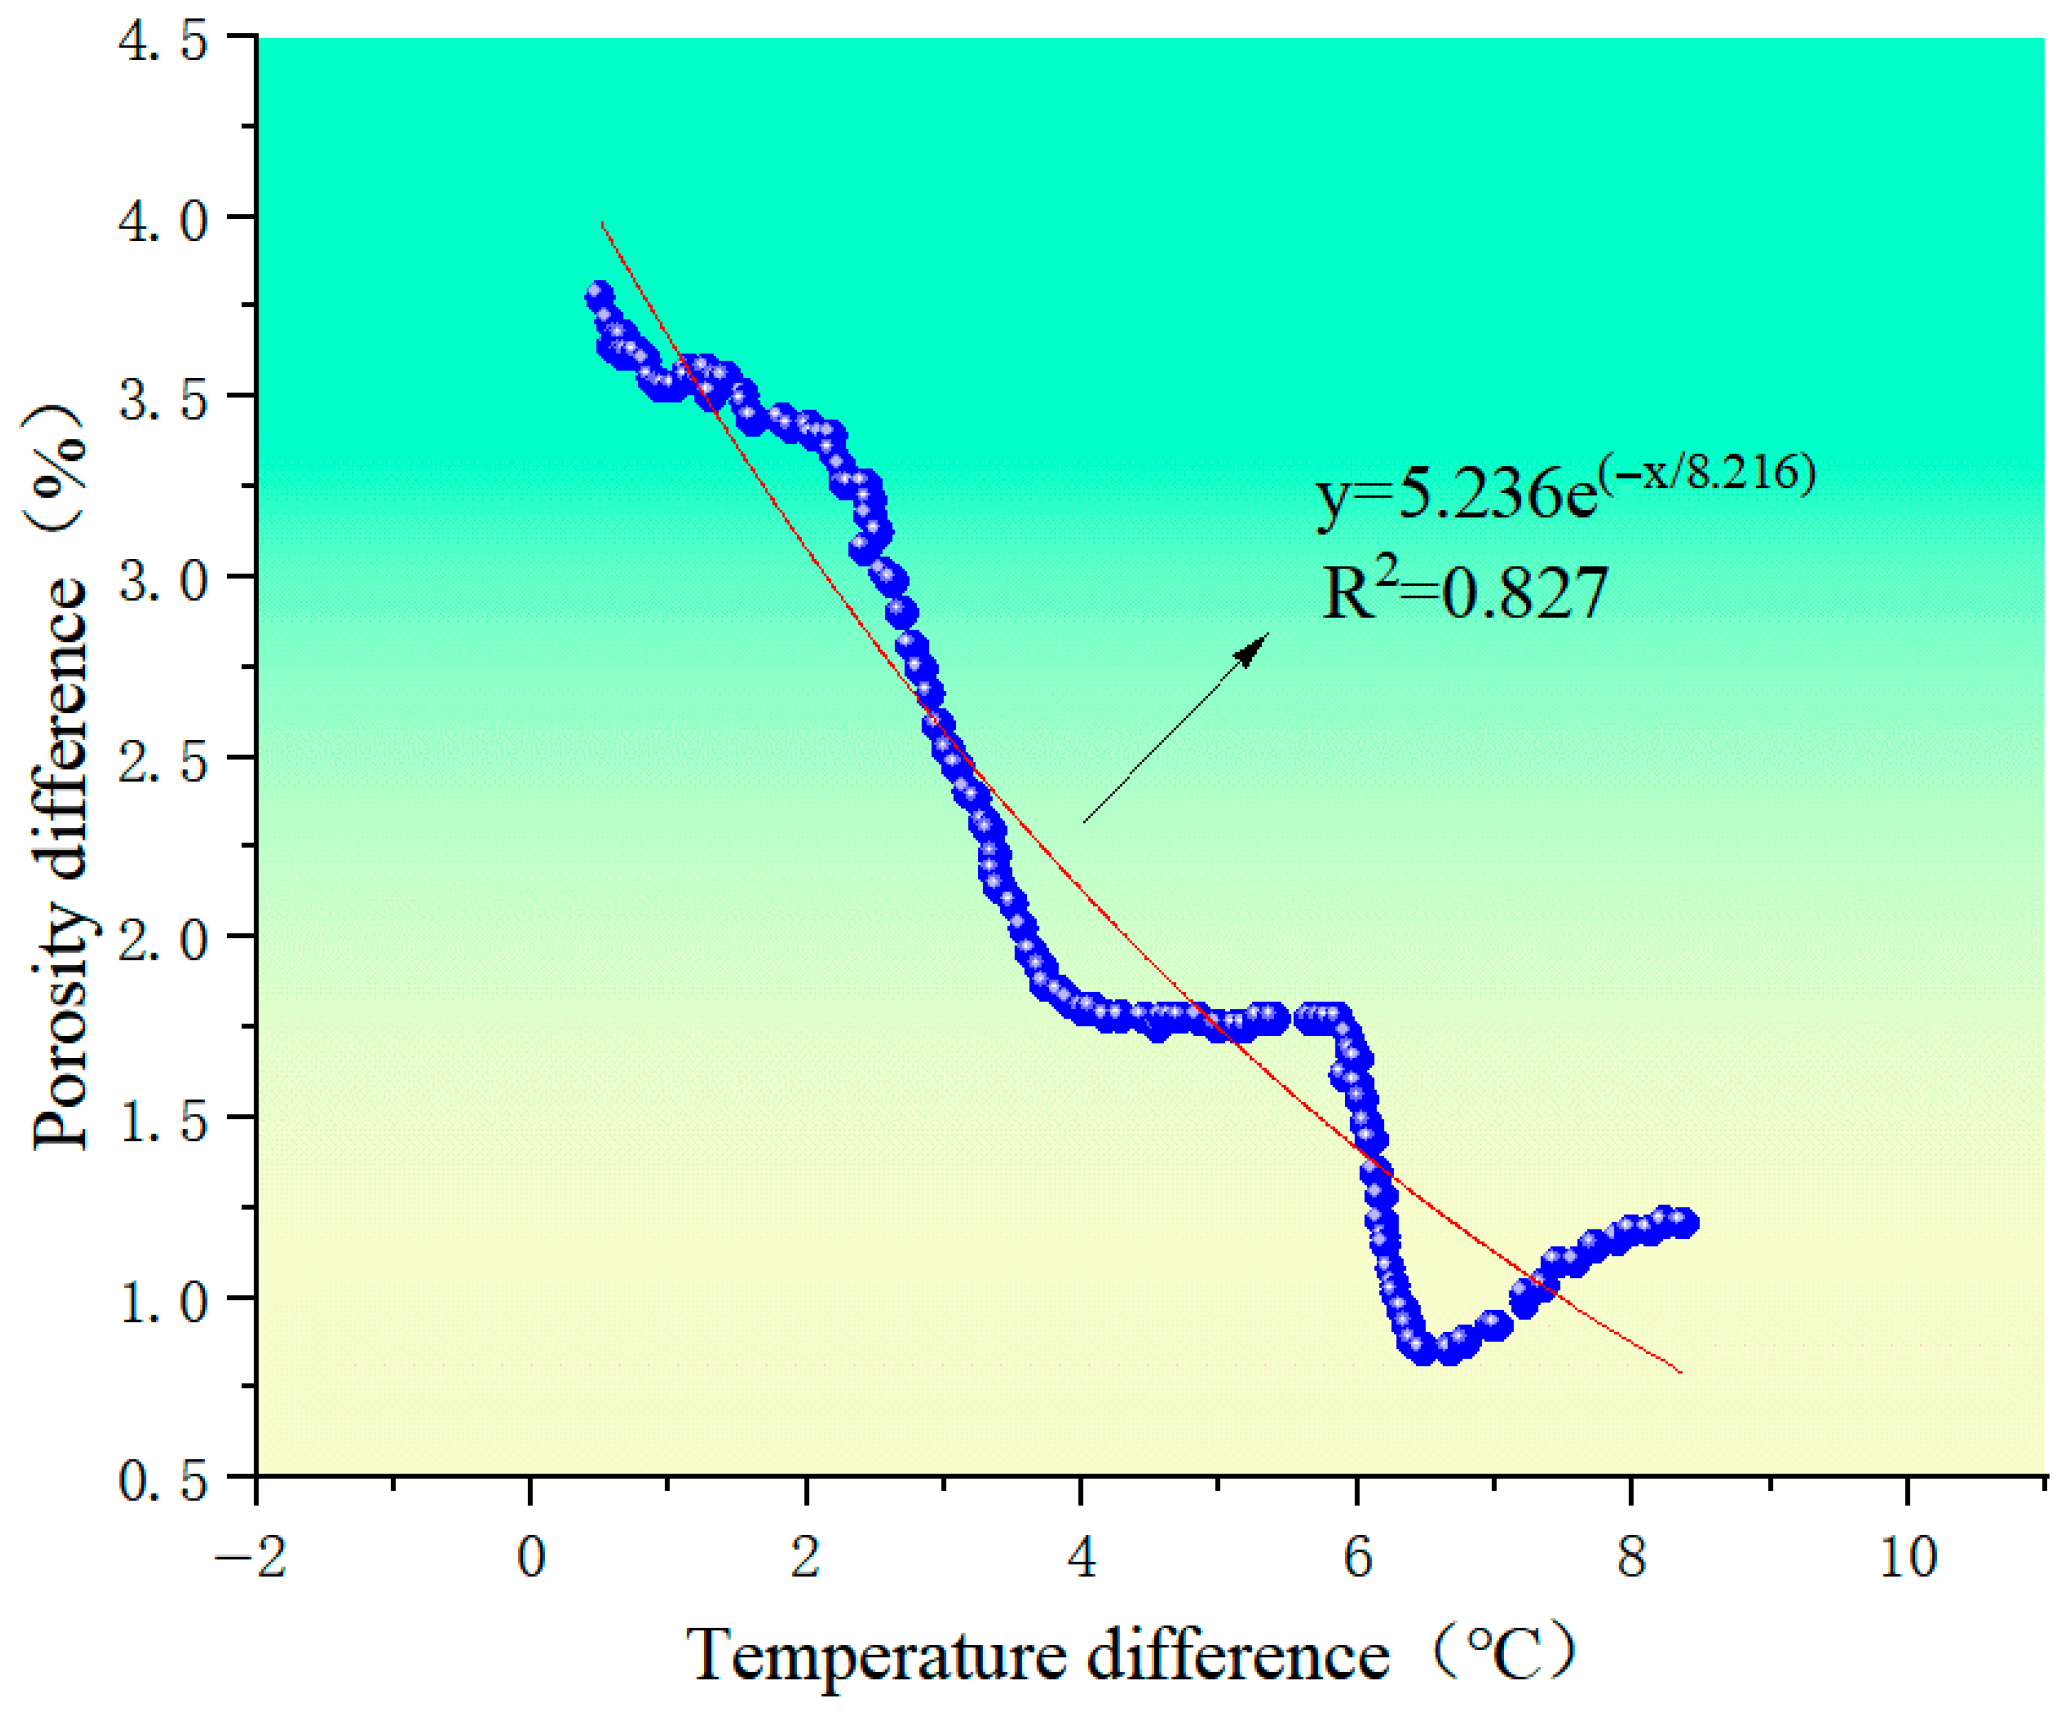
The relationship curve between the measured deviations from the mean values was plotted (
Figure 16), exhibiting a strong correlation between temperature difference and air void difference, with a coefficient of determination (R
2) of 0.827. Consequently, an evaluation criterion for temperature segregation based on air void variation (
Table 7) and a predictive model (
) were developed. These findings provide a quantitative foundation for enhancing construction quality control.
This study established an evaluation criterion specifically for AC-20 asphalt mixture. Compared to the NCAT temperature segregation standard, the proposed criterion features a narrower acceptable temperature range and accounts for more gradual air void fluctuations, which align with the typical temperature variations observed during AC-20 construction. This method is well-suited for assessing compaction quality and construction uniformity for this specific mixture [
25].
4.2. Dielectric Constant Value Method of Asphalt Pavement
As shown in
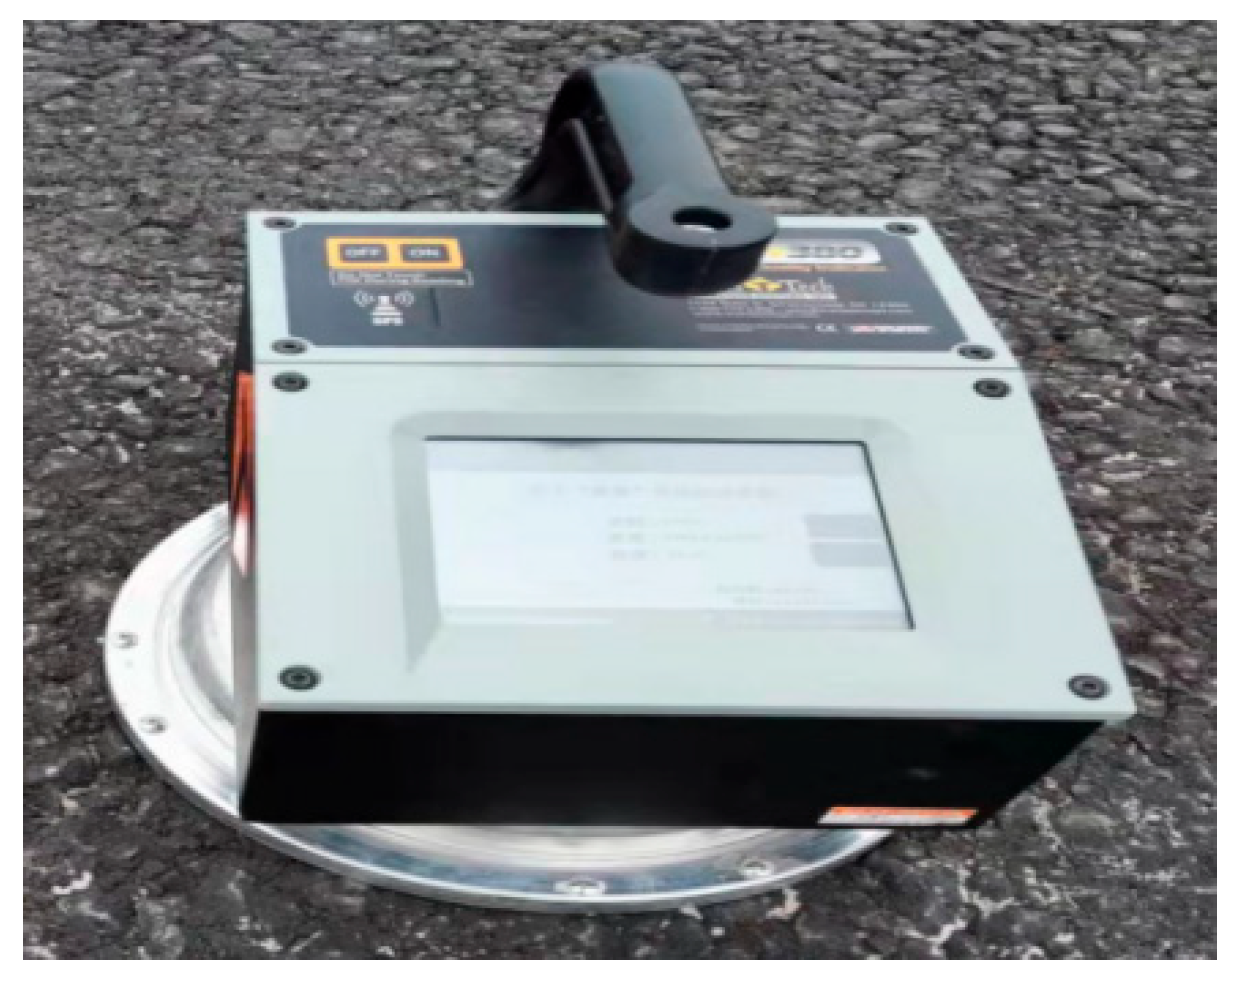
Table 8. Comparative experimental results indicate that the measurements from the non-nuclear density gauge exhibit good agreement with the densities obtained from the core-drilling method (relative error < 3%). Moreover, the non-nuclear density gauge employs a non-destructive testing technique, which avoids the damage to the pavement structure inherent in the traditional coring approach. Furthermore, the device is operationally simple, requiring only a single operator, and offers high detection efficiency with a measurement time of less than 30 s per point, making it particularly suitable for large-scale engineering applications. More importantly, the non-nuclear density gauge enables continuous full-profile pavement detection, allowing for the rapid acquisition of spatially representative density distribution data [
26].
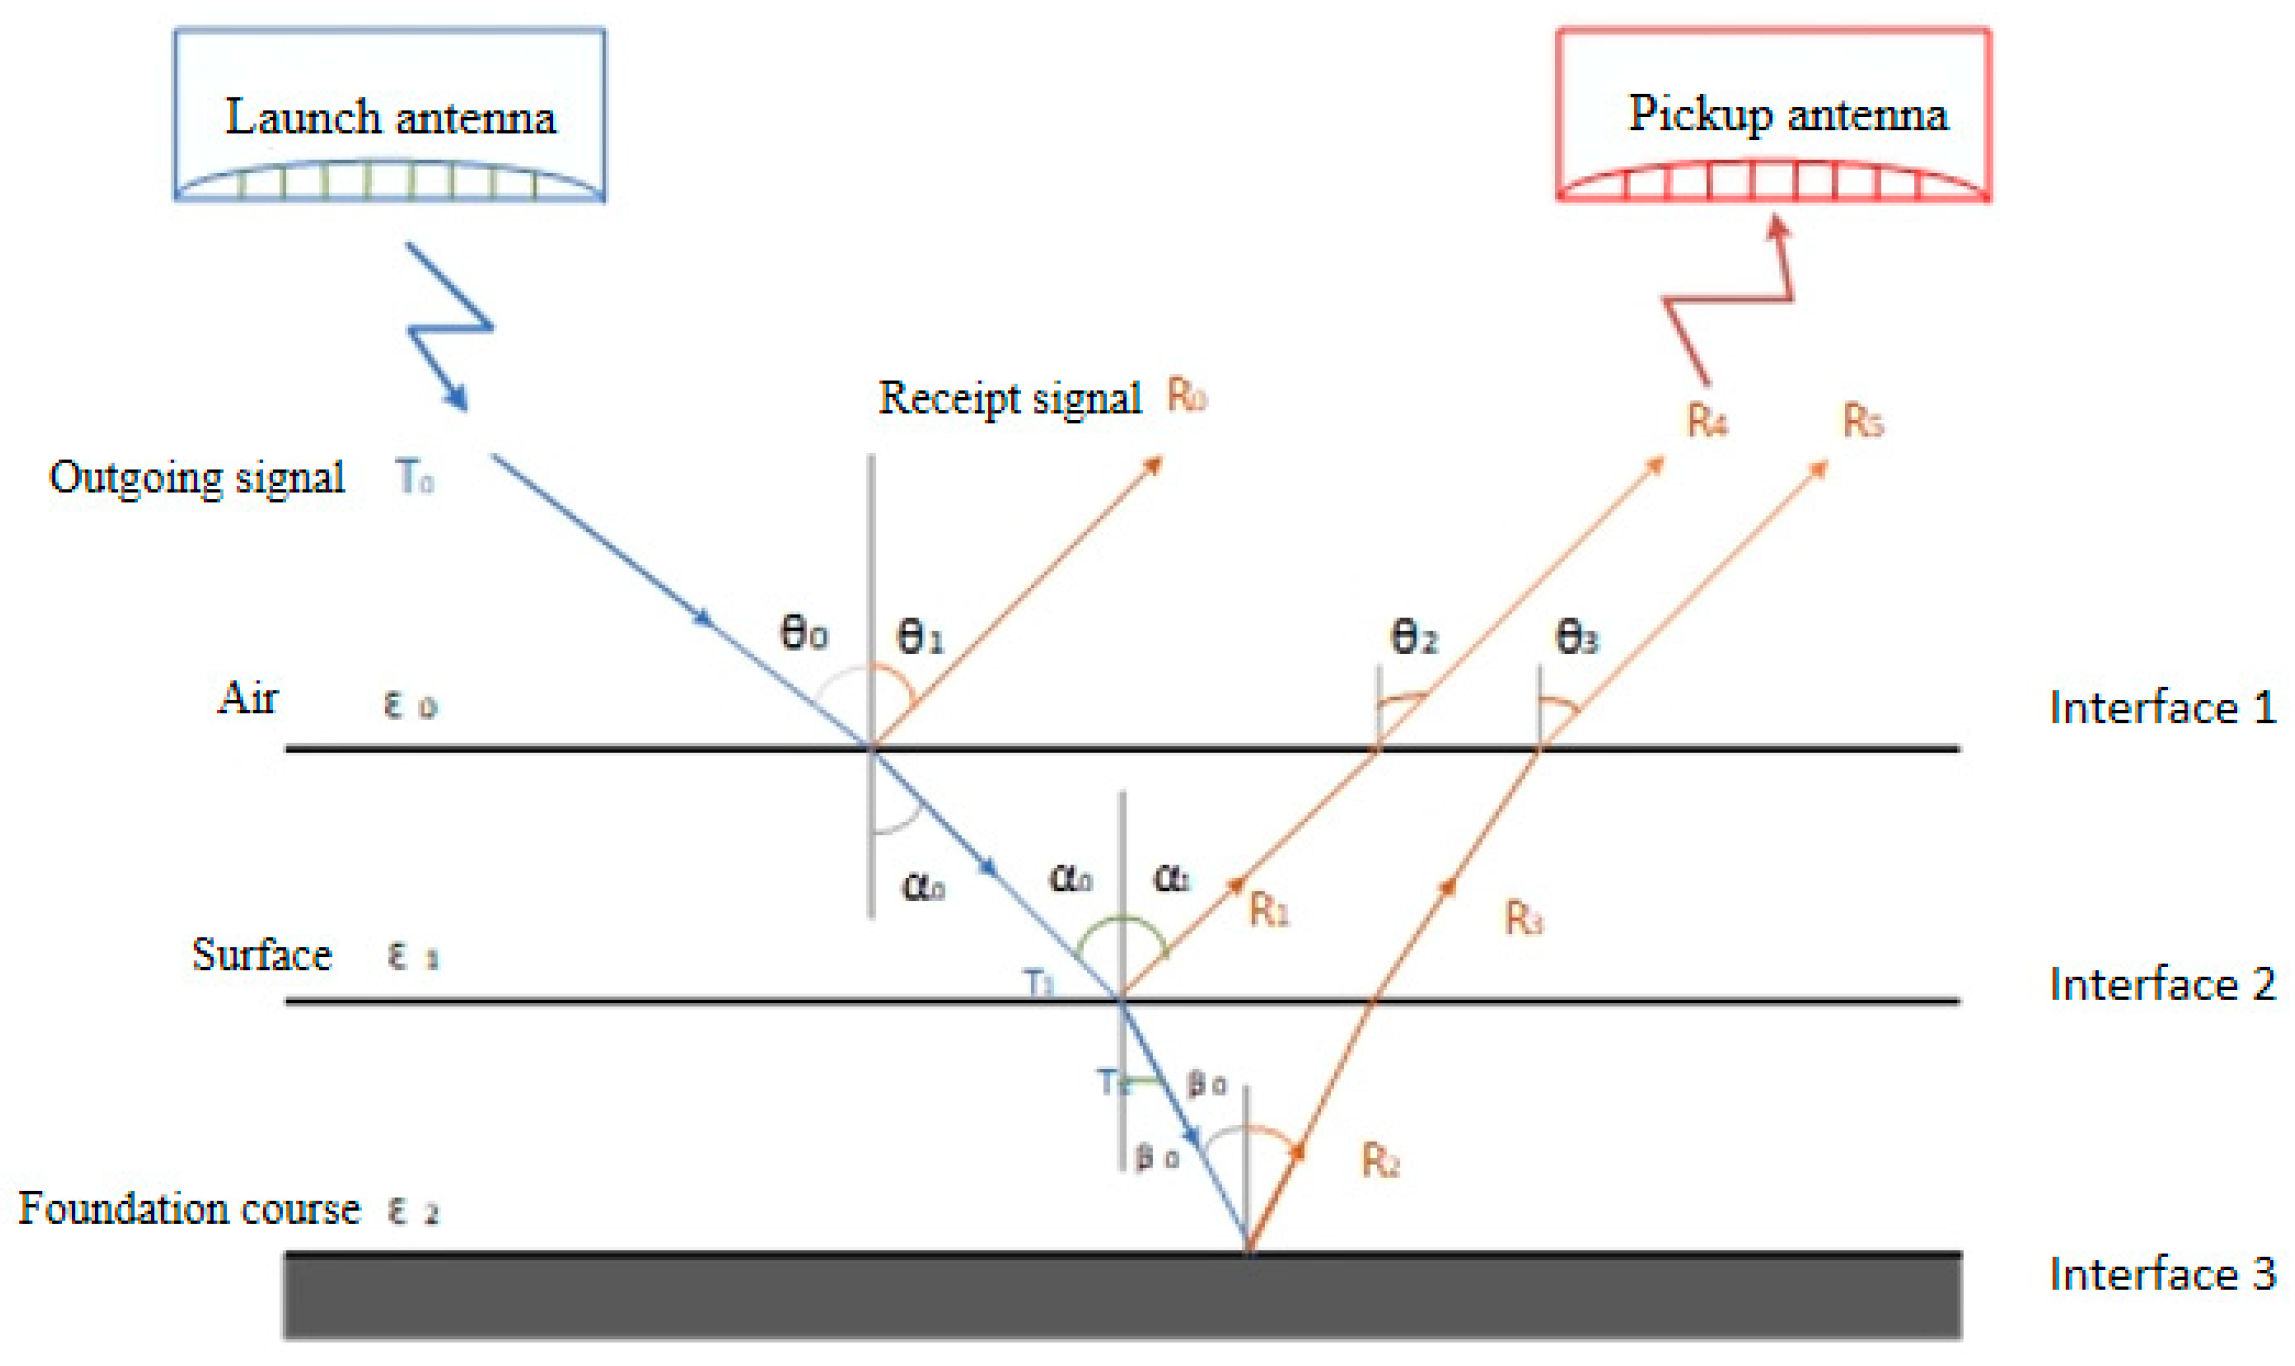
The dielectric constant of the asphalt mixture was calculated using the amplitude total reflection method. The results for the dielectric constant at the coring locations are presented in
Table 9. This method demonstrated a significant correlation (R
2 > 0.95) with the measurements obtained from the traditional coring method. Compared to the coring method, the total reflection method enables non-destructive and rapid detection of the pavement dielectric constant, increasing detection efficiency by over 90%. Furthermore, it provides 100% continuous coverage of dielectric constant data, overcoming the spatial limitations inherent in discrete sampling. A conversion model established based on 30 sets of comparative test data indicated a stable linear relationship between the dielectric constants measured by the two methods (slope = 1.02, intercept = 0.03). Therefore, the adoption of the total reflection method not only ensures measurement accuracy but also effectively prevents the structural damage to pavement caused by the traditional method, offering a more efficient and reliable technique for asphalt pavement quality evaluation.
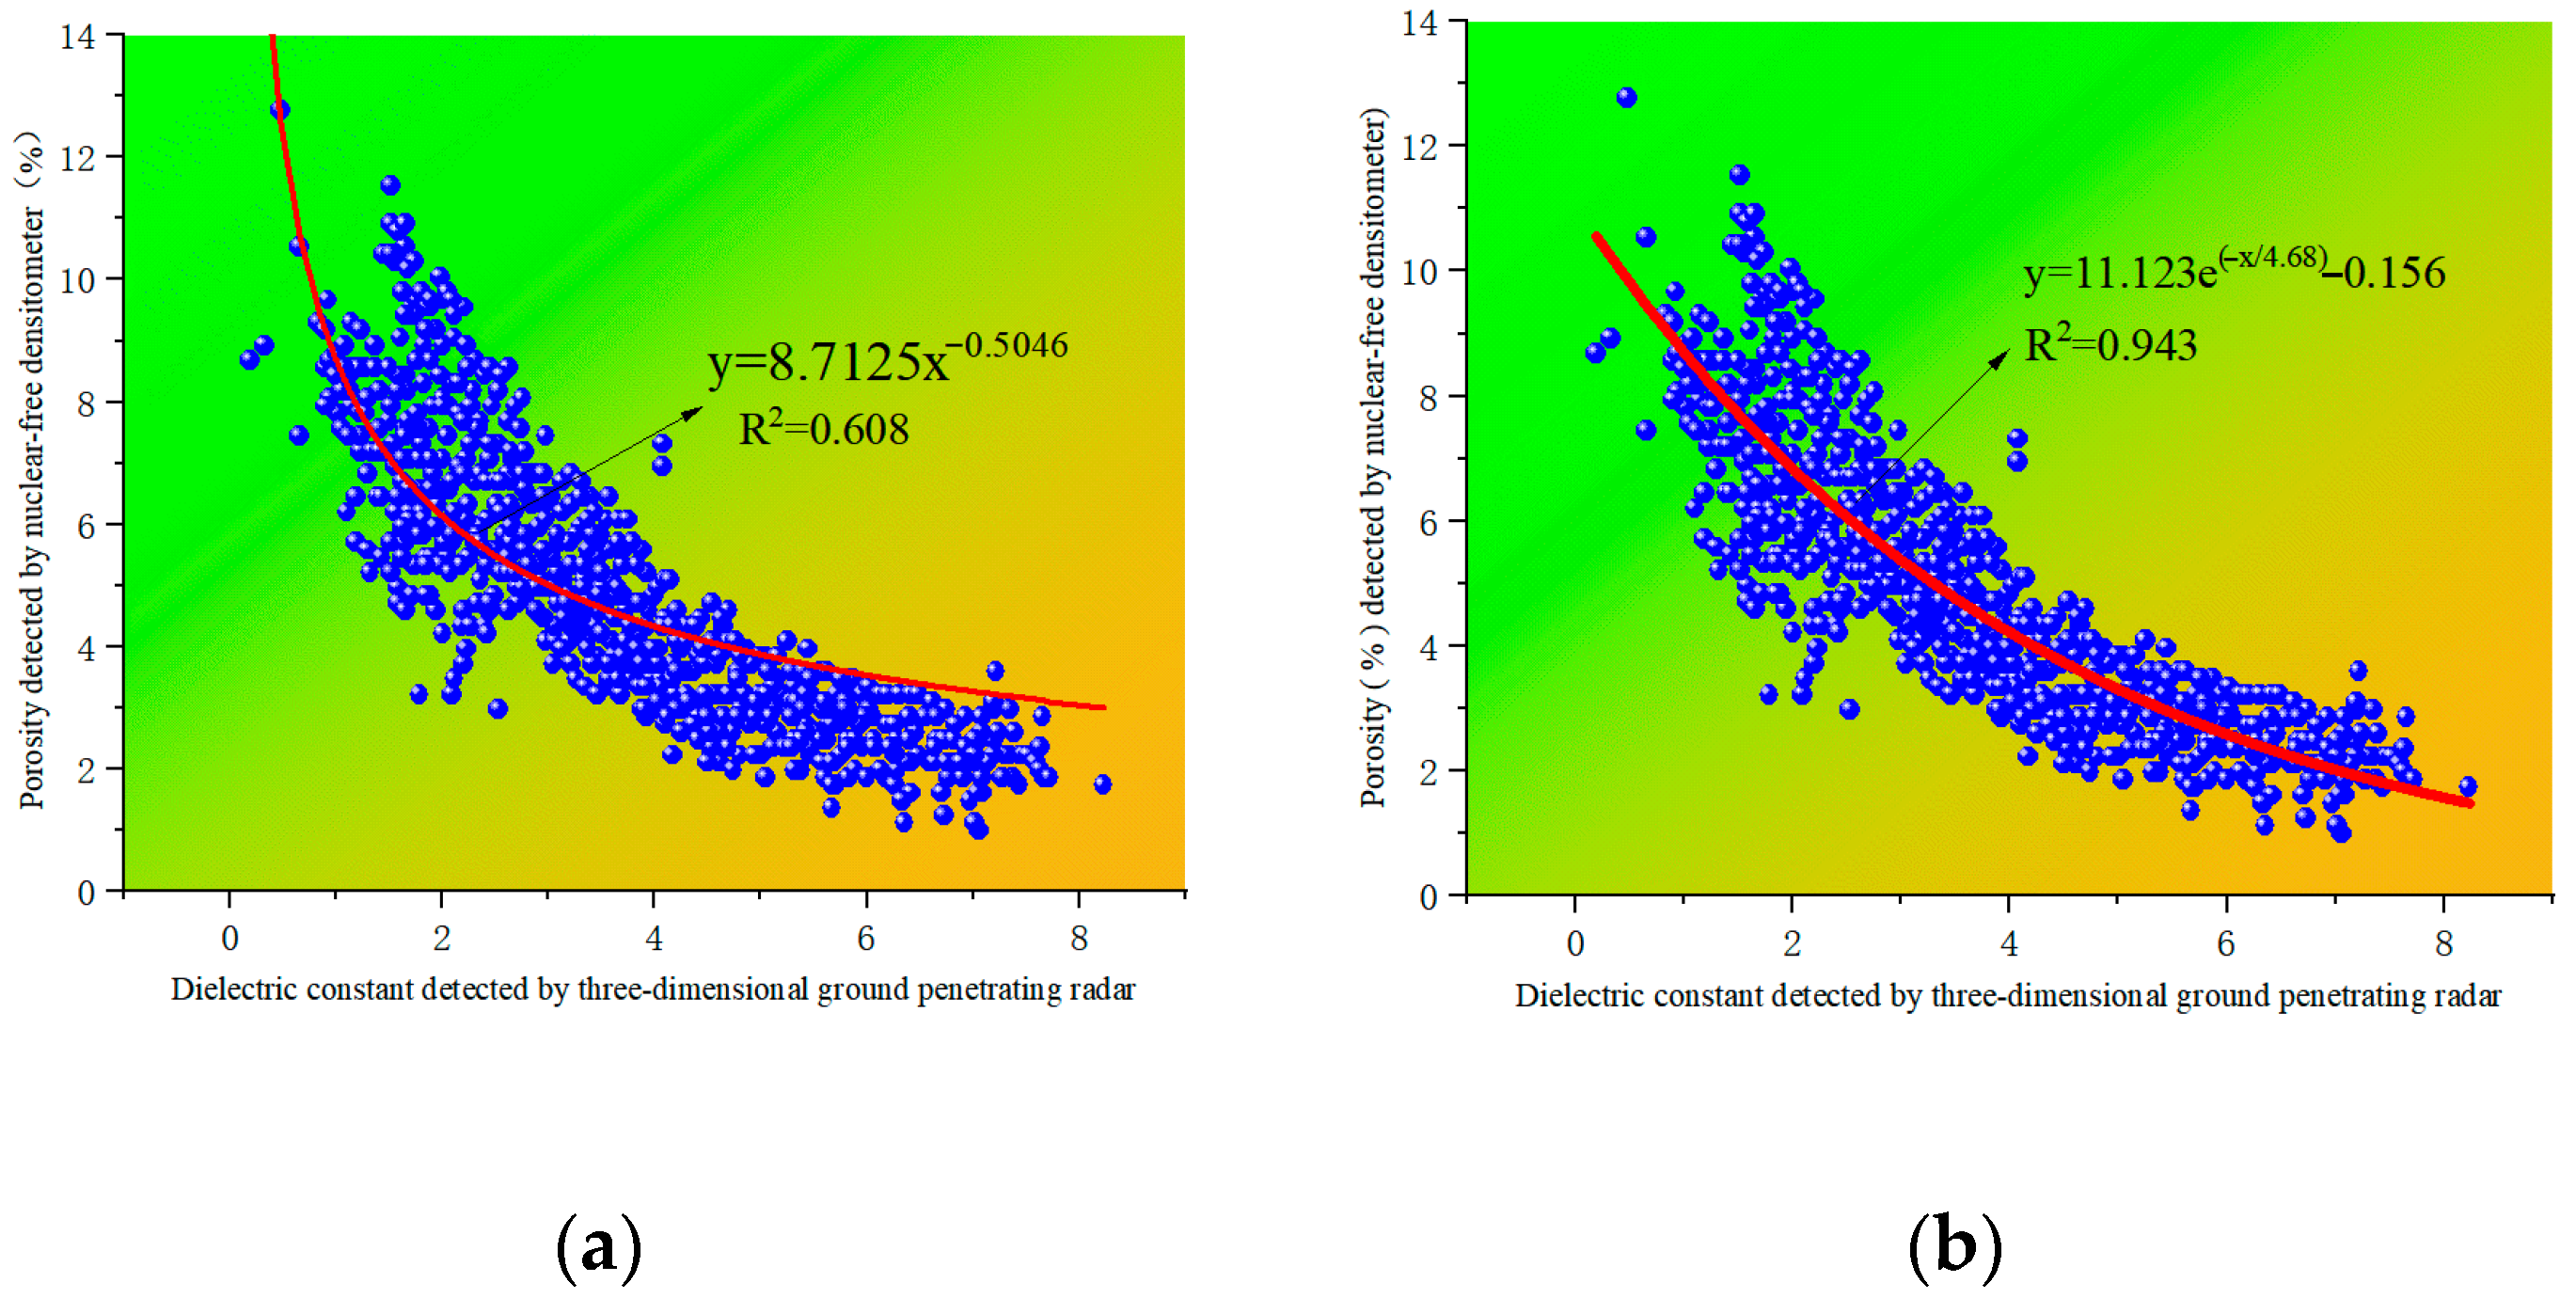
As shown in
Figure 17, exponential and linear fitting were applied to the dielectric constant and air void content data, respectively. The results indicate a significant correlation between the dielectric constant measured by the 3D ground-penetrating radar (GPR) and the air void content detected by the non-nuclear density gauge, with the strength of the correlation increasing with the number of data points. A systematic analysis of modeling performance under different sampling densities revealed that when utilizing data from all survey traces (including measurement points in both the transverse and longitudinal directions), the correlation between the 3D GPR dielectric constant and the air void content was strongest. The exponential correlation (
) was significantly greater than the linear correlation (
). Based on this finding, an exponential empirical formula was established:
. The significance of this model was confirmed by an F-test (
,
). Modeling with the full dataset improved prediction accuracy by approximately 12.5% compared to using partial sampling, demonstrating the necessity of comprehensive data collection for ensuring model reliability. This research establishes a scientific foundation for transforming pavement quality control from discrete sampling to continuous assessment, enabling more effective construction monitoring and quality assurance.
