1. Introduction
Recently, the use of artificial intelligence and, in particular, deep learning, is growing rapidly for pavement condition assessment. In fact, these technologies are assisting the automation of detection, classification, and measurement of pavement surface distresses. Therefore, traditional image processing methods like edge detection, thresholding, and morphological filtering, are gradually being replaced by more advanced approaches. Among these advanced approaches, Convolutional Neural Networks (CNNs) are very reliable due to their ability to learn complex visual patterns directly from labeled datasets.
Recent advancements in pavement monitoring have progressively integrated geospatial, sensing, and artificial intelligence technologies to enhance the accuracy and efficiency of infrastructure maintenance. Early developments focused on geospatial and remote sensing approaches for airport and road pavement management. For instance, Chen et al. [
1] introduced a GPS-based platform (SHAPMS) for optimizing pavement data collection and maintenance strategies in the Shanghai Airport Pavement Management System. Similarly, Habib et al. [
2] developed an innovative LiDAR-based Mobile Mapping System capable of providing precise real-time measurements, while Lima et al. [
3] demonstrated the benefits of combining GPS and laser scanning for automated pavement inspections, achieving faster and more consistent results than traditional methods. Other studies emphasized geodetic-based monitoring, such as Kovačič et al. [
4], who proposed a runway management model capable of detecting deformations using geodetic measurements. More recently, the deployment of unmanned aerial vehicles (UAVs) and advanced imaging systems has expanded data acquisition capabilities; for example, Pietersen et al. [
5] employed a drone-based computer vision approach using convolutional neural networks (CNNs) to detect pavement defects with improved accuracy.
Building upon these foundations, the focus of research has increasingly shifted toward deep learning-based distress detection and segmentation. Malekloo et al. [
6] leveraged artificial intelligence models applied to dashcam footage for pavement distress classification, while Mei et al. [
7] utilized a densely connected deep neural network to achieve automatic crack detection from smartphone and vehicle-mounted camera imagery. Further improvements in detection accuracy have been achieved through object detection frameworks such as YOLO and Faster R-CNN. Zhu et al. [
8], for example, compared UAV-based datasets using YOLOv3, YOLOv4, and Faster R-CNN, showing YOLOv3’s superior performance at the time for pavement defect classification. With the evolution of the YOLO family, Zhang et al. [
9] demonstrated that YOLOv8 could achieve 74% accuracy in detecting and segmenting linear cracks in infrastructure imagery, confirming the effectiveness of modern instance segmentation techniques.
Despite these advancements, the issue of distinguishing sealed cracks from active cracks remains a critical challenge. Sealed cracks often exhibit similar visual characteristics to active cracks, particularly in aerial imagery, which can lead to false positives and inaccuracies in key maintenance metrics such as the Pavement Condition Index (PCI). Early attempts to address this issue relied on traditional image-processing approaches. Kamaliardakani et al. [
10] proposed one of the first algorithms for sealed crack detection using heuristic thresholding and morphological post-processing, achieving good accuracy under variable lighting but struggling with low-contrast textures and limited scalability. Later, deep learning-based methods began explicitly modeling sealed cracks as distinct classes. Zhang et al. [
11] proposed a CNN-based framework capable of separating sealed from active cracks with high precision, though it was limited to ground-level imagery. Huyan et al. [
12] advanced this concept by introducing CrackDN, a Faster R-CNN variant that maintained high detection accuracy under varied conditions. Similarly, Shang et al. [
13] designed SCNet, a dual-branch network that learns separate representations for sealed and active cracks, significantly reducing misclassification. Yang et al. [
14] enhanced U-Net architecture by adding sealed cracks as a separate semantic class, achieving superior performance in distinguishing between crack types. Hoang et al. [
15] combined deep learning with image processing for improved segmentation of sealed regions, while Yuan et al. [
16] introduced a lightweight YOLOv5-based framework that explicitly recognized sealed cracks as a unique class, improving precision and recall compared to baseline models.
Collectively, these studies highlight the rapid technological progress from geospatial data acquisition to deep learning-based damage recognition. However, few investigations have directly addressed the accurate detection of sealed cracks in large-scale or aerial datasets, which is crucial for reliable airport pavement condition assessment. The present study aims to bridge this gap by employing an advanced instance segmentation model capable of distinguishing sealed and active cracks from UAV-acquired imagery.
In this regard, two main approaches have emerged: semantic segmentation, which labels every pixel in an image (for example, distinguishing between cracks and background), and object detection or instance segmentation, where cracks are identified and localized as discrete entities. Semantic segmentation models like U-Net and Fully Convolutional Networks (FCNs), perform strongly in capturing fine-grained crack patterns with high spatial resolution [
17,
18].
At the same time, object detection models, especially those from the YOLO (You Only Look Once) family, as well as two-stage detectors like Faster R-CNN, have been widely adopted for real-time or large-scale pavement inspection due to their speed and efficiency.
Hybrid models (e.g., Mask R-CNN) function as an intermediate approach by combining the advantages of object localization with pixel-level segmentation, which lead to effective capturing of detailed information about the crack (e.g., where and what the crack is). As demonstrated by Perri et al. [
19], these approaches have been successfully applied for crack detection, showing suitable performance for different crack morphologies and pavement textures. However, in this field, there remains one overlooked challenge, which is the presence of sealed cracks, a frequent outcome of routine pavement maintenance operations.
Although sealed cracks are visually distinct from active or unsealed cracks, they often resemble them in digital imagery, especially in orthophotos captured by unmanned aerial vehicles (UAVs) or mobile mapping systems. This visual resemblance can induce false positives during model predictions, especially when the training dataset lacks explicit differentiation between sealed and active cracks.
These deep learning models used for semantic or instance segmentation, can sometimes “hallucinate” the results, which means they may detect pavement distress in some areas where none actually exists. One of the possible reasons for this false positive detection is when a model overfits to specific patterns in the training data or misinterprets surface textures. The problem becomes even more noticeable when models try to generalize across a variety of pavement surfaces and sealing patterns without proper guidance from accurately labeled data.
This issue becomes very important in evaluating the Pavement Condition Index (PCI). In fact, if sealed cracks are misclassified as an active crack, it can overestimate distress measurements, leading to an inaccurate PCI score, which can lead to incorrect maintenance decisions. For this reason, distinguishing sealed from normal cracks is necessary not only for the accuracy of classification of pavement distresses but also for ensuring the reliability of pavement maintenance process.
To address this limitation, this study investigates whether training models with explicit labels for sealed cracks, through the adaptation of dedicated semantic masks, can help reduce these false positives and improve overall reliability. The YOLO model employed in this study for instance segmentation is YOLOv11, which detects and segments each distress type with dedicated masks. This approach permits obtaining pixel-level information for each detected object, ensuring both localization and accurate quantification of pavement distresses. To do this, a two-dataset approach is adopted: one dataset includes only active cracks, while the other considers sealed cracks as a separate class. By comparing the performance of models trained on each object and a third model trained on a dataset without any sealed crack included, tour aim is to better understand how sealed crack labeling can improve the reliability of AI-based pavement assessments.
2. Methodology
2.1. AI Model Custom Training
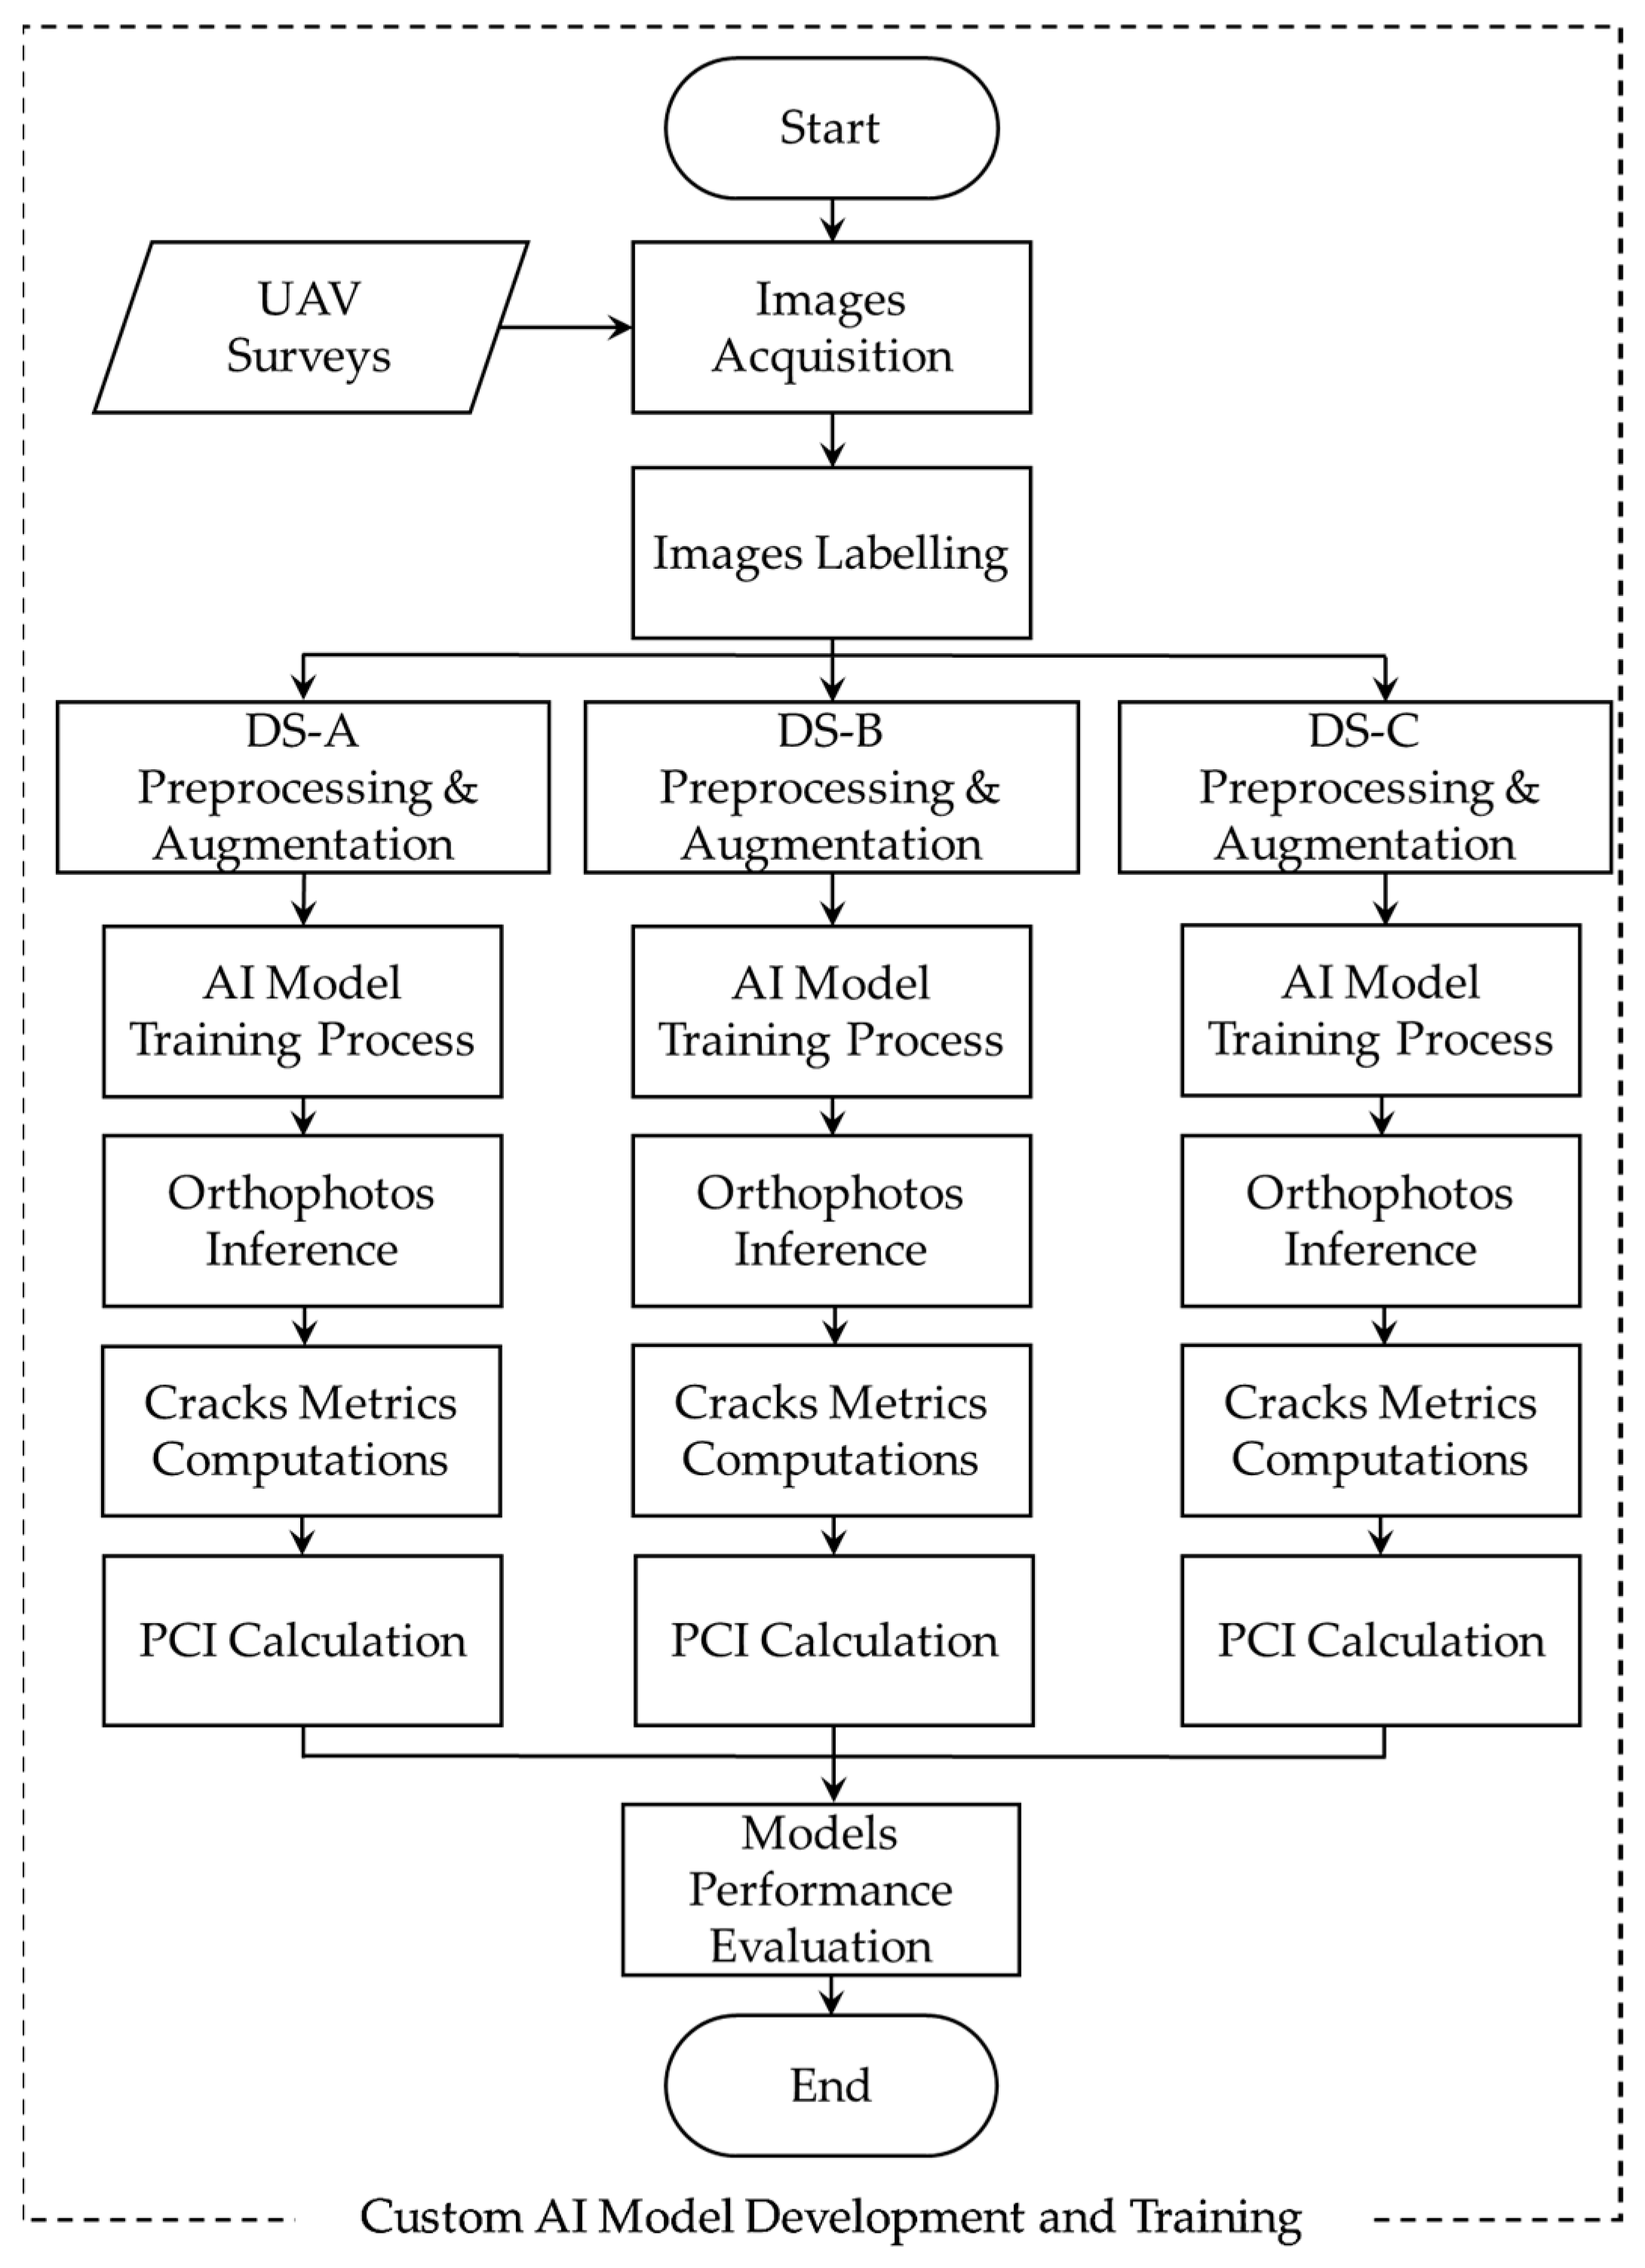
The key steps of the proposed assessment process are presented in
Figure 1.
The process starts with image acquisition via UAV surveys from various airports. In total, 160 high resolution images were captured from three different airports at an altitude of 14 m above the pavement’s surface. These images include many types of pavement distresses and sealed linear cracks. Each image was then manually annotated on a web-based platform distinguishing between transverse, longitudinal and sealed cracks with three different dedicated semantic masks. The annotated pictures were then used to create three datasets:
DS-A that did not include sealed cracks in the pictures;
DS-B that included sealed cracks but not annotated with a dedicated semantic mask;
DS-C that included sealed cracks annotated with a dedicated semantic mask.
Each dataset was then preprocessed and augmented with a final 20,768 pictures for DS-A, 24,768 for DS-B and 24,768 DS-C. After the models training with the YOLOv11 architecture was completed, each model was tested on a taxiway where different distresses are present, including sealed linear cracks.
The model operates through three main components: a backbone that extracts features at multiple scales, a neck that combines these features, and a segmentation head that produces pixel-level masks for each crack class. During training, the high-resolution images are divided into 640 × 640 tiles and standard data-augmentation steps (such as rotation, flipping, and small brightness adjustments) are applied to improve robustness. The loss function integrates localization, classification, and mask segmentation terms to guide the model in accurately distinguishing longitudinal, transverse, and sealed cracks. At inference, overlapping tiles are merged and small isolated regions are removed through simple post-processing.
2.2. Data Acquisition and Orthophoto Generation
In this study, the dataset was constructed through a large number of aerial photogrammetric surveys at several Italian Air Force airfields. These surveys were carried out using a lightweight UAV (DJI Mini 3, Da-Jiang Innovations, Shenzhen, China) that captured several hundred high-resolution images (5472 × 3648 pixels) following the pre-defined flight plans. Thanks to the resolution of these images, the crack detection process and pixel-level pavement surface analysis are feasible.
Two separate flight campaigns were conducted at altitudes of 10 m and 20 m above the pavement surface. This approach was adopted to enhance the reliability and precision of the digital model reconstruction of the taxiway. This altitude range was chosen to balance surface coverage with spatial resolution to improve the visibility of both longitudinal and transverse cracks, particularly narrow and low-severity ones that are often left out during conventional surveys.
Figure 2 presents some examples of these aerial images captured by a UAV from the studied Italian airports.
The UAV used in this study weighs approximately 250 g and is equipped with an integrated high-resolution camera. Its compact size and low weight allowed for rapid deployment and quick maneuvering, while also ensuring compliance with airspace regulations. This setup enabled data collection to take place near active runways with minimal disruption to the operations.
To ensure that the proposed model can be generalized for real-world practical applications, images were intentionally captured under diverse environmental conditions, including various lighting scenarios (e.g., sunny, cloudy, low-angle light) and mild weather variations (e.g., light winds and moderate humidity). The surveys also covered both runways and taxiways with different surface ages, maintenance background (including the presence of sealed cracks), and textures.
After acquiring all high-resolution imagery over the studied airfields using the lightweight UAV, the dataset was annotated at the pixel level. The annotation process aimed to delineate and classify pavement distresses with high precision, including micro-cracks and low-contrast ones. This level of detail is essential for training the AI model capable of accurate segmentation.
The image annotation process was performed according to three distinct datasets, which were defined for this study, as described in
Table 1.
First dataset (DS-A) is dedicated to longitudinal and transverse cracks, excluding the presence of sealed cracks. Second dataset (DS-B) consists of two classes of longitudinal and transverse cracks, including the sealed cracks but without labeling them separately. Finaly, the third dataset (DS-C) consists of three classes of longitudinal, transverse, and sealed linear cracks. For this dataset, transverse, longitudinal and sealed linear cracks were manually labeled to enable the model to distinguish them from other types of cracks. As demonstrated in
Table 1, datasets DS-B and DS-C include 4000 additional images featuring sealed cracks coexisting with active cracks within the same frame.
The annotation process is performed through a web-based platform (Roboflow), which enables each distress type to be manually labeled with a dedicated semantic mask and a dedicated color code.
Figure 3 illustrates an example of one captured image after being annotated according to the previously defined classes of cracks.
As shown in
Figure 3, the transverse cracks were labeled with purple semantic mask, the longitudinal one with red semantic mask and the sealed linear cracks were identified with a yellow semantic mask.
2.3. Network Architecture and Training
The training phase was conducted on a publicly accessible, cloud-based platform (Google Colab PRO) supporting Python (v3.13.2) programming, which is the de facto standard language for AI research and development. This platform provides advanced computational resources, including GPUs with 40 GB of memory and a memory bandwidth of 1.6 TB/s. This high-performance configuration is necessary for rapid and efficient processing of large datasets, accelerating the matrix operations required for training deep convolutional neural networks.
The AI model used for instance segmentation was YOLOv11 in its Extra Large (XL) version. This architecture consists of 379 layers and comprises approximately 62,053,721 parameters and 62,053,705 trainable gradients. This model has the best parameters; its high capacity and performance accuracy make it the best candidate for computer vision tasks like instance segmentation of thin elements such as linear cracks. The models were trained for 25 epochs using images tiled to 640 × 640 pixels, with an average GPU memory usage of 20 GB. The total training time was approximately 2 h, demonstrating the efficiency of the platform in handling high-resolution image data and complex architectures.
3. Models Validation and Results Discussion
To evaluate the performance of the trained models and validate the results, an Italian airport was selected as the case study. This validation phase aims to assess the ability of the three proposed AI models to detect, segment, and quantify pavement distresses under realistic conditions.
A portion of taxiway at this airport was determined for the generation of a set of high-resolution orthophotos via a UAV-based photogrammetric survey. Then, these orthophotos were processed by each of the proposed AI models (DS-A, DS-B, and DS-C).
Finally, the models’ predictions were compared with the results achieved from an on-site inspection, which was carried out by specialized field technicians through traditional methods. These inspections followed the procedures recommended by ASTM D5340, which establishes standard practices for evaluating the Pavement Condition Index (PCI) through visual surveys conducted directly on the pavement surface.
By cross-referencing AI outputs with both the photogrammetric ground truth and field survey data, it is possible to quantify key performance metrics, such as over-segmentation (false positives—Hallucinations), under-segmentation (false negatives—Cracks Missed), and overall error rate/index for both longitudinal and transverse cracking. The steps of validation process are explained in detail in the following Sub-chapters.
3.1. Taxiway Survey and Orthophoto Generation
The survey was conducted on the taxiway of an Italian airport. The width and length of this taxiway are 15 m and 800 m, respectively. The taxiway is paved with asphalt concrete. The pavement section, which was selected for the survey, had been in service for over 30 years and had not undergone full-scale rehabilitation and maintenance interventions in recent years. The presence of numerous sealed cracks, combined with the absence of recent interventions, made this area suitable for evaluating the performance of deep learning models in detecting and distinguishing between active and sealed distresses.
Since the selected airport is situated in northeastern Italy, the site is subject to significant climatic variability, with winter temperatures dropping below −10 °C and summer peaks exceeding +35 °C. These extreme seasonal fluctuations impose considerable mechanical and thermal stress on the pavement layers, which can lead to development and progression of cracking phenomena, particularly transverse cracks (due to their thermal entity). Therefore, selecting this case study can offer a realistic and demanding operational environment for model validation.
Image acquisition was performed via a lightweight UAV flying at low altitude, to ensure high spatial resolution and consistent coverage across the entire surface. Approximately 600 overlapping images were captured at a flight altitude of 14 m, following a pre-programmed grid mission that optimized both image distribution and photogrammetric reconstruction quality.
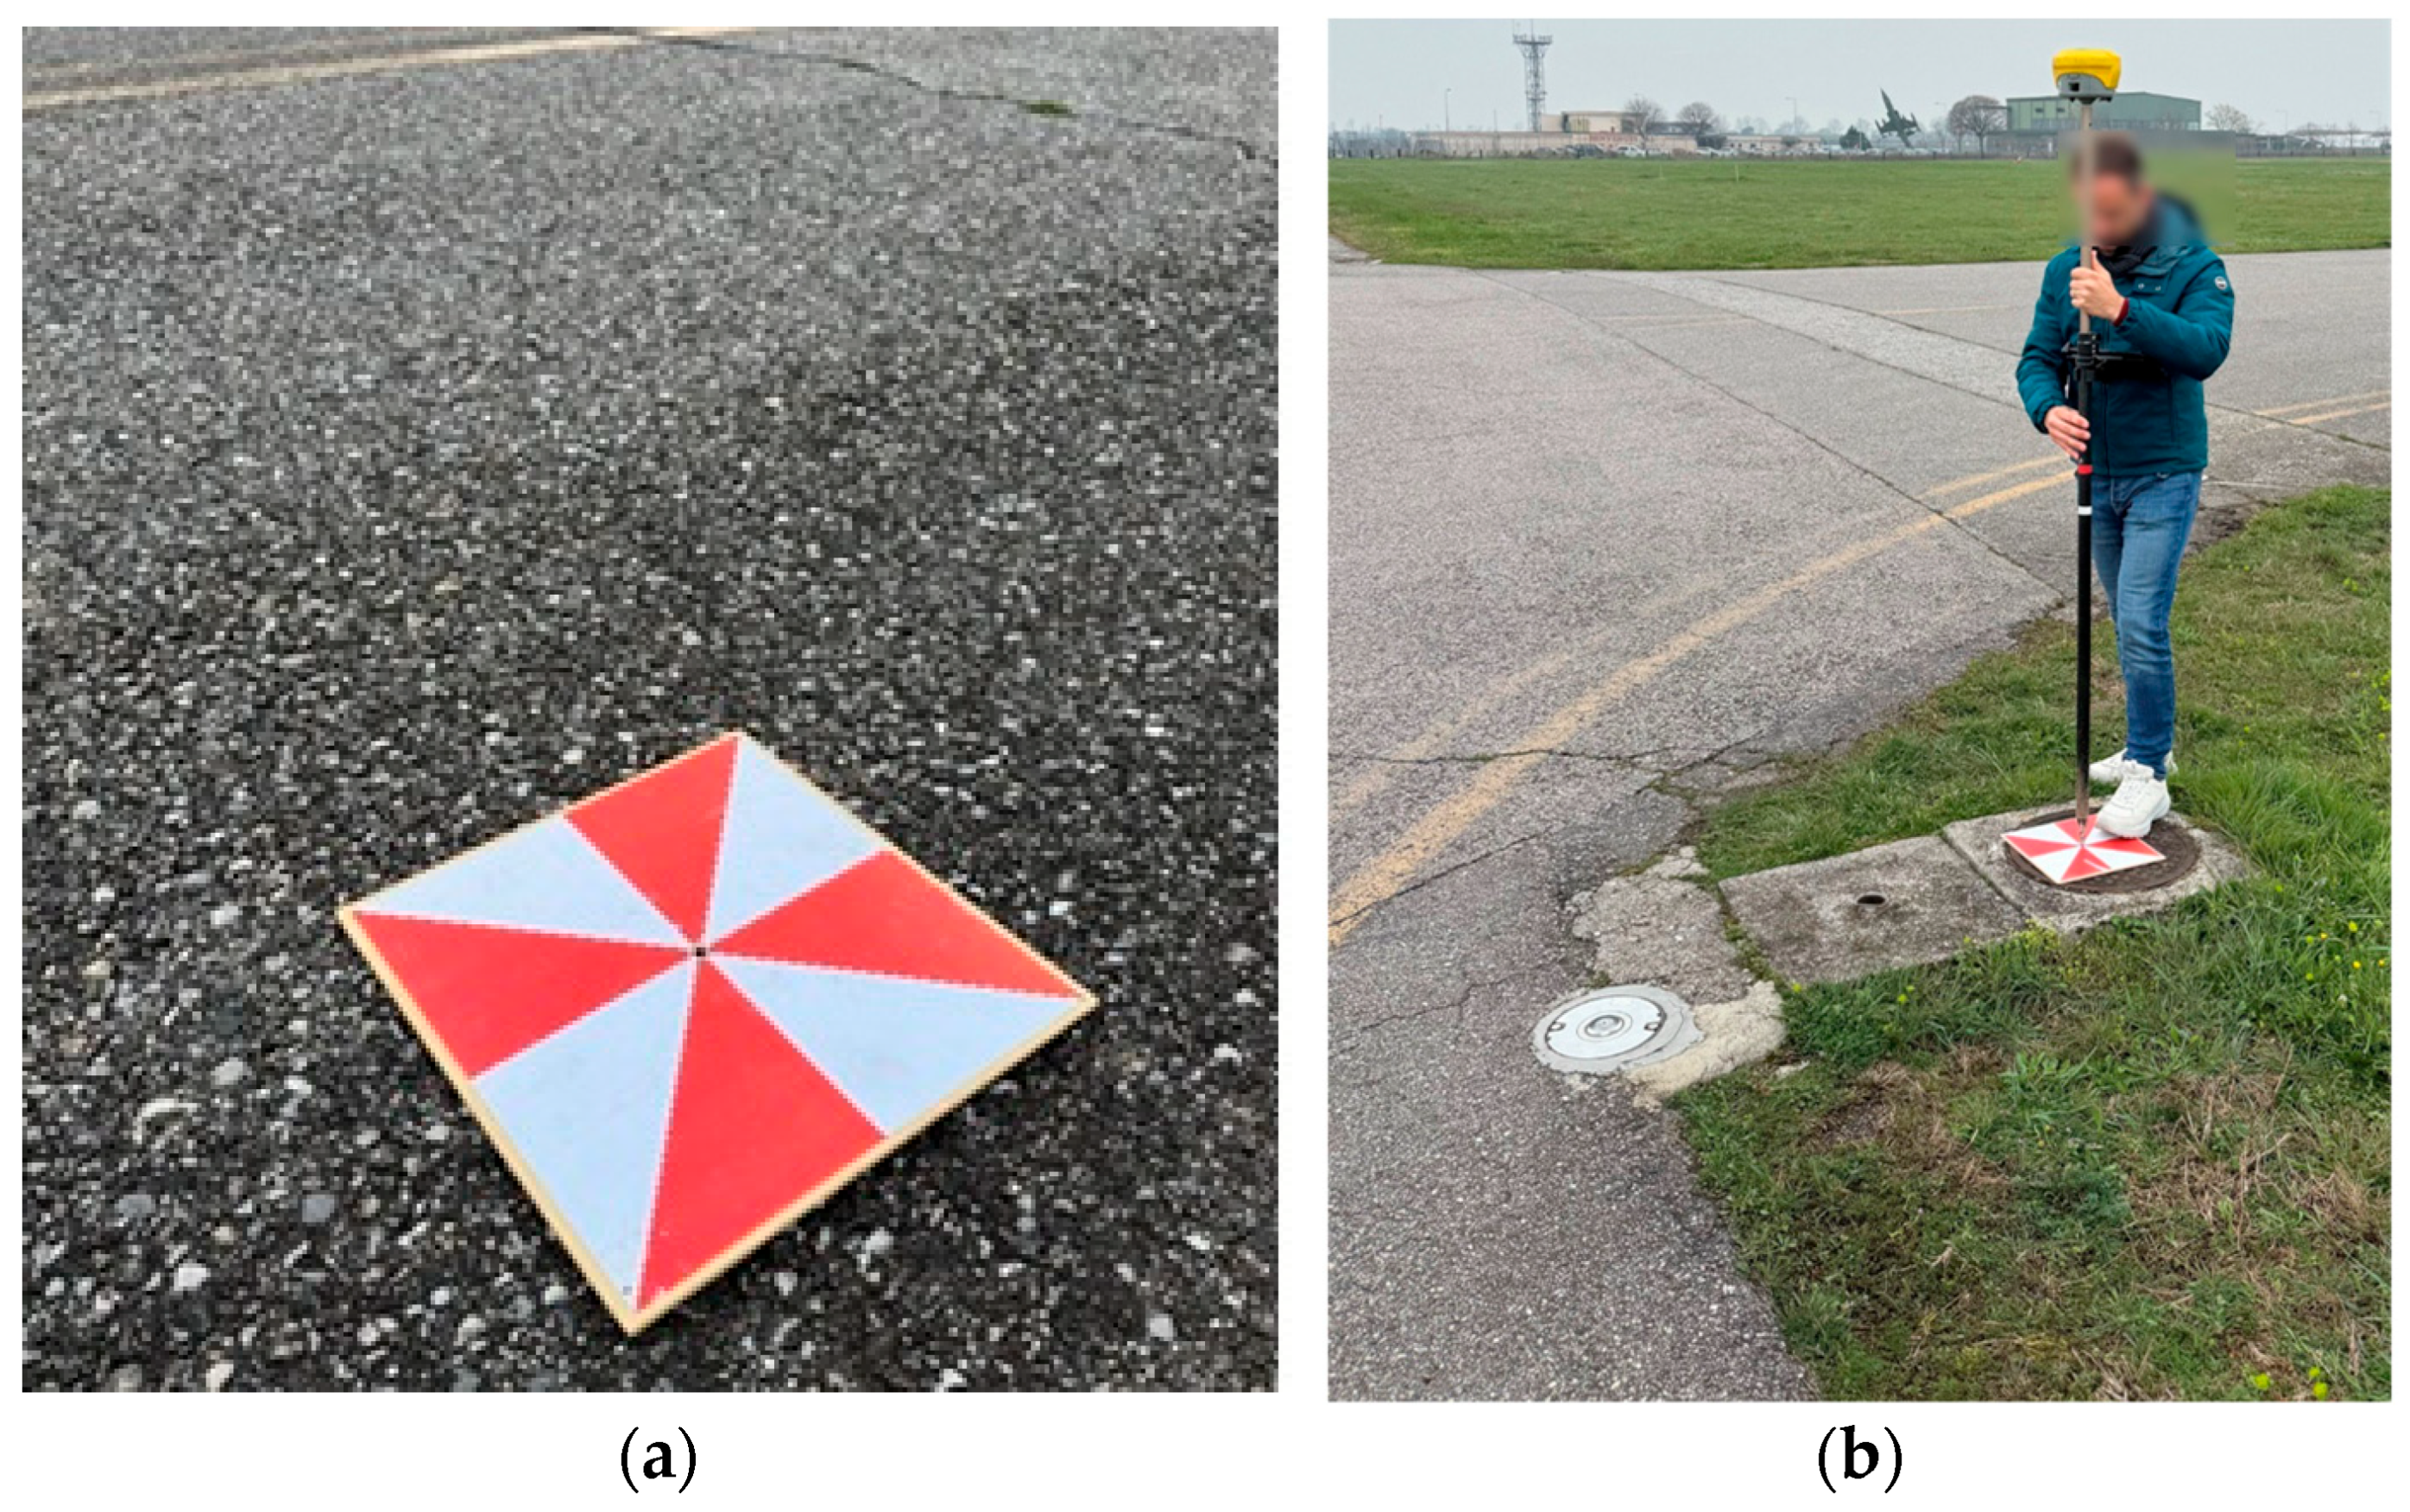
Each image was captured with a resolution of 5472 × 3648 pixels, enabling the identification of fine surface discontinuities. To enhance the geometric accuracy of the orthophoto reconstruction, a series of Ground Control Points (GCPs) were placed along the taxiway as targets (see
Figure 4a). These white and red markers, each measuring 30 × 30 cm, were positioned every 25 m on both sides of the pavement. Their coordinates were precisely georeferenced using a high-accuracy GPS system (see
Figure 4b), providing stable visual references to improve the spatial reliability of the resulting orthomosaic.
The imagery collected was then processed using advanced photogrammetric techniques to generate high-resolution, georeferenced orthophotos of the pavement surface (see
Figure 5). A forward overlap of 80%, the value usually implemented in aero photogrammetric survey and flat areas, was maintained between consecutive images to ensure sufficient data redundancy and to facilitate accurate tie-point extraction.
The orthophotos generated through this process, each with a resolution of 4000 × 4000 pixels, corresponded to real-world surface areas of approximately 20 × 20 m. An example of these orthophotos is presented in
Figure 6.
These high-resolution orthophotos provided a continuous and detailed visual representation of the taxiway surface, which is the fundamental input layer for the AI-driven crack detection, segmentation, and classification tasks. Each orthophoto was treated as a discrete sample unit, in accordance with the guidelines outlined in ASTM D5340 [
20], which recommends evaluating pavement conditions using standard-area segments of approximately 400 square meters.
3.2. Orthophoto Inference
In this study, three YOLOv11-based instance segmentation models were evaluated. Each model was trained on a distinct dataset of DS-A, DS-B, and DS-C. The performance of each of these three models was tested on ten orthophoto-derived sample units extracted from the taxiway section under study. As mentioned earlier, each of these sample units is related to an area of approximately 400 square meters as recommended by ASTM D5340. The evaluation focused on the detection and quantification of both longitudinal and transverse cracks, analyzed independently to better isolate the effect of sealed crack labeling on each type of distress.
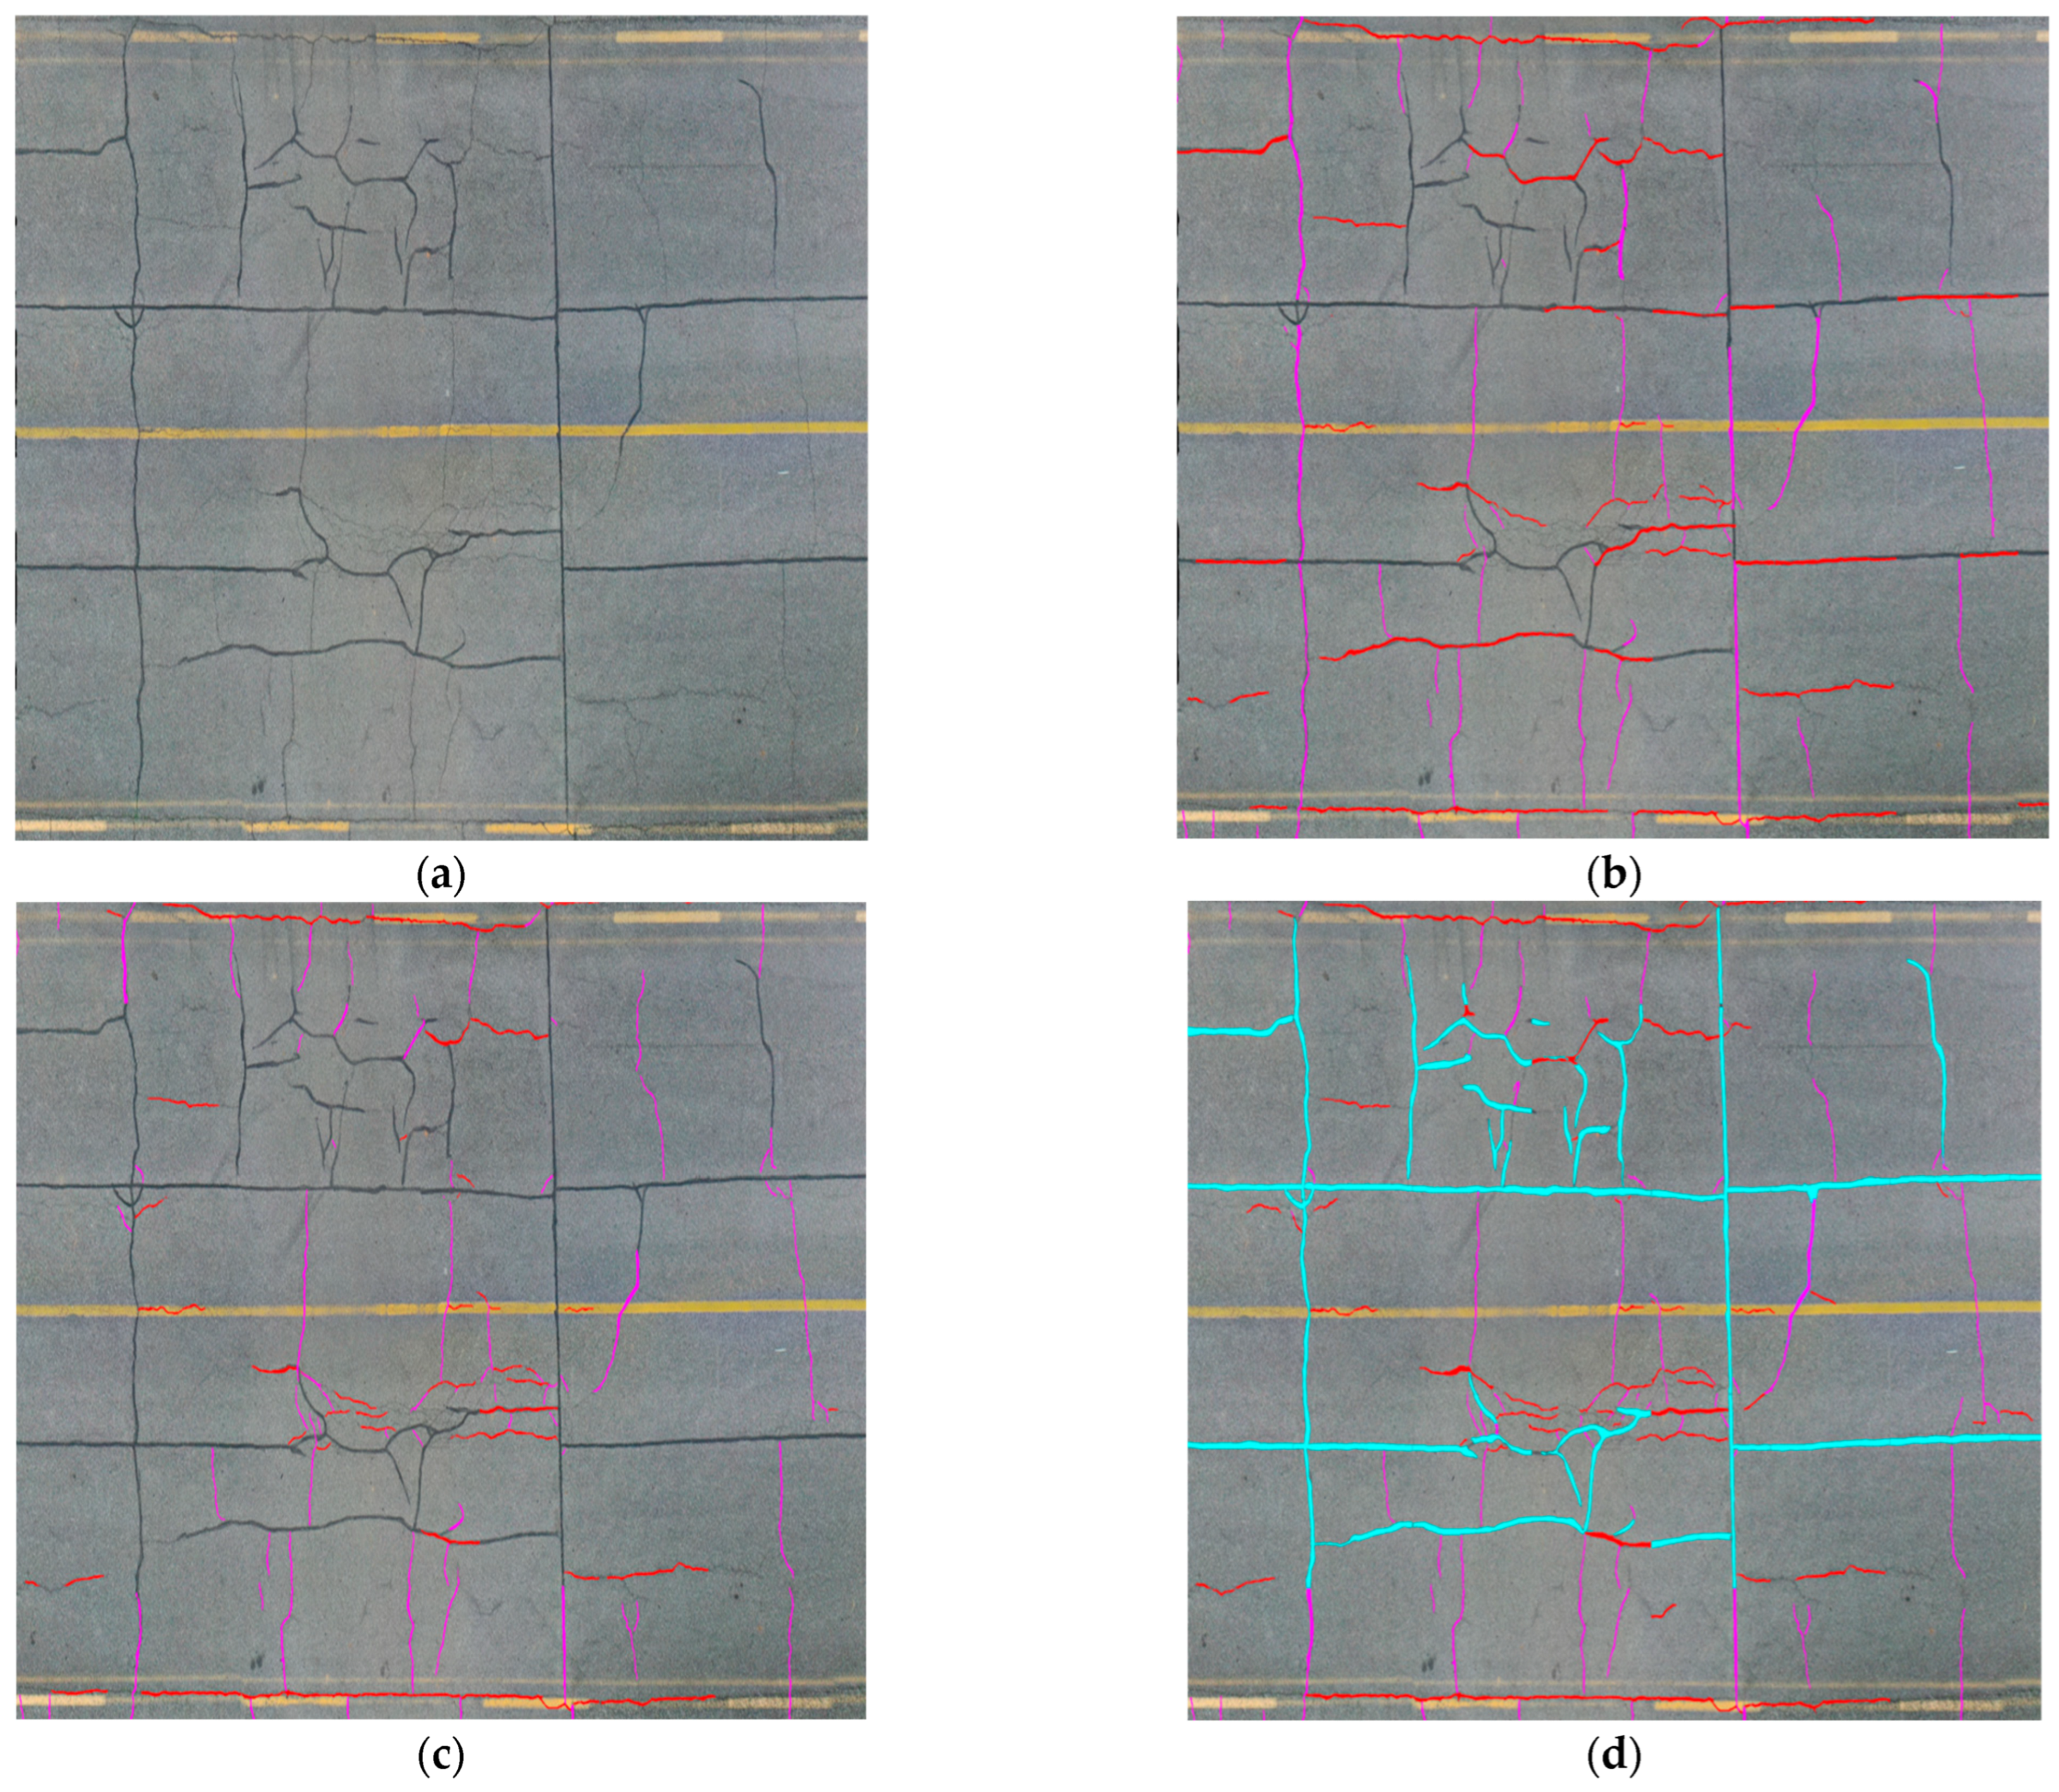
To clarify better the evaluation process performed by each dataset of DS-A, DS-B, and DS-C, Sample Unit_1 is presented step by step as an illustrative example in
Figure 7.
Figure 7a shows the georeferenced orthophoto of Sample Unit 1 (4000 × 4000 pixels–20 × 20 m) prior to processing for crack detection, segmentation, and classification with AI models trained on DS-A, DS-B, and DS-C.
Figure 7b illustrates the results obtained by processing the orthophoto of Sample Unit_1 with database DS-A. As described earlier, sealed cracks are not included in the DS-A; therefore, the AI model identifies longitudinal and transverse cracks without distinguishing between active and sealed ones.
For Sample Unit_1, the results of DS-A training can be summarized as follows:
The total length of longitudinal cracks detected by the model (DS-A) is 69.10 m, of which 35 m are false positive (Hallucination) due to misclassification of sealed cracks as active cracks. This leaves 34.10 m of actual cracks correctly detected;
The total length of transverse cracks detected is 63.55 m, of which 18.76 m are false positive for the same reason. This leaves 44.79 m of actual cracks correctly detected.
Figure 7c presents the results obtained by processing the orthophoto of Sample Unit_1 with database DS-B. As discussed earlier, sealed cracks are included in the database but are not annotated with a dedicated semantic mask. Consequently, the AI model identifies longitudinal and transverse cracks while excluding sealed ones, which reduces the model’s precision.
For Sample Unit_1, the results of DS-B training can be summarized as follows:
The total length of longitudinal cracks detected by the DS-B model is 45.13 m, of which 4.50 m are false positive (Hallucination) due to sealed cracks not being fully excluded and therefore misclassified as active cracks. This leaves 40.63 m of actual cracks correctly detected;
The total length of transverse cracks detected is 56.86 m, of which 6.00 m are false positive for the same reason. This leaves 50.86 m of actual cracks correctly detected.
Figure 7d shows the results obtained by processing the orthophoto of Sample Unit_1 with database DS-C, in which sealed cracks are both included and annotated with a dedicated semantic mask.
For Sample Unit_1, the results of DS-C training can be summarized as follows:
The total length of longitudinal cracks detected by the DS-C model is 55.67 m, of which 4.36 m are false positive (Hallucination). This leaves 51.31 m of actual cracks correctly detected. As expected, this demonstrates the higher precision of DS-C compared with DS-A and DS-B;
The total length of transverse cracks detected is 57.16 m, of which 5.85 m are false positives. This leaves 51.31 m of actual cracks correctly detected.
The ground-truth lengths of longitudinal and transverse cracks, obtained from on-site inspections and field survey data, are reported in
Table 2.
By comparing the ground-truth annotations obtained from on-site inspections (
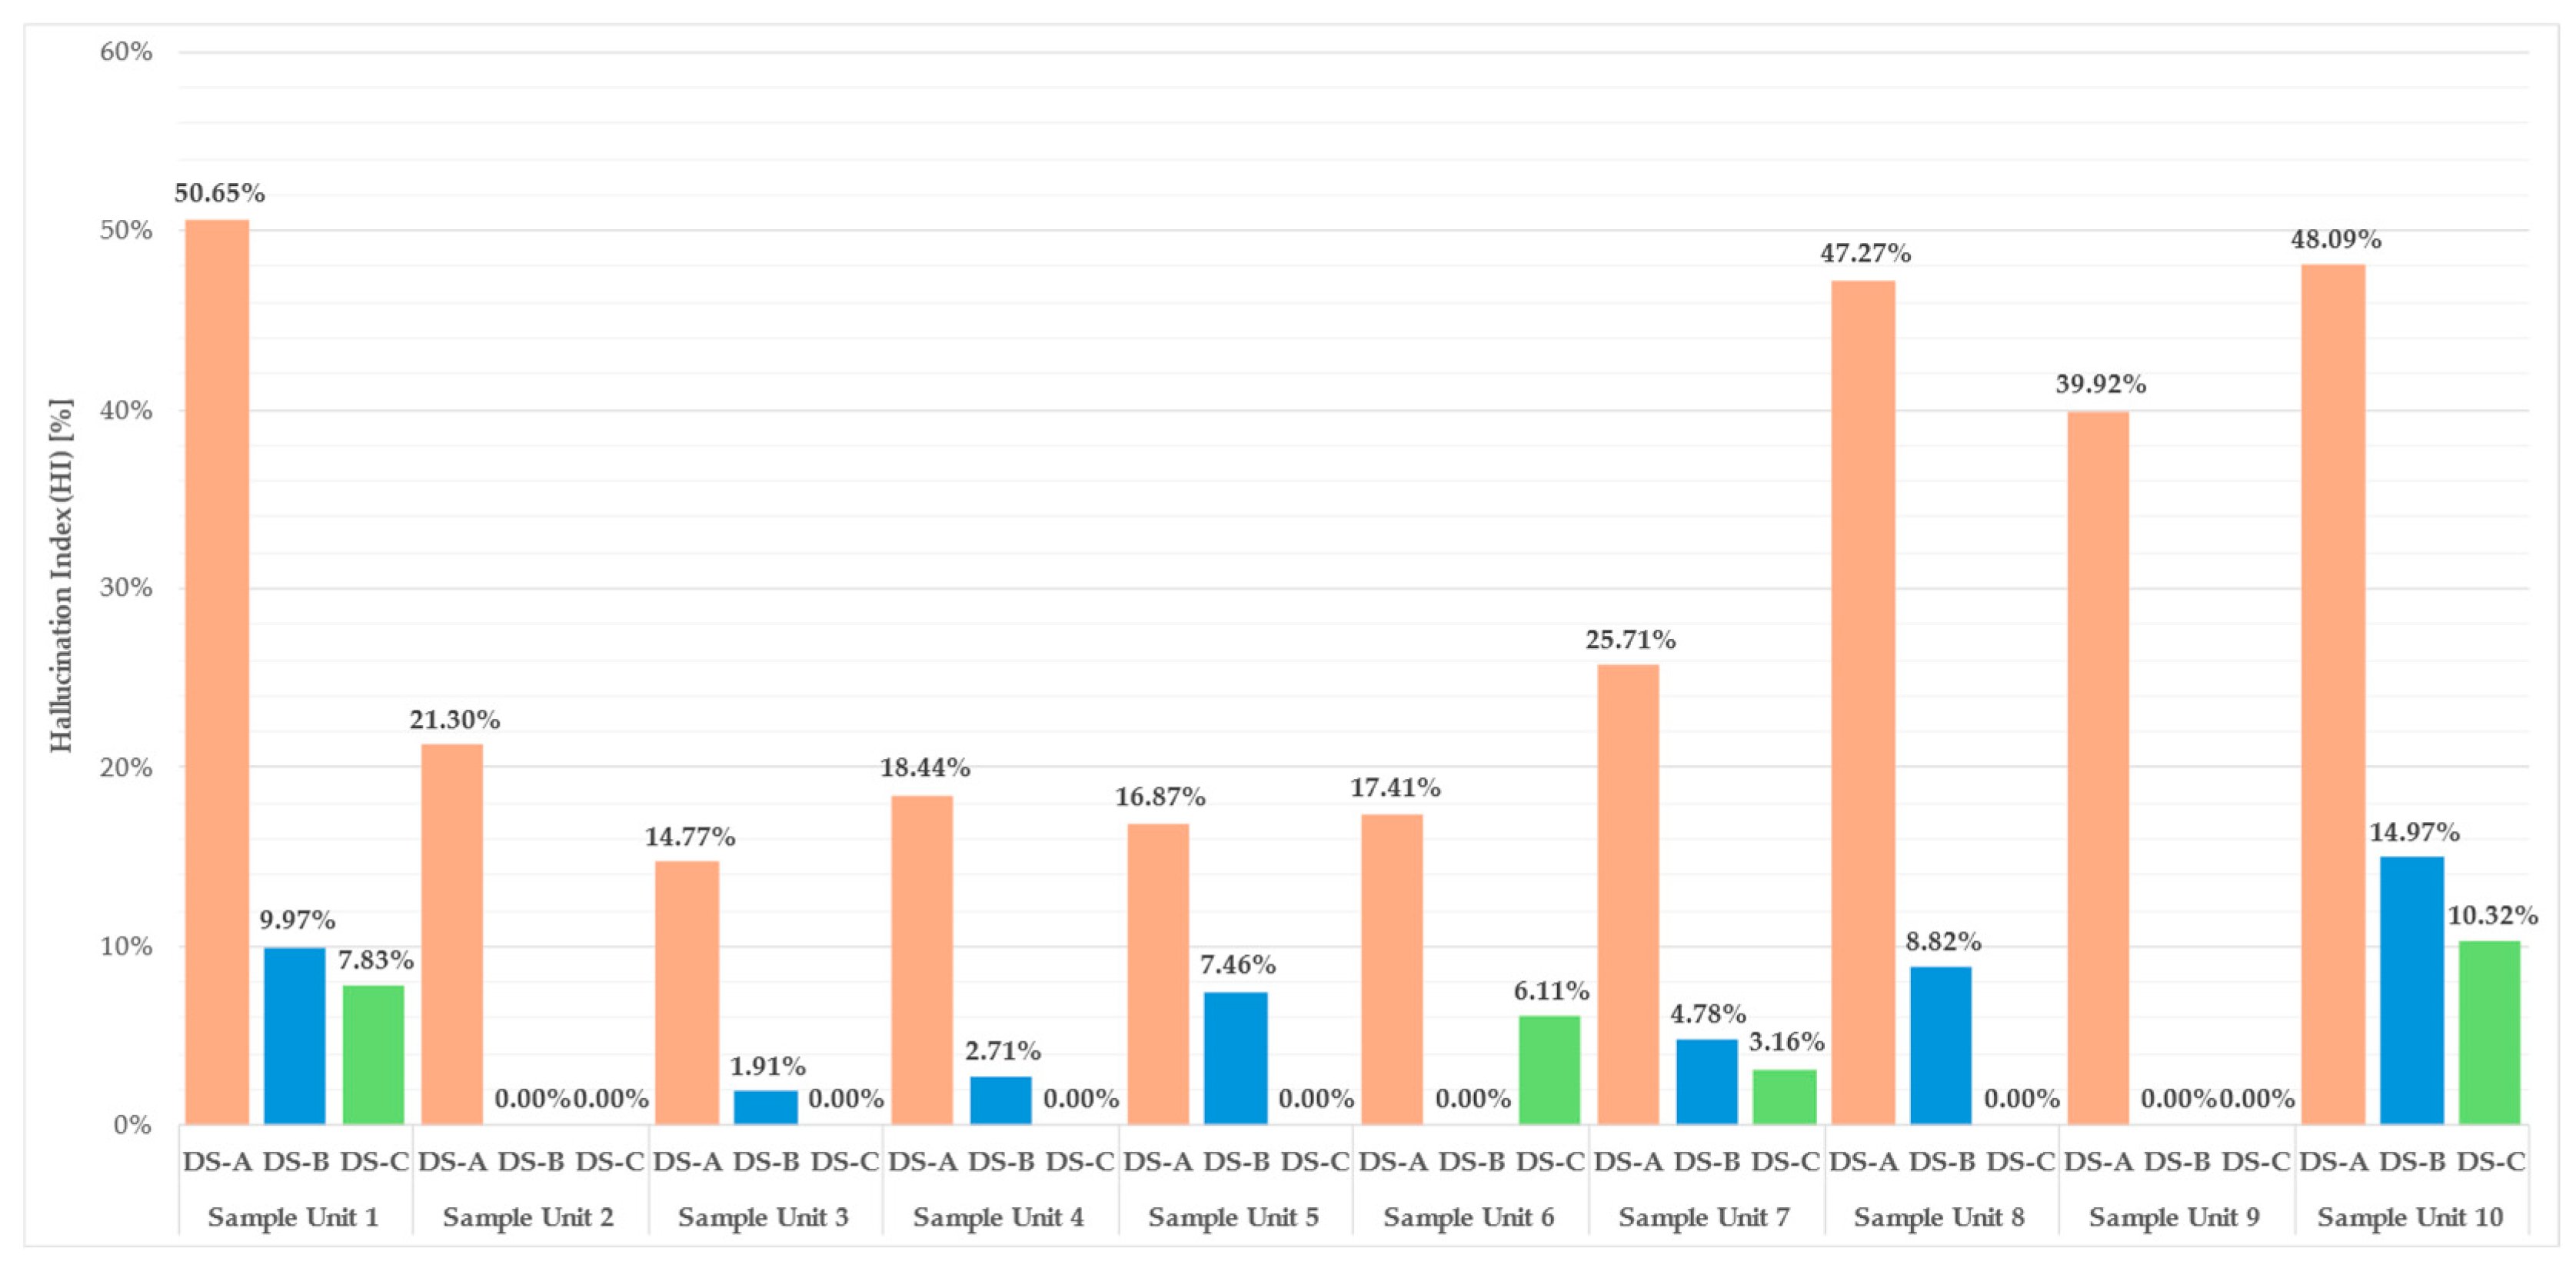
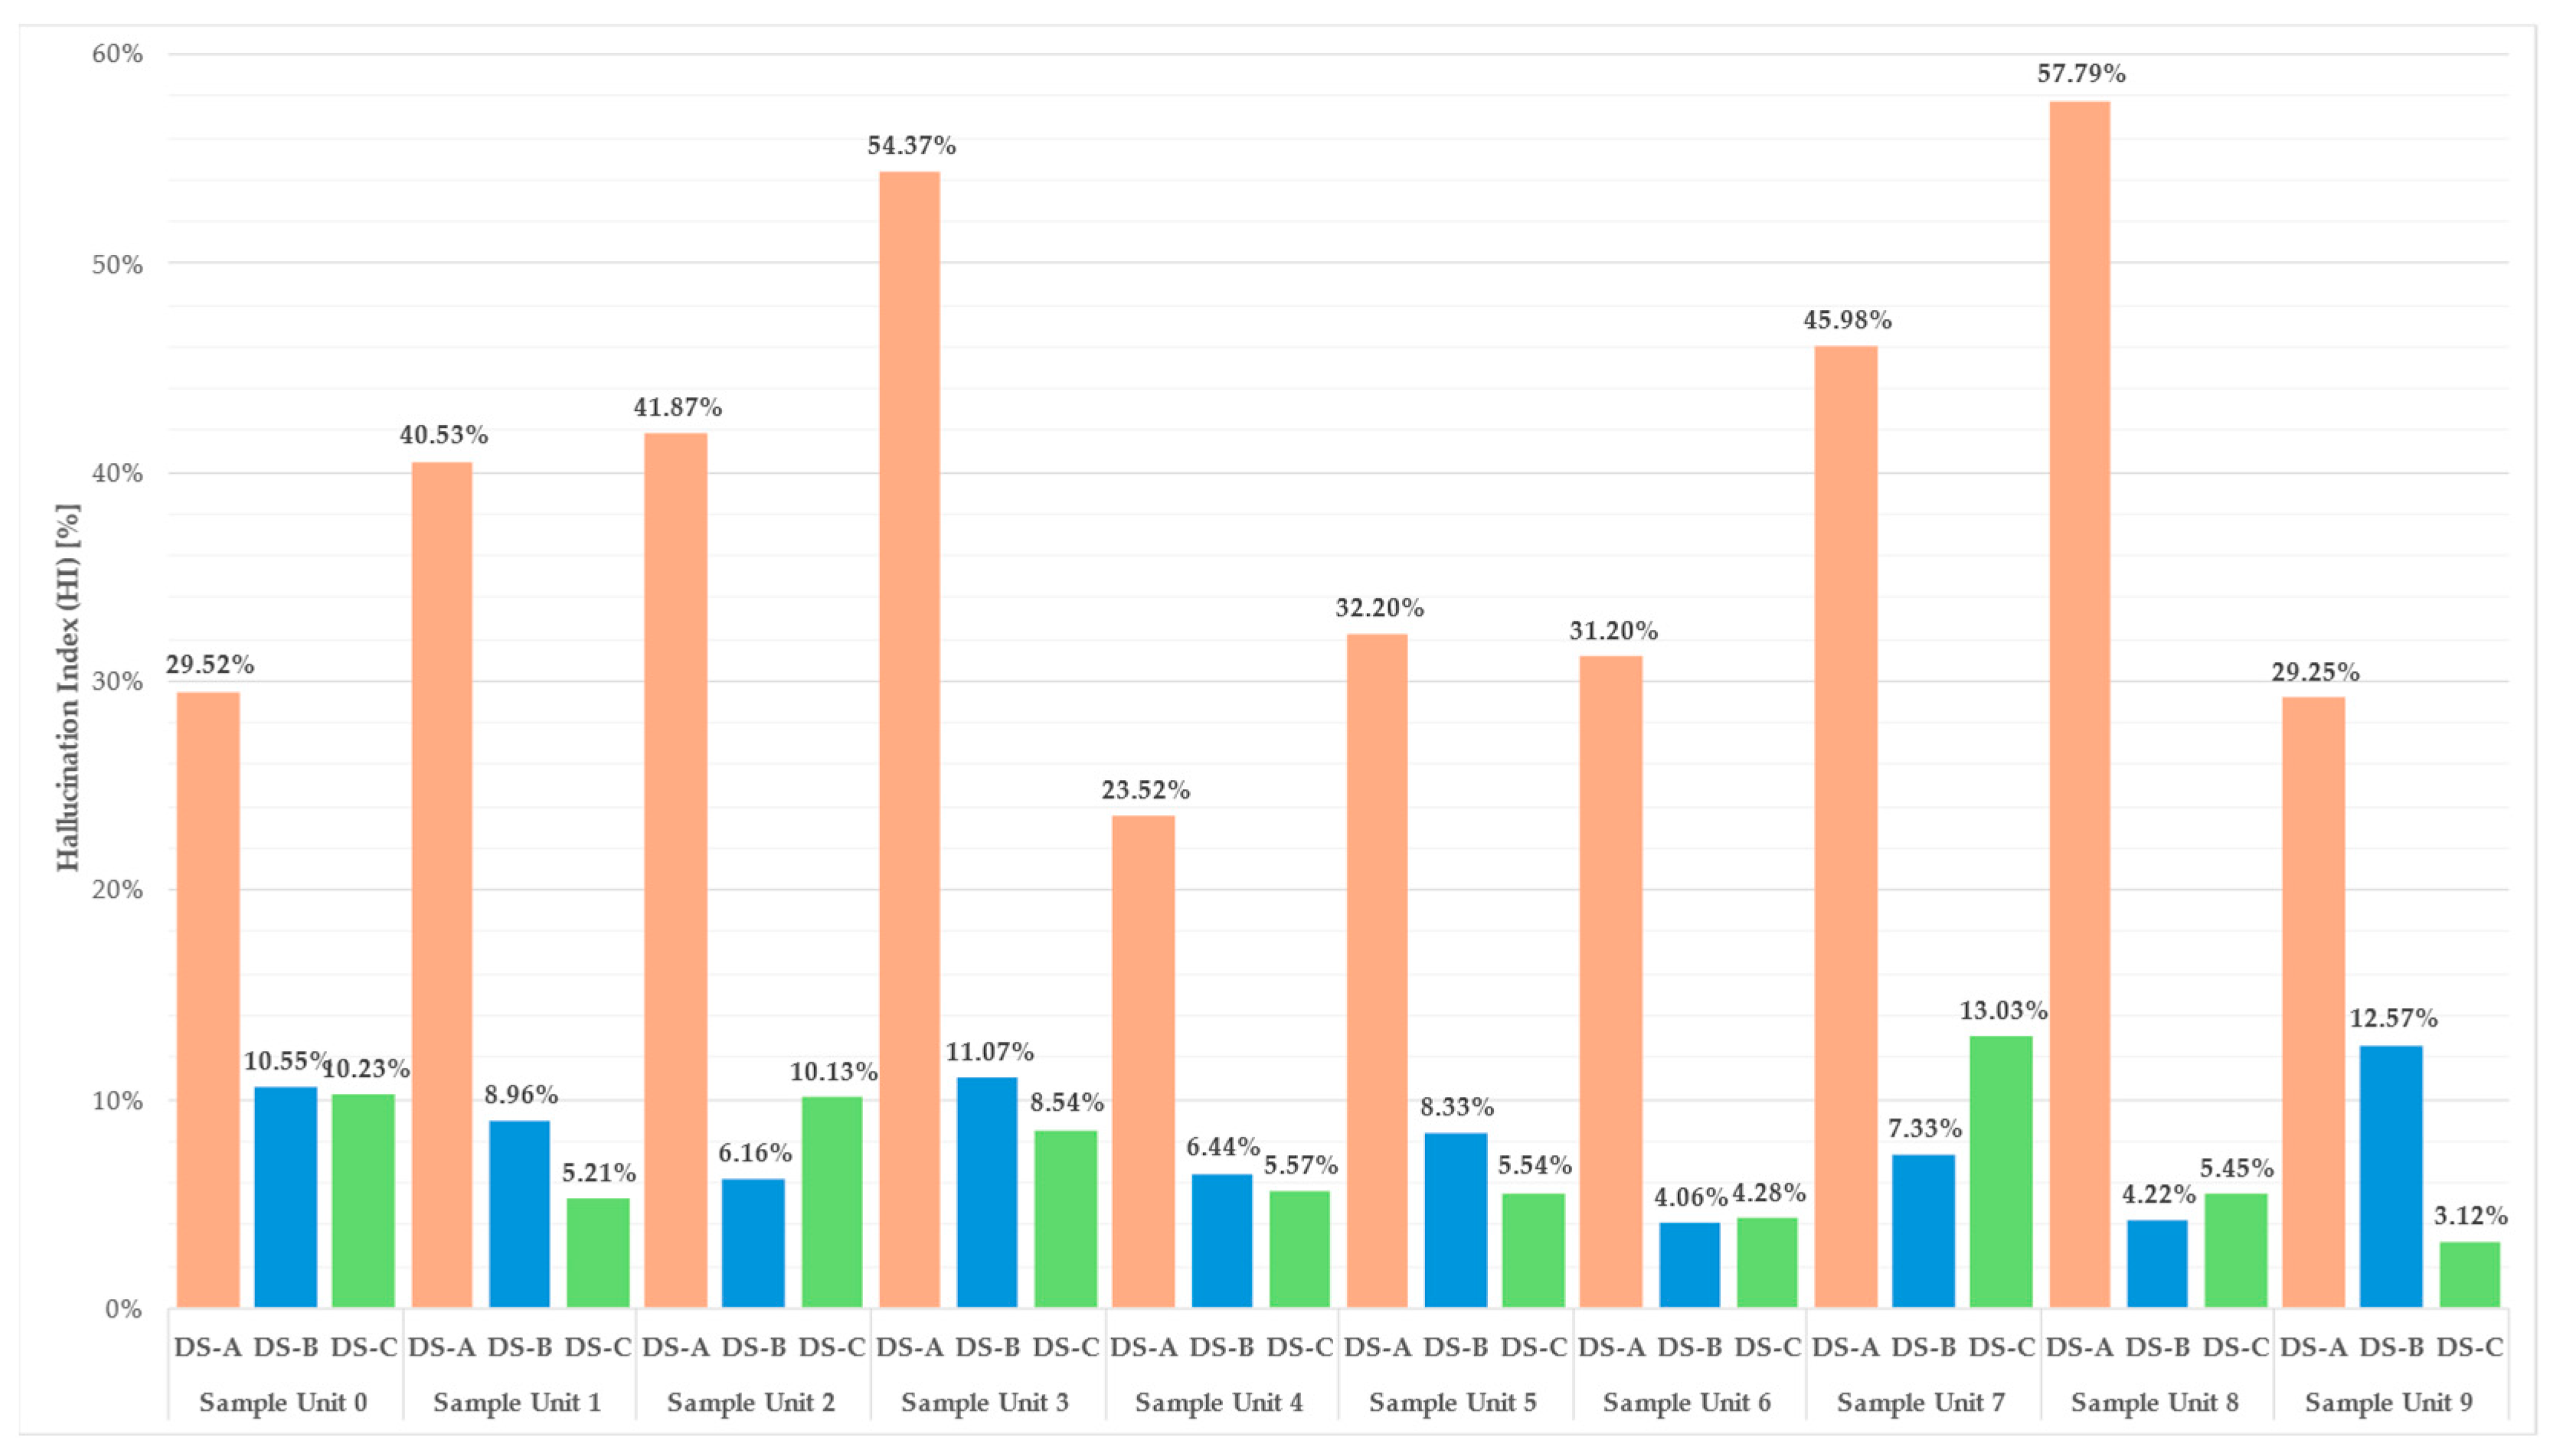
Table 2) with the crack lengths detected by the AI models trained by DS-A, DS-B, and DS-C, the prediction accuracy of the proposed models can be assessed. To further evaluate their efficiency and precision, two specific performance indexes are introduced: Hallucination Index (HI) [%], which is the ratio between the false positive length of cracks and the total length of cracks detected by the model, and Model Error Index (MEI) [%], which is the ratio of the false negative length of cracks detected by the model and the total length of the cracks obtained from on-site inspection.
In Equation (1), presents the over-segmentation length of cracks (false positives, i.e., hallucinations) detected by the model, while is the total length of cracks detected by the model. The Hallucination Index (HI) ranges from 0%, indicating complete agreement between the site inspection results and the AI model, to 100%, representing total misalignment between them.
The
HI is calculated for the AI models (DS-A, DS-B, and DS-C) across all ten sample units and the results for longitudinal and transverse cracks are shown in
Figure 8 and
Figure 9, respectively.
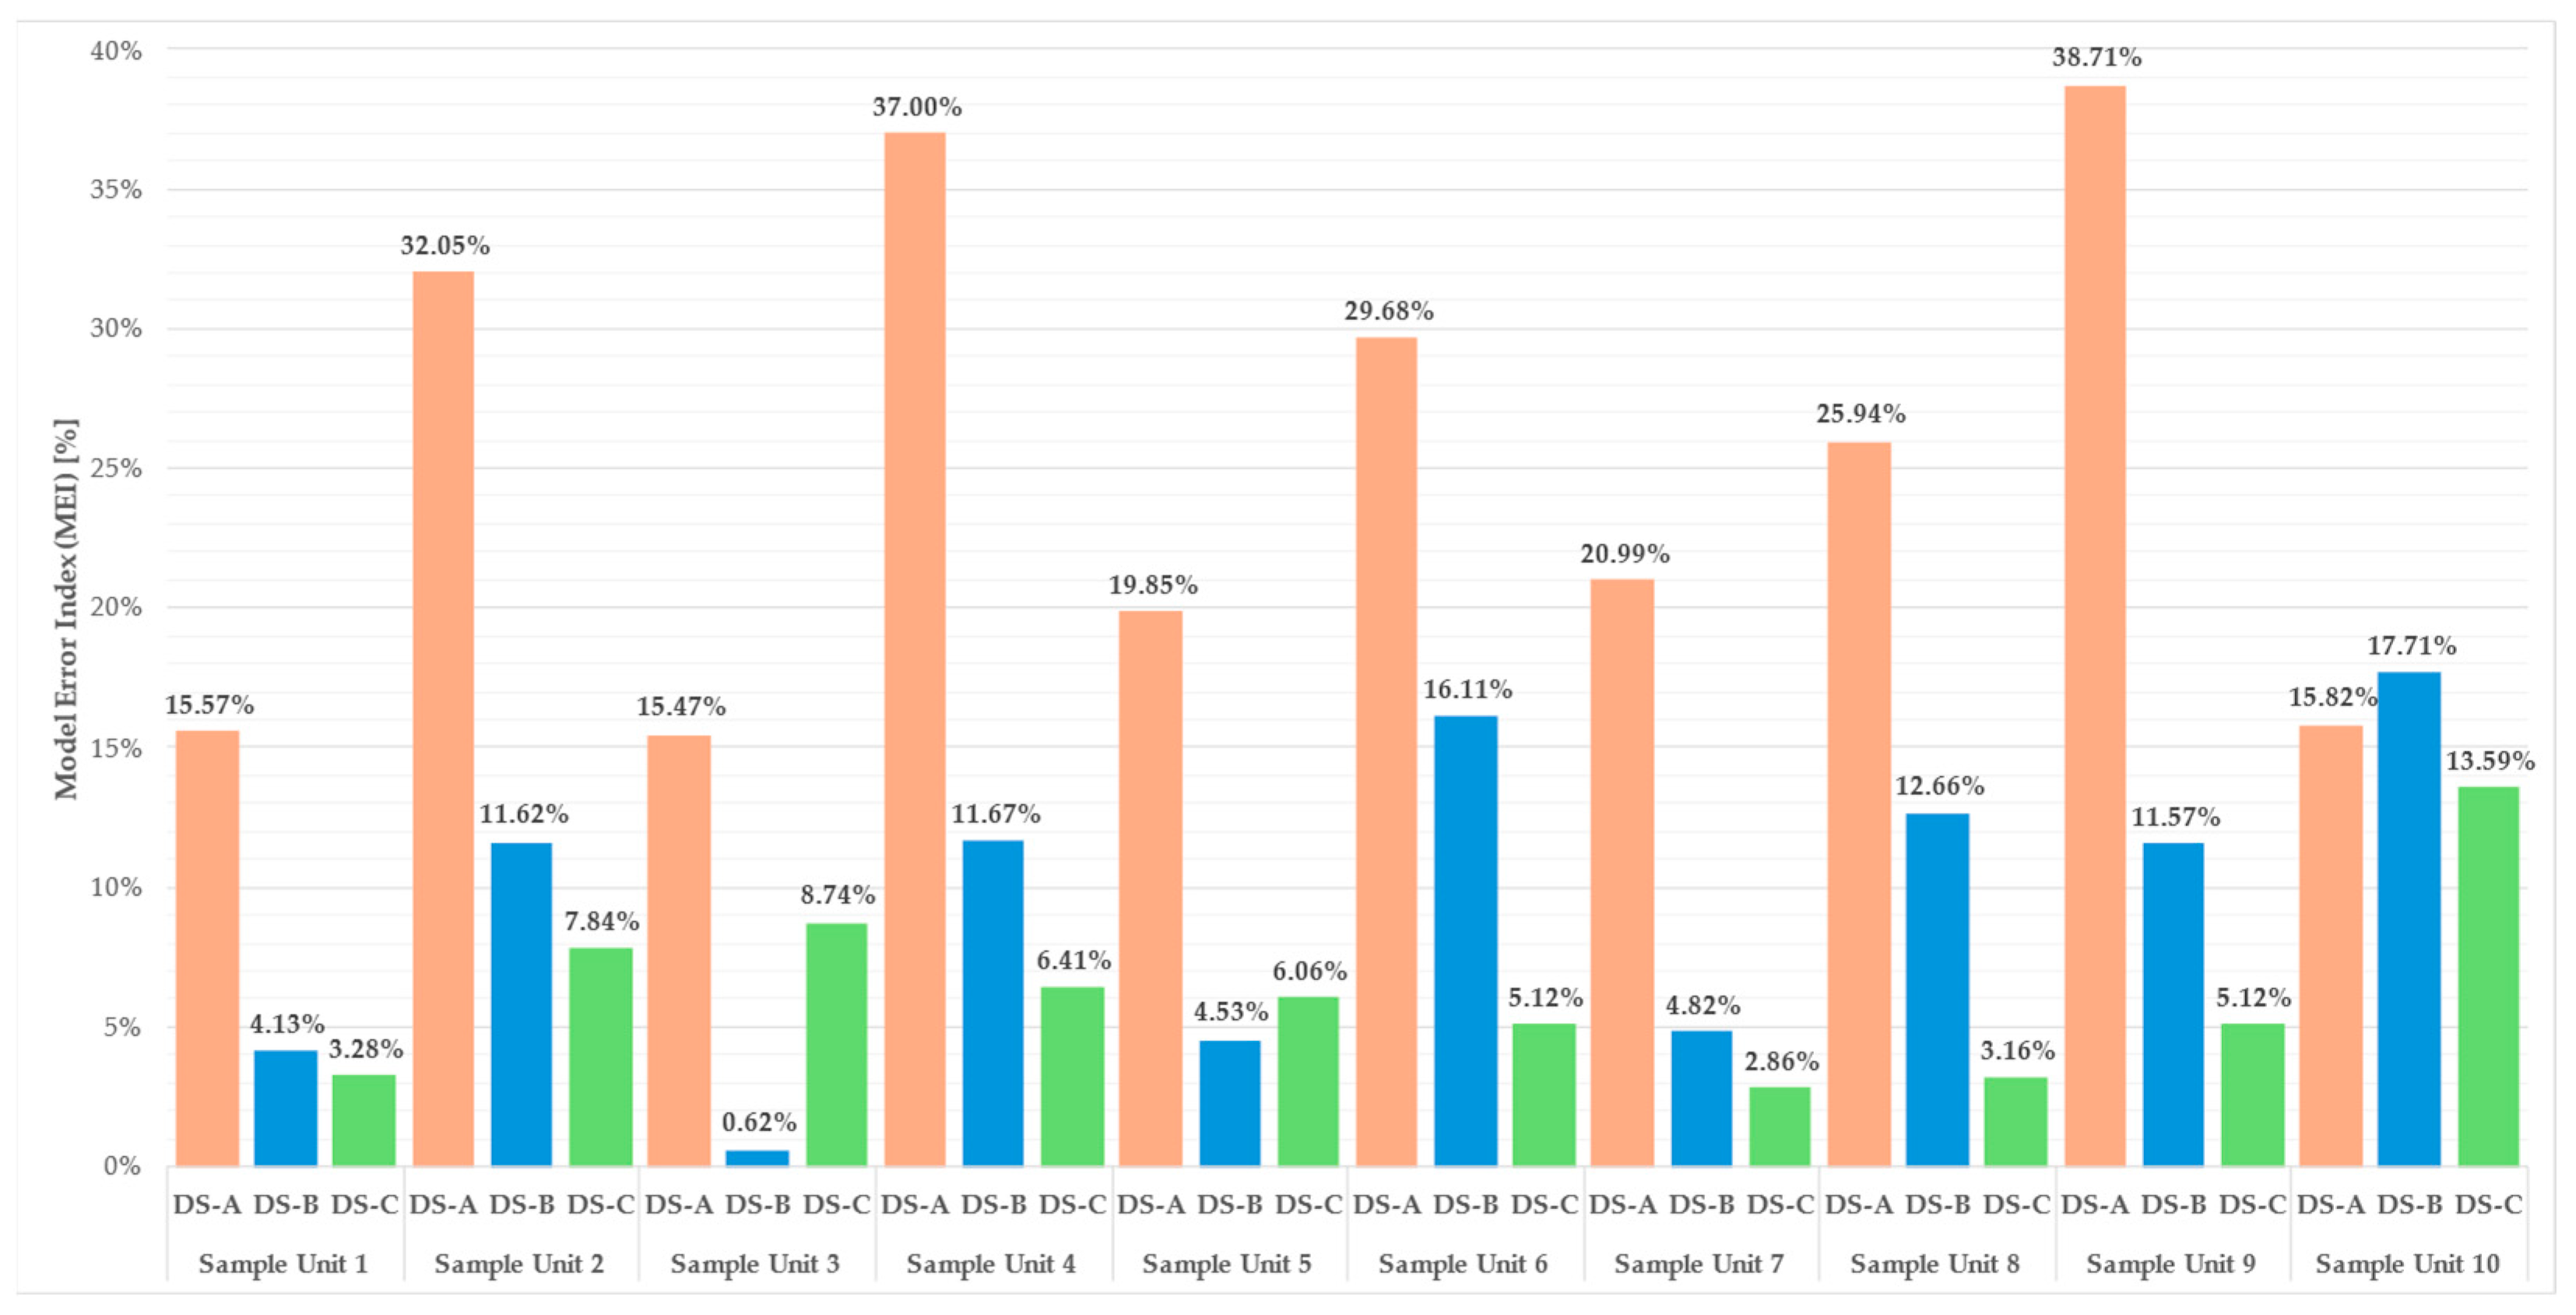
In Equation (2), presents the under-segmentation length of cracks (false negatives, i.e., cracks missed) detected by the model, while is the total ground-truth lengths of cracks, obtained from on-site inspections and field survey data. Similarly, the Model Error Index (MEI) ranges from 0%, indicating complete agreement between the site inspection results and the AI model, to 100%, representing total misalignment between them.
The
MEI is calculated for the AI models (DS-A, DS-B, and DS-C) across all ten sample units, and the results for longitudinal and transverse cracks are shown in
Figure 10 and
Figure 11, respectively.
For both longitudinal and transverse cracks, DS-C demonstrates a clear advantage. For instance, in the case of longitudinal cracks, on average, DS-C achieves a MEI of approximately 12.64%, compared to 31.15% for DS-B and 29.18% for DS-A. Moreover, DS-A exhibits frequent over-segmentation, often misinterpreting sealed cracks as active ones, especially in sections with complex maintenance histories, thereby inflating the total detected crack length.
A similar pattern emerges when analyzing transverse cracks. Here, the DS-C model again achieves superior results, with an average MEI of just 6.22%, compared to 9.54% for DS-B and a markedly higher 25.11% for DS-A. DS-C consistently identifies a greater portion of the true crack length, while generating fewer false positives. In contrast, DS-A shows clear signs of over-segmentation and a high HI, likely due to its inability to distinguish sealed cracks from active ones in the imagery.
The results further indicate that merely including images of sealed cracks in the training data (as carried out in DS-B) is not sufficient to fully address the issue of misclassification. Although DS-B does reduce HI value compared to DS-A, it still exhibits overestimation in multiple sample units. This underlines the critical importance of explicitly annotating sealed cracks as a separate class, enabling the model to learn their specific visual characteristics and avoid systematic confusion with structural distresses.
Comparative analysis reveals a consistent trend across nearly all sample units and both crack orientations. The DS-C model, which explicitly includes sealed cracks as a third semantic class, mostly achieves the lowest HI and MEI values. The DS-B model, which includes sealed cracks but does not differentiate them from active ones with a dedicated semantic class, ranks second, while DS-A, which entirely omits sealed cracks during training, shows the least accurate results. These findings support the hypothesis that explicitly labeling sealed cracks significantly improves model performance by reducing hallucinations and minimizing misclassification.
4. PCI Calculation and Confrontation
The correct detection and segmentation of the transverse and longitudinal cracks actually present in the images is vital for the correct evaluation of Pavement Condition Index (PCI) of each sample unit. According to ASTM D5340 [
20], the PCI value (dimensionless indicator) is a numerical rating of the pavement condition that ranges from 0 to 100, with 0 being the worst possible condition and 100 being the best possible condition. In this study, the PCI is calculated according to the methodology outlined in the earlier work by the authors of this study [
19]. To evaluate the performance of the models trained on the three different datasets a table of confrontation between the PCI values obtained by three AI models and PCI value calculated based on on-site inspection is shown in
Table 3.
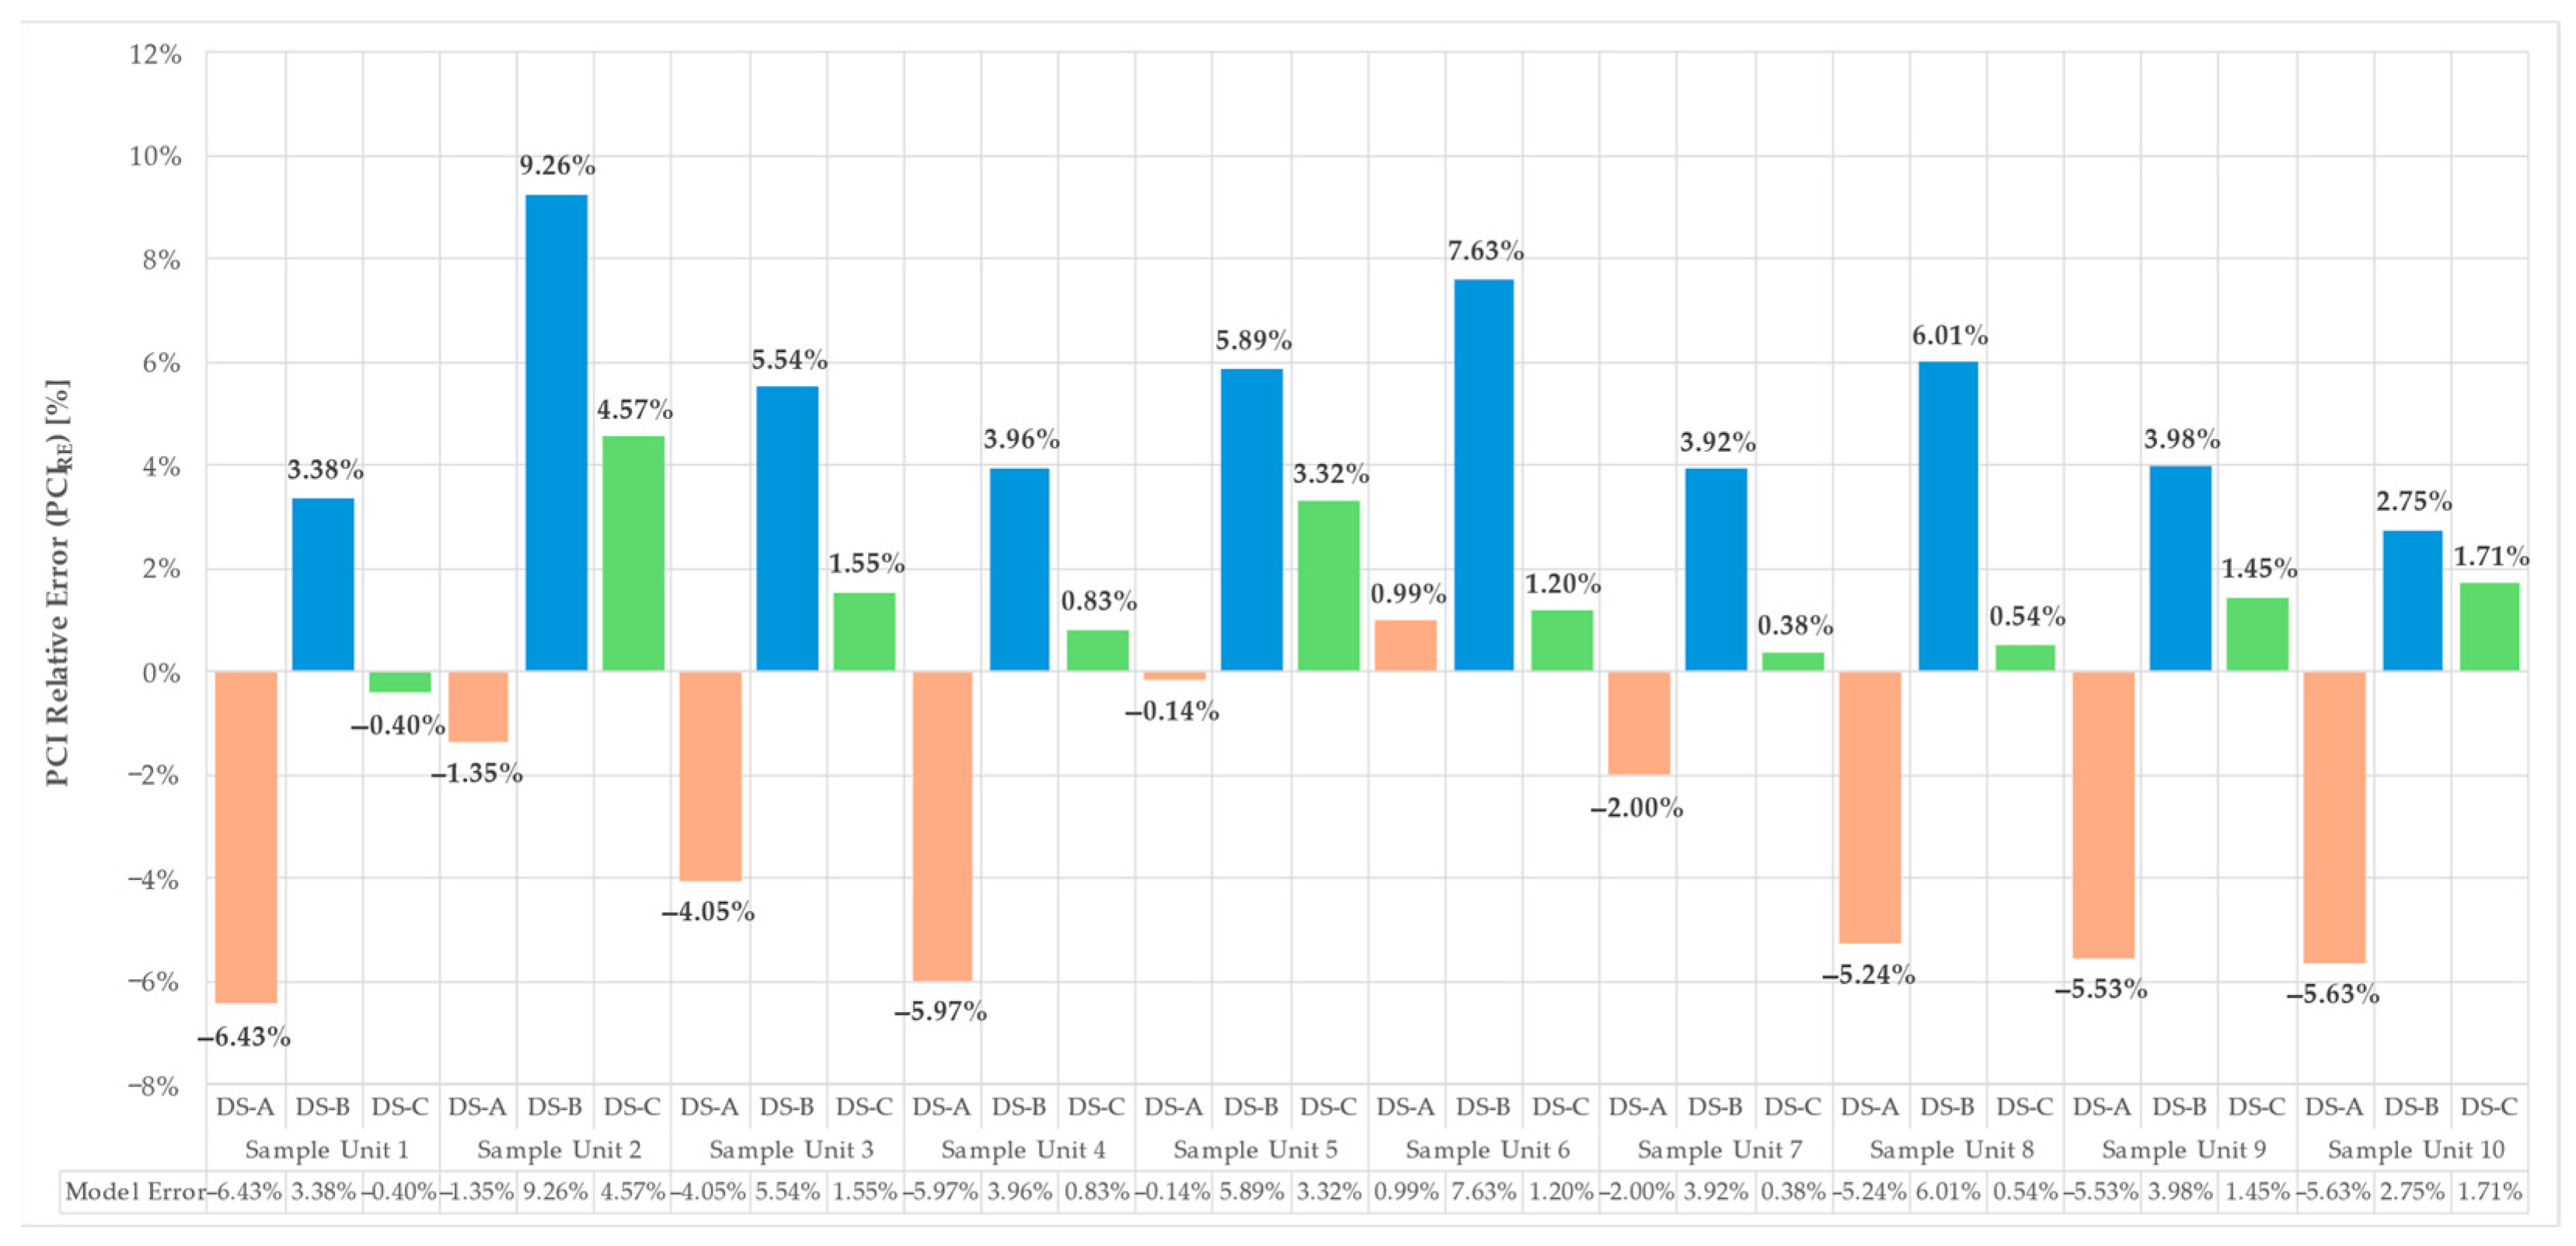
To better evaluate the efficiency of the AI models in the assessment of pavement condition, the PCI Relative Error (
PCIRE) [%], which is the error rate between the PCI calculated by AI models (DS-A, DS-B, and DS-C) and the actual PCI assessed via on-site inspection, is calculated through Equation (3).
In Equation (3),
presents the PCI, calculated based on the crack metrics obtained from the model, while
is the PCI calculated based on the ground-truth metrics of cracks, obtained from on-site inspections and field survey data. The PCI Relative Error (
PCIRE) approaches 0% when the model prediction perfectly matches the ground-truth PCI, indicating maximum accuracy. As
PCIRE increases and deviates from 0%, the prediction precision decreases, reflecting lower model reliability. The
PCIRE between the output of AI models and on-site inspections is presented in
Figure 12.
The results shown in
Figure 12 clearly demonstrate that the DS-C mostly has the best performance in the detection, segmentation, and calculation of the final PCI value of each sample unit. Basing the model’s performance evaluation only on the PCI values can misinterpret the outcome since the DS-A seems to perform better than the DS-B. In fact, the PCI values calculated via DS-A in some cases showed minor errors just because there are many false positive segmented cracks that compensate for the missing cracks. Therefore, to properly evaluate the performance of the trained models, a robust assessment should consider all three metrics: the Hallucination Index (
HI), the Model Error Index (
MEI), and the PCI Relative Error (
PCIRE).
