Article

Three-Dimensional Refined Modeling and Mechanical Response Analysis of Tunnel Structure Safety in Karst Areas

1
Powerchina Huadong Engineering Corporation Limited, Hangzhou 310014, China
2
Department of Architecture and Civil Engineering, City University of Hong Kong, Hong Kong 999077, China
3
School of Urban Construction, Changzhou University, Changzhou 213164, China
4
Shanghai Jianke Engineering Consulting Co., Ltd., Shanghai 200032, China
*
Author to whom correspondence should be addressed.
Infrastructures 2025, 10(11), 315; https://doi.org/10.3390/infrastructures10110315
Submission received: 16 October 2025 / Revised: 4 November 2025 / Accepted: 19 November 2025 / Published: 20 November 2025

Abstract

Deep-buried tunnels in karst regions are prone to complex deformation and stress redistribution due to the heterogeneity of surrounding rock and the presence of cavities. This study establishes a three-dimensional finite element model to investigate the mechanical behavior of tunnel linings under varying karst distributions and distances. The model incorporates realistic geological parameters and boundary conditions to analyze stress evolution and radial displacement of the lining under coupled mechanical effects. The results indicate that karst cavities located near the tunnel, especially beneath it, significantly amplify radial deformation and induce asymmetric stress concentrations. As the distance between the karst and the tunnel increases, the influence on lining response rapidly decreases and becomes negligible beyond approximately 3 m. The introduction of a secondary lining effectively reduces both tensile and compressive stresses by more than 65% and mitigates local deformation. The study concludes that the spatial position of karst features is the dominant factor affecting lining performance, and the composite lining structure provides an efficient means of ensuring safety and stability in water-rich karst tunnels.

1. Introduction

With the acceleration of urbanization, underground space development has become an essential component of modern urban construction. Proper underground space development not only alleviates surface space shortages and improves the urban environment but also promotes sustainable development of human settlements [1,2,3]. However, the interaction between underground space utilization and the ecological environment is complex; improper development may cause geological disturbance, hydrological imbalance, and ecological degradation [4,5].
In karst regions, underground engineering faces severe challenges due to the highly heterogeneous and discontinuous nature of the strata. The existence of cavities, fissures, and underground rivers often leads to disasters such as water inrush, collapse, and ground subsidence during tunneling [6,7,8]. Numerous studies have shown that tunneling disturbance in karst formations significantly alters groundwater dynamics and changes the mechanical properties of surrounding rocks, thereby affecting lining stresses and deformation patterns [9,10,11].
To explore these coupled processes, researchers have increasingly employed fluid–solid interaction theories and numerical simulations to study seepage and mechanical behavior in karst tunnels. Fluid–solid coupling models effectively describe the interaction between groundwater and rock mass, revealing nonlinear relationships among permeability, groundwater abundance, and construction disturbance [12,13]. Moreover, three-dimensional finite element and discrete element methods provide reliable tools for analyzing tunnel stability under complex karst conditions, elucidating how the spatial distribution of cavities influences lining performance and overall stability [14,15,16]. Recently, the peridynamics (PD) method has also been introduced to simulate crack initiation and propagation in geomaterials, providing a non-local framework for damage analysis [17,18].
As the scale of underground construction expands, environmental risks and sustainable management of karst tunneling have received growing attention. Scholars have proposed city-scale frameworks for environmental risk assessment and geological hazard prevention in underground space development, emphasizing the importance of balancing geological stability, groundwater protection, and ecological safety [19,20,21]. In particular, the integration of multi-scale monitoring and predictive risk modeling in water-rich karst regions offers scientific support for safe construction and environmental harmony [22,23].
In summary, the safety and environmental compatibility of tunnel construction in karst regions remain critical challenges in underground space development. This study focuses on the structural behavior under karst conditions, particularly the effects of water pressure loads applied to the tunnel lining. The model emphasizes the detailed consideration of structural elements such as bolts, joints, and the interaction between segments, highlighting the precision of the simulation. A thorough understanding of the mechanical response of the tunnel structure is essential for optimizing tunnel design, mitigating construction risks, and promoting the sustainable utilization of underground space, without relying on fluid–solid coupling models.
The main innovations and contributions of this study can be summarized as follows: a three-dimensional refined finite element model was developed to accurately simulate the interaction between the tunnel lining and the surrounding karst rock mass, considering different spatial positions and distances of karst cavities; the study quantitatively reveals the influence of karst cavity location on lining stress distribution and deformation, identifying critical distances that govern the structural response; and the mechanical improvement effect of the secondary lining is systematically evaluated, providing practical guidance for the design and reinforcement of tunnels in karst regions.

2. Project Overview

2.1. Introduction to the Project

The subsequent western route of the Expanded Hangjiahu South Drainage Project is located in Yuhang District, Hangzhou City, Zhejiang Province. The project starts from the Nanhu intake, passes through the Xianlinggang intake, and extends eastward to the Gujiaqiao Port intake of the north–south line project. The total length of the drainage tunnel is approximately 10.9 km, with an internal diameter of 10.5 m after lining. The tunnel invert elevation is about −55 m.

2.2. Geological Conditions

The surface strata in the project site area are primarily composed of Quaternary overburden, underlain by the Lower Ordovician Liuxia Formation (O1l), Upper Ordovician Changwu Formation (O3c), and Upper Cretaceous Qujiang Group (K1-2Q), consisting mainly of argillaceous siltstone, conglomerate, and siltstone. The karst area belongs to the Yuhang Fenghuangshan karst development zone, which generally aligns with the regional faults and stratigraphic strike, extending in a northeast direction. Its boundary is mainly controlled by the argillaceous siltstone of the Changwu Formation.
The development of karst within the investigation area is primarily influenced by the solubility of the bedrock, geological structures (including joints, faults, folds, and bedding orientations), neotectonic movements, and groundwater activity. Based on the burial conditions, the karst in this area is classified as covered karst, with the Quaternary overburden thickness ranging from approximately 4.0 to 27.0 m.
Accordingly, the karst features in the site area mainly include solution cavities, fissures, and pores, with no evidence of surface sinkholes, funnels, or collapse depressions. Along the water conveyance tunnel section, a total of 19 karst caves were identified by boreholes. Among them, 15 caves (78%) have heights less than 2.0 m, 2 caves (11%) have heights between 2.0 m and 5.0 m, and another 2 caves (11%) have heights less than 10.0 m. The maximum cave height revealed by drilling is 8.3 m.

3. Numerical Modeling

To investigate the influence of karst distribution characteristics on the mechanical response and deformation of the tunnel structure, a three-dimensional finite element model was established based on the engineering geological conditions. This modeling approach accounts for the heterogeneity of surrounding rock and the interaction between the lining and the ground, ensuring results closer to real tunnel behavior. The boundary conditions and key parameters are as follows.

3.1. Geometric Modeling

Based on the engineering background, representative geological strata were extracted for subsequent analysis. As the project involves a deep-buried tunnel, the model maintains the tunnel’s geometric dimensions and spatial position while varying only the characteristics of the karst zones and their surrounding areas. The model consists of the following main components: the geological strata (non-karst regions), the support system, and the karst zones with adjacent rock masses (see Figure 1).
The support system comprises the segmental lining structure, connecting bolts, backfill grouting, and the secondary lining. The segmental lining is assembled using staggered joints, with adjacent segments connected by bolts; the detailed assembly configuration is illustrated in Figure 1. The lining segments include three types—standard blocks, closure blocks, and abutment blocks—as shown in the corresponding schematic.

3.2. Constitutive Model

In the present model, the geological strata are composed of soil and rock masses. Under small deformation conditions, these materials can typically be represented by a linear elastic constitutive model. However, since the tunnel in this project extends to a depth exceeding 50 m, and considering the presence of adjacent karst formations, a more accurate evaluation of deformation characteristics necessitates the adoption of an elastoplastic constitutive model. Common elastoplastic models include the Mohr–Coulomb model, the Drucker–Prager (D-P) model, and the Hoek–Brown model. Considering the availability and reliability of geotechnical parameters, the Mohr–Coulomb constitutive model is employed in this simulation. The Mohr–Coulomb model was adopted to represent the rock mass behavior due to its simplicity, established parameter availability, and wide engineering applicability in tunnel analysis. Although this model reasonably reproduces the large-scale stress–strain characteristics, it does not explicitly describe nonlinear strength degradation or anisotropic failure in jointed rocks. In future studies, more advanced models such as Hoek–Brown or damage-based constitutive formulations could be introduced to capture the nonlinear and brittle failure processes in karst environments.
The karst zones generally consist of cavities, sometimes partially filled with deposits. These regions typically bear negligible external loads; therefore, in the model, they are represented as linear elastic materials with extremely low elastic modulus (set to approximately 10−6 times that of the surrounding rock mass) so as not to influence the stress characteristics of the adjacent strata. This simplification approach has also been adopted in previous karst modeling studies. Onyango [24] demonstrated that treating small karst voids as an equivalent porous medium with reduced stiffness can effectively capture their weakening influence on rock stability. Lin [25] and Wang [26] further verified that such simplification remains reasonable when the main concern is the lining’s mechanical response rather than fluid–solid coupling. To verify model robustness, the elastic modulus of the karst cavity was varied between 10−5 E₍rock₎ and 10−7 E₍rock₎ for sensitivity analysis. The resulting stress and deformation patterns were found to be qualitatively consistent, supporting the validity of this assumption.
For the rock mass within 3 m of the karst boundary, the elastic modulus is reduced to account for the potential weakening effect caused by groundwater dissolution. From a conservative standpoint, the reduction ratio is taken as 90% [27].
Both the segmental and secondary linings are composed of reinforced concrete, which possesses a high elastic modulus and undergoes relatively small deformation. Thus, a linear elastic model is appropriate for these components. In this study, the reinforcing steel and concrete are not modeled separately; instead, the reinforced concrete is treated as a homogeneous material with equivalent properties. Adjacent lining segments are connected by steel bolts. Given the much higher elastic modulus of steel compared to other materials, its deformation is minor, and a linear elastic representation is deemed suitable.
During shield tunneling, synchronous grouting is employed to compensate for the ground loss caused by cutterhead over-excavation. Once hardened, the grout exhibits a relatively high elastic modulus and can likewise be modeled as a linear elastic material. The material parameters used for all components are summarized in the accompanying Table 1.

3.3. Loads, Steps and Boundary Conditions

The tunnel in this project is designed for water conveyance and is therefore subjected to both external groundwater pressure and internal hydraulic pressure. As the external groundwater supply is sufficient and stable, the hydraulic head acting on the lining remains nearly constant during construction. Consequently, the external water pressure is modeled as a static hydrostatic pressure distribution. In addition, since groundwater seepage within the rock mass is partially impeded by the low permeability of the strata, the magnitude of the applied hydraulic pressure is appropriately reduced to account for this attenuation.
The entire model is also subjected to gravitational loading, with gravitational acceleration taken as 9.8 m/s2.
The numerical analysis shown in Figure 2 is conducted through the following steps:
(a)
Initial Geostress Equilibrium. Under karst conditions, an initial geostress equilibrium analysis is performed to establish the in situ stress field of the entire geological domain.
(b)
Stress Release of Surrounding Rock. According to the New Austrian Tunneling Method (NATM), immediate support is not applied after tunnel excavation, leading to partial stress release in the surrounding rock. Two common approaches can be used to simulate this stress release: (1) Extract the nodal geostress values around the tunnel contour, reduce them by a specified ratio, and reapply the reduced stresses in the opposite direction to achieve a new geostress equilibrium; Or (2) Reduce the elastic modulus of the rock mass within the tunnel contour and re-establish geostress equilibrium to obtain the updated stress field.
(c)
Excavation and Installation of Primary Lining (Including Backfill Grouting and Bolts). Excavate the rock and soil within the tunnel contour and activate the lining segments, backfill grout, and connecting bolts using the model change technique.
(d)
Installation of Secondary Lining. When considering the working condition with a secondary lining, this structural layer is activated. Generally, two types of contact relationships are possible between the primary and secondary linings. If surface roughening of the segmental lining is considered, the bonding strength between the two linings is high, and they can be modeled as an integrated system using tie contact. If no roughening is considered, the bonding strength is relatively weak, and slip may occur at the interface. In this case, a frictional contact model is more appropriate. In this study, the latter approach is adopted: tangential behavior is defined as frictional contact with a friction coefficient of 0.8, while normal behavior is modeled as hard contact, meaning the interface can transmit compressive stresses but not tension.
(e)
Application of Internal Water Pressure. After construction, the operational condition of the tunnel is analyzed to assess the stability of the supporting structure. Internal water pressure is applied in this step, and the mechanical responses of the primary lining, secondary lining, and other structural components are obtained. Water pressure was applied as an external static load to emphasize the structural mechanical response rather than a full fluid–structure coupling process.
Figure 2. Simulation process.
Infrastructures 10 00315 g002
To further reveal the combined influence of the spatial position of the karst cavity and its distance from the tunnel, multiple simulation conditions were established, including karst located above, below, and on both sides of the tunnel. The resulting mechanical and deformation responses of the lining were compared across these conditions.

4. Results

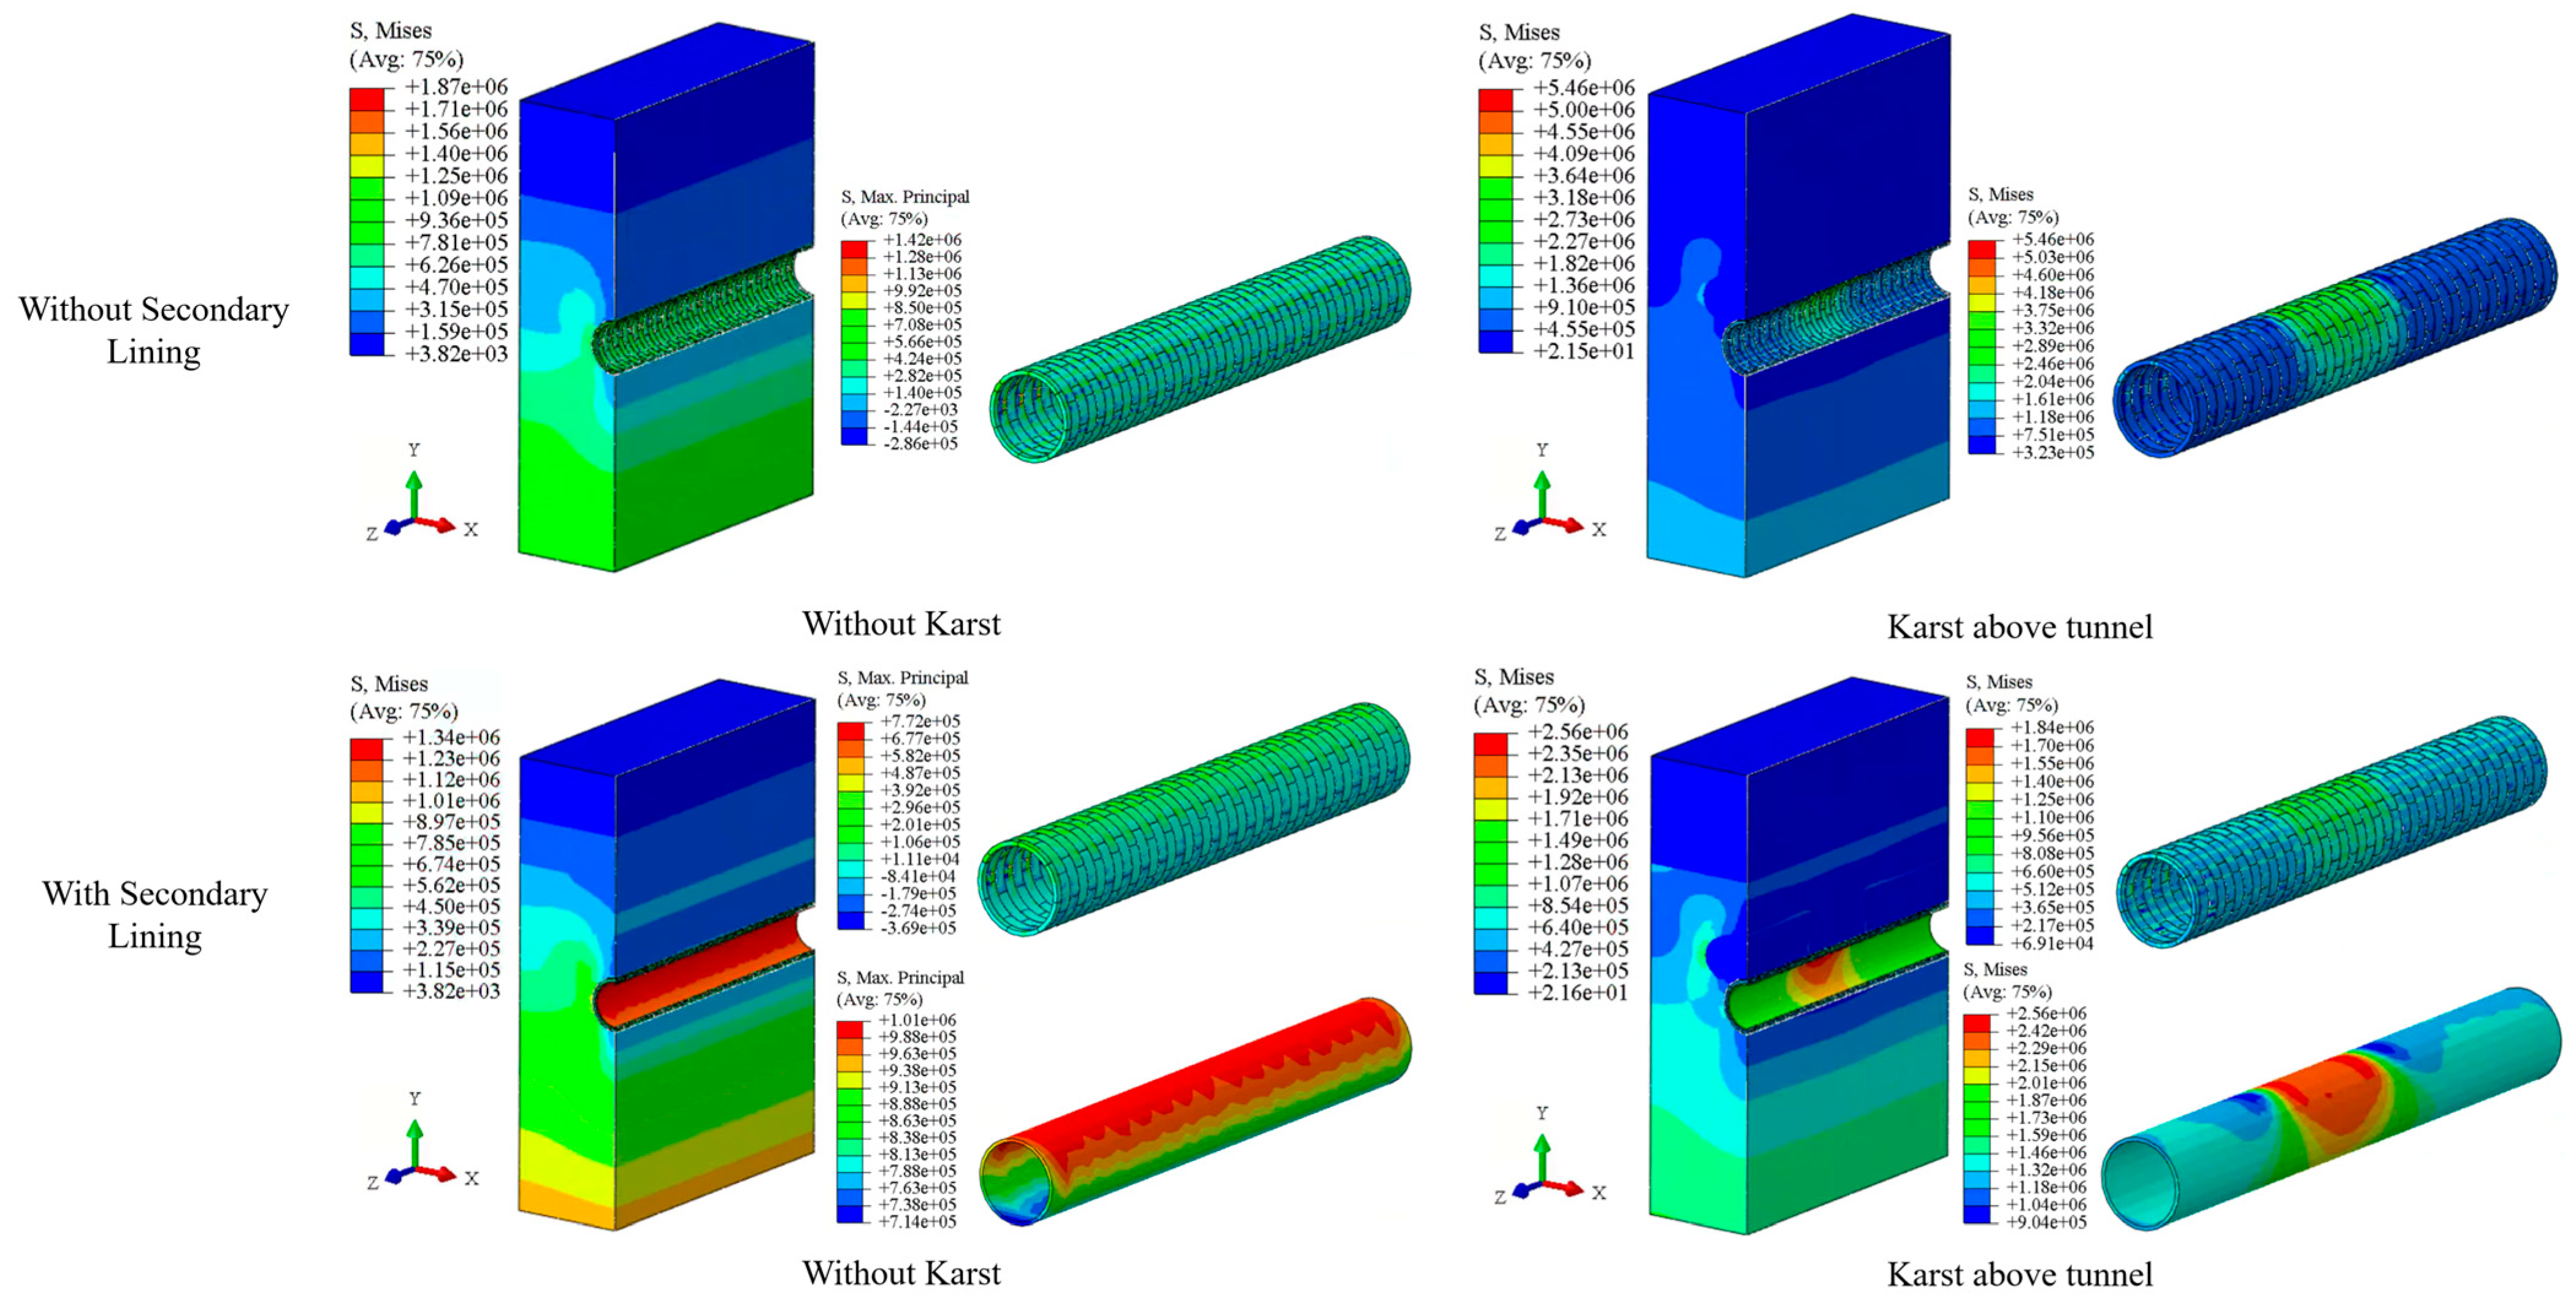
The presence of karst cavities significantly influences the three-dimensional distribution of stress and displacement in the surrounding rock. As shown in Figure 3, in the absence of karst, the displacement of the surrounding rock remains relatively uniform across different cross-sections perpendicular to the tunnel axis. However, when a karst cavity is located near the tunnel, the internal water pressure induces local deformation due to the lack of sufficient confining support from the surrounding rock in the vicinity of the cavity. Consequently, the tunnel lining in this region tends to bulge outward under the combined effect of the reduced confinement and internal hydraulic pressure.
The results indicate that, in the absence of karst cavities, the tunnel exhibits a typical deformation pattern characteristic of deep-buried tunnels. Under conditions without tectonic stress, the lateral earth pressure acting on the tunnel is generally smaller than the vertical pressure, leading to an “elliptical” or “horizontal egg-shaped” deformation mode of the lining structure.
In contrast, when a karst cavity is located directly above the tunnel, with only 0.5 m between the cavity boundary and the tunnel crown, the tunnel experiences pronounced non-uniform deformation along its longitudinal axis under the combined effects of internal and external water pressures. The maximum displacement reaches 12.4 mm (without secondary lining) and 6.52 mm (with secondary lining), representing substantial increases compared with the non-karst case—1.0 mm (without secondary lining) and 0.95 mm (with secondary lining)—corresponding to increases of approximately 1130% and 586%, respectively.
In a water conveyance tunnel, the internal hydraulic pressure plays a dominant role in structural stability. Both the surrounding rock and the outer surface of the lining jointly resist the internal water pressure. However, when the tunnel is adjacent to a karst zone, the voids and dissolution-induced weakening significantly reduce the bearing capacity of the surrounding rock behind the lining. Consequently, the lining tends to bulge outward in these areas due to insufficient confinement.
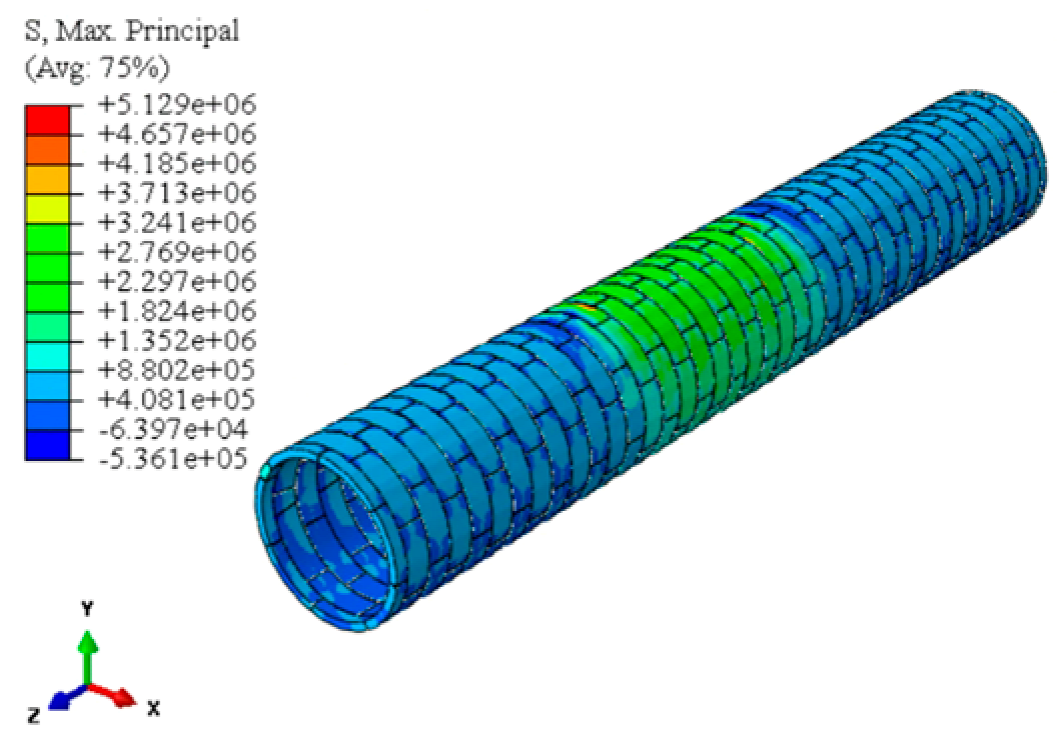
Moreover, the presence of a secondary lining substantially improves the overall stress and deformation performance of the tunnel structure shown in Figure 4. Under karst-affected conditions, the maximum Mises stress of the structure decreases from 5.46 MPa to 2.56 MPa with the inclusion of the secondary lining. The stress within the segmental lining itself is reduced to 1.84 MPa, representing a 66.3% reduction. Because the internal water pressure exceeds the external earth and hydrostatic pressure, the secondary lining bears higher stresses, with its stress level approximately 39.1% greater than that of the primary segmental lining.
From the perspective of stress transfer mechanisms, when the karst cavity is close to the tunnel, the bearing capacity of the surrounding rock decreases, causing the lining to take on greater external loads and forming stress concentration zones at the invert and sidewalls. The simplification of the karst cavity as a linear elastic body may underestimate collapse effects but allows clear identification of geometric influences. As the distance increases, the rock mass regains integrity, and the lining stress significantly decreases.

5. Discussion

To systematically explore the influence of karst distribution on the mechanical behavior of the tunnel structure, this section compares the variation patterns of stress and displacement fields under different spatial configurations and distances, aiming to identify the key controlling factors of karst effects.
Water pressure loads are applied directly to the lining without fluid–solid coupling. While this allows detailed assessment of the structural mechanical response, it does not capture dynamic seepage or pore pressure effects, which could slightly alter local stresses. Nevertheless, this simplification is reasonable because the surrounding rock and groundwater pressure mainly act as quasi-static loads under steady-state conditions, and the focus of this study is the mechanical performance of the lining structure itself. Therefore, conclusions regarding stress magnitudes should be interpreted within this modeling assumption.
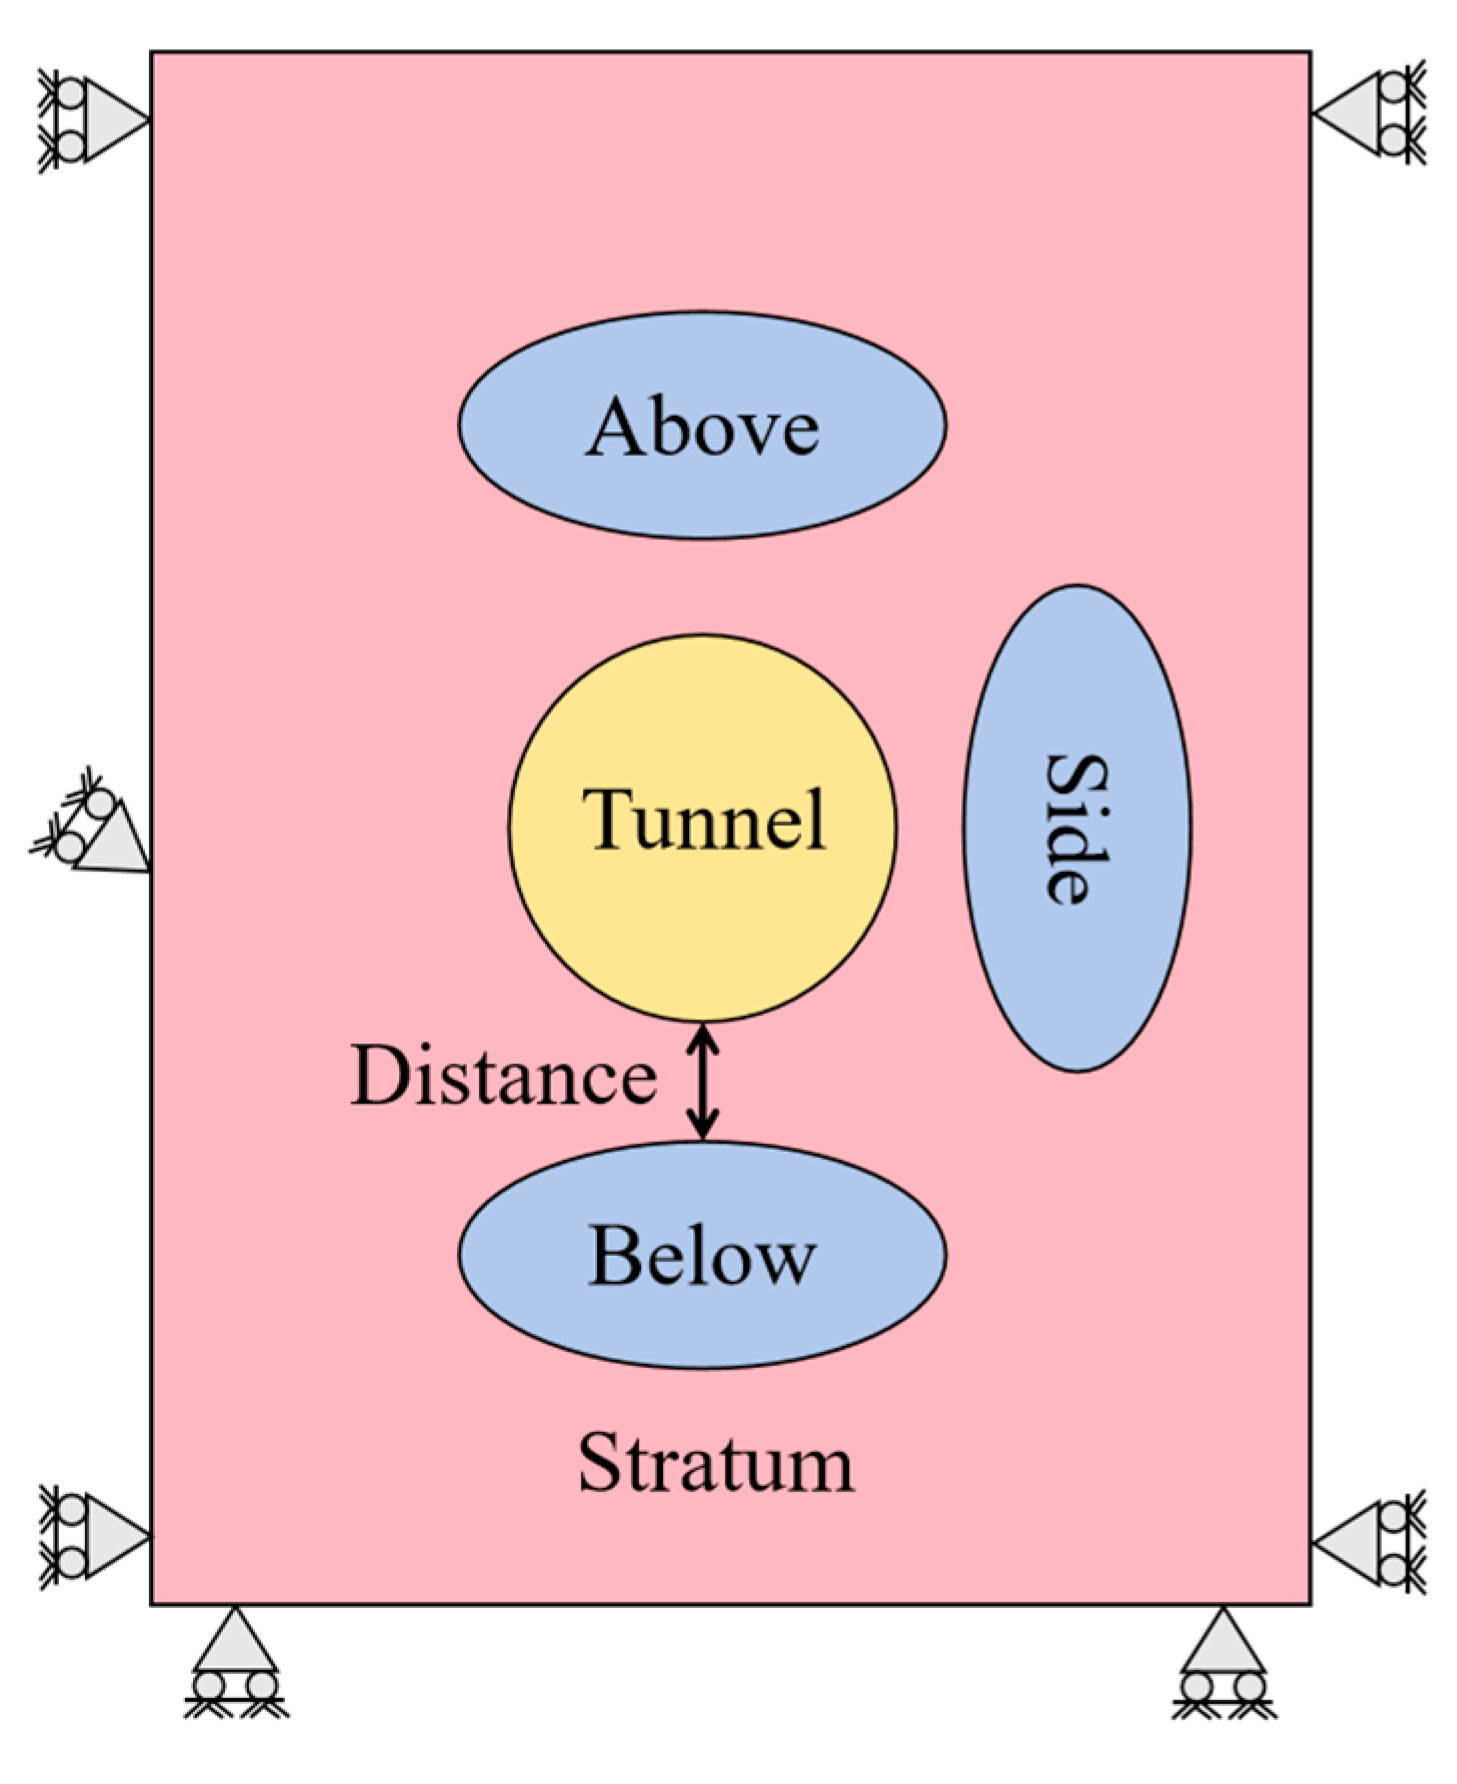
According to relevant engineering experience, the relative spatial relationship between the karst cavity and the tunnel has a significant influence on the mechanical behavior of the supporting structure. In this study, this relationship is simplified into three fundamental configurations: the karst cavity located above, beside, and below the tunnel, as illustrated in Figure 5. Based on these configurations, further analyses are conducted to investigate how variations in the distance between the karst zone and the tunnel affect the structural mechanical response, with the objective of identifying the critical distance at which the influence of karst becomes significant.

5.1. The Influence on Stress Field

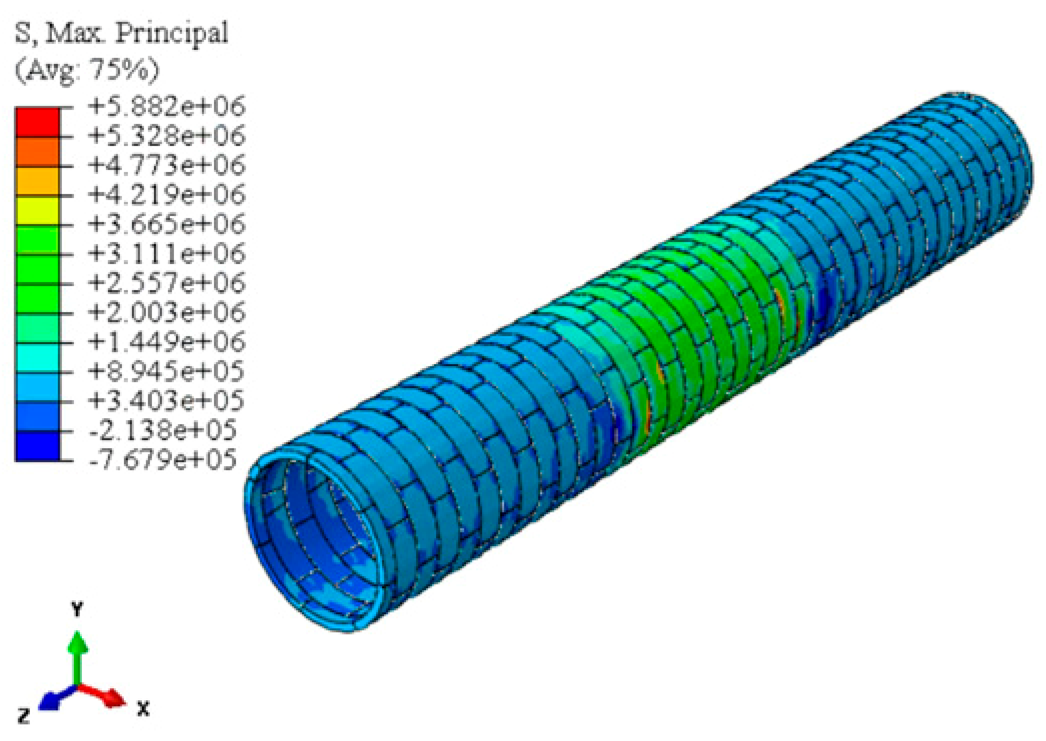
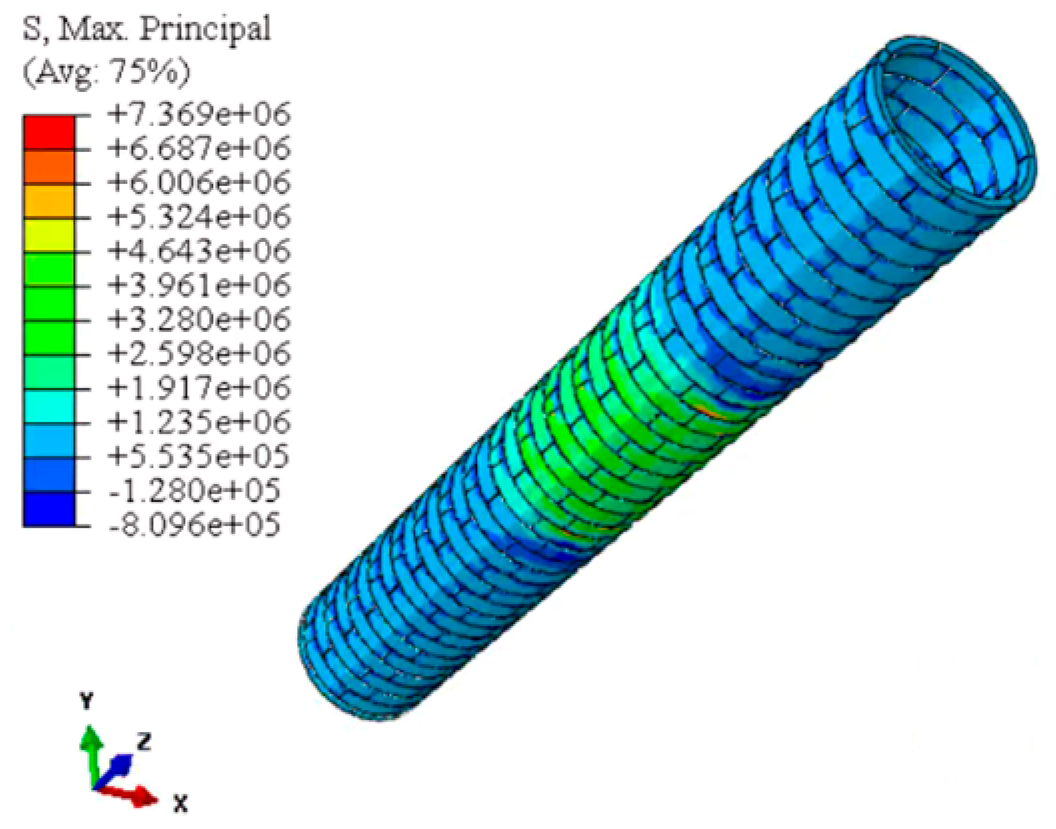
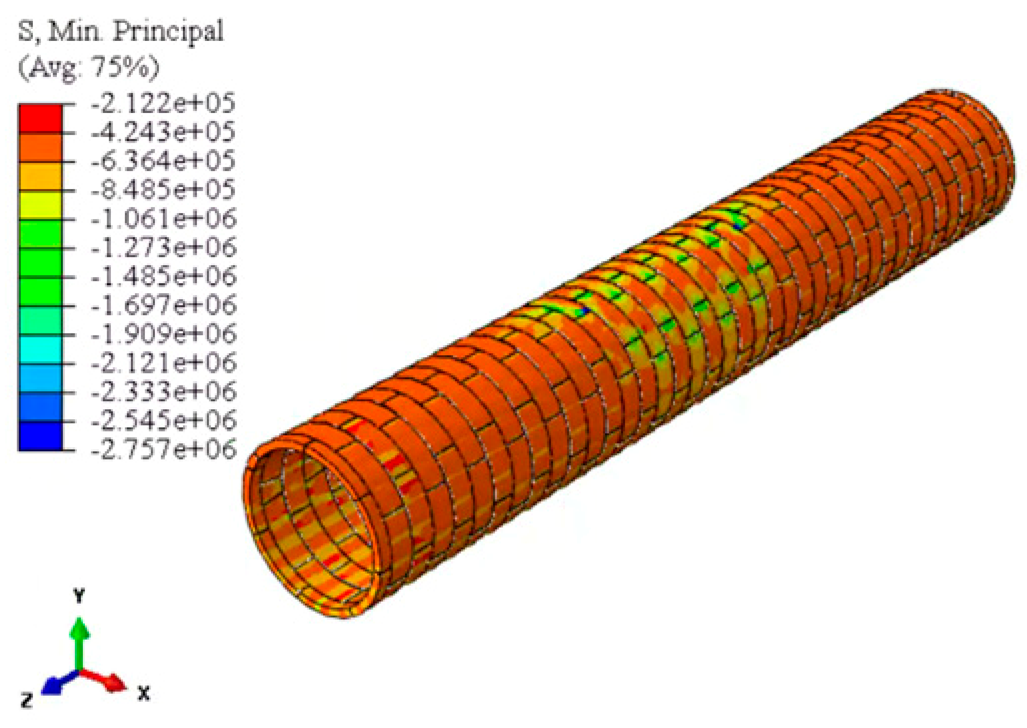
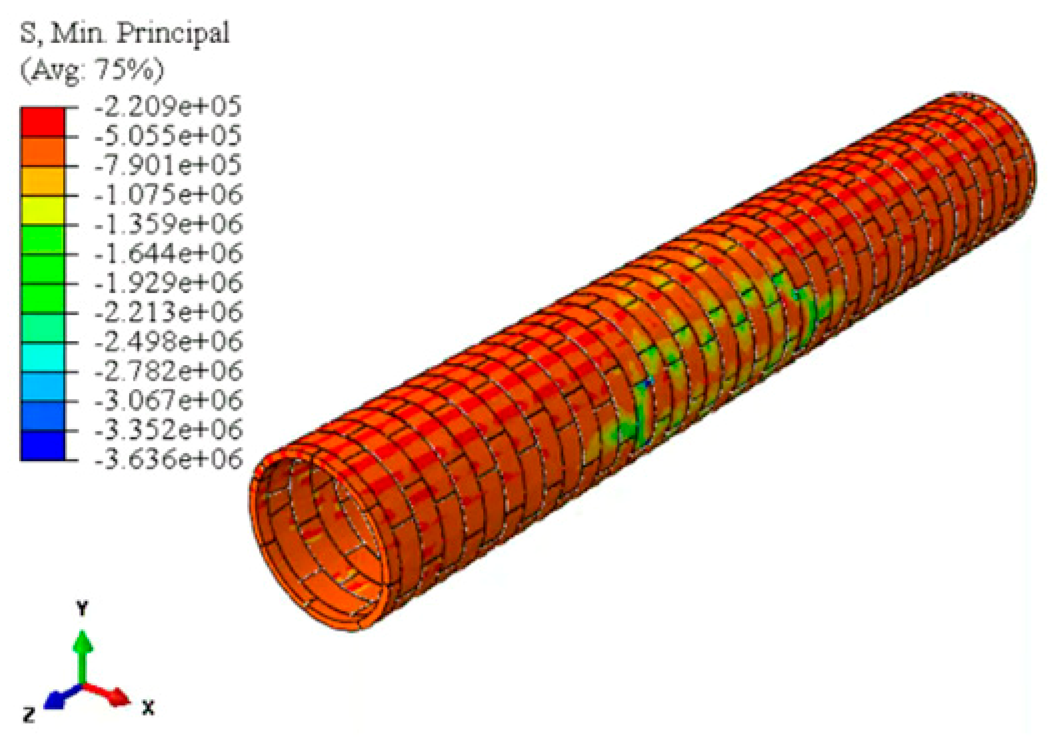
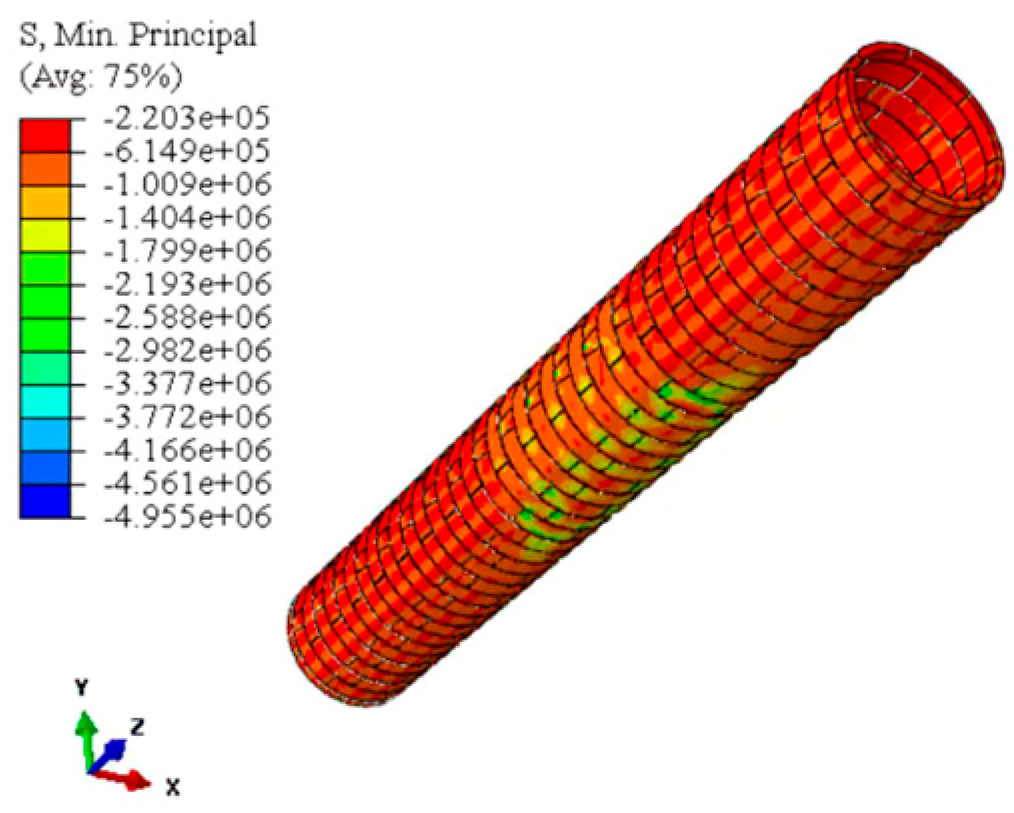
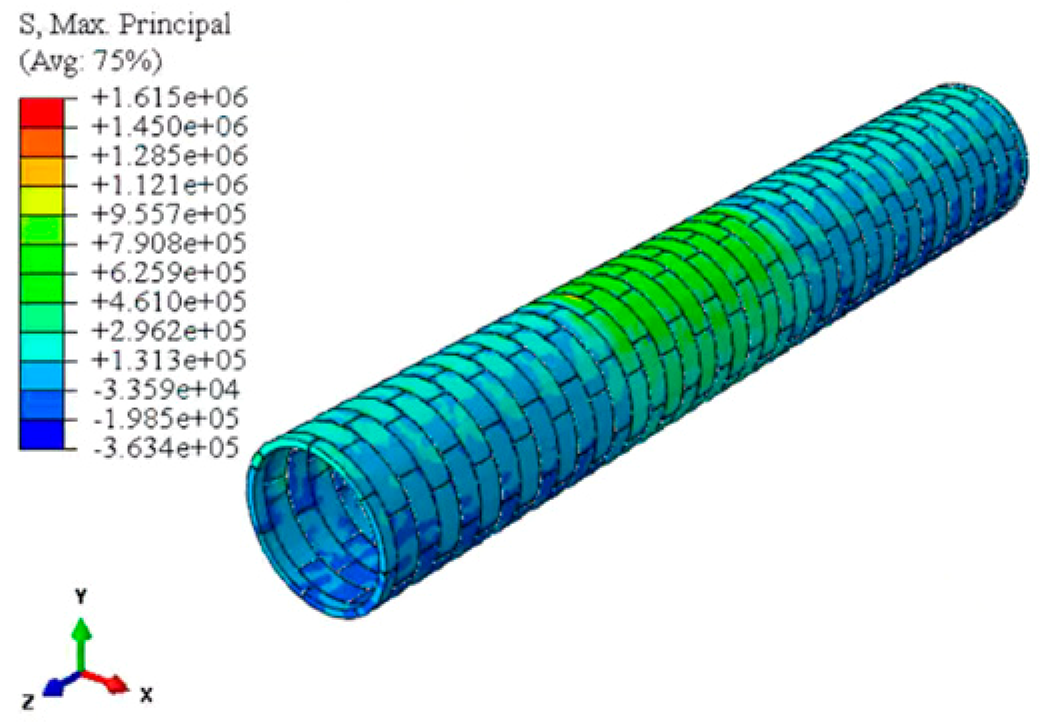
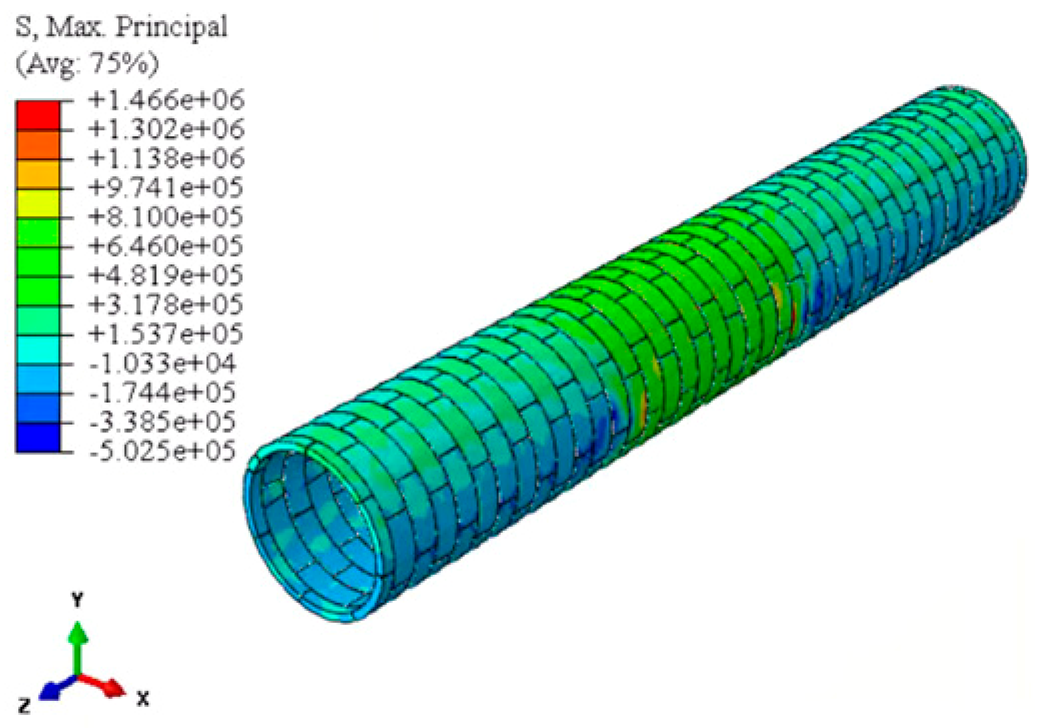
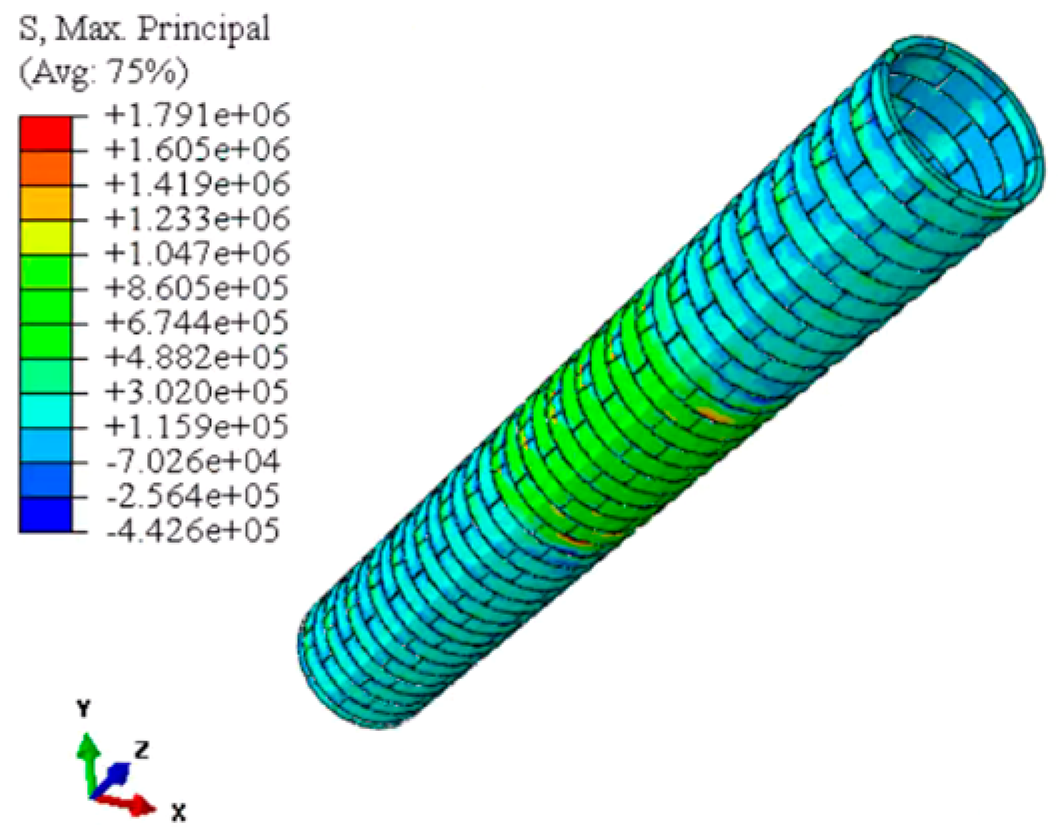
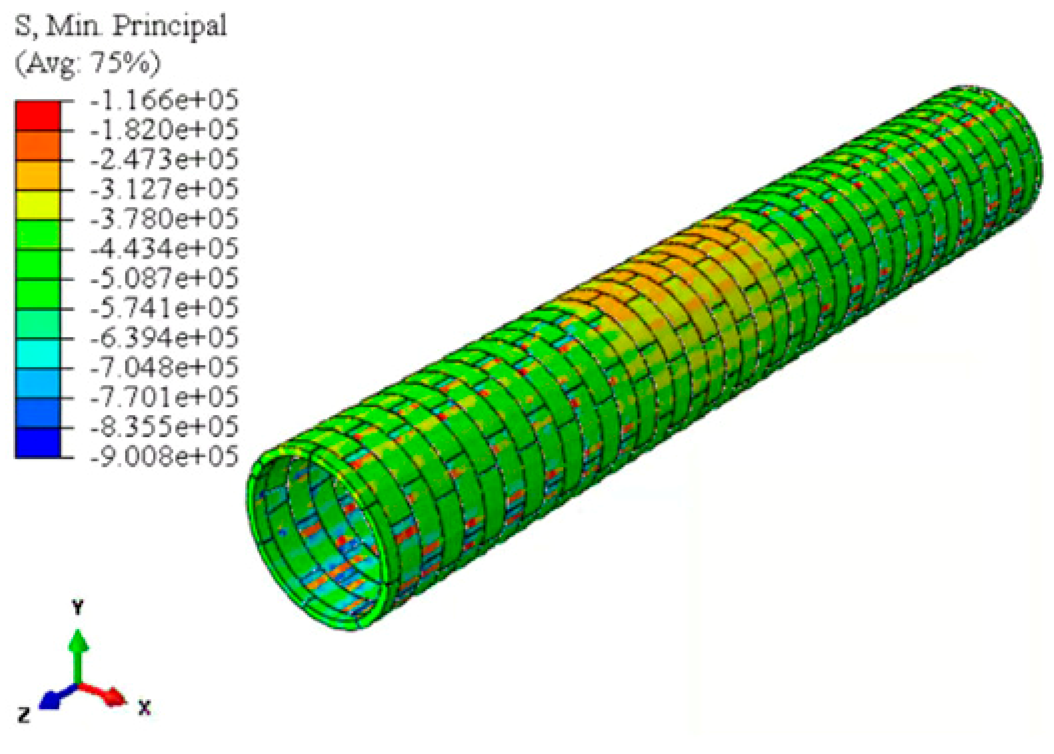
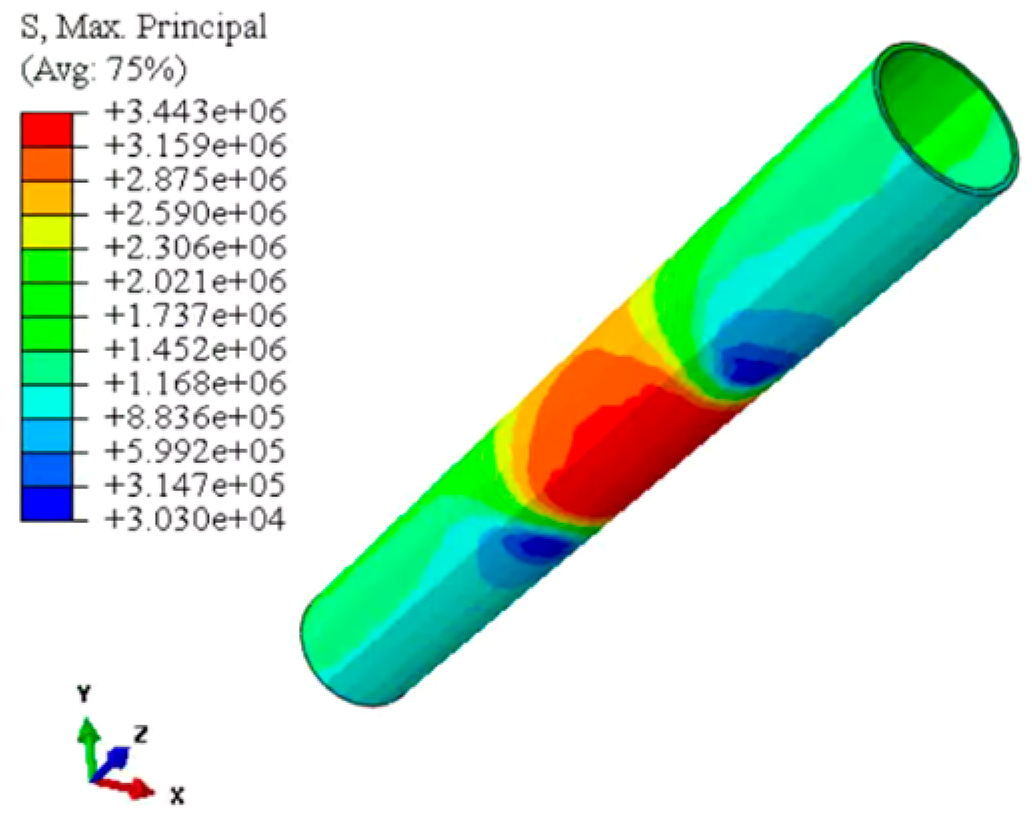
First, taking the condition where the karst cavity is located 0.5 m from the tunnel as an example, the computed stress and displacement fields are shown in Table 2. The results indicate that the maximum stress in the lining is concentrated in the section closest to the karst zone, followed by the midsection above the cavity, while the stress level in areas farther from the karst remains relatively uniform. In addition, due to the segmented configuration of the tunnel lining, the circumferential stress distribution is discontinuous. Influenced by the interaction between bolts and segments, as well as between adjacent segments, the maximum stress often appears at the segment edges, which is particularly evident in the distribution of maximum compressive stresses.
Furthermore, the relative position between the karst cavity and the tunnel has a pronounced effect on the stress level. When the karst cavity is located beneath the tunnel, at a distance of 0.5 m, the maximum tensile stress in the lining reaches 7.37 MPa, and the maximum compressive stress is 4.96 MPa. In contrast, when the karst cavity is positioned above the tunnel at the same distance, the maximum tensile stress decreases to 5.13 MPa, and the maximum compressive stress to 2.76 MPa. Evidently, the lower strata beneath the tunnel are deeper and generally subject to higher in situ stresses, which should provide stronger confinement and support. However, the presence of a karst cavity undermines this support by reducing the reaction force, causing the lining to bear larger unbalanced loads and resulting in more pronounced stress variations.
Under internal water pressure, the lining is more susceptible to tensile failure, indicating that relying solely on segmental lining as the primary support system offers limited redundancy. When both the primary lining and secondary lining jointly bear the load, the stresses in the primary lining are significantly reduced. Therefore, for critical water conveyance tunnels, the addition of a secondary lining is generally necessary to enhance structural safety. In this section, comparative analyses are conducted between cases with and without the secondary lining to quantify its contribution in improving the mechanical performance of the support system.
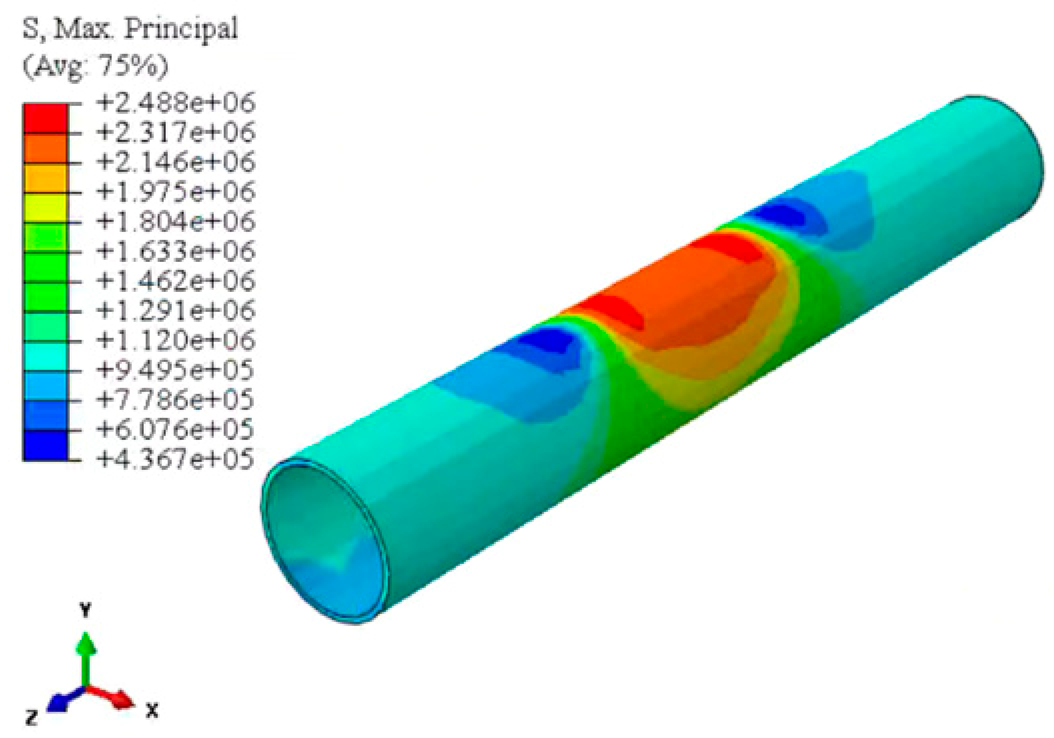
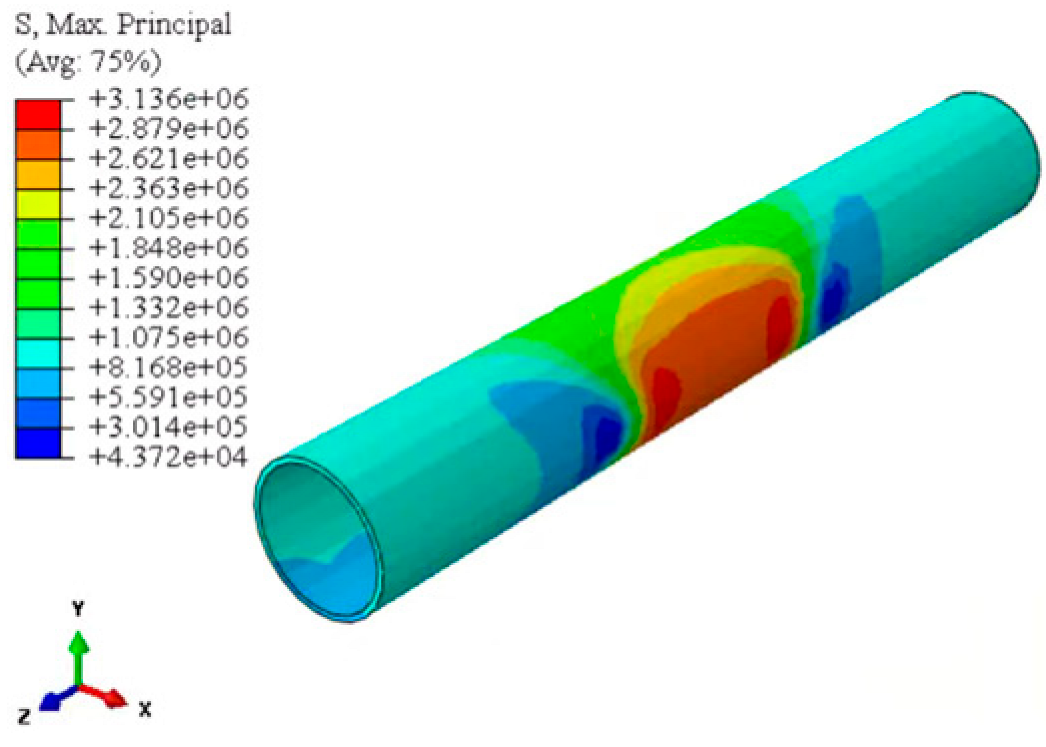
Under the same conditions, the addition of a secondary lining markedly reduces the stress level in the segmental lining as shown in Table 3. Specifically, when the karst cavity is located above, beside, and below the tunnel, the maximum tensile stress in the segments decreases by 68.4%, 75.0%, and 75.7%, respectively, while the maximum compressive stress decreases by 67.3%, 67.3%, and 77.4%, respectively. Moreover, the presence of the secondary lining leads to a more uniform stress distribution in the primary lining, effectively mitigating local stress concentrations and enhancing the overall structural integrity of the support system.
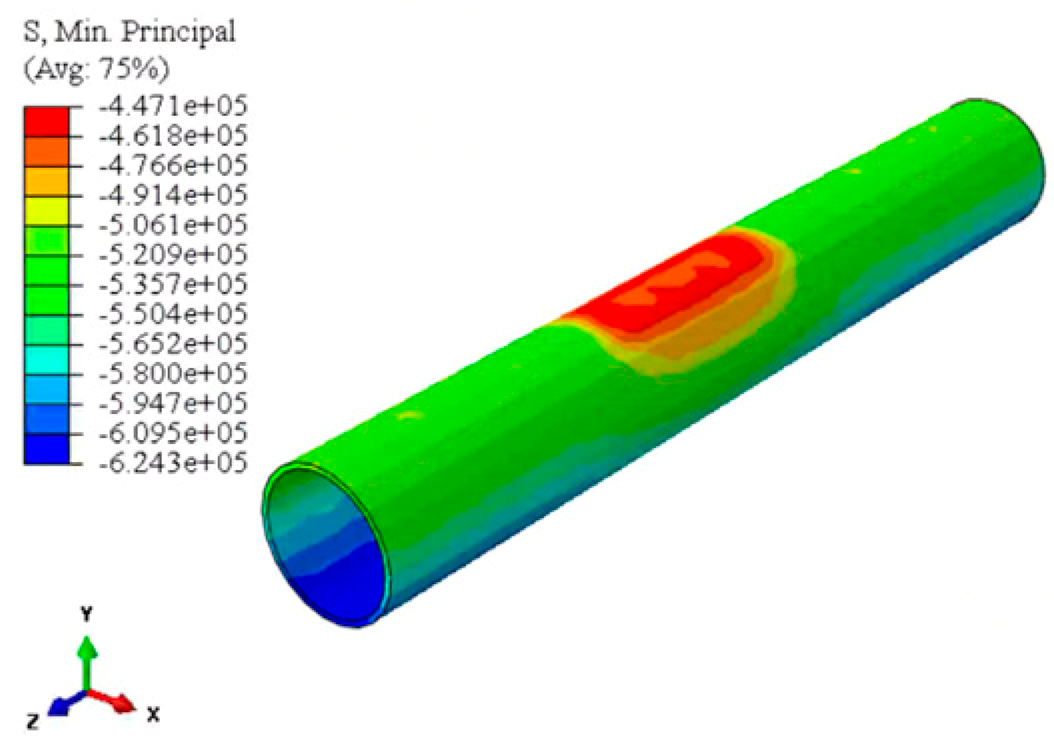
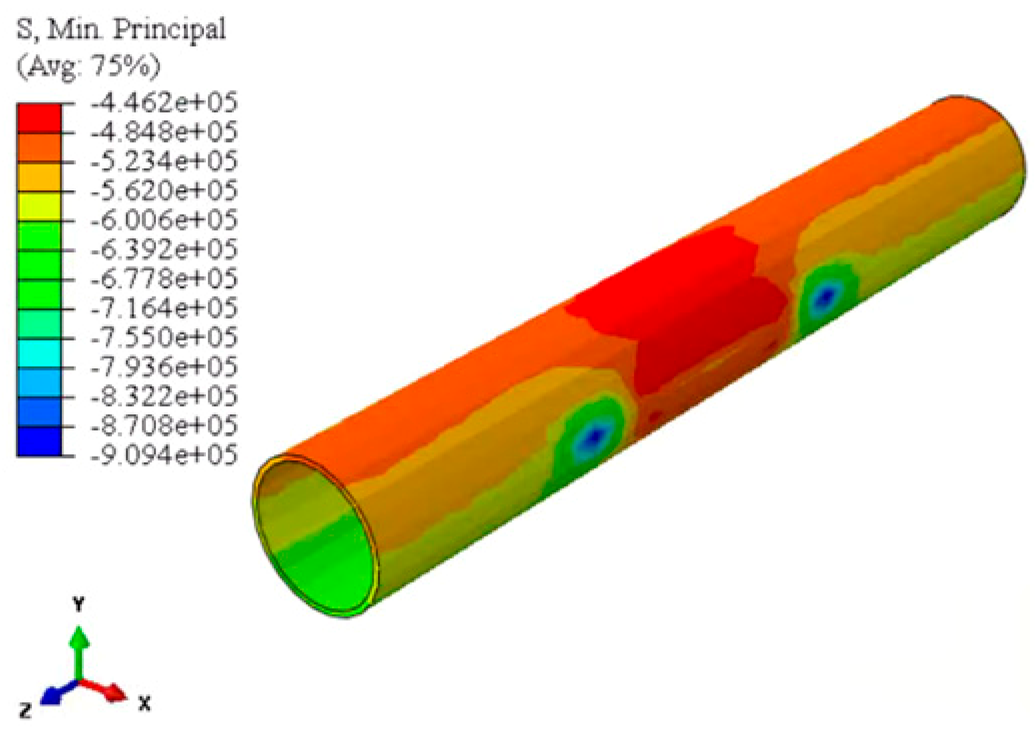
Meanwhile, the secondary lining primarily bears the load from internal water pressure, resulting in relatively higher stress levels compared to the primary lining. Since the secondary lining is cast as a monolithic concrete structure without segmentation, its stress distribution is more continuous as shown in Table 4. The maximum tensile stress is mainly concentrated on the side adjacent to the karst cavity, whereas a distinct tensile stress valley appears on the side beyond the karst boundary. The maximum compressive stress, in contrast, occurs on the opposite side of the karst cavity (when the karst is above the tunnel) or outside the karst boundary region (when the karst is beside or below the tunnel).
Notably, the magnitude of the maximum compressive stress is roughly an order higher than that of the maximum tensile stress. Given that concrete exhibits significantly lower tensile strength compared to compressive strength, the mechanical analysis primarily focuses on the distribution of tensile stress regions.
Building on the previous analysis, this section further investigates the influence of the distance between the karst cavity and the tunnel on the tensile stress in the lining. As shown in Figure 6, the maximum tensile stress in the lining (including both primary and secondary linings) gradually decreases as the distance from the karst cavity increases, with the rate of reduction slowing down. When the distance exceeds approximately 3 m, the displacement stabilizes and becomes nearly uniform. This indicates that beyond a certain range, the influence of the karst cavity on the lining is minor and can be considered secondary.
Additionally, at small distances, the maximum tensile stress under the condition of only a primary lining is significantly higher than that when both the primary and secondary linings share the load. The combined action of the primary and secondary linings effectively increases the equivalent section height of the lining, thereby enhancing its bending stiffness (EI). As a result, under the same loading conditions, the stress level is substantially reduced. However, as the distance between the karst cavity and the tunnel increases, the difference in stress levels between the two support scenarios gradually diminishes.
The inclusion of a secondary lining effectively redistributes the external and internal pressures, significantly reduces principal stress levels, and suppresses deformation development, confirming its safety advantages in water-rich karst environments.

5.2. The Influence on Displacement Field

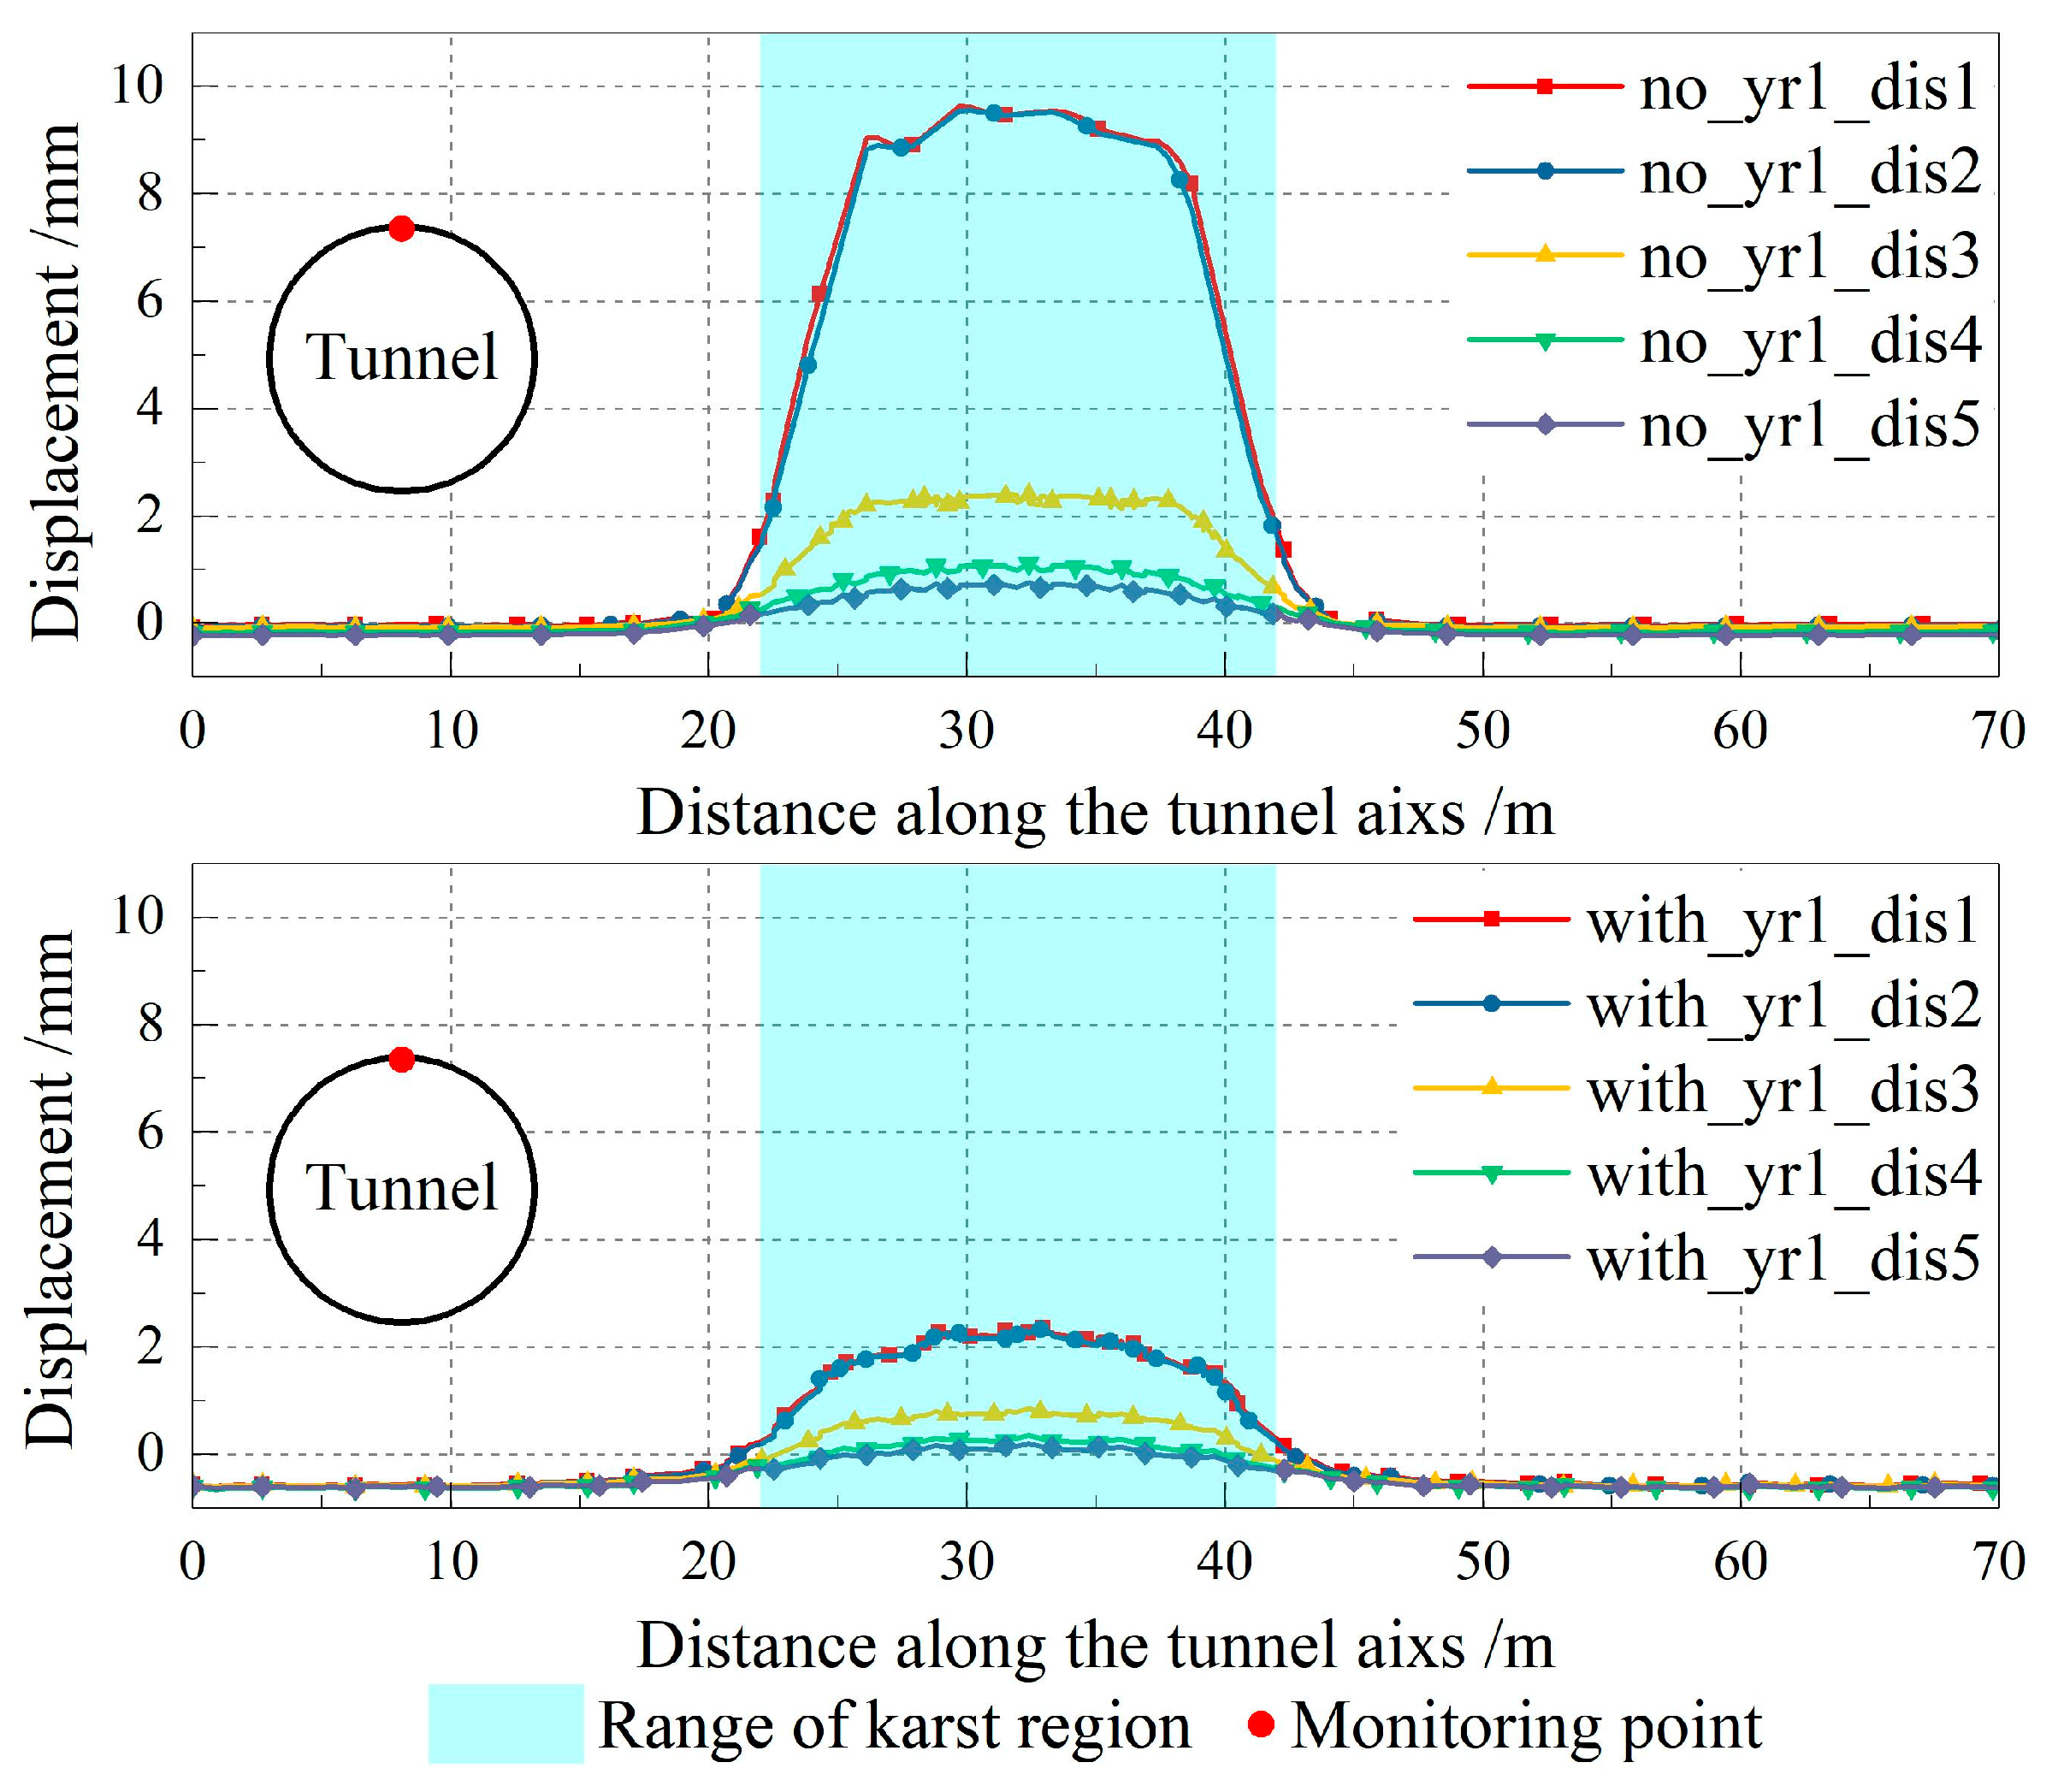
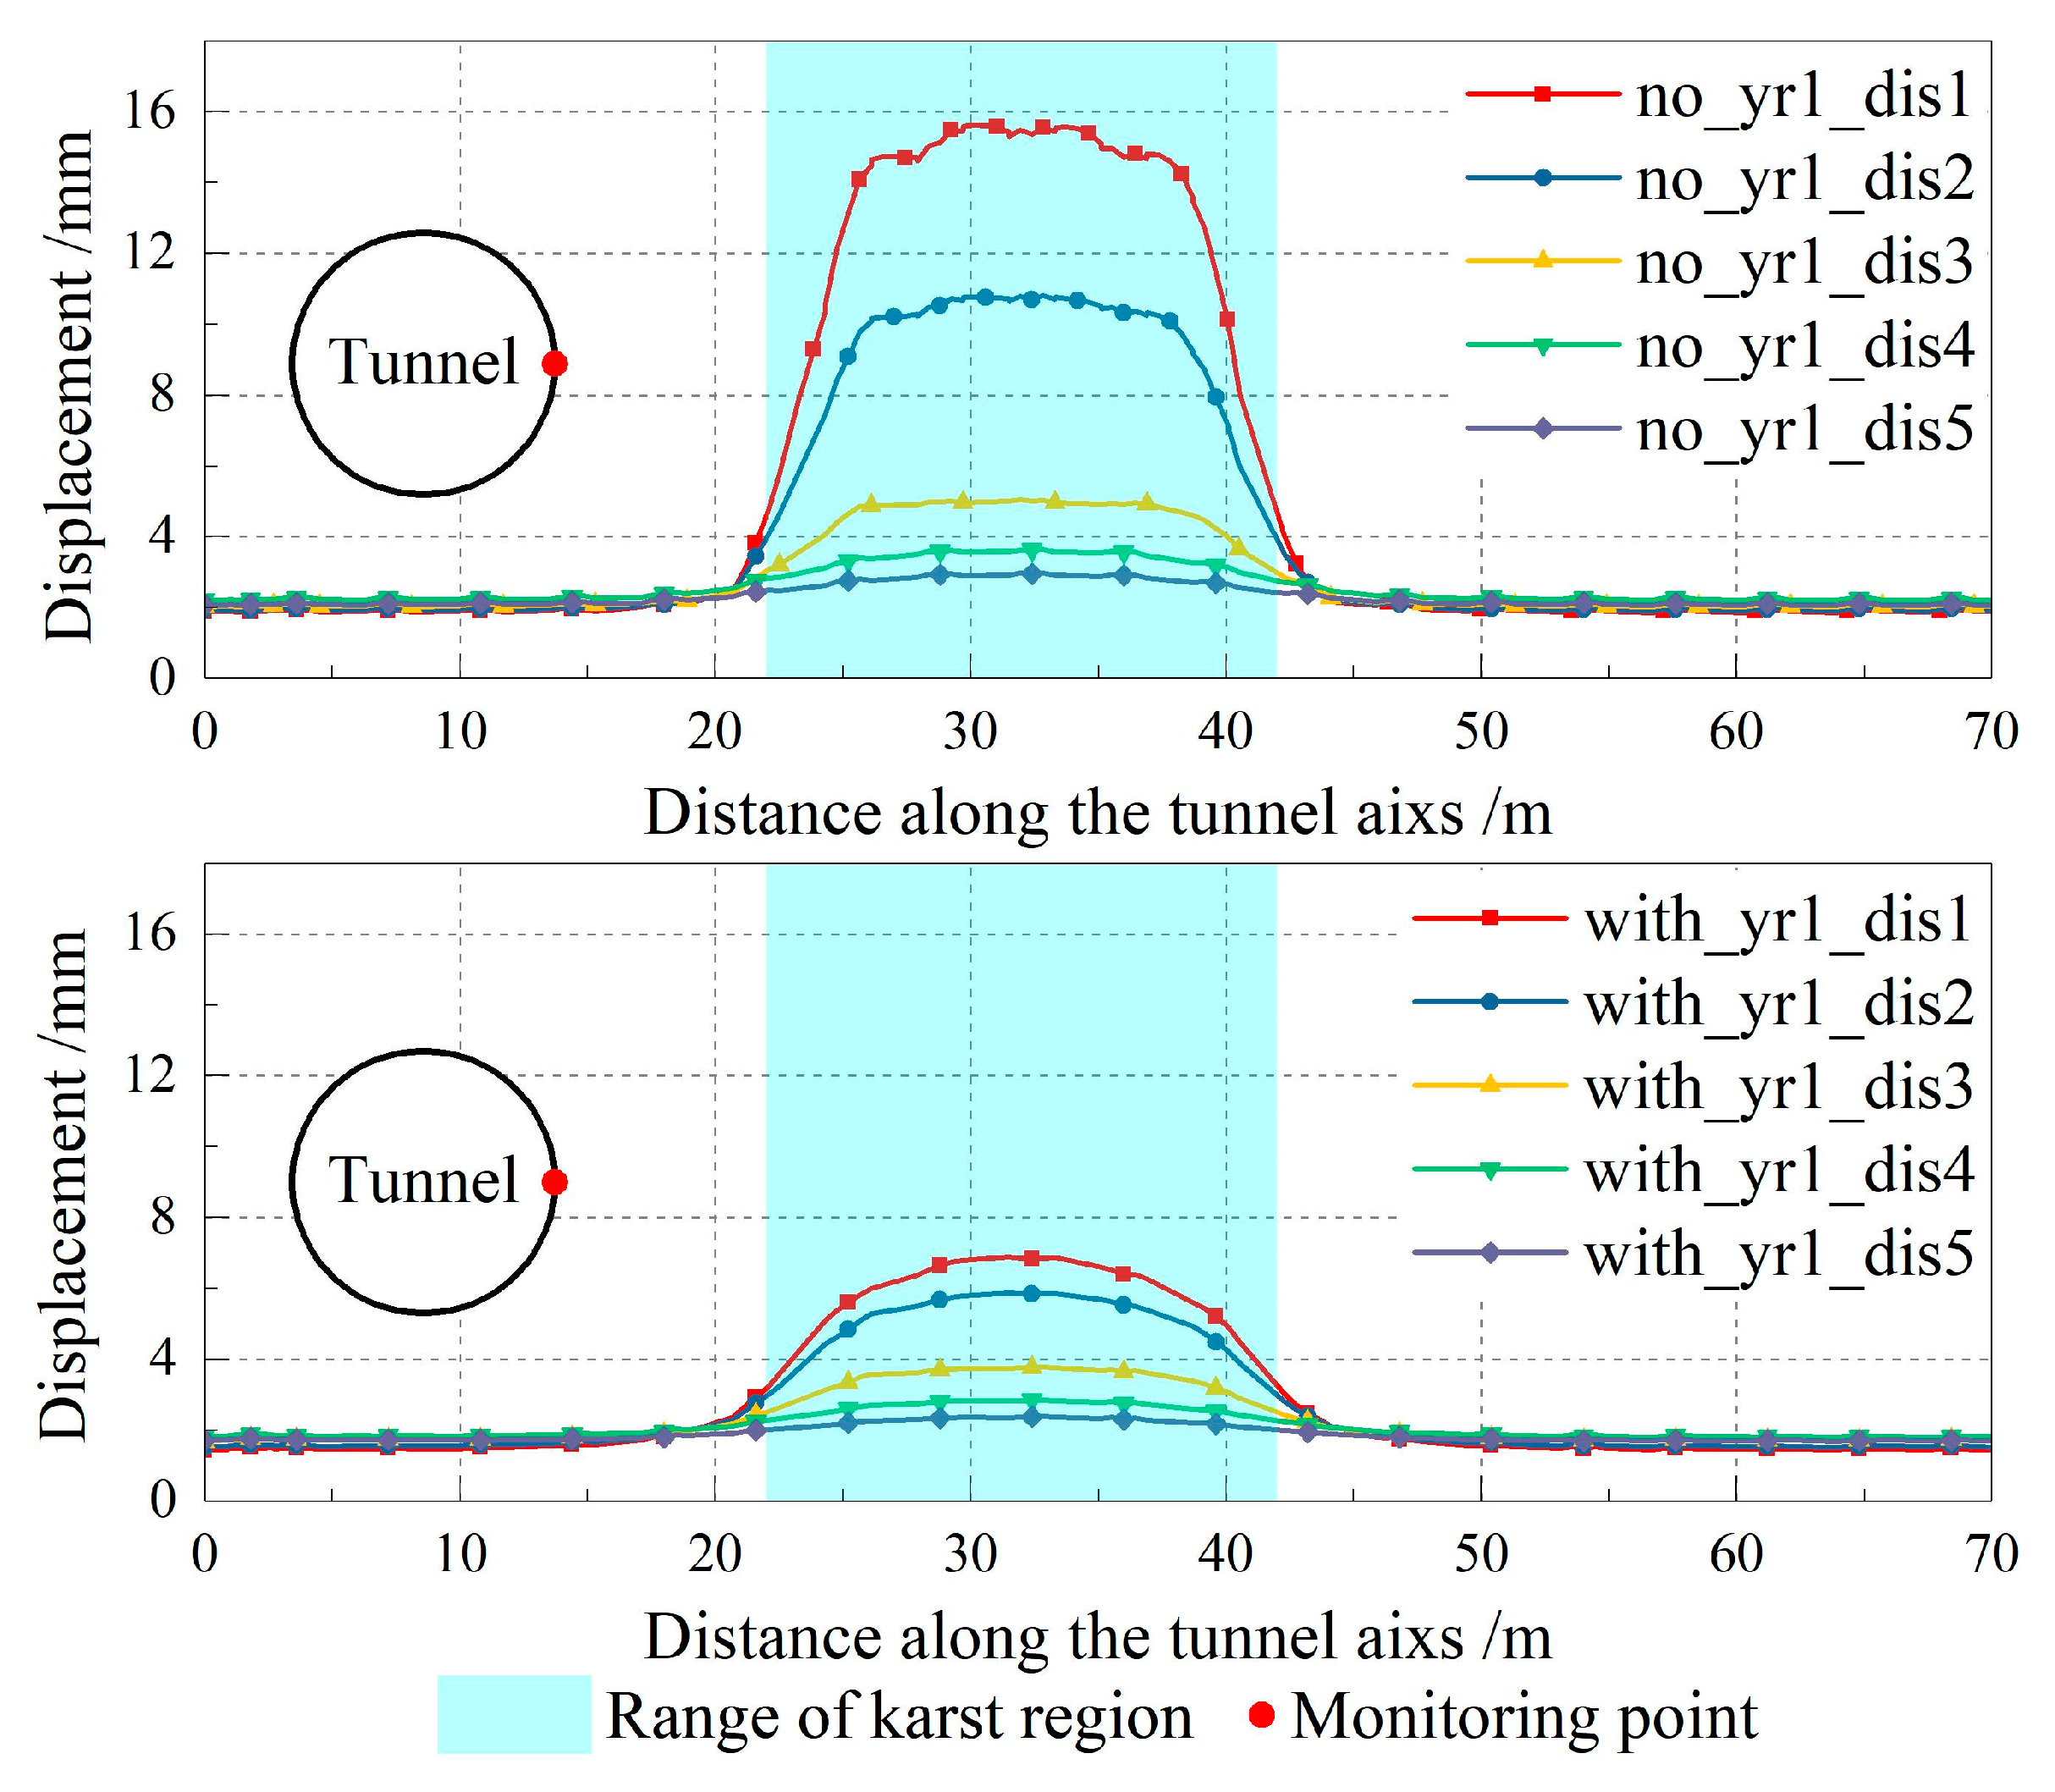
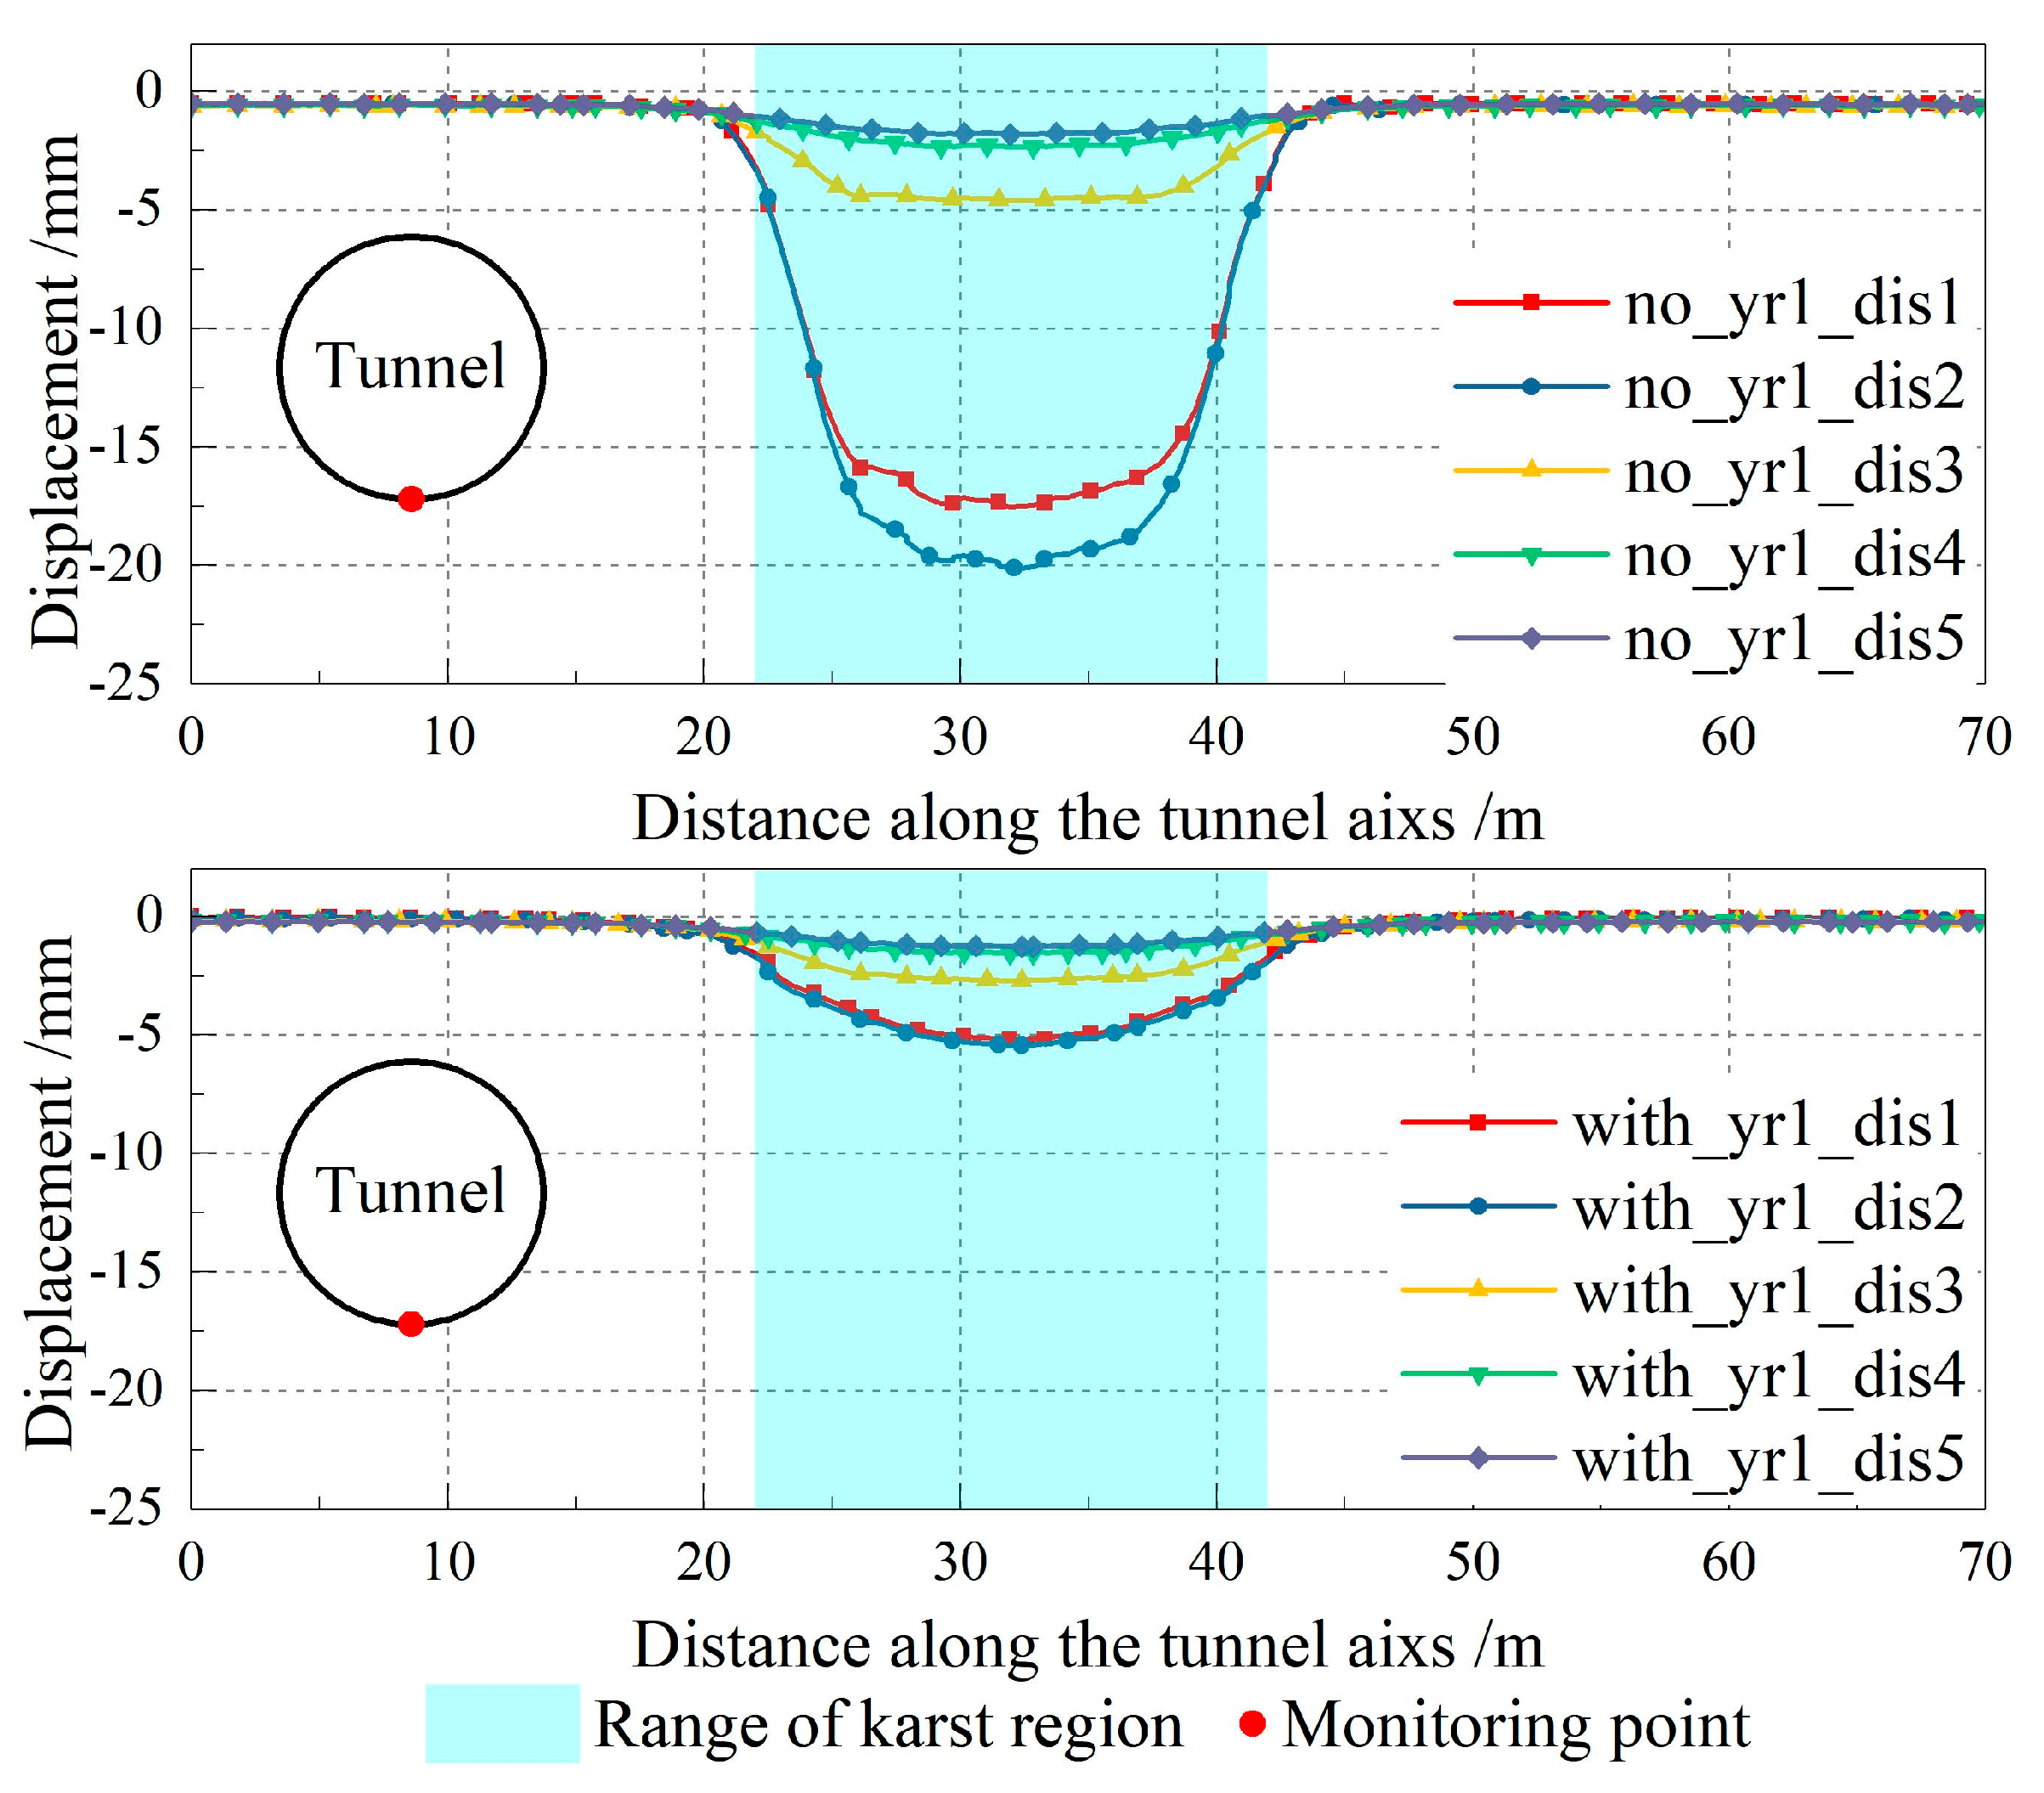
A comparison of the radial displacements along the tunnel axis yields the results shown in Figure 7, Figure 8 and Figure 9. Considering typical measurement tolerances in engineering, displacement differences below 0.1 mm can be neglected. Based on practical experience, structural behavior becomes significant when displacements reach the millimeter scale; therefore, in this study, regions where displacement continuously exceeds 1 mm are defined as displacement-sensitive zones.
Under conditions without a secondary lining, the radial displacement of the lining begins to increase near both ends of the karst-affected zone. In this case, the karst extends along the tunnel axis from 22 m to 42 m, while the displacement-sensitive zone spans 20 m to 44 m, indicating that the influence of the karst exhibits a diffusive pattern within the surrounding strata. This clearly demonstrates the three-dimensional effect of karst on the lining structure. This feature is observed regardless of whether the karst is located above, beside, or below the tunnel.
In contrast, when a secondary lining is installed, the radial displacement along the tunnel axis is significantly reduced, although the overall extent of the affected zone remains largely unchanged. In this example, the segment ring width is 1.8 m, which corresponds approximately to the distance between the outer boundary of the karst and the edge of the displacement-sensitive zone. This indicates that the influence of the karst primarily affects the immediately adjacent segment ring, with minimal impact on more distant rings. Therefore, in engineering practice, particular attention should be given to segments and other support measures located near the edges of karst zones.
The axial displacement distribution indicates that the disturbance caused by the karst cavity is not limited to the section where it occurs but extends to adjacent tunnel rings, typically within one ring width (about 1.8 m). This demonstrates the significant three-dimensional influence of karst effects, which should be carefully considered in design and monitoring.
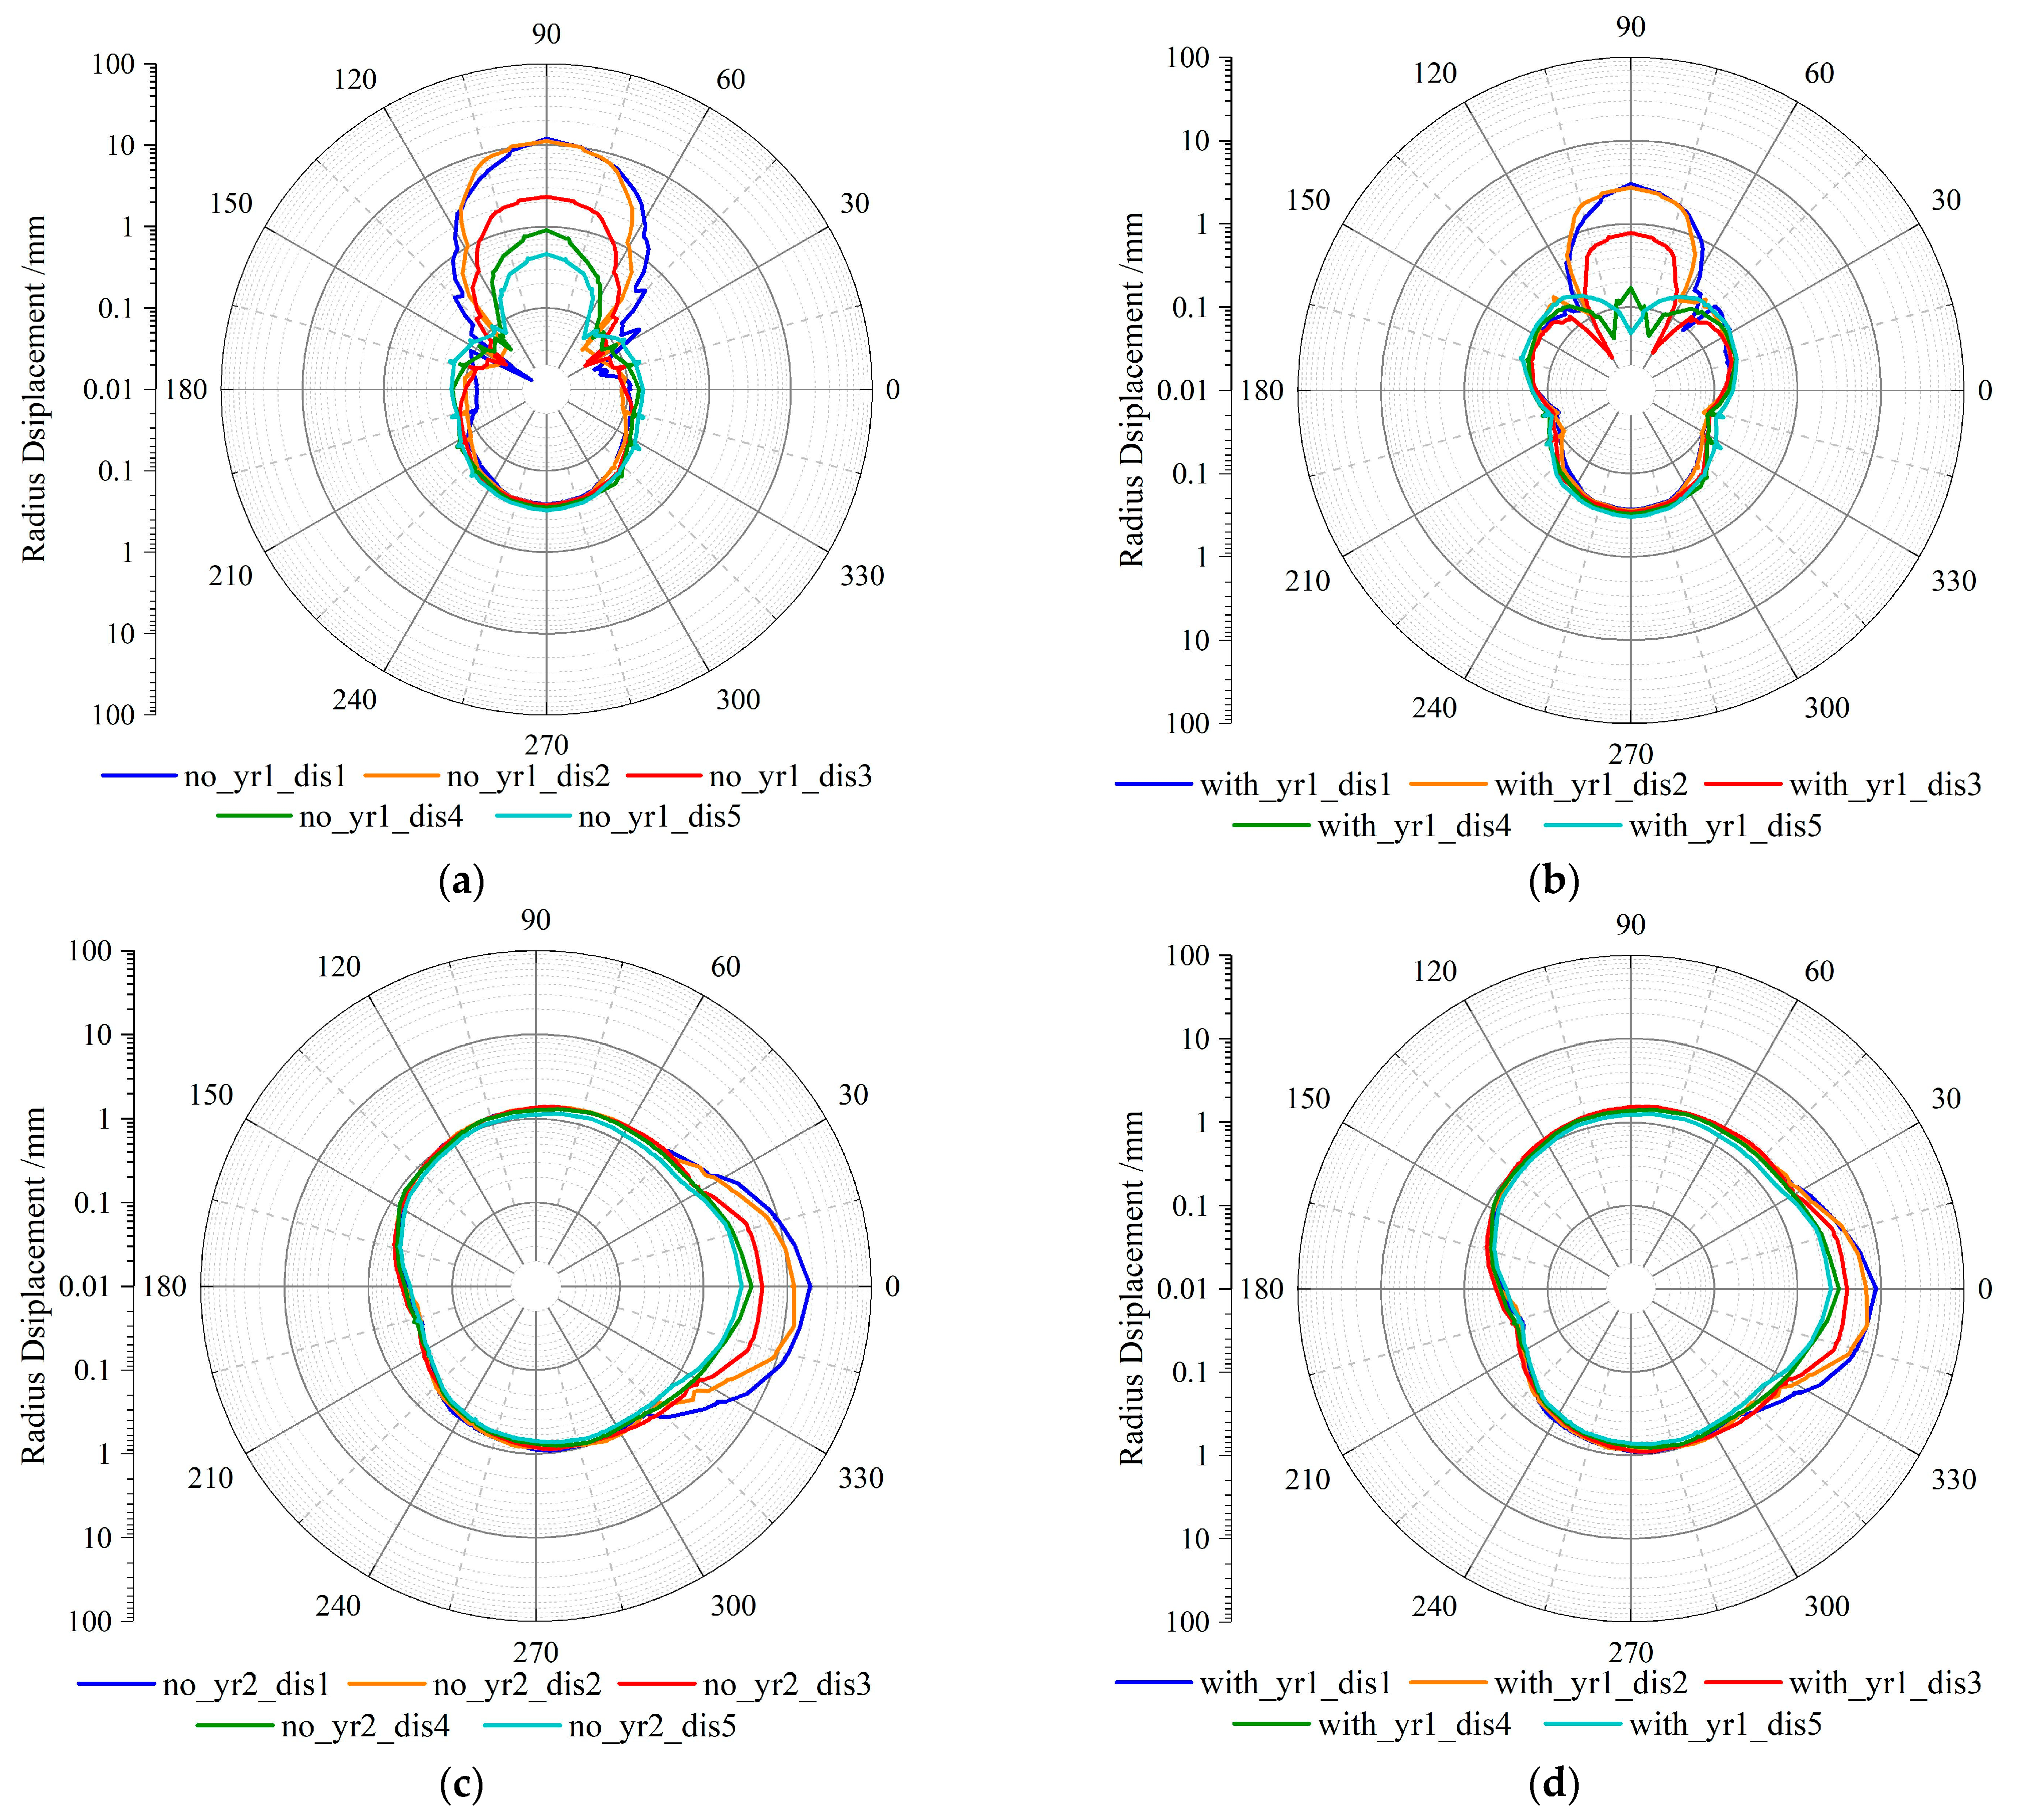
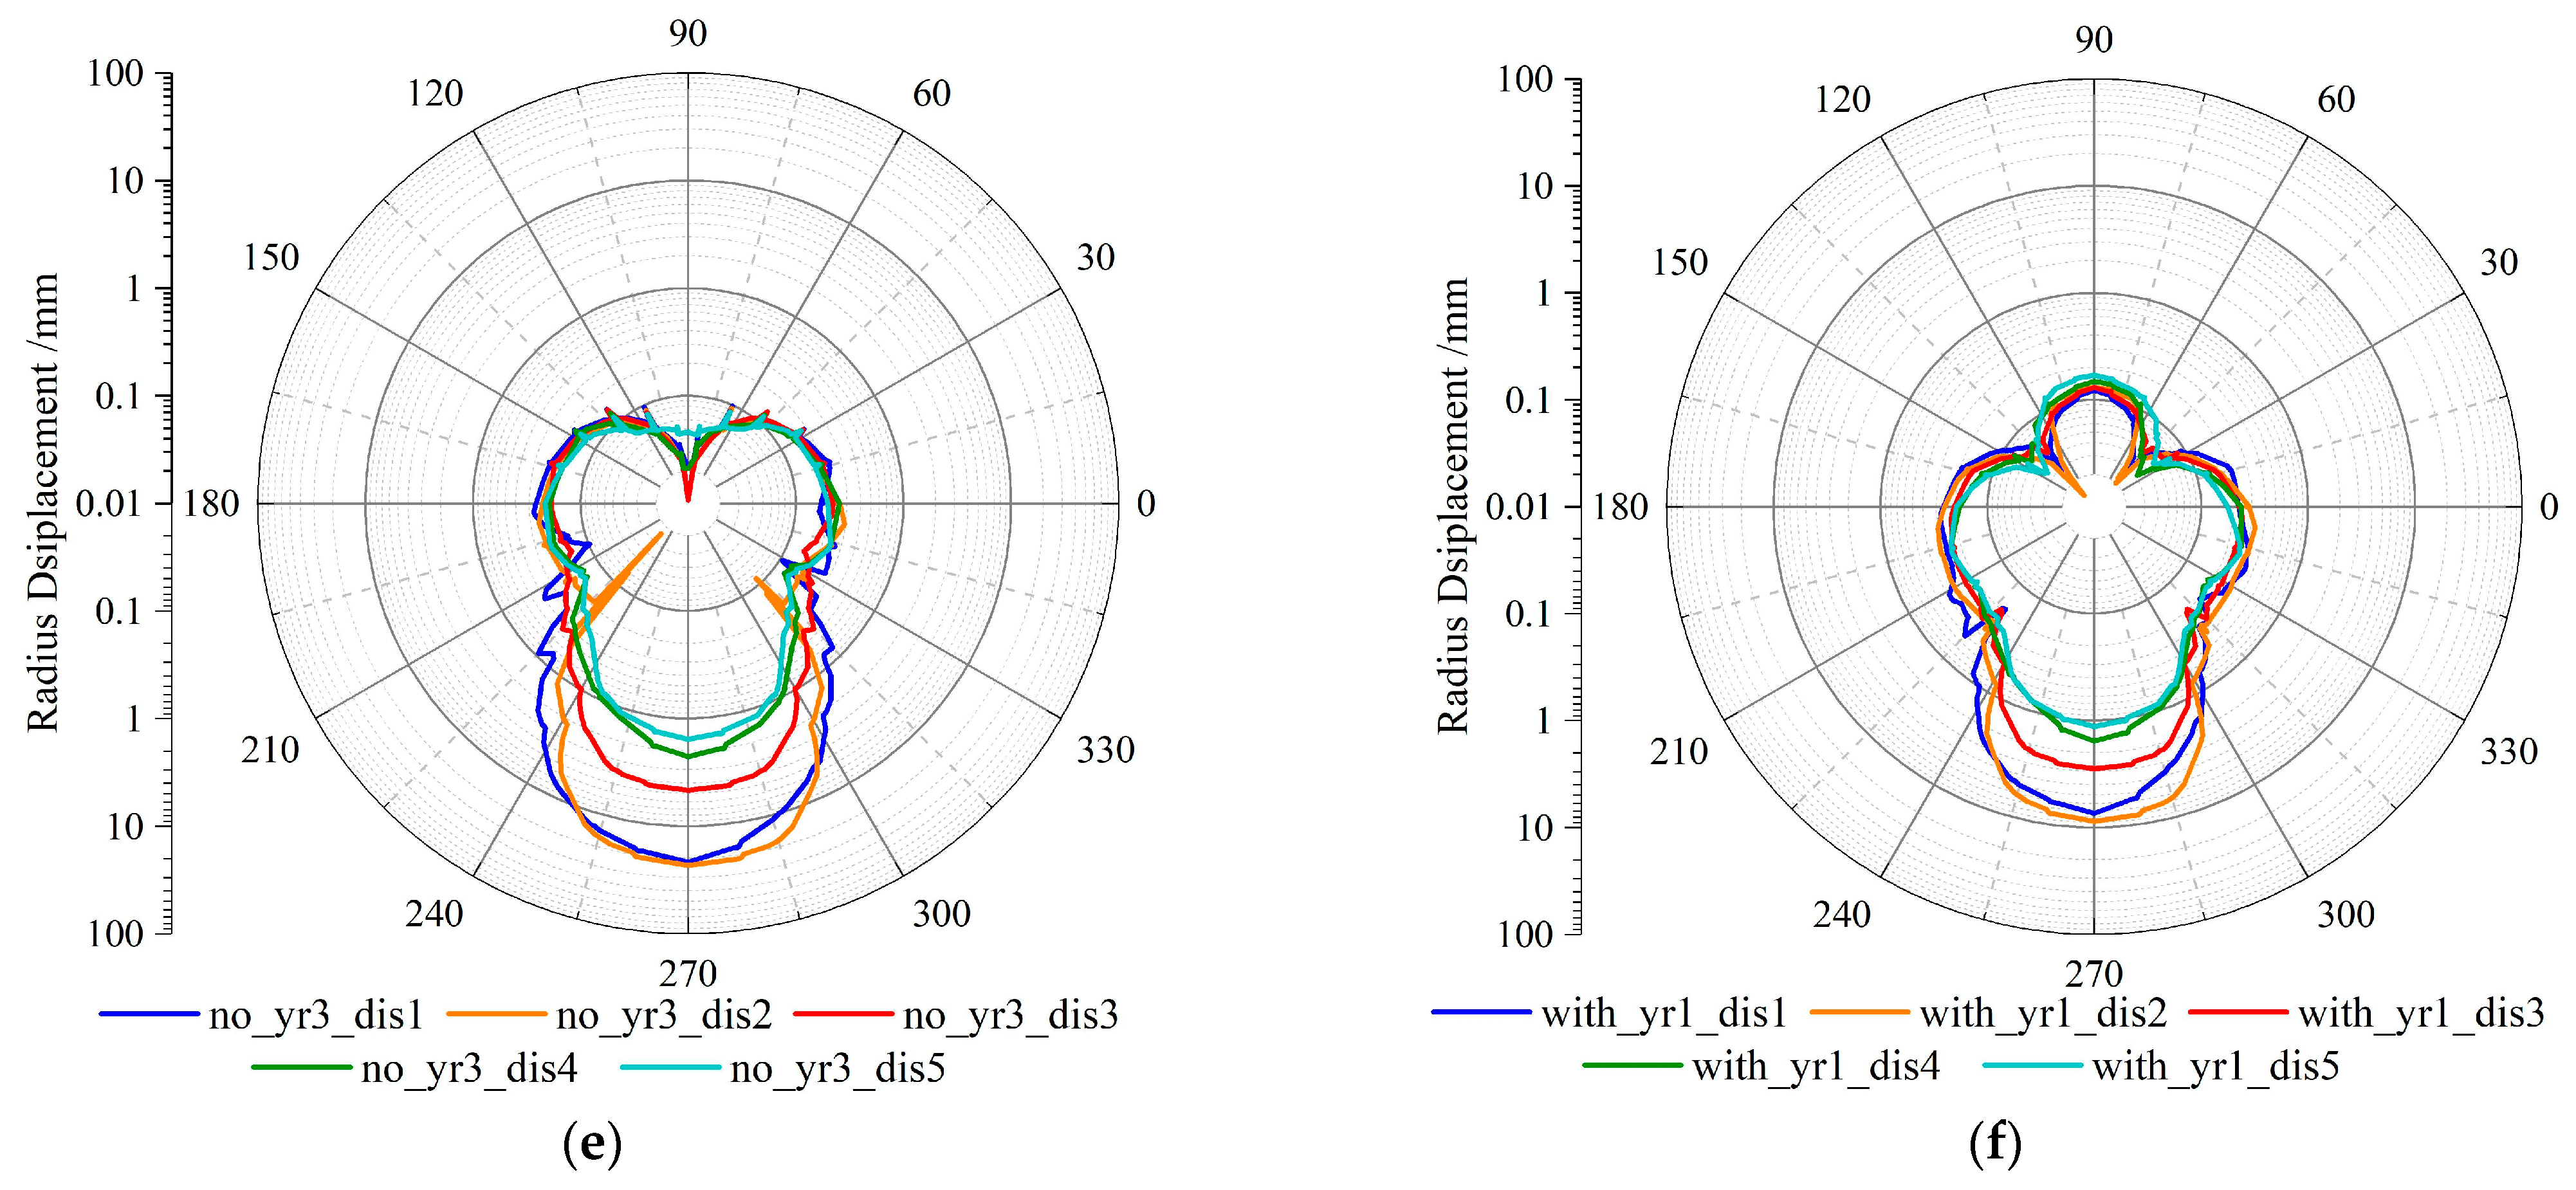
A comparison of radial displacements for tunnels with karst located in different directions is presented in Figure 10. Because the displacement magnitudes vary significantly under different distance conditions, a logarithmic scale is used for the radial axis to facilitate observation and comparison. Overall, in directions away from the karst zone, the radial displacement of the lining does not exceed 1 mm, and the relationship between displacement and the distance to the karst is negligible.
Under conditions without a secondary lining, the maximum displacement-sensitive zones are as follows: when the karst is above the tunnel, the sensitive zone spans [52°, 115°]; when the karst is beside the tunnel, it spans [310°, 360°] ∪ [0°, 45°]; and when the karst is below the tunnel, it spans [230°, 310°]. The corresponding coverage angles are 73°, 95°, and 80°, respectively. This indicates that the lateral karst position produces the widest influence on lining displacement. The asymmetry arises because the surrounding rock above and below the tunnel experiences different in situ stress levels. As a circular structure, the tunnel lining can distribute external loads more effectively through axial forces in a pressure-arch mechanism. However, under asymmetric loading, this effect is weakened, leading to an increased range of displacement variation.
The addition of a secondary lining effectively reduces the radial displacement and narrows the displacement-sensitive zones. For the karst located above, beside, and below the tunnel, the coverage of the sensitive zones decreases to 45°, 75°, and 65°, respectively. Additionally, even in regions not immediately adjacent to the karst, localized increases in displacement are observed. For example, when the karst is above the tunnel, the radial displacement increases from 0.1 mm to 0.3 mm in the [0°, 45°] ∪ [135°, 180°] intervals. As shown in Figure 10a,b, the secondary lining smooths the radial displacement profile, reducing the peak-to-trough variation and effectively distributing the applied loads.
To further quantify the strengthening effect, the comparative analysis between single and composite lining models shows that the secondary lining considerably enhances the load-bearing capacity of the tunnel structure. Specifically, the secondary lining reduces the peak circumferential stress of the primary lining by approximately 70–75%, while the maximum radial deformation is decreased by up to 60% in high-risk zones where karst cavities are located within 5 m of the tunnel. These results confirm that the secondary lining not only redistributes stresses more uniformly but also provides an effective buffer against local deformation concentration, thereby improving the overall structural stability under karst influence.
Based on the results shown in Figure 7, Figure 8, Figure 9 and Figure 10, the spatial position and distance of karst cavities have a significant influence on the displacement distribution of the tunnel lining. When the karst cavity is located beneath the tunnel, the radial displacement reaches the largest magnitude and shows a strongly asymmetric pattern along the tunnel circumference. When the karst is located above or beside the tunnel, the deformation is mainly localized in the corresponding area, characterized by upward bulging or lateral compression. As the distance between the karst cavity and the tunnel increases, the maximum displacement of the lining rapidly decreases and eventually stabilizes when the distance exceeds approximately 3 m. This finding indicates that the influence of karst disturbance on the tunnel structure is highly localized and spatially attenuated. The pronounced displacement gradient and stress concentration near the karst cavity suggest a progressive damage process of the surrounding rock. As the karst approaches within 3 m, localized zones exhibit sharp increases in Mises stress and radial deformation, indicating that the surrounding rock has entered a microcrack coalescence stage preceding failure. This behavior aligns with laboratory findings that microscopic cracking in brittle rocks evolves through a critical transition from stable to unstable growth [28]. Similarly, the nonlinear evolution of displacement and stress in our model echoes the precursory acceleration of acoustic emission activity observed prior to catastrophic rupture in brittle media [29]. These comparisons imply that the stress concentration patterns around the karst cavity may serve as macroscopic precursors of instability, offering a potential warning criterion for karst-affected tunnel segments.
In addition, the introduction of a secondary lining significantly reduces the amplitude of displacement and smooths the circumferential deformation profile, demonstrating an effective enhancement of stiffness and redistribution of stresses. The secondary lining not only decreases peak displacement but also narrows the range of displacement-sensitive zones, thereby improving the overall structural stability. These results suggest that adopting a composite lining system is an essential measure to ensure long-term safety and deformation control in water-rich karst regions.

6. Conclusions

Based on the refined 3D finite element simulations of tunnel lining in karst regions, the main conclusions are summarized as follows:
(1)
Effects of Karst Position and Distance: The spatial arrangement of karst cavities significantly affects the stress distribution and deformation of the tunnel lining. Cavities located closer to the lining or asymmetrically induce higher local stresses and radial displacements. Critical distances were identified, which can serve as reference values for construction safety assessments.
(2)
Deformation and Stress Features of the Lining: The tunnel lining exhibits asymmetric stress concentrations and localized radial displacements. Observed singularities in the stress and displacement fields may indicate precursory behaviors, emphasizing the need for monitoring and proactive management during tunneling.
(3)
Strengthening Influence and Design Implications of the Secondary Lining: The secondary lining significantly reduces peak stresses and limits radial deformation, enhancing overall structural stability. Quantitatively, it reduces peak stress by approximately 70–75% and radial deformation by up to 60% in high-risk zones near cavities (within 5 m from the lining). Therefore, a secondary lining thickness of about 0.4 m is recommended as a design reference for such areas.
These findings provide practical guidance for the design and reinforcement of tunnels in karst environments and offer insights into deformation mechanisms and stress redistribution under complex geological conditions.

Author Contributions

Conceptualization, methodology, validation, formal analysis, investigation, writing—original draft preparation, visualization, G.G.; software, W.L., G.G. and Y.D.; data curation, M.X. and G.G.; supervision, writing—review and editing, Y.D. and F.Y. All authors have read and agreed to the published version of the manuscript.

Funding

This research received no external funding.

Data Availability Statement

The data presented in this study consist solely of numerical simulation results generated within the Abaqus finite-element environment. These results are output as post-processing figures and visualization files, which are not stored in a reusable or standardized numerical format suitable for public archiving. Therefore, the raw simulation output cannot be meaningfully shared or interpreted outside the proprietary software environment. All essential information required to support the findings of this study has been fully included in the figures, descriptions, and methodological details provided in the manuscript. Additional simulation results can be made available from the corresponding author upon reasonable request, subject to software compatibility constraints.

Conflicts of Interest

Author Gu Guansi and Yang Fei are employed by the company Powerchina Huadong Engineering Corporation Limited. Author Xu Mingze is employed by the company Shanghai Jianke Engineering Consulting Co., Ltd. The remaining authors declare that the research was conducted in the absence of any commercial or financial relationships that could be construed as a potential conflict of interest.

References

  1. Pan, Q.; Ng, S.-T.T.; Peng, F.-L.; Dong, Y.-H. A Bottom-up Approach of Knowledge Graph Modelling for Urban Underground Public Spaces: Insights into Public Cognition. Tunn. Undergr. Space Technol. 2025, 163, 106710. [Google Scholar] [CrossRef]
  2. Dong, Y.-H.; Peng, F.-L.; Guo, T.-F. Quantitative Assessment Method on Urban Vitality of Metro-Led Underground Space Based on Multi-Source Data: A Case Study of Shanghai Inner Ring Area. Tunn. Undergr. Space Technol. 2021, 116, 104108. [Google Scholar] [CrossRef]
  3. Peng, F.-L.; Wang, W.-X.; Qiao, Y.-K.; Ma, C.-X.; Dong, Y.-H. Review on Data-Informed Planning for Underground Space. Undergr. Space 2025, S2467967425000789. [Google Scholar] [CrossRef]
  4. Lv, Y.; Jiang, Y.; Hu, W.; Cao, M.; Mao, Y. A Review of the Effects of Tunnel Excavation on the Hydrology, Ecology, and Environment in Karst Areas: Current Status, Challenges, and Perspectives. J. Hydrol. 2020, 586, 124891. [Google Scholar] [CrossRef]
  5. Gutiérrez, F.; Parise, M.; De Waele, J.; Jourde, H. A Review on Natural and Human-Induced Geohazards and Impacts in Karst. Earth-Sci. Rev. 2014, 138, 61–88. [Google Scholar] [CrossRef]
  6. Jeannin, P.-Y.; Malard, A.; Rickerl, D.; Weber, E. Assessing Karst-Hydraulic Hazards in Tunneling—The Brunnmühle Spring System—Bernese Jura, Switzerland. Environ. Earth Sci 2015, 74, 7655–7670. [Google Scholar] [CrossRef]
  7. Alija, S.; Torrijo, F.J.; Quinta-Ferreira, M. Geological Engineering Problems Associated with Tunnel Construction in Karst Rock Masses: The Case of Gavarres Tunnel (Spain). Eng. Geol. 2013, 157, 103–111. [Google Scholar] [CrossRef]
  8. Song, K.-I.; Cho, G.-C.; Chang, S.-B. Identification, Remediation, and Analysis of Karst Sinkholes in the Longest Railroad Tunnel in South Korea. Eng. Geol. 2012, 135–136, 92–105. [Google Scholar] [CrossRef]
  9. Zheng, X.; Yang, Z.; Wang, S.; Chen, Y.-F.; Hu, R.; Zhao, X.-J.; Wu, X.-L.; Yang, X.-L. Evaluation of Hydrogeological Impact of Tunnel Engineering in a Karst Aquifer by Coupled Discrete-Continuum Numerical Simulations. J. Hydrol. 2021, 597, 125765. [Google Scholar] [CrossRef]
  10. Jiang, C.; Xie, H.; He, J.; Wu, W.; Zhang, Z. Analytical Solution of Seepage Field in Karst Tunnel. Adv. Civ. Eng. 2018, 2018, 9215472. [Google Scholar] [CrossRef]
  11. Song, X.; Cen, C.; Liu, K.; Zhang, C.; Zhou, A.; Wang, Y.; Peng, Q.; Na, J. Numerical Simulation Analysis of the Impact of Tunnel Construction on Aquifers in the Karst Regions of Southwestern China. Water 2025, 17, 619. [Google Scholar] [CrossRef]
  12. Wang, W.; Gao, S.; Min, Y.; Liu, L.; Chen, J. Three-Dimensional Fluid–Solid Coupling Numerical Simulation of Effects of Underlying Karst Cave on Shield Tunnel Through Sand Stratum. Geotech. Geol. Eng. 2019, 37, 4825–4836. [Google Scholar] [CrossRef]
  13. Pan, X.; Fang, Y.; Lai, Y.; Sun, H.; Cai, Y.; Shi, L.; Geng, X. Three-Dimensional Numerical Modeling of Water Distribution Tunnels in Karst Area. Arab. J. Geosci. 2020, 13, 1242. [Google Scholar] [CrossRef]
  14. Zhang, C.; Fu, J.; Yang, J.; Ou, X.; Ye, X.; Zhang, Y. Formulation and Performance of Grouting Materials for Underwater Shield Tunnel Construction in Karst Ground. Constr. Build. Mater. 2018, 187, 327–338. [Google Scholar] [CrossRef]
  15. He, X.; Wang, S.; Lai, M.; Peng, X.; Chen, B. Mechanical Characterization of Subway Tunnel Construction in Urban Shallow Distributed Karst Stratums. Transp. Geotech. 2023, 43, 101139. [Google Scholar] [CrossRef]
  16. Hu, H.; Zhang, B.; Zuo, Y.; Zhang, C.; Wang, Y.; Guo, Z. The Mechanism and Numerical Simulation Analysis of Water Bursting in Filling Karst Tunnel. Geotech. Geol. Eng. 2017, 36, 1197–1205. [Google Scholar] [CrossRef]
  17. Macek, R.W.; Silling, S.A. Peridynamics via Finite Element Analysis. Finite Elem. Anal. Des. 2007, 43, 1169–1178. [Google Scholar] [CrossRef]
  18. Javili, A.; Morasata, R.; Oterkus, E.; Oterkus, S. Peridynamics Review. Math. Mech. Solids 2019, 24, 3714–3739. [Google Scholar] [CrossRef]
  19. Shi, S.; Bu, L.; Li, S.; Xiong, Z.; Xie, X.; Li, L.; Zhou, Z.; Xu, Z.; Ma, D. Application of Comprehensive Prediction Method of Water Inrush Hazards Induced by Unfavourable Geological Body in High Risk Karst Tunnel: A Case Study. Geomat. Nat. Hazards Risk 2017, 8, 1407–1423. [Google Scholar] [CrossRef]
  20. Yang, X.; Xiao, H. Safety Thickness Analysis of Tunnel Floor in Karst Region Based on Catastrophe Theory. J. Cent. South Univ. 2016, 23, 2364–2372. [Google Scholar] [CrossRef]
  21. Tian, Q.; Zhang, J.; Zhang, Y. Similar Simulation Experiment of Expressway Tunnel in Karst Area. Constr. Build. Mater. 2018, 176, 1–13. [Google Scholar] [CrossRef]
  22. Wilding, M.; Benmore, C.; Weber, R.; Parise, J.; Lazareva, L.; Skinner, L.; Alderman, O.; Tamalonis, A. Exploring the Structure of High Temperature, Iron-Bearing Liquids. Mater. Today Proc. 2015, 2, S358–S363. [Google Scholar] [CrossRef]
  23. Wu, W.; Liu, X.; Guo, J.; Sun, F.; Huang, X.; Zhu, Z. Upper Limit Analysis of Stability of the Water-Resistant Rock Mass of a Karst Tunnel Face Considering the Seepage Force. Bull. Eng. Geol. Environ. 2021, 80, 5813–5830. [Google Scholar] [CrossRef]
  24. Onyango, J.A.; Sasaoka, T.; Shimada, H.; Hamanaka, A.; Moses, D. Equivalent Porous Medium (EPM) Modeling of Karst Features for Slope Stability Analysis in Karst-Prone Weak Rock Masses. Modelling 2025, 6, 81. [Google Scholar] [CrossRef]
  25. Lin, C.; Xia, C.; Zhang, H.; Liu, Z.; Zhou, C. Simulated Short- and Long-Term Deformation in Coastal Karst Caves. J. Mar. Sci. Eng. 2022, 10, 1315. [Google Scholar] [CrossRef]
  26. Wang, Y.; Liu, S.; Zhang, L.; Guan, S.; Li, Z.; Cheng, L.; Liu, J.; Chen, J. Study on the Influence of Crystal Plugging on the Mechanical Behavior of Karst Tunnel Lining Structure. Processes 2025, 13, 568. [Google Scholar] [CrossRef]
  27. Li, G.; Zhou, W. Impact of Karst Water on Coal Mining in North China. Environ. Geol. 2006, 49, 449–457. [Google Scholar] [CrossRef]
  28. Mo, C.; Zhao, J.; Zhang, D. Mode I Microscopic Cracking Process of Granite Considering the Criticality of Failure. JGR Solid Earth 2023, 128, e2023JB027040. [Google Scholar] [CrossRef]
  29. Zhang, J.; Zhou, X. Forecasting Catastrophic Rupture in Brittle Rocks Using Precursory AE Time Series. JGR Solid Earth 2020, 125, e2019JB019276. [Google Scholar] [CrossRef]
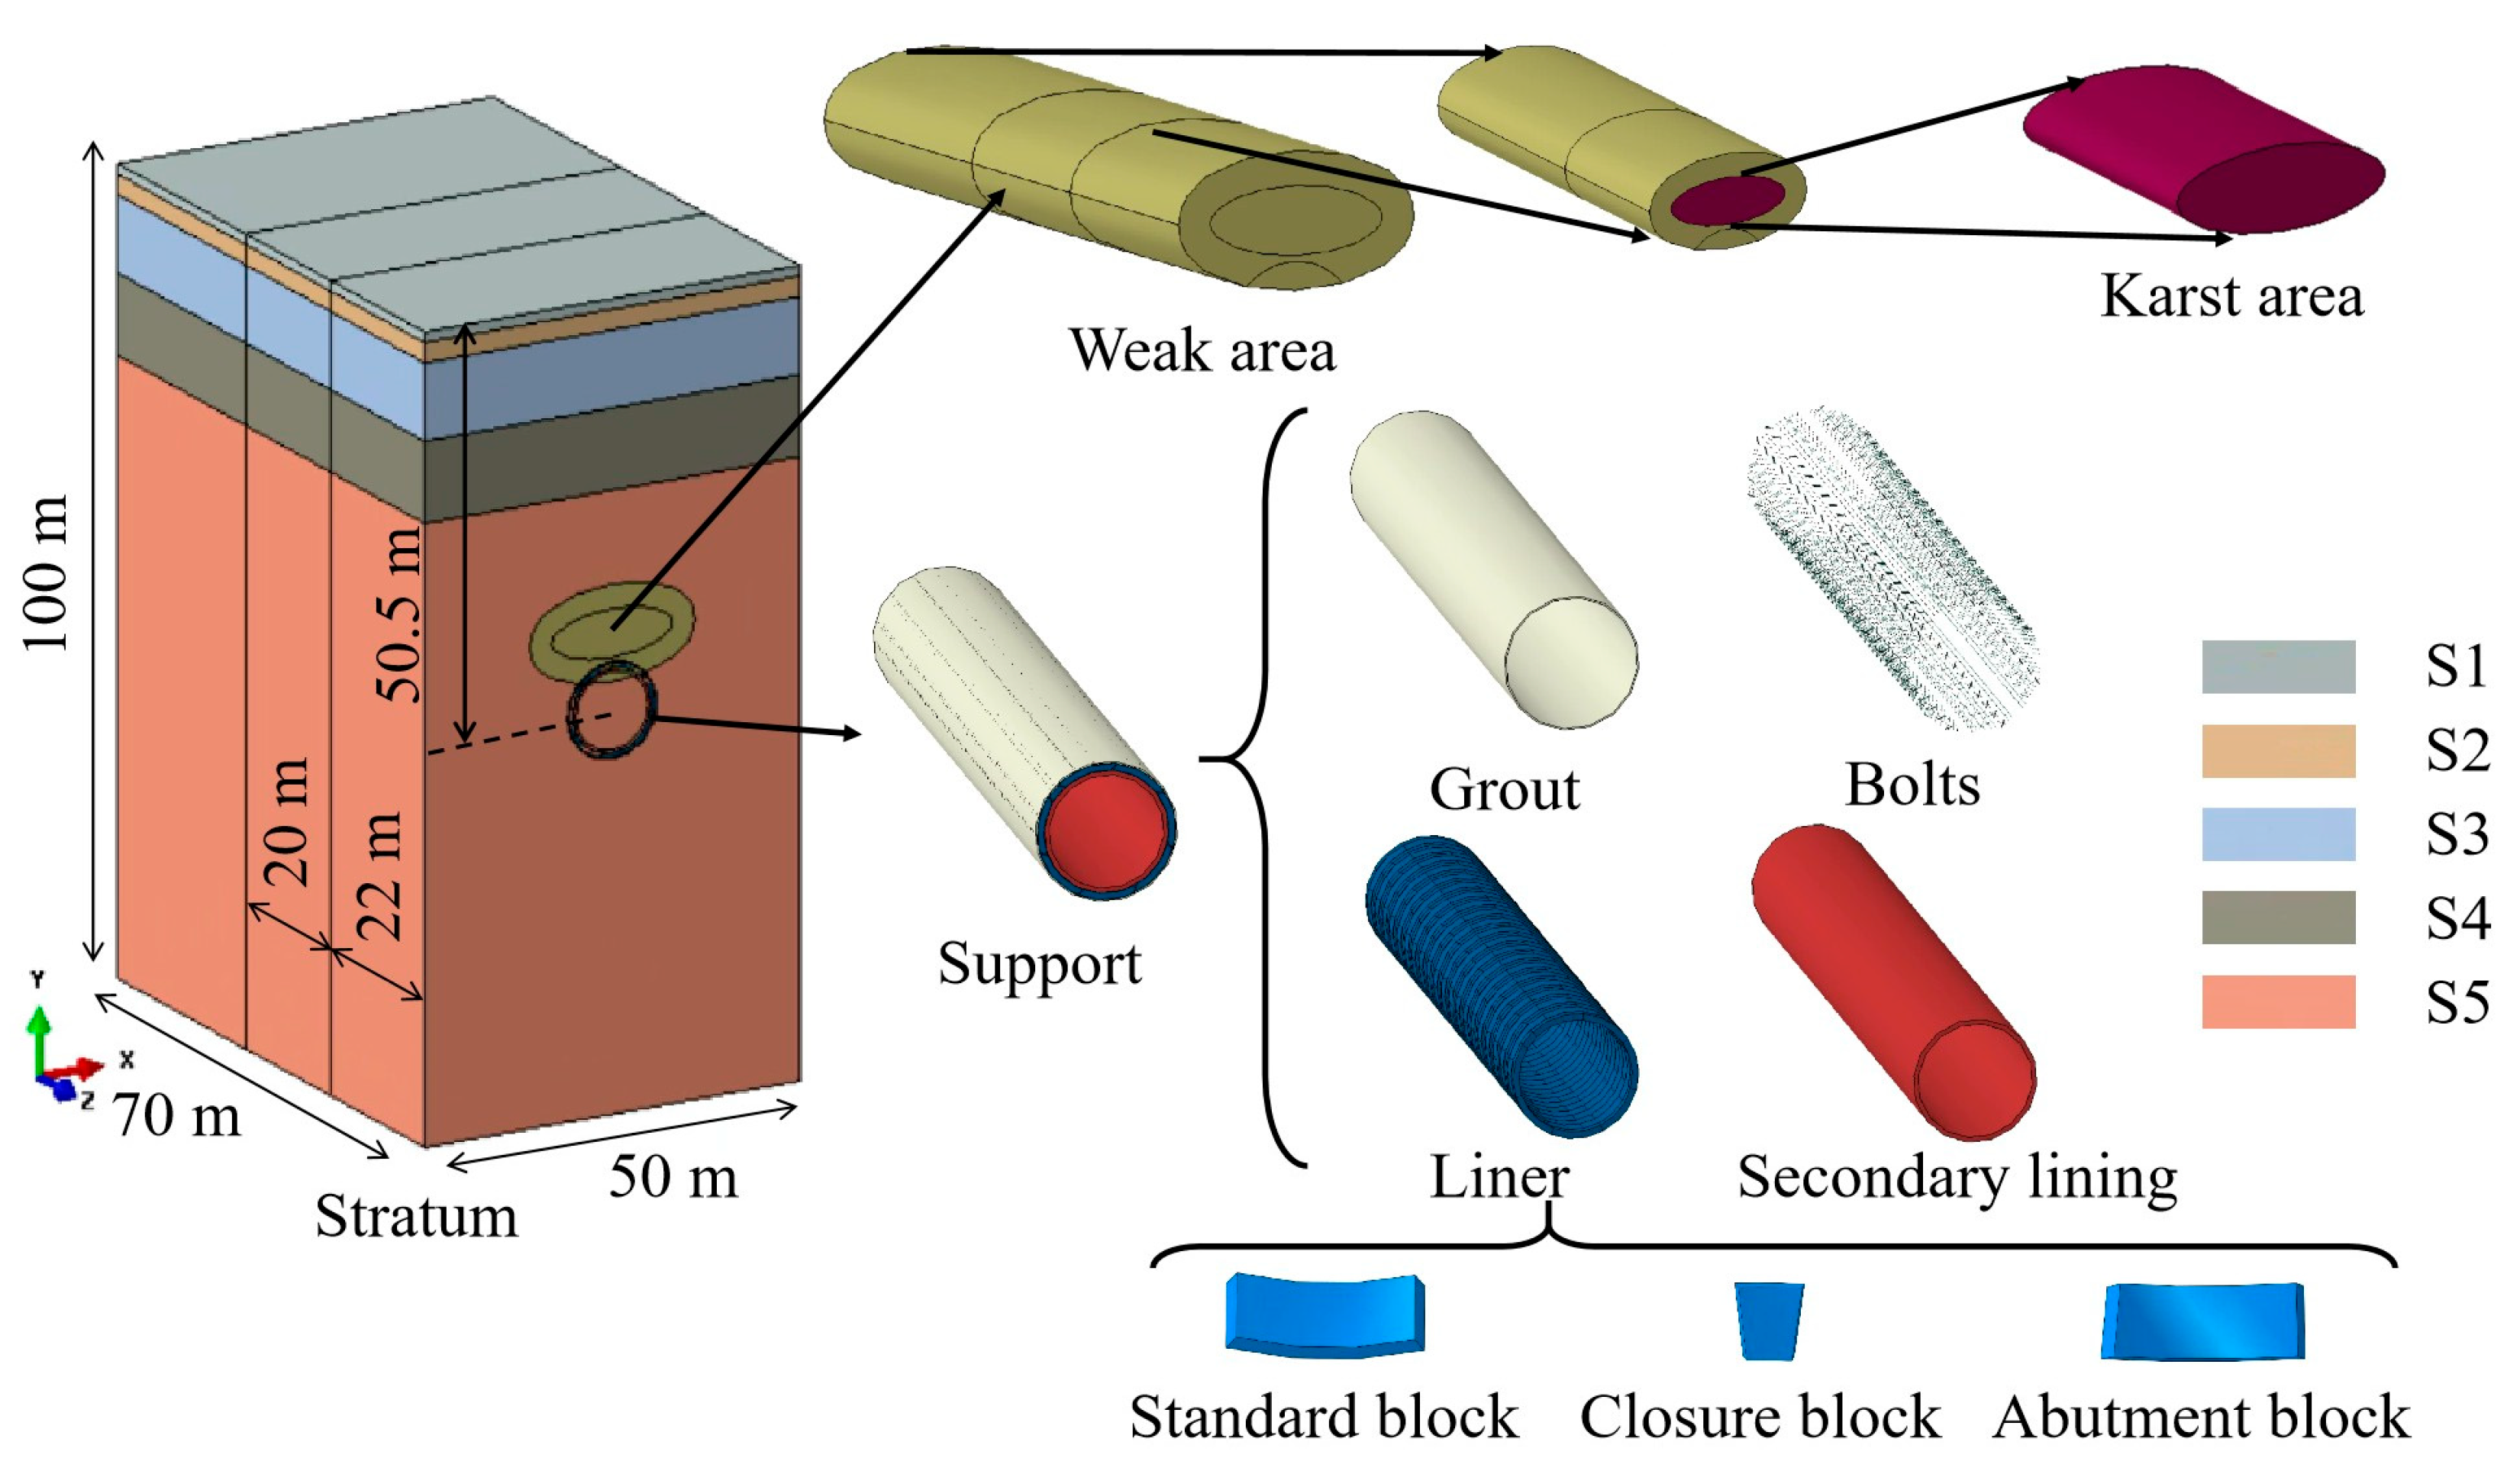
Figure 1. Geometric model schematic.
Infrastructures 10 00315 g001
Figure 3. Displacement distribution.(In the legend number format, the beginning “+” refers to positive numbers, the beginning “-” refers to negative numbers, and the scientific and technological method uses “e+0x” to represent “10x”. The same applies to the following text).
Infrastructures 10 00315 g003
Figure 4. Mises stress distribution.
Infrastructures 10 00315 g004
Figure 5. Schematic diagram of the relationship between cavity and tunnel locations.
Infrastructures 10 00315 g005
Figure 6. Variation in maximum tensile stress in the structure with the distance from the cavity. (a) Cavity above tunnel; (b) Cavity beside tunnel; (c) Cavity under tunnel.
Infrastructures 10 00315 g006
Figure 7. Radial displacement of the lining above the tunnel axis (+: vertically upwards).
Infrastructures 10 00315 g007
Figure 8. Radial displacement of the lining on the side of the tunnel axis (+: horizontally to the right).
Infrastructures 10 00315 g008
Figure 9. Radial displacement of lining below the tunnel axis (+: vertically upwards).
Infrastructures 10 00315 g009
Figure 10. Distribution of radial displacement of structures under various operating conditions. (a) Cavity above the tunnel (without secondary liner); (b) Cavity above the tunnel (with secondary liner); (c) Cavity beside the tunnel (without secondary liner); (d) Cavity beside the tunnel (with secondary liner); (e) Cavity under the tunnel (without secondary liner); (f) Cavity under the tunnel (with secondary liner).
Infrastructures 10 00315 g010aInfrastructures 10 00315 g010b
Table 1. Geotechnical physical and mechanical parameters.
Layer NumberStratum CategoryDepth (m)Water Content
(%)
Natural Unit Weight
(kN/m3)
Dry Unit Weight
(kN/m3)
Cohesive
(kPa)
Internal Friction Angle (°)Compression Modulus
(MPa)
Elastic Modulus
(GPa)
①—2 (S1)Plain fill1.332.218.312.41010.03.0
②—1 (S2)Silty clay2.532.918.412.32014.03.5
⑮—1 (S3)Gravelly silty clay9.629.018.813.33018.05.0
㉝b—1 (S4)Completely weathered limestone10.139.917.710.63514.25.6
㉝a—3 (S5)Moderately weathered carbonaceous limestone76.525.090040.0Incompressible10.0
Table 2. Stress characteristics of liner in each cavity location (without secondary liner).
Cavity LocationAbove
(Distance = 0.5 m)
Side
(Distance = 0.5 m)
Below
(Distance = 0.5 m)
Maximum principal stress distributionInfrastructures 10 00315 i001Infrastructures 10 00315 i002Infrastructures 10 00315 i003
Maximum tensile stress/MPa5.135.887.37
Minimum principal stress distributionInfrastructures 10 00315 i004Infrastructures 10 00315 i005Infrastructures 10 00315 i006
Maximum compressive stress/MPa2.763.644.96
Table 3. Stress characteristics of liner in each cavity location (with secondary liner).
Cavity LocationAbove
(Distance = 0.5 m)
Side
(Distance = 0.5 m)
Below
(Distance = 0.5 m)
Maximum principal stress distributionInfrastructures 10 00315 i007Infrastructures 10 00315 i008Infrastructures 10 00315 i009
Maximum tensile stress/MPa1.621.471.79
Minimum principal stress distributionInfrastructures 10 00315 i010Infrastructures 10 00315 i011Infrastructures 10 00315 i012
Maximum compressive stress/MPa0.9011.191.12
Table 4. Stress characteristics of secondary liner in each cavity location.
Cavity LocationAbove
(Distance = 0.5 m)
Side
(Distance = 0.5 m)
Below
(Distance = 0.5 m)
Maximum principal stress distributionInfrastructures 10 00315 i013Infrastructures 10 00315 i014Infrastructures 10 00315 i015
Maximum tensile stress/MPa2.493.143.44
Minimum principal stress distributionInfrastructures 10 00315 i016Infrastructures 10 00315 i017Infrastructures 10 00315 i018
Maximum compressive stress/MPa0.6240.9090.870
Disclaimer/Publisher’s Note: The statements, opinions and data contained in all publications are solely those of the individual author(s) and contributor(s) and not of MDPI and/or the editor(s). MDPI and/or the editor(s) disclaim responsibility for any injury to people or property resulting from any ideas, methods, instructions or products referred to in the content.