1. Introduction
Roadway infrastructure serves as the backbone of modern transportation systems, playing a critical role in economic activities, mobility, and public safety. However, roadways are subject to continuous deterioration due to environmental factors, increasing traffic loads, and natural aging. This deterioration not only compromises the structural integrity and functionality of road networks but also presents significant risks to driver safety. Potholes, cracks, and surface irregularities can lead to accidents, vehicle damage, and disruption of transportation systems, underscoring the urgent need for effective roadway assessment and maintenance strategies.
The consequences of poor roadway conditions extend beyond driver safety. Deteriorated pavement surfaces increase rolling resistance, leading to higher fuel consumption and elevated tailpipe emissions. This contributes to environmental pollution and exacerbates climate change challenges. Addressing these issues requires timely and accurate assessments to prioritize repairs and optimize the use of limited maintenance budgets. However, traditional methods of roadway assessment, such as manual inspections and expensive, sophisticated equipment, often prove to be time-consuming, labor-intensive, and financially prohibitive for widespread implementation.
To tackle these challenges, there is a growing interest in low-cost, sensor-based technologies for roadway pavement assessment. These innovative solutions leverage advances in sensors, data collection, and analytics to provide scalable, efficient, and cost-effective tools for monitoring pavement conditions. By enabling real-time data acquisition and analysis, these technologies offer the potential to enhance maintenance planning, reduce operational costs, and promote safer, more sustainable transportation systems.
Further to presenting the proposed approach to low-cost assessment of roadway pavements, the paper presents case-study results from two pilot implementations and briefly discusses how such results can be utilized, as part of wider-scope research whose key objectives are not only pavement assessment but also roadway anomaly detection and classification, and operations and maintenance (O&M) actions related to pavement management systems (PMSs). A PMS is a systematic approach to managing pavement infrastructure, so as to optimize maintenance, rehabilitation, and reconstruction activities. By leveraging data collection, analysis, and decision-making tools, PMS aim to ensure cost-effective, sustainable, and long-lasting pavement performance. Since, though, legacy PMS platforms, (1) require specialized hardware and software, (2) are expensive to purchase and operate, and (3) require specialized personnel [
1,
2], several municipalities are actively seeking sustainable alternatives.
Paper Structure
The paper’s introduction section is followed by a brief literature review on roadway sensing, with an emphasis on low-cost vibration sensing, and on machine learning for roadway pavement assessment. A brief section on pavement management systems is also included, followed by the underlying principles of the proposed methodology, and a preliminary analysis on the suitability of possible machine learning algorithms and their performance on vibration sensing and pavement assessment. Two case studies are then presented, with corresponding results and a discussion of them. Finally, a methodology and a case-study are presented on the utilization of the sensed vibration data in a low-cost pavement management system. The paper concludes with a discussion section, also presenting challenges and future directions.
2. Literature Review
In the past decade, significant advancements have been made in the development and application of low-cost sensor-based technologies for roadway pavement assessment. Traditional methods, such as visual inspections and manual surveys, have been supplemented or replaced by automated techniques that utilize cutting-edge sensors, data analytics, and machine learning (ML) algorithms. This shift has been driven by the growing demand for more efficient, accurate, low-cost and scalable solutions to monitor and maintain roadway infrastructure.
Advancements in smartphone technology, however, have opened new possibilities for more accessible and efficient pavement condition assessment, and recent studies have explored the use of accelerometer-equipped smartphones to detect surface irregularities, including potholes and cracks.
The brief literature review below explores the various approaches to using smartphones for this purpose (notwithstanding that parallel efforts have focused on machine-vision and lidar-driven methods), encompassing machine learning, vehicle-based sensing, and image analysis techniques.
2.1. Machine Learning for Pavement Assessment
Machine learning has revolutionized roadway assessment by improving the data analysis and the accuracy of condition classification and anomaly detection. In fact, several studies have demonstrated the potential of machine learning algorithms in conjunction with smartphone sensors to analyze sensor-generated data, to identify pavement distress levels with minimal human intervention, and to develop low-cost pavement rating systems. For example, Kyriakou et al. [
3] and Kyriakou and Christodoulou [
4] proposed a system that utilizes machine learning to analyze data collected from smartphone sensors, such as accelerometers and gyroscopes, to assess pavement quality. This approach presents a promising avenue for citizen science initiatives, allowing individuals to contribute to pavement condition monitoring using their devices. Additional recent works [
5,
6,
7] have reinforced these findings, while also highlighting the limitations inherent in the approach.
2.2. Vehicle-Based Vibration Monitoring
The integration of smartphone sensors into vehicles has enabled researchers to explore the use of vibration data for real-time pavement condition monitoring. Studies such as the ones by Ho et al. [
8] and Rana [
9] investigated the feasibility of using vehicle-based vibration data, captured by smartphone sensors, to assess pavement roughness and identify potential anomalies. Albeit utilizing sensors (instead of smartphones) and mathematical models (instead of ML), these studies highlight the potential of leveraging existing vehicle infrastructure for continuous and cost-effective pavement monitoring.
2.3. Smartphone-Based Pavement Anomaly Detection
The detection of potholes using smartphones has been a focal point of several research efforts. Studies by Mednis et al. [
10] and Christodoulou et al. [
11] explored the use of artificial neural networks and other machine learning techniques to analyze smartphone sensor data, particularly accelerometer data, to identify and locate potholes. Further, a number of studies demonstrated the use of smartphone-based sensors for the detection of other pavement anomalies (primarily vibration-inducing pavement anomalies) such as speed-bumps, manholes, patching, severe cracking, and raveling [
2,
12]. Recent studies [
13,
14,
15,
16,
17] have added to the state of knowledge on the use of smartphone-grade sensors. A key limitation reported by most of these studies was their absolute reliance on vibration signals and, therefore, their inability to detect non-vibration-inducing roadway anomalies or roadway defects not traversed over by the probe vehicles.
2.4. Image Analysis and Video Processing
In addition to sensor data, smartphones equipped with high-resolution cameras can be utilized for visual inspection of pavement conditions. Works by Christodoulou et al. [
11,
12], Hadjidemetriou and Christodoulou [
18] and Lekshmipathy et al. [
19] explored the use of image and video analysis techniques to detect and classify various pavement defects, including cracks, potholes, and rutting. These studies highlight the potential of combining visual data with sensor data to enhance the accuracy and reliability of pavement condition assessments.
2.5. Pavement Management Systems
Work in the literature on pavement management systems (PMSs) has been extensive. Provided below is a brief literature review of recent works related to this paper.
De la Garza et al. [
20] introduced a network-level optimization framework for pavement maintenance and renewal strategies, emphasizing the integration of engineering and economic considerations. The authors proposed a mixed-integer linear programming model to prioritize maintenance activities while adhering to budgetary constraints. By considering the interdependencies of pavement sections and using life-cycle cost analysis, the framework optimizes resource allocation across a road network, demonstrating its effectiveness through case studies.
The work of Shoghli and De La Garza [
21] extended the optimization of roadway maintenance by incorporating multi-asset considerations, addressing the interrelationship between different infrastructure components (e.g., pavements, bridges, drainage systems). Using a multi-objective optimization approach, the authors developed a decision-making framework that balances cost, performance, and risk across asset categories. The methodology, demonstrated with real-world data, highlights the potential for more comprehensive and efficient asset management strategies within constrained budgets.
The works by Christodoulou et al. [
11,
12], Hadjidemetriou and Christodoulou [
18], and Kyriakou et al. [
2] explored a smartphone-based system for detecting and classifying pavement defects using vibration and video signals. By leveraging smartphone sensors, machine learning, and machine vision techniques, the authors developed a low-cost, efficient method for identifying pavement anomalies. The approach demonstrates high accuracy in distinguishing defect types, offering a scalable solution for pavement condition monitoring, and their studies highlight the potential for automation in pavement monitoring through advanced machine learning and machine vision techniques, and the potential of vehicles as sensors for detecting pavement surface anomalies.
Similarly, the study by Hadjidemetriou et al. [
22] presented a comprehensive decision support system (DSS) for managing asphalt pavements, integrating predictive modeling, real-time data, and optimization tools. The developed DSS balances cost, performance, and risk to guide maintenance and rehabilitation decisions. The system’s applicability was demonstrated through case studies, showcasing its ability to enhance pavement management efficiency.
In Li et al. [
23], a process was proposed based on the Analytic Hierarchy Process (AHP) for allocating priorities on highway network maintenance, with the researchers determining the quantified weightage of five pavement maintenance decision-making factors such as performance, structure strength, traffic loads, age, and road grade. The ranking index value
is derived by incorporating all relevant factors of the road section under consideration to determine its maintenance priority.
In Amandio et al. [
24], a literature review of PMS works that apply smart technologies is presented, identifying a series of future direction recommendations for researchers. A key study finding is that future PMS should tend to be capable of collecting and analyzing data at different levels, as well as to detect and predict all types of functional and structural flaws and defects.
In Shon et al. [
25], a pavement management system is suggested where connected autonomous vehicles would be used in the process of real-time data gathering. The authors put forward a mathematics model of the Markov decision process (MDP) for possible use in this system and pointed out the advantage of raising the precision of prediction models, inspections, and maintenance operations. Unfortunately, instead of real values, the authors used certain ranges for the level of uncertainty reduction because actual figures and data were not available at the time. Further, the work is based on model predictions, even though society is shifting toward model-free deep learning that may be effective when handling large datasets.
2.6. Key Findings
The key findings of the above noted studies can be summarized, as listed below.
Roughness assessment: Numerous studies have demonstrated the potential of smartphones to estimate the International Roughness Index (IRI), a widely used metric for quantifying pavement roughness. Accelerometers, gyroscopes, and GPS sensors embedded in smartphones have been effectively employed to capture vehicle vibrations and GPS coordinates, enabling IRI calculation with varying degrees of accuracy compared to traditional methods.
Distress detection: While less common, some research has explored using smartphone cameras and machine learning algorithms to identify and classify pavement distresses such as cracks, potholes, and rutting. These studies typically involve image acquisition, preprocessing, feature extraction, and classification using techniques like convolutional neural networks (CNNs).
Crowdsourcing: The ubiquitous nature of smartphones has facilitated crowdsourcing initiatives for pavement data collection. Citizen scientists can contribute to pavement assessment by using dedicated smartphone applications to record and submit data, potentially leading to more comprehensive and timely information on road conditions.
Overall, these advancements underscore the transformative potential of low-cost sensor-based technologies in ensuring safer, more sustainable roadway networks. While challenges such as data accuracy, integration, and system scalability remain, the innovations of the past decade lay a robust foundation for the continued evolution of smart infrastructure monitoring.
3. Methodology
3.1. Key Principles and Dataflows
The applied method is founded on the principle that the movement and rotation (roll, pitch, yaw) of a smartphone or smartphone-grade sensor within a probe vehicle correspond to pavement-induced vibrations, thereby enabling the assessment of roadway pavement quality. Further, under certain conditions and with the integration of additional data, vibration signals can be utilized to detect and classify pavement anomalies (Kyriakou and Christodoulou, 2021) [
3]. In parallel, a coupled camera can capture images of these anomalies, which may then be classified using machine vision (MV) techniques.
The geopositioned data and the sensed gyroscope rotations (roll, pitch, yaw;
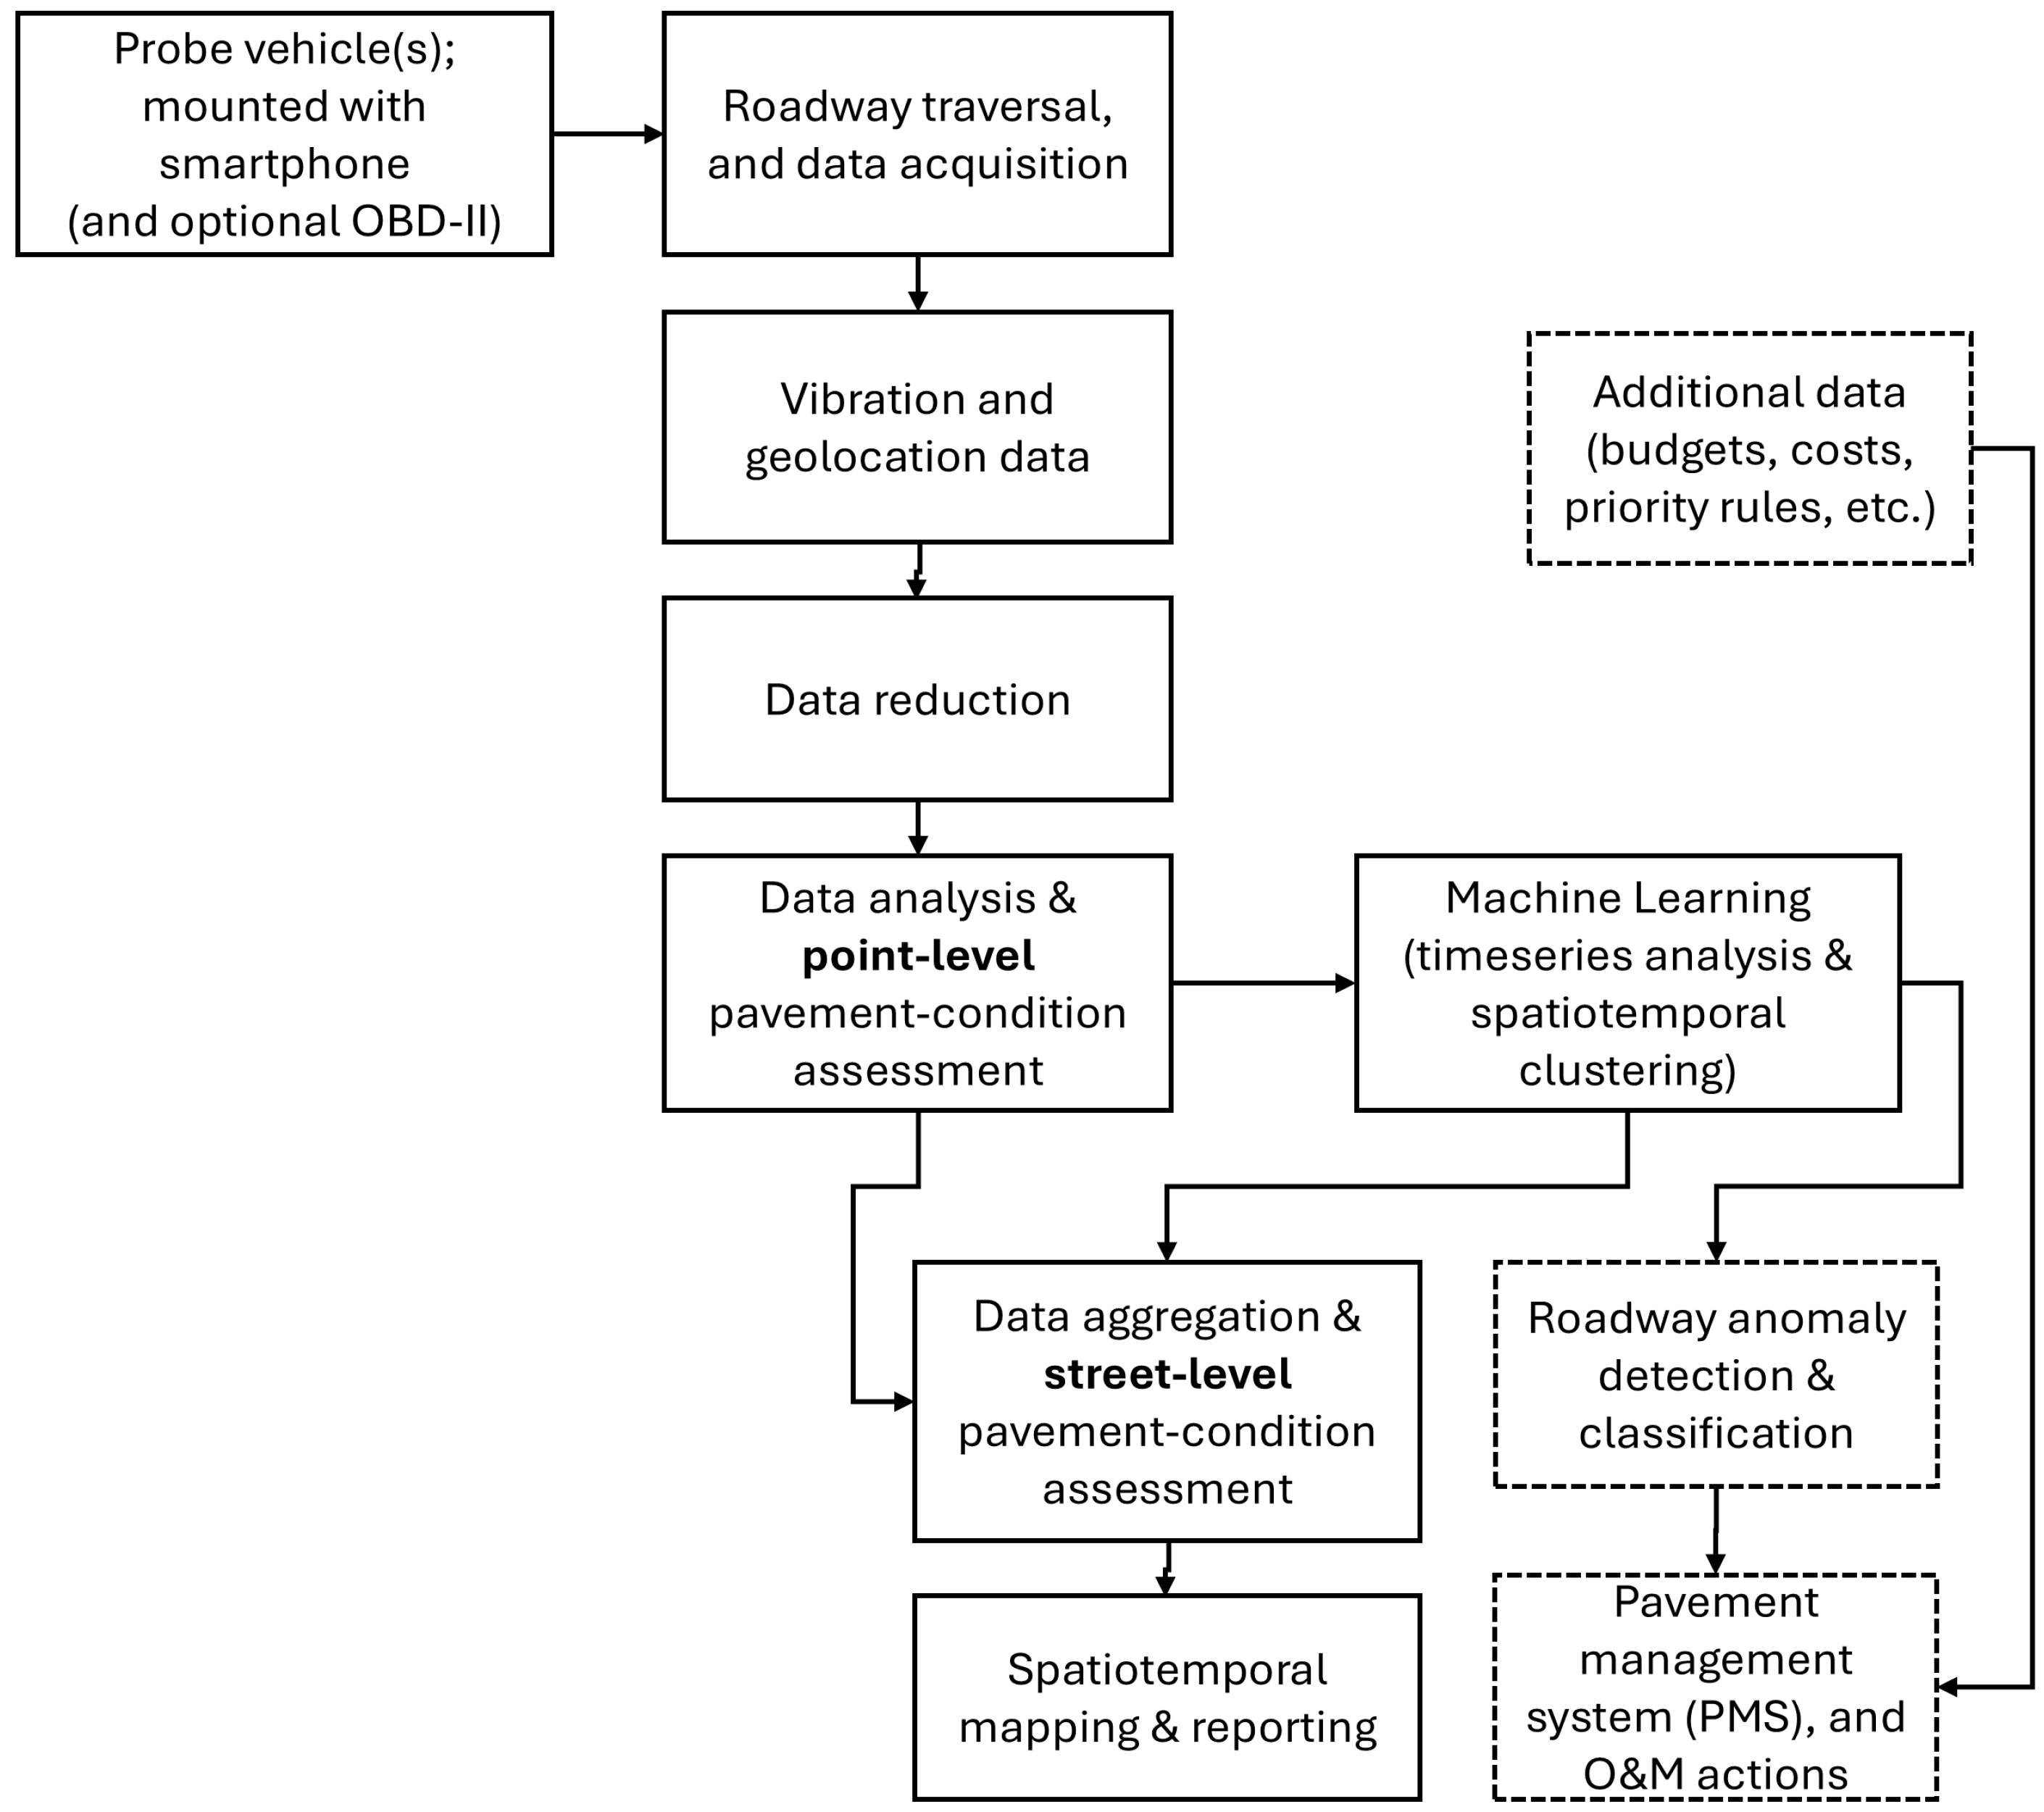
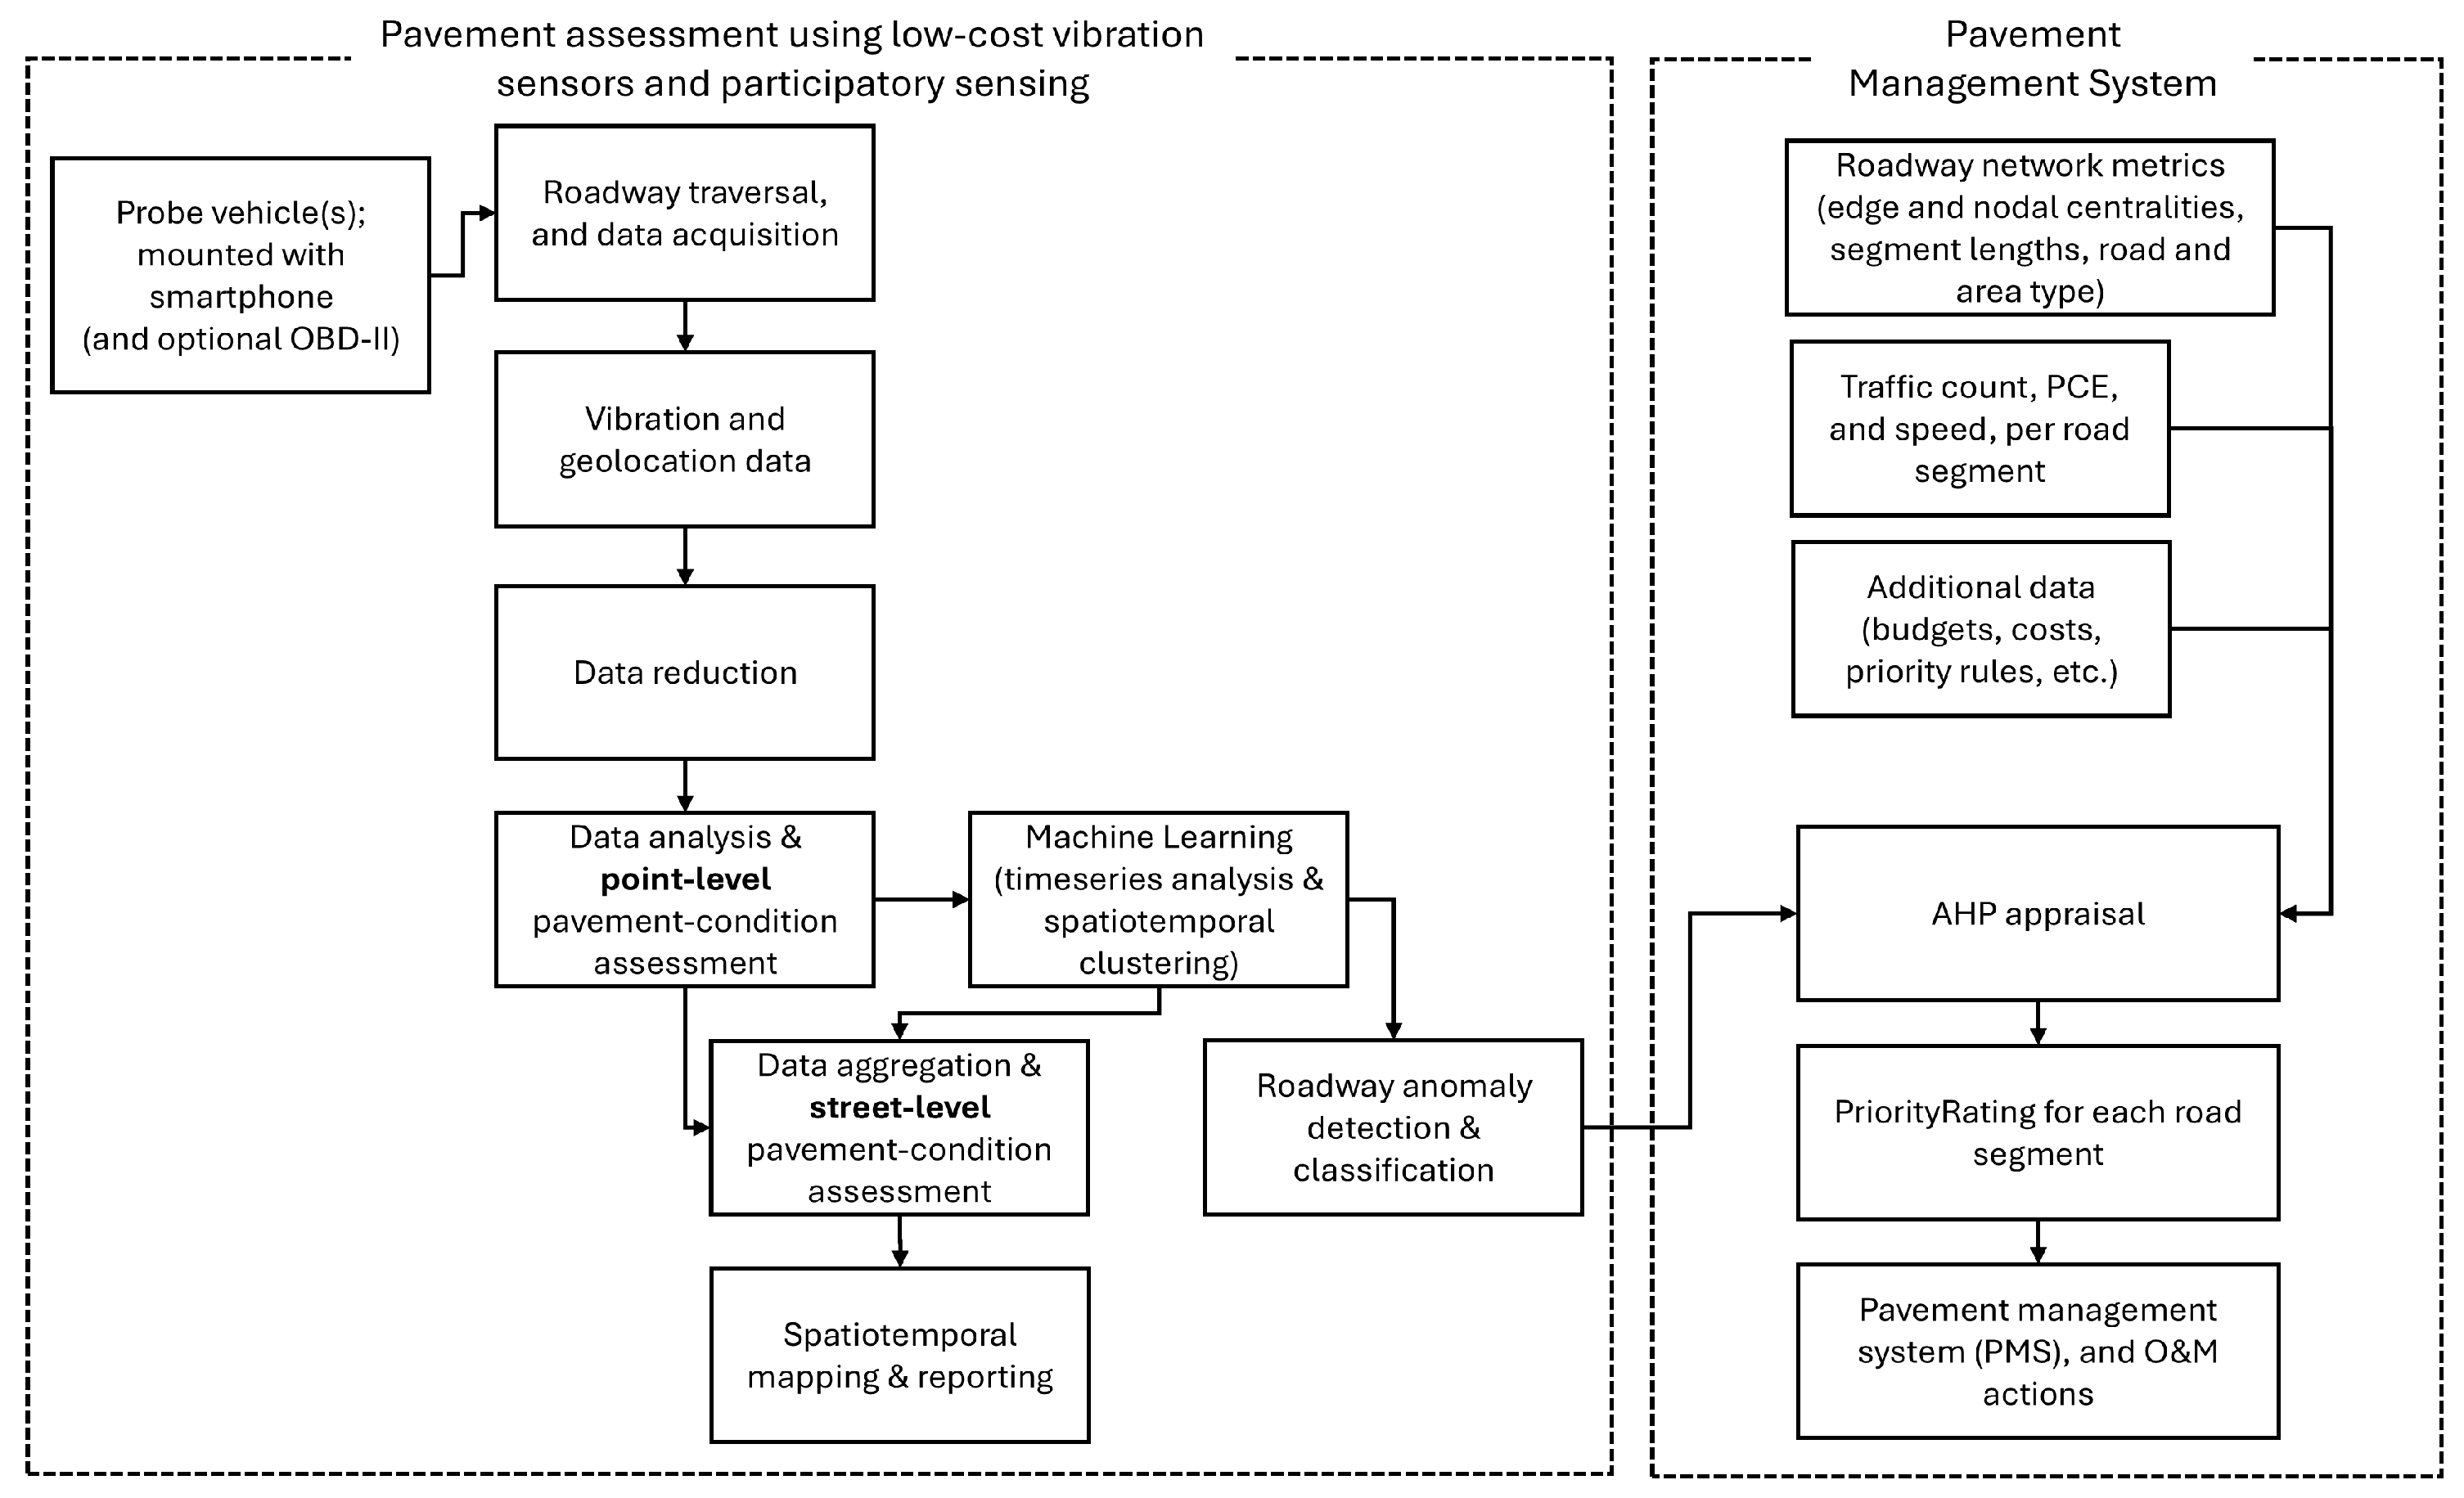
Figure 1) serve as data sources, and several spatiotemporal and machine learning algorithms serve as data processors, pattern recognition extractors, and KPI calculators in the process flow depicted in
Figure 2.
Sensed point-level data are first processed for anomaly detection by use of machine learning algorithms (such as k-means for clustering; LSTM and ANN for timeseries analysis and anomaly detection, respectively), aggregated by trip and date, shuffled, analyzed in space and time by means of machine-learning algorithms, and then clustered into a Likert scale of five pavement condition classes (1: Good; 2: Good-Bad; 3: Average; 4: Average-Bad; 5: Bad) by use of proprietary software code (Python ver. 9),and then mapped.
Finally, the data are aggregated into street-level condition classes, mapped in GIS, and utilized in extracting additional spatiotemporal KPIs such as the total length and condition class per road type.
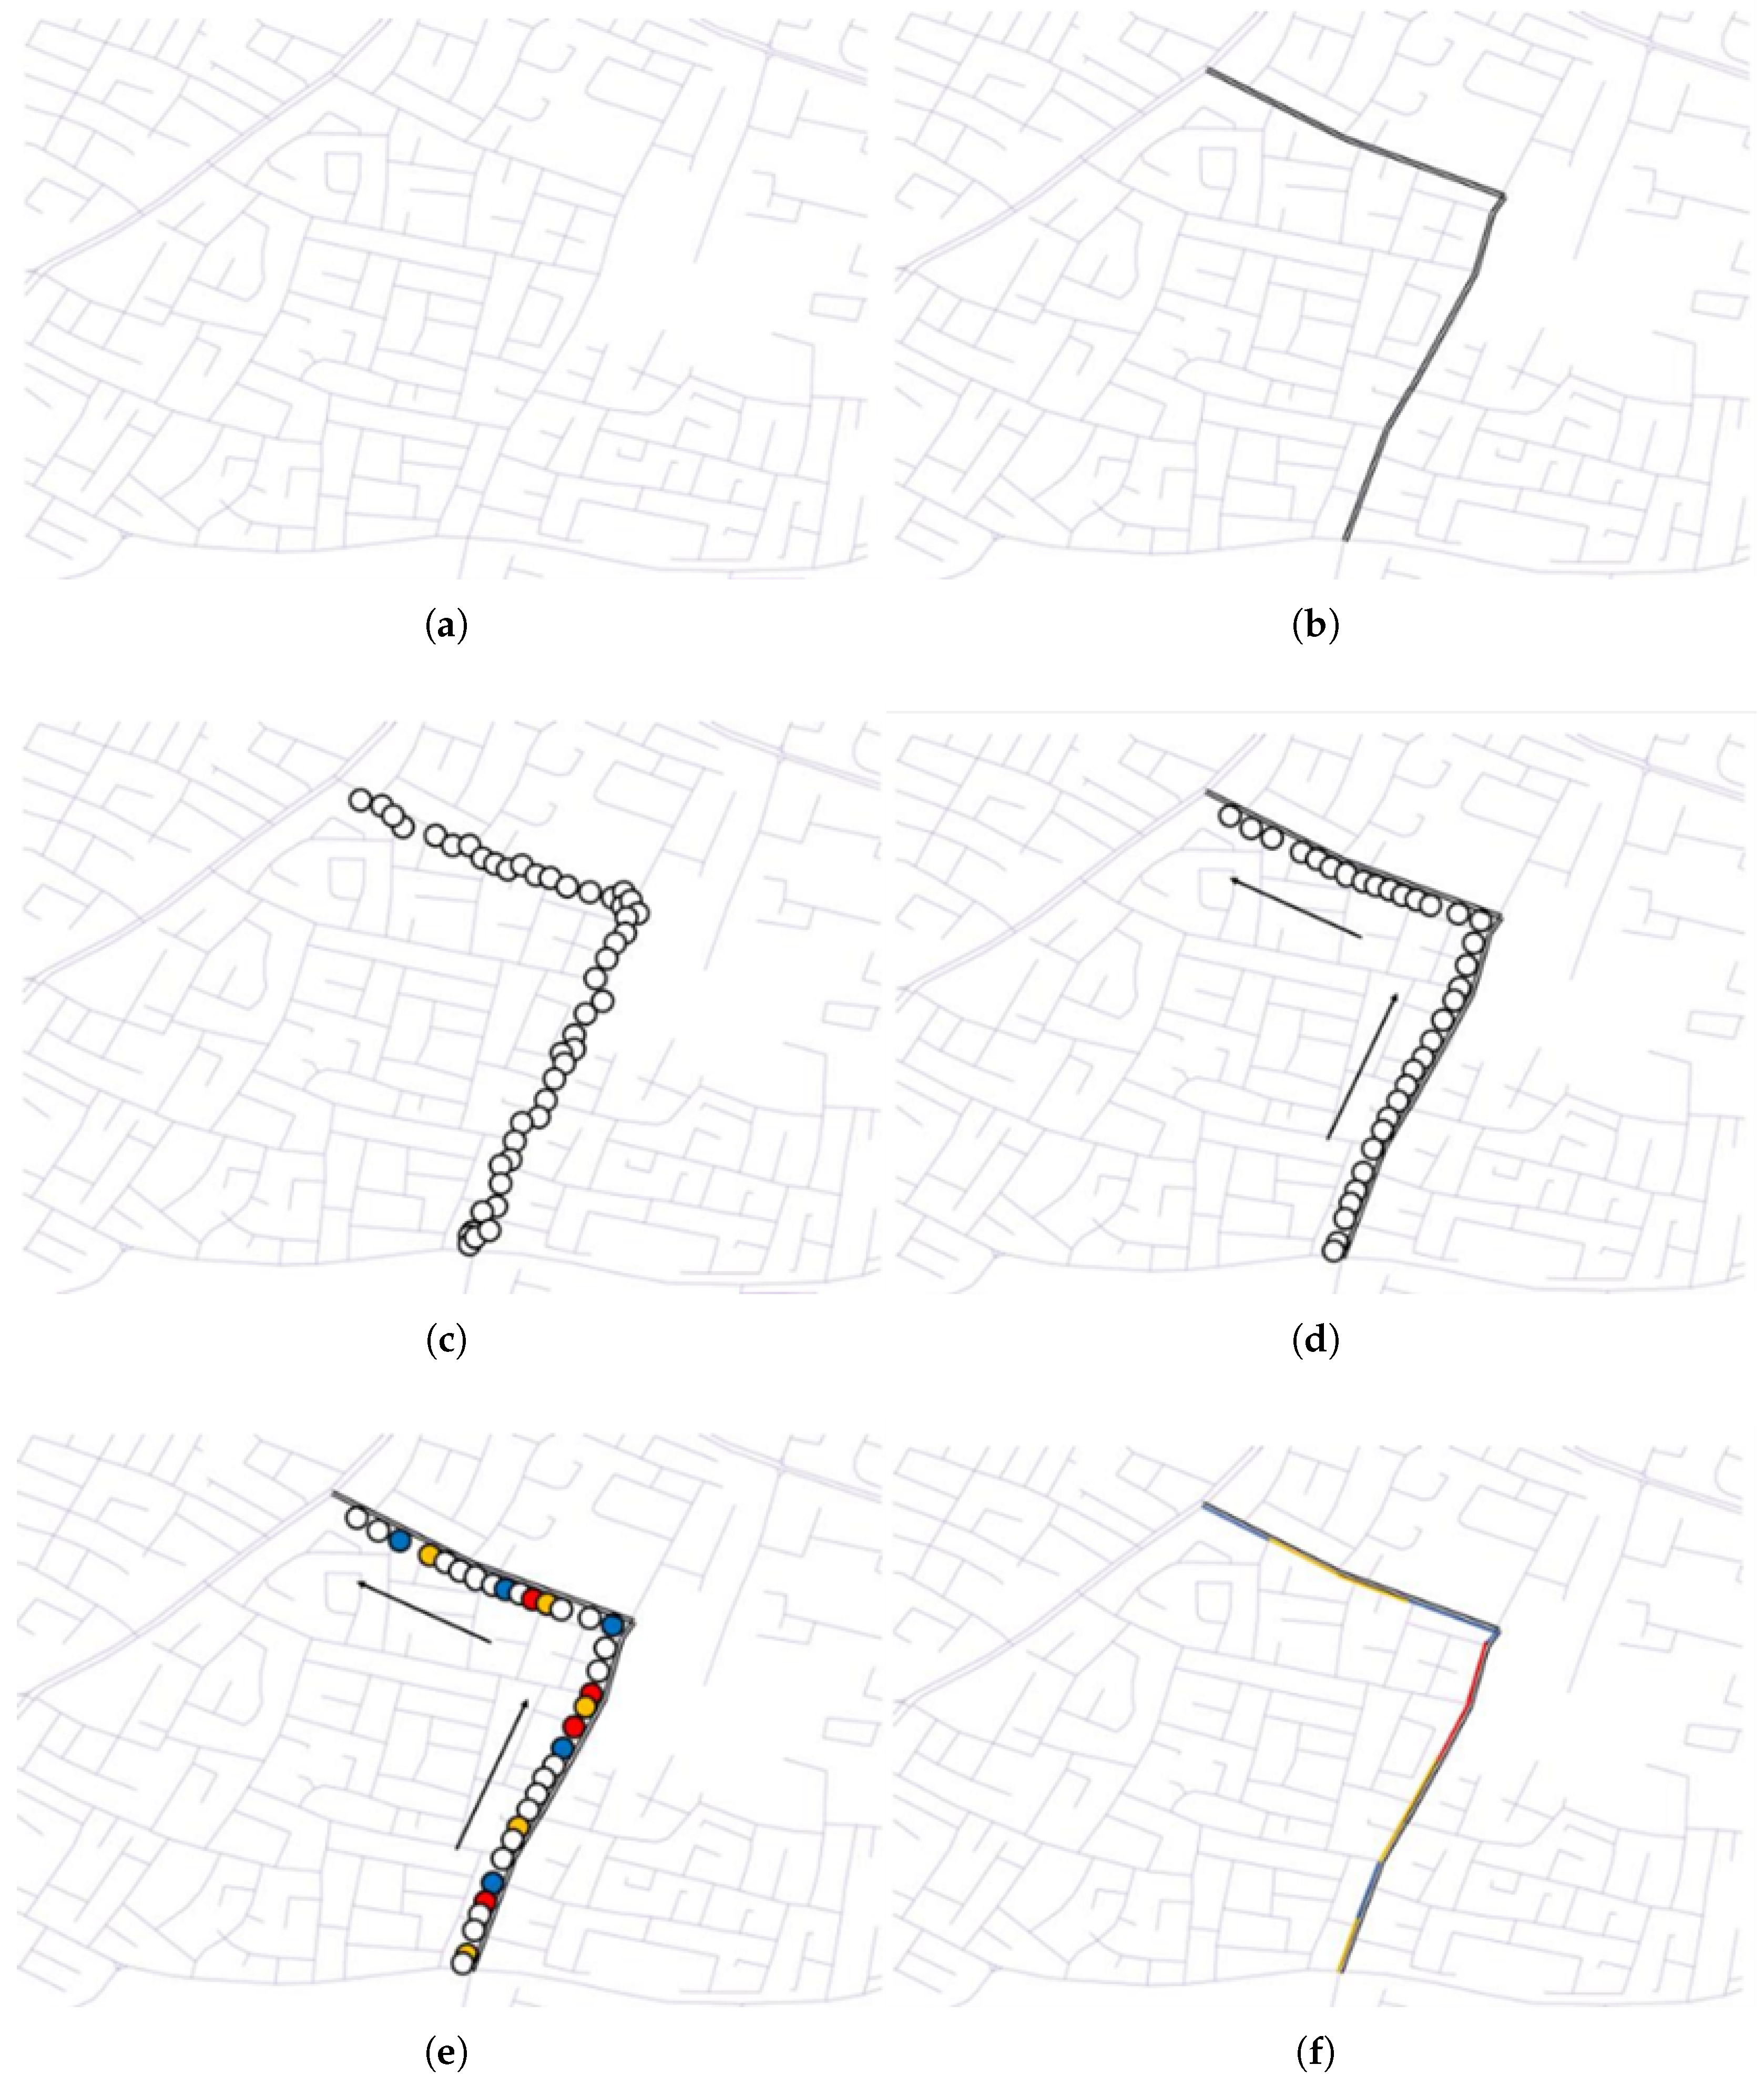
The data reduction, the point-level classification, and the subsequent data aggregation and segment-level classification are key steps in the above process, as they allow the collected vibration data and detected roadway anomalies to eventually be geocoded and mapped to the nearest roadway segments, thus arriving at the condition assessment of streets. The process is depicted in
Figure 3.
3.2. Preliminary Investigation and Analysis
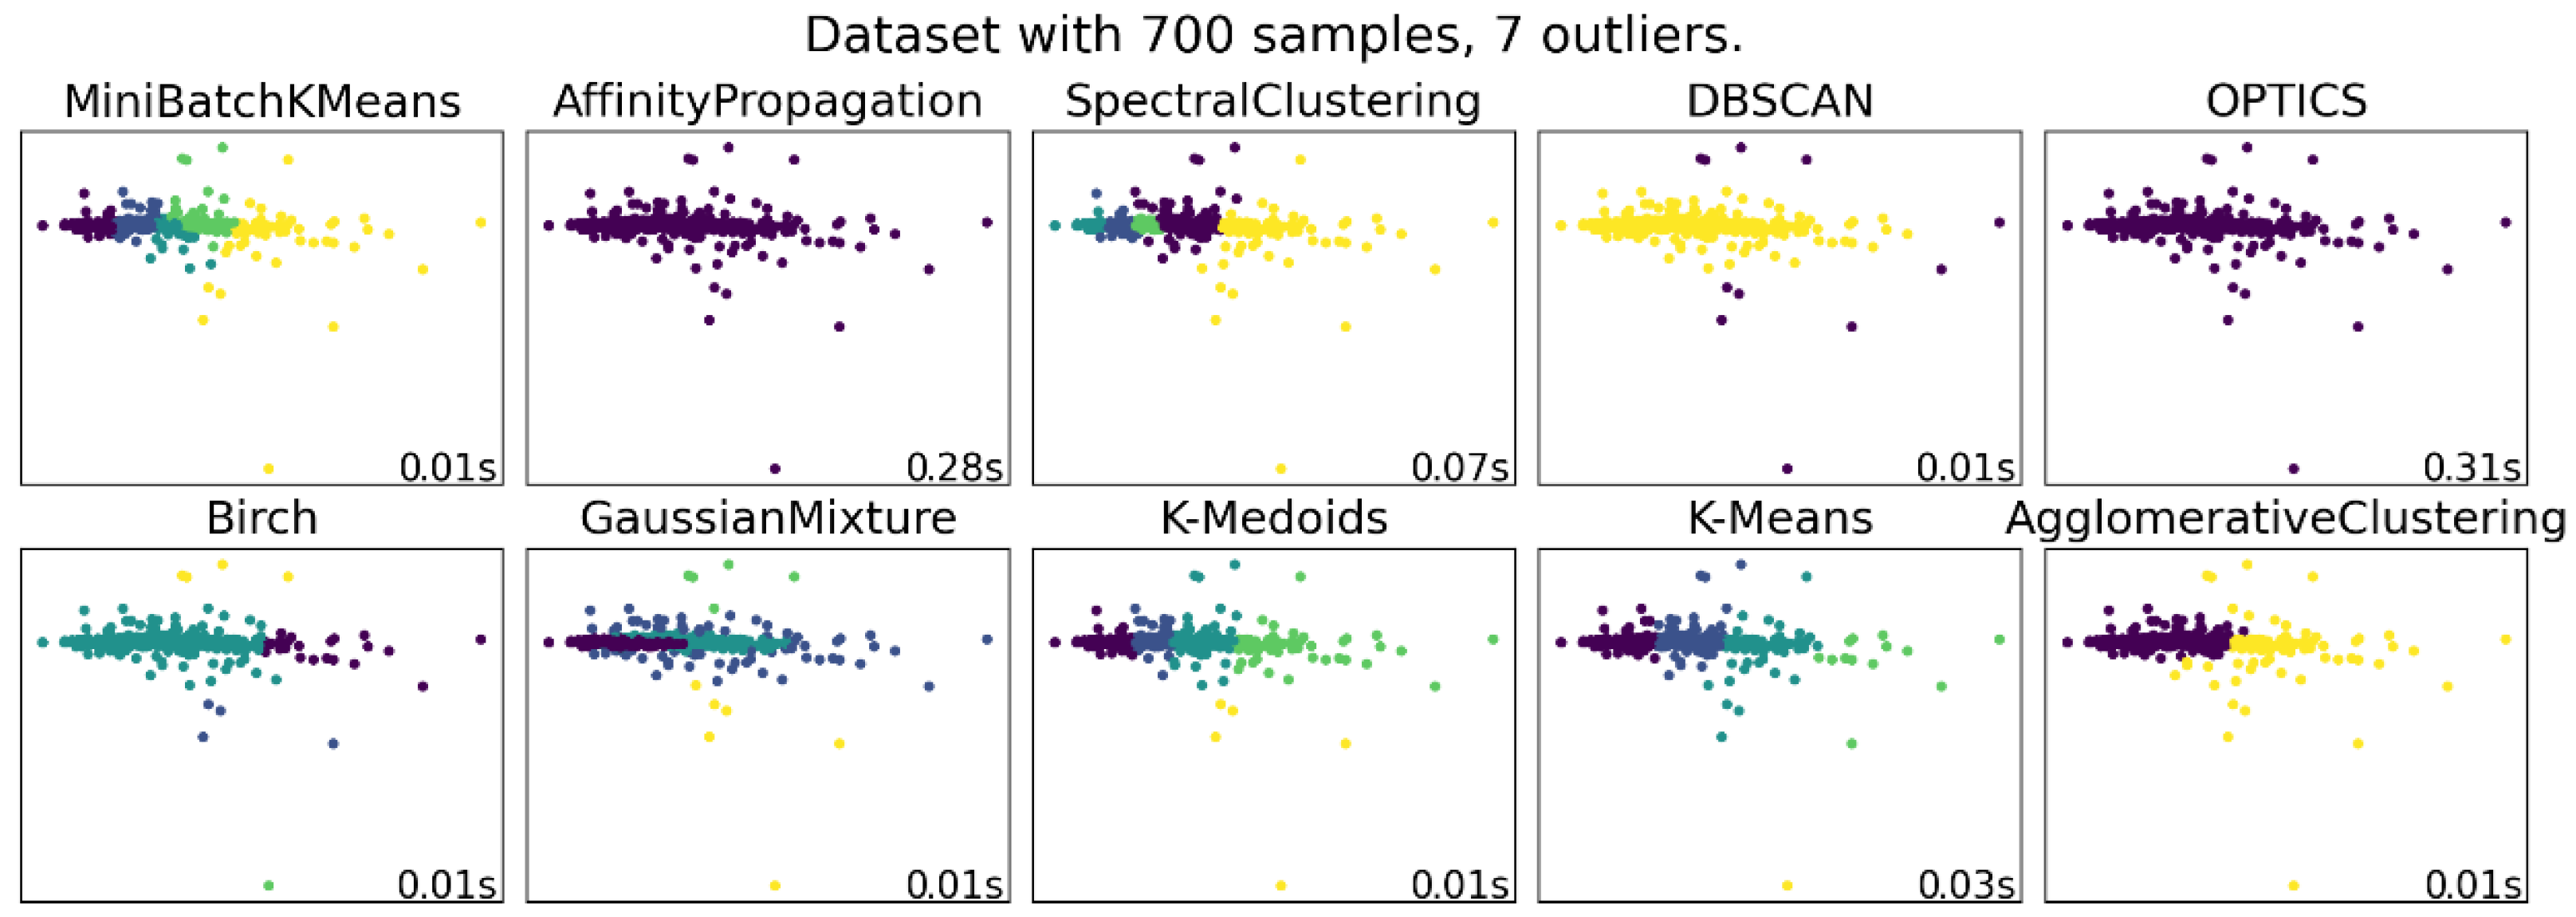
The computational efficiency (
Figure 4) and suitability to task (
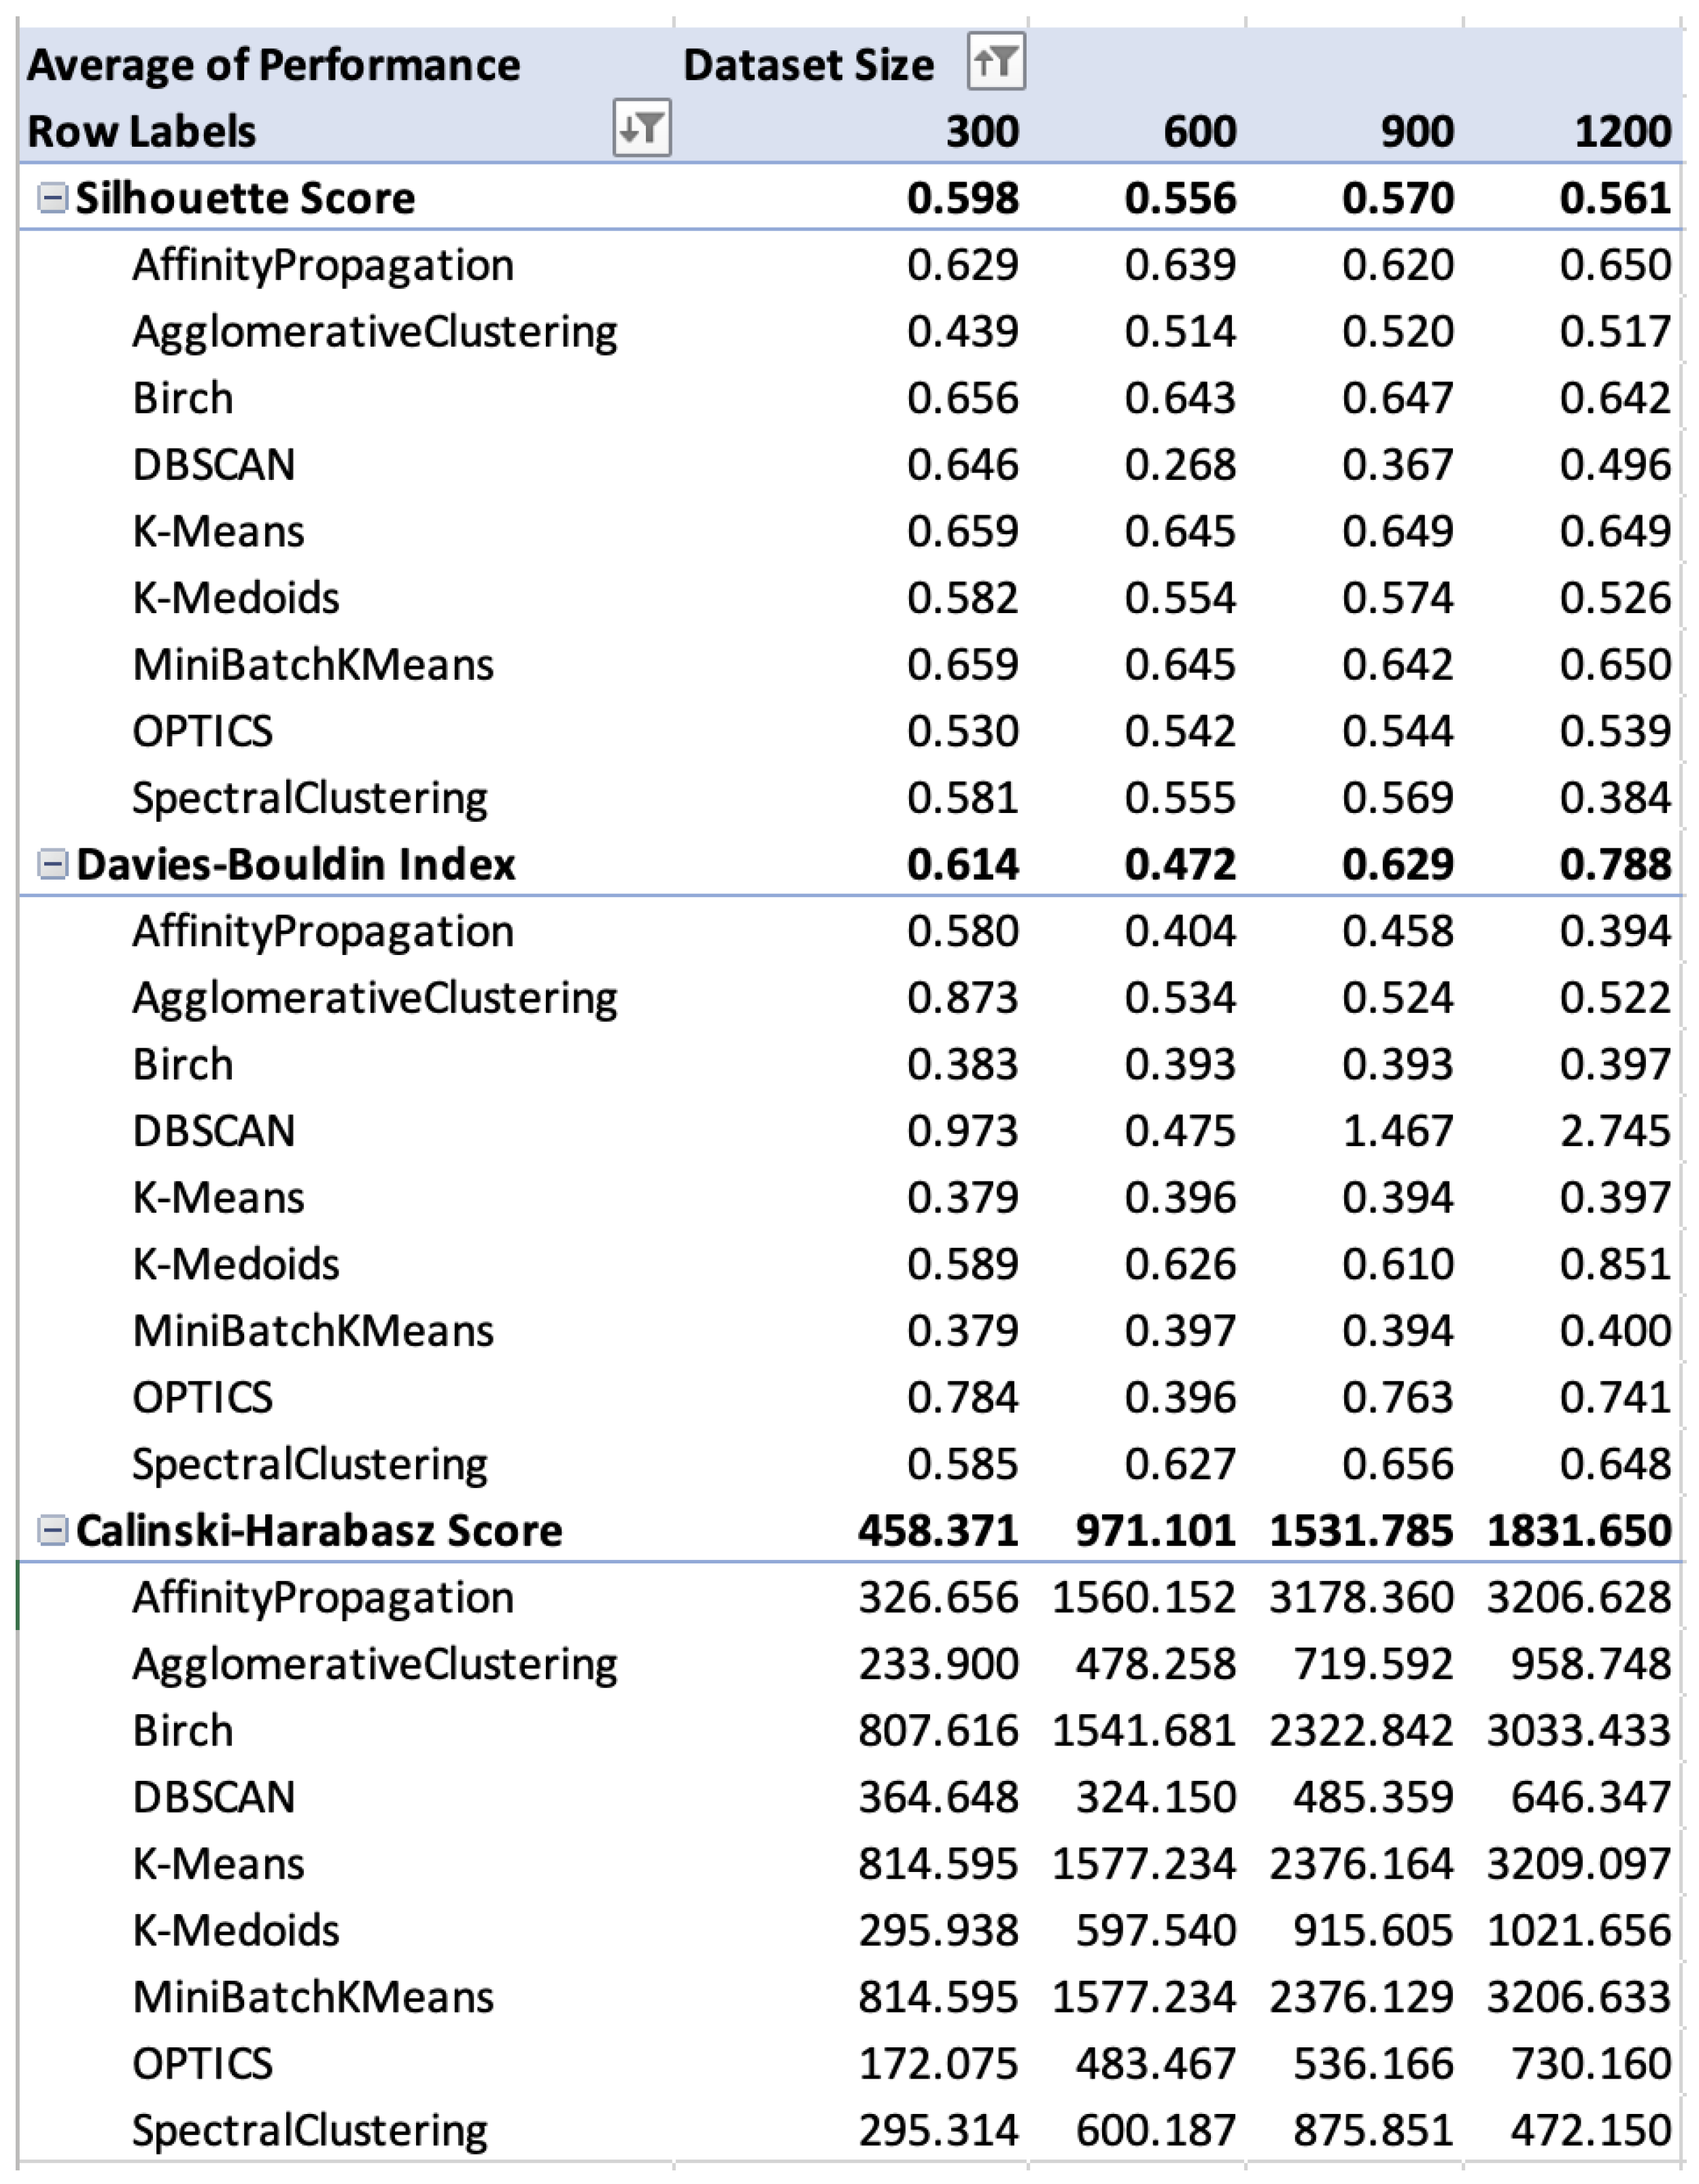
Figure 5 and
Figure 6) of the considered clustering methods and metrics were examined on roadway pavement data, from both the case-study networks, by use of standard evaluation metrics (i.e., the Silhouette Score, the Davies–Boulding Index, the Calinski–Harabasz Score).
Silhouette Score: It is a metric, with values ranging from −1 to 1, used to calculate the goodness of a clustering technique. A higher Silhouette Score relates to a model with better-defined clusters (the obtained clusters are well apart from each other and clearly distinguished), while negative values indicate incorrect clustering and scores around zero indicate overlapping clusters.
Values in the range [0.71, 1.00]: A strong structure has been found;
Values in the range [0.51, 0.70]: A reasonable structure has been found;
Values in the range [0.26, 0.50]: The structure is weak;
Values in the range [−1.00, 0.25]: No substantial structure has been found.
Davies–Bouldin Index: This index signifies the average ‘similarity’ between clusters, where the similarity is a measure that compares the distance between clusters with the size of the clusters themselves. Lower Davies–Bouldin values (with zero being the lowest possible score) relate to a model with better separation between the clusters.
Calinski–Harabasz Score (also known as the Variance Ratio Criterion): The index is the ratio of the sum of between-cluster dispersion and of within-cluster dispersion for all clusters (where dispersion is defined as the sum of distances squared). A higher Calinski–Harabasz score relates to a model with better-defined clusters.
As shown in
Figure 4, some clustering methods are faster than others in detecting data clusters (the speed of computation is shown in the lower right corner of each subfigure), and some methods are more suitable than others for arriving at a preset number of clusters (represented by the different group colorings in each subfigure. Clustering methods such as Affinity Propagation, DBSCAN, OPTICS, and Agglomerative Clustering seem to be unsuitable for vibration-based pavement condition classification.
The suitability to task of the various clustering methods evaluated was judged against the following five criteria:
Preset number of clusters: Methods not producing a preset number of clusters were dropped.
Consistency of clustering: The produced clusters should be consistent from run to run (and from time to time) regardless of the probe vehicle.
Randomness of clusters: The produced clusters should be consistent with pavement condition classes (i.e., lowest-class clusters should correspond to better-quality pavement).
Performance: The performance of the clustering method should be as high as possible (
Figure 5).
Speed of calculation: The computational load (and speed of computation) should be low, so that vast datasets can be efficiently processed (
Figure 4).
A similar analysis for the suitability to task and the accuracy of each clustering method shows that the methods’ performance varies depending on the metric examined and the size (and nature) of the dataset used (
Figure 5). Among the clustering metrics considered were the mean and standard deviation of the roll and pitch values, their products, and their covariances. The best-performing metrics are shown in
Figure 6.
As
Figure 5 shows, the choice of a suitable clustering method on the basis of one of the aforementioned three key performance indicators (KPIs) is not clear-cut. For example, for the four datasets shown in the figure (of 300, 600, 900 and 1200 datapoints) from a specific roadway run, in some cases the method of choice is the Mini-Batch K-Means Method (based on the Silhouette Score), in others it is the Affinity Propagation (based on the Calinski–Harabasz Score), and still in others it is the K-Means method. It is noted that the values in each row heading represent the average of the values by each method.
The suitability and performance of each method are also dependent on the input parameters the dataset is clustered on. The case in point is demonstrated in
Figure 6, depicting the results of the Silhouette Score analysis on a subset of datapoints and clustering parameter pairs. The analysis utilized 12 datasets of about 10,000 points each, six clustering methods (Birch, K-Means, K-Medoids, MiniBatchKMeans, Spectal Clustering, GaussianMixture) and four clustering parameter pairs based on the probe vehicle’s roll, pitch and roll*pitch mean, standard deviation and covariance values.
4. Case Study 1 (Thailand): Use of Smartphones as Vibration Sensors
4.1. Experimental Setup
The experimental setup for the first case study roadway survey included an Android-based smartphone, mounted in landscape orientation on the dashboard of a hybrid car (as per
Figure 1) serving as the probe vehicle. The use of a hybrid car aimed to minimize the level of vibration induced by ordinary combustion-engine vehicles. The smartphone’s sensors were operated at 100 MHz and 1 s gyroscope sensing and location sampling frequencies, respectively.
A total of 13 runs (in 3 days) were made, with several roads traversed multiple times. Key statistics on the case-study runs are reported in
Table 1, using pitch as the indicator for pavement distress.
Pavement classes are unitless measures of the perceived pavement condition, as sensed by the probe vehicles, obtained by clustering the vibration readings into a Likert scale of five pavement condition classes (1: Good; 2: Good-Bad; 3: Average; 4: Average-Bad; 5: Bad). The mean street-level condition class listed in
Table 1,
Table 2,
Table 3 and
Table 4 is obtained by aggregating on the sensed point vibration data and represents the weighted pavement condition class for the street segment containing these points.
The results of the pilot study are summarized in
Table 2,
Table 3 and
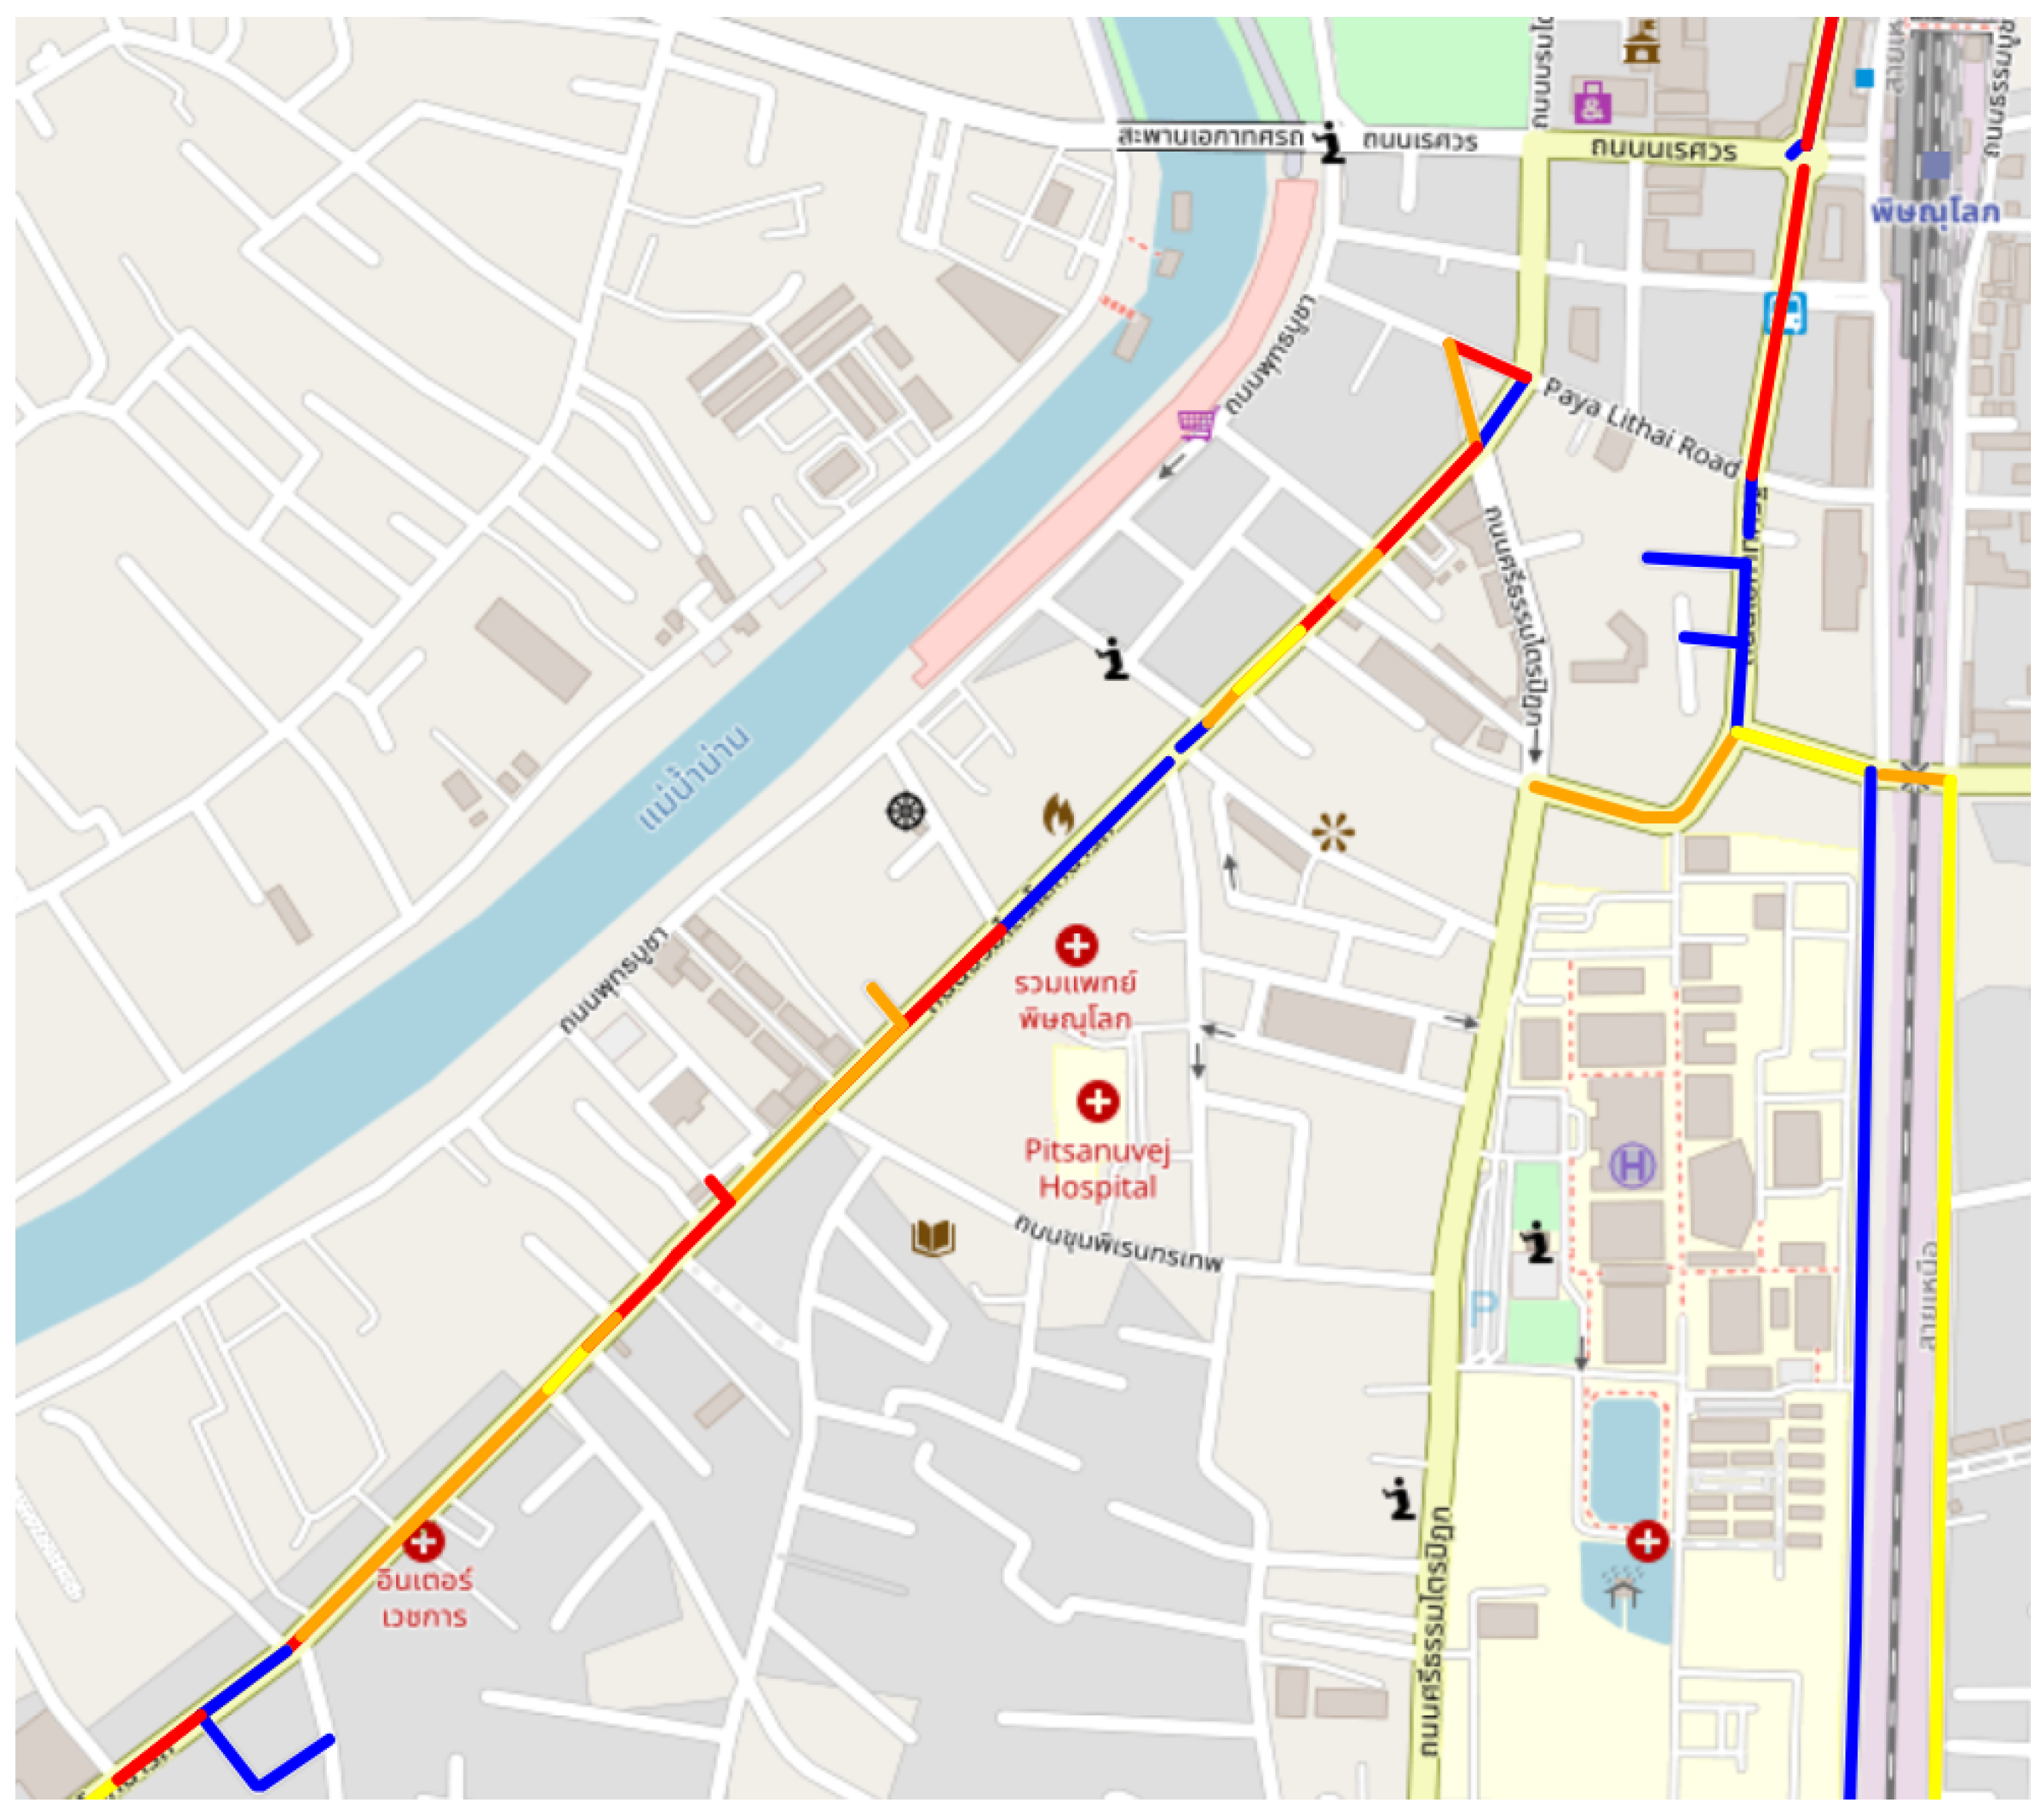
Table 4, for both the point-level and the street-level pavement assessments. The resulting point-level and aggregated street-level GIS map (
Figure 7 and
Figure 8) are also provided for visualization purposes, with the deduced pavement condition classes colored in green (class 1), blue (class 2), yellow (class 3), orange (class 4), and red (class 5).
The results in
Table 2 are obtained by use of proprietary ML-driven algorithms (such as ANN for pattern recognition and k-means for clustering), while those in
Table 3 and
Table 4 were obtained by spatio-temporal aggregations and spatial operations (such as point-to-line snapping and reverse-geocoding) on the classified vibration data. In summary, the vibration data provided by the smartphone sensors are first geolocated and then analyzed for feature extraction and pattern recognition (using ANN, decision trees, and timeseries analysis), before being spatially clustered by use of ML methods (such as k-means, or k-medoids).
As aforementioned, the choice of implemented ML algorithms was dictated by the needs for pattern recognition, timeseries anomaly detection, classification, and clustering, complemented by the need for scalability and computational efficiency.
4.2. Result Analysis and Discussion
The case study brought to light several issues faced by vibration-based roadway pavement assessment methods. The most important of such issues, and related steps taken or possible remediation strategies, are listed below:
Vibration-based methods are reliant on the probe-vehicle traversing over a vibration-inducing roadway anomaly. Hence, multi-pass probing and/or participatory sensing are needed.
To avoid long gaps in the surveyed roadway networks, especially if the probe vehicle’s speed is high when sensing a roadway, the frequency of sampling must be high and/or participatory sensing shall be used. In this case-study, the limitations of the smartphone 1 s location sampling frequency result in 3–10 m gaps in pavement-condition sampling (for speeds between 10 and 40 kmh, respectively).
- -
The sampling frequency of a typical smartphone GPS sensor is about 1 Hz, so at about 20 kmh (5.56 m/s)–40 kmh (11.11 m/s), the distance traveled is about 5.56–11.11 m. By comparison, the highest-performance (and thus highest-price) GNSS sensors operate at 50–100 HZ sampling rate, so the horizontal accuracy provided is much higher.
To avoid issues related to the probe vehicle’s sensitivity of sensing and/or the driver’s behavior and/or the smartphones used, participatory sensing shall be utilized. Further, to avoid bias in the processing of roadway data and in the pattern recognition processes of machine learning, data-collection runs should include a varying level of pavement condition classes.
If participatory sensing is used, intelligent data aggregation techniques, and a mixture of machine learning, anomaly detection algorithms and clustering parameters shall be used.
5. Case Study 2 (Cyprus): Use of Custom-Built Vibration Sensors
5.1. Experimental Setup
In the second case study, the probe vehicle was retrofitted (as shown in
Figure 9) with a developed integrated sensor device (including a camera) which replaced the smartphone used in the previous case study.
The combined use of a low-cost, yet high-accuracy, GNSS vibration sensor and a low-cost high-speed camera serves as an interesting alternative to high-cost specialized vehicles and a complementary technology that can help road network managers optimize resources and prioritize investments by providing a clear identification of areas needing more detailed inspections. In fact, the in-development sensors are currently piloted on both buses and municipal cars, providing valuable insights into the condition of roadway pavements and on detected roadway anomalies, at low capital and operational costs.
5.2. Key Functional and Hardware Requirements
The key functional requirements for the said sensor device and its key hardware components are as listed below. These requirements were formulated based on the observed limitations of the smartphone-based case study, the objective of enhancing detection accuracy at minimal cost, and the overarching scope of project PAVE-SCAN [
26], which drove the development of the technology.
Key functional requirements:
Design for modular integration of sensors, software modules, and user interfaces.
Modular options tailored for different user groups (e.g., agencies, operators, public).
Plug-and-play, non-intrusive installation on M1-class vehicles.
Support real-time and batch data processing (on-device and cloud).
Enable fusion of timestamped, geo-referenced vibration, image, and 3D data.
Compatible with GNSS corrections (RTK or Galileo HAS).
Design for compliance with EU directives (Technology Readiness Level, TRL8).
No battery to be used, for safety reasons.
Over-the-air updates.
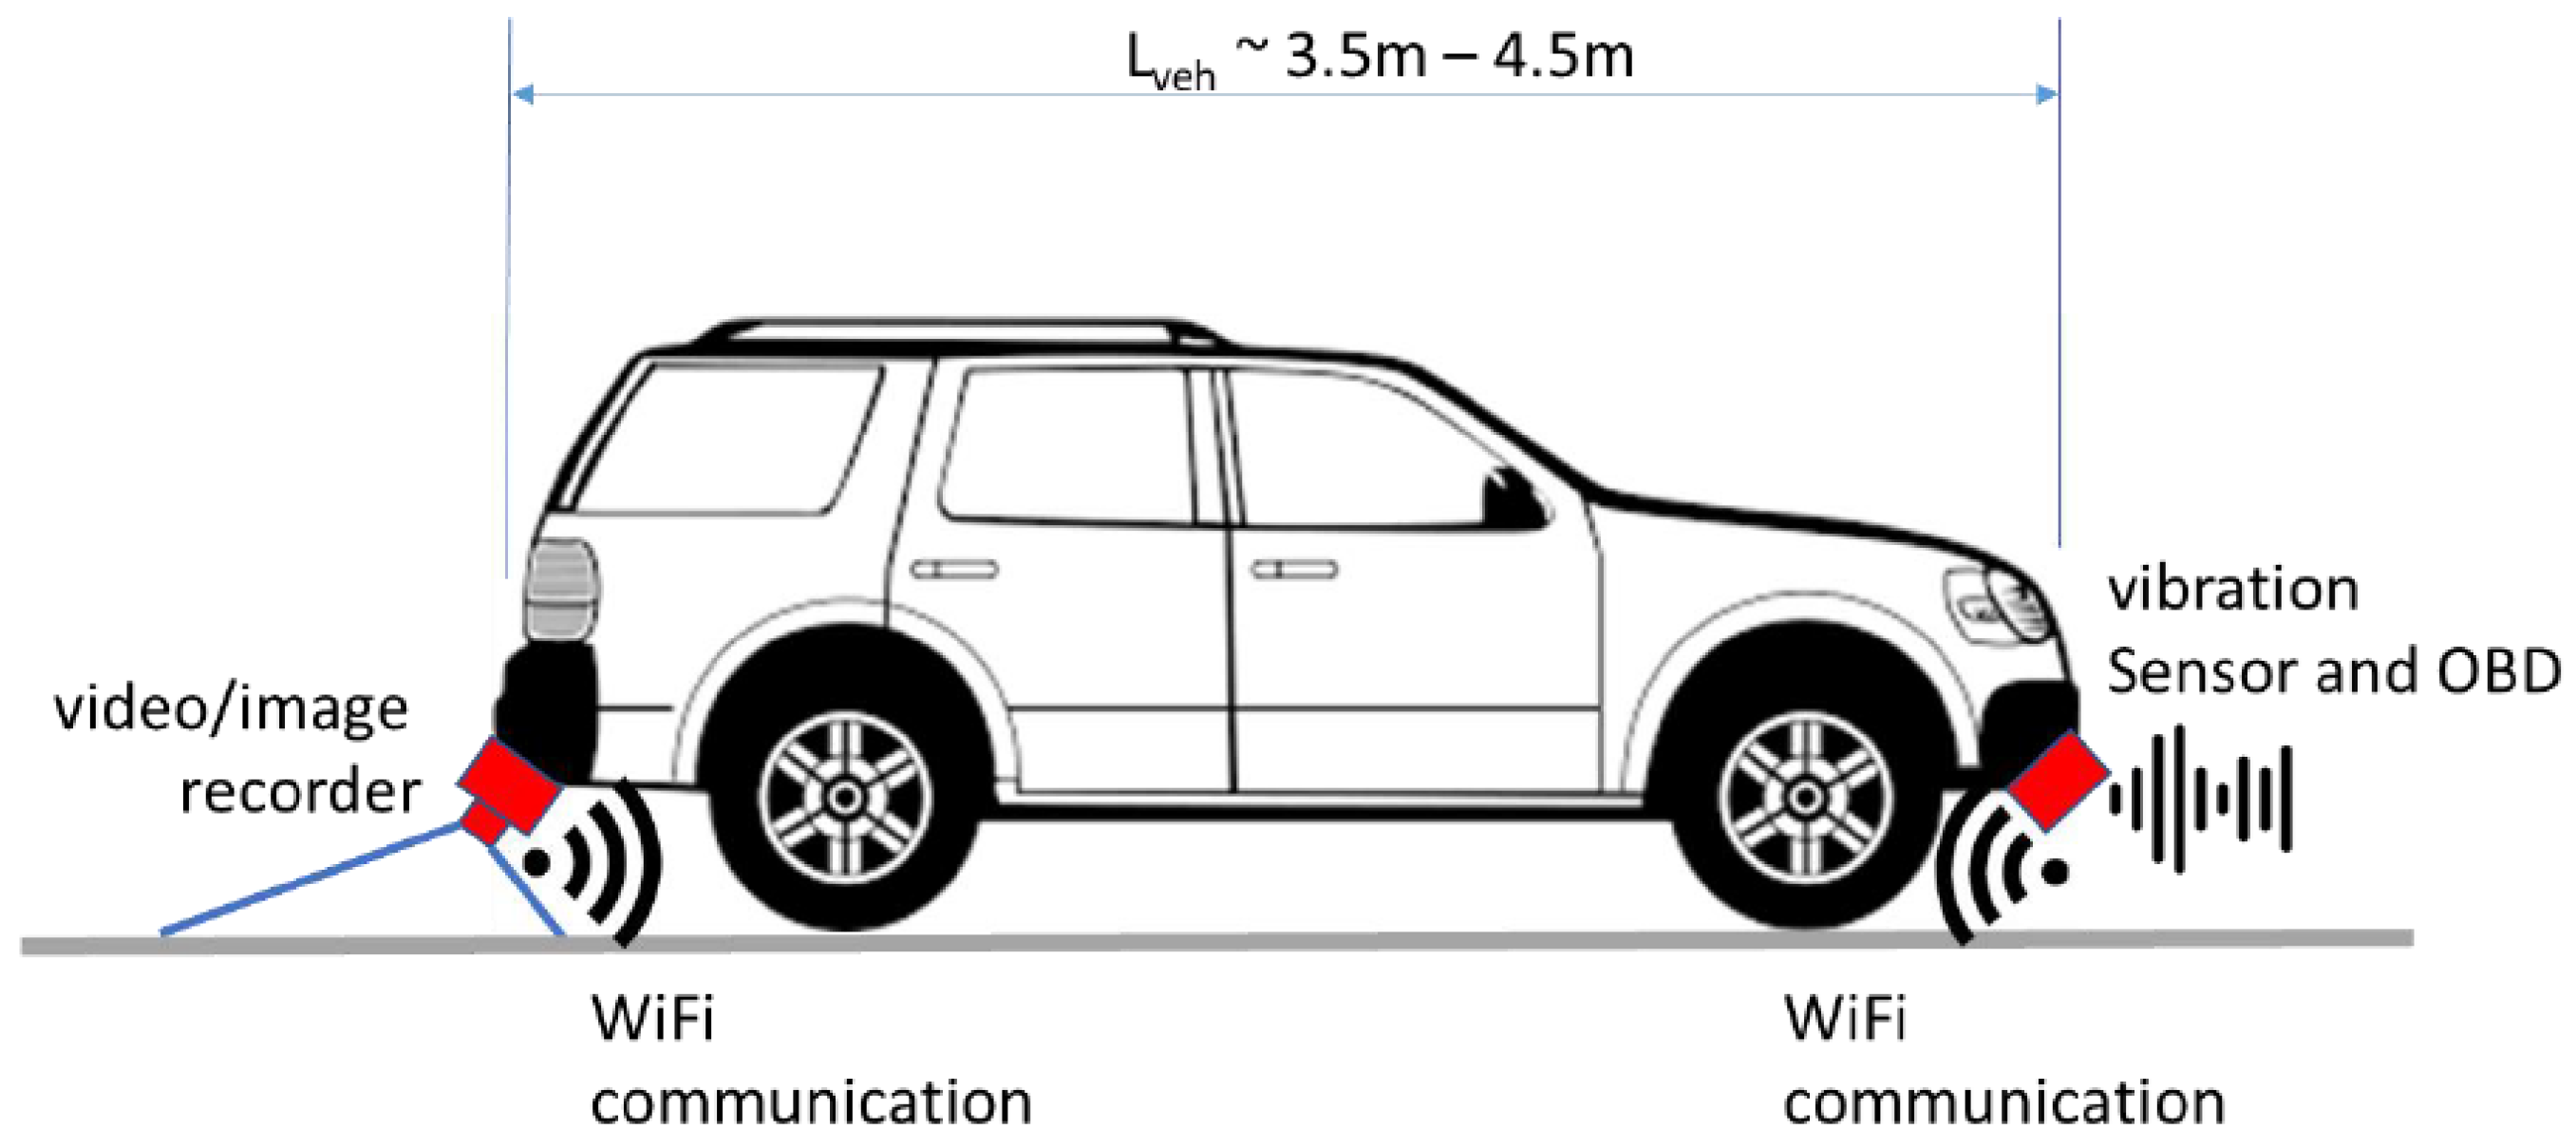
Key hardware components (depicted schematically in
Figure 10):
Accelerometers.
Communication modules.
Processing unit (AI-edge module).
2D camera (or 3D camera, if depth measurements are required).
GNSS standard accuracy (or Galileo High Accuracy Service, HAS, if higher accuracy is required).
Graphics/AI card (for MV).
Power management.
Antenna for standard and high-accuracy GNSS.
Antenna for communication modules.
Storage device.
5.3. Results
As with the first case study, sensed point-level data are first processed for anomaly detection by use of machine learning algorithms, aggregated by trip and date, shuffled, analyzed in space and time by means of machine-learning algorithms, and then clustered into a Likert scale of five pavement condition classes (1: Good; 2: Good-Bad; 3: Average; 4: Average-Bad; 5: Bad) by use of proprietary Python-based software code, and finally mapped.
The key differences between the two case studies are the change in technologies used (from smartphone to the proprietary integrated sensor devices schematically shown in
Figure 10), the added positioning accuracy, and the inclusion of a camera for the machine-vision analysis of detected roadway anomalies (the analysis is not included in this paper).
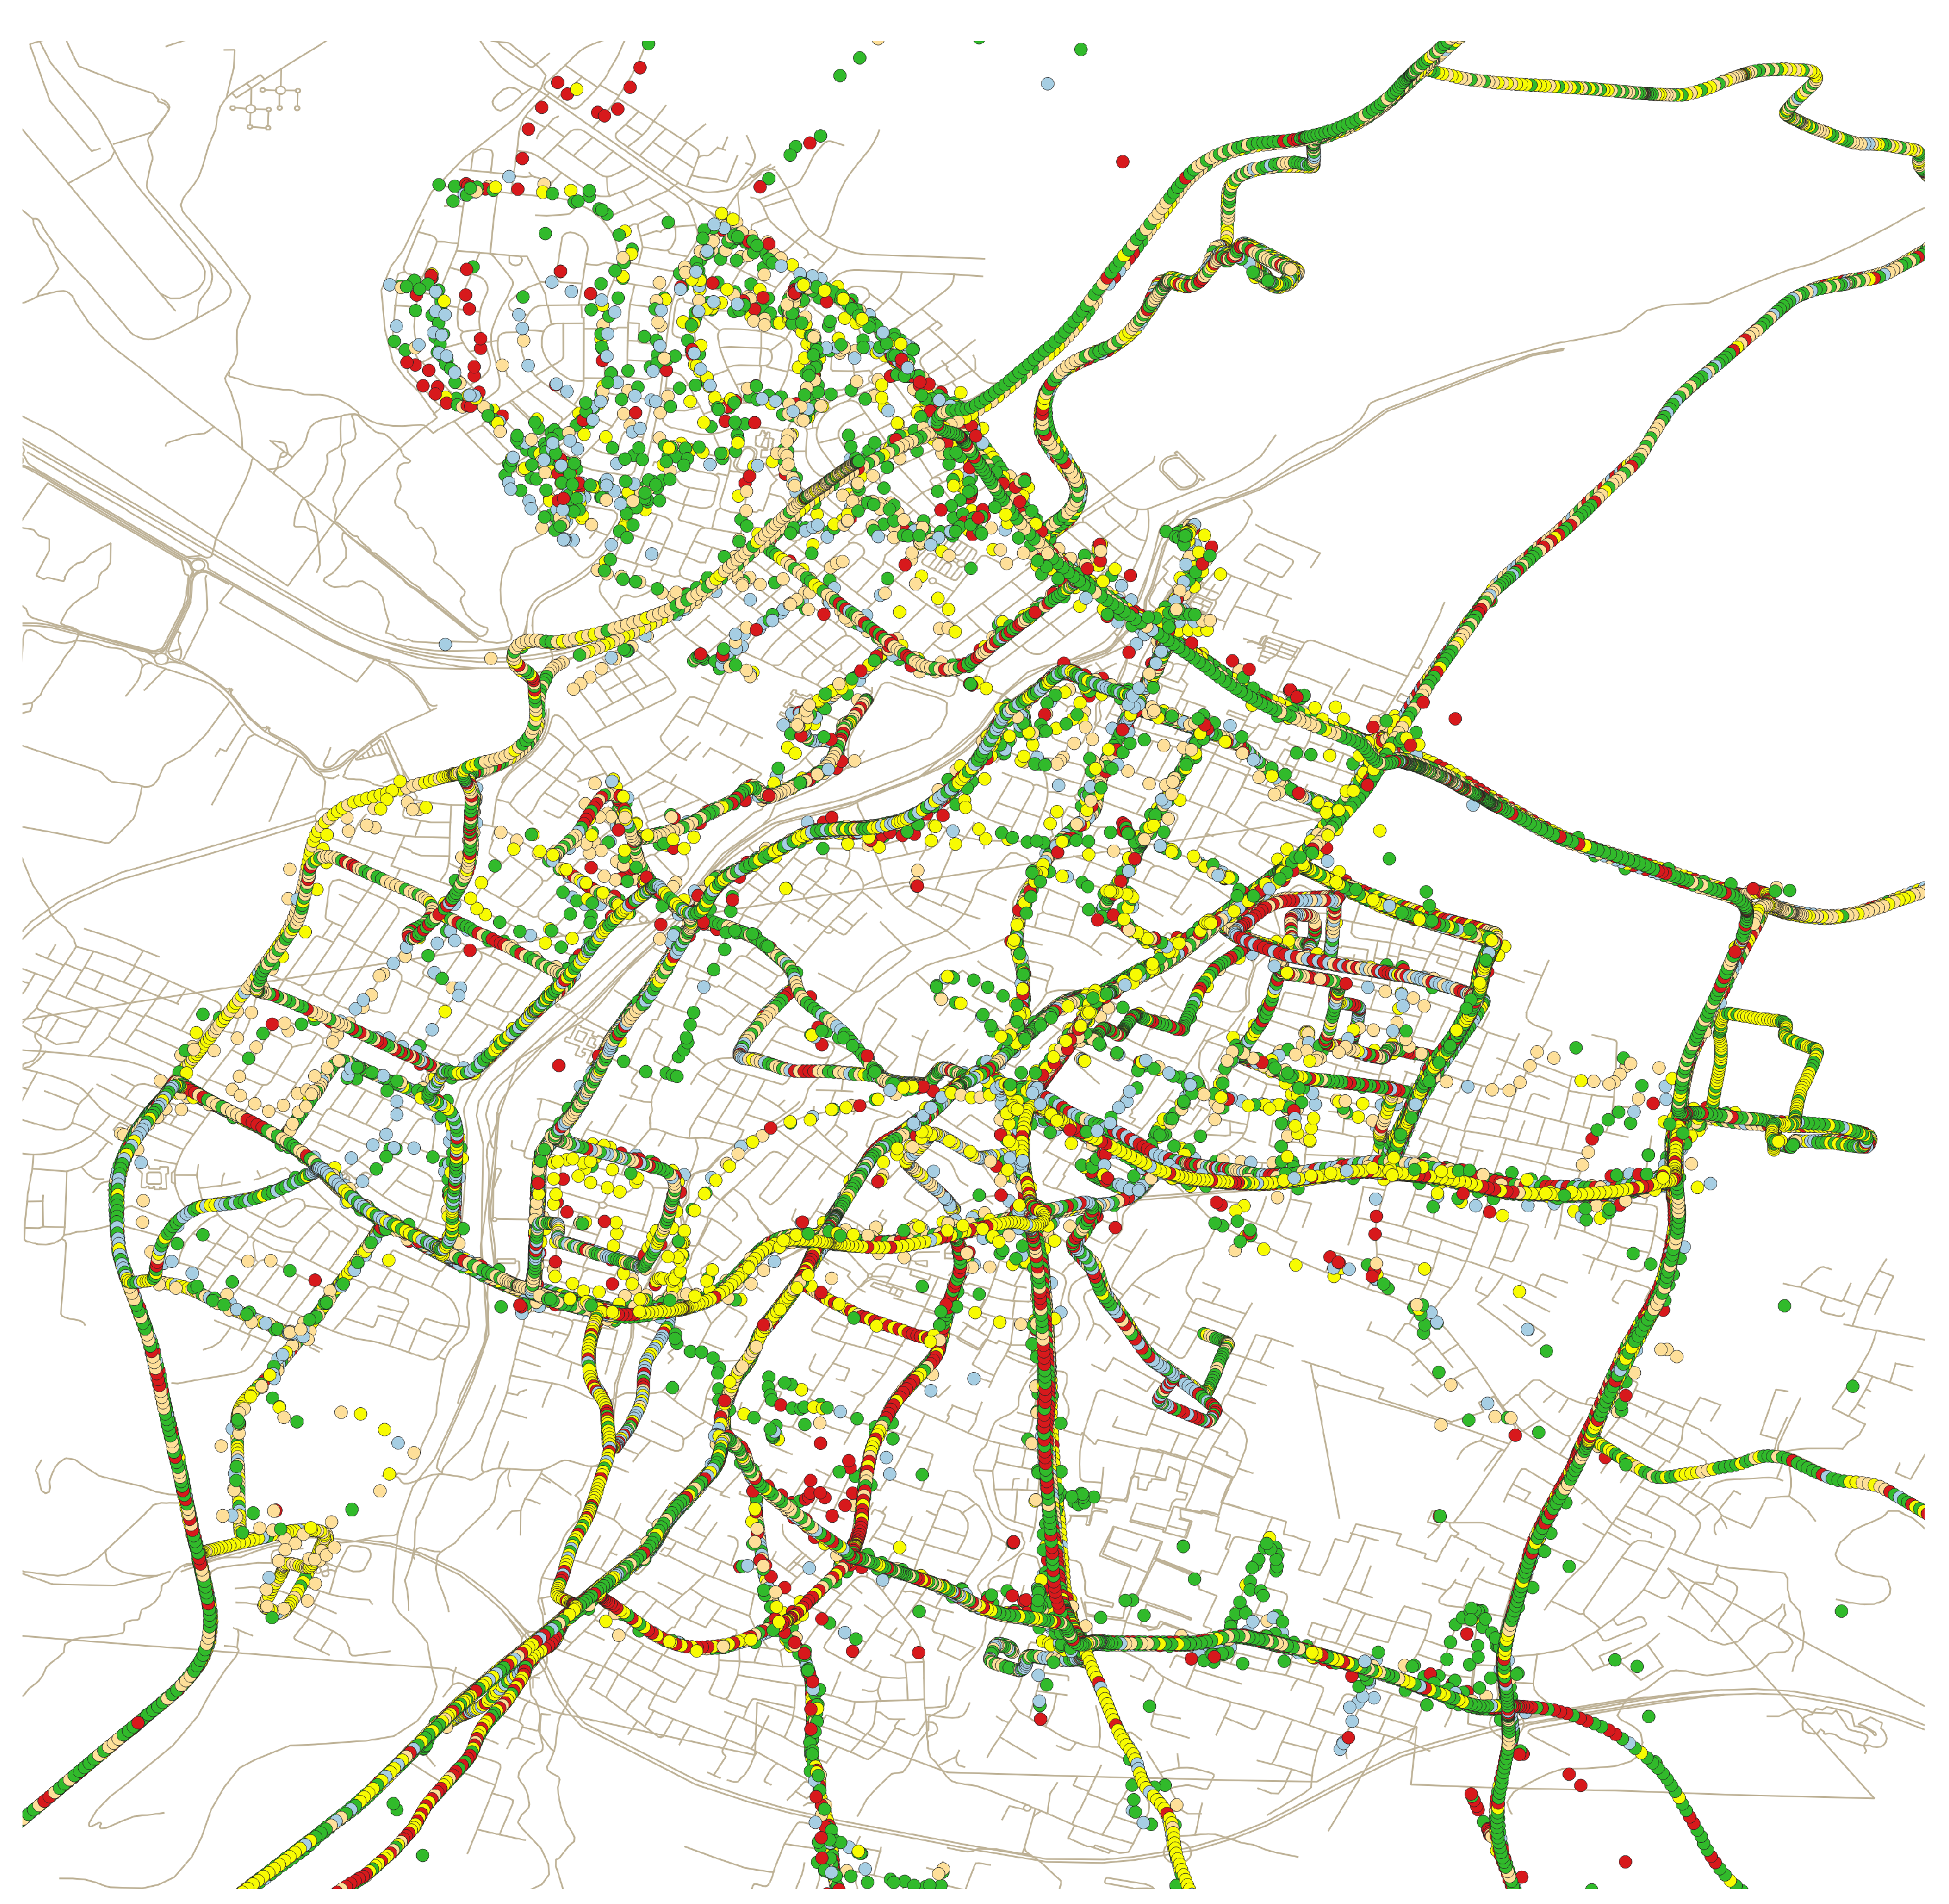
Key statistics on the case study are listed in
Table 5, with the point-level roadway assessments shown in
Figure 11 (in green, good-condition pavements; in red, bad-condition pavements). As with the roadway network in Case Study 1, point-level condition assessments can be aggregated to street-level condition maps.
6. From Pavement Condition Assessment to Pavement Management
To translate vibration-based roadway assessment into actionable decision making, it is essential to embed such sensing approaches within pavement management systems. By integrating vibration-derived indicators of pavement condition with broader datasets, municipalities can move from raw sensor outputs to structured, multi-criteria prioritization frameworks. This ensures that low-cost sensing is not only feasible as a data collection method but also meaningful for long-term planning and resource allocation.
6.1. Methodology
The succeeding sections outline the development of a road pavement management system (PMS) using the aforementioned low-cost sensing technologies and the Analytic Hierarchy Process (AHP), to prioritize road works based on seven criteria (as listed in
Table 6). A key aspect of the method is the utilization of the discussed smartphone-grade technologies for the condition assessment of roadway pavements (criterion
) and readily available open-source data on the other criteria (
), primarily through National Access Points (NAPs). National Access Points are data APIs mandated by the European Union to facilitate access, easy exchange, and reuse of transport-related data in order to help support the provision of EU-wide interoperable travel and traffic services to end users (ITS Directive 2010/40/EU). Other data sources include the OpenStreetMap (OSM) roadway network datasets, and unit construction costs and annual budgets from local municipalities.
Each of the used criteria was further broken into sub-criteria and assigned weights through pairwise comparisons, as per the Analytic Hierarchy Process (AHP) technique. Sample sub-criteria were, for example, the considered studied roadway network’s nodal and edge centralities (edge betweenness centrality, nodal betweenness centrality, closeness centrality, degree centrality).
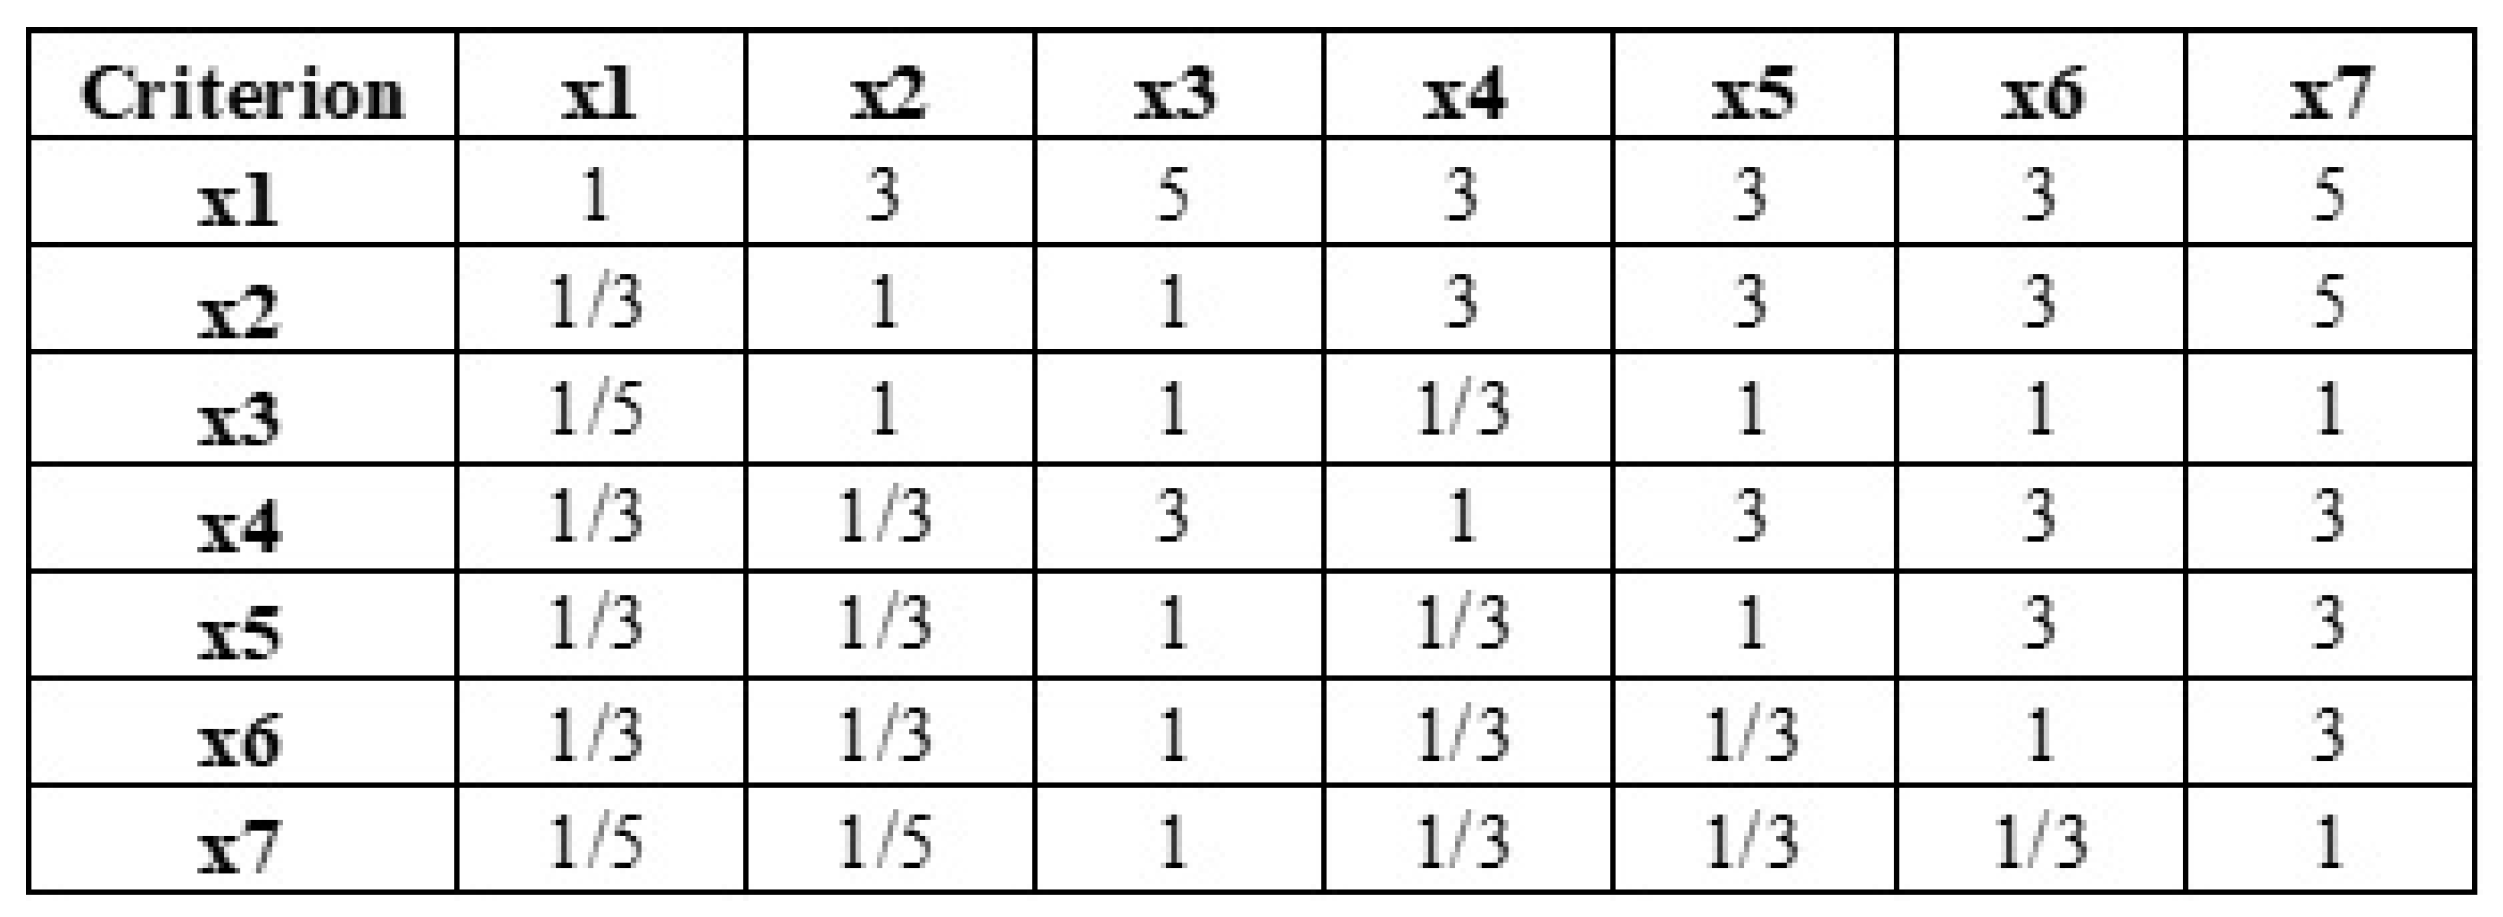
The aforementioned AHP weights reflect the relative importance of each criterion on the overall assessment and prioritization, and are determined using a symmetric comparison matrix populated based on professional experience (distributed questionnaires) or factual information. For example, a road’s assessed (or projected) condition was deemed significantly more important than the average traffic speed on that road, while criteria such as the type of road (primary, secondary, highway, etc.) and the type of area in which the road is located (residential, industrial, mixed, etc.) were considered equally important but less critical than the road condition.
The deduced pairwise comparison matrix (
Figure 12) is a key feature of this methodology, ensuring consistency and proportionality in the weighting process. It assigns higher values to more significant criteria and reciprocal values to less significant ones, ensuring a balanced assessment. Data for the criteria were sourced from various platforms, including vibration sensors, OpenStreetMap (OSM), and transport authorities. This structured approach enables a systematic evaluation of roads, integrating expert judgment and data-driven insights to inform maintenance and prioritization decisions effectively.
The pairwise comparison matrix is then processed using AHP principles, dividing all individual pairwise weights by the total value of each column, to obtain the matrix of relative weights shown in
Figure 13. The values in the table’s “Final Weights” column are computed as the arithmetic mean of the values in each row of the table.
The resulting formula for calculating the road rating (
) for each road,
i, is thus:
The overall process used and the related dataflows are as shown in
Figure 14. As aforementioned, data on the roadway network is sourced from open sources (OpenStreetMap, National Access Points). These datasets (providing information on the network topology and various road features) are supplemented by financial information related to annual construction unit costs, repair/reconstruction contracts, and budgetary constraints. Data on the condition of roadways is collected using smartphone-level sensors and participatory sensing. Municipal vehicles and/or buses and/or citizen vehicles equipped with vibration sensors serve as probe vehicles, collecting vibration data as they traverse the roadway network and transferring the data to the cloud for processing.
The vibration data from the probe vehicles are processed by means of machine learning algorithms, georeferenced and then aggregated to their corresponding road segments. A database management system then relates all used datasets and processes the underlying AHP equation (Equation (
1)) to compute the road priority rating of each road segment (
). The computed road ratings, the deduced construction costs per considered repair or reconstruct strategy, and the in-place budgetary constraints are then used to provide guidance to the roadway network managers on the maintenance actions to take.
6.2. Case Study, Analysis and Discussion
The proposed methodology was applied to the urban road network examined in Case Study 2, which spans approximately 600 km in total length and covers an area of about 30 sq. km, encompassing zones of varying land use and density, including residential, rural, office, and industrial areas.
Four ’repair or reconstruct’ strategies were considered, as listed below:
S1: Five equi-numbered road-segment clusters; no geo-location (and thus proximity of selected road segments) was considered in the analysis.
S2: Five equi-numbered road-segment clusters; geo-location (and thus proximity of selected road segments) was considered in the analysis.
S3: Five equi-numbered road-segment clusters; no geo-location considered; primary objective is to maximize the number of roads repaired and/or reconstructed subject to the available budget.
S4: Hybrid approach, five equi-numbered road-segment clusters; no geo-location considered; primary objective is to maximize the number of roads repaired and/or reconstructed subject to the available budget.
- -
Both ’repair or reconstruct’ options were considered in tandem, and the n worst road segments were marked for reconstruction while the rest identified for works were marked for repair.
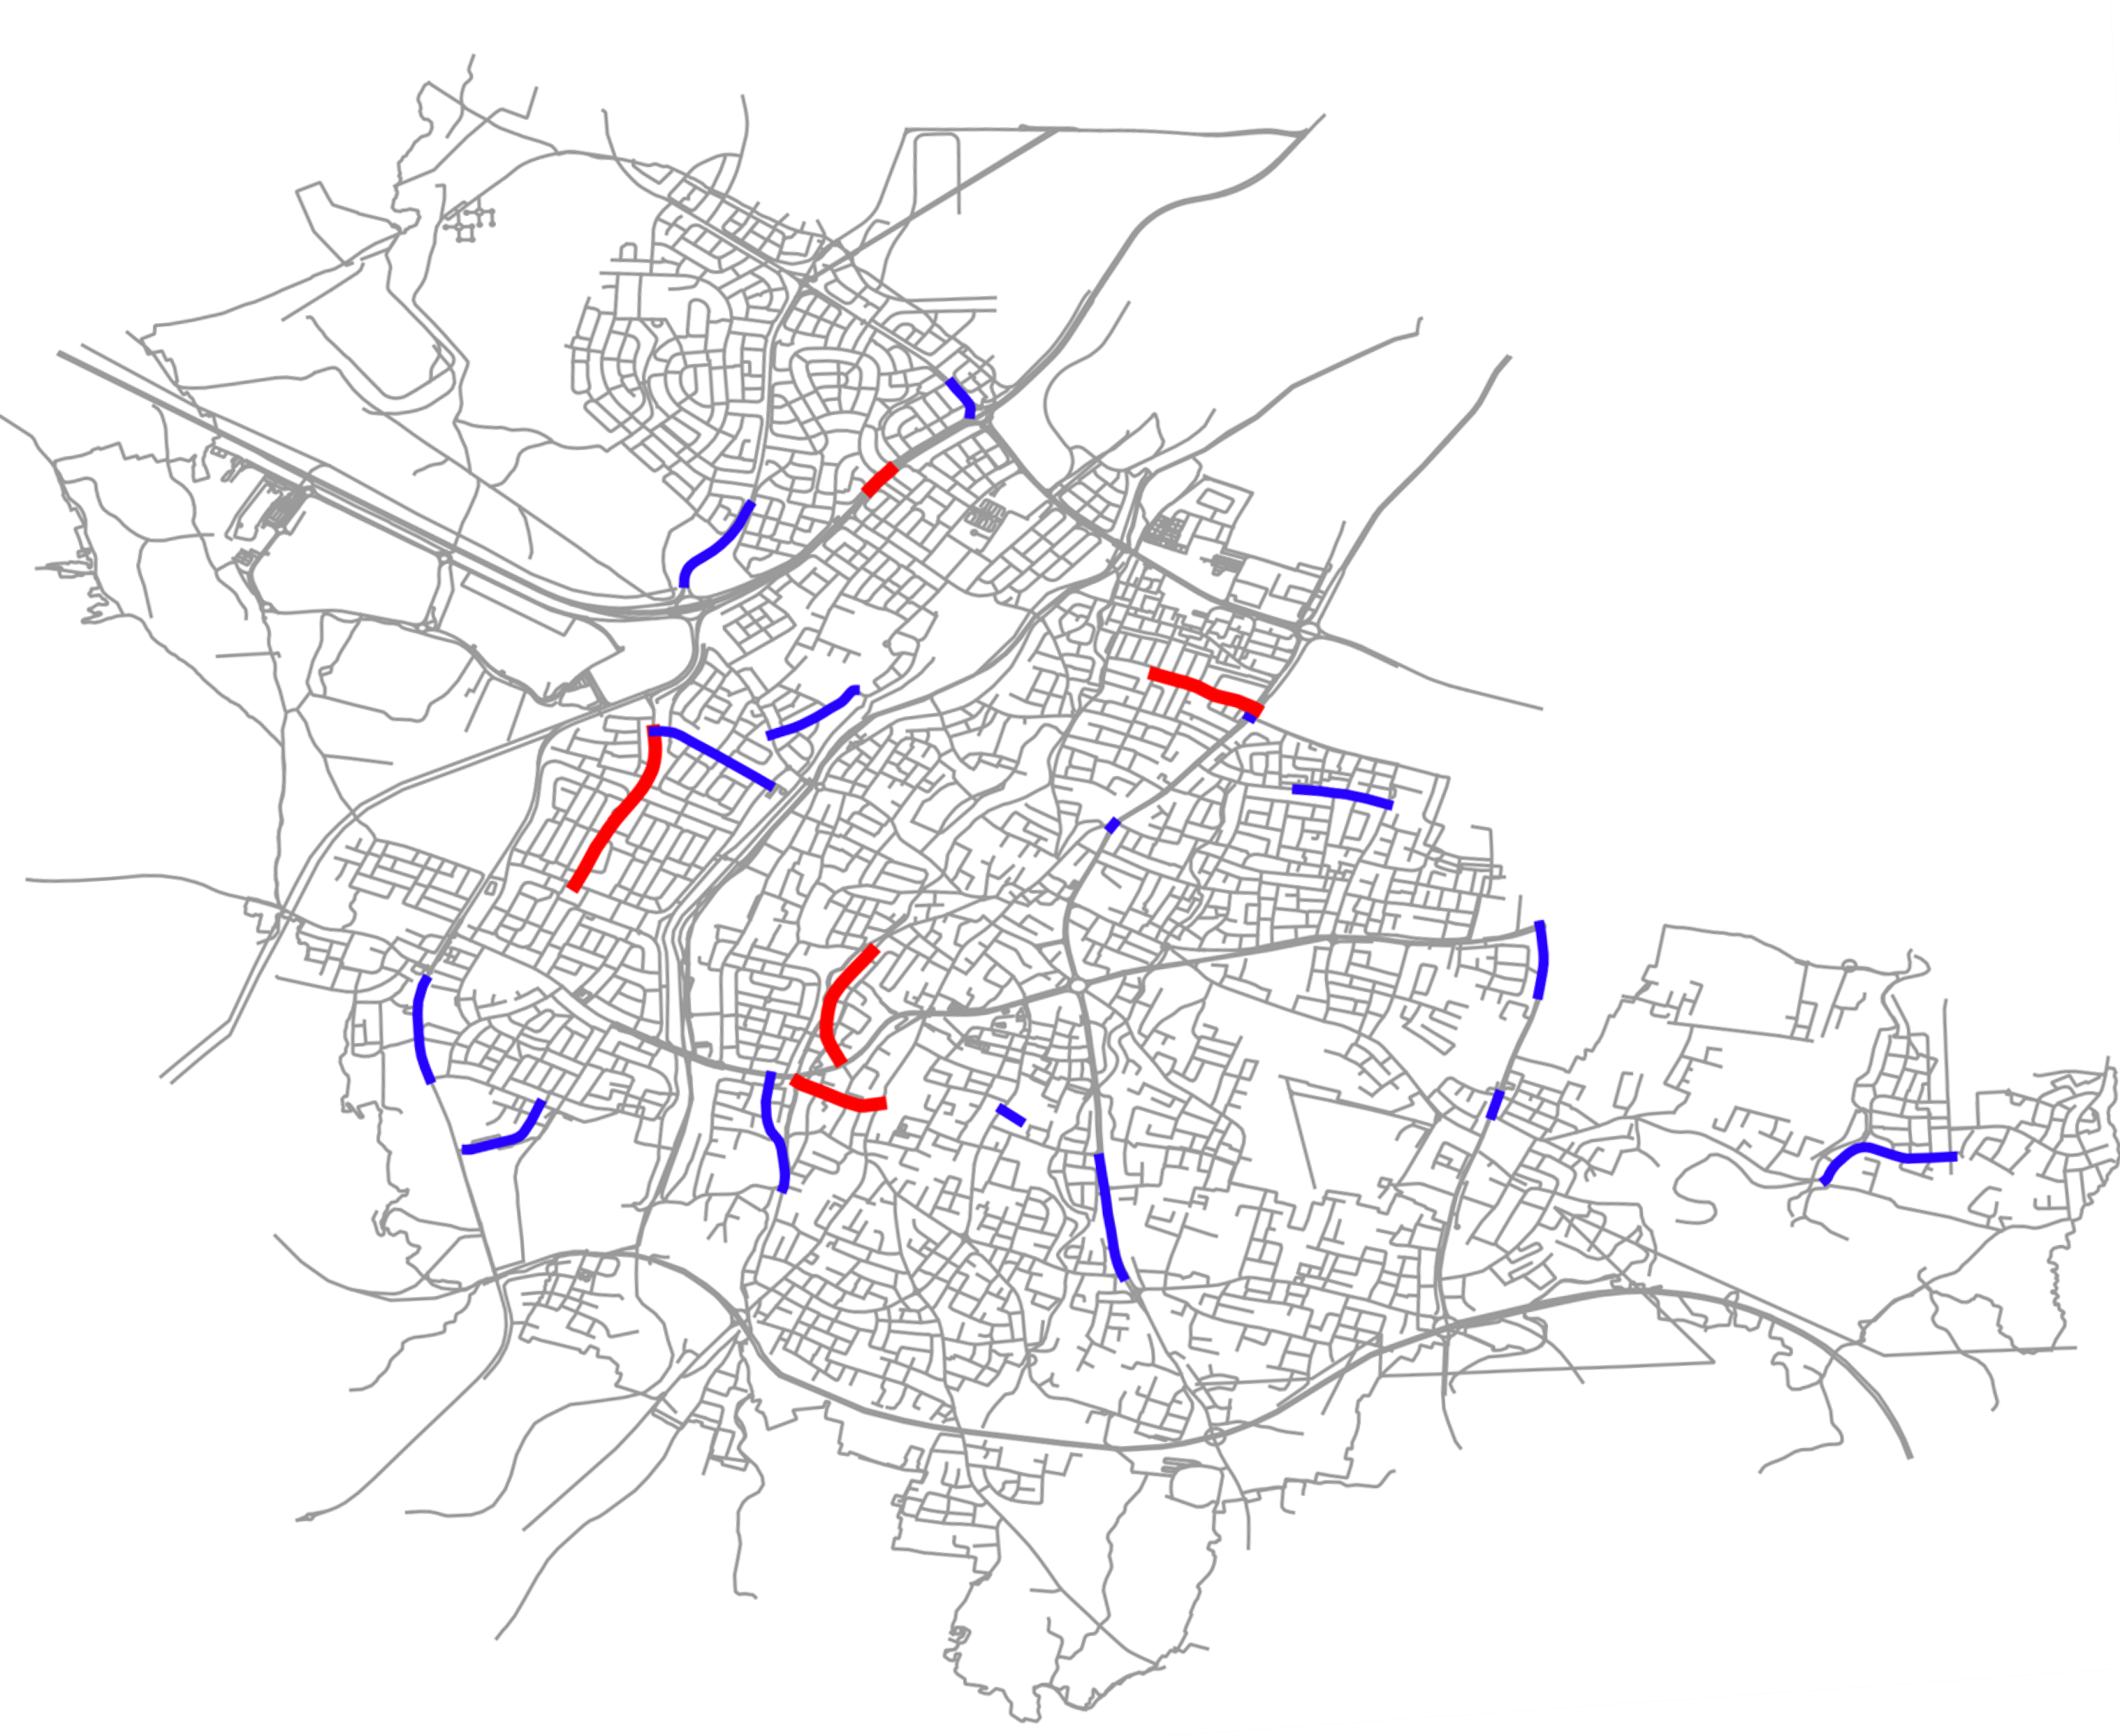
Snapshots of the analysis results and the resulting O&M map for strategy ’S4’ are shown in
Figure 15,
Figure 16 and
Figure 17. The AHP analysis arrives at the
RoadPriorityRatings for all segments in the studied road network and ranks the segments in descending priority order for construction works (
Figure 5). Should budget constraints be imposed (for example, EUR 10.0 m for reconstruction), then the analysis identifies the worst road segments (red segments in
Figure 17) and marks them for reconstruction (for a total cost of EUR 9,167,495). The remaining road segments are marked for repair (a total cost of EUR 18,789,435, for the roads listed in
Figure 16).
6.3. Assumptions and Limitations
The PMS implementation faced several methodological and data-related limitations that influenced the accuracy and reliability of its findings. The most notable of these limitations are (1) the reliance of the AHP method on ‘expert opinions’ and open-source (sometimes inaccurate) data for the calculation of the AHP weights matrix; (2) the use of smartphone-grade sensors for the condition assessment of roadway pavements; (3) the lack of accurate data on traffic counts and passenger car equivalents, for each road segment and traffic direction.
The obstacles, though, can be overcome by use of better historical records, richer datasets, and remote sensing. Further, the use of Markov Chains can improve the utilized methodology by allowing the proposed AHP and PMS processes forward calculations, forecasting the deterioration of roadway pavements without the need for repeated extensive sensing.
7. Discussion, Challenges and Future Directions
Despite the promising advancements in low-cost smartphone-based pavement assessment, several challenges remain, as discussed below.
Accuracy and reliability: While smartphone-based methods have shown potential, their accuracy can be influenced by factors such as sensor calibration, vehicle dynamics, driver behavior, and the built environment. For example, GPS-based geolocation is heavily influenced by the built environment’s density, and sensing is influenced by the probe vehicle’s suspension performance and the location of the smartphone used in sensing. The observed inaccuracy in the geo-positioning of point-level measurements can be improved, though, by use of the Global Navigation Satellite System (GNSS) instead of GPS positioning (PAVE-SCAN, 2024) [
26], and by use of improved multi-parameter machine-learning methods. Work is actually currently under way on both above-noted pathways as part of the herein-acknowledged ‘PAVE-SCAN’ project.
Data quality and consistency: Crowdsourced data can be subject to variability in data quality and consistency. Developing robust quality control mechanisms and guidelines for data collection is crucial.
Sensing technologies: As aforementioned, vibration-based sensing is limited by the need that probe-vehicles traverse over a pavement anomaly. A combination of vibration- and vision-based methods promises a higher accuracy in detecting such pavement anomalies, but employing vision-based methods requires heavier computation loads and, most often, edge-computing capabilities (thus, higher costs). Work is actually currently underway on both above-noted pathways as part of the herein-acknowledged ‘PAVE-SCAN’ project.
Standardization: Lack of standardized protocols for data collection, processing, and analysis can hinder data comparability and integration with existing pavement management systems (PMSs).
International Roughness Index (IRI): Work on relating the smartphone-sensed data and the deduced point-level and street-level condition assessment with the internationally recognized IRI is currently in progress and expected to be completed by mid-2025.
Pavement Management Systems (PMSs): As aforementioned, the employed smartphone-based pavement assessment method is geared for use in a pavement management system, alongside open-source data (such as a street network, network metrics, and points of interest in a city) and financial data from municipalities (such as the annual budgets and expenditures by roadwork type). The intent is to provide spatiotemporal analyses of roadway pavements at varying spatial and temporal resolutions and utilize such analyses for improving the operations and maintenance of roadway networks.
With regard to PMS, the body of related literature underscores the interdisciplinary nature of PMS, combining civil engineering, data science, and economics. Future research directions include enhancing predictive capabilities through AI, integrating real-time monitoring systems, including machine vision (to identify and classify roadway anomalies), and developing globally adaptable frameworks.
The proposed methodology and discussed case study demonstrate the power of low-cost technologies and legacy analytical methods to assess transport infrastructure and to prioritize related operations and maintenance actions in a cost-efficient manner.

