Article

Life-Cycle-Assessment-Based Quantification and Low-Carbon Optimization of Carbon Emissions in Expressway Construction

by
Zhen Liu
Institute of Space and Earth Information Science, Fok Ying Tung Remote Sensing Science Building, The Chinese University of Hong Kong, Hong Kong SAR, China
Infrastructures 2025, 10(11), 291; https://doi.org/10.3390/infrastructures10110291 (registering DOI)
Submission received: 10 October 2025 / Revised: 26 October 2025 / Accepted: 31 October 2025 / Published: 2 November 2025
(This article belongs to the Special Issue Sustainable Road Design and Traffic Management)

Abstract

To quantitatively assess the carbon emission characteristics of expressway construction and to identify its key influencing factors, this study establishes a comprehensive carbon emission accounting framework that covers the material production, transportation, and construction stages based on the life cycle assessment (LCA) approach. Typical expressway projects are selected as case studies to perform stage-based emission quantification and multivariable response analysis. The results indicate that the total carbon emissions per kilometer during the construction phase are approximately 1.80 × 10³ kg CO2-eq/km, with material production being the dominant contributor, accounting for about 60–70%, followed by transportation and construction activities. The analysis of structural layers shows that variations in the thickness of the asphalt surface and cement-stabilized base layers, which are the main sources of emissions, are strongly and positively correlated with total emissions, making them the principal control factors. Transportation distance and equipment efficiency are identified as moderately sensitive parameters, each contributing approximately 3–5% to emission variation. Further multivariable response analysis demonstrates nonlinear coupling effects between structural parameters and transportation factors. The combined increase in layer thickness and transport distance significantly amplifies total emissions, while the marginal impact of long-distance transport gradually decreases. Based on these findings, this study proposes a low-carbon construction strategy that focuses on structural optimization, local material sourcing, energy-efficient construction practices, and the use of clean energy. The outcomes of this research provide a theoretical foundation and quantitative reference for carbon emission prediction, structural design optimization, and green construction decision making during the expressway construction phase.

1. Introduction

Against the background of increasing pressure of global climate change [1], carbon emissions from transportation infrastructure [2], especially highway construction [3], have become one of the important considerations for a country’s emission reduction targets [4]. As a stage of high energy consumption and material consumption in infrastructure projects, the green transformation of road construction is not only related to carbon footprint control in the life cycle category but also affects energy consumption and environmental impact in the future operation period [5,6]. In recent years, with the proposal of “carbon neutrality” and “double carbon” goals [7,8], more and more studies have begun to pay attention to the greenhouse gas emission characteristics and optimization paths of road projects during the construction period and life cycle [9,10].
According to relevant research, carbon emission accounting methods in the transportation field can be mainly divided into three categories:
(1)
The first category is the quantitative method of carbon emission models based on the factor decomposition method [11,12]. By decomposing the contribution of different factors into carbon emissions, it analyzes the continuous impact of each link and provides a basis for phased emission reduction policies and structural optimization.
(2)
The second category is the emission accounting method based on the background of carbon trading [13,14], usually based on the emission factor guidelines issued by national or international climate specialized agencies. It is currently the most widely used and systematic carbon emission accounting method.
(3)
The third category is quantitative research on carbon emissions based on the life cycle assessment (LCA) method [15]. This method comprehensively evaluates the energy consumption and greenhouse gas emissions in the whole life cycle of products or projects from the systematic perspective of “cradle to grave” and can comprehensively reflect the carbon emission characteristics of road engineering in the whole process of material production, transportation, and construction [16]. Therefore, it has become the main technical route of carbon emission research in the field of road transportation.
In recent years, the LCA-based method has become the mainstream path of carbon emission research during road infrastructure and highway construction [17,18]. This is because LCA can systematically quantify the energy consumption and emission characteristics in the entire process from material acquisition [19], production, and transportation to construction, providing a scientific basis for full life cycle carbon footprint analysis and low-carbon design [20]. Compared with the single-stage accounting method, LCA can not only identify emission hot links but also support multischeme comparison and structural optimization and has become an important tool for green decision making in highway engineering.
Many scholars at home and abroad have carried out a lot of research on LCA of road infrastructure. At the macro level, Hoxha et al. pointed out, based on a systematic review of 94 road LCA studies, that emissions during road construction may account for 30–60% of the total emissions during the entire road life cycle [21]. However, existing studies still have obvious deficiencies in data transparency, structural parameter characterization, system boundary consistency, etc. Picardo et al. also emphasized in their comprehensive review of road LCA applications that most current research focuses on materials and construction stages [22], and insufficient attention has been paid to transportation infrastructure design parameters, database applicability, and method integration. At the level of road network scale and sustainable transportation systems, Picardo et al. also discussed the application status and challenges of LCA tools, databases, and software technologies in road engineering and pointed out that method standardization, digital support, and modular model construction need to be promoted in the future. At the level of engineering applications, research has also made a lot of progress. Azam et al. took the application of recycled materials in flexible pavement base as an example [23] and evaluated the carbon emission differences of different material alternatives based on actual measurement tests and LCA methods, providing empirical basis for base material optimization. Hasan et al. adopted recycled asphalt (RAP) and warm-mix asphalt (WMA) solutions for a highway section in Abu Dhabi [24] and compared the life cycle with traditional solutions, showing that WMA has significant emission reduction advantages in total carbon footprint. In addition, at the level of the LCA method, Aryan et al. conducted a critical review of 67 existing road LCA studies [25], pointing out that most studies are limited to the material production and construction stages and usually only consider the global warming potential. Most studies only focus on the global warming impact category, lacking a comprehensive analysis of other environmental impact categories (such as acidification, particulate matter, and eutrophication).
Overall, although existing studies have accumulated considerable achievements in the application of LCA to road infrastructure, several limitations remain. Most previous research has focused on a single phase, such as material production or construction, or on single-factor sensitivity analyses, while neglecting the integrated modeling and interaction effects among key variables such as structural parameters, transport distance, and construction efficiency. Moreover, nonlinear response analysis and response surface methods have rarely been applied to reveal the coupling mechanisms among multiple variables, resulting in an incomplete understanding of the complex characteristics of carbon emissions. In addition, current low-carbon optimization models for engineering design and construction decision making are still insufficient, leading to a gap between research outcomes and practical applications. Therefore, this study focuses on the construction phase of expressways and establishes a stage-based LCA carbon emission accounting framework. A multivariable response analysis method is further introduced to model and analyze the coupling relationships among asphalt layer thickness, base layer thickness, transport distance, and equipment efficiency. The proposed approach aims to address the limitations of conventional LCA in capturing variable interactions and in supporting coordinated optimization of structure, logistics, and construction processes, providing a scientific and quantitative basis for carbon emission control and sustainable highway design.

2. Methodology

Based on the theory of LCA, this study develops a carbon emission accounting method system in the expressway construction stage, defines the system boundary and functional units, establishes a carbon emission accounting model, and defines data sources and emission factor lists, which provides methodological support for subsequent empirical research and optimization analysis.

2.1. LCA Framework

In this study, the LCA method is used to systematically identify and quantify the carbon emissions during the highway construction phase. This study refers to international standards such as ISO 14040 and 14044 [26] and constructs a carbon emission accounting framework during expressway construction in line with China’s actual situation. According to the existing research, the whole life cycle of an expressway is usually divided into five stages: material production, construction, operation, maintenance, and dismantling and recycling. Since the construction period is usually the front-end stage with the highest emission intensity, and it is also the link in which the project can directly intervene and optimize, this article focuses on the material physicization and emission accounting during the construction phase and does not involve traffic emissions during the service period and later operation and maintenance. The LCA process of the expressway construction cycle is shown in Figure 1. Based on this, a carbon emission accounting model is established following the LCA framework, which is selected for its systematic capability to quantify emissions from multiple stages and processes. The model allows modular characterization of material, transportation, and equipment-related carbon sources, ensuring consistency with international standards (ISO 14040/14044 [26]) and improving the comparability and traceability of results. The resulting carbon emission intensity under a single functional unit provides a solid basis for subsequent carbon optimization strategies.

2.2. Function Unit and System Boundary Setting

Functional units are the core indicators in the LCA model used to unify the data caliber and ensure the comparability of results. In this study, “1 km two-way four-lane expressway (single structure)” is selected as the functional unit. Taking the semi-rigid base layer of a typical expressway in Jiangsu Province as an example (Figure 1), the pavement structure is 4 cm AC-13 upper layer, 6 cm AC-20 middle surface layer, and 8 cm AC-25 lower layer. The base layer is 36 cm cement-stabilized macadam and a 20 cm water-stabilized subbase layer, and the soil foundation thickness is 40 cm [27]. In the aspect of system boundary setting, this paper follows the principle of “from raw materials to completion delivery” [28] and divides the expressway construction period into three main phases: material production phase, material transportation phase, and road construction phase. Among them, the physical and chemical stage of materials includes the mining, processing, storage, and packaging of major building materials such as asphalt, cement, and aggregates. The transportation stage covers the whole process logistics of building materials from the factory or stock yard to the construction site [29]. The construction operation stage focuses on the on-site construction process, including mechanical operation, paving, rolling, heating, mixing, and other process emissions.
To simplify the model and focus on the main emission sources, the following contents are not considered in this study: (1) depreciation and indirect emissions of material production equipment; (2) domestic emissions such as personnel transportation, office work, food and accommodation; (3) on-site greening and construction emissions of nonstructural facilities. The system boundary diagram is shown in Table 1, which clearly shows the three-phase emission path and accounting input and output elements.

2.3. Development of Carbon Emission Accounting Model

Carbon emissions during expressway construction mainly come from three types of activities: first, energy consumption in the production process of building materials, second, fuel combustion emissions in the process of material transportation, and third, the operation and operation of various mechanical equipment at the construction site. To quantify these emission sources, this paper establishes a carbon emission accounting model based on process-based LCA. The process-based model quantifies carbon emissions by tracing each activity unit along the construction chain, including material production, transportation, and on-site construction processes. Each process module is parameterized with activity data (such as material quantities, transport distances, and energy consumption) and corresponding emission factors. This bottom-up approach enables detailed stage-by-stage assessment, improves transparency and comparability, and reflects the cumulative contribution of different construction processes to total emissions. During the material production phase, the calculation of carbon emissions follows the following Equation (1):
G 1 = i = 1 n M i · E F i
where G1 is the total carbon emission in the physical and chemical stage of the material (kgCO2-eq), Mi is the usage of the ith material (t), and EFi is the corresponding unit carbon emission factor (kgCO2-eq/t). This study refers to the Ministry of Ecology and Environment’s “General Principles for Carbon Footprint Accounting of Chinese Products” and the IPCC National Greenhouse Gas Inventory Preparation Guidelines [31] and selects the representative factors in Table 2.
In the transportation phase, the carbon emission model is given in Equation (2):
G 2 = j = 1 n M j · D j · E F t r a n s
where G2 is the total carbon emission in the transportation stage, Mj is the jth material consumption (t), Dj is its transportation distance (km), and EFtrans is the unit transportation carbon factor (kgCO2-eq/t·km). This study assumes that all transportation is completed by National V diesel heavy trucks, and the values of carbon emission factors involved are shown in Table 3. Refer to the data released by the Ministry of Ecology and Environment in 2022 [34,35]. The average transportation distance is about 40 km according to typical projects and 20 to 60 km in some areas.
During the road construction phase, the sources of carbon emissions mainly include direct emissions from fuel-fired construction machinery (such as pavers, road rollers, loaders, etc.) and energy consumption of asphalt mixing plants. The calculation model is given in Equation (3):
G 3 = k = 1 m F k · Q k · E F k
where Fk is the usage frequency or number of shifts of the kth mechanical equipment, Qk is its unit energy consumption (kg fuel or kWh electricity), and EFk is the carbon emission factor of the corresponding energy. The equipment energy consumption and carbon emission parameters during the construction stage are shown in Table 4. According to previous literature [36], the fuel consumption of each shift of a vibratory roller is about 65 to 75 kg, that of a paver is 120 to 150 kg, and that of a loader is 90 kg. The mixing station of the asphalt mixture is the link with the highest energy consumption and emission during the construction period, especially under hot mixing conditions, its unit mixing energy consumption can reach 4.5 MJ/kg of asphalt mixture, and the carbon emission accounts for more than 70% in the construction stage.
After calculating the carbon emissions of the above three stages separately, the total emission model in Equation (4) is developed.
G t o t a l = G 1 + G 2 + G 3
To improve the practicability and engineering visualization of the model, this paper introduces the concept of functional unit intensity (kgCO2-eq/km), that is, it normalizes the total emissions to each kilometer of road section that can be used for comparison between different projects, optimization algorithm integration, and carbon budget management.
To improve the reliability and adaptability of data, this paper constructs the data input form of the LCA model, covering fields such as material type, dosage, transportation distance, construction equipment model, number of shifts, fuel type, and consumption. Part of the data comes from the actual project bidding documents and completion data, and the rest refers to the national industry standards and engineering experience database. Table 5 shows the typical material consumption and mechanical energy consumption of a 1 km standard first-class highway, which is used as the basic sample for parameter setting of the LCA model. The LCA method system constructed in this paper has the characteristics of clear process, clear parameters, and reasonable emission path, which can be well applied to the quantitative analysis of carbon emissions during expressway construction in China. In the future, based on typical engineering projects, empirical calculations will be carried out on the above models to reveal the emission structure and main control factors and explore the green construction optimization path.

3. Results and Analysis

3.1. Carbon Emissions Accounting Results per Construction Phase

To more systematically identify the carbon emission contribution of each link of expressway construction, based on the aforementioned LCA model and structural stratification data, this study decomposes the carbon emissions during the construction period into six typical structural layers according to the standard pavement structure of a 1 km two-way four-lane expressway: AC-13 upper layer, AC-20 middle layer, AC-25 lower layer, cement-stabilized base layer, water-stabilized base layer, and soil base layer. The accounting results are shown in Table 6. Gtotal of the entire 1 km expressway construction phase is approximately 1797.6 kg CO2-eq/km. Among them, the three structural layers with the largest contribution to carbon emissions are cement-stabilized base layer (547.55 kg CO2-eq/km), AC-25 lower layer (394.7 kgCO2-eq/km), and subbase layer (284.98 kg CO2-eq/km), accounting for about 66.2% of the total emissions and being the main source of emissions.
In the material production stage (G1), the main emission sources are associated with the manufacturing of cement, asphalt binder, and aggregates. Among these, cement production for the cement-stabilized base layer is the dominant contributor, primarily due to the calcination of limestone and fossil-fuel combustion during clinker formation. Asphalt production also generates considerable emissions through bitumen heating and aggregate drying, while aggregate crushing and screening contribute only marginally. In the transportation stage (G2), diesel combustion from heavy-duty trucks is the major source of emissions, whereas in the construction stage (G3), fuel consumption from asphalt mixing, paving, and compaction equipment represents the largest share. This multisource composition aligns with previous LCA studies on highway projects [3,21], where material manufacturing typically accounts for 60–70% of total construction emissions, followed by transportation and on-site construction activities.
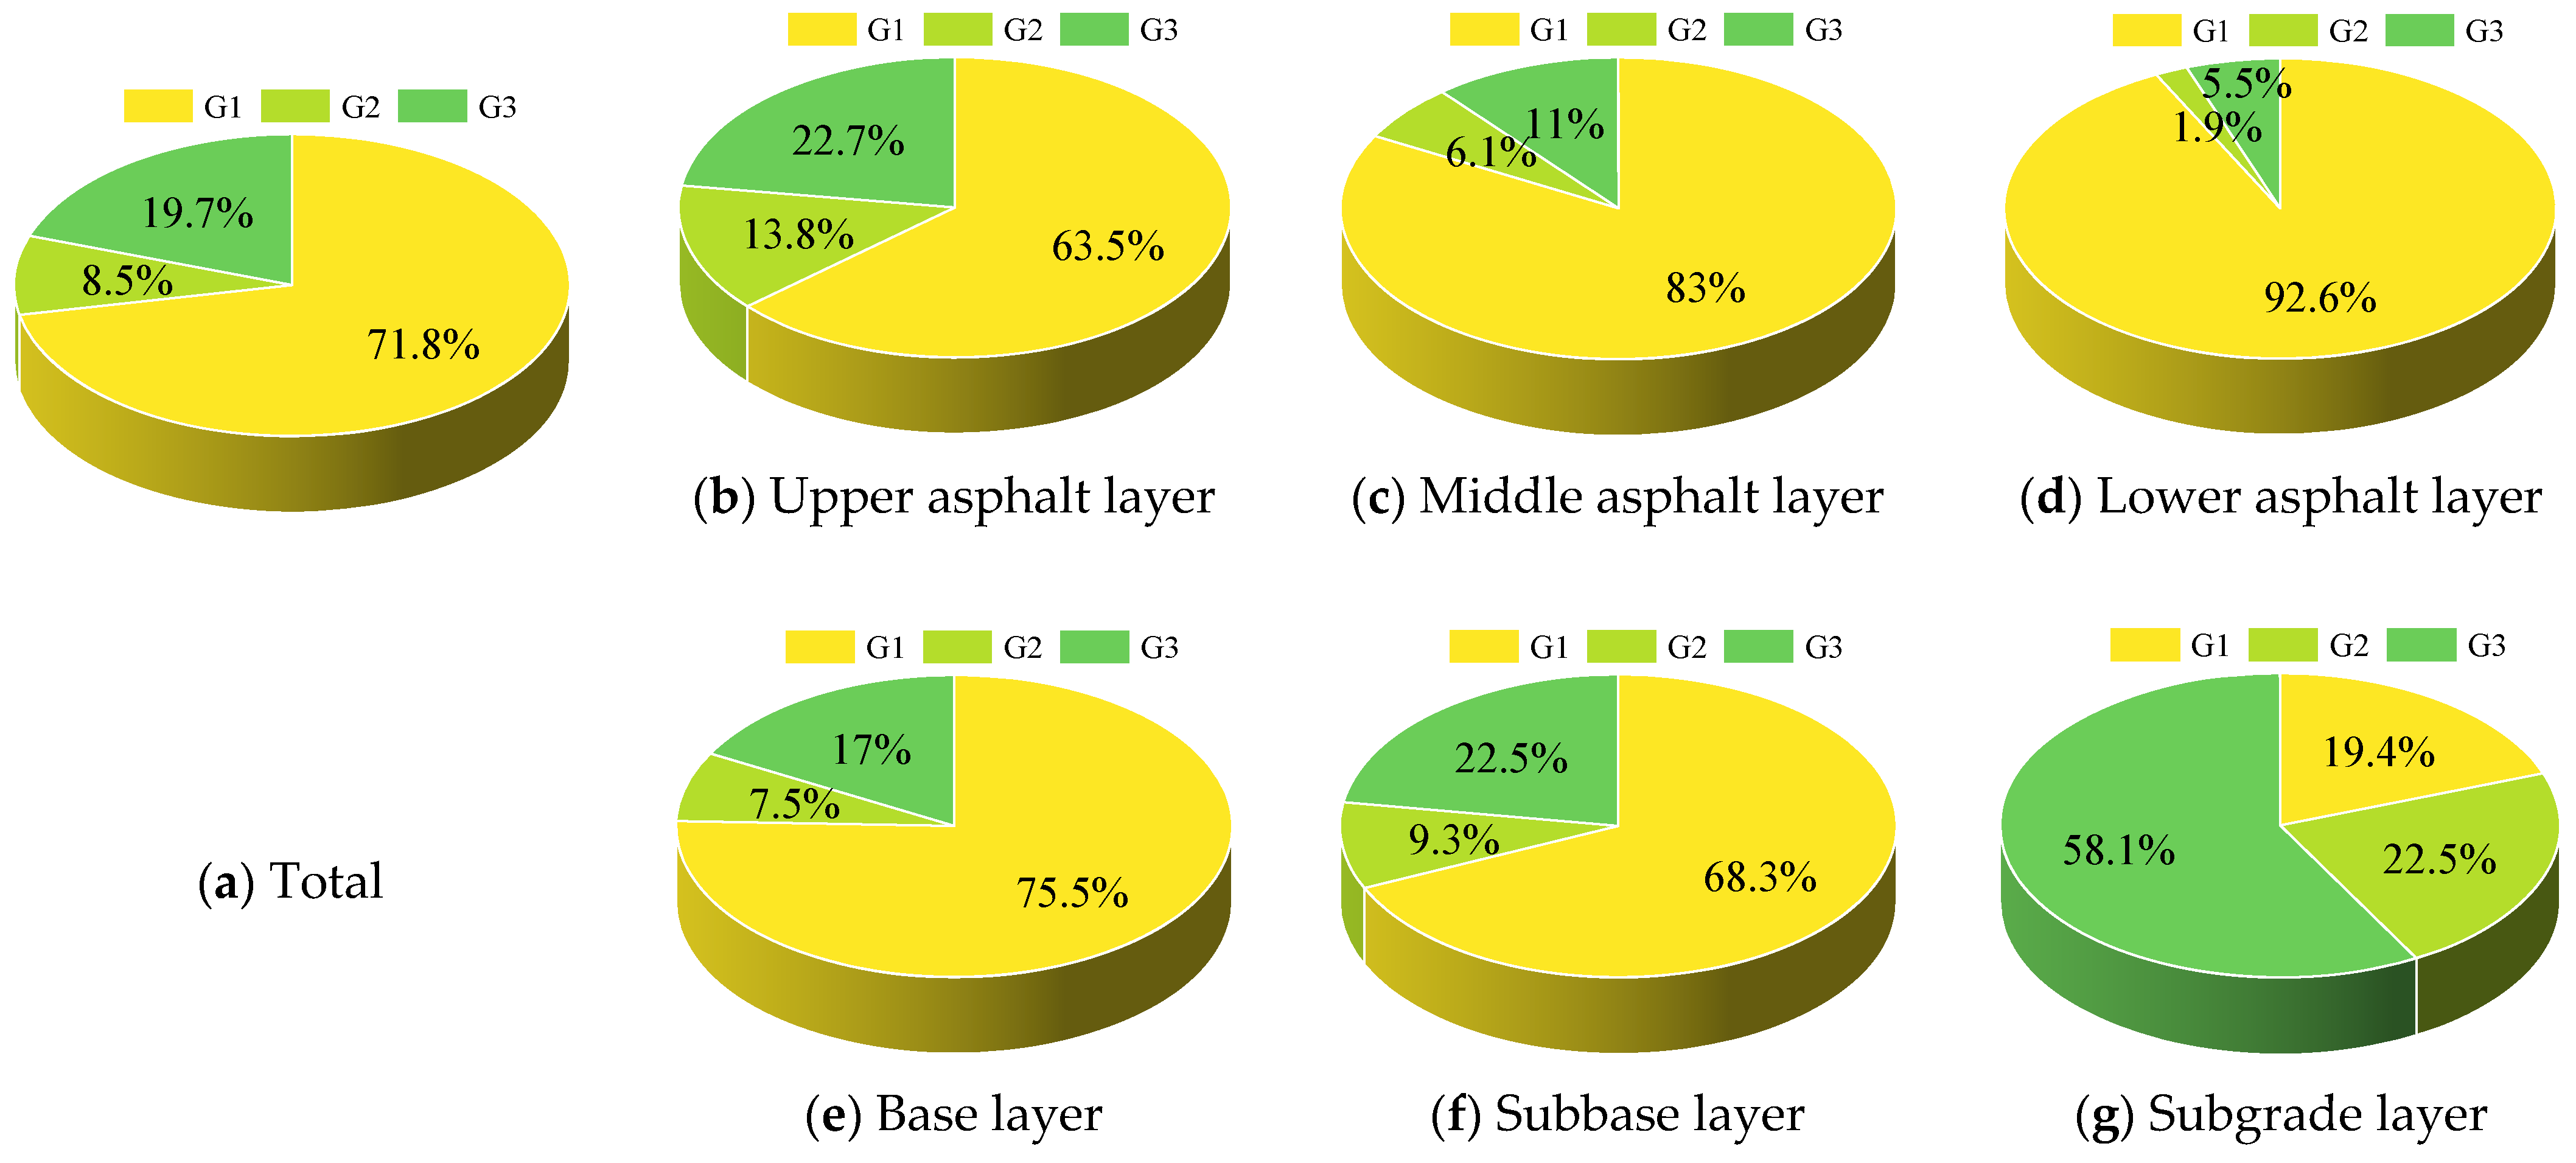
The emission composition of different structural layers in the three stages is also significantly different, and the relevant results are shown in Figure 2. Figure 2a shows the carbon emission structure of the whole road section during the construction stage, in which the material production (G1) stage is still the main emission source, accounting for 71.8%, and the transportation stage (G2) and construction stage (G3) account for 8.5% and 19.7%, respectively. This result is consistent with previous research findings. For instance, Yu et al. [33] reported that the construction phase accounted for the majority of greenhouse gas emissions in road construction projects, particularly those related to material production and on-site energy consumption. The proportion observed in this study closely aligns with their results, confirming that the carbon emission characteristics are dominated by the physical and chemical processes of materials during the construction period.
Specifically, the material production (G1) of the upper layer of AC-13 accounted for only 63.5% of the total emissions, while transportation and construction accounted for a higher proportion, 13.8% and 22.7%, respectively (Figure 2b). In contrast, due to the use of modified asphalt materials in AC-20 and AC-25 layers, G1 accounts for 83% and 92.6% (Figure 2c,d), indicating that almost all their carbon emissions come from the highly energy-consuming manufacturing of the materials themselves, and the construction and transportation stages account for a relatively small proportion. In particular, the modification of asphalt mixtures using SBS or rubber powder significantly increases embodied emissions compared with conventional binders, as observed in previous studies such as Luo et al. [3] and Ozcan-Deniz et al. [9]. The cement-stabilized base layer is relatively balanced between the material production and construction stages, with G1 being 75.5% and G3 being 17%, and the transportation is still controlled within 7.5% (Figure 2e), but considering its large total material amount and deep thickness, it is the structural layer that has the largest total emission. The carbon emission compositions of the subbase layer and soil base layer showed different trends. The proportion of G1 in the water-stabilized subbase layer decreased to 68.3%, while G3 increased to 22.5% (Figure 2f). However, the soil base layer hardly involves the production of complex materials, and its carbon emissions are concentrated in the field operation stage, with G3 accounting for 58.1% and material production accounting for only 19.4% (Figure 2g), reflecting the “low G1 and high G1” characteristics of carbon emissions from natural earthwork treatment operations.
Overall, the emission distribution among phases observed here is consistent with published LCAs of highway construction [3,21], which reported that 60–70% of total carbon emissions are attributed to material production, while transportation and construction account for approximately 10% and 20%, respectively. This agreement reinforces the representativeness of the present model and validates its applicability to similar infrastructure contexts. The main emission control factors can be summarized as follows:
  • Asphalt materials dominate surface carbon emissions, and the focus of optimization is on material technology.
  • Cement base and subbase have dual emission pressures of G1 and G3, which is a structural difficulty in emission reduction.
  • The energy consumption of soil construction is high, so attention should be paid to the energy efficiency of construction machinery and compaction technology.

3.2. Identification of Key Influencing Factors on Carbon Emissions

To identify the main driving factors of carbon emissions during expressway construction, this study, within the defined system boundary covering material production, transportation, and on-site construction stages, uses the constructed LCA model to quantify emission variations. The functional unit is defined as 1 km of a two-way, four-lane expressway, and the model considers the cradle-to-gate process during the construction phase. Based on this model, the one-at-a-time method is applied to analyze the disturbance of representative influencing factors, evaluate their impact on total carbon emissions, and identify the main controlling factors. The influencing factors include material transportation distance, thickness of asphalt layer, thickness of water-stabilized base layer, energy efficiency of construction equipment, and change of power carbon factor. The analysis results are listed as follows in tabular form.

3.2.1. Impact of Transport Distance

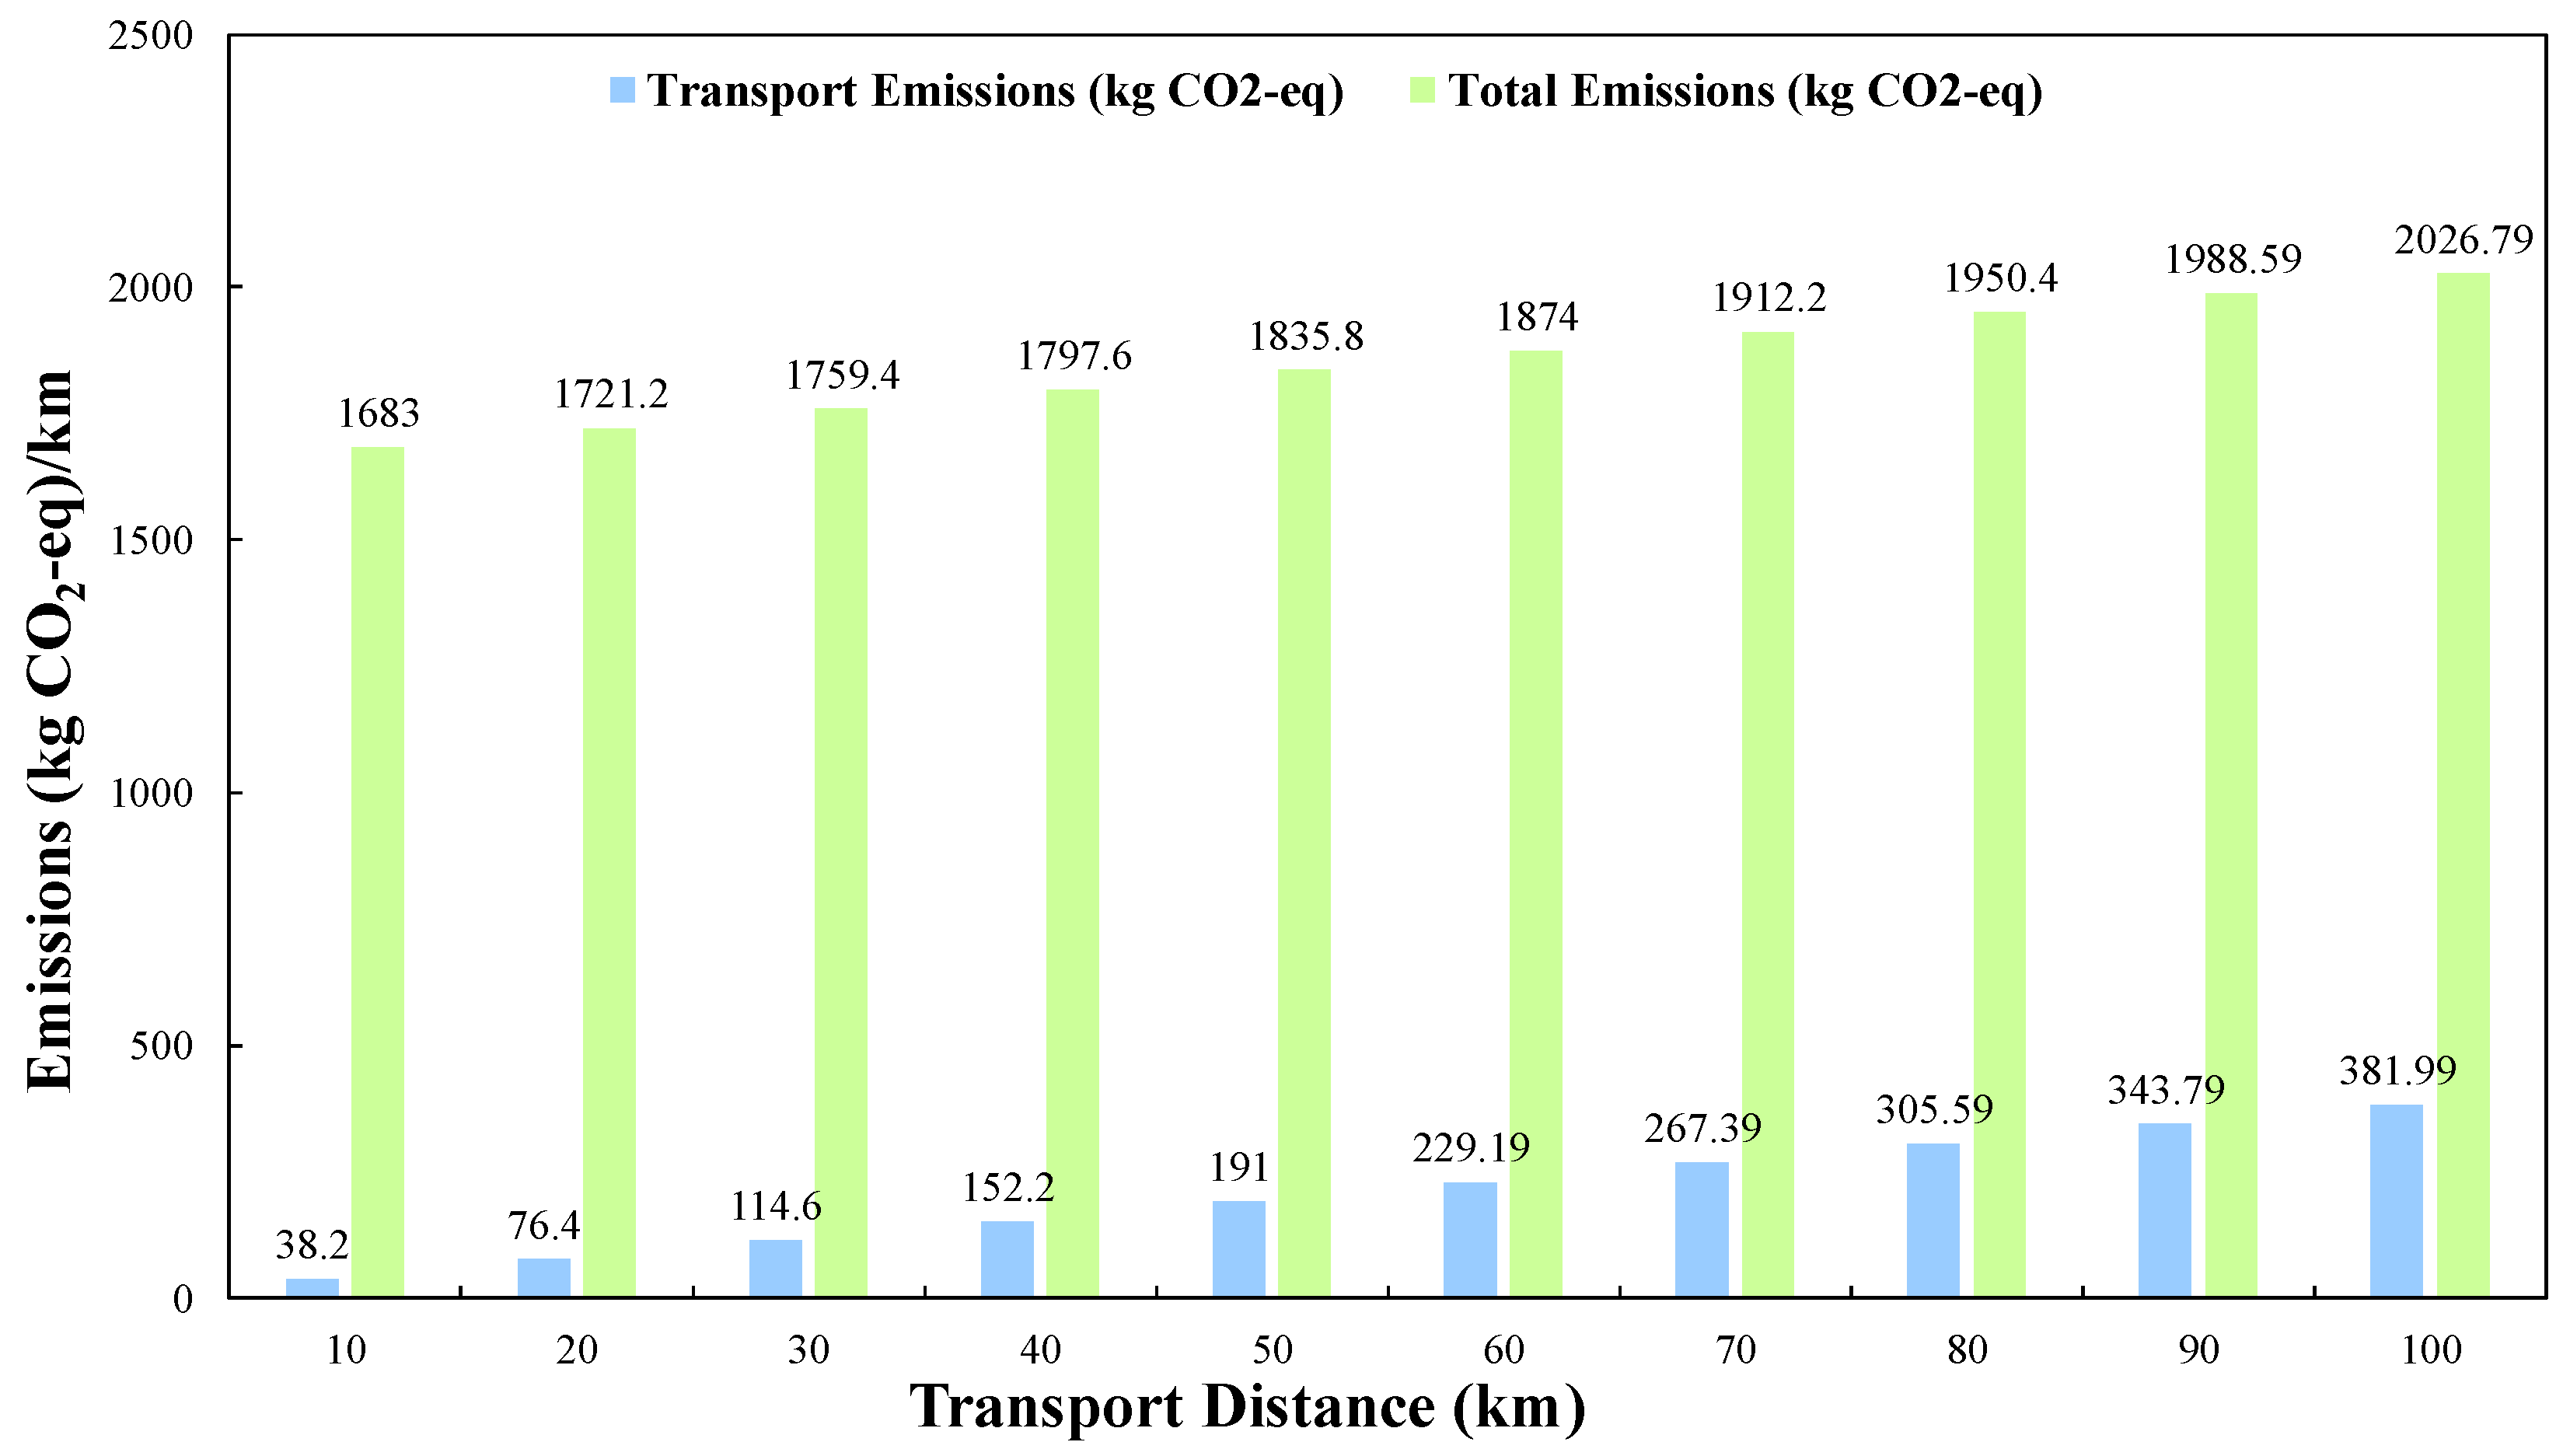
Material transportation distance is one of the important factors affecting carbon emissions during expressway construction. Especially in the case of centralized distribution and long-distance procurement of bulk materials, the indirect carbon emissions in transportation links will increase significantly. In order to explore the sensitivity of the change of transportation distance to the carbon emission per unit kilometer (1 km) during the construction period, this paper takes the 40 km set in the previous article as the baseline scenario and, on this basis, sets different transportation distances (10–100 km, step length is 10 km), keeps other parameters unchanged, and calculates the corresponding change of total carbon emission. The results are shown in Figure 3.
When the transportation distance gradually increases from 10 km to 100 km, the total carbon emissions gradually increase from 1683.00 to 2026.79 kg CO2-eq/km, with an overall increase of approximately 20.4%. Among them, the emissions in the transportation stage show a linear growth trend, which basically conforms to the estimation model that the transportation carbon factor is proportional to the distance. In particular, every additional 10 km of transportation distance will lead to an increase of approximately 38–39 kg CO2-eq/km in total carbon emissions per unit kilometer, equivalent to an increase of 0.8% to 2.3%, reflecting the nonnegligible impact of material transportation routes on the overall carbon footprint. This result shows that if the material transportation organization can be optimized through the following measures, carbon emissions during the G2 stage and even the overall construction period will be effectively reduced:
  • Optimize the layout of stock yards and give priority to localized raw materials.
  • Set up an on-site temporary mixing station to reduce transportation frequency.
  • Transport vehicles using low-carbon fuels or new energy sources.
Comprehensive analysis shows that the material transportation distance is a moderately sensitive variable. Although it does not play a dominant role in emission contribution, it has high adjustability and implementation in practice, and it is an engineering organization optimization direction with good carbon reduction potential.

3.2.2. Impact of Structural Layer Thickness

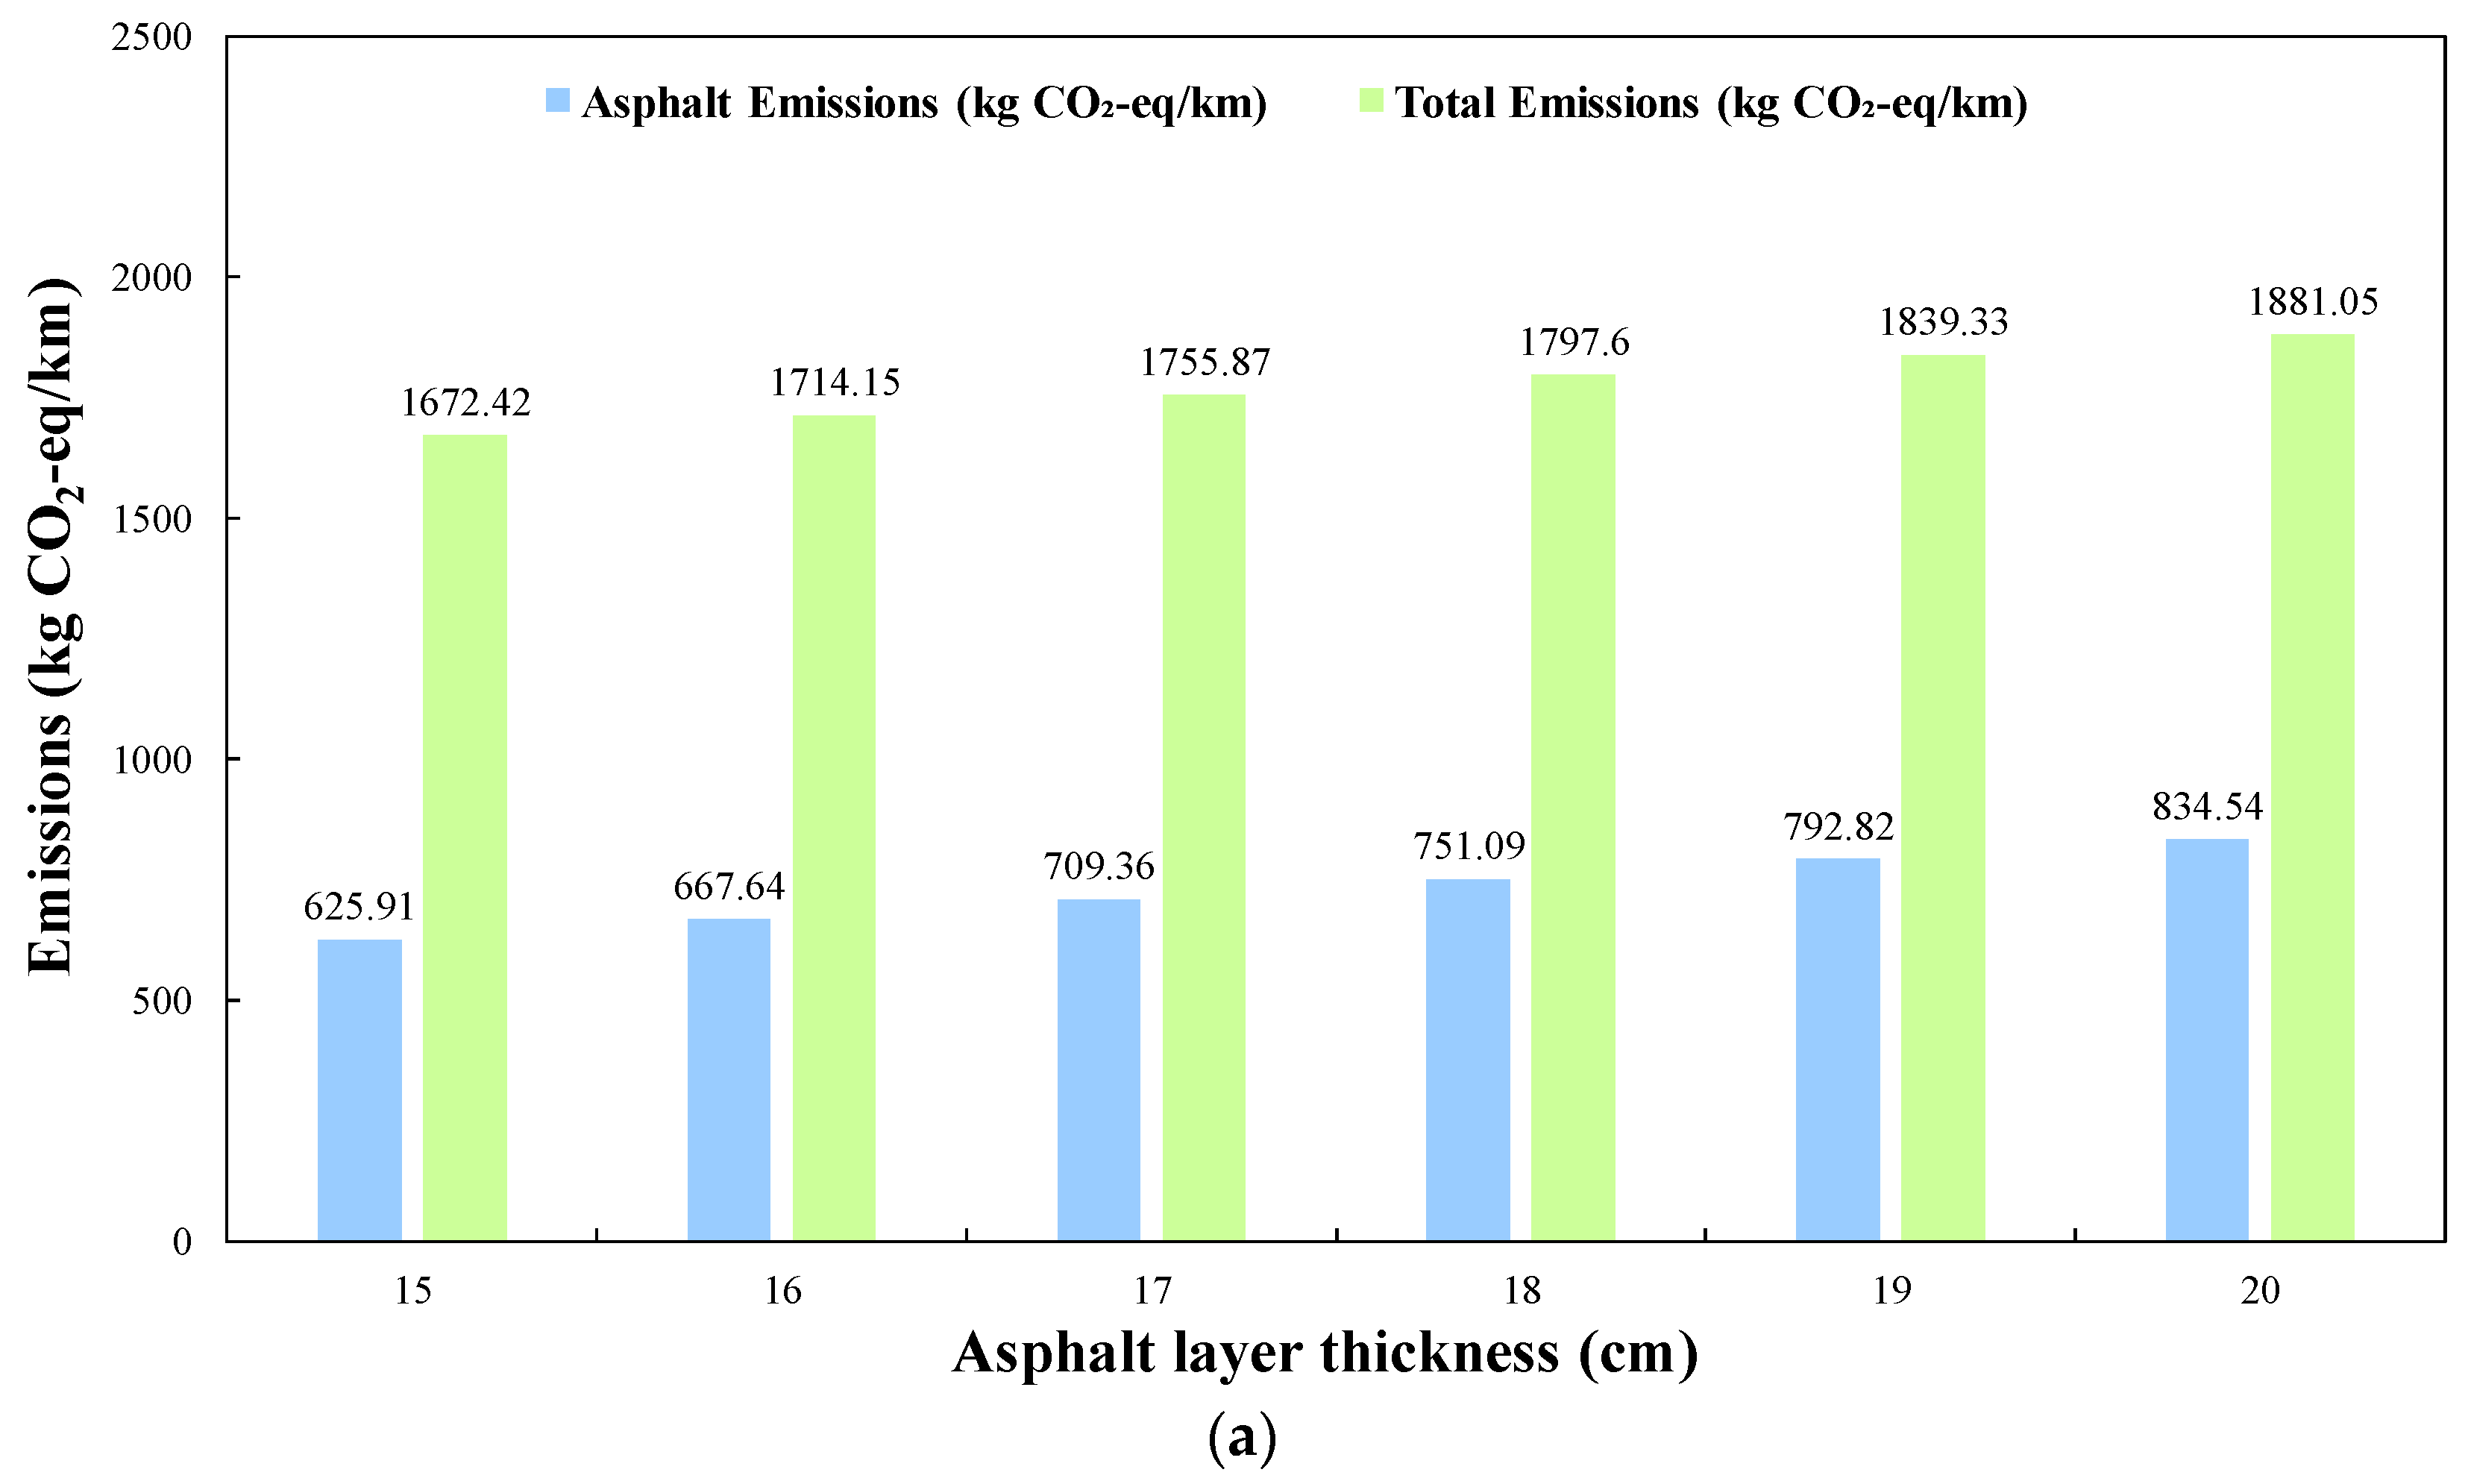
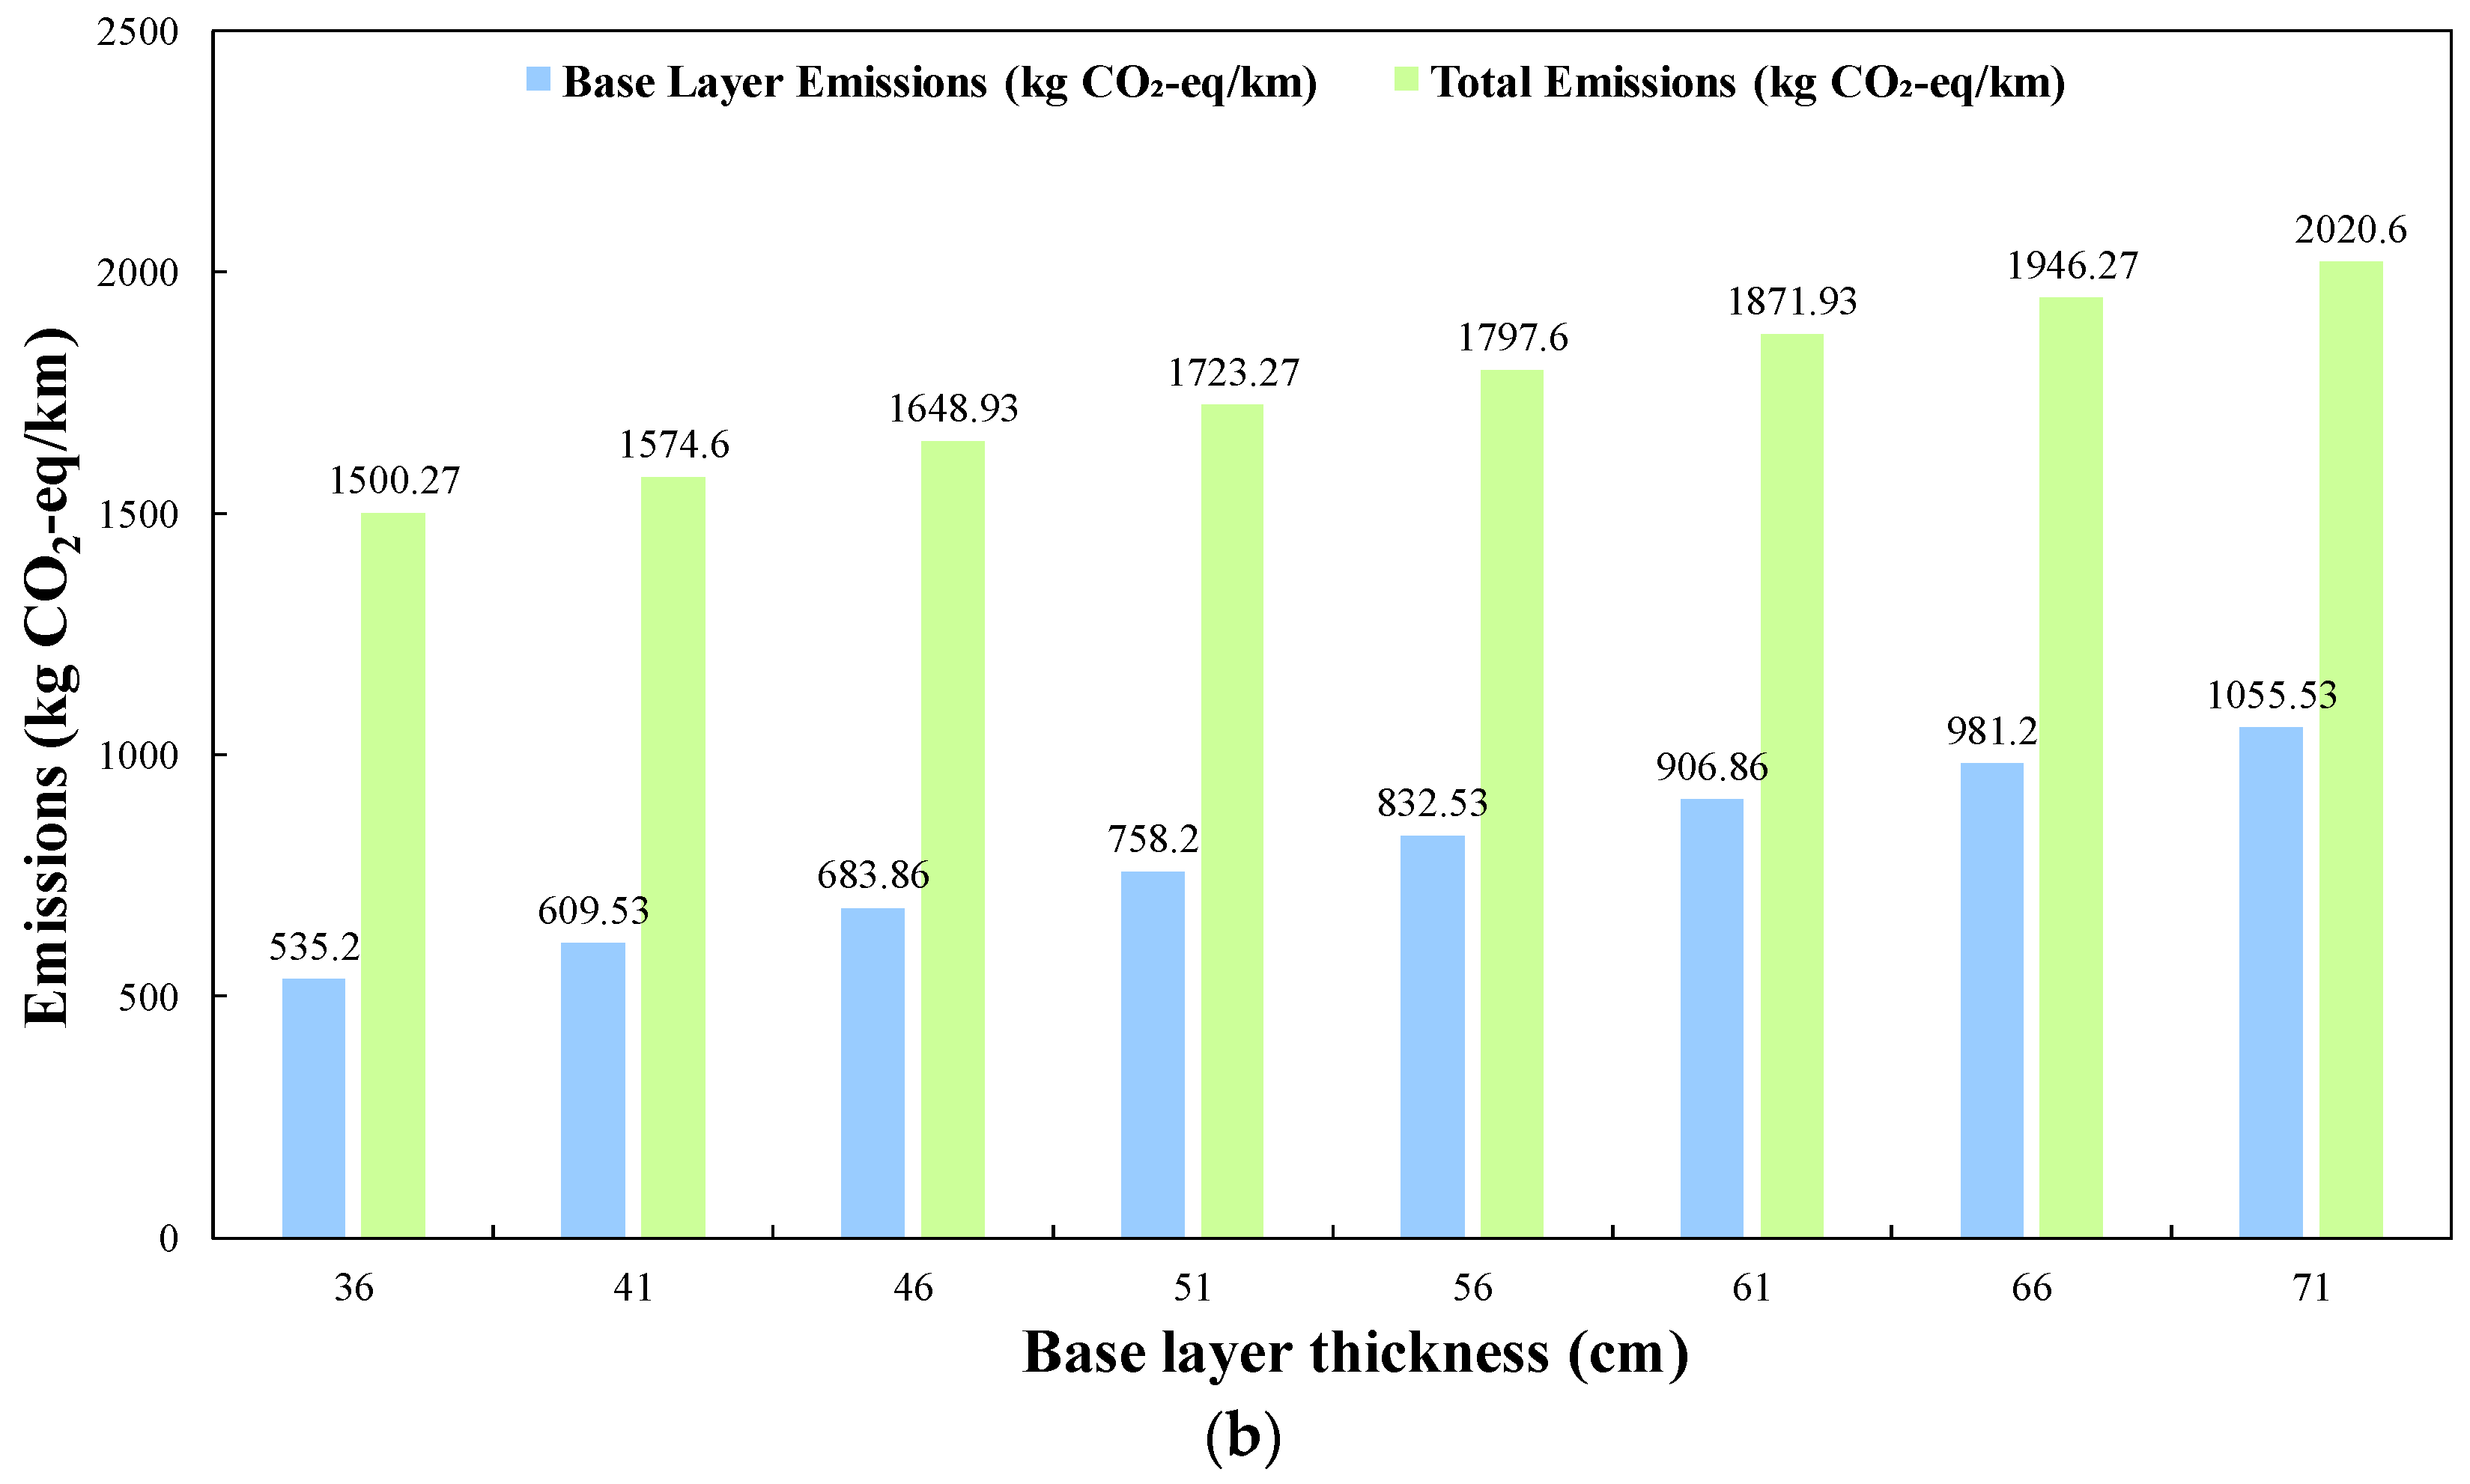
This section mainly focuses on two key parameters: asphalt layer thickness and base layer thickness. By calculating the total carbon emissions under different expressway surface and base thicknesses, the results are shown in Figure 4.
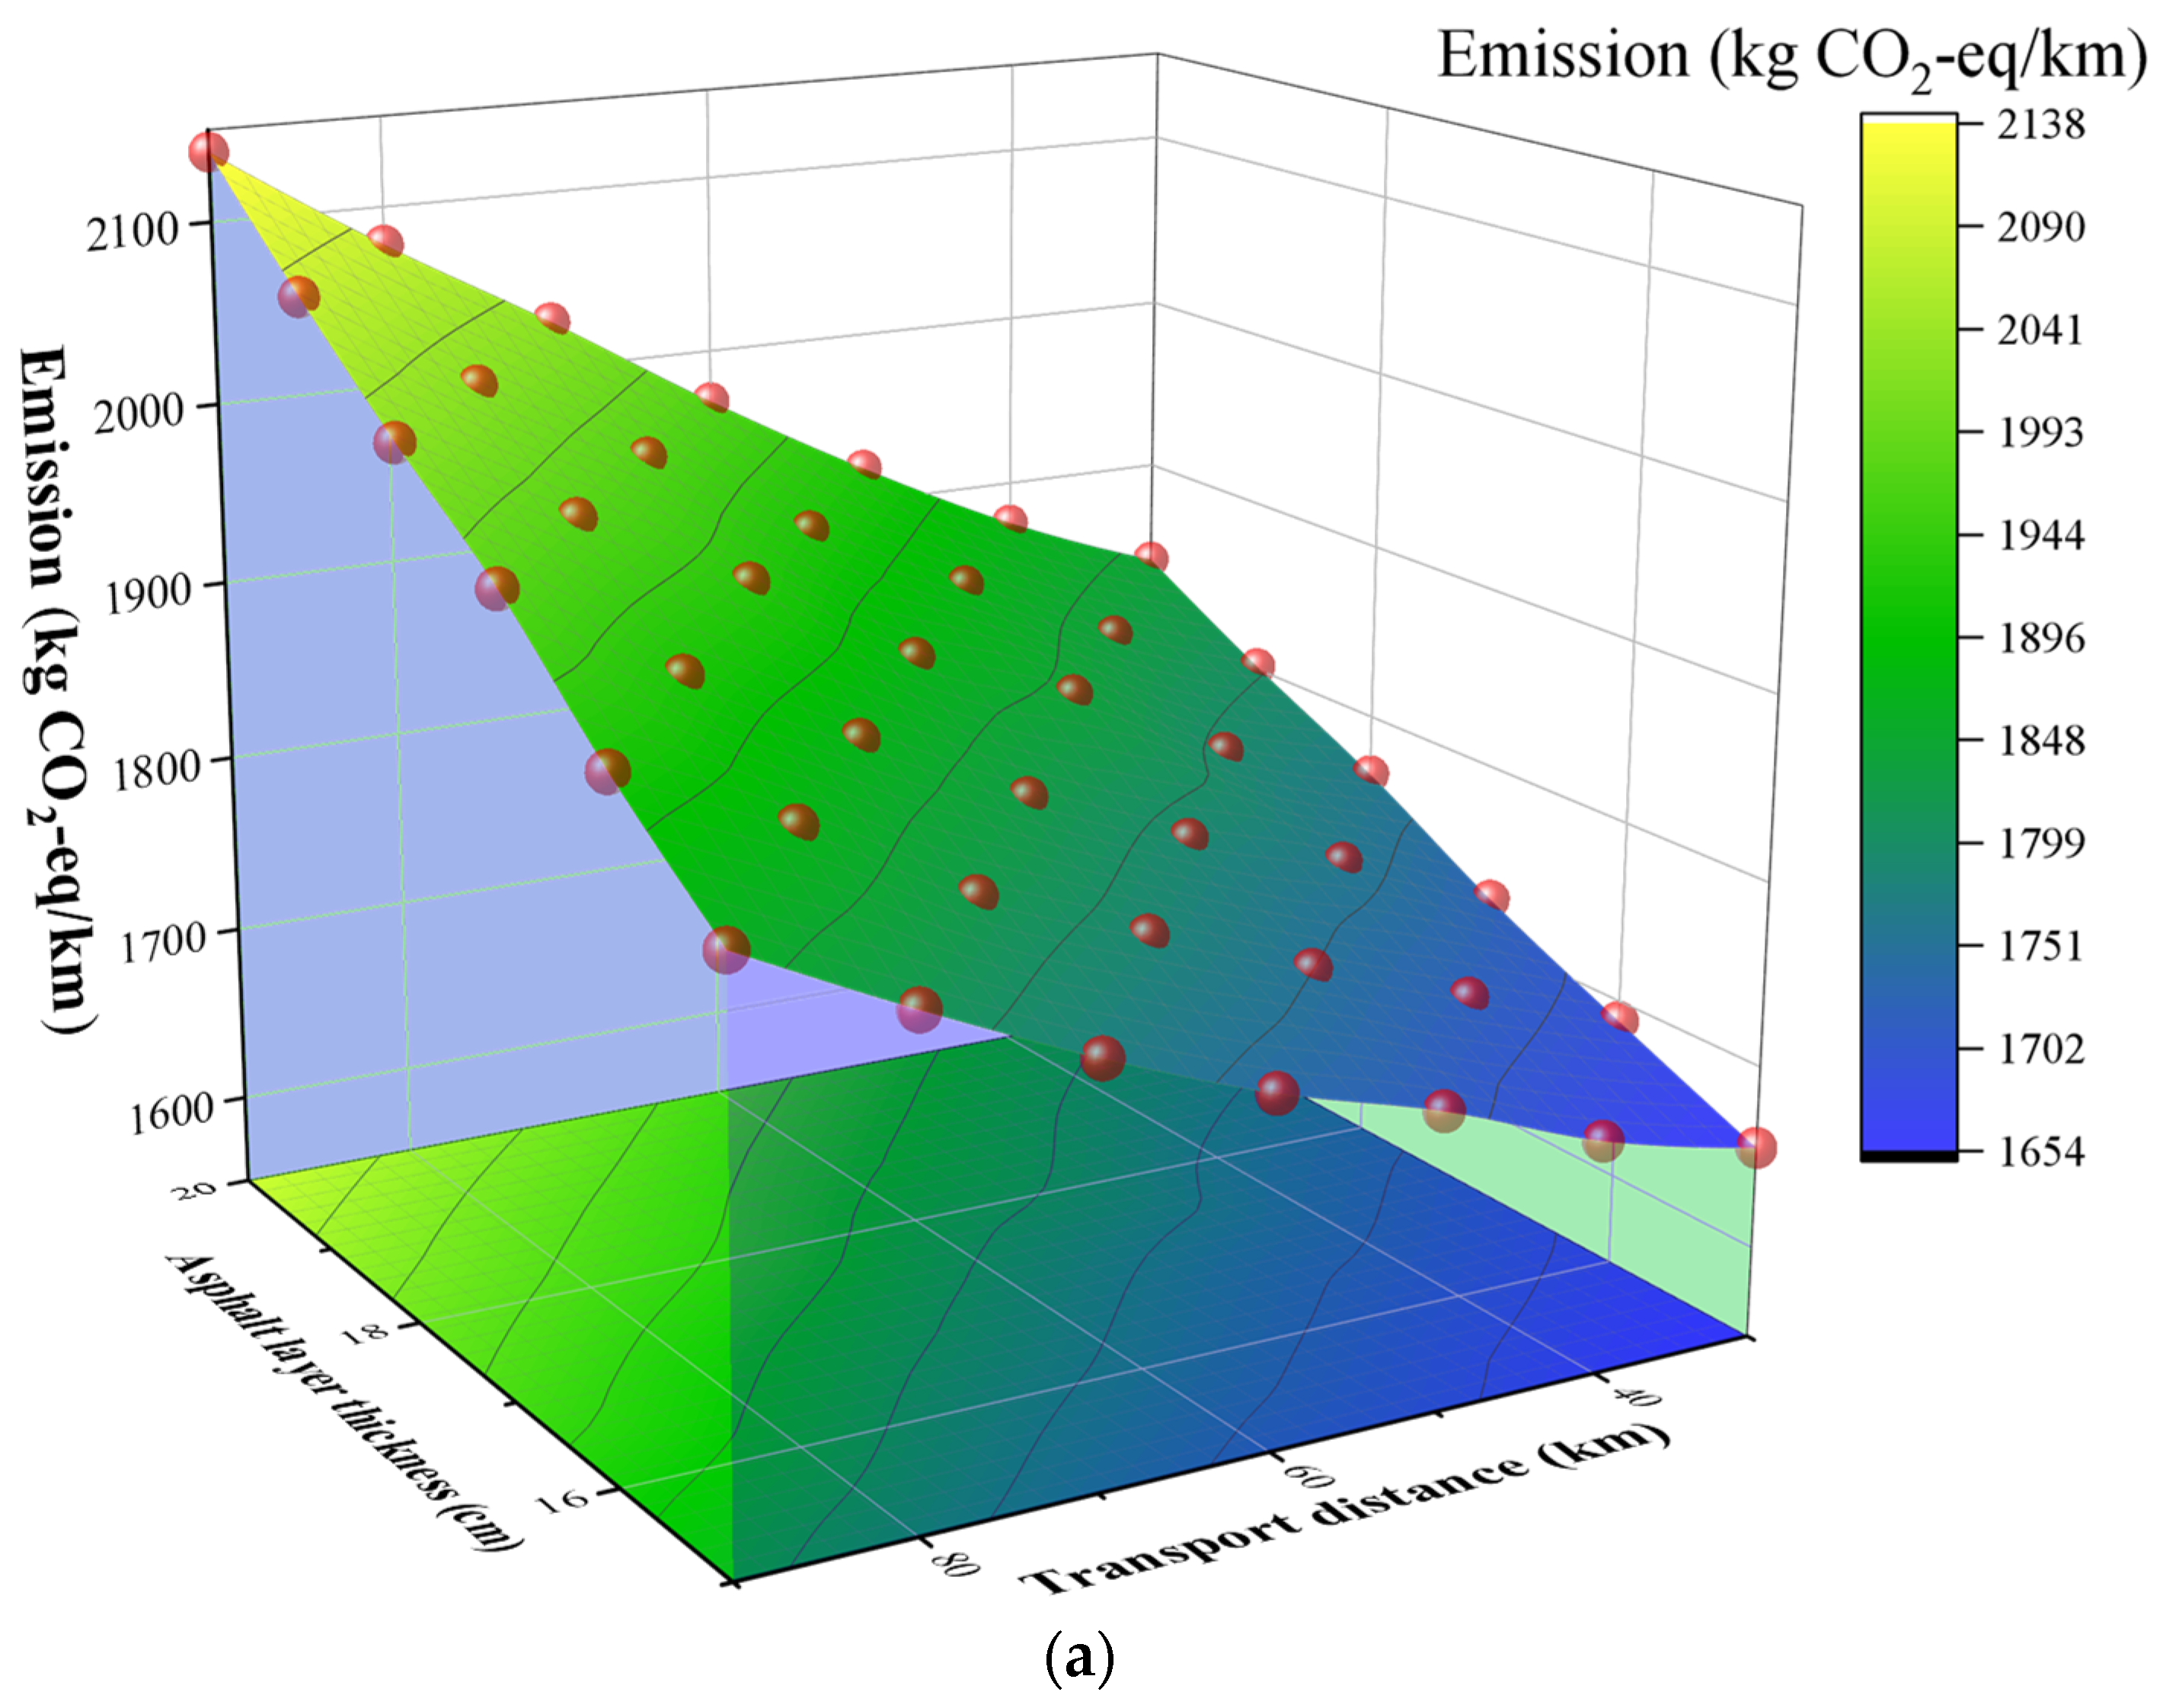
Figure 4a shows the impact of adjusting the total thickness of asphalt structures (including the three layers of AC-13, AC-20, and AC-25) from 15 cm to 20 cm at an interval of 1 cm on carbon emissions on the premise of keeping other structural and construction parameters unchanged. In this analysis, the variation in total asphalt structure thickness is primarily attributed to the AC-25 lower layer, while the thicknesses of AC-13 (4 cm) and AC-20 (6 cm) remain fixed, following typical design standards. The results show that, as the thickness increases from 15 cm to 20 cm, the total carbon emissions per unit kilometer increase from 1672.42 kg CO2-eq/km to 1881.05 kg CO2-eq/km, with a cumulative increase of 12.5%. The emissions of the asphalt structure itself increased from 625.91 kg CO2-eq/km to 834.54 kg CO2-eq/km, corresponding to an increase of more than 200 kg CO2-eq/km. This change fully demonstrates that, as a high-carbon material, the amount of asphalt used is highly positively correlated with carbon emissions and, especially, modified asphalt (such as SBS) has a higher carbon emission factor. Therefore, the asphalt layer thickness belongs to the typical high-sensitivity variables. Optimization strategies can include thinning structural design (such as reasonable configuration of layering thickness), improving material properties (such as using warm-mix asphalt), and promoting recycling technology.
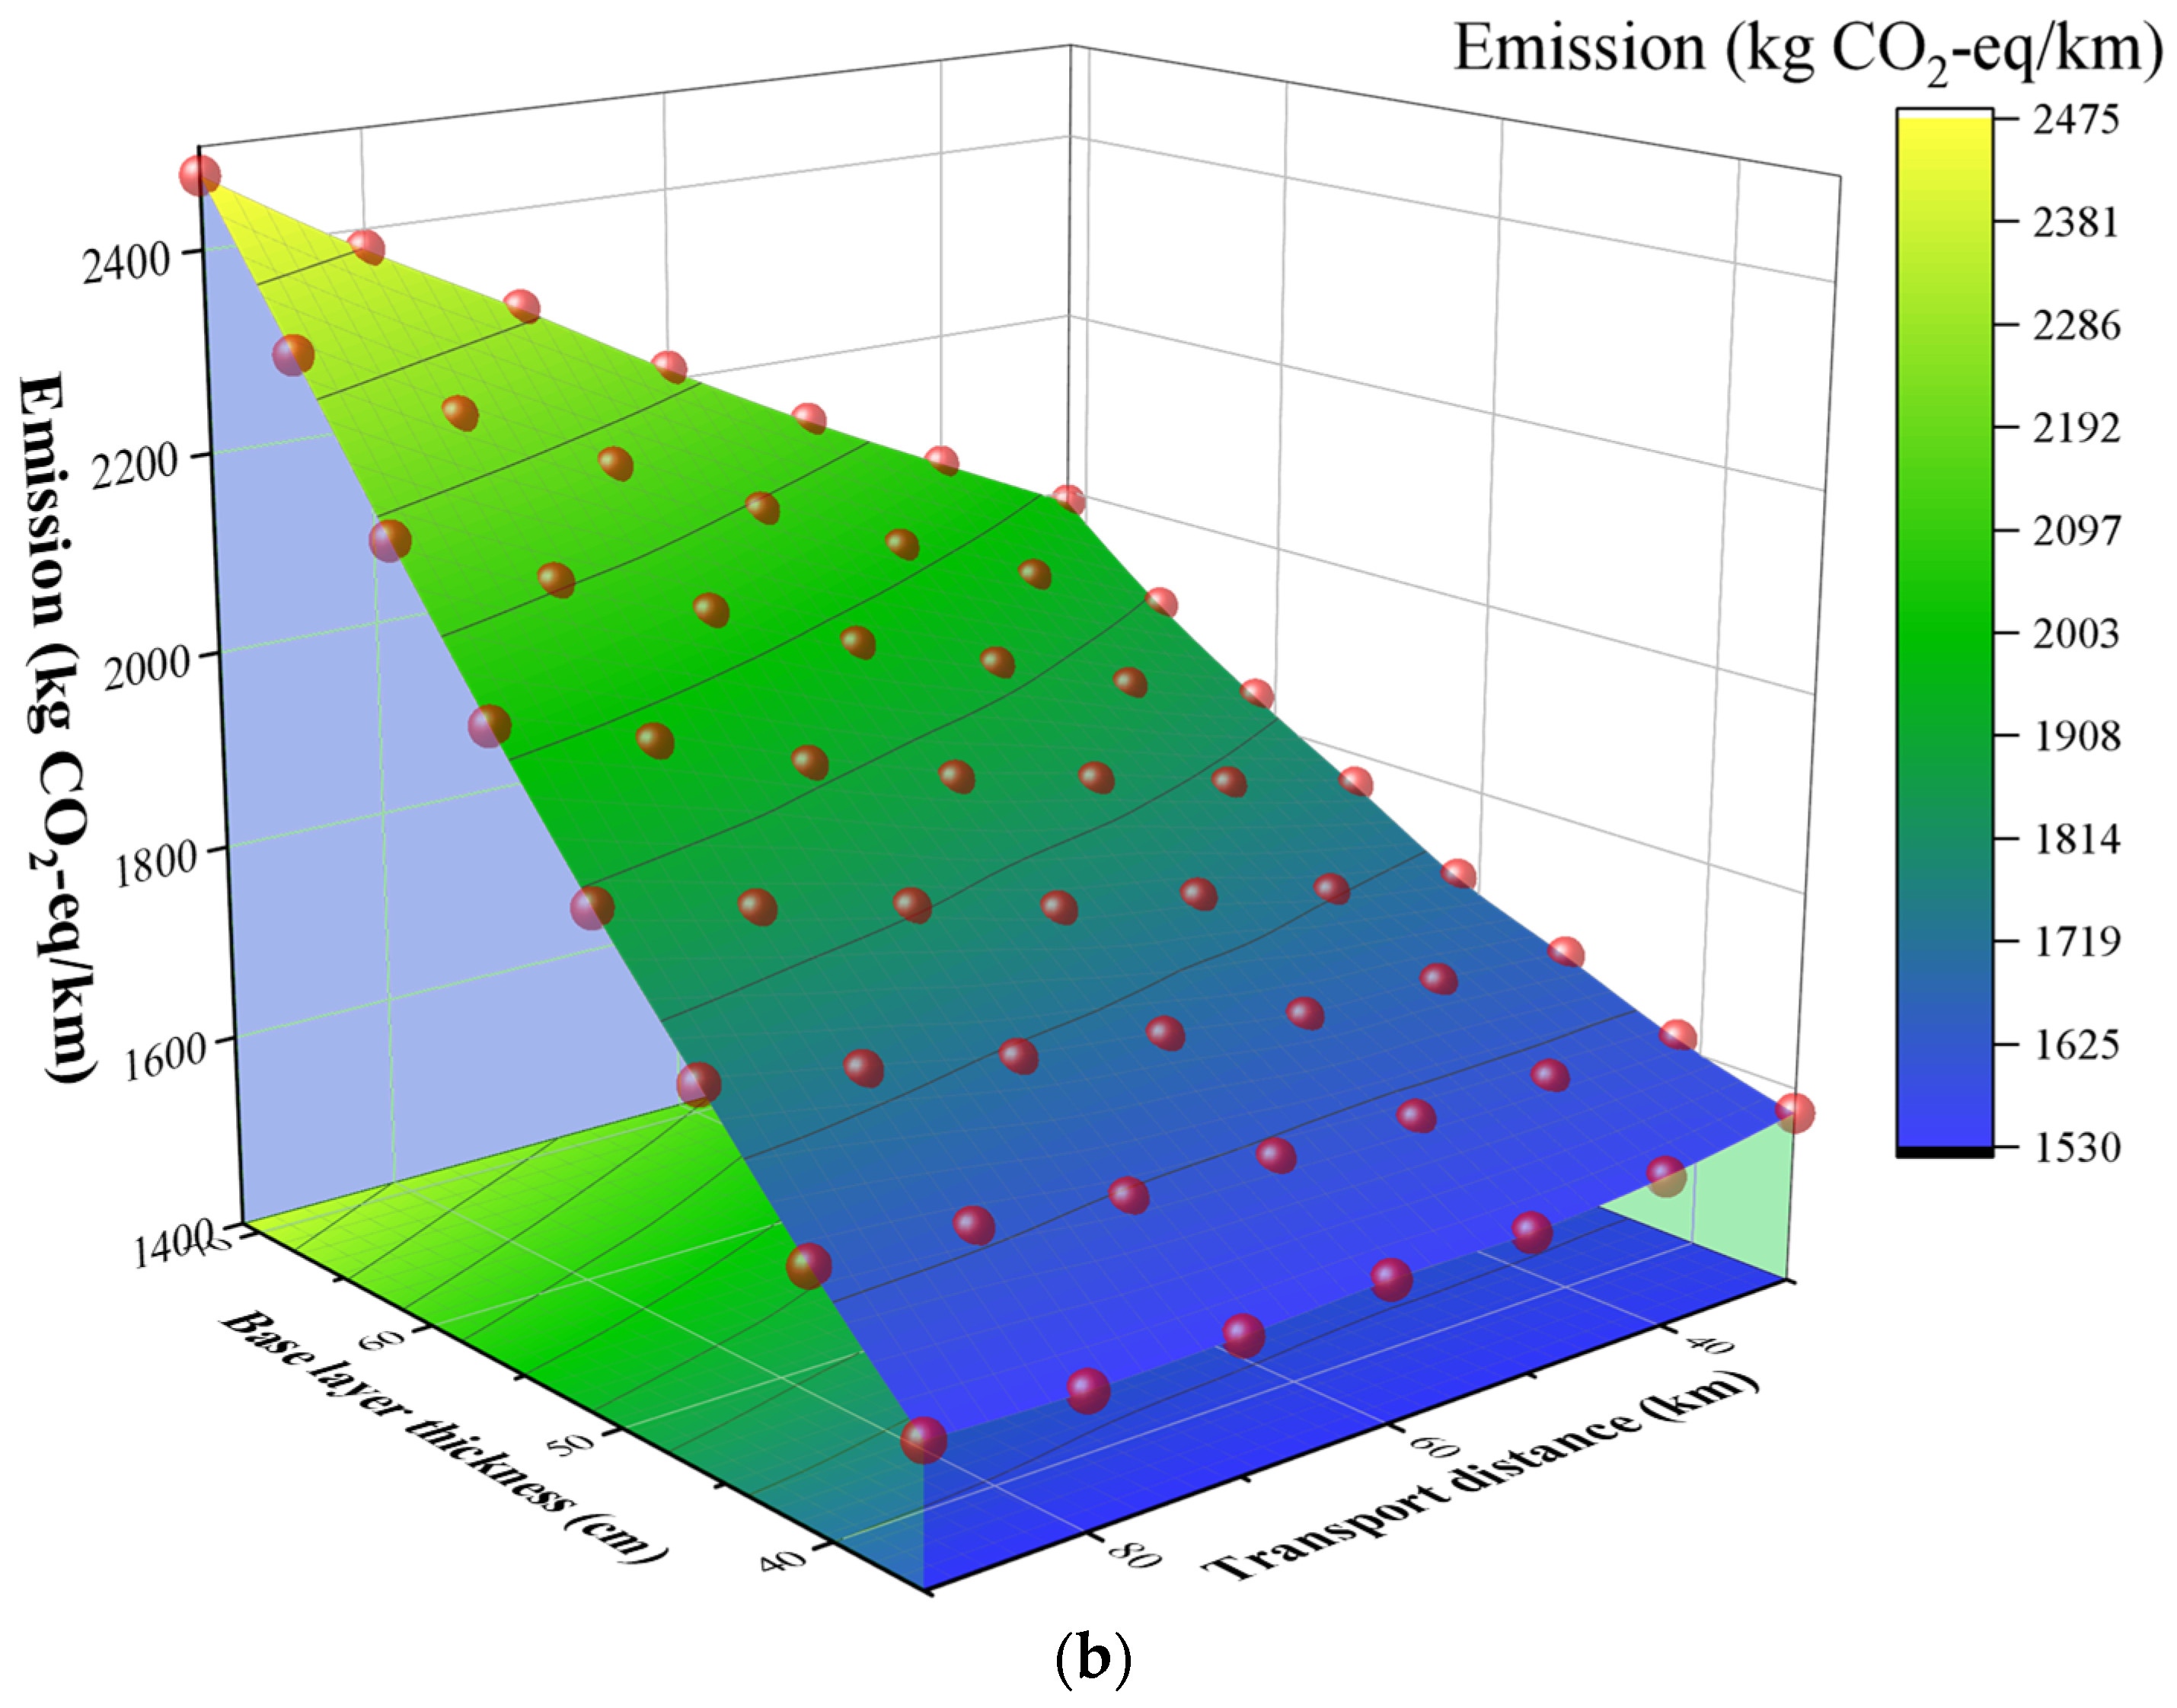
Figure 4b illustrates the carbon emission response when the base layer, consisting of a 36 cm cement-stabilized macadam layer and a 20 cm water-stabilized subbase, is treated as an integrated thickness variable ranging from 36 cm to 71 cm. As the base layer thickness increases within this range, total emissions rise from 1500.27 kg CO2-eq/km to 2020.60 kg CO2-eq/km, representing a 34.6% increase. Correspondingly, emissions from the base materials increase from 535.20 kg CO2-eq/km to 1055.53 kg CO2-eq/km, nearly doubling. Although the unit carbon emission factors of cement-stabilized aggregates and stone materials are lower than those of asphalt, the large volume, greater depth, and energy-intensive construction of the base layer result in considerable total emissions. Furthermore, the energy demand in the G3 construction stage rises proportionally with thickness, confirming the base layer as a major control factor of construction-phase emissions.
Overall, both asphalt and base layer thicknesses show a clear linear increase in total carbon emissions. The asphalt layer, with high unit emissions but limited thickness variation, is a high-carbon, high-sensitivity factor. In contrast, the base layer, though lower in unit emissions, contributes significantly due to its large volume and construction energy use. Both are key structural drivers of emissions and should be prioritized in design.

3.2.3. Impact of Construction Equipment Efficiency

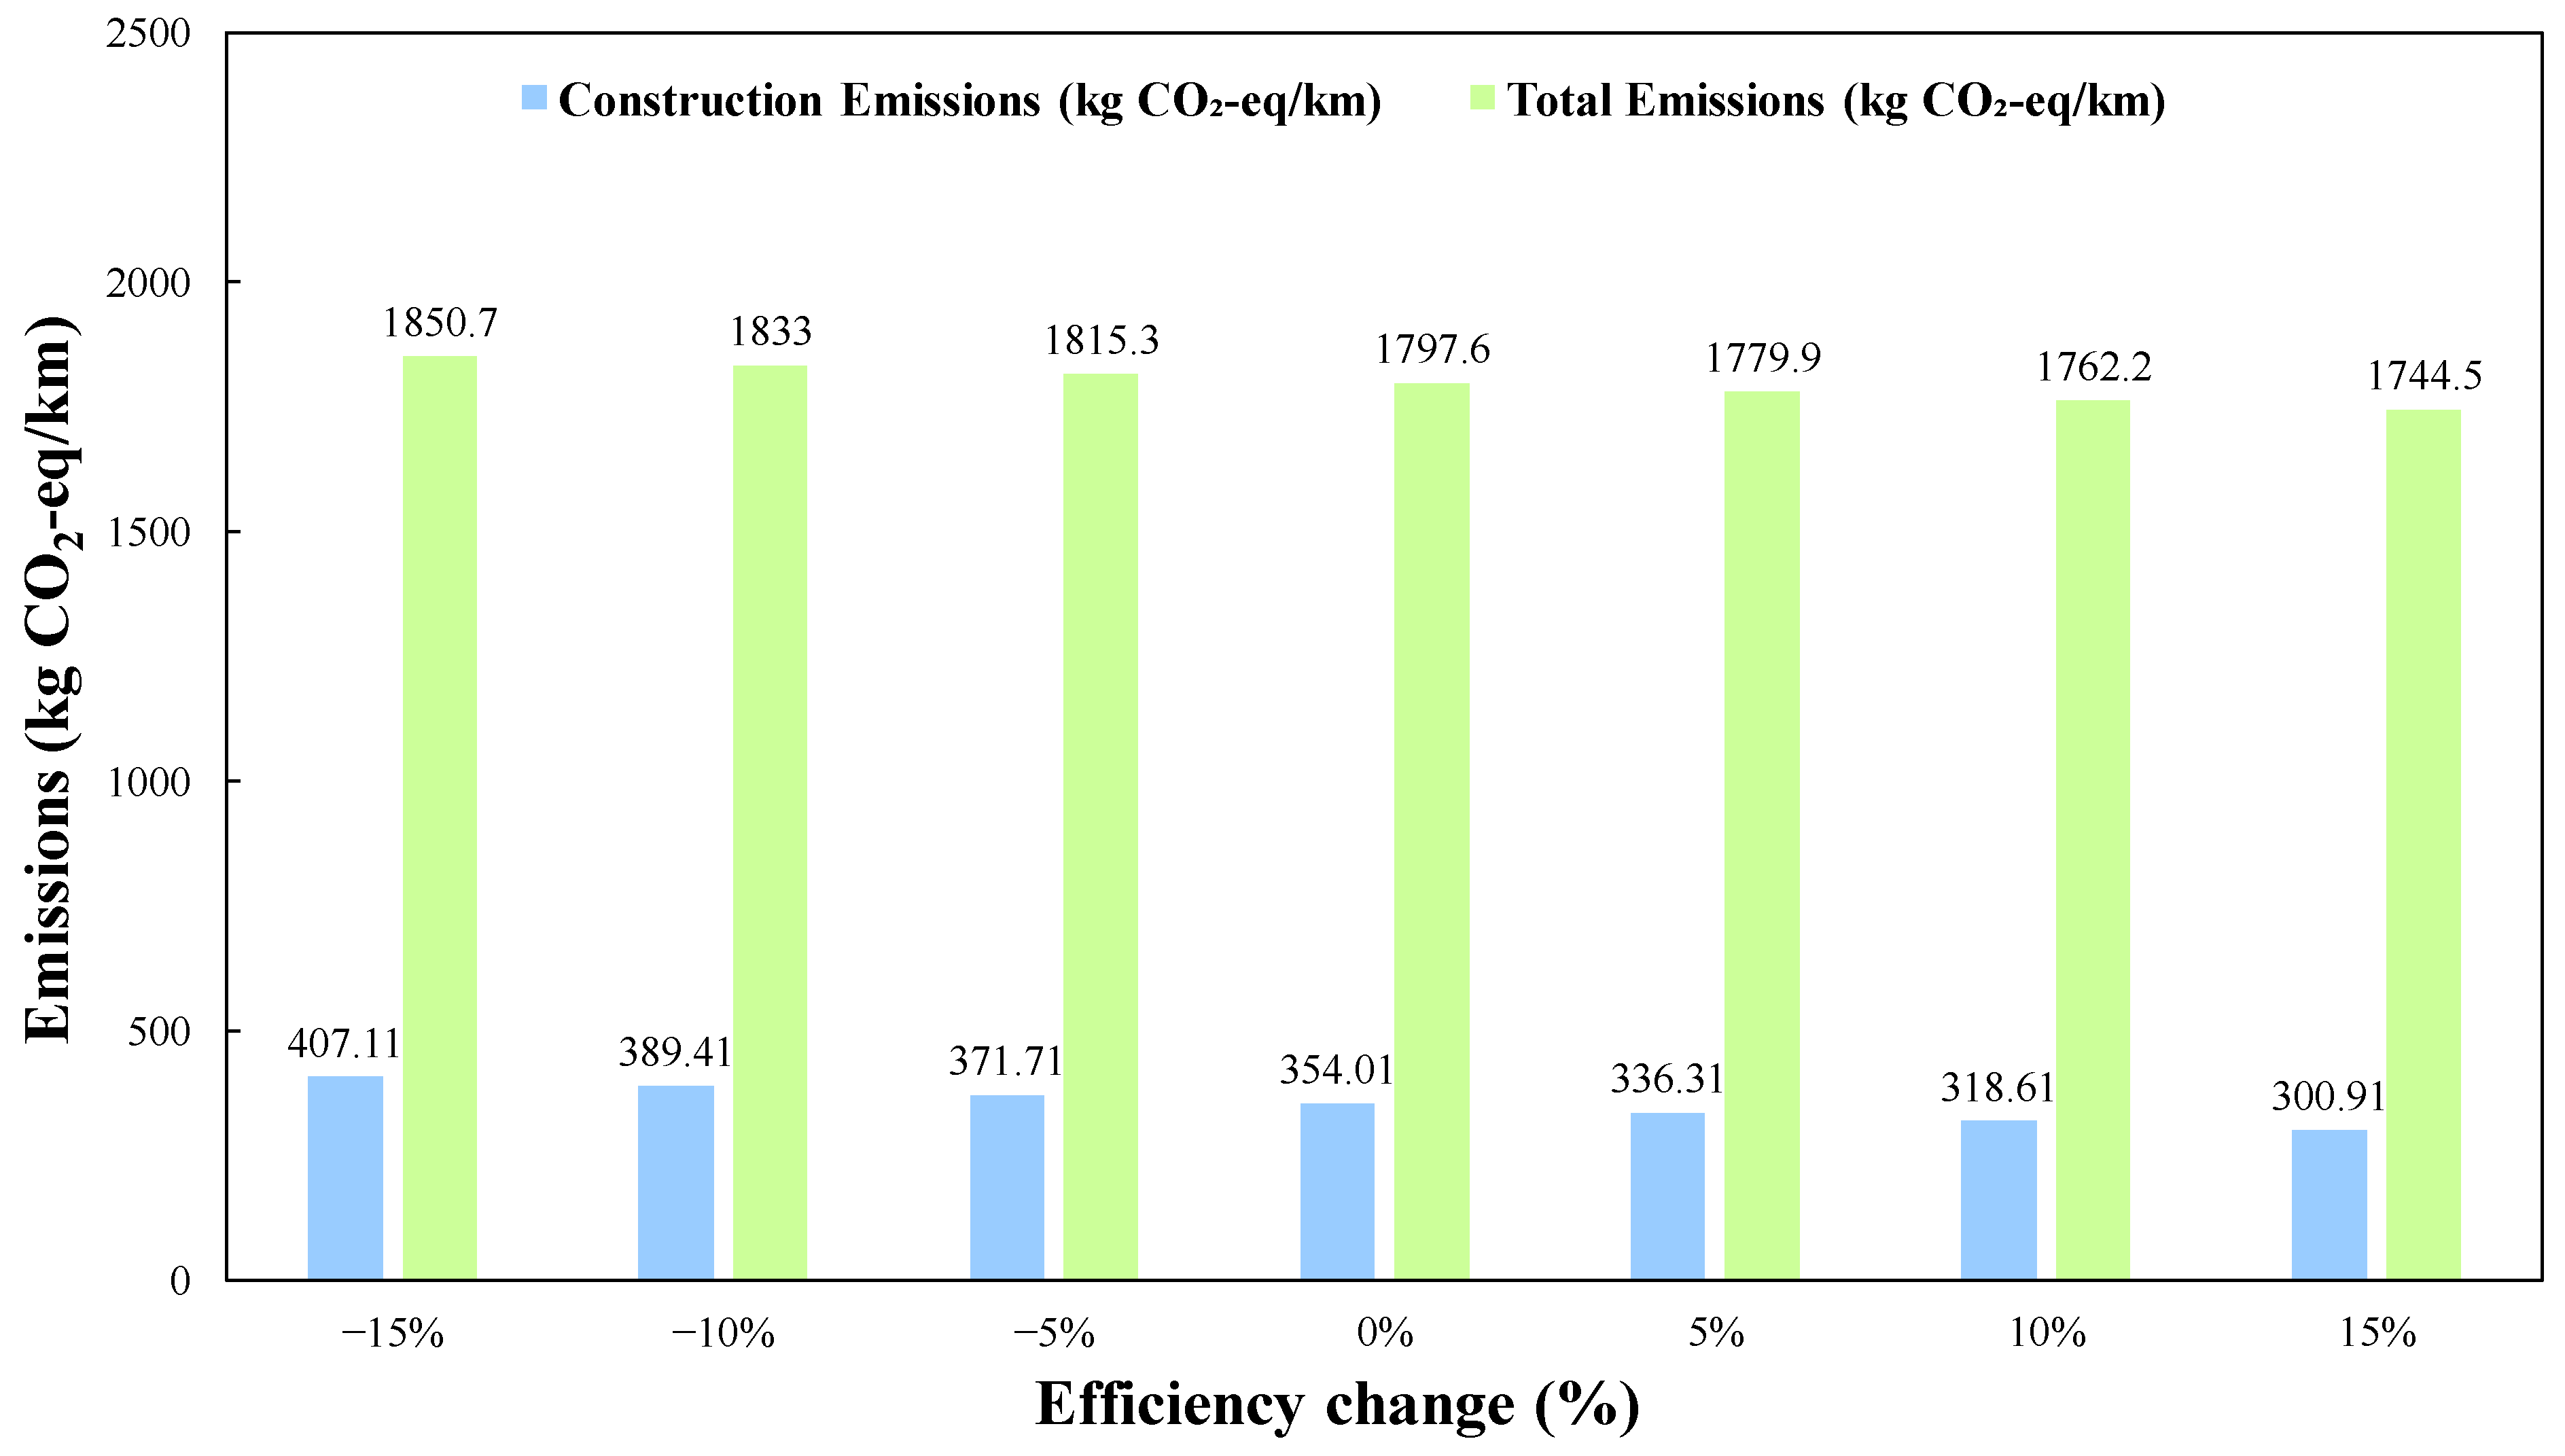
The construction stage is an important part of the carbon emission during the expressway construction period, and its carbon emission mainly comes from the energy consumption of diesel-driven pavers, road rollers, loaders, mixing stations, and other mechanical equipment. To analyze the sensitivity of fuel efficiency of construction equipment to carbon emissions, this paper takes the emission of 354.01 kg CO2-eq/km during the construction stage as the baseline scenario, sets the change range of equipment efficiency from −15% to +15% (interval of 5%), and calculates the total carbon emissions under different scenarios accordingly. The results are shown in Figure 5.
The improvement of the efficiency of construction equipment can effectively reduce G3 stage emissions, thereby driving the reduction of Gtotal. When the equipment efficiency decreases, the total emissions increase accordingly, reaching a maximum of 1850.7 kg CO2-eq/km. The variation between the +15% and −15% efficiency scenarios is approximately symmetrical (around ±53 kg CO2-eq/km), indicating a nearly linear relationship between efficiency and total carbon emissions. Although the construction stage contributes about 20% of the total emissions, it remains sensitive to equipment performance variations, particularly in large-scale projects. Hence, improving construction machinery efficiency can still bring measurable but moderate emission reductions. Especially in large-scale and centralized projects, the use of high-efficiency and energy-saving equipment will significantly improve the benefits of carbon emission reduction. It is therefore recommended to:
  • Promote fuel-saving construction equipment and improve engine thermal efficiency.
  • Optimize construction procedures and organization to reduce idling and repetitive operations.
  • Encourage the use of electrified and intelligent construction equipment to achieve low-carbon transformation.

3.2.4. Impact of Electricity Grid Factor

With the continuous improvement of intelligence and electrification in the construction process, the dependence of some construction equipment and auxiliary systems (such as mixing station control, electric drive rollers, etc.) on electric energy has increased significantly, and the impact of changes in electric carbon factors on total carbon emissions has attracted increasing attention. For this reason, this paper sets a floating interval (10% interval) of the power carbon factor ± 50% above and below the benchmark value and calculates the change of carbon emission per unit kilometer under different power structure conditions accordingly. The results are shown in Figure 6.
As we can see, the change of the power carbon factor shows a linear relationship with the emission of power-related equipment in the G3 stage. Under the benchmark conditions (the carbon electricity factor is the current national standard level), the carbon emission of power equipment is approximately 86.0 kg CO2-eq/km, corresponding to the total carbon emission of 1797.6 kg CO2-eq/km. When the power source becomes cleaner and the carbon factor is reduced to 50% of the baseline, the total emissions decrease slightly to 1754.6 kg CO2-eq/km (a reduction of 2.4%). Conversely, when the electricity carbon factor increases by 50%, total emissions rise moderately to 1840.6 kg CO2-eq/km. The results indicate a nearly linear and symmetric response of total emissions to variations in the electricity carbon factor, suggesting that the overall sensitivity of the system to power grid changes remains limited under current construction energy structures. Overall, although the current proportion of electricity in the energy structure during the construction period is relatively low (< 5%), its changes can still cause carbon emissions per unit kilometer to fluctuate within the range of ± 43 kg CO2-eq/km, which has certain sensitivity. Especially in the future, when intelligent construction is widely used and the proportion of electric drive equipment is increasing, the cleanliness of power sources will directly affect the carbon footprint of the construction process.
Therefore, it is recommended to improve the low-carbon level in the electricity use stage from the following aspects:
  • Prioritize the use of clean electricity (such as green electricity price, photovoltaic energy supply, etc.).
  • Promote electrified construction equipment to replace traditional diesel power.
  • Optimize power allocation and load management in mixing stations and compaction processes.

3.3. Multivariable Response Analysis of Carbon Emissions

The above analysis results show that the material transportation distance and the thickness of the pavement structure (especially the asphalt layer and base layer) are the main sensitive factors affecting carbon emissions during expressway construction. To further explore the interaction between different variables and their coupling effect on total carbon emissions, this paper constructs a multivariate carbon emission response model based on the parameter accounting results and draws a three-dimensional response surface as shown in Figure 7.
As shown in Figure 7a, the coupling of different asphalt layer thicknesses (15–20 cm) and material transportation distances (30–90 km) presents significant nonlinear positive correlation characteristics for carbon emissions per kilometer. Overall, as the two increase together, carbon emissions continue to rise, but there are stage differences in the growth trend: when the transportation distance is less than 60 km, the discharge changes gently with the increase in thickness; when the transportation distance exceeds 70 km, the emissions caused by thickness change increase obviously, showing the superposition amplification effect of thickness–transportation. This is mainly due to the thicker asphalt structural layer, which leads to the synchronous increase in material demand and transportation frequency, resulting in the synchronous increase in G1 and G2 stage emissions.
Figure 7b shows the response relationship of different base layer thicknesses (36–71 cm) with transport distance (30–90 km). The influence of the thickness change of the base layer on the emission is higher than that of the asphalt layer, and the overall slope of its curved surface is larger. When the thickness exceeds 60 cm, the upward trend of emission is significantly accelerated, and a local steep rise area appears on the edge of the curved surface under the condition of long-distance transportation, which reflects the nonlinear enhancement effect caused by the coupling of material volume and transportation path. In contrast, the effect of transport distance remains approximately linear, but its interaction with thickness variation significantly widens the range of emission fluctuations.
From the overall response characteristics, carbon emissions show nonlinear, coupled, and phased characteristics for two types of structural parameters:
  • The thickness of the asphalt layer dominates the change of material carbon factor (G1 dominates), which belongs to high-carbon sensitive factors.
  • The thickness of the base layer dominates the change of material volume and construction energy consumption (G1 + G3 double drive), which belongs to high-volume cumulative factors.
  • The transportation distance forms a bridging effect between the two by affecting external energy consumption (G2).
To further illustrate the application significance of the model, the three-dimensional response surface can be used for engineering optimization analysis. For example, when the combination of design thickness and transportation distance is in the “gentle response zone” (that is, the area with small gradient changes), carbon emissions can be minimized while ensuring structural performance. In addition, by fitting the response surface function, the carbon emission prediction model can be further constructed, providing a calculation basis for subsequent automated design, green construction decision making, and intelligent scheduling.
Overall, the multivariate carbon emission response analysis framework established in this study not only reveals the interaction mechanism between structural and logistics factors but also provides theoretical support for future low-carbon design based on multiobjective optimization algorithms (such as response surface methodology, genetic algorithm, machine learning regression model, etc.). This method lays a foundation for quantitative carbon assessment, optimal design, and intelligent decision making in the expressway construction stage.

4. Conclusions

This study systematically quantified and analyzed the carbon emissions associated with expressway construction through an LCA approach. By conducting phased accounting and multivariable modeling using typical engineering data, the emission characteristics and key driving factors across the material production, transportation, and construction stages were identified. The main conclusions are as follows:
(1)
The total carbon emissions per kilometer during the expressway construction phase are approximately 1.80 × 10³ kg CO2-eq/km, with material production (G1) contributing about 60–70% and serving as the primary emission source. Although the construction (G3) and transportation (G2) stages account for smaller proportions, they still exert considerable influence due to their high energy consumption characteristics.
(2)
The thicknesses of the asphalt layer and base layer have the most significant impact on total carbon emissions. Their variations show linear or nonlinear positive correlations with emission levels. The asphalt layer represents a high-carbon and highly sensitive factor, while the base layer demonstrates a high-volume cumulative effect. Together, these two structural layers account for more than 60% of the total emissions during the construction phase.
(3)
Transportation distance and construction equipment efficiency are moderately sensitive parameters. A 50% increase in transportation distance results in an approximately 3.5% increase in total emissions, while a 10% improvement in equipment efficiency reduces emissions by about 2%. Although the influence of changes in the electricity grid emission factor is relatively minor, the potential for adopting clean electricity remains substantial.
(4)
The three-dimensional response surface model of asphalt layer thickness, base layer thickness, and transportation distance indicates that carbon emissions are affected by multiple variables with clear interaction effects. The combined increase in layer thickness and transportation distance significantly amplifies emissions, whereas the marginal effect of transport distance gradually diminishes. This model provides quantitative support for future low-carbon design and green construction strategies that can be further enhanced through intelligent optimization algorithms.
Future research should integrate measured energy consumption data and dynamic carbon emission factors to develop more refined spatiotemporal carbon emission models. In addition, incorporating economic and performance constraints will enable multiobjective optimization of carbon emissions, cost, and structural performance during the construction phase, thereby providing a solid scientific foundation for green and low-carbon management throughout the entire life cycle of expressways.

Funding

This research received no external funding.

Data Availability Statement

The data that support the findings of this study are available on reasonable request from the corresponding author. Access to the data is restricted due to institutional confidentiality and the ongoing nature of related research work.

Conflicts of Interest

The author declares no conflicts of interest.

References

  1. Cui, B.; Wang, H. Predicting Asphalt Pavement Deterioration Under Climate Change Uncertainty Using Bayesian Neural Network. IEEE Trans. Intell. Transp. Syst. 2025, 26, 785–797. [Google Scholar] [CrossRef]
  2. EN B. 15804; Sustainability of Construction Works—Environmental Product Declarations—Core Rules for the Product Category of Construction Products. UNE: Madrid, Spain, 2012.
  3. Luo, W.; Sandanayake, M.; Zhang, G.; Tan, Y. Construction Cost and Carbon Emission Assessment of a Highway Construction—A Case towards Sustainable Transportation. Sustainability 2021, 13, 7854. [Google Scholar] [CrossRef]
  4. Liu, Y.; Wang, Y.; Li, D.; Feng, F.; Yu, Q.; Xue, S. Identification of the potential for carbon dioxide emissions reduction from highway maintenance projects using life cycle assessment: A case in China. J. Clean. Prod. 2019, 219, 743–752. [Google Scholar] [CrossRef]
  5. Cui, B.; Wang, H. Compatibility analysis of waste polymer recycling in asphalt binder using molecular descriptor and graph neural network. Resour. Conserv. Recycl. 2025, 212, 107950. [Google Scholar] [CrossRef]
  6. Gallivan, F.; Rose, E.; Choe, J.; Williamson, S.; Houk, J. FHWA Infrastructure Carbon Estimator: Final Report and User’s Guide; Federal Highway Administration: Washington, DC, USA, 2014. [Google Scholar]
  7. He, B.; Yuan, X.; Qian, S.; Li, B. Carbon Neutrality: A Review. J. Comput. Inf. Sci. Eng. 2023, 23, 060809. [Google Scholar] [CrossRef]
  8. Hao, J.; Chen, L.; Zhang, N. A Statistical Review of Considerations on the Implementation Path of China’s “Double Carbon” Goal. Sustainability 2022, 14, 11274. [Google Scholar] [CrossRef]
  9. Ozcan-Deniz, G.; Zhu, Y. Multi-objective optimization of greenhouse gas emissions in highway construction projects. Sustain. Cities Soc. 2017, 28, 162–171. [Google Scholar] [CrossRef]
  10. Hanson, C.S.; Noland, R.B. Greenhouse gas emissions from road construction: An assessment of alternative staging approaches. Transp. Res. Part D Transp. Environ. 2015, 40, 97–103. [Google Scholar] [CrossRef]
  11. Jiang, R.; Wu, P.; Wu, C. Driving Factors behind Energy-Related Carbon Emissions in the U.S. Road Transport Sector: A Decomposition Analysis. Int. J. Environ. Res. Public Health 2022, 19, 2321. [Google Scholar] [CrossRef]
  12. Gu, J.; Jiang, S.; Zhang, J.; Jiang, J. An analysis of the decomposition and driving force of carbon emissions in transport sector in China. Sci. Rep. 2024, 14, 30177. [Google Scholar] [CrossRef] [PubMed]
  13. Han, R.; Yu, B.-Y.; Tang, B.-J.; Liao, H.; Wei, Y.-M. Carbon emissions quotas in the Chinese road transport sector: A carbon trading perspective. Energy Policy 2017, 106, 298–309. [Google Scholar] [CrossRef]
  14. Li, J.; Lu, Q.; Fu, P. Carbon Footprint Management of Road Freight Transport under the Carbon Emission Trading Mechanism. Math. Probl. Eng. 2015, 2015, 814527. [Google Scholar] [CrossRef]
  15. Jiang, R.; Wu, C.; Song, Y.; Wu, P. Estimating carbon emissions from road use, maintenance and rehabilitation through a hybrid life cycle assessment approach—A case study. J. Clean. Prod. 2020, 277, 123276. [Google Scholar] [CrossRef]
  16. Liu, Y.; Wang, Y.; Li, D.; Yu, Q. Life cycle assessment for carbon dioxide emissions from freeway construction in mountainous area: Primary source, cut-off determination of system boundary. Resour. Conserv. Recycl. 2019, 140, 36–44. [Google Scholar] [CrossRef]
  17. Tokede, O.O.; Whittaker, A.; Mankaa, R.; Traverso, M. Life cycle assessment of asphalt variants in infrastructures: The case of lignin in Australian road pavements. Structures 2020, 25, 190–199. [Google Scholar] [CrossRef]
  18. Balaguera, A.; Carvajal, G.I.; Albertí, J.; Fullana-i-Palmer, P. Life cycle assessment of road construction alternative materials: A literature review. Resour. Conserv. Recycl. 2018, 132, 37–48. [Google Scholar] [CrossRef]
  19. Liu, Z.; Gu, X.; Wu, W. Deterioration Modeling of Pavement Performance in Cold Regions Using Probabilistic Machine Learning Method. Infrastructures 2025, 10, 212. [Google Scholar] [CrossRef]
  20. Liu, Y.; Wang, Y.; An, D. Life-cycle CO2 emissions and influential factors for asphalt highway construction and maintenance activities in China. Int. J. Sustain. Transp. 2018, 12, 497–509. [Google Scholar] [CrossRef]
  21. Hoxha, E.; Vignisdottir, H.R.; Barbieri, D.M.; Wang, F.; Bohne, R.A.; Kristensen, T.; Passer, A. Life cycle assessment of roads: Exploring research trends and harmonization challenges. Sci. Total Environ. 2021, 759, 143506. [Google Scholar] [CrossRef]
  22. Picardo, A.; Soltero, V.M.; Peralta, E. Life Cycle Assessment of Sustainable Road Networks: Current State and Future Directions. Buildings 2023, 13, 2648. [Google Scholar] [CrossRef]
  23. Azam, A.; Gabr, A.; Ezzat, H.; Arab, M.; Alshammari, T.O.; Alotaib, E.; Zeiada, W. Life cycle assessment and pavement performance of recycled aggregates in road construction. Case Stud. Constr. Mater. 2024, 20, e03062. [Google Scholar] [CrossRef]
  24. Hasan, U.; Whyte, A.; AlJassmi, H. A multi-criteria decision-making framework for sustainable road transport systems: Integrating stakeholder-cost-environment-energy for a highway case study in United Arab Emirates. J. Clean. Prod. 2024, 450, 141831. [Google Scholar] [CrossRef]
  25. Aryan, Y.; Dikshit, A.K.; Shinde, A.M. A critical review of the life cycle assessment studies on road pavements and road infrastructures. J. Environ. Manag. 2023, 336, 117697. [Google Scholar] [CrossRef]
  26. Finkbeiner, M.; Inaba, A.; Tan, R.; Christiansen, K.; Klüppel, H.-J. The New International Standards for Life Cycle Assessment: ISO 14040 and ISO 14044. Int. J. Life Cycle Assess. 2006, 11, 80–85. [Google Scholar] [CrossRef]
  27. Liu, Z.; Gu, X.; Ren, H. Rutting prediction of asphalt pavement with semi-rigid base: Numerical modeling on laboratory to accelerated pavement testing. Constr. Build. Mater. 2023, 375, 130903. [Google Scholar] [CrossRef]
  28. Cui, B.; Wang, H.; Gu, X.; Hu, D. Study of the inter-diffusion characteristics and cracking resistance of virgin-aged asphalt binders using molecular dynamics simulation. Constr. Build. Mater. 2022, 351, 128968. [Google Scholar] [CrossRef]
  29. Cui, B.; Wang, H. Cross-scale analysis of asphalt binder tensile fracture using molecular dynamics simulation. Constr. Build. Mater. 2024, 426, 136200. [Google Scholar] [CrossRef]
  30. Lu, Y.; Cui, B.; Wang, H.; Hajj, R. Experimental and simulation-based engineering of calcium alginate self-healing asphalt capsules. Chem. Eng. J. 2024, 499, 156212. [Google Scholar] [CrossRef]
  31. Change, I. 2006 IPCC Guidelines for National Greenhouse Gas Inventories; Institute for global environmental strategies: Hayama, Kanagawa, Japan, 2006. [Google Scholar]
  32. Mao, R.; Duan, H.; Dong, D.; Zuo, J.; Song, Q.; Liu, G.; Hu, M.; Zhu, J.; Dong, B. Quantification of carbon footprint of urban roads via life cycle assessment: Case study of a megacity-Shenzhen, China. J. Clean. Prod. 2017, 166, 40–48. [Google Scholar] [CrossRef]
  33. Yu, C.; Wu, L.; Liu, Y.; Ye, K.; Liang, G. Estimating Greenhouse Gas Emissions from Road Construction by Considering the Regional Differences in Carbon Emission Factors of Cement: The Case of China. Buildings 2022, 12, 1341. [Google Scholar] [CrossRef]
  34. Ecology, M. 2020 Press Conference Records of Ministry of Ecology and Environment, the People’s Republic of China; Springer Nature: Singapore, 2022. [Google Scholar]
  35. Chongxi, B.; Zhang, Z. Carbon emission quantification analysis of excavation engineering under road transport conditions. PLoS ONE 2025, 19, e0315765. [Google Scholar] [CrossRef] [PubMed]
  36. Wang, T.; Lee, I.-S.; Kendall, A.; Harvey, J.; Lee, E.-B.; Kim, C. Life cycle energy consumption and GHG emission from pavement rehabilitation with different rolling resistance. J. Clean. Prod. 2012, 33, 86–96. [Google Scholar] [CrossRef]
  37. Barati, K.; Shen, X. Operational level emissions modelling of on-road construction equipment through field data analysis. Autom. Constr. 2016, 72, 338–346. [Google Scholar] [CrossRef]
  38. Liu, Z.; Sun, L.; Gu, X.; Wang, X.; Dong, Q.; Zhou, Z.; Tang, J. Characteristics, mechanisms, and environmental LCA of WMA containing sasobit: An analysis perspective combing viscosity-temperature regression and interface bonding strength. J. Clean. Prod. 2023, 391, 136255. [Google Scholar] [CrossRef]
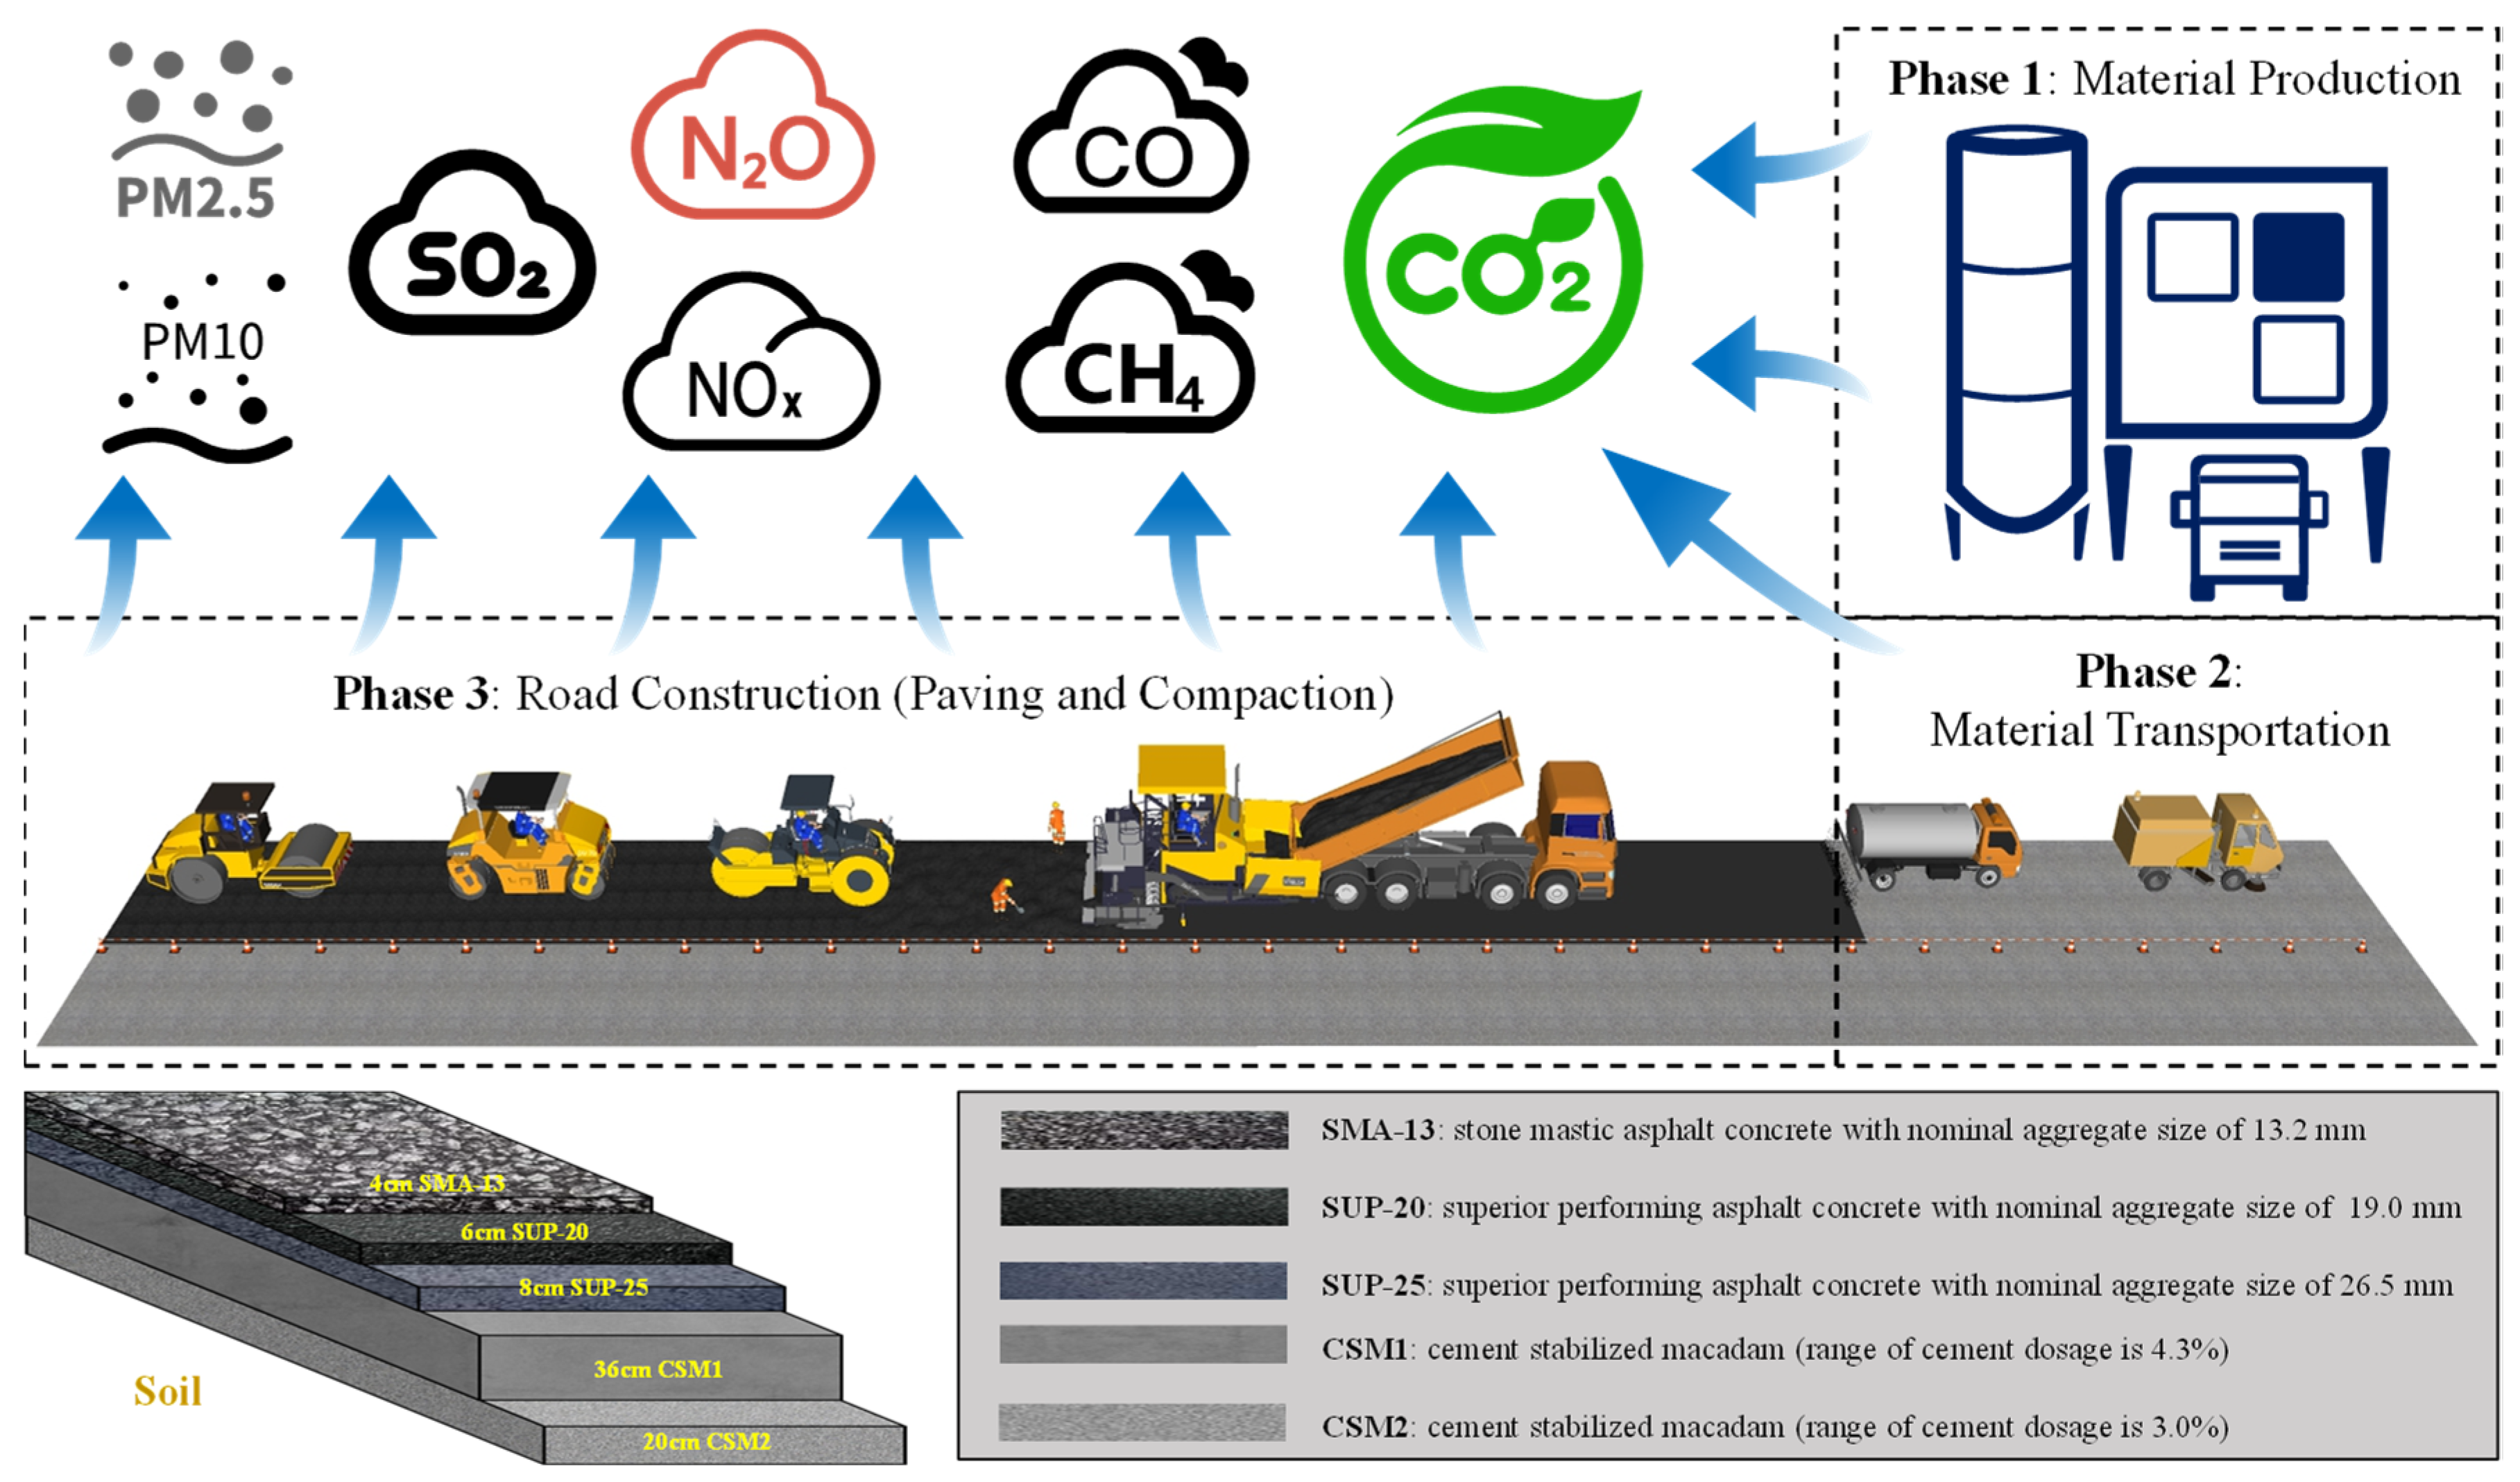
Figure 1. The process of constructing the deterioration modeling.
Infrastructures 10 00291 g001
Figure 2. Proportion chart of carbon emission phases of each structural layer.
Infrastructures 10 00291 g002
Figure 3. Impact of Transport Distance on Carbon Emissions.
Infrastructures 10 00291 g003
Figure 4. Impact of Structural Layer Thickness on Carbon Emissions: (a) Impact of Asphalt Layer Thickness (15–20 cm) and (b) Impact of Base Layer Thickness (36–71 cm).
Infrastructures 10 00291 g004aInfrastructures 10 00291 g004b
Figure 5. Impact of Construction Equipment Efficiency on Carbon Emissions.
Infrastructures 10 00291 g005
Figure 6. Impact of Electricity Grid Factor on Carbon Emissions.
Infrastructures 10 00291 g006
Figure 7. Multivariable Response Surface of Carbon Emissions: (a) Asphalt layer thickness and transport distance and (b) Base layer thickness and transport distance.
Infrastructures 10 00291 g007aInfrastructures 10 00291 g007b
Table 1. Input and Output Elements of Carbon Emission Pathways in Expressway Construction Phases.
PhaseMajor ActivitiesInputsOutputs (Emissions)
1: Material ProductionExtraction and processing of asphalt, cement, steel, aggregates, etc.Raw materials (e.g., crude oil, limestone, ores), electricity, fuels (coal, gas), water, chemical additives [30]CO2, CH4, N2O, industrial exhaust gases, process heat
2: Material TransportationTransport of construction materials to mixing plants or construction siteConstruction materials, diesel fuel, transportation vehicles, road infrastructureCO2, CH4, NOx, SO2, PM2.5, noise emissions
3: Road ConstructionAsphalt mixing, paving, rolling, spraying, field operationsMixed materials, construction equipment, diesel, heavy oil, electricity, construction water, laborCO2, CH4, N2O, dust emissions, machine noise, waste heat
Table 2. Carbon Emission Factors of Common Construction Materials [32,33].
Material TypeUnitEmission Factor (kgCO2-eq/unit)
Petroleum Asphaltt147.24
SBS Modified Asphaltt320.00
Ordinary Portland Cementt735.00
Cement-Stabilized Crushed Stonet35.00
Coarse Aggregate (gravel)t2.43
Fine Aggregate (sand)t1.20
Table 3. Average Carbon Emission Factors for Material Transportation [34,35].
Material TypeTransport WaysEmission Factor (kg CO2-eq)
Heavy-duty Diesel TruckRoad Transport0.130
Medium-duty Diesel TruckRoad Transport0.102
Table 4. Energy Consumption and Carbon Emission Parameters of Typical Construction Equipment [37,38].
Equipment TypeEnergy TypeEnergy Consumption (kg/unit) or (kg/h)Emission Factor (kgCO2-eq/kg)
Asphalt PaverDiesel135 kg/unit3.17
Vibratory RollerDiesel70 kg/unit3.17
LoaderDiesel90 kg/unit3.17
Asphalt Mixing Plant (120 t/h)Heavy Oil85 kg/h3.95
Table 5. Material Consumption and Energy Input of 1 km Standard Expressway Construction [38].
Material TypeConsumption (t or m3)Equipment TypeDiesel (kg)Heavy Oil (kg)Electricity (kWh)
Petroleum Asphalt546.3Asphalt Mixing Equipment84,055.5408.237,643.5
Modified Asphalt180.9Tire Roller Loader5445.0
Emulsified Asphalt49.4Spraying Truck24,808.5
Crushed Stone7237.8Asphalt Mixing Transporter1341.3
Water521.6Light Vibratory Roller8031.0
Cement371.5Grader864.0
Table 6. Carbon emission accounting results of different structural layers at each stage (unit: kg CO2-eq).
Structural LayersG1G2G3Gtotal for Single LayerGtotal for Whole Road
AC-13 upper layer6313.6722.599.171797.6
AC-20 upper layer213.415.6228.2257.22
AC-25 lower layer365.47.5521.75394.7
Base layer413.540.8993.16547.55
Subbase layer194.526.3864.1284.98
Subgrade layer41.648.08124.3213.98
Disclaimer/Publisher’s Note: The statements, opinions and data contained in all publications are solely those of the individual author(s) and contributor(s) and not of MDPI and/or the editor(s). MDPI and/or the editor(s) disclaim responsibility for any injury to people or property resulting from any ideas, methods, instructions or products referred to in the content.