Article

Effect of Ground Motion Duration and Frequency Characteristics on the Probabilistic Risk Assessment of a Concrete Gravity Dam

1
Department of Civil Engineering, Pabna University of Science and Technology, Pabna 6600, Bangladesh
2
Department of Civil and Environmental Engineering, Kongju National University, Cheonan-si 31080, Chungnam, Republic of Korea
*
Author to whom correspondence should be addressed.
Infrastructures 2025, 10(10), 259; https://doi.org/10.3390/infrastructures10100259
Submission received: 18 July 2025 / Revised: 24 September 2025 / Accepted: 25 September 2025 / Published: 27 September 2025
(This article belongs to the Special Issue Advances in Dam Engineering of the 21st Century)

Abstract

Evaluation of seismic risk by capturing the influences of strong motion duration and frequency contents of ground motion through probabilistic approaches is the main element of this study. Unlike most existing studies that mainly focus on intensity measures such as peak ground acceleration or spectral acceleration, this work highlights how duration and frequency characteristics critically influence dam response. To achieve this, a total of 45 ground motion records, categorized by strong motion duration (long, medium, and short) and frequency content (low, medium, and high), were selected from the PEER database. Nonlinear numerical dynamic analysis was performed by scaling each ground motion from 0.05 g to 0.5 g, with the drift ratio at the dam crest used as the Engineering Demand Parameter. It is revealed that long-duration and low-frequency ground motions induced significantly higher drift demands. The fragility analysis was conducted using a lognormal distribution considering extensive damage threshold drift ratio. Finally, the probabilistic seismic risk was carried out by integrating the site-specific hazard curve and fragility curves which yield the height risk for long durations and low frequencies. The outcomes emphasize the importance of ground motion strong duration and frequency in seismic performance and these findings can be utilized in the dam safety evaluation.

1. Introduction

Concrete gravity dams are massive human-made infrastructures that are commonly used for flood control, hydroelectric power generation, water resource management, and agricultural water supply, and are inherently susceptible to seismic hazards [1]. There may be disastrous consequences, including significant loss of life, serious environmental impact, and property damage, if such a big structure suddenly fails. Consequently, a comprehensive understanding of their seismic vulnerability is crucial for maintaining public safety and infrastructure resilience.
The ground motion characteristics, the structural characteristics of the dam, the dam–reservoir interaction, and the dam–foundation rock interactions are some of the many variables that affect the seismic response of concrete gravity dams. The rigorous seismic responses may create potential risk in a seismically hazardous location. Beyond shaking amplitude alone, a growing body of evidence shows that ground motion characteristics, particularly strong motion duration, frequency content, and near-fault pulse effects, govern cumulative damage and damage mechanisms in dams and must be reflected in assessment frameworks and design checks [2,3,4,5]. Recent reviews of dam fragility emphasize that incorporating these record attributes alongside dam–reservoir–foundation (DRF) interaction is central to credible seismic safety evaluations [2].
Duration is commonly quantified using the significant duration based on Arias intensity (e.g., 5–95% or 5–75% energy windows) or related measures; classic and modern works formalized and compared such metrics [6,7]. Duration also encompasses hazard-consistent record selection and collapse-risk evaluations for structures, highlighting that longer shaking tends to reduce collapse capacity when all else is held equal [8]. For dams, longer duration has been shown to elevate cumulative damage, crest displacement, and cracking demands even under similar spectral amplitudes [9,10,11,12,13,14].
Dam response is also sensitive to the frequency content of input motions relative to the dam’s fundamental periods and hydrodynamic resonance. Frequency content can be screened with scalar indicators such as PGA/PGV (lower ratios ≈ lower-frequency content), which correlate with inelastic demand in systems and are often used in the selection/partitioning of motions [15,16]. Broader frequency-content estimators in geotechnical/structural contexts are likewise useful when curating record sets for DRF analyses [15]. For massive dams with long natural periods and fluid–structure coupling, low-frequency-dominated motions tend to produce larger crest drifts and stress concentrations than high-frequency motions at the same spectral amplitude [9,11,13].
Near-fault records often contain large velocity pulses due to directivity/fling, which amplify displacement and demand. Canonical work by Mavroeidis and Papageorgiou [17] provided analytical pulse representations used widely in parametric studies, while Earthquake Spectra studies have proposed pulse indicators and selection strategies [18]. For dams specifically, multiple studies show that pulse-like motions and incident angle/directionality can significantly worsen responses and damage indices (e.g., concrete gravity and arch dams), compared with ordinary motions [19,20,21]. These findings translate directly into fragility shifts (lower median capacity) and should inform record sets for nonlinear time history analysis of dam–reservoir–foundation systems [19,20].
For concrete gravity dams, Zhang et al. [9] and Wang et al. [13] demonstrated that long-duration motions increase accumulated damage and drift demands relative to short-duration counterparts at comparable intensity; Wang et al. [14] introduced an integrated duration metric and linked it to demands; and Mohammadnezhad et al. [10] quantified the duration–response correlation statistically across intensity levels [9,10,11,13,14]. For CFRDs, Wang et al. [22] showed measurable sensitivity of displacement, plastic shear strain, and slab damage to strong motion duration. For arch dams, Wang et al. [20] found that pulse-like near-fault motions and orientation effects impose substantially larger damage volumes than ordinary motions (with PGV emerging as an informative IM). Together, these studies underscore the need to explicitly partition motions by duration and frequency content when developing fragilities for dams.
Because hydrodynamic pressures and rock-foundation flexibility alter modal characteristics, wave radiation, and damping, DRF interaction can materially change demands and fragility results. Three-dimensional DRF studies and targeted sensitivity work show that reservoir and foundation modeling assumptions (e.g., compressible fluid, absorbing boundaries, and impedance contrasts) materially affect predicted dam responses [3,4]. Consequently, duration/frequency effects should be interrogated within a modeling framework that captures DRF coupling to avoid biased fragility estimates. Natural dam foundations are heterogeneous; layering/stratigraphic dip and spatially random stiffness/strength fields can scatter and amplify seismic waves, alter effective input duration/frequency at the dam base, and increase both mean demand and dispersion [23,24]. In this study, we assume a homogeneous elastic foundation to isolate ground motion duration/frequency effects; results should be conditionally interpreted on this assumption, and future work will incorporate heterogeneity via random-field foundation properties and stratigraphic geometry [23,24].
Comprehensive reviews of dam fragility [2] synthesize methods, modeling assumptions (including DRF interaction), intensity-measure choices, and sources of uncertainty for dams, and they identify the need to better represent record characteristics beyond amplitude in fragility/risk evaluations. Building on those insights, our study implements a hazard-informed, DRF-consistent framework that explicitly stratifies motions by significant duration (SD/MD/LD) and frequency content (HF/MF/LF via PGA/PGV), performs IDA on a single, consistent FE model, fits groupwise lognormal fragilities, and convolves each group with the site hazard to obtain duration- and frequency-conditioned risk. This implementation quantifies, within one case study, how long-duration and low-frequency motions systematically lower median capacity and elevate annual risk relative to short-duration and high-frequency motions, providing actionable guidance for duration-aware record selection, fragility development, and hazard weighting in practice. Related syntheses were concerned with uncertainty propagation and the influence of record/model choices on fragility [25].
Despite extensive research on the seismic performance of concrete gravity dams, a specific gap remains in comprehensively understanding the coupled influence of both ground motion frequency characteristics and strong motion duration on their probabilistic seismic risk, especially when considering the complex dam–reservoir–foundation interaction. While researchers have independently explored the influence of ground motion duration on dam responses [13,14], the effect of near-fault ground motions [21], the dam–foundation–reservoir interaction importance [3,26], and the probabilistic estimation of seismic performance considering many uncertainties [25,27,28,29,30], a unified probabilistic framework that systematically investigates the combined effects of frequency content and duration of seismic loading on the seismic risk of these complex systems remains underexposed. However, a well-rationalized probabilistic seismic risk assessment (PSRA) framework that merges the effects of ground motion frequency content and duration, with a critical analysis of DRF interaction, is still an area for future research. Current PSRA studies for dams often have conditions that simplify the incredibly intricate phenomena or completely omit examining them altogether. This results in erroneous risk estimates and ultimately does not allow the construction of truly resilient dam infrastructure.
This article seeks to fill this important gap by developing and implementing a probabilistic seismic risk assessment framework for the concrete gravity dams (Bohyeonsan concrete gravity dam) located in South Korea. Further, the developed framework incorporates the combined effects of ground motion frequency characteristics, the duration of strong motion, and the dam–reservoir–foundation interaction through adequate modeling. The goal of the study is to quantify the effects of combined ground motion frequency and strong motion duration on the fragility and risk curves of concrete gravity dams through FEM-based numerical modeling and probabilistic analysis. This study will provide more adequate and accurate measures of seismic performance by estimating the fragility curves and risk curves of concrete gravity dams. The proposed method and contributions of the study to the seismic design guidelines, risk mitigation strategies, and safety and reliability of concrete gravity dams in seismically active areas are significant. The general methodology follows a flowchart in Figure 1, where the preliminary steps include FEM, selecting ground motions based on strong motion duration and frequency, IDA, and the fragility and risk assessment of concrete gravity dams.

2. Numerical Modeling of CGDs

2.1. Bohyeonsan Dam Detailing

The Bohyeonsan Dam is a concrete gravity dam that serves many purposes. It is located in the upper reaches of the Gohyeoncheon River, which is the second tributary of the Kumho River in South Korea [1]. The construction project was finished in 2014 and was mainly built to hold water, control floods, and maybe even create electricity from water. The dam has a crest length of 250 m, a maximum height of 58.5 m, and a crest width of about 11.25 m. It has dedicated service lanes and extra pedestrian bridges that make it easy for vehicles and maintenance workers to get to the top. The reservoir can hold a total of 22.10 million cubic meters of water. The water levels are controlled by setting different levels, such as the highest water level (H.W.L.) of EL. 240.00 m, a planning flood level of EL. 238.50 m, and a low water level of EL. 208.00 m [31]. The dam has a maintenance gallery on the inside and is made of two types of concrete, each with its own compressive strength and elastic properties to handle different load conditions. The inner part has a strength of 12 MPa, and the outer part has a strength of 18 MPa. The dimensions of the cross-section along the length of the dam are variable; however, the critical section is considered for assessment purposes and is illustrated in Figure 2.

2.2. Finite Element Modeling and Analysis

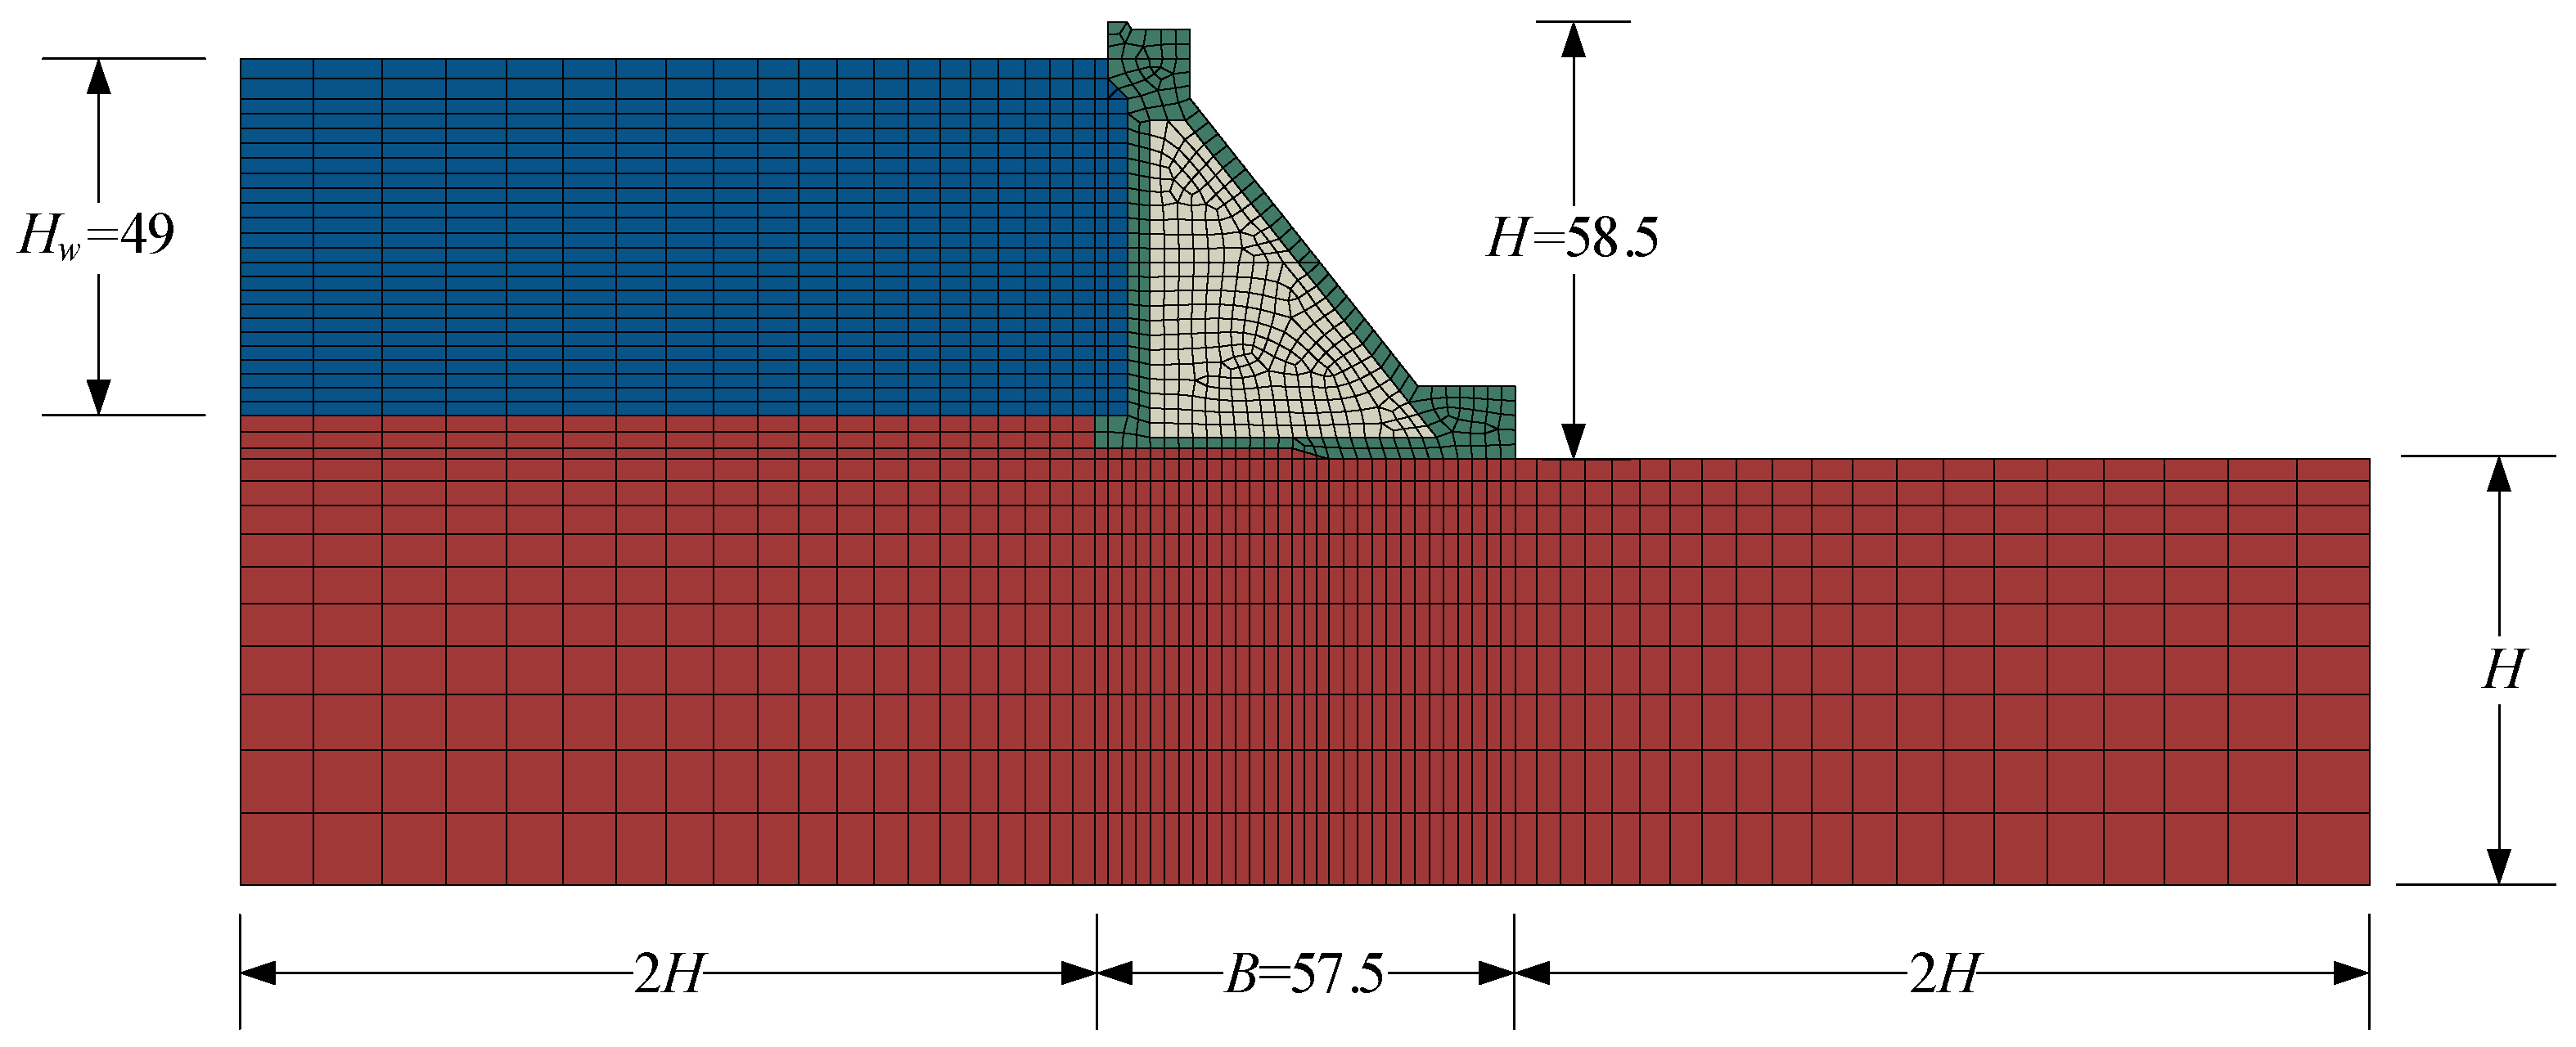
The 2D finite element modeling (FEM) of the Bohyeonsan concrete gravity dam is an essential component of seismic performance evaluation studies conducted in recent research. The modeling approach integrates the structural configuration of the dam, examining the dam–foundation–reservoir interaction. The simulation was conducted using ABAQUS 2024, a widely recognized finite element analysis software [32]. Modeling is performed using SI units (m·N·s); gravity is g = 9.81 m/s2. The global axes follow the dam geometry: x is upstream–downstream (seismic input direction), and y is vertical. The selected section for analysis corresponds to the most critical segment based on sensor data and structural response outputs [1]. To incorporate foundation effects adequately, the model includes a foundation soil domain with a depth equal to the dam height (H) and horizontal extents of 2H upstream and 2H downstream (Figure 3), which ensures proper stress distribution and avoids boundary reflections during seismic simulation [33].
This study was conducted using 2D elements available in ABAQUS, specifically, the 4-node linear 2D acoustic quadrilateral element (AC2D4) for modeling water; the linear triangular element (CPE3); and the 4-node bilinear plane-strain quadrilateral element with reduced integration and hourglass control (CPE4R) for modeling the dam and soil. These elements are well-suited for simulating massive gravity dams under seismic excitation. The model considers reduced integration with hourglass control to balance computational efficiency and numerical stability. A relatively finer mesh (maximum mesh size 2 m) was used in the near-field region of the foundation domain to accurately capture localized effects and stress variations. In contrast, a coarser mesh was applied to the dam domain to maintain computational efficiency while still ensuring sufficient accuracy in the overall analysis. The mesh discretization is demonstrated in Figure 3.
In numerical modeling of the Bohyeonsan concrete gravity dam, accurately representing the interaction between the dam structure and the reservoir water is crucial for realistic seismic response simulation. While simplified methods such as the Westergaard added mass technique are commonly used [34], a more advanced and physically representative approach involves modeling the water domain using acoustic elements. This method treats the reservoir water as an inviscid, compressible fluid that can transmit pressure waves but cannot resist shear stresses, which aligns well with the behavior of real water during dynamic events such as earthquakes. Acoustic elements in FEA are specialized continuum elements that solve the pressure wave equation instead of traditional displacement-based equations. The primary unknown in these elements is the acoustic pressure, and their behavior is defined by fluid properties like density and bulk modulus. When seismic ground motions are applied, these elements simulate the propagation of pressure (acoustic) waves within the fluid domain, capturing complex behaviors such as wave reflections, standing wave formations, and resonant effects in the reservoir. These phenomena are important for accurately computing hydrodynamic pressures that develop on the upstream face of the dam during earthquake events. To establish realistic fluid–structure interaction (FSI), acoustic elements are coupled with the structural elements of the dam. At the interface between the reservoir and the dam body, the pressure fields generated in the acoustic fluid domain are transferred as loads to the dam surface. Simultaneously, any displacement of the dam surface influences the pressure field in the fluid. This bidirectional coupling ensures dynamic equilibrium between the dam and the reservoir throughout the seismic loading period. This interaction captures both the inertial effects of the water mass and the radiation damping provided by the reservoir, which are essential for assessing the seismic performance of the dam accurately. In the case of the Bohyeonsan Dam, this modeling strategy is particularly effective due to the significant depth of the reservoir (49 m), considering the high water level and the geometry of the dam.
Static boundary conditions fix the base of the foundation ( u x = u y = 0 ); at the lateral foundation boundaries, horizontal translation is restrained ( u x = 0 ) while vertical translation is free, representing canyon confinement. The reservoir free surface is assigned p = 0 (atmospheric), and hydrostatic preload p ( y ) = ρ g ( H w y ) is applied on the upstream face. Dynamic coupling is enforced via two-way acoustic-structure interaction along the wet interface (pressure-traction transfer and normal-acceleration compatibility), and a non-reflecting (impedance) boundary is applied at the far reservoir to emulate radiation damping; seismic input is a uniform horizontal base acceleration along x . In the static steps (gravity and hydrostatic preload), the base remains encased, and the lateral boundaries enforce u x = 0 , making it free to achieve a stable initial state; in the dynamic step, the lateral u x restraint is released.
In the nonlinear seismic analysis of the Bohyeonsan concrete gravity dam, the loading and analysis procedures are designed to replicate realistic conditions that the dam experiences over its operational lifetime. The analysis is conducted in multiple sequential steps, each of which incorporates nonlinear behavior to ensure that material degradation, cracking, and geometric nonlinearity are accurately captured. The sequence is (i) static gravity, (ii) static hydrostatic to H.W.L., and (iii) time history analysis. In the first analysis step, the structure’s self-weight is applied as a gravity load, which is computed from the assigned material densities and gravitational acceleration using the static, general procedure to establish the initial in situ stress state of the dam–foundation system. In the second step, full-reservoir conditions are simulated by incrementally applying hydrostatic pressure, p ( y ) , on the upstream face with a depth ( y ) -dependent distribution p ( y ) = ρ g ( H w y ) also under static, general conditions. Finally, in the third step, earthquake effects are represented in a dynamic, implicit analysis by prescribing the ground motion acceleration time history at the foundation base. All dynamics are run with Abaqus/Standard implicit dynamic parameters employed with automatic time incrementation. The initial increment is 0.001 s, with bounds at Δ t m i n = 10−10 s, and Δ t m a x is the time increment of ground motion (i.e., 0.01, 0.005, etc.). Geometric nonlinearity is active (NLGEOM = YES).

2.3. Material Modeling

The material modeling for the Bohyeonsan concrete gravity dam in the finite element analysis incorporates a detailed and realistic constitutive behavior using the Concrete Damaged Plasticity (CDP) model available in ABAQUS. This approach captures both the nonlinear compressive and tensile behaviors, including cracking, crushing, and stiffness degradation, which are critical in simulating the seismic response of large-scale concrete structures such as gravity dams. The CDP model, a continuum plasticity-based damage model, accurately captures the complex behavior of concrete and is widely recognized as an effective constitutive model for simulating its nonlinear response [1,35,36,37,38,39]. The concrete dam body is represented using the CDP model, while both the reservoir and foundation are modeled with linear elastic materials, providing appropriate boundary conditions for the fluid–structure and soil–structure interactions.
The dam body is constructed using two types of concrete, each defined separately in the model: the inner core concrete, with lower strength and stiffness, and the outer shell concrete, with higher mechanical capacity. The basic material properties of the dam body (inside and outside) were taken from Cao et al. [31], Nahar et al. [38], and Nguyen et al. [40]. The mechanical properties used in the model for both zones of concrete are summarized in Table 1.
For the concrete domain within the CDP model, several initial plasticity parameters were defined. These included a dilation angle ( ψ ) of 36°, a flow potential eccentricity ( ϵ ) of 0.1, a biaxial-to-uniaxial-strength ratio ( f b 0 / f c 0 ) of 1.16, and a ratio of the second stress invariant on the tensile meridian ( K ) of 0.667 [41].
To simulate the compressive behavior of the concrete, the Popovics [42] model was applied, which provides a nonlinear stress–strain relationship capturing both the hardening and softening phases of concrete under compression. According to Popovics [42], the compressive stress ( σ c ) of normal concrete can be analyzed at any given point of compressive strain ( ε c ) using Equation (1) as follows:
σ c = f c n η n 1 + η n
where η = ε c ε c 0 , ε c 0 = 2.7 × 10 4 f c 4 and n = 0.4 × 10 3 f c .
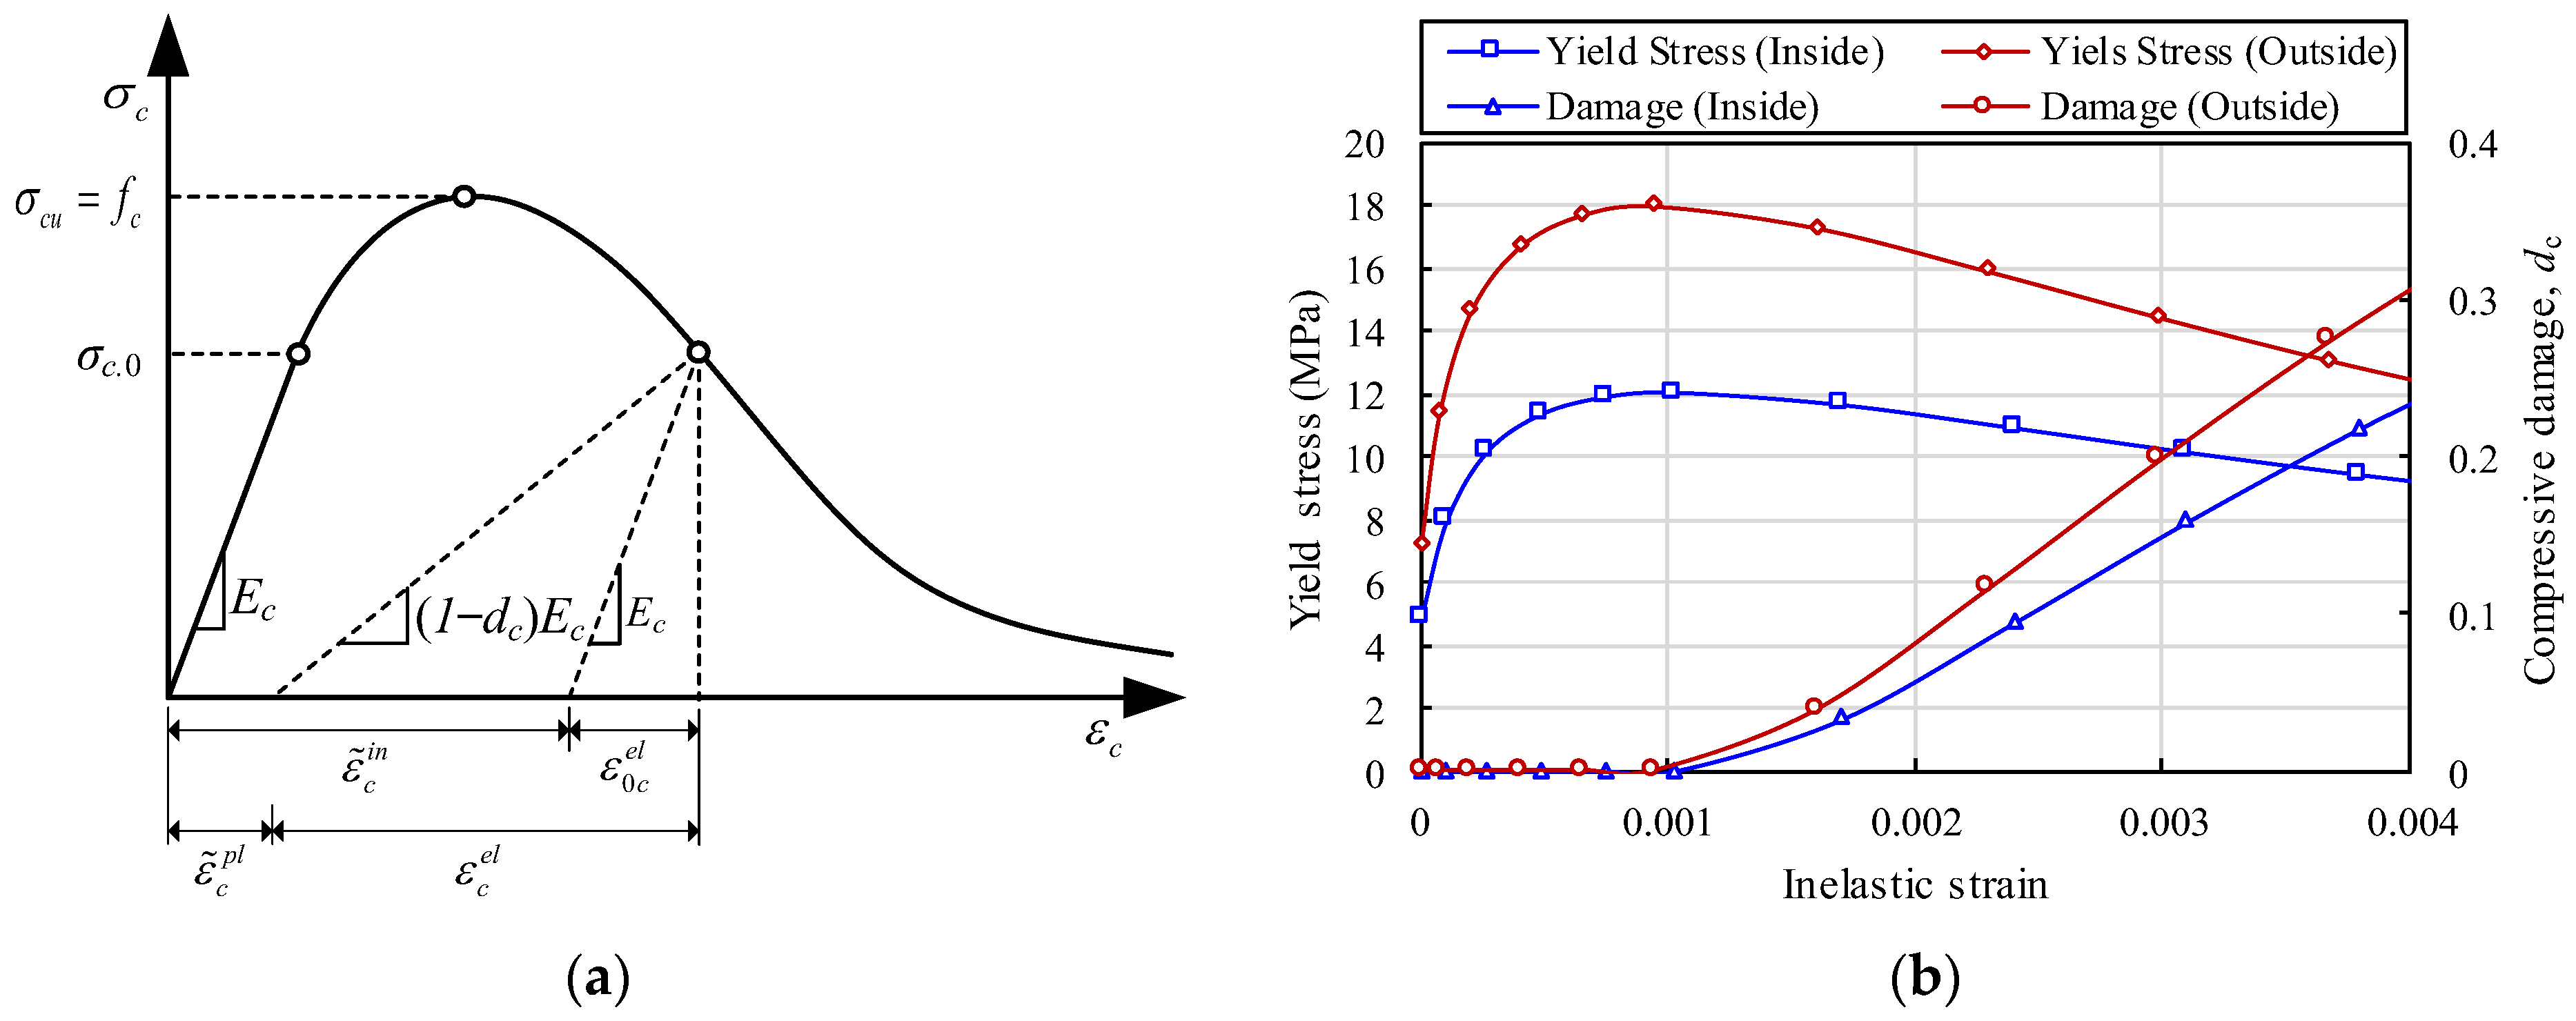
The compressive damage parameter ( d c ) at each inelastic strain level is specified, ranging from 0 (no damage) to 1 (full crushing damage). Equation (2) is used to calculate the d c value, as shown in Figure 4a [43,44].
d c = 0 [ ε c < ε c 0 ] 1 σ c f c [ ε c ε c 0 ]
Equation (3) in ABAQUS automatically converts inelastic strain to plastic strain values. The resulting plastic strain ( ε ~ c p l ) must always be positive and cannot decrease with increasing inelastic strain.
ε ~ c p l = ε ~ c i n d c 1 d c σ c E c
The uniaxial compressive yield stress–inelastic strain relationship, along with the corresponding damage evolution curves for the concrete utilized in this study, is presented in Figure 4b.
In the case of the stress–strain softening behavior of concrete, a multilinear relationship as presented in Figure 5a was adopted from Allam et al. [45].
To obtain the cracking stain ( ε ~ c i n ) used in the CDP model, as represented in Figure 5b, the elastic strain ( ε 0 t e l ) is deducted from the total tensile strain ( ε t ) as shown in Equation (4):
ε ~ t i n = ε t ε 0 t e l
where the elastic strain can be found using Equation (5):
ε 0 t e l = σ t E c
The tensile damage parameter ( d t ), like the compression damage parameter, must be specified at each cracking strain, which can be calculated from Equation (6):
d t = 0 [ ε t < ε c r ] 1 σ t f t [ ε t ε c r ]
where ε c r is the tensile stress at the initial tensile strength, which can be found using Equation (7):
ε c r = f t E c m
The plastic strain in tension stiffening (Figure 5b) is also automatically converted in ABAQUS from cracking strain using Equation (8), which should always be positive.
ε ~ t p l = ε ~ t i n d t 1 d t σ t E c
The tensile stress–strain and damage data presented in Figure 5c were used in the CDP to define the tensile stiffening of concrete in this study. The following are the stress–strain relationships under uniaxial compression and tension loading:
σ c = 1 d c E c ε c ε ~ c p l
σ t = 1 d t E c ε t ε ~ t p l

2.4. FEM Evaluation

The FEM evaluation for the Bohyeonsan concrete gravity dam is a critical step in ensuring the reliability and accuracy of the numerical simulation results. In this study, evaluation is primarily carried out by comparing the first modal frequency and mode shapes of the developed 2D FEM with those reported in previous validated studies and references. The first natural frequency of a structure is a key dynamic characteristic that reflects its stiffness, mass distribution, and boundary conditions. Accurate prediction of this parameter indicates that the model correctly represents the physical behavior of the dam. In the current study, the first modal frequency ( f 1 ) of the Bohyeonsan Dam model was computed through modal analysis using ABAQUS.
The first modal frequency obtained from the finite element model developed In this study was validated by comparing it with results from the existing literature, particularly the work of [46], who developed a simplified approach for the natural vibration period of the DFR system. In their study, the natural vibration period ( T ~ 1 ) can be approximated by
T ~ 1 = T 1 R r R f T 1
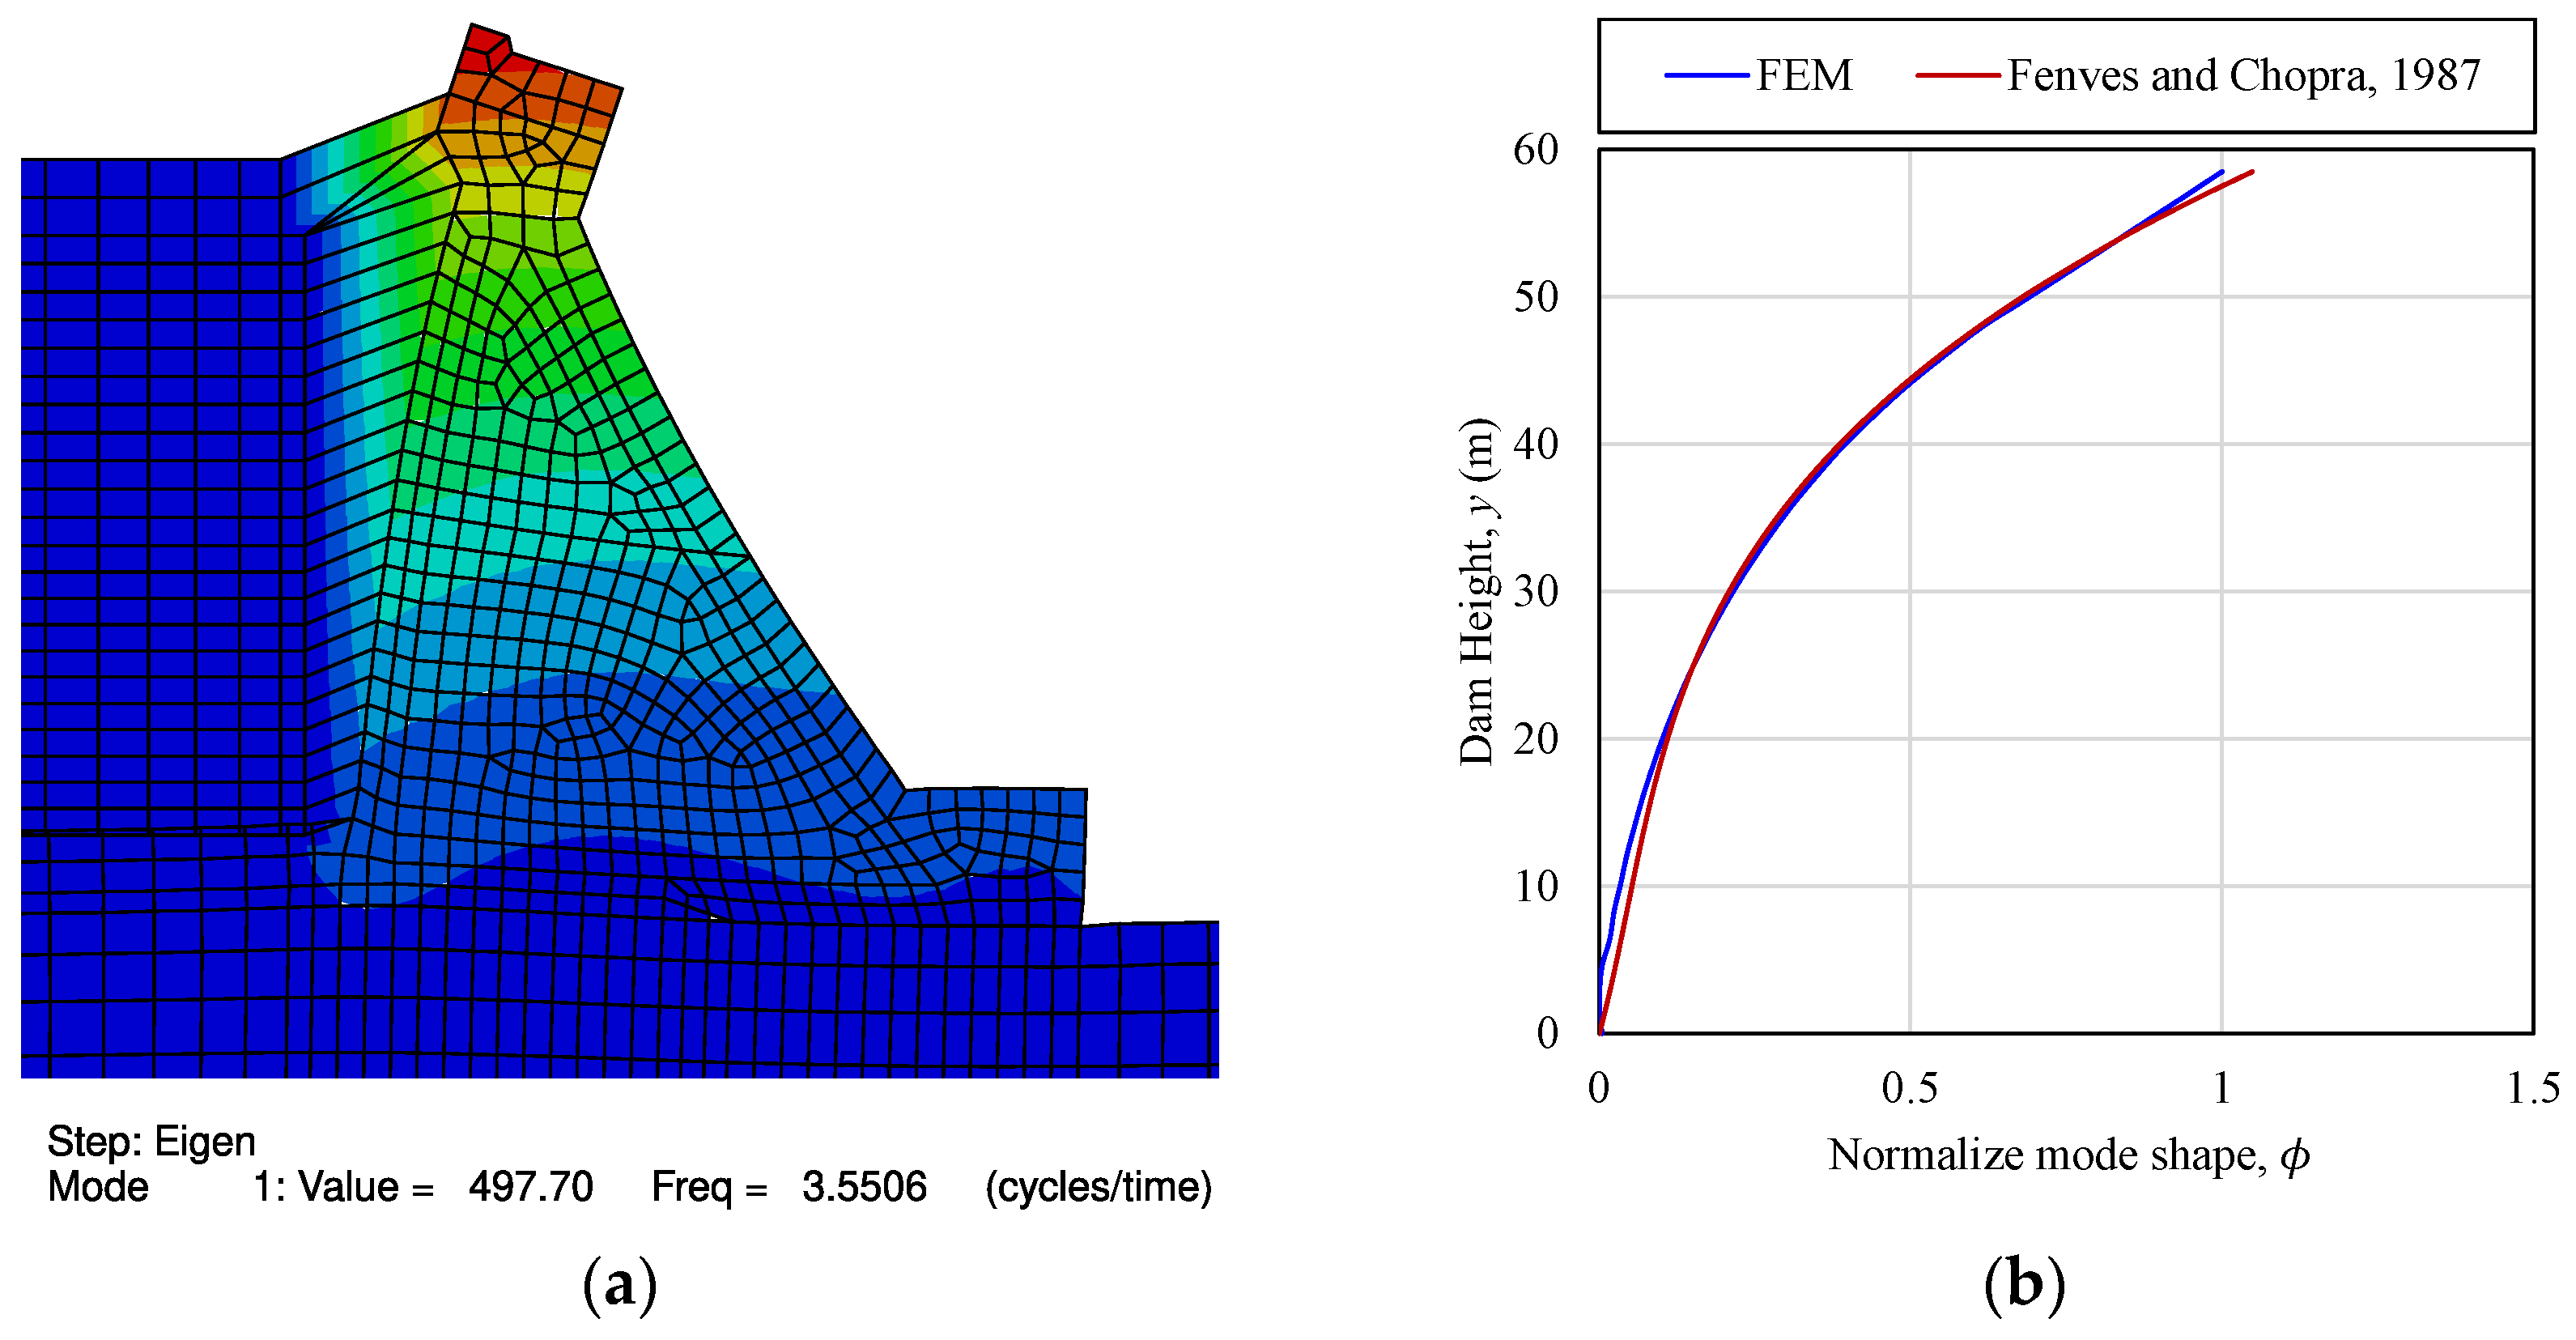
where T 1 ( s ) = 0.38 H / E c is the fundamental vibration period of a rigid rock and an empty reservoir system. R r and R f represent the reservoir period-lengthening factor and foundation flexibility factor, respectively. The values of R r = 1.11 and R f = 1.19 are gathered from information provided by Fenves and Chopra [46]. Using this formulation, the calculated first modal frequency for the Bohyeonsan Dam is 3.98 Hz (period, T ~ 1 = 0.251 s). From the ABAQUS analysis, the value of F 1 is 3.551 Hz (Figure 6a), which shows a variation of around 10%. The close agreement between this analytical estimate and the modal analysis result from the FEM confirms the accuracy and reliability of the developed numerical model in capturing the dam’s dynamic characteristics.
To further validate the finite element model of the Bohyeonsan Dam, a comparison of the first-mode shape was conducted against the standard reference provided by Fenves and Chopra [47]. Fenves and Chopra’s [47] guidelines offer a benchmark for evaluating the dynamic behavior of concrete gravity dams by providing idealized mode-shape patterns, particularly for the fundamental mode, which typically governs the dynamic response during seismic events. The first-mode shape ( ϕ ) can be calculated using Equation (12):
ϕ = 0.357 y H 0.53236 y H 2 + 1.17415 y H 3
where H is the dam height and y is the height above the base. The mode shape obtained from the FEM closely matches this pattern as per Equation (12), as depicted in Figure 6b, confirming that the mass and stiffness distribution, boundary conditions, and dam have been accurately modeled.
This agreement between the numerically obtained mode shape and the Fenves and Chopra [47]-recommended pattern strengthens the validity of the developed FEM. It confirms that the model reliably captures the fundamental dynamic behavior of the Bohyeonsan Dam, making it suitable for further use in time history analyses, fragility curve development, and seismic risk assessments.
The dam and foundation are meshed with CPE4R (reduced integration) elements, which employ built-in hourglass control in Abaqus/Standard. Although reduced integration is more computationally efficient than full integration, it presents a significant hourglass issue that necessitates the use of artificial stiffness in order to withstand this nonphysical deformation [48]. To quantify any spurious zero-energy deformation, the hourglass contribution, as the ratio ( r H G t ) of hourglass energy (( E H G t ) to total energy (defined as internal ( E i n t t ) + kinetic ( E k i n t ) + hourglass energies), as calculated by Equation (13), is quantified.
r H G t = E H G t E i n t t + E k i n t + E H G t × 100 ( % )
In Abaqus/Standard, E H G = ALLAE (artificial strain energy), E i n t = ALLIE (internal energy) =ALLAE, and E k i n t = ALLKE (kinetic energy). Since ALLAE is included in ALLIE in Abaqus’ energy accounting, the same ratio is computed as
r H G t = A L L A E t A L L I E t + A L L K E t × 100 ( % )
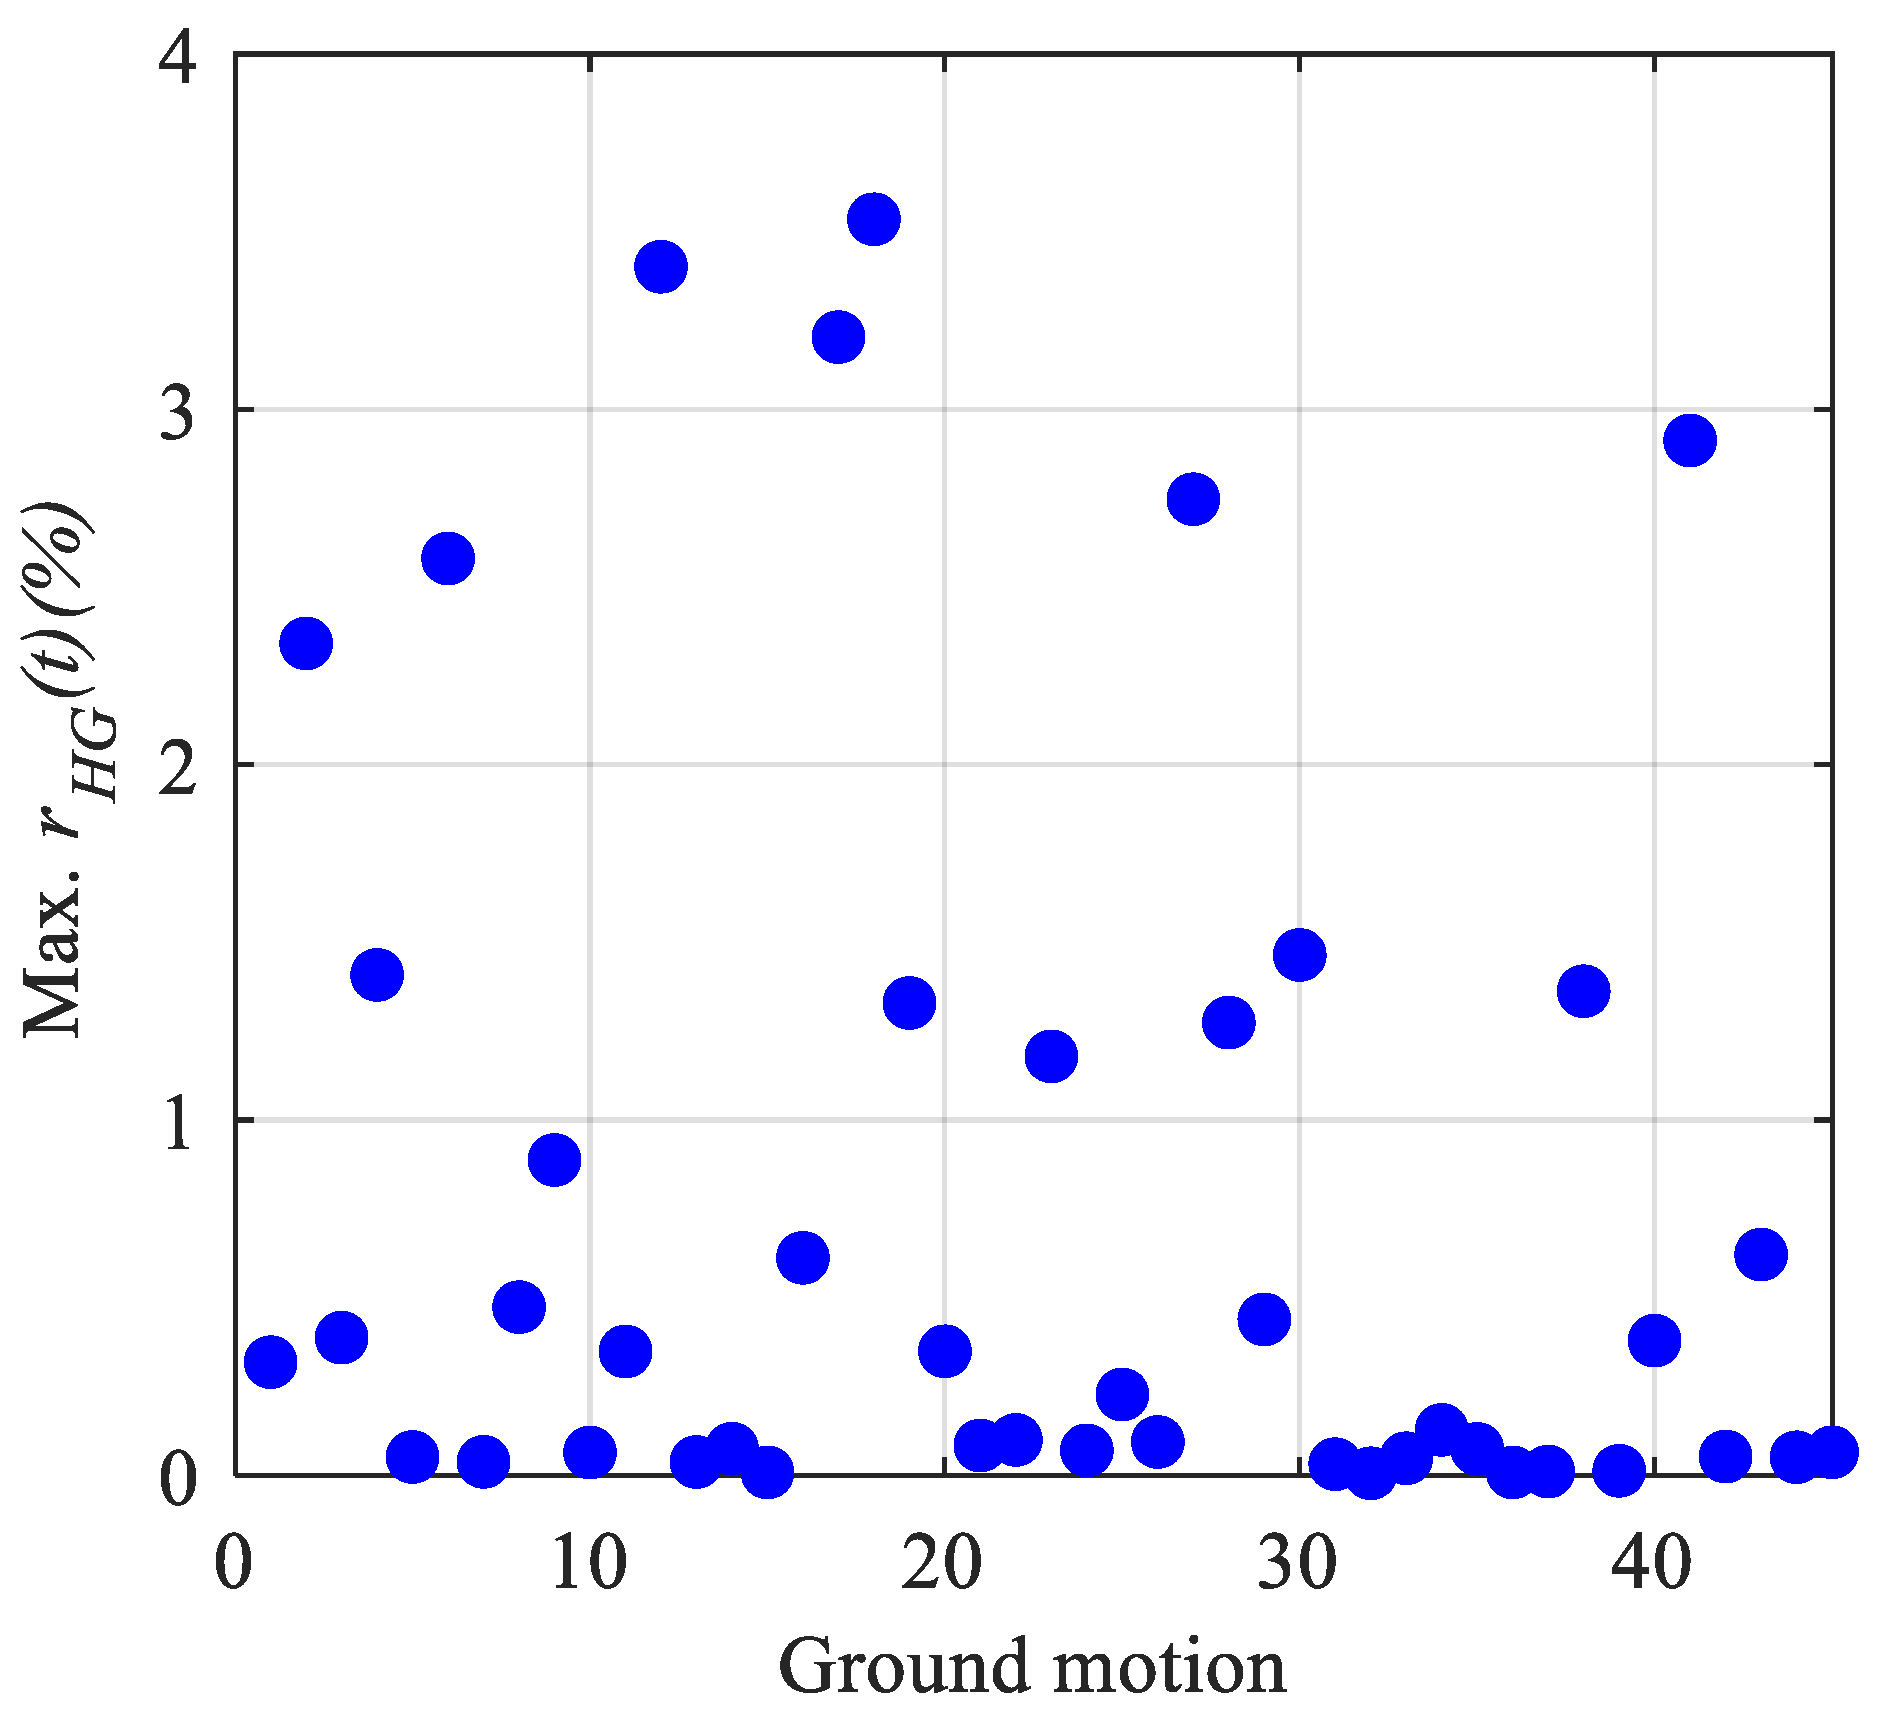
Generally, it is preferable to maintain this ratio much below 5%. In this study, we found that the maximum value of r H G t for all selected ground motions at a height intensity level of 0.5 g is 3.53%, as presented in Figure 7. This indicates that spurious hourglass modes are effectively suppressed and do not contaminate the reported response measures, i.e., EDP.
The model is intended to quantify comparative effects of ground motion duration and frequency content on crest-drift demand, fragility (probability of exceeding an extensive damage drift threshold), and site-specific risk via hazard convolution for the Bohyeonsan cross-section under a 2D plane-strain DRF idealization. Briefly, the Verification, Validation, and Uncertainty Quantification (VVUQ) workflow and credibility statement is mentioned below:
  • FSI sign and coupling sanity check: Code/algorithm verification is used, where static hydrostatic preload recovers p ( y ) = ρ w g ( H w y ) on the wet face, and dynamic reservoir uses acoustic elements with a non-reflecting boundary (impedance ρ w c ), confirming pressure-to-traction transfer and normal-acceleration compatibility.
  • Ground motion scaling loader: Ground motion scaling uses s k = P G A / P G A r a w applied via amplitude and prescribed base acceleration; pre-checks confirm target PGA at each IDA level. Energy outputs (ALLIE/ALLKE/ALLAE) are physical.
  • Mesh/time-step convergence: Mesh is graded (≤2 m near heel/toe and wet interface); automatic time-stepping resolves dominant periods. Stability under halved Δ t was confirmed on representative records.
  • Hourglass control: The hourglass-to-mechanical-energy ratio stayed below 5% (max 3.53% at 0.5 g), indicating negligible spurious modes.
  • Modal reasonableness: Finite element eigen frequency f 1 = 3.551 Hz agrees within ~10% with the Fenves and Chopra [46] analytical estimate of f 1 = 3.98 Hz; the first-mode shape matches the canonical profile.
  • Model-form justification: A two-dimensional plane-strain DRF with acoustic reservoir and a foundation domain to ±2H (base fixed) is used; lateral u x = 0 , u y free represents stiff canyon confinement; far-reservoir impedance boundary emulates radiation damping. This captures global DRF coupling while omitting explicit contraction/lift–joint contact and vertical input; interpretation is bounded accordingly within the 0.05–0.50 g pre-collapse window.
  • Due to the lack of original responses recorded from experimental data of the Bohyeonsan Dam, here, analytical/benchmark comparisons are carried out: fundamental frequency and mode-shape benchmarks are examined via the Fenves and Chopra method.
  • Sources and classification: Aleatory record-to-record variability within duration/frequency bins was captured in fragility dispersion β . Epistemic CDP parameters, foundation/boundary idealization, model form (2D), and hazard curve were used.
  • Estimation (fragility): Binary exceedances from IDA are fit to a well-established lognormal fragility.
  • Sensitivity: Group contrasts (LD/MD/SD; LF/MF/HF) quantify sensitivity to duration/frequency; qualitative checks note potential influence of lateral-boundary idealization and reservoir radiation modeling.
  • Propagation to risk: Fragilities are convolved with the site hazard curve; crack propagation of fragility and hazard uncertainty is noted as a straightforward extension.
  • Credibility statement: Comparative duration/frequency effects on drift-based fragility and risk for the Bohyeonsan monolith under 2D DRF are examined. Mesh/time-step/energy diagnostics are used, with an r A E max of 3.53% (<5%); frequency and mode-shape benchmarks (~10% agreement); transparent fragility fitting with lognormal distribution; and a documented record of metadata and scaling. Applicability within the range for IM of 0.05–0.50 g was examined, with horizontal input, no joints/vertical, and 2D DRF with lateral confinement idealization.

3. Selection of Ground Motion

In this study, ground motions are curated to be consistent with the site hazard context before they are partitioned by duration and frequency content. Specifically, (i) only shallow-crustal records are drawn from PEER NGA-West2 [49], (b) stations whose site conditions are compatible with the dam’s rock/stiff-soil setting are retained, (c) for plausible scenario ranges in magnitude and distance are screened for the region, and (d) spectral-shape proximity to a reference rock target spectrum is required around the dam’s fundamental period T 1 . From this hazard-aware pool, motions are then stratified by significant duration D 5 95 and frequency content (PGA/PGV), which are the attributes under study.
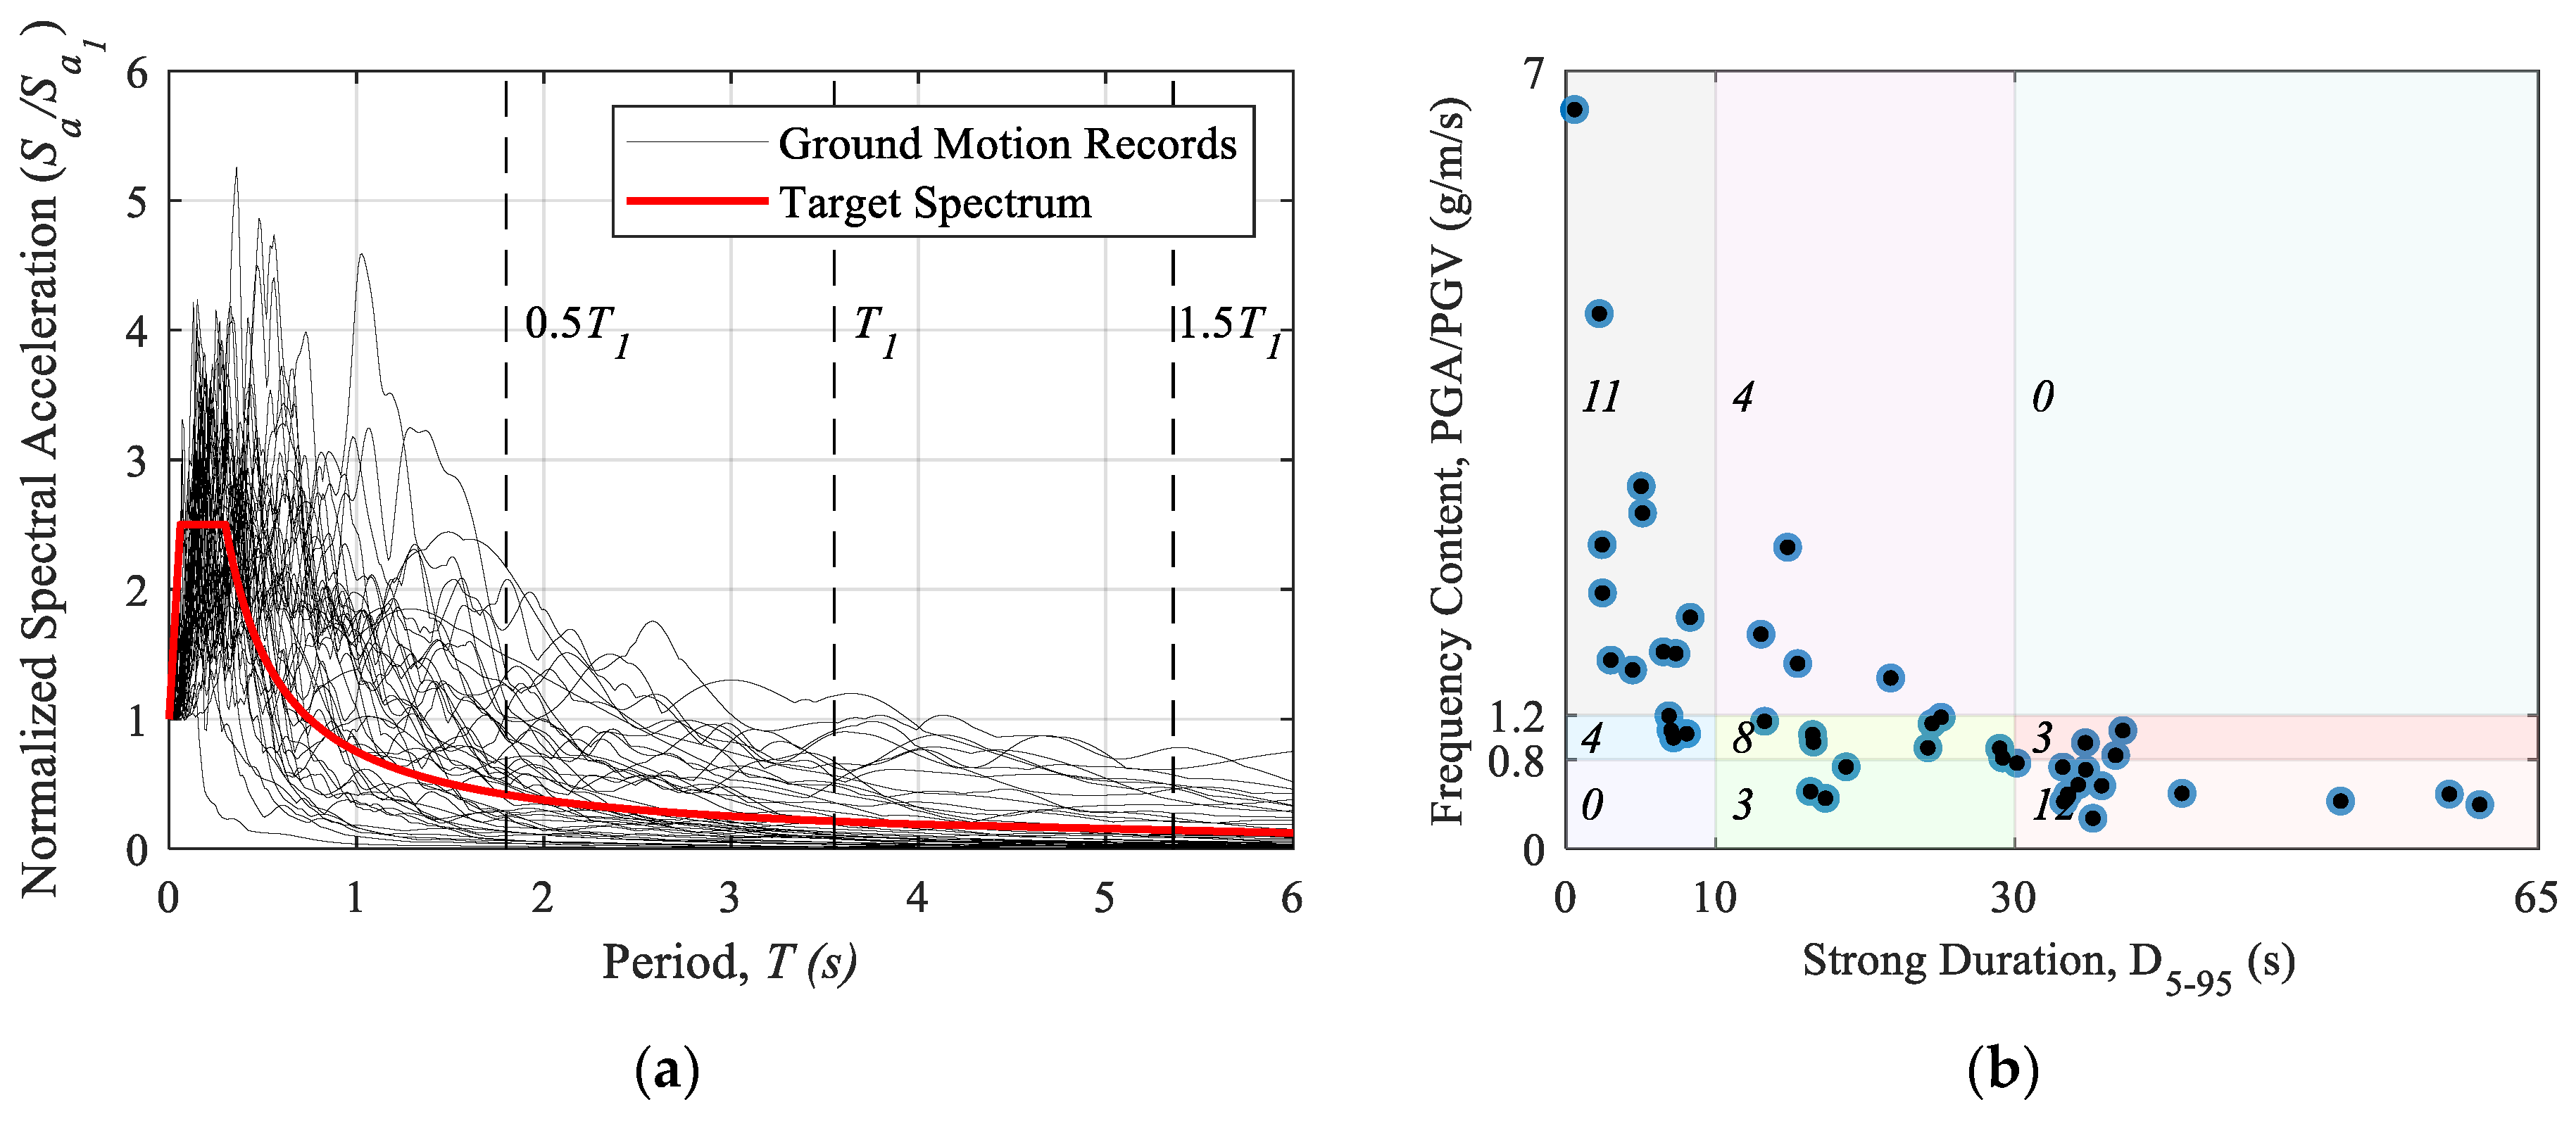
Forty-five recorded accelerograms were taken from PEER NGA-West2, as presented in Figure 8 also the key parameters of the selected ground motions are enlisted in Table 2. To align with site conditions, we retained rock/stiff-soil stations by V s 30 and shallow-crustal tectonics. Scenario reasonableness was enforced by keeping magnitude–distance combinations representative of the regional shallow-crustal hazard. The realized medians (with inter-quartile ranges, IQRs) in Table 3 confirm this: for the duration groups, M ≈ 6.69 [0.77] (LD), 6.00 [1.00] (MD), and 6.00 [1.07] (SD); R r u p ≈ 86.31 km [74.54] (LD), 34.98 km [50.09] (MD), and 15.96 km [37.37] (SD); and V S 30 ≈ 280.56 m/s [129] (LD), 219.31 m/s [65.49], and (MD), 486 m/s [278.98] (SD). The frequency groups show similar shallow-crustal ranges: R r u p ≈ 22.94–86.31 km, M ≈ 6.0–6.63, and V S 30 medians ≈ 219–477 m/s. These statistics indicate that the set is tectonically and geotechnically compatible with the site context rather than an arbitrary convenience sample.
To keep duration and phase intact, no spectral matching was performed. Instead, we tested the representativeness of each subgroup against the KDS 17 41 00 [50] design response spectrum for rocks as the target, with 5% damping, used here as a reference target in the neighborhood of the dam’s fundamental period T 1 = 0.28 s ( f 1 = 3.551 Hz) as shown in Figure 8. For each group, the set-average spectrum S a ( T ) is formed and the RMS logarithmic spectral misfit is computed as
μ s p e c = 1 T u T l T l T u ln S a ( T ) S a t a r g e t ( T ) 2 d T
over the band [ T l = 0.5 T 1 , T l = 1.5 T 1 ] (≈0.14 to 0.42 s). Groupwise results in Table 3 show μ s p e c values between 0.11 and 0.18 (e.g., LD = 0.14, MD = 0.11, SD = 0.18; HF = 0.14, MF = 0.13, LF = 0.17), i.e., ≈±11–18% RMS in log-space near T 1 . It is considered that μ s p e c ≲ 0.20 is an acceptable proximity for the pre-collapse intensity window used here. Thus, the selected sub-sets are spectrally representative of the KDS 41 rock target around T 1 while preserving the record characteristic.
For duration-based classification, the ground motions were categorized using the significant duration ( D 5 95 ), which represents the time interval during which 90% (5% to 95%) of the total Arias intensity is accumulated, effectively capturing the duration of strong energy input. Based on this metric, three categories were defined: long duration (LD) for motions with a significant duration greater than 30 s ( D 5 95 > 20 s), medium duration (MD) for durations between 10 and 30 s ( 10 D 5 95 20 s), and short duration (SD) for durations less than 10 s ( D 5 95 < 10 s). This classification ensures that the study considers a wide range of energy input characteristics, from impulsive to prolonged shaking, which is crucial for understanding cumulative-damage effects in concrete dams.
In addition to duration, the selected ground motions were also categorized based on their frequency characteristics, using the ratio of peak ground acceleration to peak ground velocity (PGA/PGV) as an indicator of dominant frequency content. A higher PGA/PGV ratio corresponds to a higher-frequency ground motion, while a lower ratio indicates dominance of low-frequency components. Accordingly, the frequency classification was divided into three groups: high frequency (HF) for motions with PGA/PGV > 1.2 g/m/s, medium frequency (MF) for 0.8 g/m/s ≤ PGA/PGV ≤ 1.2 g/m/s, and low frequency (LF) for PGA/PGV < 0.8 g/m/s [16,51,52]. This categorization is particularly important because gravity dams, which generally have long natural periods, are more susceptible to low-frequency ground motions due to resonance effects. By systematically selecting and grouping the 45 ground motions according to both duration and frequency content, there are 15 motions in each subgroup, so the study ensures a robust, multidimensional seismic assessment that captures a broad spectrum of potential earthquake scenarios, consistent with performance-based earthquake engineering principles and recent research methodologies. Key parameters of the selected ground motions are listed in Table 2.

4. Results and Discussion

4.1. Fragility Analysis

To conduct fragility analysis on the Bohyeonsan concrete gravity dam, IDA was conducted using the 45 selected ground motions. Each ground motion was scaled incrementally from 0.05 g to 0.5 g in steps of 0.05 g, resulting in ten intensity levels per record. For each record with raw PGA ( P G A r a w ), scaled series are defined for target levels PGA ∈ {0.05 g, 0.10 g, …, 0.50 g}. The scale factor is s k = P G A / P G A r a w , and the scaled acceleration series is a k t = s k a r a w . The scaled a k t is supplied as time–acceleration pairs through an AMPLITUDE object and applied as prescribed base acceleration (BOUNDARY, TYPE = ACCELERATION, x-DOF). Only the upstream–downstream component is used in this study.
The structural response, i.e., EDP was measured in terms of the maximum drift ratio, defined as the difference in horizontal displacement at the dam crest ( u x c r e s t ) and base ( u x b a s e ) divided by the dam height ( u x c r e s t u x b a s e / H ), which serves as a reliable indicator of damage potential in concrete gravity dams.
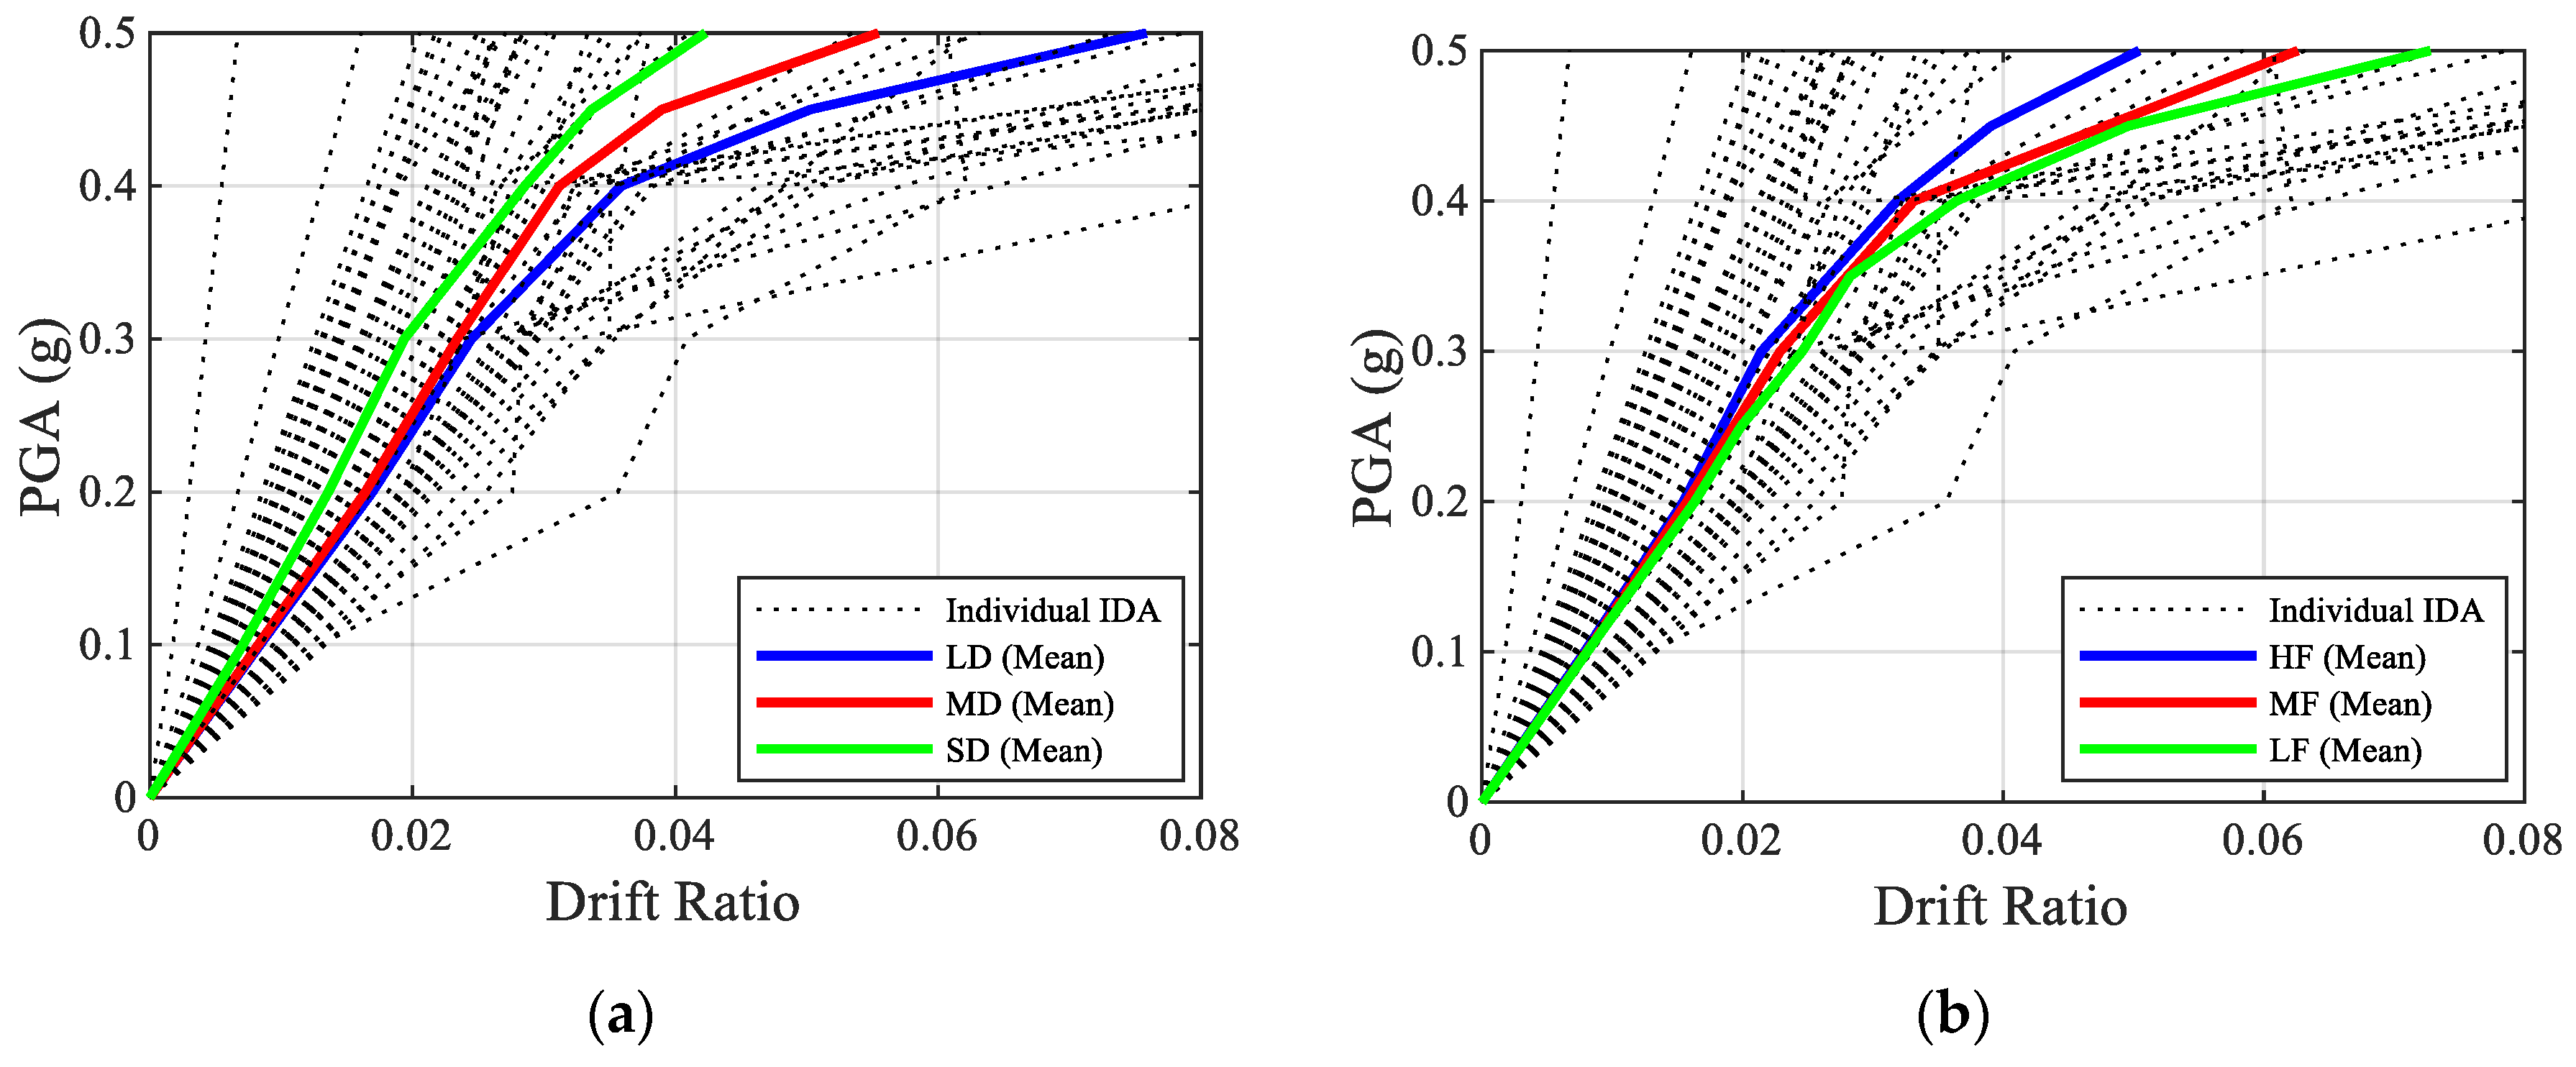
The results of the IDA are presented in a series of PGA vs. drift ratio plots, as shown in Figure 9a,b, grouped according to the classifications of ground motion duration and frequency content.
These plots reveal distinct trends in structural demand. It was consistently observed that long-duration (LD) ground motions produced the highest drift ratios, followed by medium-duration (MD) and short-duration (SD) motions, indicating that longer shaking durations lead to greater energy input and cumulative damage in the dam. Similarly, when categorized by frequency content, low-frequency (LF) ground motions caused significantly higher drift demands compared to medium-frequency (MF) and high-frequency (HF) records. This trend aligns with the natural period characteristics of gravity dams, which are more susceptible to resonance effects under low-frequency inputs. At the upper IM (PGA = 0.50 g), some records reach a crest-drift ratio of 0.08; under the adopted pre-collapse modeling scope (no joints/vertical), these responses remain numerically and physically stable and are therefore interpreted as “beyond extensive” rather than collapse.
These results highlight the critical role of both shaking duration and dominant frequency in influencing the seismic response of gravity dams. The IDA curves confirm that under equivalent PGA levels, long-duration and low-frequency motions can induce higher damage demands, even at moderate intensity levels. These findings underscore the importance of considering record characteristics beyond peak acceleration in performance-based design and assessment.
In this study, fragility analysis was performed to quantify the probability of the Bohyeonsan Dam exceeding a defined damage threshold under varying levels of seismic intensity. The analysis was based on results of IDA, with the Engineering Demand Parameter (EDP) taken as the maximum drift ratio of the dam, and the intensity measure (IM) defined as the peak ground acceleration (PGA).
The fragility function adopted Is the standard lognormal cumulative distribution, which relates the probability of exceeding a damage state to a given level of ground motion intensity. The probability of failure, P f , can be expressed by Equation (16) [53,54,55].
P D d I M = ϕ ln I M θ l n ( θ ) β
Here, ϕ represents the standard normal cumulative distribution function, which determines the probability that the seismic demand ( D ) will exceed a given threshold ( d ). Parameter θ denotes the median value of IM, i.e., PGA at which the defined damage state is expected to occur; it is commonly referred to as the fragility mean. The variability in this estimate is captured by β which is the logarithmic standard deviation, reflecting the uncertainty in the structural response due to variability in ground motion characteristics and modeling assumptions.
For this analysis, the damage threshold for extensive damage was set at a drift ratio of 0.0477, beyond which the dam may experience severe cracking or instability requiring substantial repair or posing safety risks. Table 4 summarizes the crest-drift thresholds used to classify performance in this study: slight = 0.0128, moderate = 0.0343, and extensive = 0.0477 (all ratios). “Collapse” is not defined by a drift value; consistent with the collapse-fragility literature, it denotes global instability (loss of equilibrium/solver divergence associated with joint opening/sliding or overturning). Under the present pre-collapse modeling scope (2D DRF, no explicit joints, horizontal input), the model does not exhibit global instability within the analyzed IM range; therefore, the fragility curves in Figure 10 are for LS-Extensive (4.77% drift).
Hariri-Ardebili and Saouma [56] define collapse as a global instability (e.g., loss of equilibrium or divergent response associated with joint opening/sliding, rocking/overturning, or severe localization), and they do not prescribe a single drift value as a collapse threshold. Our model intentionally excludes explicit contraction/lift–joint contact and vertical input as discussed in Section 2, and our IDA window is pre-collapse (PGA ≤ 0.50 g). Consequently, although a few records at the highest IM produce a crest-drift ratio of 0.08 (8%), the numerical solution remains stable, base reactions stay compressive within the contact region, and no loss of equilibrium is observed. We therefore do not assign a collapse LS in this study; instead, exceedance of LS-Extensive (4.77% drift) is reported, and the focus is on how duration or frequency characteristics shift this fragility.
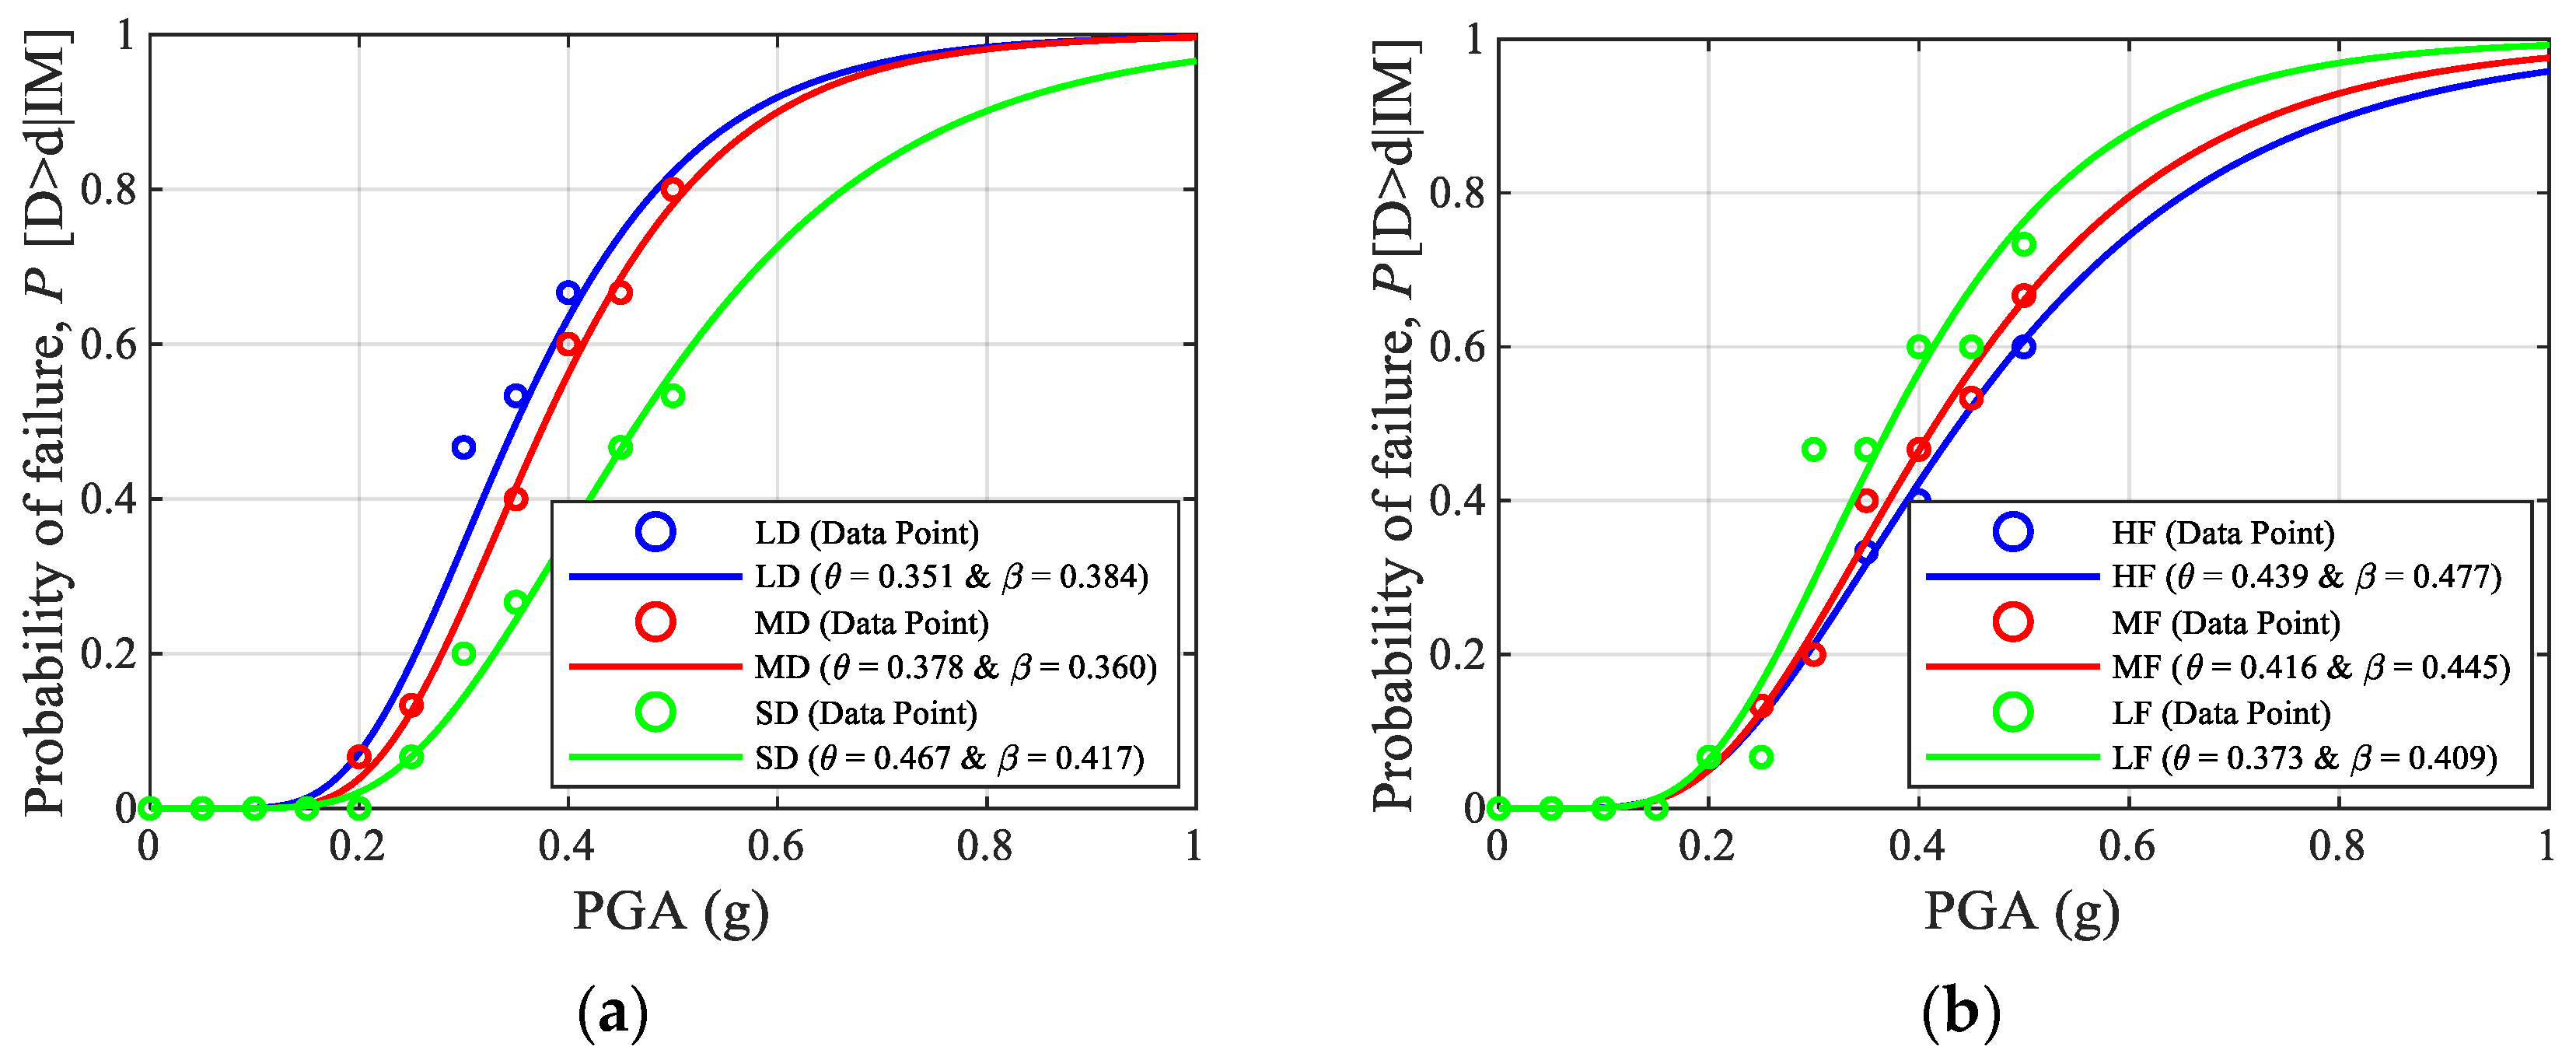
The fragility curves were developed for two primary classifications of ground motions: duration-based groups and frequency-content-based groups. The fragility curves, shown in Figure 10a,b, clearly illustrate the influence of ground motion characteristics on the probability of extensive damage. The results indicate that the LD and LF ground motion groups exhibit higher vulnerability, as evidenced by their lower mean PGA values. Specifically, LD ground motions have the lowest mean threshold of 0.351 g, suggesting that extensive damage is more likely to occur under prolonged shaking compared to MD or SDs. Similarly, LF ground motions, which are more compatible with the natural period of the dam, have a lower mean PGA of 0.373 g, emphasizing their higher potential to induce damaging resonance effects.
Conversely, SD and HF motions show higher median PGA values, indicating comparatively lower probabilities of damage at the same intensity level. This behavior aligns with the dynamic characteristics of concrete gravity dams, which are generally more sensitive to long-period (low-frequency) inputs due to their mass and stiffness properties.
These results underscore the importance of considering both shaking duration and spectral content when evaluating dam vulnerability, as traditional intensity measures like PGA alone may not fully capture the damaging potential of ground motions. The fragility analysis thus provides a probabilistic framework that supports performance-based seismic design and risk-informed decision-making for critical infrastructure like the Bohyeonsan Dam.

4.2. Seismic Risk Assessment

The seismic risk assessment for the Bohyeonsan concrete gravity dam was carried out by integrating the fragility functions with seismic hazard information. This approach allows for the estimation of the annual probability of exceeding a specific damage state due to earthquake ground motions, using a probabilistic convolution of the structural fragility and regional seismic hazard. The annual risk R of exceeding a damage threshold can be computed using Equation (17):
R = 0 P D d I M d λ ( I M ) d I M d I M
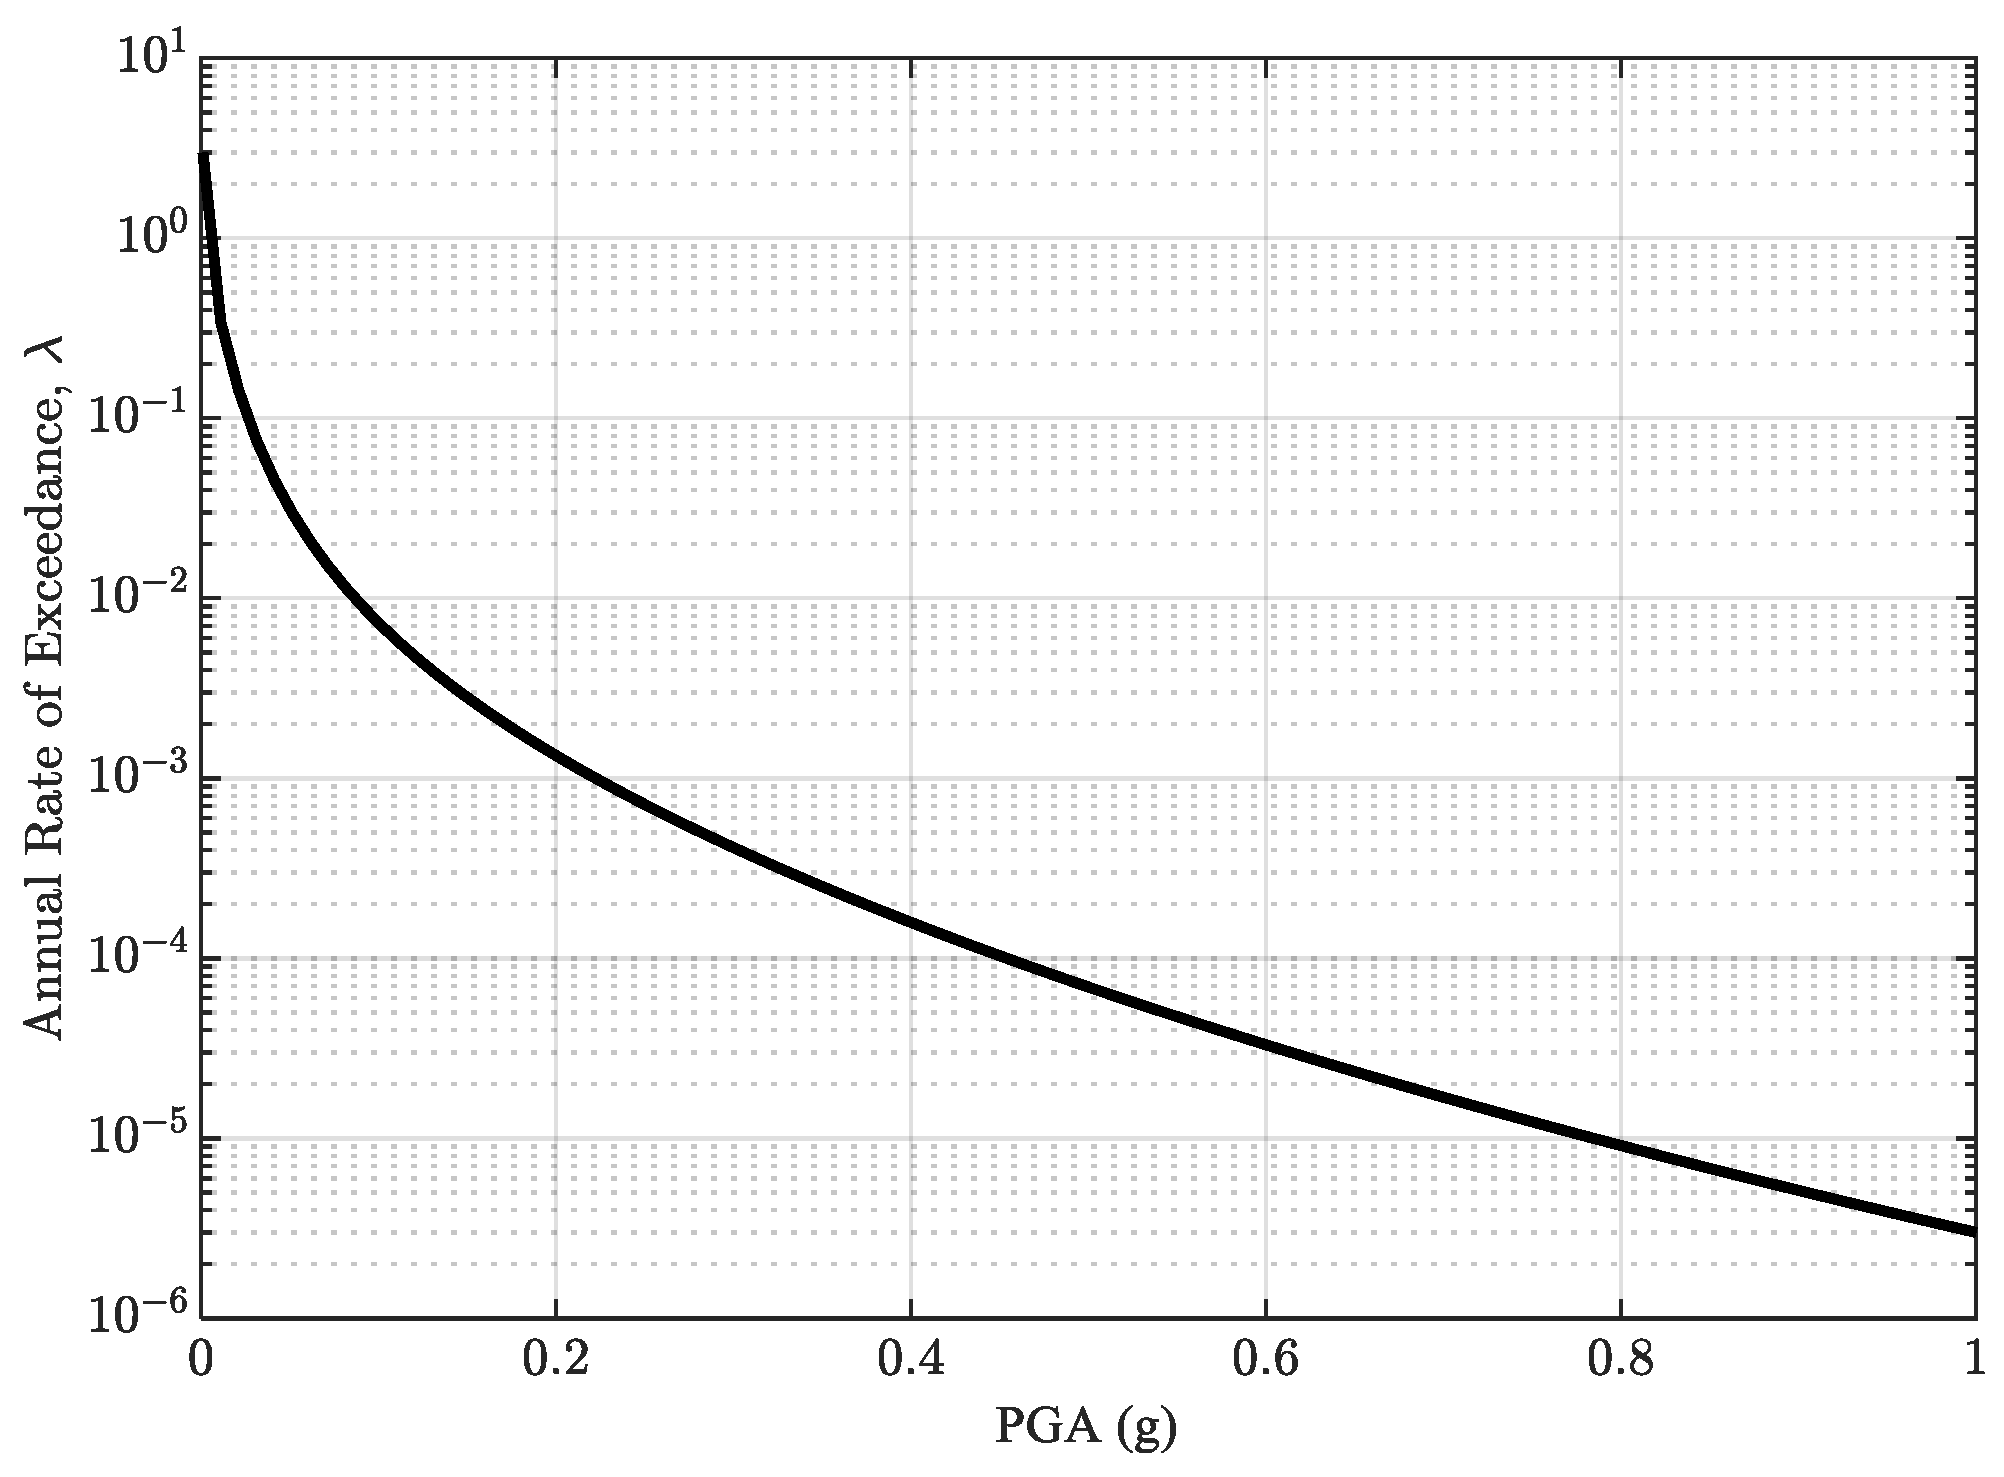
where d λ ( I M ) d I M is the hazard density function, derived from the seismic hazard curve. The seismic hazard curve used for this integration was adopted from Nahar et al. [38], who developed the curve specifically for the Bohyeonsan Dam site using ground motion selection and statistical hazard fitting techniques. The hazard curve, shown in Figure 11, provides the annual frequency of exceedance for various PGA levels.
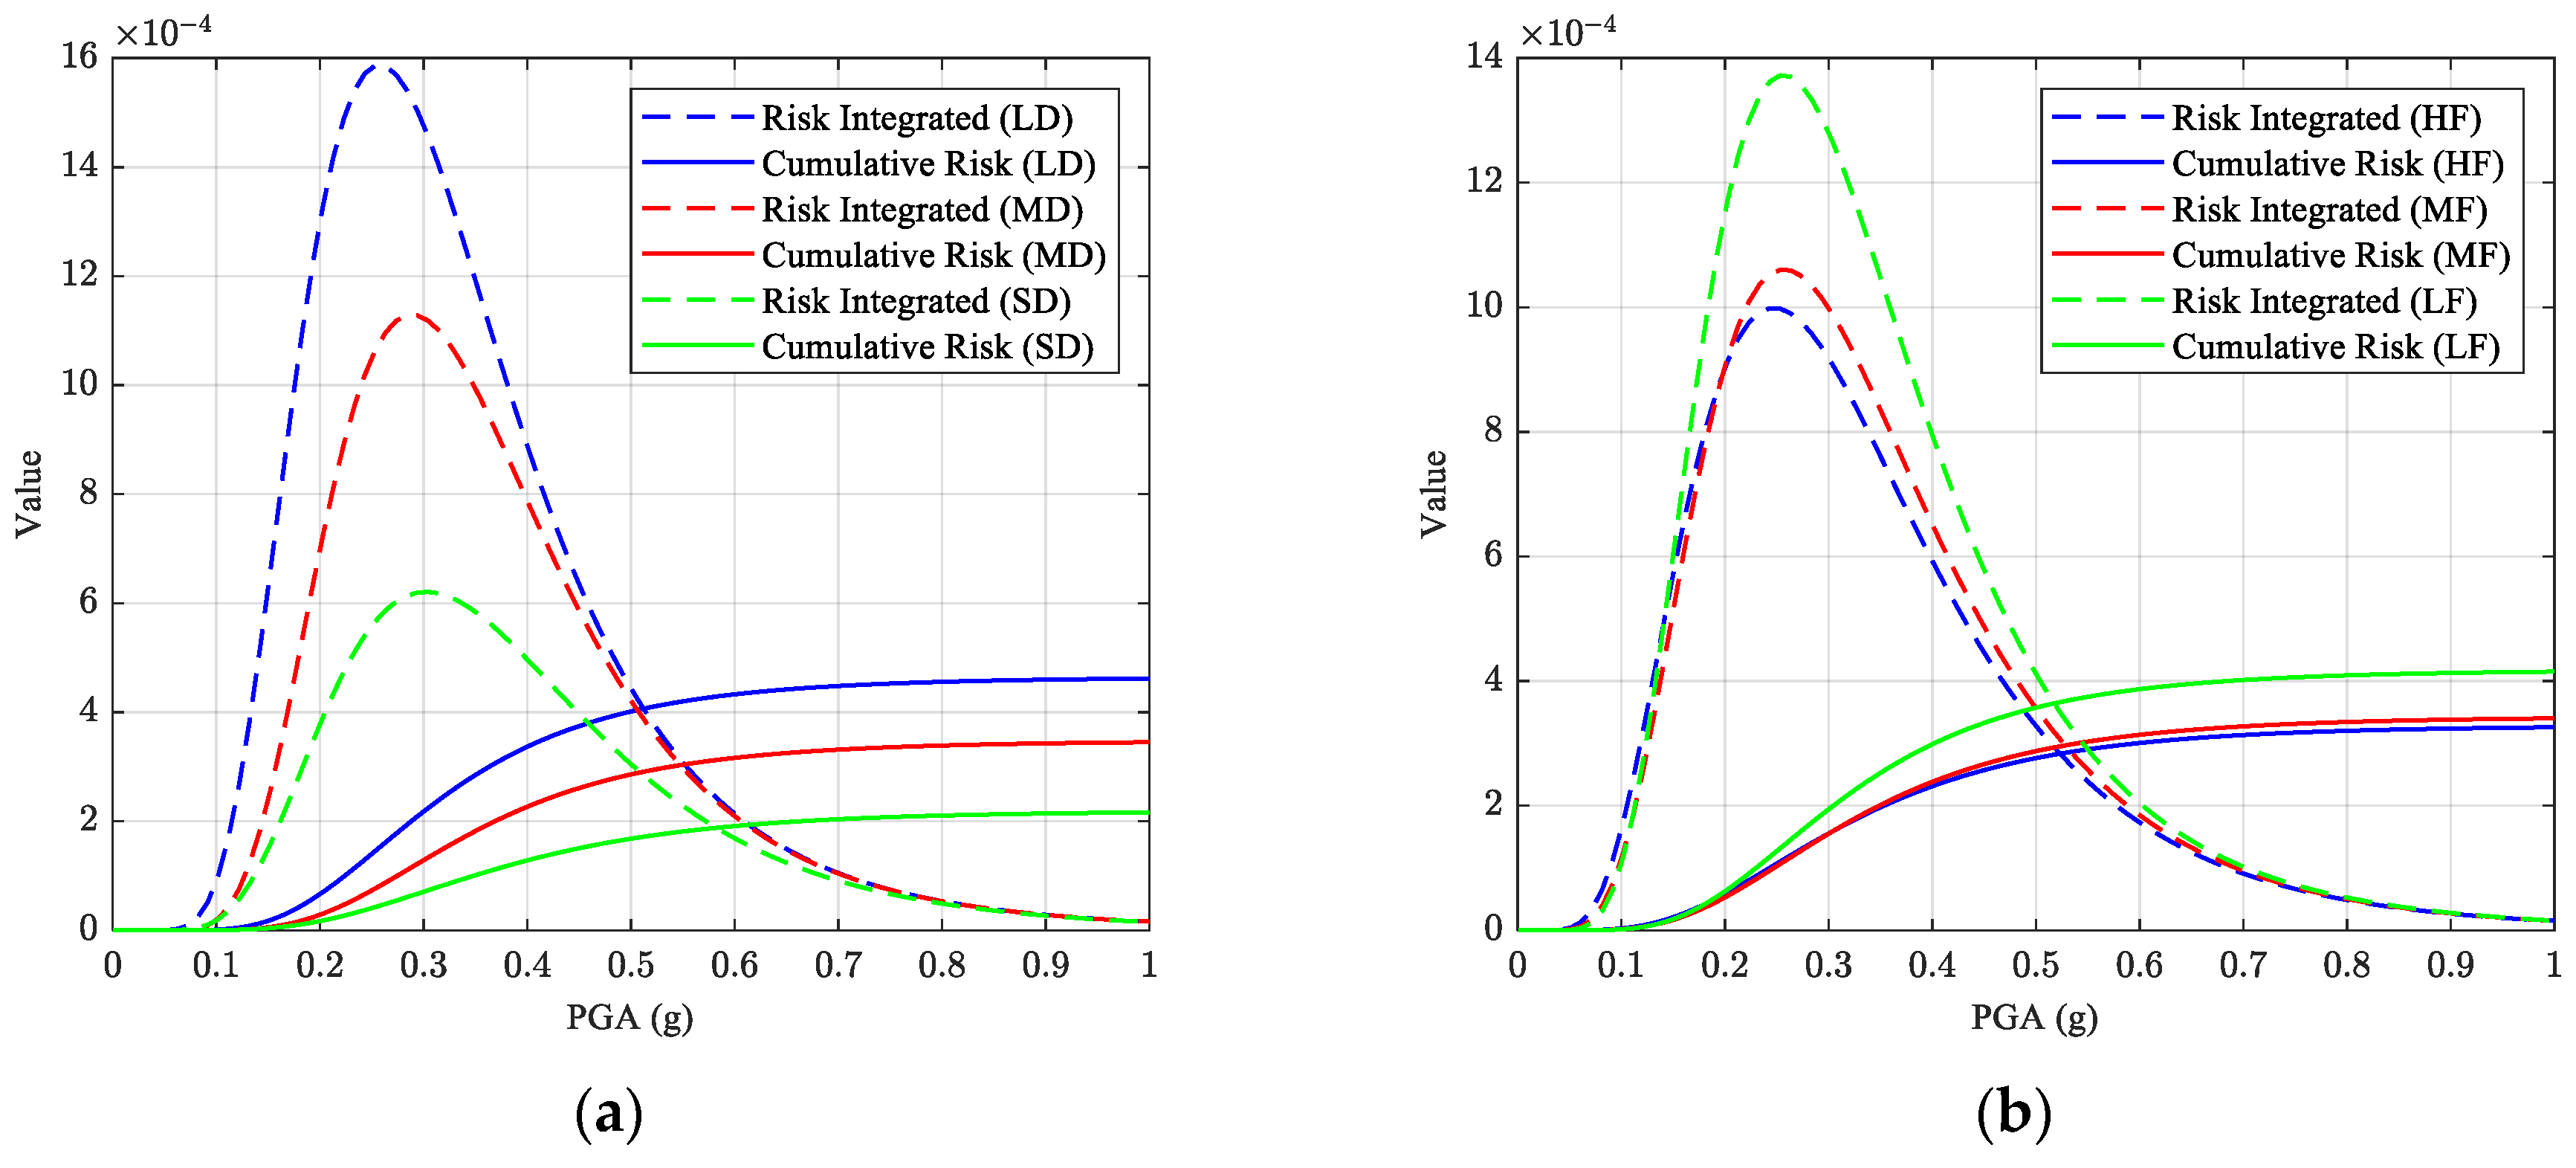
To calculate risk, the fragility curves developed for each category (as detailed in Section 4.1) were convolved with the hazard curve using numerical integration. The resulting risk values, representing the annual probability of exceeding extensive damage, are illustrated in Figure 12a for ground motion duration categories (LD, MD, and SD) and in Figure 12b for frequency-content categories (HF, MF, and LF), with both integrated and cumulative risk curves provided for each.
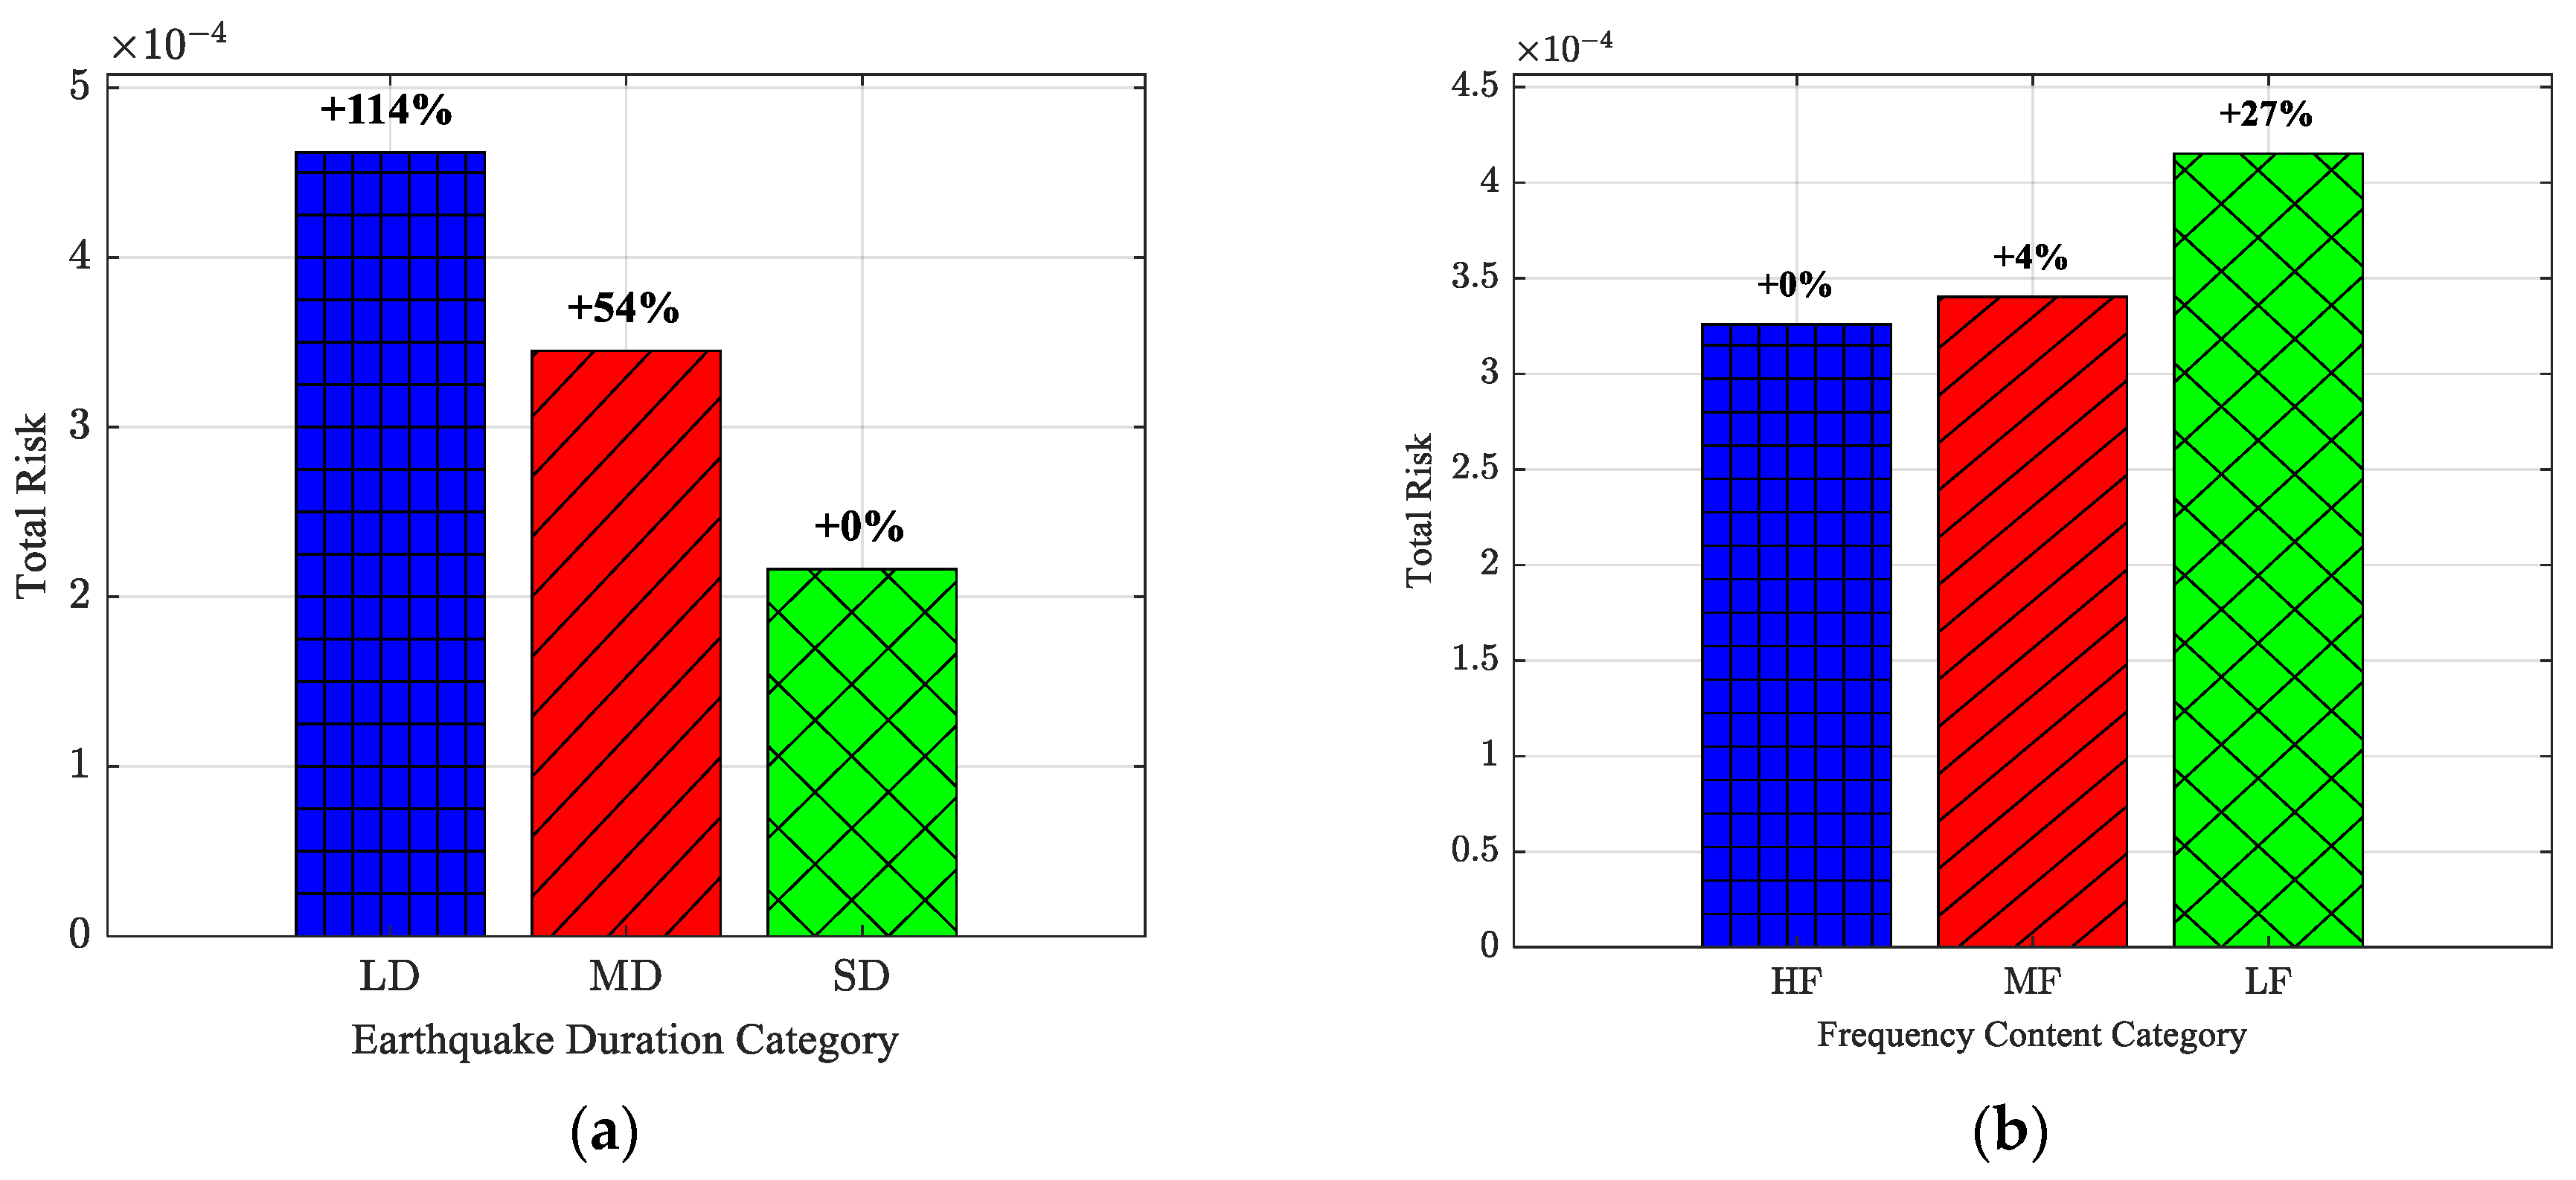
The results indicate that ground motions with a long duration (LD) exhibit the highest seismic risk, with an annual exceedance probability of 0.000462, followed by medium duration (MD) at 0.000345 and short duration (SD) at 0.000216. This means that the total risk associated with LD motions is approximately 114% greater than that of SD, while that associated with MD is 54% greater than that of SD (Figure 13a). This trend reflects the fact that prolonged shaking increases cumulative energy input, exacerbating nonlinear deformation and damage in concrete gravity dams. In contrast to short- or medium-duration motions, LD events subject the structure to a greater number of inelastic cycles, which accelerate stiffness degradation and increase the likelihood of exceeding limit states, even when peak intensity measures are comparable. This duration-driven accumulation of damage explains the increased risk reported during LD motions and is consistent with prior seismic performance assessments of large-scale concrete buildings. These findings emphasize the need to take duration effects into account, especially for subduction-type earthquakes, which have stronger long-duration ground motions.
When categorized by frequency content, the computed risk values are 0.000326 for high-frequency (HF) motions, 0.000340 for medium-frequency (MF) motions, and 0.000415 for low-frequency (LF) motions. Compared to HF motions, the seismic risk from LF ground motions is 27% higher, and that from MF is 4% higher (Figure 13b). These results are consistent with the dynamic properties of gravity dams, which have long natural periods and are therefore more vulnerable to low-frequency seismic inputs that can induce resonance and amplified crest displacements.

5. Conclusions

This study implemented a DRF-consistent nonlinear analysis and PSRA workflow for a concrete gravity dam using 45 recorded motions stratified by strong motion duration (SD/MD/LD) and frequency content (HF/MF/LF). The results in Figure 9, Figure 10, Figure 11, Figure 12 and Figure 13 show that, at the same intensity, long-duration (LD) and low-frequency (LF) motions drive larger crest-drift demands and lower median capacities than short-duration (SD) and high-frequency (HF) motions. Building on these findings, the following actionable steps for practice and future studies are detailed:
Build duration- and frequency-stratified fragilities: Construct separate fragility curves F r a g d ( x ) for duration bins d ∈{SD, MD, LD} (and, when needed, frequency bins f ∈{HF, MF, LF}). Combine them with the site-specific hazard via v L S = d F r a g d ( x ) d λ d ( x ) , where v L S is the annual frequency of exceeding the limit state and d λ d ( x ) is the incremental hazard for motions in bin d . When only the total hazard λ ( x ) is available, use bin weights w d = λ d ( x ) / λ ( x ) from PSHA deaggregation combined with a duration model to partition the hazard among SD/MD/LD. This “analyze once, reweight many” approach lets agencies reuse the same structural results under evolving PSHA inputs.
IMs and reporting: Use PGA (or PGV where appropriate) as the primary IM and report it together with D 5 95 and PGA/PGV for each record group. Publish θ (median capacity) and β (dispersion) per group (as in Figure 10), and provide risk computed by hazard convolution (Figure 12 and Figure 13). This makes the influence of duration/frequency explicit, not hidden inside a pooled curve.
Record selection for NLTHA: Curate recorded motions from the appropriate tectonic regime and site class; check spectral representativeness near T 1 against the code/site target (here, KDS 41 rock) without spectral matching so that duration and phase are preserved. Control the mix of SD/MD/LD and HF/MF/LF so the analysis set reflects the site-expected composition (see Table 3 and μ s p e c ).
Dual design/assessment checks when long duration is non-negligible: If site deaggregation or regional knowledge indicates a non-trivial LD share (e.g., subduction-influenced or large-magnitude sources), verify performance against (i) the overall hazard-weighted fragility/risk and (ii) the LD-conditioned fragility/risk. Where the LD-conditioned check governs, prioritize mitigation that addresses cumulative-damage mechanisms.
Communicate risk with clarity: In addition to a single annual exceedance value, report the contributions by group (e.g., LD vs. SD; LF vs. HF) so decision-makers see what portion of risk is driven by duration or low-frequency content. This facilitates targeted risk reduction and monitoring.
Priorities for future work: Incorporate explicit contraction/lift–joint contact, vertical excitation, and selected 3D DRF effects to define a collapse limit state consistent with collapse-fragility frameworks; explore foundation heterogeneity (random-field properties and stratigraphic dip) and near-fault directivity when relevant. The comparative trends documented here—LD > MD > SD and LF > MF > HF—are expected to remain because they arise from cumulative-damage and quasi-resonance mechanisms identified in our results.
Finally, for sites where both short- and long-duration motions occur, adopt duration-/frequency-stratified fragilities and hazard weighting as standard practice. This yields risk estimates that reflect the real mix of shaking at the site and makes the role of duration and frequency auditable, actionable, and easy to update as hazard models evolve.

Author Contributions

Conceptualization, T.T.N. and M.M.R.; formal analysis, T.T.N. and M.M.R.; funding acquisition, D.K.; methodology, T.T.N.; project administration, D.K.; software, T.T.N. and M.M.R.; supervision, D.K.; validation, T.T.N., M.M.R., and D.K.; writing—original draft, T.T.N.; writing—review and editing, T.T.N., M.M.R., and D.K. All authors have read and agreed to the published version of the manuscript.

Funding

This research was supported by the Basic Science Research Program through the National Research Foundation of Korea (NRF), funded by the Ministry of Education under Grant No. RS-2023-00241517.

Data Availability Statement

The data presented in this study are available upon request from the corresponding author.

Acknowledgments

The authors gratefully acknowledge the financial support provided by the Basic Science Research Program through the National Research Foundation of Korea (NRF), funded by the Ministry of Education under Grant No. RS-2023-00241517. The authors also wish to express their gratitude to Pabna University of Science and Technology (PUST), Bangladesh, for their support and encouragement during this research.

Conflicts of Interest

The authors declare no conflicts of interest.

References

  1. Nahar, T.T.; Cao, A.-T.; Kim, D. Risk assessment of aged concrete gravity dam subjected to material deterioration under seismic excitation. Int. J. Concr. Struct. Mater. 2020, 14, 53. [Google Scholar] [CrossRef]
  2. Hariri-Ardebili, M.A.; Saouma, V.E. Seismic fragility analysis of concrete dams: A state-of-the-art review. Eng. Struct. 2016, 128, 374–399. [Google Scholar] [CrossRef]
  3. Yilmazturk, S.M.; Arici, Y.; Binici, B. Seismic assessment of a monolithic RCC gravity dam including three dimensional dam–foundation–reservoir interaction. Eng. Struct. 2015, 100, 137–148. [Google Scholar] [CrossRef]
  4. Wang, C.; Zhang, H.; Zhang, Y.; Guo, L.; Wang, Y.; Thira Htun, T.T. Influences on the seismic response of a gravity dam with different foundation and reservoir modeling assumptions. Water 2021, 13, 3072. [Google Scholar] [CrossRef]
  5. Raghunandan, M.; Liel, A.B. Effect of ground motion duration on earthquake-induced structural collapse. Struct. Saf. 2013, 41, 119–133. [Google Scholar] [CrossRef]
  6. Trifunac, M.D.; Brady, A.G. A study on the duration of strong earthquake ground motion. Bull. Seismol. Soc. Am. 1975, 65, 581–626. [Google Scholar] [CrossRef]
  7. Bommer, J.J.; MartÍNez-Pereira, A. The effective duration of earthquake strong motion. J. Earthq. Eng. 1999, 3, 127–172. [Google Scholar] [CrossRef]
  8. Chandramohan, R.; Baker, J.W.; Deierlein, G.G. Impact of hazard-consistent ground motion duration in structural collapse risk assessment. Earthq. Eng. Struct. Dyn. 2016, 45, 1357–1379. [Google Scholar] [CrossRef]
  9. Zhang, S.; Wang, G.; Pang, B.; Du, C. The effects of strong motion duration on the dynamic response and accumulated damage of concrete gravity dams. Soil Dyn. Earthq. Eng. 2013, 45, 112–124. [Google Scholar] [CrossRef]
  10. Mohammadnezhad, H.; Saeednejad, N.; Mashayekhi, M. Statistical investigation of the influence of ground motion duration on concrete gravity dam responses by proposing a quantitative index. Structures 2023, 57, 105221. [Google Scholar] [CrossRef]
  11. Akköse, M.; Şimşek, E. Non-linear seismic response of concrete gravity dams to near-fault ground motions including dam-water-sediment-foundation interaction. Appl. Math. Model. 2010, 34, 3685–3700. [Google Scholar] [CrossRef]
  12. Ayati Ahmadi, A.; Noorzad, A.; MohammadNezhad, H.; Mirghasemi, A.A. Seismic fragility of rockfill dams with asphaltic concrete core. Iran. J. Sci. Technol. Trans. Civ. Eng. 2023, 47, 1585–1598. [Google Scholar] [CrossRef]
  13. Wang, C.; Hong, H.; Sherong, Z.; Wang, G. Influence of ground motion duration on responses of concrete gravity dams. J. Earthq. Eng. 2020, 24, 1156–1180. [Google Scholar] [CrossRef]
  14. Wang, G.; Wang, Y.; Lu, W.; Yan, P.; Zhou, W.; Chen, M. A general definition of integrated strong motion duration and its effect on seismic demands of concrete gravity dams. Eng. Struct. 2016, 125, 481–493. [Google Scholar] [CrossRef]
  15. Rathje, E.M.; Abrahamson, N.A.; Bray, J.D. Simplified Frequency Content Estimates of Earthquake Ground Motions. J. Geotech. Geoenviron. Eng. 1998, 124, 150–159. [Google Scholar] [CrossRef]
  16. Zhu, T.J.; Heidebrecht, A.C.; Tso, W.K. Effect of peak ground acceleration to velocity ratio on ductility demand of inelastic systems. Earthq. Eng. Struct. Dyn. 1988, 16, 63–79. [Google Scholar] [CrossRef]
  17. Mavroeidis, G.P.; Papageorgiou, A.S. A mathematical representation of Near-Fault ground motions. Bull. Seismol. Soc. Am. 2003, 93, 1099–1131. [Google Scholar] [CrossRef]
  18. Bayraktar, A.; Altunişik, A.C.; Sevim, B.; Kartal, M.E.; Türker, T.; Bilici, Y. Comparison of near- and far-fault ground motion effect on the nonlinear response of dam–reservoir–foundation systems. Nonlinear Dyn. 2009, 58, 655–673. [Google Scholar] [CrossRef]
  19. Xu, S.; Xu, Q.; Chen, J.; Li, J. Improved endurance time analysis for seismic responses of concrete dam under near-fault pulse-like ground motions. Eng. Struct. 2022, 270, 114912. [Google Scholar] [CrossRef]
  20. Wang, G.; Yan, S.-D.; Li, D.-Q.; Du, W. Seismic performance assessment of high arch dams considering the pulse-like and directionality effects of near-fault ground motions. Eng. Struct. 2024, 321, 119010. [Google Scholar] [CrossRef]
  21. Wang, G.; Zhang, S.; Wang, C.; Yu, M. Seismic performance evaluation of dam-reservoir-foundation systems to near-fault ground motions. Nat. Hazards 2014, 72, 651–674. [Google Scholar] [CrossRef]
  22. Wang, X.; Xue, B.; Xu, B.; Pang, R. Role of strong motion duration on seismic responses of high concrete faced rockfill dams. Structures 2021, 32, 1092–1102. [Google Scholar] [CrossRef]
  23. Ren, S.-P.; Chen, X.-J.; Ren, Z.-L.; Cheng, P.; Liu, Y. Large-deformation modelling of earthquake-triggered landslides considering non-uniform soils with a stratigraphic dip. Comput. Geotech. 2023, 159, 105492. [Google Scholar] [CrossRef]
  24. Ren, S.-P.; Li, Y.; Chen, X.-J.; Cheng, P.; Liu, F.; Yao, K. Large-deformation analyses of seismic landslide runout considering spatially random soils and stochastic ground motions. Bull. Eng. Geol. Environ. 2025, 84, 136. [Google Scholar] [CrossRef]
  25. Sevieri, G.; De Falco, A.; Marmo, G. Shedding light on the effect of uncertainties in the seismic fragility analysis of existing concrete dams. Infrastructures 2020, 5, 22. [Google Scholar] [CrossRef]
  26. Chen, D.-H.; Yang, Z.-H.; Wang, M.; Xie, J.-H. Seismic performance and failure modes of the Jin’anqiao concrete gravity dam based on incremental dynamic analysis. Eng. Fail. Anal. 2019, 100, 227–244. [Google Scholar] [CrossRef]
  27. Bernier, C.; Padgett, J.E.; Proulx, J.; Paultre, P. Seismic fragility of concrete gravity dams with spatial variation of angle of friction: Case study. J. Struct. Eng. 2016, 142, 05015002. [Google Scholar] [CrossRef]
  28. Ganji, H.T.; Alembagheri, M.; Khaneghahi, M.H. Evaluation of seismic reliability of gravity dam-reservoirinhomogeneous foundation coupled system. Front. Struct. Civ. Eng. 2019, 13, 701–715. [Google Scholar] [CrossRef]
  29. Pasbani Khiavi, M. Investigation of the effect of reservoir bottom absorption on seismic performance of concrete gravity dams using sensitivity analysis. KSCE J. Civ. Eng. 2016, 20, 1977–1986. [Google Scholar] [CrossRef]
  30. Tidke, A.R.; Adhikary, S. Seismic fragility analysis of the Koyna gravity dam with layered rock foundation considering tensile crack failure. Eng. Fail. Anal. 2021, 125, 105361. [Google Scholar] [CrossRef]
  31. Cao, A.-T.; Nahar, T.T.; Kim, D.; Choi, B. Earthquake risk assessment of concrete gravity dam by cumulative absolute velocity and response surface methodology. Earthq. Struct. 2019, 17, 511–519. [Google Scholar] [CrossRef]
  32. ABAQUS. 6.14 Documentation; Dassault Systemes Simulia Corporation: Johnston, RI, USA, 2014. [Google Scholar]
  33. Nahar, T.T.; Rahman, M.M.; Kim, D. Damage index based seismic risk generalization for concrete gravity dams considering FFDI. Struct. Eng. Mech. 2021, 78, 53–66. [Google Scholar] [CrossRef]
  34. Westergaard, H.M. Water pressures on dams during earthquakes. Trans. Am. Soc. Civ. Eng. 1933, 98, 418–433. [Google Scholar] [CrossRef]
  35. Van Nguyen, D.; Kim, D.; Duy Nguyen, D. Nonlinear seismic soil-structure interaction analysis of nuclear reactor building considering the effect of earthquake frequency content. Structures 2020, 26, 901–914. [Google Scholar] [CrossRef]
  36. Wang, X.; Zhou, Q.; Shi, L.; Wang, H.; Li, X. An integral numerical analysis of impact of a commercial aircraft on nuclear containment. Sci. Technol. Nucl. Install. 2019, 2019, 9417954. [Google Scholar] [CrossRef]
  37. Bao, X.; Zhai, C.-H.; Zhang, M.-H.; Xu, L.-J. Seismic capacity assessment of postmainshock damaged containment structures using nonlinear incremental dynamic analysis. Struct. Des. Tall Spec. Build. 2020, 29, e1706. [Google Scholar] [CrossRef]
  38. Nahar, T.T.; Rahman, M.M.; Kim, D. Effective safety assessment of aged concrete gravity dam based on the reliability index in a seismically induced site. Appl. Sci. 2021, 11, 1987. [Google Scholar] [CrossRef]
  39. Ansari, M.I.; Agarwal, P. Damage index evaluation of concrete gravity dam based on hysteresis behavior and stiffness degradation under cyclic loading. Int. J. Struct. Stab. Dyn. 2017, 17, 1750009. [Google Scholar] [CrossRef]
  40. Nguyen, D.V.; Dookie, K.; Chunse, P.; Choi, B. Seismic soil–structure interaction analysis of concrete gravity dam using perfectly matched discrete layers with analytical wavelengths. J. Earthq. Eng. 2021, 25, 1657–1678. [Google Scholar] [CrossRef]
  41. Oyguc, E.; Hayır, A.; Oyguc, R. Structural modeling and dynamic analysis of a nuclear reactor building. In Structural Integrity and Failure; Oyguc, R., Tahmasebinia, F., Eds.; IntechOpen: London, UK, 2020; pp. 1–19. [Google Scholar] [CrossRef]
  42. Popovics, S. A numerical approach to the complete stress-strain curve of concrete. Cem. Concr. Res. 1973, 3, 583–599. [Google Scholar] [CrossRef]
  43. Shamass, R.; Zhou, X.; Alfano, G. Finite-element analysis of shear-off failure of keyed dry joints in precast concrete segmental bridges. J. Bridge Eng. 2015, 20, 04014084. [Google Scholar] [CrossRef]
  44. Kytinou, V.K.; Chalioris, C.E.; Karayannis, C.G. Analysis of residual flexural stiffness of steel fiber-reinforced concrete beams with steel reinforcement. Materials 2020, 13, 2698. [Google Scholar] [CrossRef]
  45. Allam, S.M.; Shoukry, M.S.; Rashad, G.E.; Hassan, A.S. Evaluation of tension stiffening effect on the crack width calculation of flexural RC members. Alex. Eng. J. 2013, 52, 163–173. [Google Scholar] [CrossRef]
  46. Fenves, G.L.; Chopra, A.K. Simplified Analysis for Earthquake Resistant Design of Concrete Gravity Dams; University of California, Earthquake Engineering Research Center: Berkeley, CA, USA, 1986. [Google Scholar]
  47. Fenves, G.; Chopra, A.K. Simplified Earthquake Analysis of Concrete Gravity Dams. J. Struct. Eng. 1987, 113, 1688–1708. [Google Scholar] [CrossRef]
  48. Zhao, W.; Ji, S. Mesh convergence behavior and the effect of element integration of a human head injury model. Ann. Biomed. Eng 2019, 47, 475–486. [Google Scholar] [CrossRef] [PubMed]
  49. PEER. PEER Ground Motion Database. Available online: https://ngawest2.berkeley.edu/ (accessed on 1 January 2025).
  50. KCSC. Standard for Seismic Design of Buildings (건축물 내진설계기준); KCSC: Annandale, VA, USA, 2022. [Google Scholar]
  51. Moon, D.-S.; Lee, Y.-J.; Lee, S. Fragility analysis of space reinforced concrete frame structures with structural irregularity in plan. J. Struct. Eng. 2018, 144, 04018096. [Google Scholar] [CrossRef]
  52. Bommer, J.J.; Elnashai, A.S.; Weir, A.G. Compatible acceleration and displacement spectra for seismic design codes. In Proceedings of the 12th World Conference on Earthquake Engineering, Auckland, New Zealand, 30 January–4 February 2000. [Google Scholar]
  53. Kennedy, R.; Ravindra, M. Seismic fragilities for nuclear power plant risk studies. Nucl. Eng. Des. 1984, 79, 47–68. [Google Scholar] [CrossRef]
  54. Ellingwood, B.; Tekie, P.B. Fragility analysis of concrete gravity dams. J. Infrastruct. Syst. 2001, 7, 41–48. [Google Scholar] [CrossRef]
  55. Shinozuka, M.; Feng, M.Q.; Lee, J.; Naganuma, T. Statistical analysis of fragility curves. J. Eng. Mech. 2000, 126, 1224–1231. [Google Scholar] [CrossRef]
  56. Hariri-Ardebili, M.A.; Saouma, V.E. Collapse Fragility Curves for Concrete Dams: Comprehensive Study. J. Struct. Eng. 2016, 142, 04016075. [Google Scholar] [CrossRef]
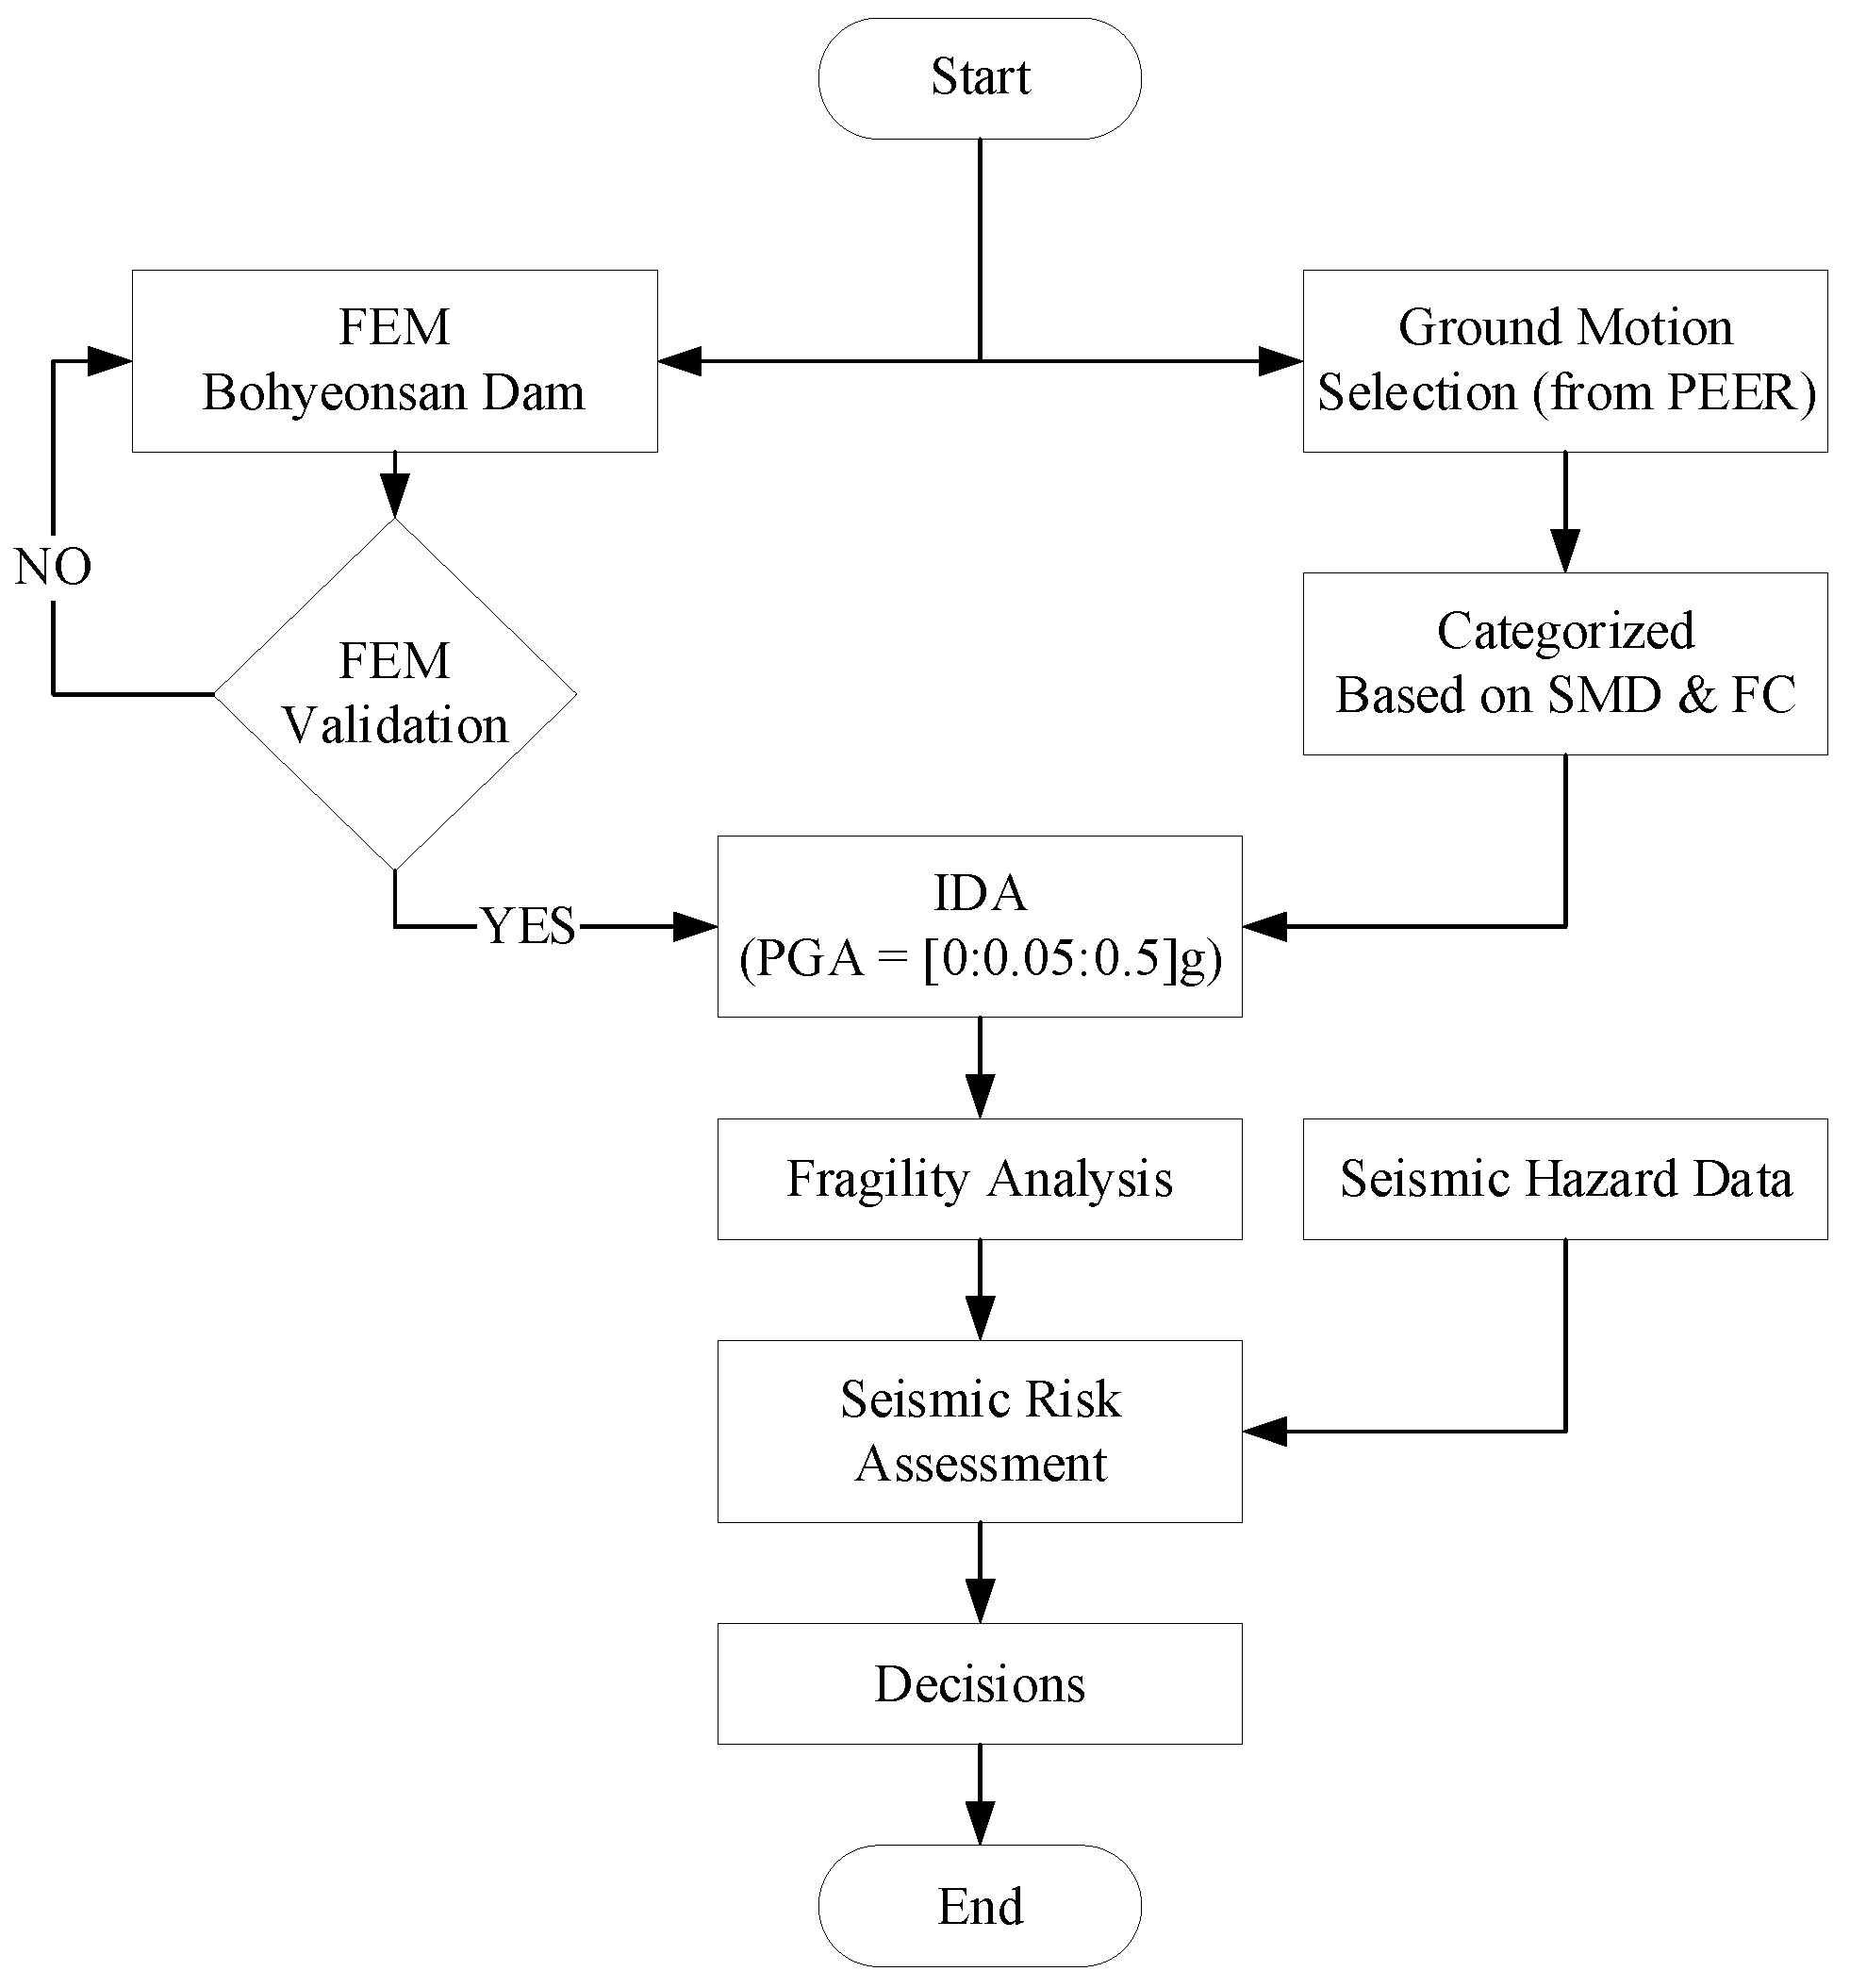
Figure 1. Overall workflow for probabilistic seismic risk assessment of concrete gravity dams.
Infrastructures 10 00259 g001
Figure 2. Bohyeonsan concrete gravity dam.
Infrastructures 10 00259 g002
Figure 3. Mesh discretization of Bohyeonsan concrete gravity dam.
Infrastructures 10 00259 g003
Figure 4. Compressive crushing behavior of concrete: (a) CDP model; (b) yield stress and damage parameters.
Infrastructures 10 00259 g004
Figure 5. Tension softening behavior: (a) stress–strain curve; (b) CDP model; (c) yield stress and damage parameters.
Infrastructures 10 00259 g005
Figure 6. First-mode shape of Bohyeonsan concrete gravity dam: (a) modal frequency with contour; (b) comparison of mode shape.
Infrastructures 10 00259 g006
Figure 7. Maximum values of the ratio of hourglass energy to total energy.
Infrastructures 10 00259 g007
Figure 8. Selected ground motions: (a) response spectra; (b) scatterplot.
Infrastructures 10 00259 g008
Figure 9. Incremental dynamic analysis (IDA): crest drift (%) versus PGA for (a) duration groups and (b) frequency-content groups.
Infrastructures 10 00259 g009
Figure 10. Fragility for LS-Extensive (4.77% crest drift): probability of exceedance versus PGA for (a) duration groups and (b) frequency-content groups.
Infrastructures 10 00259 g010
Figure 11. Hazard curve for Bohyeonsan concrete gravity dam site.
Infrastructures 10 00259 g011
Figure 12. Risk curves: (a) ground motion duration group; (b) frequency-content group.
Infrastructures 10 00259 g012
Figure 13. Total risk curves: (a) ground motion duration group; (b) frequency-content group.
Infrastructures 10 00259 g013
Table 1. Basic concrete material properties.
PropertyConcrete
InsideOutside
Compressive strength, f c (MPa)1218
Modulus of elasticity, E c (MPa)13,76716,861
Tensile strength, f t (MPa)1.31.6
Poisson’s ratio (ν)0.180.18
Density, ρ (kg/m3)23002300
Dilation angle ( ψ ) (°)3636
Flow potential eccentricity, ϵ 0.10.1
Biaxial-to-uniaxial-strength ratio, f b 0 / f c 0 1.161.16
Ratio of the second stress invariant on the tensile meridian, K 0.6670.667
Table 2. Summary of selected ground motion properties.
EQ
No.
EQ NameStationYearM D 5 95
(s)
Duration
Category
PGA/PGV
(g/m/s)
Freq. Content
1BorregoEl Centro Array #919426.537.22LD1.06MF
2Kern CountyLA—Hollywood Stor FF19527.3633.54LD0.49LF
3El AlamoEl Centro Array #919566.836.74LD0.84MF
4Central Calif-02Hollister City Hall1960534.72LD0.95MF
5Borrego MtnEl Centro Array #919686.6341.18LD0.50LF
6San Fernando2516 Via Tejon PV19716.6151.78LD0.43LF
7Tabas_IranSedeh19787.3530.14LD0.77LF
8Taiwan SMART1(45)SMART1 O0819867.334.24LD0.57LF
9Superstition Hills-02Imperial Valley Wildlife Liquefaction Array19876.5435.81LD0.57LF
10LandersArcadia—Arcadia Av19927.2835.22LD0.27LF
11Big Bear-01LA—Temple & Hope19926.4634.74LD0.71LF
12Northridge-01LB—City Hall19946.6933.2LD0.73LF
13Dinar_TurkeyDenizli19956.459.05LD0.49LF
14Gulf of AqabaHadera19957.233.27LD0.42LF
15Kocaeli_TurkeyAfyon Bay19997.5161.08LD0.40LF
16Humbolt BayFerndale City Hall19375.821.7MD1.54HF
17Imperial Valley-01El Centro Array #91938514.81MD2.71HF
18Imperial Valley-02El Centro Array #919406.9524.19MD0.91MF
19Northwest Calif-02Ferndale City Hall19416.615.48MD1.67HF
20Northern Calif-01Ferndale City Hall19416.413.03MD1.93HF
21Imperial Valley-03El Centro Array #919515.624.47MD1.13MF
22Kern CountyPasadena—CIT Athenaeum19527.3629.19MD0.82MF
23Northern Calif-02Ferndale City Hall19525.216.54MD0.96MF
24Southern CalifSan Luis Obispo1952613.27MD1.15MF
25Central Calif-01Hollister City Hall19545.325.07MD1.18MF
26Northern Calif-03Ferndale City Hall19546.517.34MD0.45LF
27Hollister-01Hollister City Hall19615.618.72MD0.74LF
28Hollister-02Hollister City Hall19615.516.48MD1.03MF
29ParkfieldCholame—Shandon Array #1219666.1928.99MD0.90MF
30San FernandoBorrego Springs Fire Sta19716.6116.34MD0.51LF
31Helena_Montana-01Carroll College193562.41SD2.74HF
32Helena_Montana-02Helena Fed Bldg193560.57SD6.65HF
33San FranciscoGolden Gate Park19575.285.02SD3.26HF
34ParkfieldCholame—Shandon Array #519666.196.5SD1.77HF
35ParkfieldTemblor pre-196919666.194.45SD1.61HF
36Lytle CreekCedar Springs Pumphouse19705.332.43SD2.30HF
37Lytle CreekDevil’s Canyon19705.332.22SD4.82HF
38Lytle CreekLake Hughes #119705.336.88SD1.20MF
39Lytle CreekSanta Anita Dam19705.335.11SD3.02HF
40Lytle CreekWrightwood—6074 Park Dr19705.332.99SD1.70HF
41San FernandoColton—So Cal Edison19716.617.34SD1.76HF
42San FernandoFort Tejon19716.618.3SD2.08HF
43San FernandoGormon—Oso Pump Plant19716.617.19SD1.00MF
44San FernandoPacoima Dam (upper left abut)19716.617.02SD1.06MF
45Managua_Nicaragua-02Managua_ESSO19725.28.06SD1.03MF
Table 3. Summary of selected ground motion by group.
EQ GroupnM
(Median [IQR])
R r u p
(km, Median [IQR])
V S 30
(m/s, Median [IQR])
D 5 D 95
(s, Median [IQR])
PGA/PGV
(s, Median [IQR])
μ s p e c
LD156.69 [0.77]86.31 [74.54]280.56 [129]35.22 [5.31]0.57 [0.29]0.14
MD156 [1]34.98 [50.09]219.31 [65.49]17.34 [8.42]1.03 [0.5]0.11
SD156 [1.07]15.96 [37.37]486 [278.98]5.11 [4.4]1.77 [1.48]0.18
HF156 [0.97]22.94 [41.58]477.22 [318.15]5.11 [7.96]2.08 [1.15]0.14
MF156 [1.3]25.81 [51.82]219.31 [198.59]24.19 [18.43]1.03 [0.17]0.13
LF156.63 [0.77]86.31 [93.98]316.46 [124]34.24 [6.83]0.5 [0.2]0.17
Table 4. LS thresholds to drift values.
Limit State (LS)Crest-Drift Ratio Threshold
Slight0.0128
Moderate0.0343
Extensive (used for fragility in this study)0.0477
Collapse-
Disclaimer/Publisher’s Note: The statements, opinions and data contained in all publications are solely those of the individual author(s) and contributor(s) and not of MDPI and/or the editor(s). MDPI and/or the editor(s) disclaim responsibility for any injury to people or property resulting from any ideas, methods, instructions or products referred to in the content.