Abstract
The preservation of bridge infrastructure has become increasingly critical as aging assets face accelerated deterioration due to climate change, environmental loading, and operational stressors. This issue is particularly pronounced in regions with limited maintenance budgets, where delayed interventions compound structural vulnerabilities. Although traditional bridge inspections generate detailed condition ratings, these are often viewed as isolated snapshots rather than part of a continuous structural health timeline, limiting their predictive value. To overcome this, recent studies have employed various Artificial Intelligence (AI) models. However, these models are often restricted by fixed input sizes and specific report formats, making them less adaptable to the variability of real-world data. Thus, this study introduces a Transformer architecture inspired by Natural Language Processing (NLP), treating condition ratings, and other features as tokens within temporally ordered inspection “sentences” spanning 1993–2024. Due to the self-attention mechanism, the model effectively captures long-range dependencies in patterns, enhancing forecasting accuracy. Empirical results demonstrate 96.88% accuracy for short-term prediction and 86.97% across seven years, surpassing the performance of comparable time-series models such as Long Short-Term Memory (LSTM) and Gated Recurrent Units (GRUs). Ultimately, this approach enables a data-driven paradigm for structural health monitoring, enabling bridges to “speak” through inspection data and empowering engineers to “listen” with enhanced precision.
1. Introduction
Bridges serve as vital component of the nation’s infrastructure, facilitating transportation economic productivity, and social integration. However, the long-term performance of bridge networks is increasingly at risk due to aging structures, limited maintenance resources, and growing environmental pressures, including those driven by climate change. In many developed countries, including the United States, the United Kingdom, and Australia, a large share of bridges are nearing the end of their design service life, and a considerable proportion have already been classified as substandard, raising serious concerns about structural adequacy and long-term resilience [].
Recent estimates by the RAC Foundation report that over 3000 bridges in the United Kingdom fall into the substandard category, indicating they are no longer considered adequate for carrying standard highway traffic loads [,]. Despite awareness among local authorities of the need to upgrade and rehabilitate aging structures, persistent funding limitations continue to delay or restrict essential maintenance actions. According to [], only 387 out of approximately 2500 bridges identified as urgently needing repair are expected to receive upgrades within the next five years and the estimated cost of addressing the entire maintenance backlog now exceeds £5.9 billion. In the United States, nearly 8% of bridges were classified as structurally deficient in 2020, with close to 56,000 structures identified as needing significant rehabilitation [,]. These trends underscore the urgent need for more effective preservation strategies to safeguard structural integrity and extend the operational lifespan of bridge networks.
Ongoing inspection delays and limited technical capacity further reveal the fragility of existing bridge management systems, many of which still rely on reactive rather than preventive approaches. These operational challenges are increasingly intensified by the effects of climate change. The rising frequency and severity of weather events such as heavy rainfall, flooding, and prolonged heat place additional strain on aging infrastructure, particularly on structures not designed to accommodate such conditions. According to [], increased rainfall has contributed to more severe scour and erosion around bridge foundations, undermining structural stability and disrupting regional transport networks. Similarly, the UK Climate Change Risk Assessment identifies flooding, erosion, and elevated temperatures as among the most pressing threats to national infrastructure, including bridges and pipelines [].
These climate-related pressures are especially critical because they exceed the assumptions embedded in historical design codes and asset life models. Many bridges were constructed with an intended service life of around 120 years, often without accounting for long-term environmental stress or compounding deterioration [,]. As a result, conventional deterioration models and lifecycle cost assessments are no longer adequate for capturing current and emerging risks. Strengthening long-term performance now requires the integration of retrofit measures and climate-resilient preservation policies.
Although structural health monitoring (SHM) remains essential for assessing infrastructure condition, it often depends on periodic inspection reports that are interpreted as isolated data points rather than as part of a continuous performance history. This disconnect limits the predictive value of inspection data and often results in reactive, rather than forward-looking, maintenance strategies. Recent advancements in Internet of Things (IoT) technologies and AI present promising opportunities to improve real-time monitoring and enhance the interpretation of structural data.
A key strategy for maintaining bridge integrity is preservation, which entails proactive actions to prevent, delay, or mitigate structural deterioration in bridge components [,]. Figure 1 presents a comparative trajectory of bridge condition and corresponding maintenance costs under four distinct management strategies: unmanaged deterioration, reactive maintenance, conventional preservation, and AI-enhanced preservation. In the absence of intervention, structural condition deteriorates rapidly, whereas both reactive and conventional preservation strategies slow this decline but incur escalating maintenance costs due to delayed action. In contrast, the AI-enhanced preservation strategy combines early forecasting with targeted interventions, allowing bridges to remain in good condition for longer while minimizing cumulative maintenance costs. By addressing deterioration earlier, this proactive approach reduces the need for major repairs and postpones the point at which full replacement becomes necessary. This relationship between condition and cost highlights the value of intelligent, data-driven strategies in extending the service life of infrastructure and improving the efficiency of long-term investment planning.
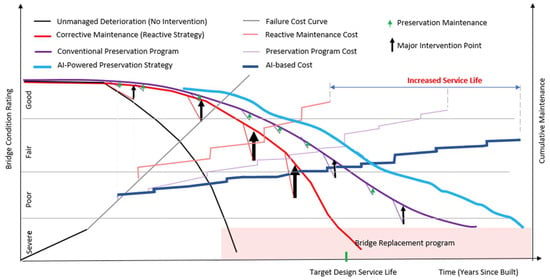
Figure 1.
Bridge condition and cost evolution under diverse maintenance strategies.
As a matter of fact, bridge inspections are essential for ensuring the safety and functionality of structures throughout their lifespan, as they generate crucial data to guide maintenance decisions and support effective infrastructure management []. As of the present, the United States has accumulated a rich database of historical condition rating data of the bridge being rated in a scale from 0 to 9 as shown in Table 1. This historical data was collected from 1993 to 2024, which includes records for over 600,000 structures spanning diverse climates, traffic loads, and material types. Due to its scale, consistency and accessibility, the NBI has become a widely adopted benchmark in academic studies on bridge deterioration modeling, offering valuable opportunities for data mining, feature extraction, and data-driven forecasting [,,,].

Table 1.
NBI condition rating’s description.
Although the National Bridge Inventory (NBI) contains a large volume of historical inspection records, these ratings are typically treated as isolated entries rather than as part of a continuous condition timeline. This treatment makes it difficult to identify deterioration patterns over time and reduces the predictive value of the data. As a result, the dataset is limited in its usefulness for forward-looking decision-making and may introduce bias in condition assessments. To address these challenges, researchers have developed a range of analytical frameworks, spanning deterministic and probabilistic models as well as advanced data-driven methodologies rooted in AI. Each method offers specific advantages, but also presents challenges, especially when applied to long-term forecasting of bridge deterioration. Continued improvements in these models aim to make condition predictions more reliable and enable earlier, more cost-effective maintenance planning.
Deterministic models have been used to describe bridge components’ deterioration in relation to time-dependent effects such as age, climate factors, Average Daily Traffic (ADT), and Average Daily Truck Traffic (ADTT), these relationships can be formulated as a linear regression with a form of a polynomial or exponential regression [,]. To address these limitations, probabilistic models have been introduced to incorporate uncertainty into bridge condition predictions. Markov methods were employed to predict the bridge elements’ condition as a probability, predicting the deterioration progression with a decent accuracy [,]. However, whilst probabilistic models improve the representation of uncertainty, they often require extensive historical data and predefined assumptions about degradation behavior, which may not always align with the complexity of real-world bridge behavior. Not only that, but Markov chain models also may struggle to account spatial and temporal dependencies that exist in bridge networks [].
AI techniques have a long history in bridge engineering, with early applications dating back to the mid-1980s. One of the earliest examples is the Bridge Design Expert System (BDES) developed by [], which applied rule-based logic to support superstructure design tasks. In the early 2000s, rule-based expert systems were also applied to bridge condition evaluation and maintenance prioritization, using predefined decision rules derived from domain knowledge []. These early efforts demonstrated the feasibility of embedding engineering expertise into digital tools for infrastructure management. However, their limited adaptability and inability to process large-scale, time-sequenced data restricted their use for long-term forecasting. Nevertheless, recent advances in deep learning now offer a more scalable and flexible framework capable of learning deterioration patterns from inspection sequences and supporting data-driven, proactive maintenance strategies.
In recent years, there has been growing interest in applying AI techniques to analyze bridge inspection data and predict future structural conditions. Machine learning methods such as Random Forest and Gradient Boosting have demonstrated effectiveness in modeling deterioration patterns using large-scale historical inspection datasets [,,,,]. These models are capable of automatically learning complex relationships from data, thereby reducing the need for explicit feature engineering. However, many of these approaches are limited by their reliance on fixed input structures and specific types of reports, which restricts their adaptability to evolving and heterogeneous datasets.
Furthermore, predicting bridge condition ratings requires models that can capture long-term deterioration patterns spanning decades, while also handling noisy and imbalanced inspection data. Traditional Artificial Neural Networks (ANNs) and Convolutional Neural Networks (CNNs) have been investigated for this purpose. Nevertheless, ANNs, though simple and computationally efficient, lack explicit mechanisms for modeling sequential dependencies. Similarly, CNNs, while effective at extracting spatial features, are inherently constrained in temporal modeling; they focus on short-range correlations and often fail to capture gradual, long-term deterioration trends [,].
To overcome these limitations, recurrent models such as LSTM networks and GRUs have been employed, as they offer improved temporal modeling capabilities. Yet, they also face notable challenges, including difficulty in retaining long-term dependencies, bias toward majority condition ratings, and instability when exposed to noise or data imbalance. As highlighted by [], LSTMs are particularly effective at modeling dependencies that require information from earlier timesteps, which explains their superior performance in predicting superstructure and substructure ratings, where gradual structural changes demand nuanced understanding of long-term relationships. In contrast, GRUs often perform better in deck condition ratings, suggesting they are more suited for tasks involving dependencies concentrated in recent timesteps and noisier datasets. However, there remains a research gap in developing models capable of addressing both scenarios simultaneously, by combining the strengths of LSTMs and GRUs.
Given these challenges, a transformer-based framework has been proposed, inspired by NLP to model bridge condition assessments as structured temporal sequences [,]. Unlike Recurrent neural network (RNN)-based models, Transformers employ a self-attention mechanism that enables them to capture dependencies across all timesteps simultaneously. This allows for more accurate long-horizon forecasts and improved detection of underrepresented deterioration states. Consequently, the proposed Transformer-based framework addresses critical gaps in the state of the art by offering a more reliable, interpretable, and comprehensive tool for predicting bridge condition ratings as depicted by []. Moreover, while most existing machine and deep learning approaches have been trained using the National Bridge Inventory (NBI) dataset, they typically focus on specific regions only. This introduces a further research gap: the need for models that are adaptable and robust across diverse geographic and climatic conditions.
Accordingly, this study aims to address the following key research question:
- How can the proposed Transformer architecture surpass the accuracy of bridge condition rating predictions compared to models such as LSTM and GRU with time-distributed layers?
2. Materials and Methods
2.1. Dataset
The dataset was collected from the National Bridge Inventory (NBI) spanning from 1993 to 2024, this study aims to predict the condition rating of bridges using a transformer architecture. Over the 32-year period, the NBI has compiled extensive historical condition ratings and other features, enabling a rich analysis of deterioration trends across various bridge components, including decks, superstructures and substructures. This open-access dataset comprises detailed information on nearly 623,000 individual bridges across the United States, facilitating comprehensive insights into their structural condition across time. However, for this study we focused on bridges from eight specific states—Connecticut, Delaware, Indiana, Maine, Maryland, New Jersey, Ohio, and Virginia. These states were strategically selected due to their better quality, consistent historical reporting over the 32-year period without any missing value, and their diverse geographic and climatic profiles.
- North-eastern states like Maine, Connecticut, and New Jersey experience harsh winters, frequent freeze–thaw cycles, and snow-related stress, all of which significantly affect bridge deterioration.
- Mid-Atlantic states such as Delaware, Maryland, and Virginia face coastal humidity, as well as salt exposure, introducing different aging mechanisms.
- Midwestern states like Ohio and Indiana present continental climates with seasonal temperature extremes and are influenced by deicing chemicals and heavy freight traffic.
From these bridges, we extracted 27 key features, also known as National Bridge Inventory (NBI) items, which were selected based on their significance as influencing factors identified in prior studies such as [,,,,], as listed in Table 2. Among these features, Item CAT23, which is the bridge condition rating, serves as the target variable for prediction. This item reflects the overall condition of the bridge based on inspections and is rated on scale from 0 (failed condition) to 9 (excellent condition), in accordance with Federal Highway Administration (FHWA) inspection guidelines []. Importantly, the CAT23 rating employed in this study is derived from standardized visual inspections conducted by certified bridge inspectors. These inspections are typically performed every 2 years under FHWA protocols, which ensures consistency in data collection nationwide. Consequently, the resulting ratings offer a uniform and comparable measure of bridge condition, thereby enhancing the reliability of the dataset used in this research.

Table 2.
Selected features from NBI dataset.
The dataset was filtered to include bridges built between 1900 and 1996, with maximum span lengths ranging from 100 to 900 feet as shown in Figure 2. Only highway bridges with main spans made of concrete, continuous concrete, prestressed concrete, or continuous prestressed concrete were considered. This selection helped refine the scope and extract meaningful patterns.
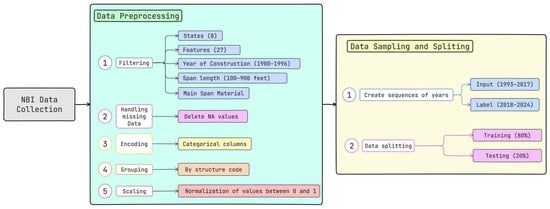
Figure 2.
Data pipeline.
After the Filtering and handling missing data mentioned in Figure 2. The number of bridges were reduced from 30,756 bridges to 5921 bridges to ensure the data quality, characterized by 189,472 reports and 5,115,744 features in total. For model development, the dataset is split into 80% for training and 20% for testing. The input data is structure as three-dimensional matrix, where:
- Rows correspond to 27 selected features (detailed in Table 2), 26 features correspond to the input and 1 feature corresponds to the target (Item CAT23 -> Bridge condition).
- Columns represent each year from 1993 to 2017, forming a temporal sequence.
- The Z-axis represents each bridge structure, effectively organizing the dataset as set of independent structures.
This setup allows for a novel analogy with natural language processing:
- Each year functions as a word in a sentence.
- The features act as the vector representation of each word.
- Each bridge structure corresponds to a sentence.
This formulation facilitates the application of sequence-based learning methods, capturing the temporal evolution of structural features for predictive modeling as depicted in Figure 3.
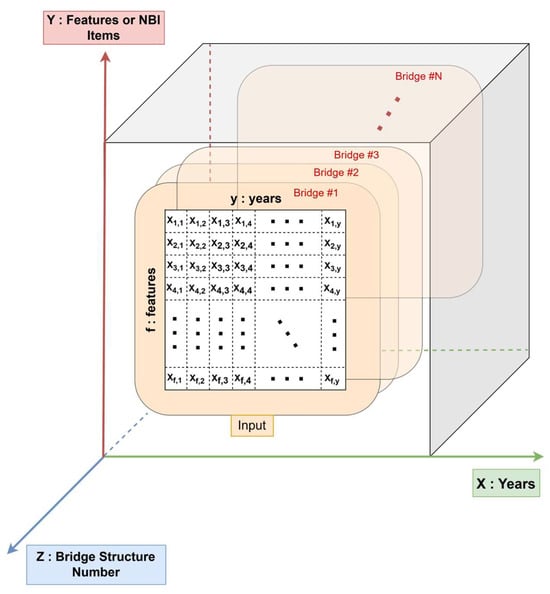
Figure 3.
Input’s 3D matrix representation.
Figure 4 presents the condition ratings of bridges, which are the labels for the predictions concerning the years from 1993 to 2024, across different states, highlighting that the majority are classified as being in fair condition. Without proper maintenance or preservation efforts, these bridges are at risk of further deterioration, potentially reaching a poor condition. This trend underscores the importance of proactive infrastructure management. Additionally, the dataset provides a valuable foundation for analyzing patterns and extracting meaningful insights to support the aim of this research.
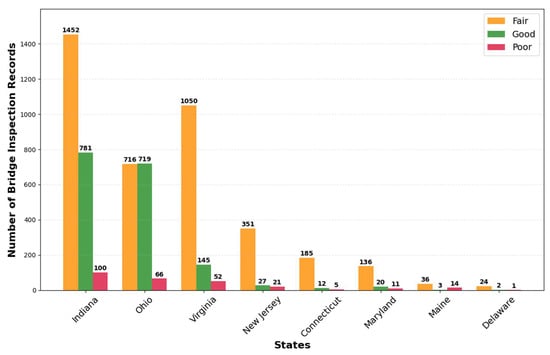
Figure 4.
Bridge condition per state.
2.2. Deep Learning Architectures
In the world of Deep learning, there are different types of architectures used to make predictions in bridge engineering, depending on the dataset. The ones used on prior research are CNNs, ANNs, RNNs [,,,,,,]. CNNs are known for their strong performance with images and spatial data. However, there are several limitations. They can only “see” small parts of the data at a time, which makes them less effective for understanding patterns over time. Similarly, ANNs, while useful for general prediction tasks, are not good at handling sequences of data. They have trouble remembering long-term patterns. These limitations make both CNNs and ANNs less suitable for tasks that require analyzing long-term trends over time. Meanwhile RNNs process the data sequentially, and due to bridge inspection are performed every 2 years and the condition rating might not vary much unless an unpredictable failure happens, the model does not capture the whole picture of the situation over years.
Transformer architectures, as illustrated in Figure 5, offer significant advantages that address the limitations of traditional models such as CNNs, ANNs and RNNs. The primary significance of the proposed Transformer model lies in its self-attention mechanism, which empowers the model to analyze an asset’s entire history, rather than just its most recent state. By learning to weigh the significance of long-range dependencies, the model can discern that a bridge holding a specific condition rating for a decade carries a different risk profile than one holding it for only two years, thus capturing the underlying degradation patterns that precede a failure.
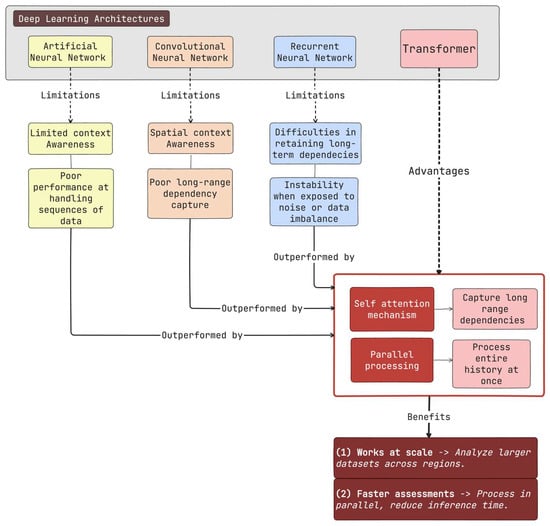
Figure 5.
Schematic of how transformer architecture outperforms other architectures for bridge condition prediction.
In NLP, transformers are designed to read and understand sequences of words (referred to as tokens) that together form a sentence. The order of these words is crucial, as it determines the meaning of the sentence. In this study, a similar approach is applied; however, instead of words, we use bridge condition ratings, such as inspection scores recorded over time, along with additional features like average daily traffic, structure length, and others listed in Table 2. Rather than forming a sentence, the yearly sequence of these inspection ratings constitutes the inspection history of a bridge. This historical timeline is treated analogously to a sentence composed of words. In doing so, the transformer model learns how a bridge’s condition evolves over time and is then used to predict future condition ratings.
Moreover, transformers are particularly well-suited for sequential data because they can process inputs in parallel, which significantly improves computational efficiency, especially when working with large datasets. Additionally, their scalability allows them to accept a variety of input types and lengths. Taken together, these capabilities contribute to higher prediction accuracy, making transformers especially valuable for forecasting the future condition of infrastructure like bridges [].
2.2.1. Transformer Architecture
The transformer neural network architecture represents a groundbreaking advancement in deep learning, significantly transforming the field of sequence modeling. Unlike traditional models, the transformer allows each element in a sequence to attend to all other elements simultaneously, enabling it to capture complex and long-range dependencies within the data. This capability has led to its remarkable success across a range of fields, including NLP, computer vision, speech recognition, among others; where it has outperformed previous models in many tasks [,,,,,].
In this project, the transformer architecture was employed to extract and correlate features from bridge inspection reports collected over an extended period. By leveraging this approach, the model was able to predict the condition ratings of bridges, facilitating predictive maintenance and providing valuable insights for infrastructure management. The application of transformer models in this context highlights their potential to enhance decision-making processes in civil engineering by offering more accurate and timely predictions.
The diagram shown in Figure 6 presents a Transformer-based deep learning framework designed to predict the annual condition ratings of bridges using historical inspection data. The input to the model consists of 25 years of bridge data, from 1993 to 2017, where each year is represented by 26 distinct features related to the bridges. This sequence of features is enhanced with positional encoding to retain the temporal order of the data, which is essential for modeling year-to-year dependencies. The encoded input is then passed into a Transformer architecture that comprises a multi-head attention layer, responsible for identifying complex relationships across different years, and feed-forward neural networks, which generate a prediction for the condition rating of the target year, 2018. During the training phase, the model’s prediction is compared with the actual 2018 condition rating to calculate accuracy.
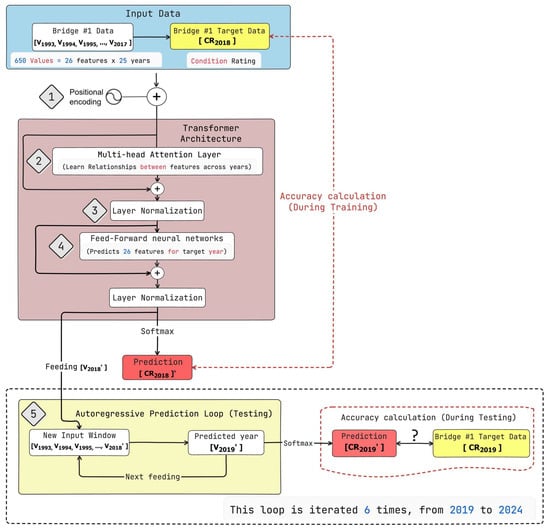
Figure 6.
Transformer with autoregression for year-by-year bridge condition prediction.
In the testing phase, the model operates in an autoregressive loop to forecast future condition ratings from 2019 to 2024. In each iteration, the model’s previous prediction (e.g., for 2018) is included as part of the input sequence for predicting the next year (e.g., 2019). This new input window again goes through the Transformer to produce a prediction, which is subsequently used as input for the following year. The model repeats this loop six times, one for each year between 2019 and 2024, and compares each prediction with the corresponding actual condition rating to evaluate its performance. By leveraging historical data and autoregressive feedback, the model is capable of capturing long-term trends and temporal dynamics, enabling accurate, year-by-year forecasting of bridge conditions.
The step-by-step explanation of the Transformer architecture is as follows:
Step 1: Input Embedding + Positional Encoding.—The model input is a matrix , where each column corresponds to each year where . This matrix is first passed through a linear embedding layer that maps each 26-dimensional row to a higher-dimensional space , and then positional encoding is added to retain temporal order.
The positional encoding assigns a unique value to each position in the input embedding. It helps to distinguish different positions and aids in learning the sequential nature of the data. The size of position encoding ought to match the input embedding size, so that they can be added together. For each time step (from 0 to 24) and each embedding dimension index from 0 to 12. The positional encoding values shown in Figure 7 are computed using Equation (1).
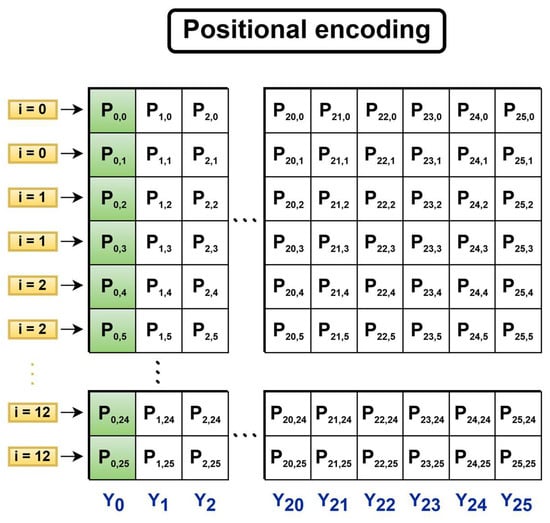
Figure 7.
Positional encoding schematic.
The result is a matrix as represented in Equation (2), where is the learned weight matrix, PE is the positional encoding.
In addition, in the positional encoding the sin and cosine functions are used because of their periodic nature, providing a continuous, smooth way to encode position without abrupt changes.
Step 2: Multi-Head Attention Layer.—This layer allows the model to learn dependencies between all years. For each attention head, queries, keys and values, represented by Q, K, and V, respectively, are computed using Equation (3).
In a transformer, the query is a piece of information asking about something, the key is the information that helps match the query with the relevant data, and the value is the actual data you want to retrieve. In our research we can properly explain the use of query, key and value based on our dataset.
Query.—What caused the drop in condition after 2015?
Key.—Each feature in your dataset (e.g., bridge age, length of maximum span, Average daily traffic, etc.) can be considered a key to help the model identify which past information is important for answering the query.
Value.—If the key is “condition rating from 2015,” the value could be 5, representing the bridge’s condition rating in that year.
Then the attention is computed to find useful relationships and patterns provided by the dataset using Equations (4) and (5). The multi-head attention is multiple self-attention mechanism, which looks at all the keys (the past years data) and finds out which values (the actual data) are most relevant to the query (predicting the 2020 condition). The reason behind using multi-head attention is because when the larger the number of heads, the more different patterns you can find in the data. For instance, the features from 2010 and 2016 may be more important in predicting the future condition than some other data points.
The number of heads, denoted as “h”, is a key hyperparameter in the Transformer architecture. Increasing its value enhances the model’s capacity to extract diverse features from the input data.
Step 3: Addition and Layer Normalization.—The output of the multi-head attention is added back to the input and normalized; the result is expressed as “”. This is useful to stabilize the training process, and it is calculated by the following equation:
Step 4: Feed-Forward Neural Network (FNN) and Prediction (Training).—Each column (year) in the sequence is independently passed through a position-wise FFN. This calculation allows the model to capture non-linear relations by applying the ReLU activation function.
The output corresponding to the last year (2017) in the sequence is used to predict the bridge’s condition rating for 2018 (), by applying the SoftMax operation. The SoftMax function is used to convert a set of raw scores (which can be any number, positive or negative) into probabilities. These probabilities are the likelihood of each possible outcome.
Step 5: Autoregressive Prediction Loop.—Before predicting the , the form a new input matrix is fed back as a new input. This new matrix is passed through the Transformer architecture to predict the next year’s rating (2019). The loop continues for each subsequent year until 2024.
2.2.2. Long Short-Term Memory (LSTM) and Gated Recurrent Unit (GRU) Architecture
The LSTM and GRU architecture are considered as types of RNNs, designed to capture temporal relationships but they differ in its characteristics, LSTM maintain long-term dependencies using gating mechanisms, deciding which information to retain or discard at each time step. Meanwhile, GRU is a simplified version of LSTM architecture, combining gates into a single one, allowing the architecture to be more efficient while keeping the effectiveness. Both architectures are equipped with a Time-distributed layer, preserving the temporal structure, which is crucial in sequential architectures.
The input representations for the training section are 4737 bridges, where each input sequence corresponds to a bridge temporal inspection history up to . Each time step includes condition ratings and associated features with dimensionality as explained in the transformer architecture section.
The core of the model consists of a stacked configuration of 4 recurrent layers as stated in []. Each of these layers can be implemented using either LSTM or GRU architecture. Moreover, to mitigate overfitting, a dropout regularization technique with a rate of 0.1 is applied after each of the four recurrent layers as shown in Figure 8. The recurrence is defined as , where denotes either the LSTM or GRU function.

Figure 8.
LSTM and GRU architecture pipeline.
The output from the final recurrent layer is then processed by a time-distributed layer. This layer applies a fully connected transformation to every temporal slice of its input sequence independently. It is crucial to generate a multi-year forecast, as this allows the model to produce a distinct prediction for each future time step (2018 to 2024). The SoftMax function converts the model’s logits into a probability distribution across the discrete condition rating classes for each predicted year, providing a clear and interpretable forecast of bridge condition. Finally, the output passes through a ReLU activation function, followed by a SoftMax activation function. The SoftMax function converts the model’s logits into a probability distribution across the discrete condition rating classes of the bridge for each predicted year.
3. Results
The proposed transformer architecture was built on Google Colab platform following the flow graph depicted in Figure 9, which provides sufficient computational resources. The model was trained using the Graphic Processing Unit (GPU) NVIDIA T4 using the training dataset (4737 bridges). Furthermore, to effectively train the deep learning architecture, it is important to set the hyper parameters, which are mentioned in Table 3.
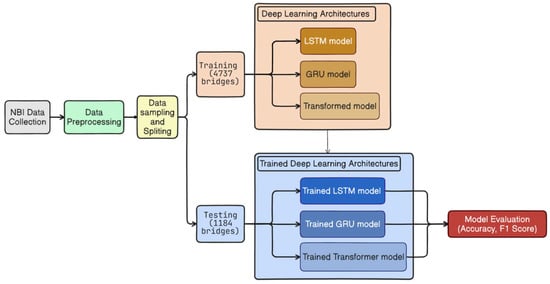
Figure 9.
Model training and evaluation workflow.

Table 3.
Hyperparameter description for the transformer architecture.
The Transformer model was trained with an initial learning rate of 0.01, which was decayed every 10 epochs to promote stable convergence. Training was performed for up to 30 epochs with a batch size of 2, chosen to accommodate the dataset size. Non-linearity was introduced through the ReLU activation function, while the Adam optimizer was employed to adaptively update model weights. The architecture comprised 6 attention heads, enabling the model to extract features from multiple representation subspaces, and 6 stacked layers, which improved its capacity to model complex patterns at the expense of higher computational cost. For fair comparison, the LSTM- and GRU-based models were trained under identical hyperparameter settings, except that they do not employ attention heads or stacked Transformer layers as illustrated in Table 3 and Table 4.

Table 4.
Hyperparameter description for the LSTM and GRU architectures.
The evaluation of the models was based on the following metrics:
- 1.
- Accuracy: It calculates the percentage of correct predictions.
- 2.
- F1-score: It calculates the harmonic mean of precision and recall; this is used because the class distribution is even.
The proposed deep learning architectures were evaluated on a test dataset of 1184 bridges. As illustrated in Figure 10, we assessed the predictive performance of the proposed deep learning architectures for bridge condition rating forecasting under two scenarios: v1 (2018), representing single-year prediction immediately following the training period, and v2 (2018–2024), corresponding to multi-year autoregressive forecasting over a seven-year horizon.
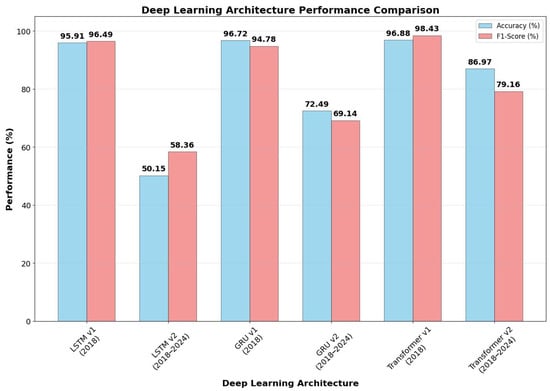
Figure 10.
Deep Learning Architecture Performance’s Comparison.
The results reveal that all three architectures: LSTM, GRU, and Transformer; achieve high accuracy in the short term, with the Transformer attaining the best v1 accuracy at 96.88%, slightly outperforming GRU (96.72%) and LSTM (95.91%). This indicates that recurrent and attention-based models are equally capable of learning near-future deterioration dynamics when sufficient inspection history is available.
However, the performance differences become more pronounced in the long-term forecasts. Both recurrent models suffer significant degradation in accuracy: LSTM drops to 50.15%, while GRU improves slightly to 72.49%, yet both struggles to sustain predictive reliability over extended horizons. In contrast, the Transformer maintains a substantially higher accuracy of 86.97%, highlighting its superior ability to model long-range dependencies and capture complex degradation trajectories across multiple years.
These findings suggest that while LSTM and GRU architectures are well suited for short-term prediction, their reliance on sequential memory limits their robustness in autoregressive settings where compounding errors accumulate over time. The Transformer, by leveraging self-attention across all historical inspection data, mitigates this limitation and achieves more stable long-term predictions. This advantage is particularly relevant for infrastructure asset management, where accurate multi-year forecasts are critical for proactive maintenance planning and resource allocation.
While accuracy provides a general measure of predictive performance, the F1-score offers a more balanced assessment since it jointly considers both precision and recall. This is particularly important in bridge condition rating prediction, where correctly identifying deterioration events is just as critical as avoiding false alarms.
All three models achieved high F1-scores in the short-term (v1, 2018) evaluation. Specifically, the Transformer demonstrated the strongest performance with an F1-score of 98.43%, followed by the LSTM at 96.49% and the GRU at 94.78%. Therefore, while all architectures were effective at capturing immediate condition transitions, the Transformer was more precise in detecting subtle variations while simultaneously maintaining high recall.
However, in the long-term forecasting scenario (v2, 2018–2024), the F1-scores declined across all models due to the inherent challenges of autoregressive prediction. In particular, the LSTM experienced the steepest drop to 58.36%, which reflects its difficulty in sustaining predictive reliability across multiple years. Meanwhile, the GRU performed moderately better, achieving an F1-score of 69.14%, thus indicating greater robustness compared to the LSTM but still showing limited consistency in tracking deterioration patterns. By contrast, the Transformer maintained a substantially higher F1-score of 79.16%, which confirms its advantage in long-range temporal modeling and its superior ability to balance false positives and false negatives.
To evaluate whether the performance difference between the two best models for long-term prediction (Transformer v2 and GRU v2) was statistically significant, a paired t-test was conducted on the bridge-level accuracies using the testing data, conformed by 1184 bridges (2018–2024), as illustrated in Figure 11. The scatter plot shows per-bridge performance, where each point represents the accuracy achieved by a model on a specific bridge. The Transformer v2 (green points) consistently outperformed the GRU v2 (red points) across nearly all bridge indices, achieving a higher mean accuracy (86.97% vs. 72.49%) and demonstrating a substantial 15%-point improvement. Moreover, the Transformer exhibited lower variability (σ = 0.025) compared to the GRU (σ = 0.040), indicating more consistent performance across different bridge structures. The 50-point moving average trend lines (darker green and red) further reveal that both models maintain stable accuracy throughout the dataset, with no systematic degradation based on bridge ordering. Importantly, statistical testing confirmed that this performance gap is highly significant (t = 121.63, p < 0.001), underscoring that the superiority of the Transformer is both statistically and practically meaningful for long-term bridge condition forecasting.
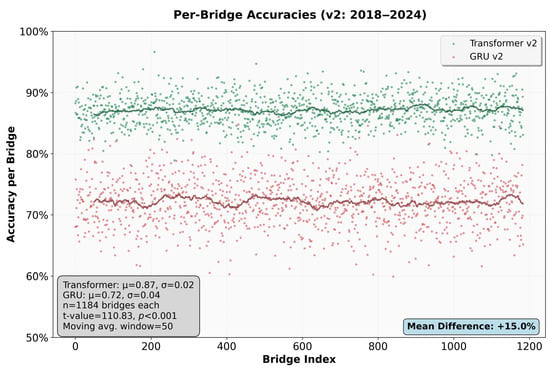
Figure 11.
Bridge-level Accuracy Distribution (v2: 2018–2024).
Taken together, these findings reinforce the superiority of the Transformer architecture for long-term condition rating prediction. Whereas recurrent models tend to accumulate errors over multiple forecasting steps; leading to reduced recall of actual deterioration events; the Transformer, through its self-attention mechanism, enables more stable detection across the prediction horizon. Consequently, this robustness demonstrates the robustness and long-term reliability of the proposed deep learning architecture, offering a significant advancement in predictive maintenance for infrastructure.
To provide a clearer visualization of model performance, Figure 12a–d presents a comparative analysis of predicted bridge condition ratings against their ground truth values for four representative bridges over the 2018–2024 period. Specifically, each subplot corresponds to an individual bridge, juxtaposing the actual data with the forecasts from the LSTM, GRU, and Transformer models. These plots effectively illustrate how each architecture uniquely captures deterioration patterns and recovery trends. For instance, the Transformer model consistently aligns more closely with the ground truth across multiple cases, demonstrating superior accuracy. In contrast, the GRU model often underestimates sudden changes in condition. Furthermore, the LSTM model shows a notable weakness in long-term prediction, as its forecasts tend to plateau and remain static over several years. In practice, this behavior indicates that the LSTM is effectively acting as a “no-change” predictor, reproducing the most recent observed value rather than adapting to future variations.
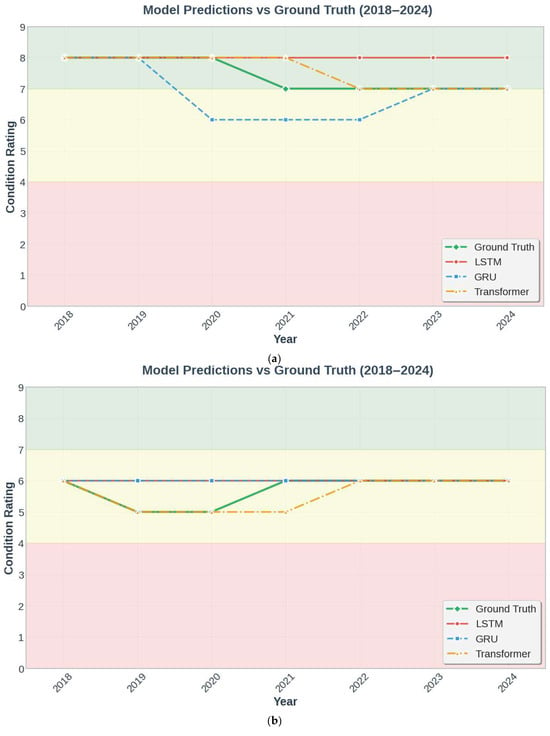
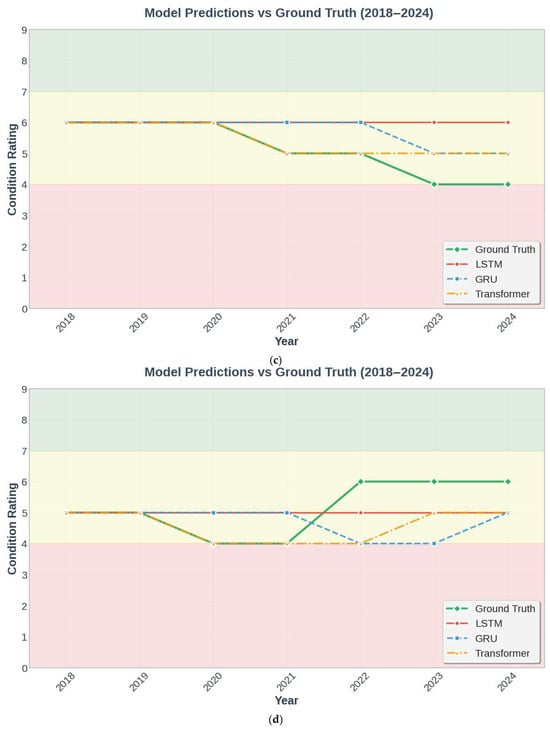
Figure 12.
(a) Bridge #1, (b) Bridge #2, (c) Bridge #3, (d) Bridge #4. A Comparison of Actual vs. Predicted Condition Ratings for Each Deep Learning Architecture using the Testing Dataset.
4. Discussion
Interpreting the results in light of the strong persistence of bridge condition ratings, a natural concern is that high accuracy might be achievable by a trivial “no-change” classifier. However, Figure 10 indicates genuine predictive skill, particularly for the Transformer. In the short-term setting (v1, 2018), all models achieve high accuracy, yet the Transformer is best (96.88%) and simultaneously yields the highest F1-score (98.43%), surpassing the LSTM (95.00% accuracy; 96.49% F1-score) and GRU (96.72% accuracy; 94.78% F1-score). Because F1-score jointly reflects precision and recall, these results show that performance does not arise from simply reproducing stability; rather, the Transformer more reliably captures rare deterioration events while still recognizing prevalent steady periods. This is consistent with its self-attention mechanism, which integrates extended histories and contextual covariates to differentiate, for example, a bridge that has remained at Condition 7 for two versus ten years, thereby adjusting risk for imminent downgrades.
Moreover, the advantages of attention-based modeling become more pronounced over longer horizons. In the seven-year autoregressive setting (v2, 2018–2024), recurrent models degrade substantially (LSTM: 50.15% accuracy; 58.36% F1-score; GRU: 72.49% accuracy; 69.14% F1-score), whereas the Transformer sustains markedly higher performance (86.97% accuracy; 79.16% F1-score). These findings suggest that self-attention better captures long-range dependencies and mitigates compounding errors inherent to multi-step forecasting. Consequently, the model attains high accuracy not by ignoring rare events, but by forecasting them when they arise while simultaneously identifying the much more prevalent periods of stability. For example, it can distinguish between a bridge that has remained in “Condition 7” for two years and one that has been in “Condition 7” for ten years, even when their most recent inspections are identical. By integrating extended history and contextual covariates (e.g., age, traffic volume), the attention mechanism recognizes that the latter scenario carries a substantially higher risk of an imminent downgrade. In short, the model learns degradation dynamics and context, rather than relying on naive persistence.
Interestingly, our results show that the GRU outperformed the LSTM in long-term forecasts, despite the LSTM’s theoretical advantage in modeling long-term dependencies. One reasonable explanation lies in the network design, where a time-distributed dense layer was applied after the recurrent layers to process each timestep independently while preserving temporal order. This design has favored the simpler gating structure of the GRU, which requires fewer parameters and is less prone to overfitting compared to the LSTM.
A primary limitation of the current study lies in the deterministic nature of the forecasting methodology. The employed autoregressive prediction loop, which iteratively uses the condition rating with the maximum likelihood as input for the subsequent prediction, is designed to forecast the single most probable degradation path. While effective for short-term predictions, this approach does not explicitly model the full spectrum of potential outcomes as predictive uncertainty grows over an extended horizon. This inherent characteristic is reflected in the model’s performance, where the accuracy, while high in the initial year (96.88%), experiences a degradation over the seven-year forecast period (86.97%) as uncertainty compounds and the potential for deviation from the most likely path increases.
5. Conclusions
The proposed deep learning model was developed to predict bridge condition ratings from 2018 to 2024, using historical data collected between 1993 and 2017 and by extracting patterns from both structural and environmental characteristics. The dataset, sourced from the National Bridge Inventory (NBI) of eight U.S. states (Connecticut, Delaware, Indiana, Maine, Maryland, New Jersey, Ohio, and Virginia), contributed significantly to achieving promising results. The key findings are summarized as follows:
- By leveraging self-attention to model long-range temporal dependencies, the transformer surpasses recurrent baselines even with time-distributed layers, achieving higher short (2018) and long-term (2018–2024) accuracy (short-term prediction: 96.88% vs. GRU:96.72%, LSTM: 95.00%; long-term prediction: 86.97% vs. GRU: 72.49%/LSTM: 50.15%).
- Regarding the transformer architecture, unlike LSTM/GRU, with its time-distributed layers that tend to plateau or underestimate abrupt changes, the attention mechanism exploits extended histories and covariates to discriminate subtle risk shifts, resulting in more stable and actionable multi-year predictions.
Future research should aim to improve predictive accuracy and model generalizability by fine-tuning hyperparameters, expanding the dataset, and exploring alternative input representations. As the current dataset predominantly features concrete bridges, incorporating other structural types such as steel, masonry, and composite bridges would enhance the model’s applicability across diverse bridge typologies.
In addition, to address the constraints of a single-path prediction, future work could focus on developing a probabilistic forecasting framework. Instead of outputting a single condition rating, such a model would predict a full probability distribution for the bridge’s state at each future time step. Methodologies such as Monte Carlo simulation could then be employed to sample from these distributions, generating a large ensemble of possible degradation trajectories. This would not only provide a more comprehensive understanding of long-term bridge behavior under uncertainty but also facilitate more robust decision-making, enabling the analysis of various “what-if” scenarios, which are crucial for strategic maintenance and proactive asset management.
Author Contributions
Conceptualization, M.F.F.C., Y.Y. and C.H.; data curation, M.F.F.C.; methodology, M.F.F.C. and Y.Y.; software, M.F.F.C.; supervision, Y.Y.; validation, M.F.F.C.; writing—original draft, M.F.F.C.; writing—review and editing, Y.Y. All authors have read and agreed to the published version of the manuscript.
Funding
The work was supported by the National Program of Scholarships and Educational Loans (PRONABEC), a governmental organization of Peru (RJ 1030-2024-MINEDU-VMGI-PRONABEC-DIBEC).
Data Availability Statement
The dataset utilized in this study is publicly available thanks to the U.S. Department of Transportation; it can be accessed via the following link: https://infobridge.fhwa.dot.gov/Data/SelectedBridges (accessed on 20 May 2025).
Conflicts of Interest
Author Cengis Hasan was employed by the company Cognifinity. The remaining authors declare that the research was conducted in the absence of any commercial or financial relationships that could be construed as a potential conflict of interest.
References
- Shahrivar, F.; Sidiq, A.; Mahmoodian, M.; Jayasinghe, S.; Sun, Z.; Setunge, S. AI-Based Bridge Maintenance Management: A Comprehensive Review. Artif. Intell. Rev. 2025, 58, 135. [Google Scholar] [CrossRef]
- Experts Dispute RAC Foundation Claim That One in 24 UK Road Bridges Are “substandard”. New Civil Engineer. Available online: https://www.newcivilengineer.com/latest/experts-dispute-rac-foundation-that-claim-one-in-24-uk-road-bridges-are-substandard-17-03-2023/ (accessed on 9 June 2025).
- Number of Substandard Road Bridges Rises for Second Year Running. New Civil Engineer. Available online: https://www.newcivilengineer.com/latest/number-of-substandard-road-bridges-rises-for-second-year-running-25-03-2022/ (accessed on 9 June 2025).
- Wang, C.; Yao, C.; Zhao, S.; Zhao, S.; Li, Y. A Comparative Study of a Fully-Connected Artificial Neural Network and a Convolutional Neural Network in Predicting Bridge Maintenance Costs. Appl. Sci. 2022, 12, 3595. [Google Scholar] [CrossRef]
- Jiang, Y.; Yang, G.; Li, H.; Zhang, T. Knowledge Driven Approach for Smart Bridge Maintenance Using Big Data Mining. Autom Constr 2023, 146, 104673. [Google Scholar] [CrossRef]
- Transport Scotland’s Approach to Climate Change Adaptation and Resilience. Available online: https://www.transport.gov.scot/publication/transport-scotland-s-approach-to-climate-change-adaptation-and-resilience/ (accessed on 10 June 2025).
- Jaroszweski, D.; Wood, R.; Chapman, L. UK Climate Risk Independent Assessment Technical Report Chapter 4: Infrastructure. UK Climate Risk. 2021. Available online: https://www.ukclimaterisk.org/publications/technical-report-ccra3-ia/chapter-4/#section-1-about-this-document (accessed on 10 June 2025).
- Domaneschi, M.; Martinelli, L.; Cucuzza, R.; Noori, M.; Marano, G.C. Structural Control and Health Monitoring Contributions to Service-Life Extension of Bridges. ce/papers 2023, 6, 741–745. [Google Scholar] [CrossRef]
- Li, K.; Wang, P.; Li, Q.; Fan, Z. Durability Assessment of Concrete Structures in HZM Sea Link Project for Service Life of 120 Years. Mater. Struct. Mater. Constr. 2016, 49, 3785–3800. [Google Scholar] [CrossRef]
- Ailaney, R. Bridge Preservation Guide Maintaining a Resilient Infrastructure to Preserve Mobility Quality Assurance Statement. 2018. Available online: https://rosap.ntl.bts.gov/view/dot/43527 (accessed on 10 June 2025).
- Hein, D.; Croteau, J. The Impact of Preventive Maintenance Programs on the Condition of Roadway Networks. In Proceedings of the 2004 Annual Conference of the Transportation Association of Canada, Québec City, QC, Canada, 19–22 September 2004. [Google Scholar]
- Abdallah, A.M.; Atadero, R.A.; Ozbek, M.E. A State-of-the-Art Review of Bridge Inspection Planning: Current Situation and Future Needs. J. Bridge Eng. 2022, 27, 03121001. [Google Scholar] [CrossRef]
- Sowemimo, A.D.; Chorzepa, M.G.; Birgisson, B. Recurrent Neural Network for Quantitative Time Series Predictions of Bridge Condition Ratings. Infrastructures 2024, 9, 221. [Google Scholar] [CrossRef]
- Fiorillo, G.; Nassif, H. Application of Machine Learning Techniques for the Analysis of National Bridge Inventory and Bridge Element Data. Transp. Res. Rec. 2019, 2673, 99–110. [Google Scholar] [CrossRef]
- Fereshtehnejad, E.; Gazzola, G.; Parekh, P.; Nakrani, C.; Parvardeh, H. Detecting Anomalies in National Bridge Inventory Databases Using Machine Learning Methods. Transp. Res. Rec. 2022, 2676, 453–467. [Google Scholar] [CrossRef]
- Nehme, J.A. InfoBridge: Easy Access to the National Bridge Inventory and Much More—Part 1. ASPIRE The Concrete Bridge Magazine. 2020. Available online: https://www.aspirebridge.com/magazine/2020Winter/ (accessed on 10 June 2025).
- Goyal, R.; Whelan, M.J.; Cavalline, T.L. Characterising the Effect of External Factors on Deterioration Rates of Bridge Components Using Multivariate Proportional Hazards Regression. Struct. Infrastruct. Eng. 2017, 13, 894–905. [Google Scholar] [CrossRef]
- Moomen, M.; Qiao, Y.; Agbelie, B.R.; Labi, S.; Sinha, K.C. Bridge Deterioration Models to Support Indiana’s Bridge Management System; Joint Transportation Research Program Publication No. FHWA/IN/JTRP-2016/03; Purdue University: West Lafayette, IN, USA, 2016. [Google Scholar] [CrossRef]
- Morcous, G. Performance Prediction of Bridge Deck Systems Using Markov Chains. J. Perform. Constr. Facil. 2006, 20, 146–155. [Google Scholar] [CrossRef]
- Ranjith, S.; Setunge, S.; Gravina, R.; Venkatesan, S. Deterioration Prediction of Timber Bridge Elements Using the Markov Chain. J. Perform. Constr. Facil. 2013, 27, 319–325. [Google Scholar] [CrossRef]
- Biswas, M.; Welch, J.G. BDES: A Bridge Design Expert System. Eng. Comput. 1987, 2, 125–136. [Google Scholar] [CrossRef]
- Jaafar, M.S.; Yardim, Y.; Thanoon, W.A.M.; Noorzaie, J. Development of a Knowledge-Based System for Condition Assessment of Bridges. Indian Concr. J. 2003, 77, 1484–1490. Available online: https://www.researchgate.net/publication/292917043_Development_of_a_knowledge-based_system_for_condition_assessment_of_bridges (accessed on 10 June 2025).
- Cheng, M.Y.; Wu, Y.W.; Syu, R.F. Seismic Assessment of Bridge Diagnostic in Taiwan Using the Evolutionary Support Vector Machine Inference Model (ESIM). Appl. Artif. Intell. 2014, 28, 449–469. [Google Scholar] [CrossRef]
- Mia, M.M.; Kameshwar, S. Machine Learning Approach for Predicting Bridge Components’ Condition Ratings. Front. Built Environ. 2023, 9, 1254269. [Google Scholar] [CrossRef]
- Xu, Z.; Qian, S.; Ran, X.; Zhou, J. Application of Deep Convolution Neural Network in Crack Identification. Appl. Artif. Intell. 2022, 36, 2014188. [Google Scholar] [CrossRef]
- Bao, Y.; Sun, H.; Xu, Y.; Guan, X.; Pan, Q.; Liu, D. Recent Advances in Structural Health Diagnosis: A Machine Learning Perspective. Adv. Bridge Eng. 2025, 6, 1–28. [Google Scholar] [CrossRef]
- Yu, E.; Wei, H.; Han, Y.; Hu, P.; Xu, G. Application of Time Series Prediction Techniques for Coastal Bridge Engineering. Adv. Bridge Eng. 2021, 2, 6. [Google Scholar] [CrossRef]
- Liu, H.; Zhang, Y. Bridge Condition Rating Data Modeling Using Deep Learning Algorithm. Struct. Infrastruct. Eng. 2020, 16, 1447–1460. [Google Scholar] [CrossRef]
- Liu, H.; Nehme, J.; Lu, P. An Application of Convolutional Neural Network for Deterioration Modeling of Highway Bridge Components in the United States. Struct. Infrastruct. Eng. 2023, 19, 731–744. [Google Scholar] [CrossRef]
- Vaswani, A.; Brain, G.; Shazeer, N.; Parmar, N.; Uszkoreit, J.; Jones, L.; Gomez, A.N.; Kaiser, Ł.; Polosukhin, I. Attention Is All You Need. Adv. Neural. Inf. Process Syst. 2017, 30, 5998–6008. [Google Scholar]
- Radford, A.; Narasimhan, K. Improving Language Understanding by Generative Pre-Training. 2018. Available online: https://www.mikecaptain.com/resources/pdf/GPT-1.pdf (accessed on 14 July 2025).
- Li, Z.; Li, D.; Sun, T. A Transformer-Based Bridge Structural Response Prediction Framework. Sensors 2022, 22, 3100. [Google Scholar] [CrossRef] [PubMed]
- Madanat, S.; Mishalani, R.; Ibrahim, W.H.W. Estimation of Infrastructure Transition Probabilities from Condition Rating Data. J. Infrastruct. Syst. 1995, 1, 120–125. [Google Scholar] [CrossRef]
- Chang, M.; Maguire, M.; Sun, Y. Framework for Mitigating Human Bias in Selection of Explanatory Variables for Bridge Deterioration Modeling. J. Infrastruct. Syst. 2017, 23, 04017002. [Google Scholar] [CrossRef]
- Kim, Y.J.; Queiroz, L.B. Big Data for Condition Evaluation of Constructed Bridges. Eng. Struct. 2017, 141, 217–227. [Google Scholar] [CrossRef]
- Ghonima, O.; Schumacher, T.; Unnikrishnan, A.; Fleischhacker, A. Advancing Bridge Technology, Task 10: Statistical Analysis and Modeling of US Concrete Highway Bridge Deck Performance—Internal Final Report. Civ. Environ. Eng. Fac. Publ. Present. 2018, 9, 443. [Google Scholar]
- Ryan, T.W.; Lloyd, C.E.; Pichura, M.S.; Tarasovich, D.M.; Fitzgerald, S. Bridge Inspector’s Reference Manual (BIRM); United States Department of Transportation, Federal Highway Administration; National Highway Institute: Vienna, VA, USA, 2022. Available online: https://rosap.ntl.bts.gov/view/dot/71829 (accessed on 10 June 2025).
- Tokdemir, O.B.; Ayvalik, C.; Mohammadi, J. Prediction of Highway Bridge Performance by Artificial Neural Networks and Genetic Algorithms. In Proceedings of the 17th IAARC/CIB/IEEE/IFAC/IFR International Symposium on Automation and Robotics in Construction, Taipei, Taiwan, 28 June–1 July 2017. [Google Scholar] [CrossRef]
- Huang, Y.-H. Artificial Neural Network Model of Bridge Deterioration. J. Perform. Constr. Facil. 2010, 24, 597–602. [Google Scholar] [CrossRef]
- Allah Bukhsh, Z.; Stipanovic, I.; Saeed, A.; Doree, A.G. Maintenance Intervention Predictions Using Entity-Embedding Neural Networks. Autom. Constr. 2020, 116, 103202. [Google Scholar] [CrossRef]
- Lei, X.; Xia, Y.; Komarizadehasl, S.; Sun, L. Condition Level Deteriorations Modeling of RC Beam Bridges with U-Net Convolutional Neural Networks. Structures 2022, 42, 333–342. [Google Scholar] [CrossRef]
- Zhang, G.Q.; Min, Q.; Wang, B. A Decision-Making System for Large Span Bridge Inspection Intervals Based on Sliding Window DFNN. Adv. Bridge Eng. 2023, 4, 16. [Google Scholar] [CrossRef]
- Flores Cuenca, M.F.; Malikov, A.K.U.; Kim, J.; Cho, Y.; Jeong, K.S. A Novel Flaw Detection Approach in Carbon Steel Pipes through Ultrasonic Guided Waves and Optimized Transformer Neural Networks. J. Mech. Sci. Technol. 2024, 38, 3253–3263. [Google Scholar] [CrossRef]
- Bannadabhavi, A.; Lee, S.; Deng, W.; Ying, R.; Li, X. Community-Aware Transformer for Autism Prediction in FMRI Connectome. In International Conference on Medical Image Computing and Computer-Assisted Intervention; Lecture Notes in Computer Science (Including Subseries Lecture Notes in Artificial Intelligence and Lecture Notes in Bioinformatics); Springer Nature: Cham, Switzerland, 2023; Volume 14227, pp. 287–297. [Google Scholar] [CrossRef]
- Saeed, F.; Aldera, S. Adaptive Renewable Energy Forecasting Utilizing a Data-Driven PCA-Transformer Architecture. IEEE Access 2024, 12, 109269–109280. [Google Scholar] [CrossRef]
- Xie, L.; Chen, Z.; Yu, S. Deep Convolutional Transformer Network for Stock Movement Prediction. Electronics 2024, 13, 4225. [Google Scholar] [CrossRef]
- Faresh Khan, K.H.; Simon, S.P.; Mohammed Mansoor, O. Time Series Prediction of Solar Radiation Using Transformer Neural Networks. In Proceedings of the INDICON 2022—2022 IEEE 19th India Council International Conference, Kochi, India, 24–26 November 2022. [Google Scholar] [CrossRef]
Disclaimer/Publisher’s Note: The statements, opinions and data contained in all publications are solely those of the individual author(s) and contributor(s) and not of MDPI and/or the editor(s). MDPI and/or the editor(s) disclaim responsibility for any injury to people or property resulting from any ideas, methods, instructions or products referred to in the content. |
© 2025 by the authors. Licensee MDPI, Basel, Switzerland. This article is an open access article distributed under the terms and conditions of the Creative Commons Attribution (CC BY) license (https://creativecommons.org/licenses/by/4.0/).