Declaration-Ready Climate-Neutral PEDs: Budget-Based, Hourly LCA Including Mobility and Flexibility
Abstract
1. Introduction
- NZEBs in Renewable Energy Communities (RECs) and energy sharing. Recent work extends NZEB logic to building-to-building exchange, where prosumer surpluses buffer consumer deficits inside a REC [10]. While this can improve local self-consumption and grid friendliness, it remains annual-balance driven and typically does not enforce finite, Paris-compatible CO2 budgets.
- Zero-Emission Neighborhoods (ZEN). The Norwegian ZEN program defines neighborhood-scale goals “towards zero life-cycle GHG emissions,” explicitly emphasizing life-cycle accounting, high energy efficiency, high shares of local renewables, and smart/flexible operation. ZEN provides ambition levels and guidance but leaves budget allocation and declaration rules to localization [11]
- Positive Energy Districts (PEDs). IEA EBC Annex 83 positions PEDs as districts with net annual energy surplus and operational flexibility. Many PED implementations, however, still report annual net balances without translating them into cumulative, per-m2 CO2 budgets aligned with Paris [12].
Novelty and Contribution of This Study
- The integration of operational, embodied, and mobility energy and emissions into a combined assessment system with quantitative target budgets
- The assembly of these factors into a nationally applicable declaration system.
- The demonstration of achievability of this declaration for a diverse range of ambitious districts.
2. Materials and Methods
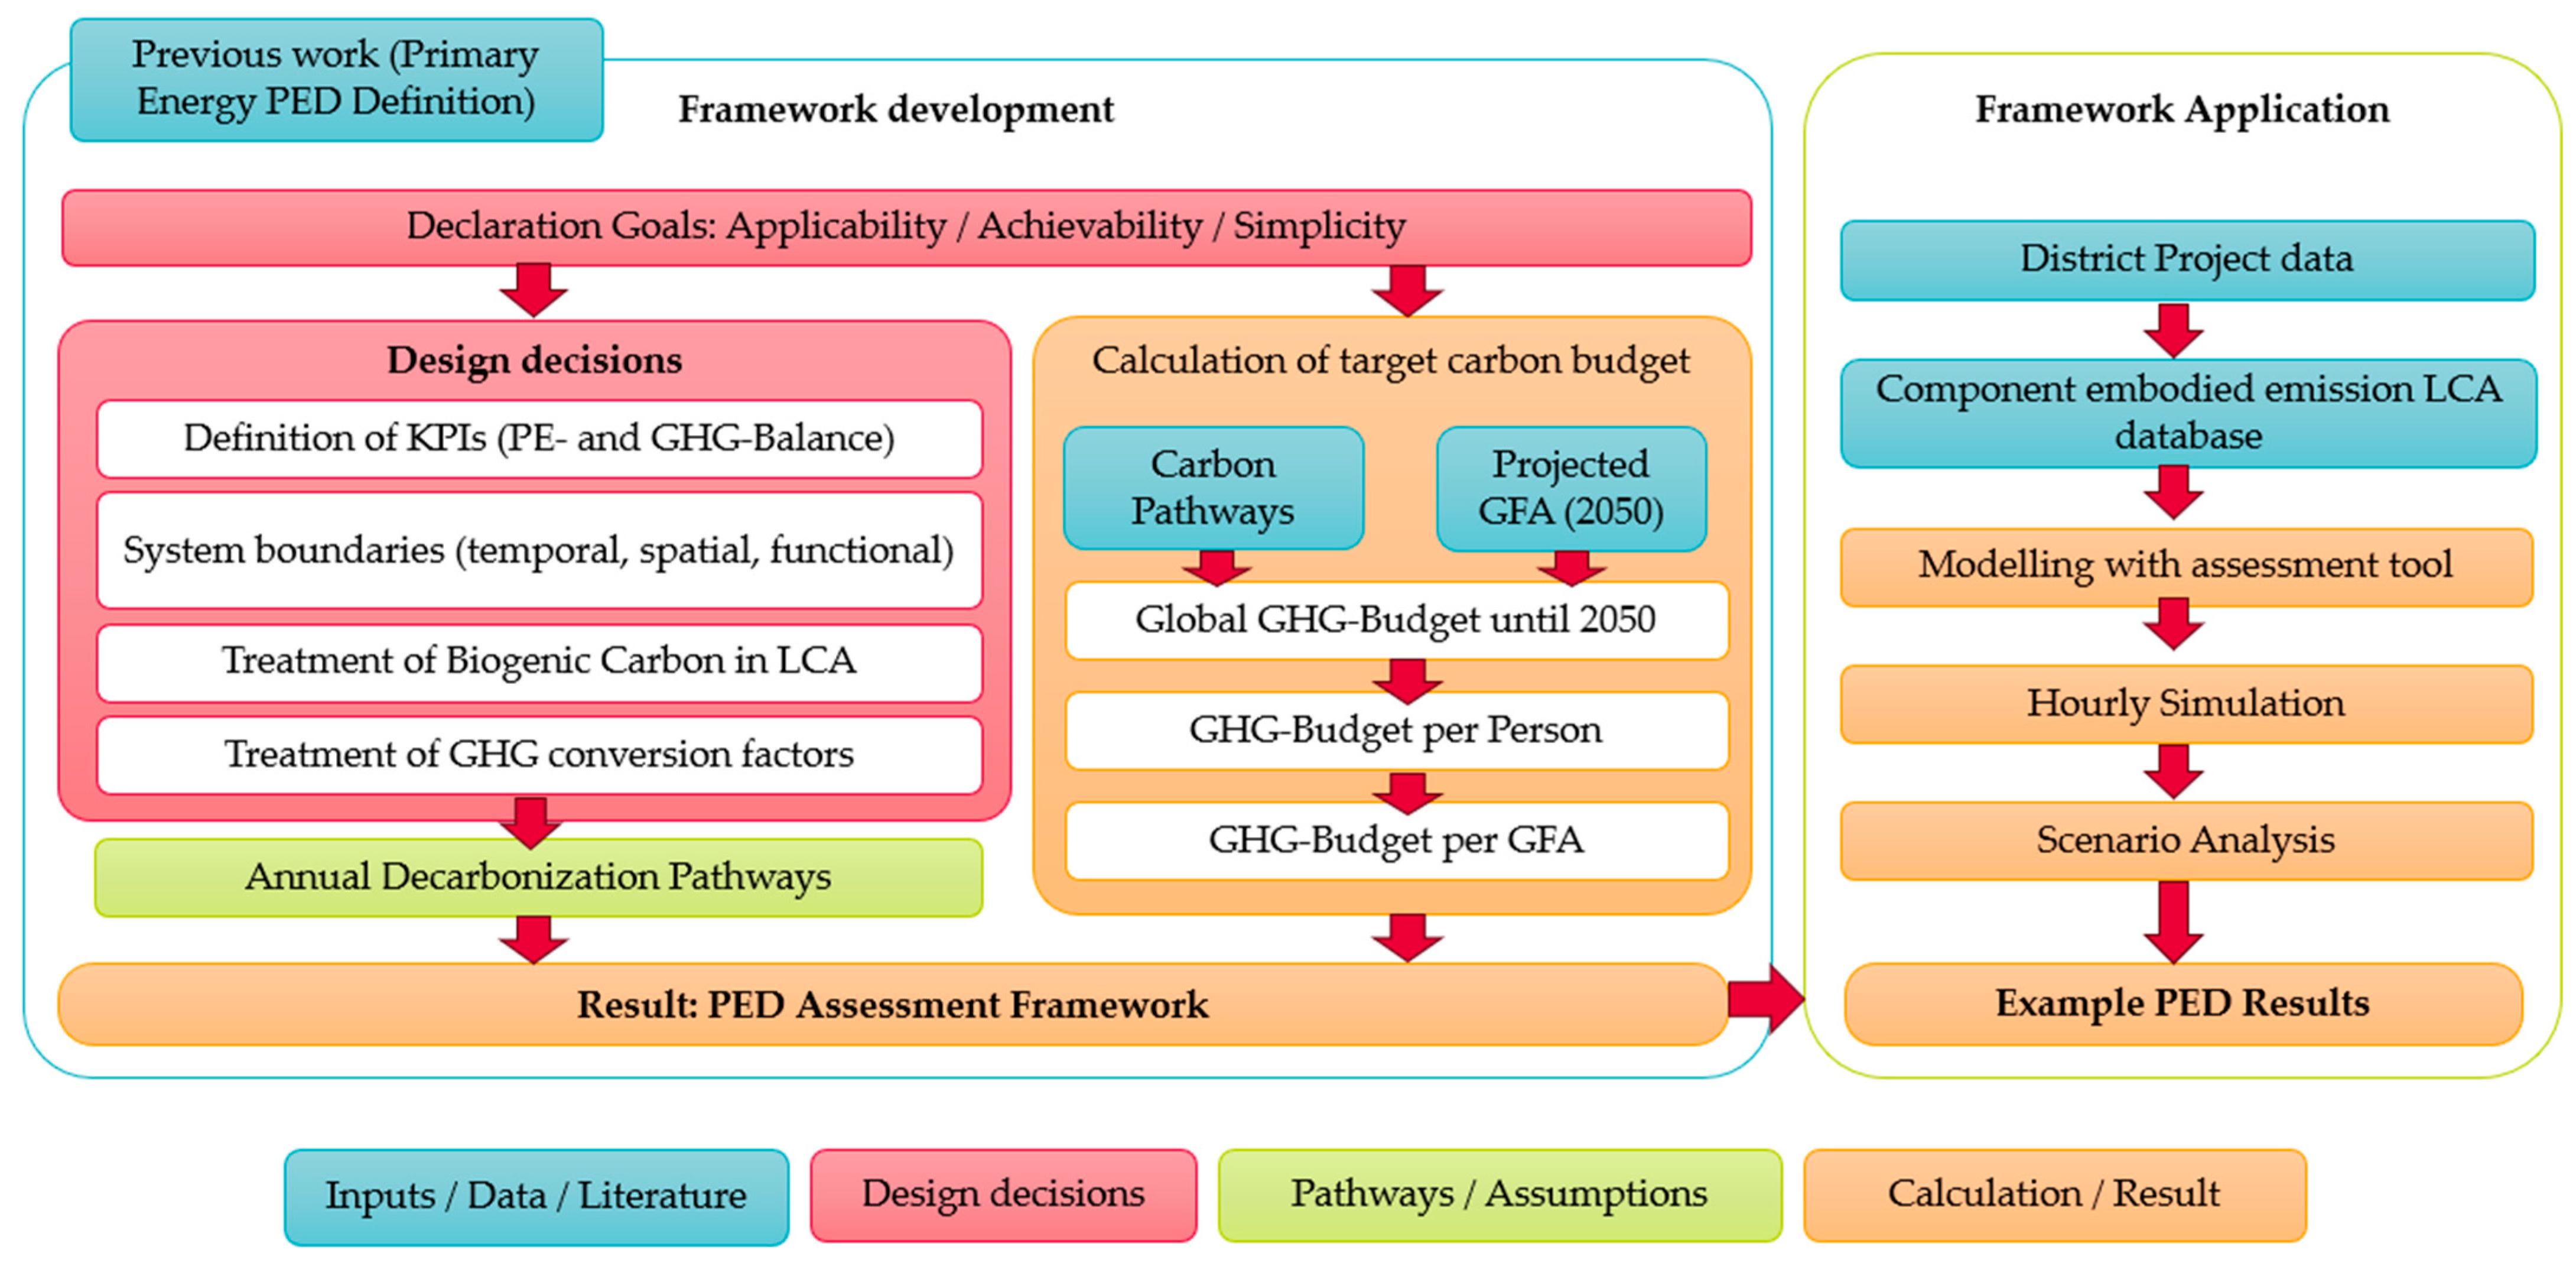
2.1. Methodological Principles and Declaration Goals
- Practical applicability and stakeholder relevance—The method is designed to be appliable for real estate developers, municipalities, and planning professionals, enabling its integration into certification schemes and project assessments [38,39]. Its scope is limited to emissions that can be directly influenced through planning and construction decisions—namely, operational energy use, EMIM, and embodied emissions—ensuring decision-making relevance.
- Integrated and adaptable system boundaries—Assessment boundaries extend beyond individual buildings to the full Positive Energy District (PED) system, covering on-site generation, storage, flexibility, and interconnections with surrounding grids. The framework retains adaptability in data sources, emission factors, and system configurations, allowing regional customization while ensuring methodological comparability.
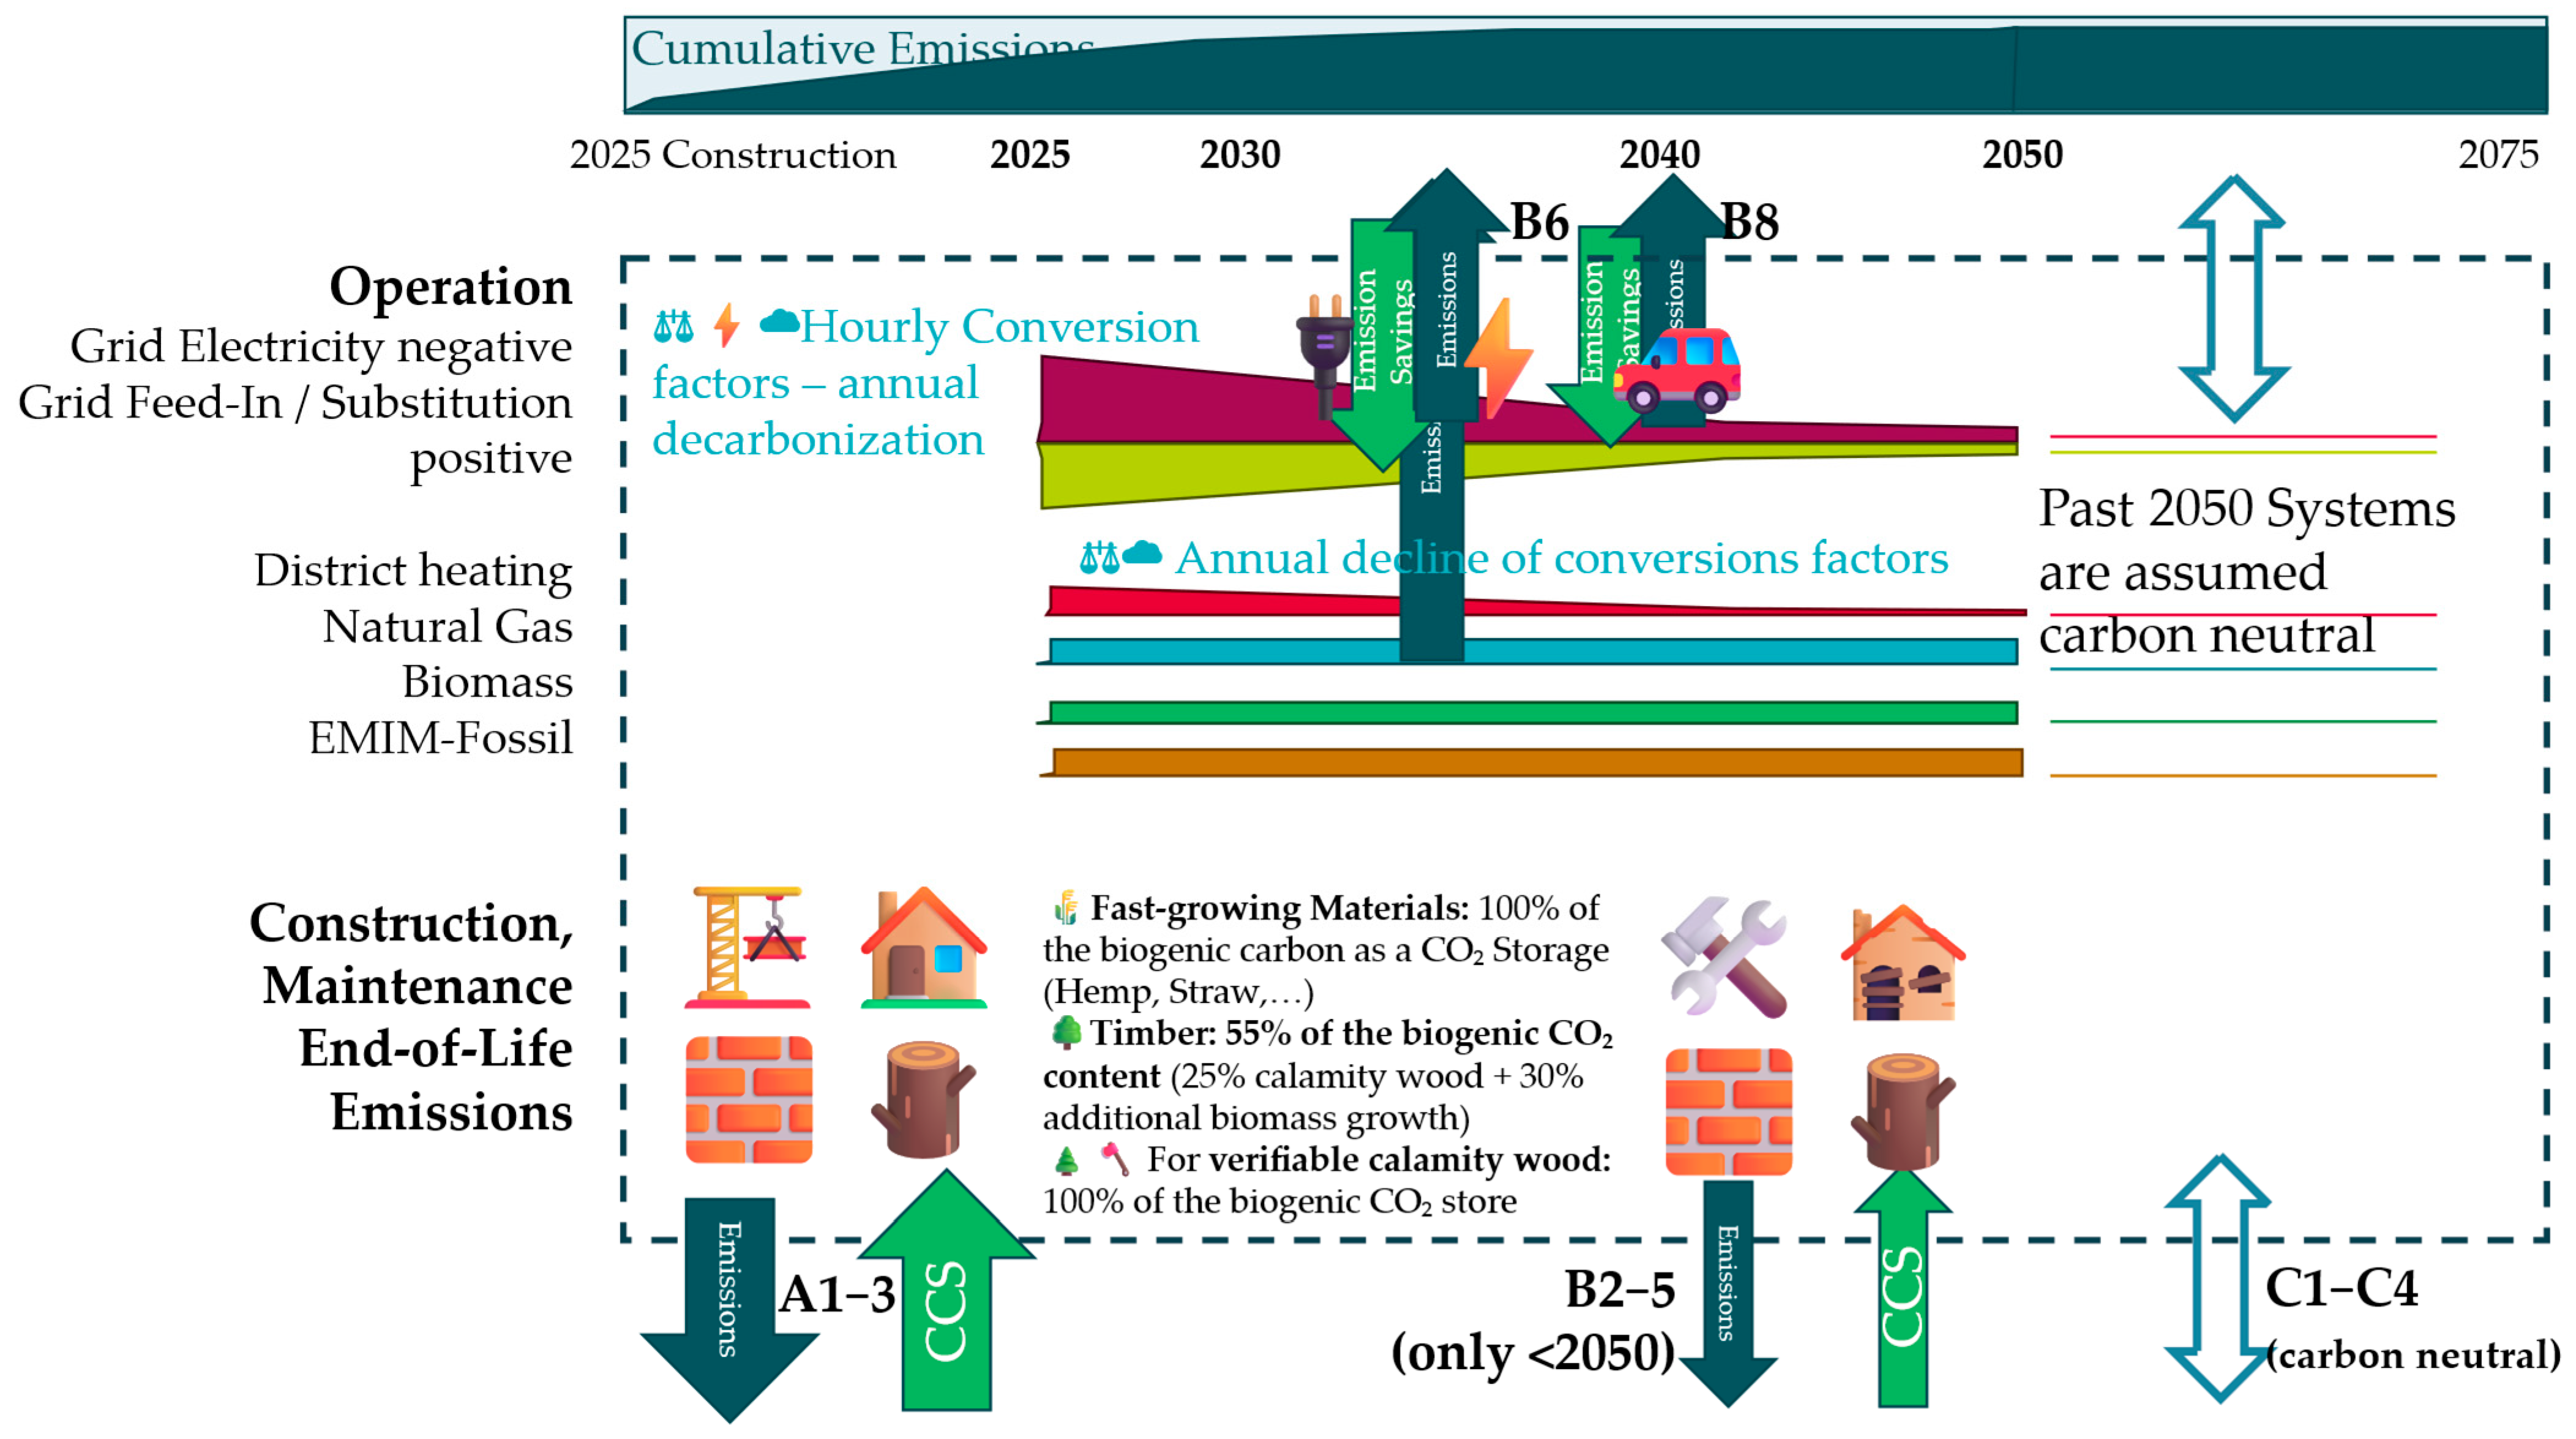
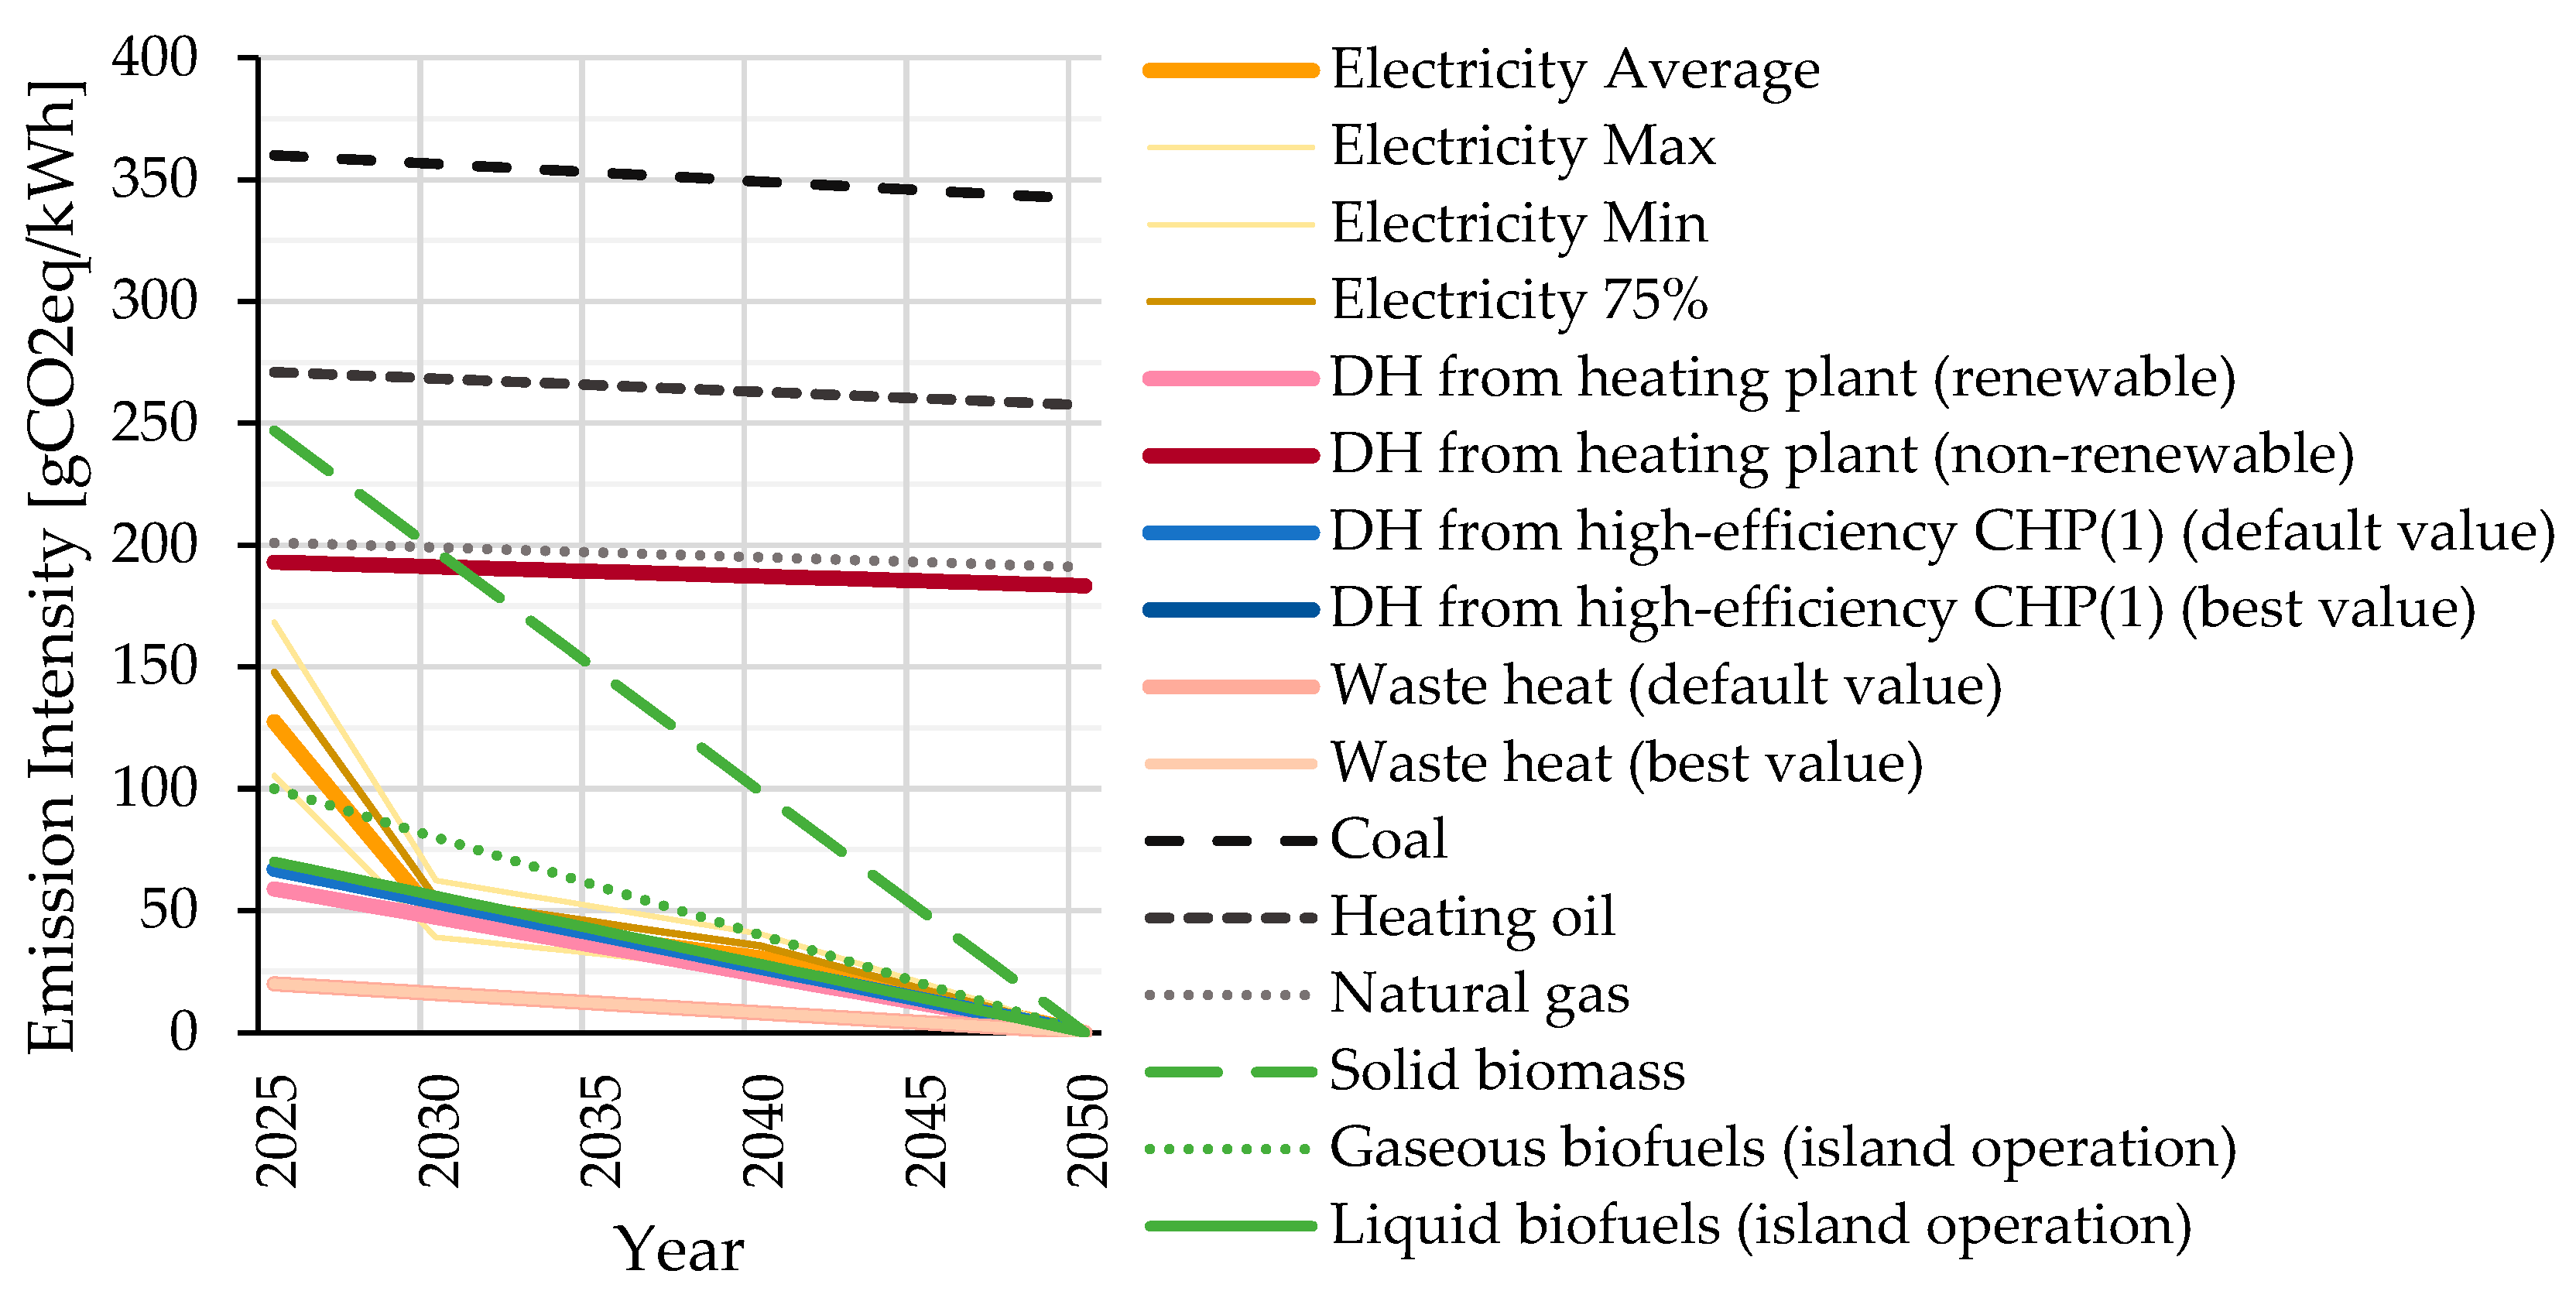
- Temporal differentiation—Emissions are assessed over a 50-year timeframe (2025–2075), with the assumption that climate neutrality is achieved for all services by 2050. As a result, all conversion factors for both operational and embodied energy are assumed to be zero by 2050, reflecting the expected decarbonization of energy carriers and building systems. This approach ensures alignment with long-term climate goals while considering the gradual reduction in emissions over the assessment period.
- Science-based, budget-oriented compliance thresholds—The method is anchored in downscaled CO2 budgets consistent with Austria’s 2040 climate neutrality target and the 1.5 °C global carbon budget [1]. It establishes a hierarchy of compliance thresholds: an ambitious target value representing a precautionary level for high-confidence Paris alignment, and a maximum compliance limit that must not be exceeded for a project to qualify as “climate-neutral PED.”
2.2. Key Performance Indicators (KPIs) and PED Levels
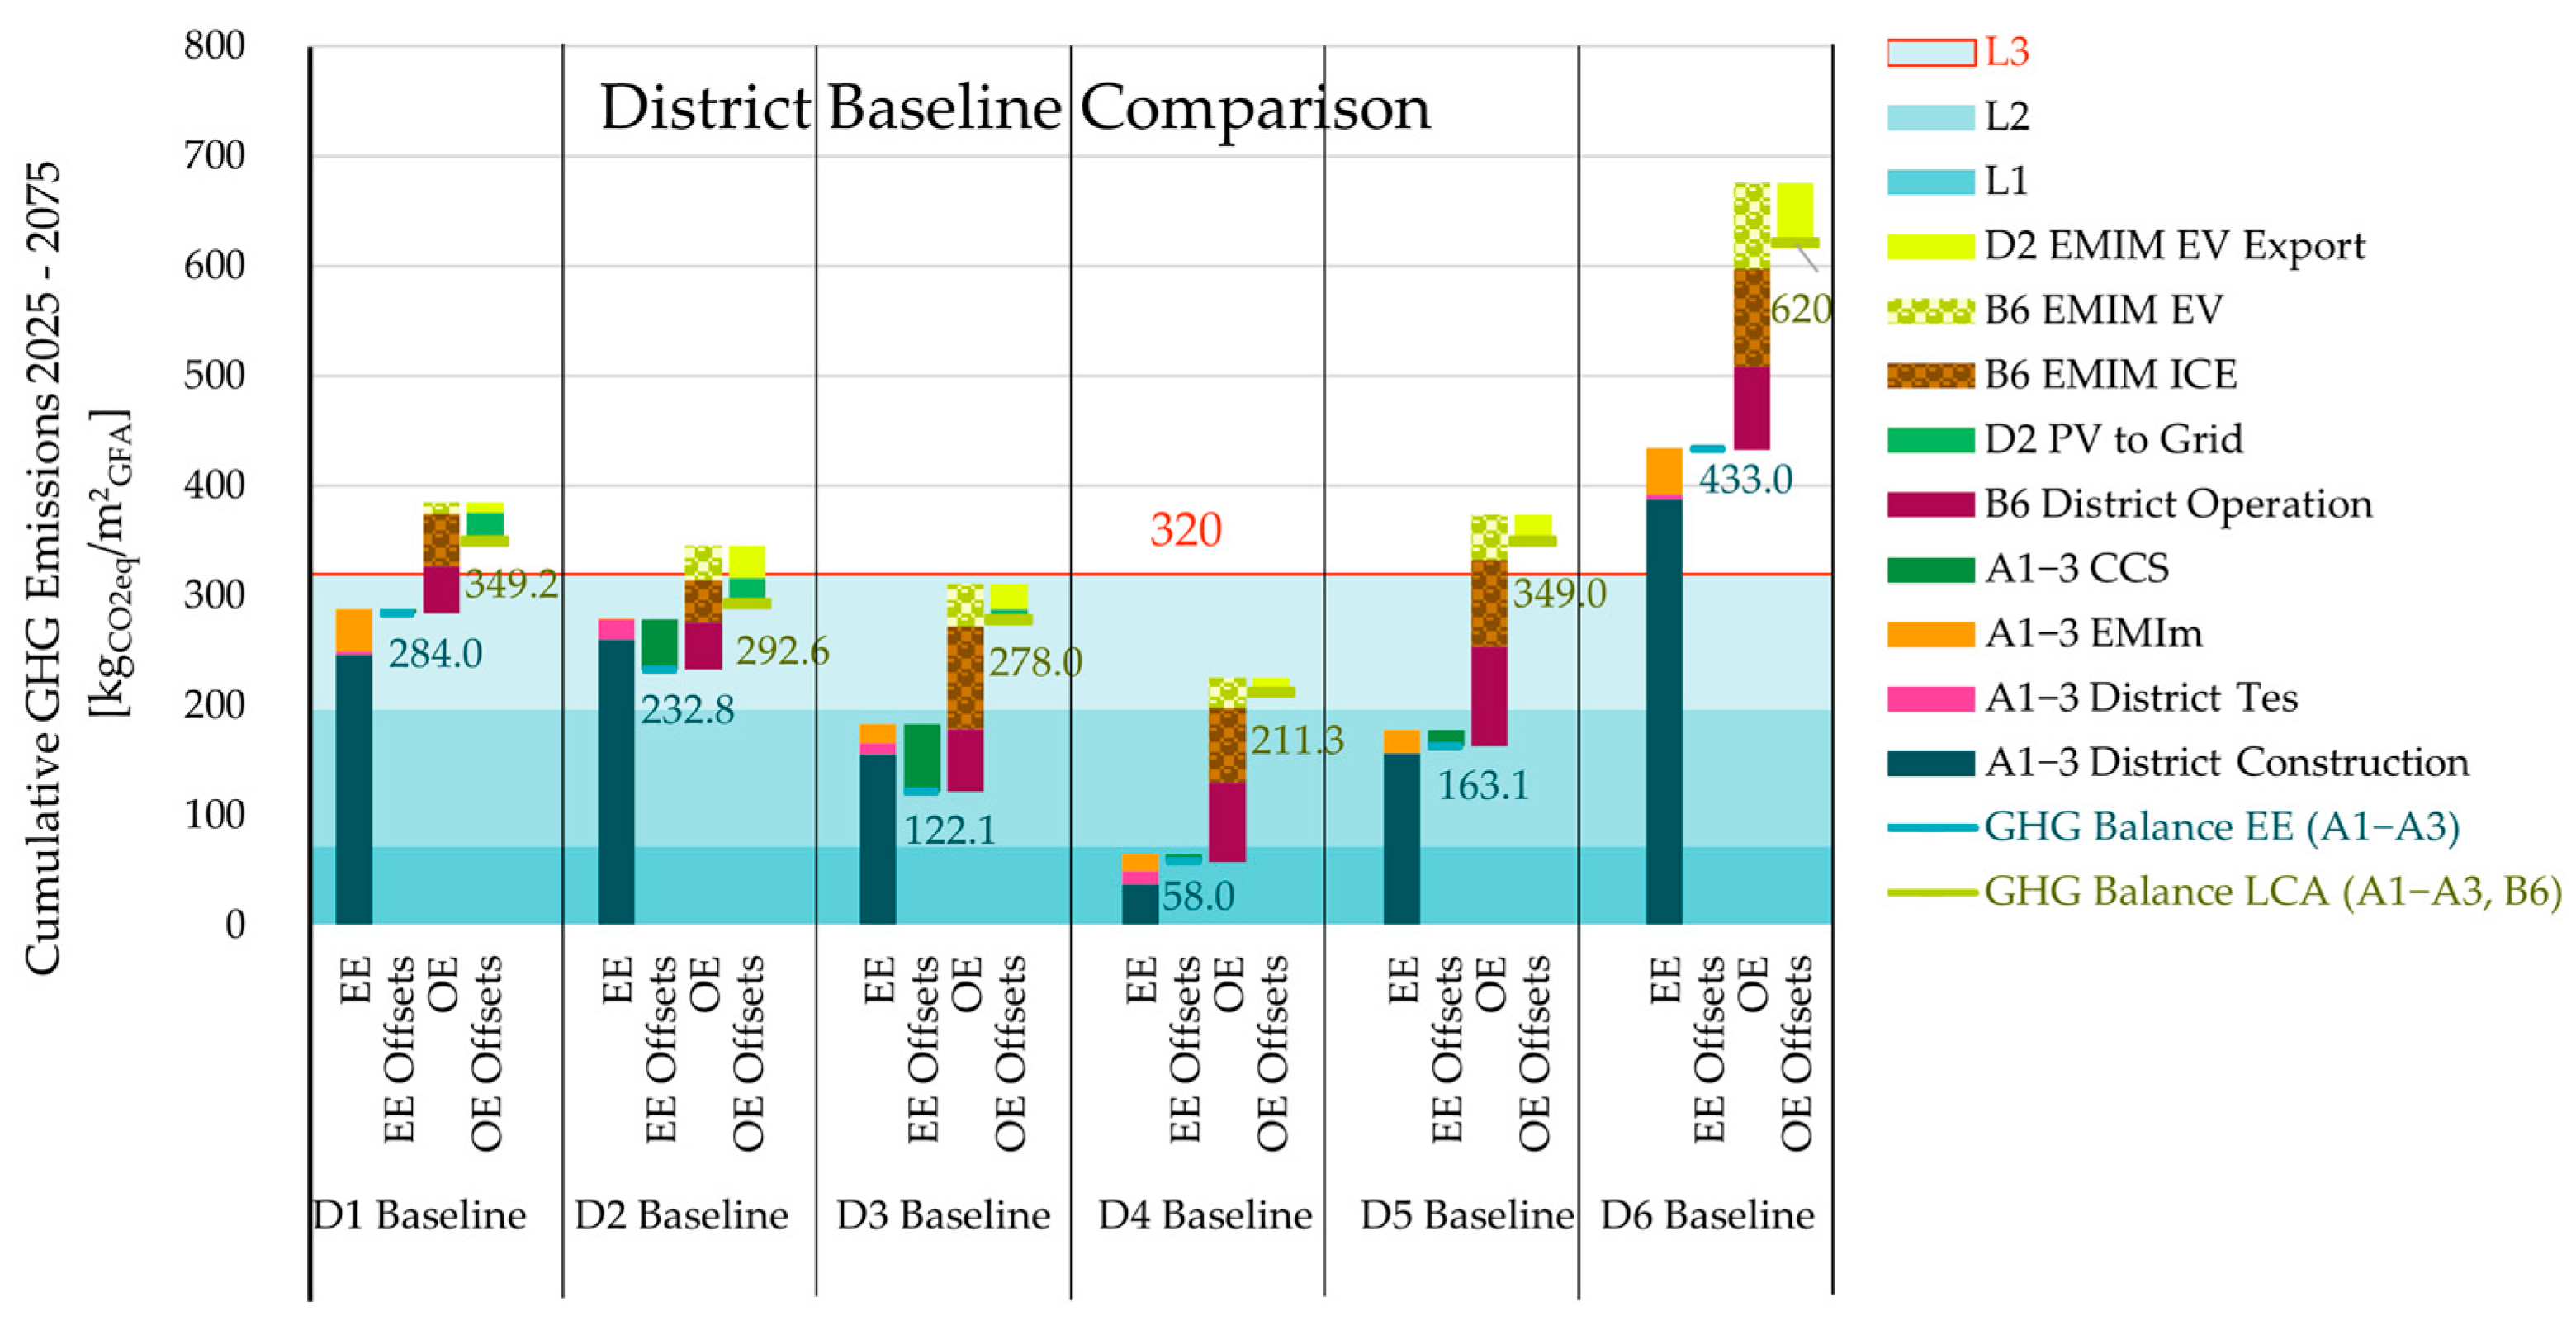
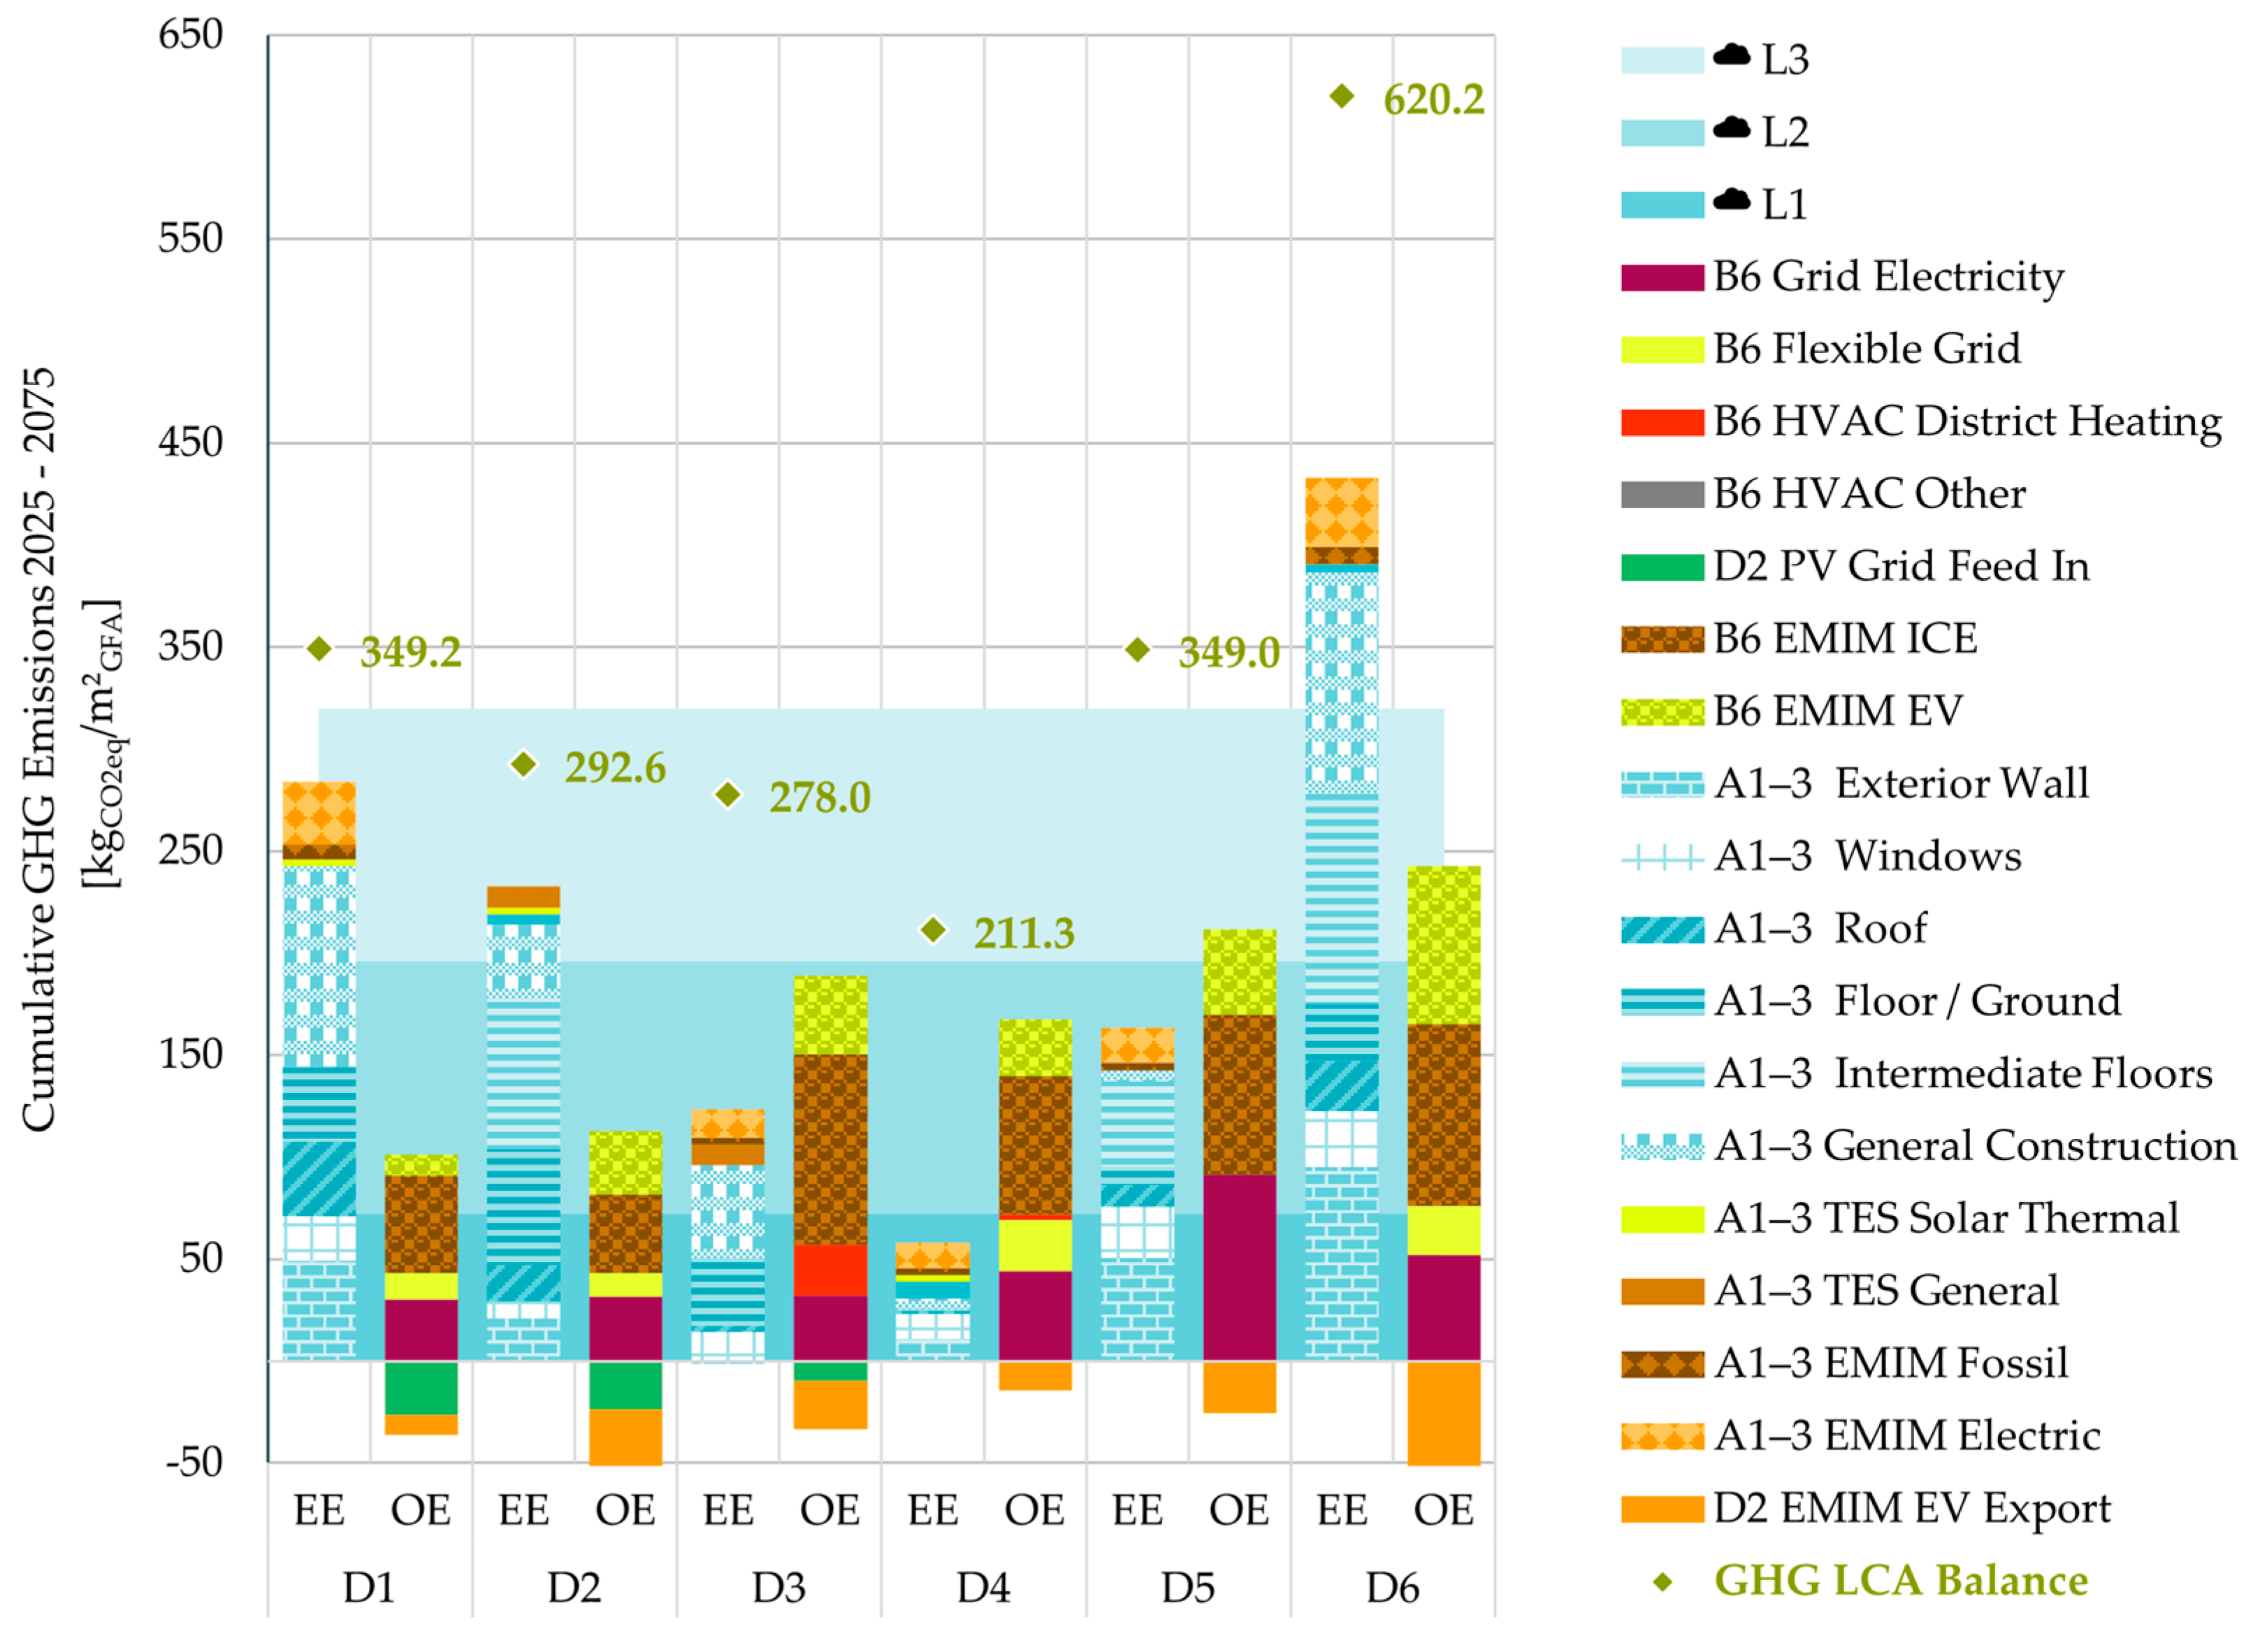
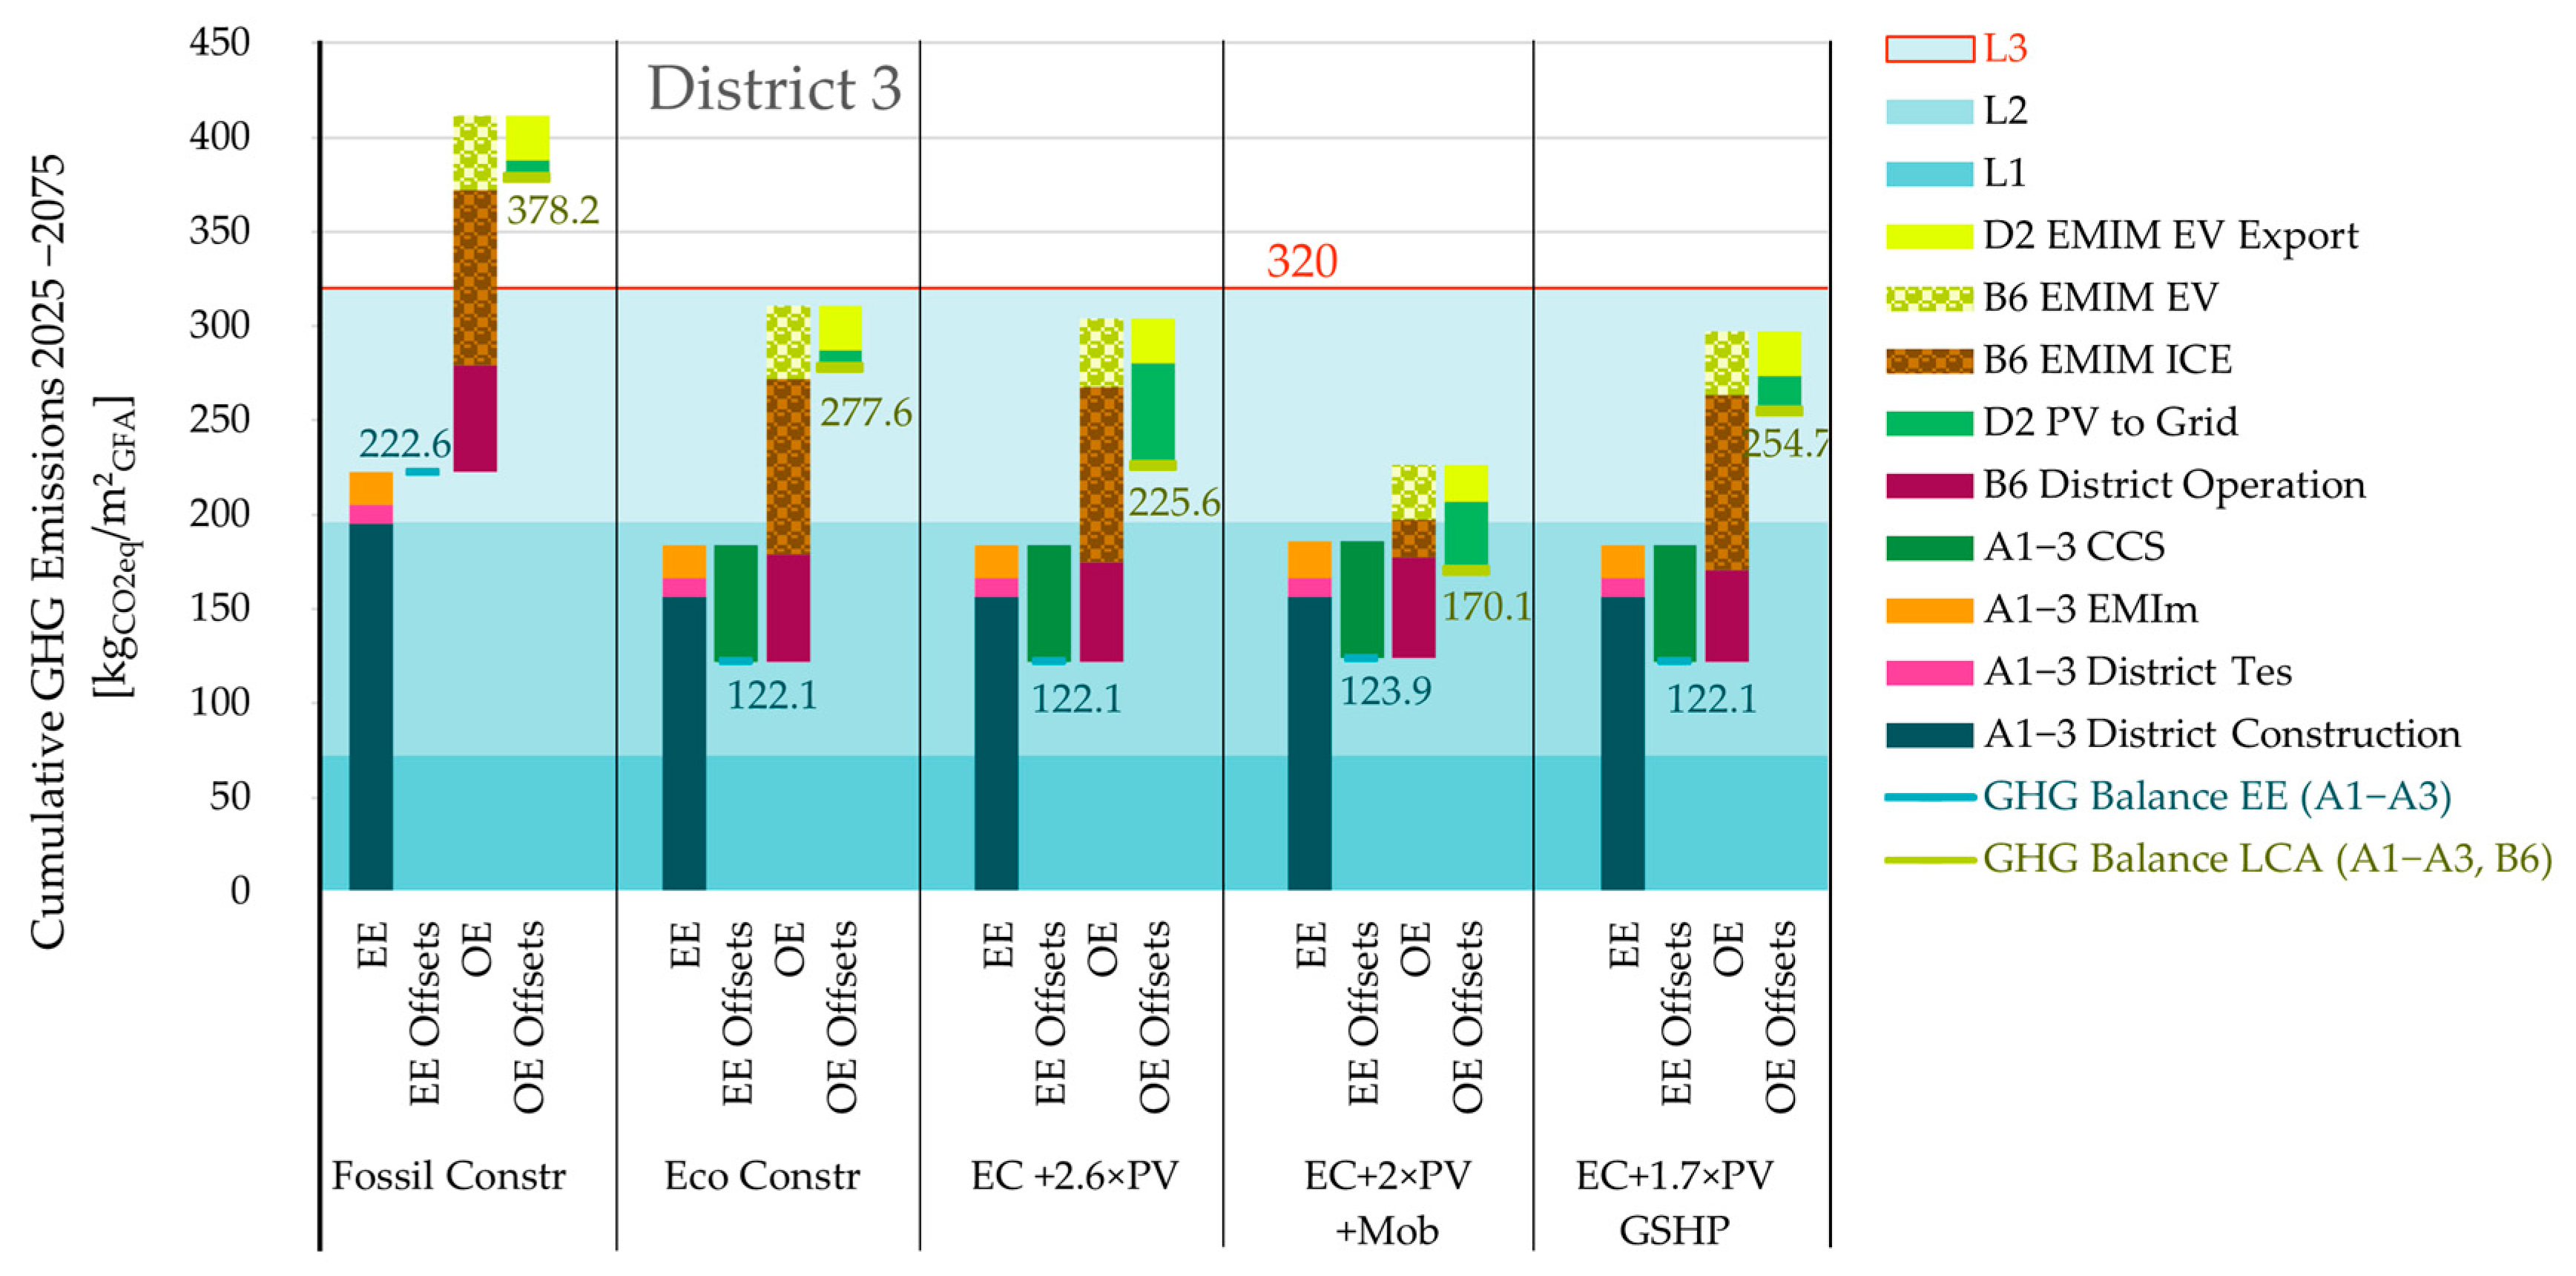
- Cumulative GHG balance (2025–2075, kgCO2e·m−2GFA)—as defined in the framework above: cradle-to-grave embodied emissions (A1–A3; buildings, TES, PV, batteries, vehicles, C1–C4 before 2050), time-resolved operational emissions (B6; grid electricity and thermal carriers), operational mobility (B8 EMIM; ICE/EV), and avoided grid emissions (D2; PV exports and EMIM substitution). Negative components reduce the balance. Compliance bands are L3 = 320, L2 = 196, L1 = 72 kgCO2e·m−2GFA.
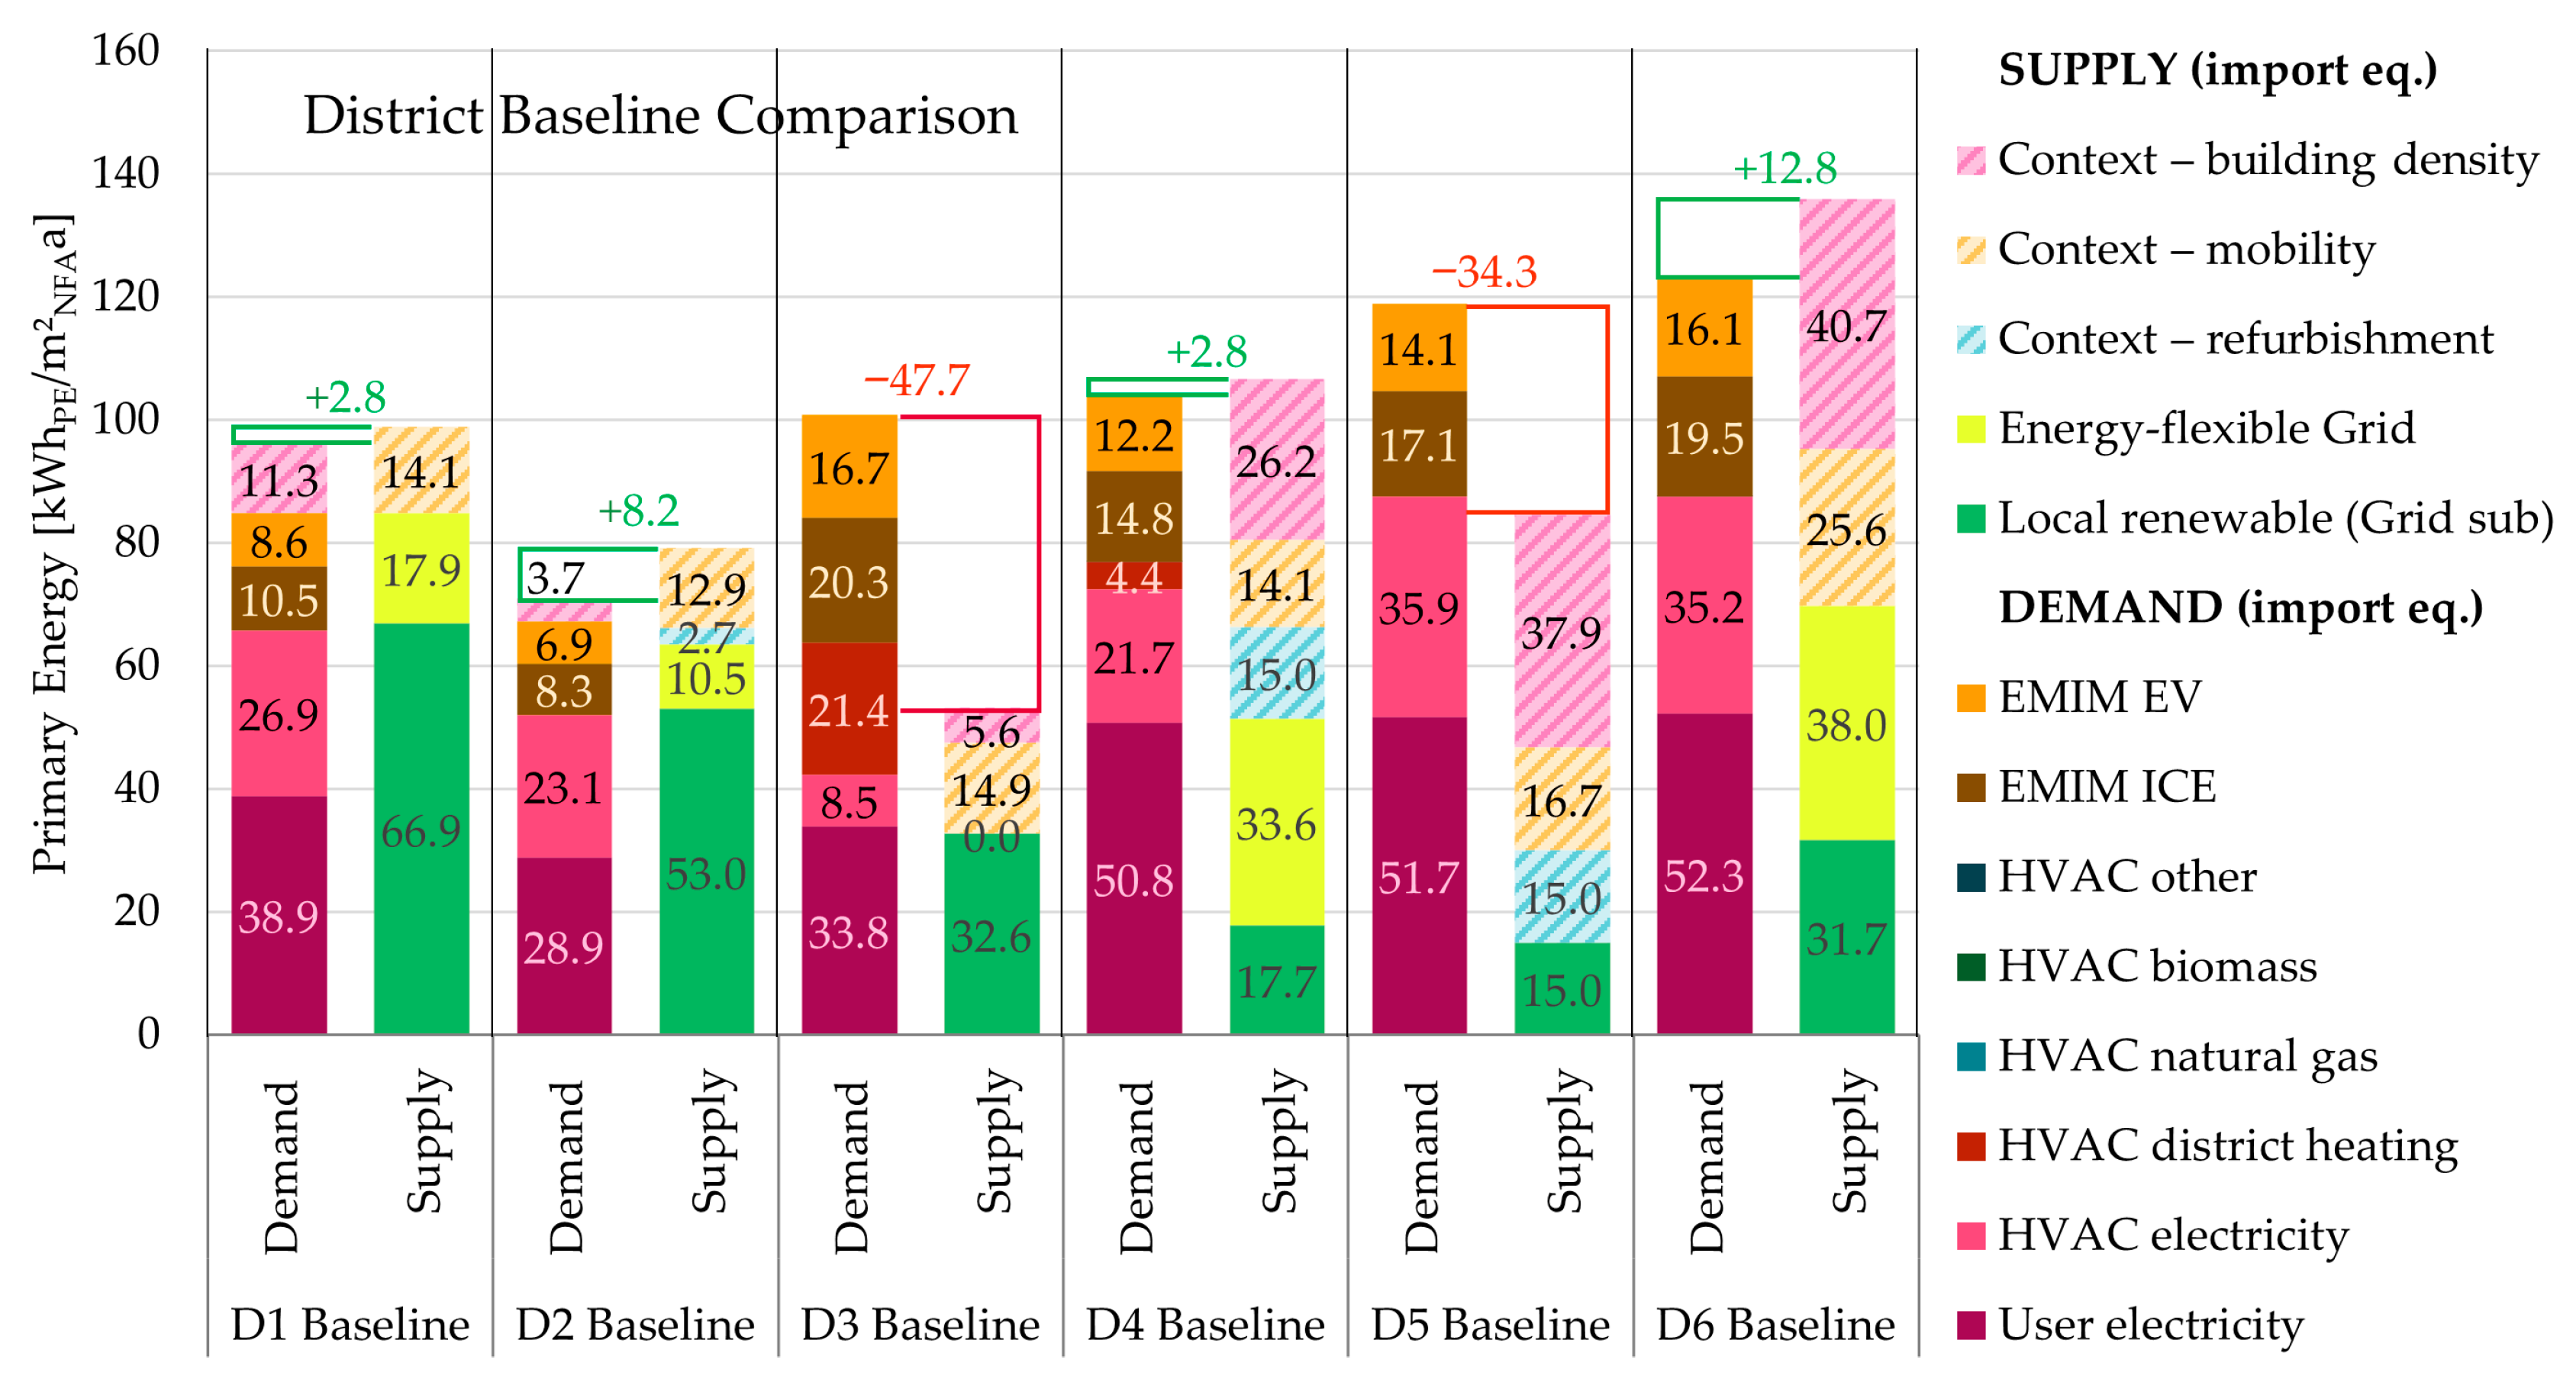
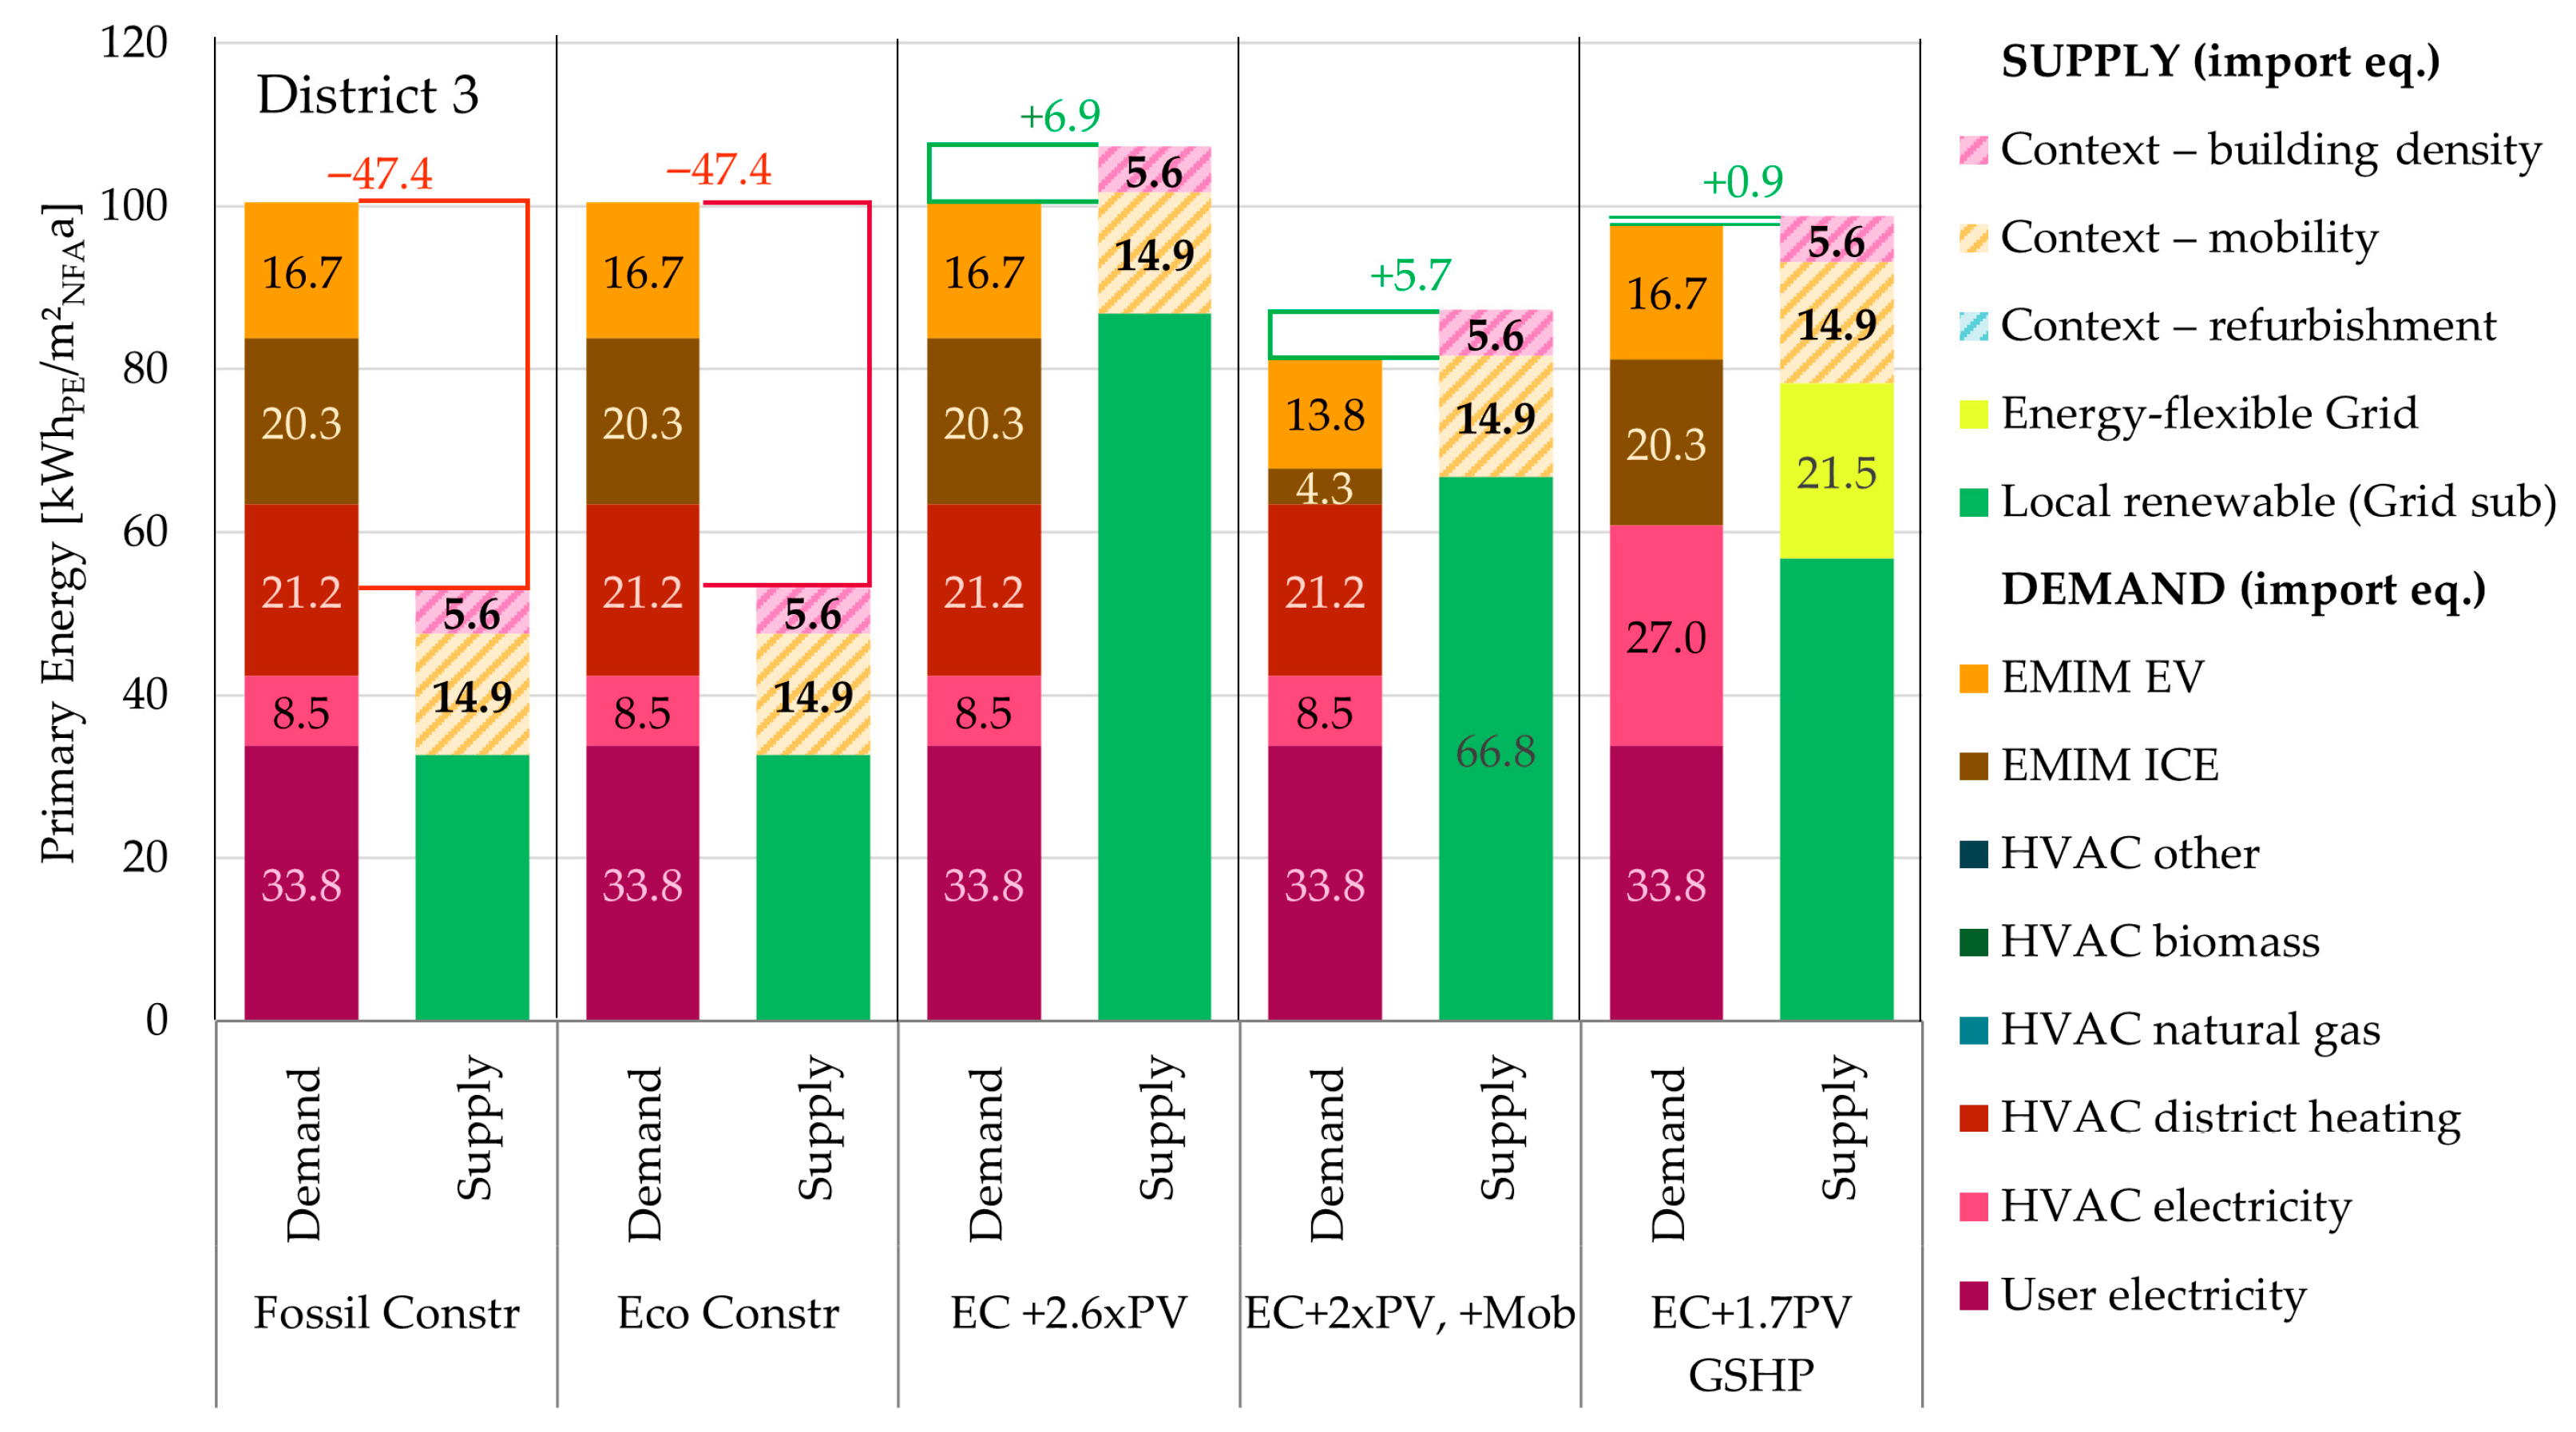
- Primary energy balance (kWhpe·m−2 NFA·a−1)—computed per [24,36] as the difference between annual primary energy grid equivalence from local renewable supply and flexible grid use (PV self-use and feed-in, flexible TES and EMIM operation) and the district’s primary energy demand (grid equivalence, HVAC and electricity; EMIM included or excluded depending on the level). A positive value denotes a “positive balance”. Context factors for density, mobility and renovation may apply as virtual demands or supplies.
2.3. Carbon Budget for Climate-Neutral Districts
- L1 (Paris-compatible target): stringent limit without sequestration,
- L2 (precautionary limit): moderate sequestration (0.5 tCO2e cap−1 a−1),
- L3 (absolute compliance limit): generous sequestration (1.0 tCO2e cap−1 a−1).
- Intermediate values and assumptions underlying this derivation are documented in Appendix A Table A1 for transparency. The resulting compliance thresholds, which serve as methodological reference points for district assessment, are summarized in Table 2.
2.4. LCA System Boundary and Scope of District
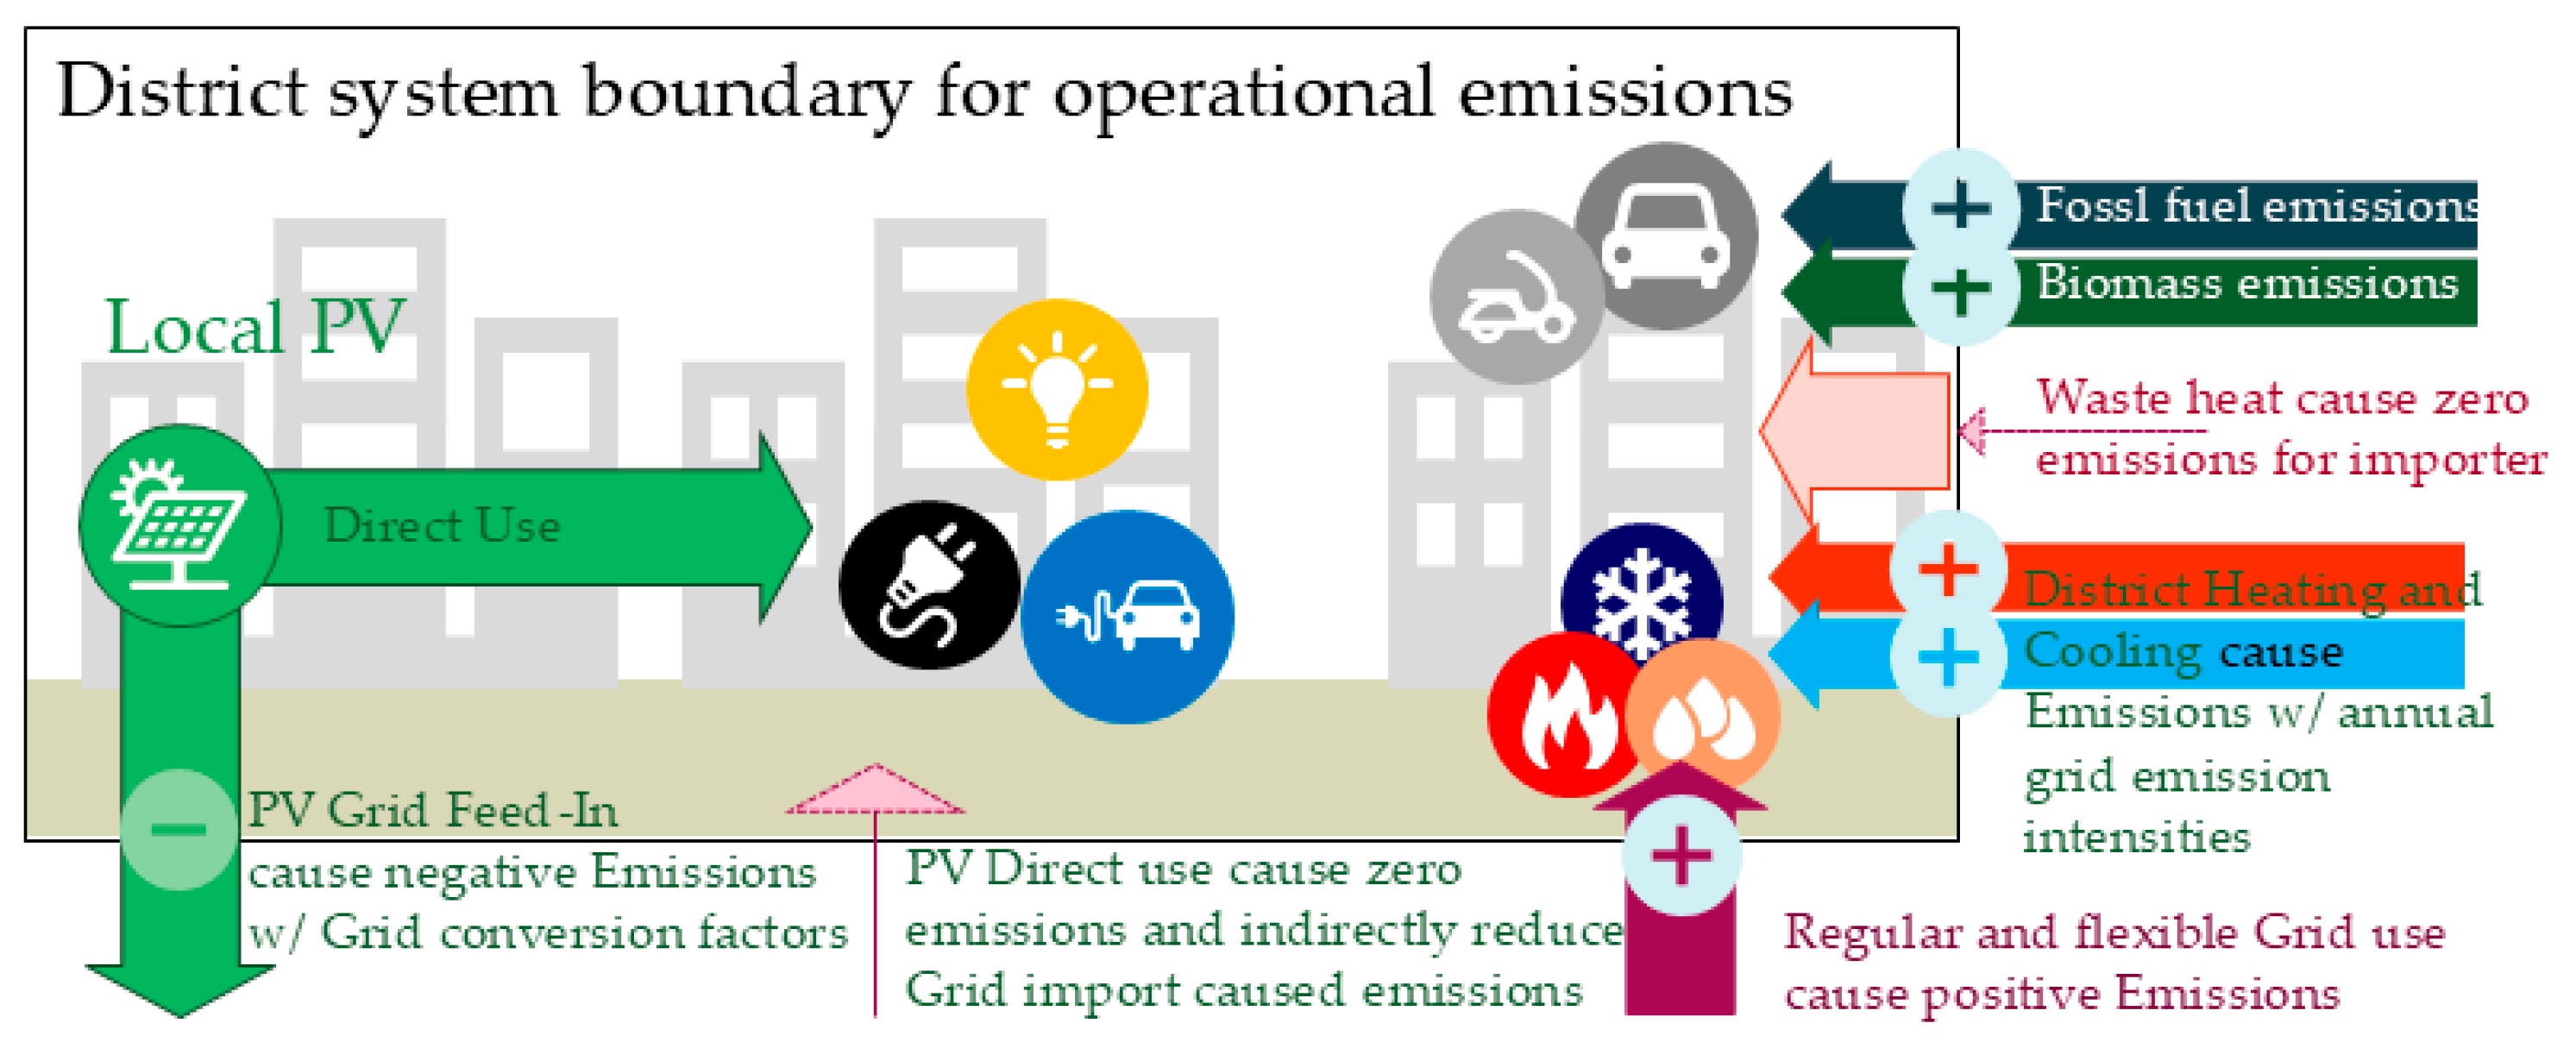
2.4.1. Operational Energy Flows, Local PV, and Exported Electricity (Module B6/D2)
2.4.2. Mobility (Module B8)
2.4.3. Maintenance and End-of-Life: Post-2050 Assumptions (Modules B2–B5; C1–C4; Vehicles)
2.4.4. Public Infrastructure and Contextual Assets
2.5. Treatment of Biogenic Carbon and Carbon Storage in Building Materials
- An optional but preferred dynamic LCA method, for time-explicit treatment where results materially depend on biogenic storage and timing effects (e.g., rotation periods, storage duration, end-of-life timing);
- A default simplified LCA method provided for practicality and comparability, where biogenic carbon contained in bio-based building materials is partly credited as negative emissions (carbon storage) over the assessment horizon, based on carbon origin and use but independent of emission time.
- The framework tooling accommodates both simplified and dynamic biogenic carbon methods, with the latter recommended where data availability allows.
2.5.1. Dynamic LCA Method
2.5.2. Simplified LCA Method
- Fast-growing plant-based materials (e.g., straw, hemp, flax; rotation period ~1 year): → 100% of the biogenic CO2 content is credited.
- Wood from managed forests (typical rotation period ~100 years): Only the proportion representing additional sequestration beyond a no-harvest scenario is credited. This comprises: 25% of the harvested wood volume from calamity events (e.g., bark beetle infestation, storm damage), credited at 100% plus 30% of biomass growth from sustainable management practices. → This results in a total credit of 55% of the biogenic CO2 content for standard harvested wood.
- Calamity wood: → 100% credit for the biogenic CO2 content. Project declaration requires origin verification from pest or storm damage.
- Carbon uptake following harvest due to replanting in sustainably managed forests, compared to unmanaged forest growth.
- Temporary sequestration of biogenic carbon, which reduces the peak temperature increase when paired with rapid and consistent GHG emission reductions.
2.6. Operational Conversion Factors/Dynamic Emission Factors
- Data sources and projections:
- Hourly CO2 intensity profiles for electricity are derived from Austrian grid mix data and adjusted to annual benchmarks from the Austrian National Energy and Climate Plan for 2030 and 2040.
- For biomass and district heating from renewable sources, a separate decarbonization pathway is applied based on sectoral transition strategies, reflecting gradual replacement of fossil inputs with renewable heat sources.
- For natural gas and other fossil fuels, virtually no decarbonization is assumed; in line with their inherent combustion emissions, CO2 intensities recede by 5% until 2050 and must thereafter be completely phased out or covered by CCS.
- Use of hourly vs. monthly factors:
- For analysis and research purposes, the framework uses hourly conversion factors. Multiple factors sets from literature and modeling studies have been created and compared, enabling investigation of the timing effects of energy demand and generation. Section 3.3 presents a case study on these effects.
- For practical usability, regulatory consistency, and comparability with the Austrian building code, the official application of this proposed climate neutrality assessment framework for PEDs uses monthly CO2 conversion factors to normalize hourly values to compliant annual levels (Appendix A Table A3). These are linearly downscaled from 2023 to 2050 according to the decarbonization path for each energy carrier (Section 2.5.1).
- Application in operational assessment (Module B6/D2):
Gradual Emission Intensity Reductions 2025 to 2050
2.7. Example Assessments
2.7.1. Selection of Use Cases
2.7.2. Data Collection and Assumptions
3. Results
3.1. Comparative Analysis
Effects of PV TES Embodied Emission (Non-)Inclusion
3.2. Case Study District 3: Redevelopment of Urban Medium Density Residential District: Interplay of Embodied and Operational Emission Reduction Measures
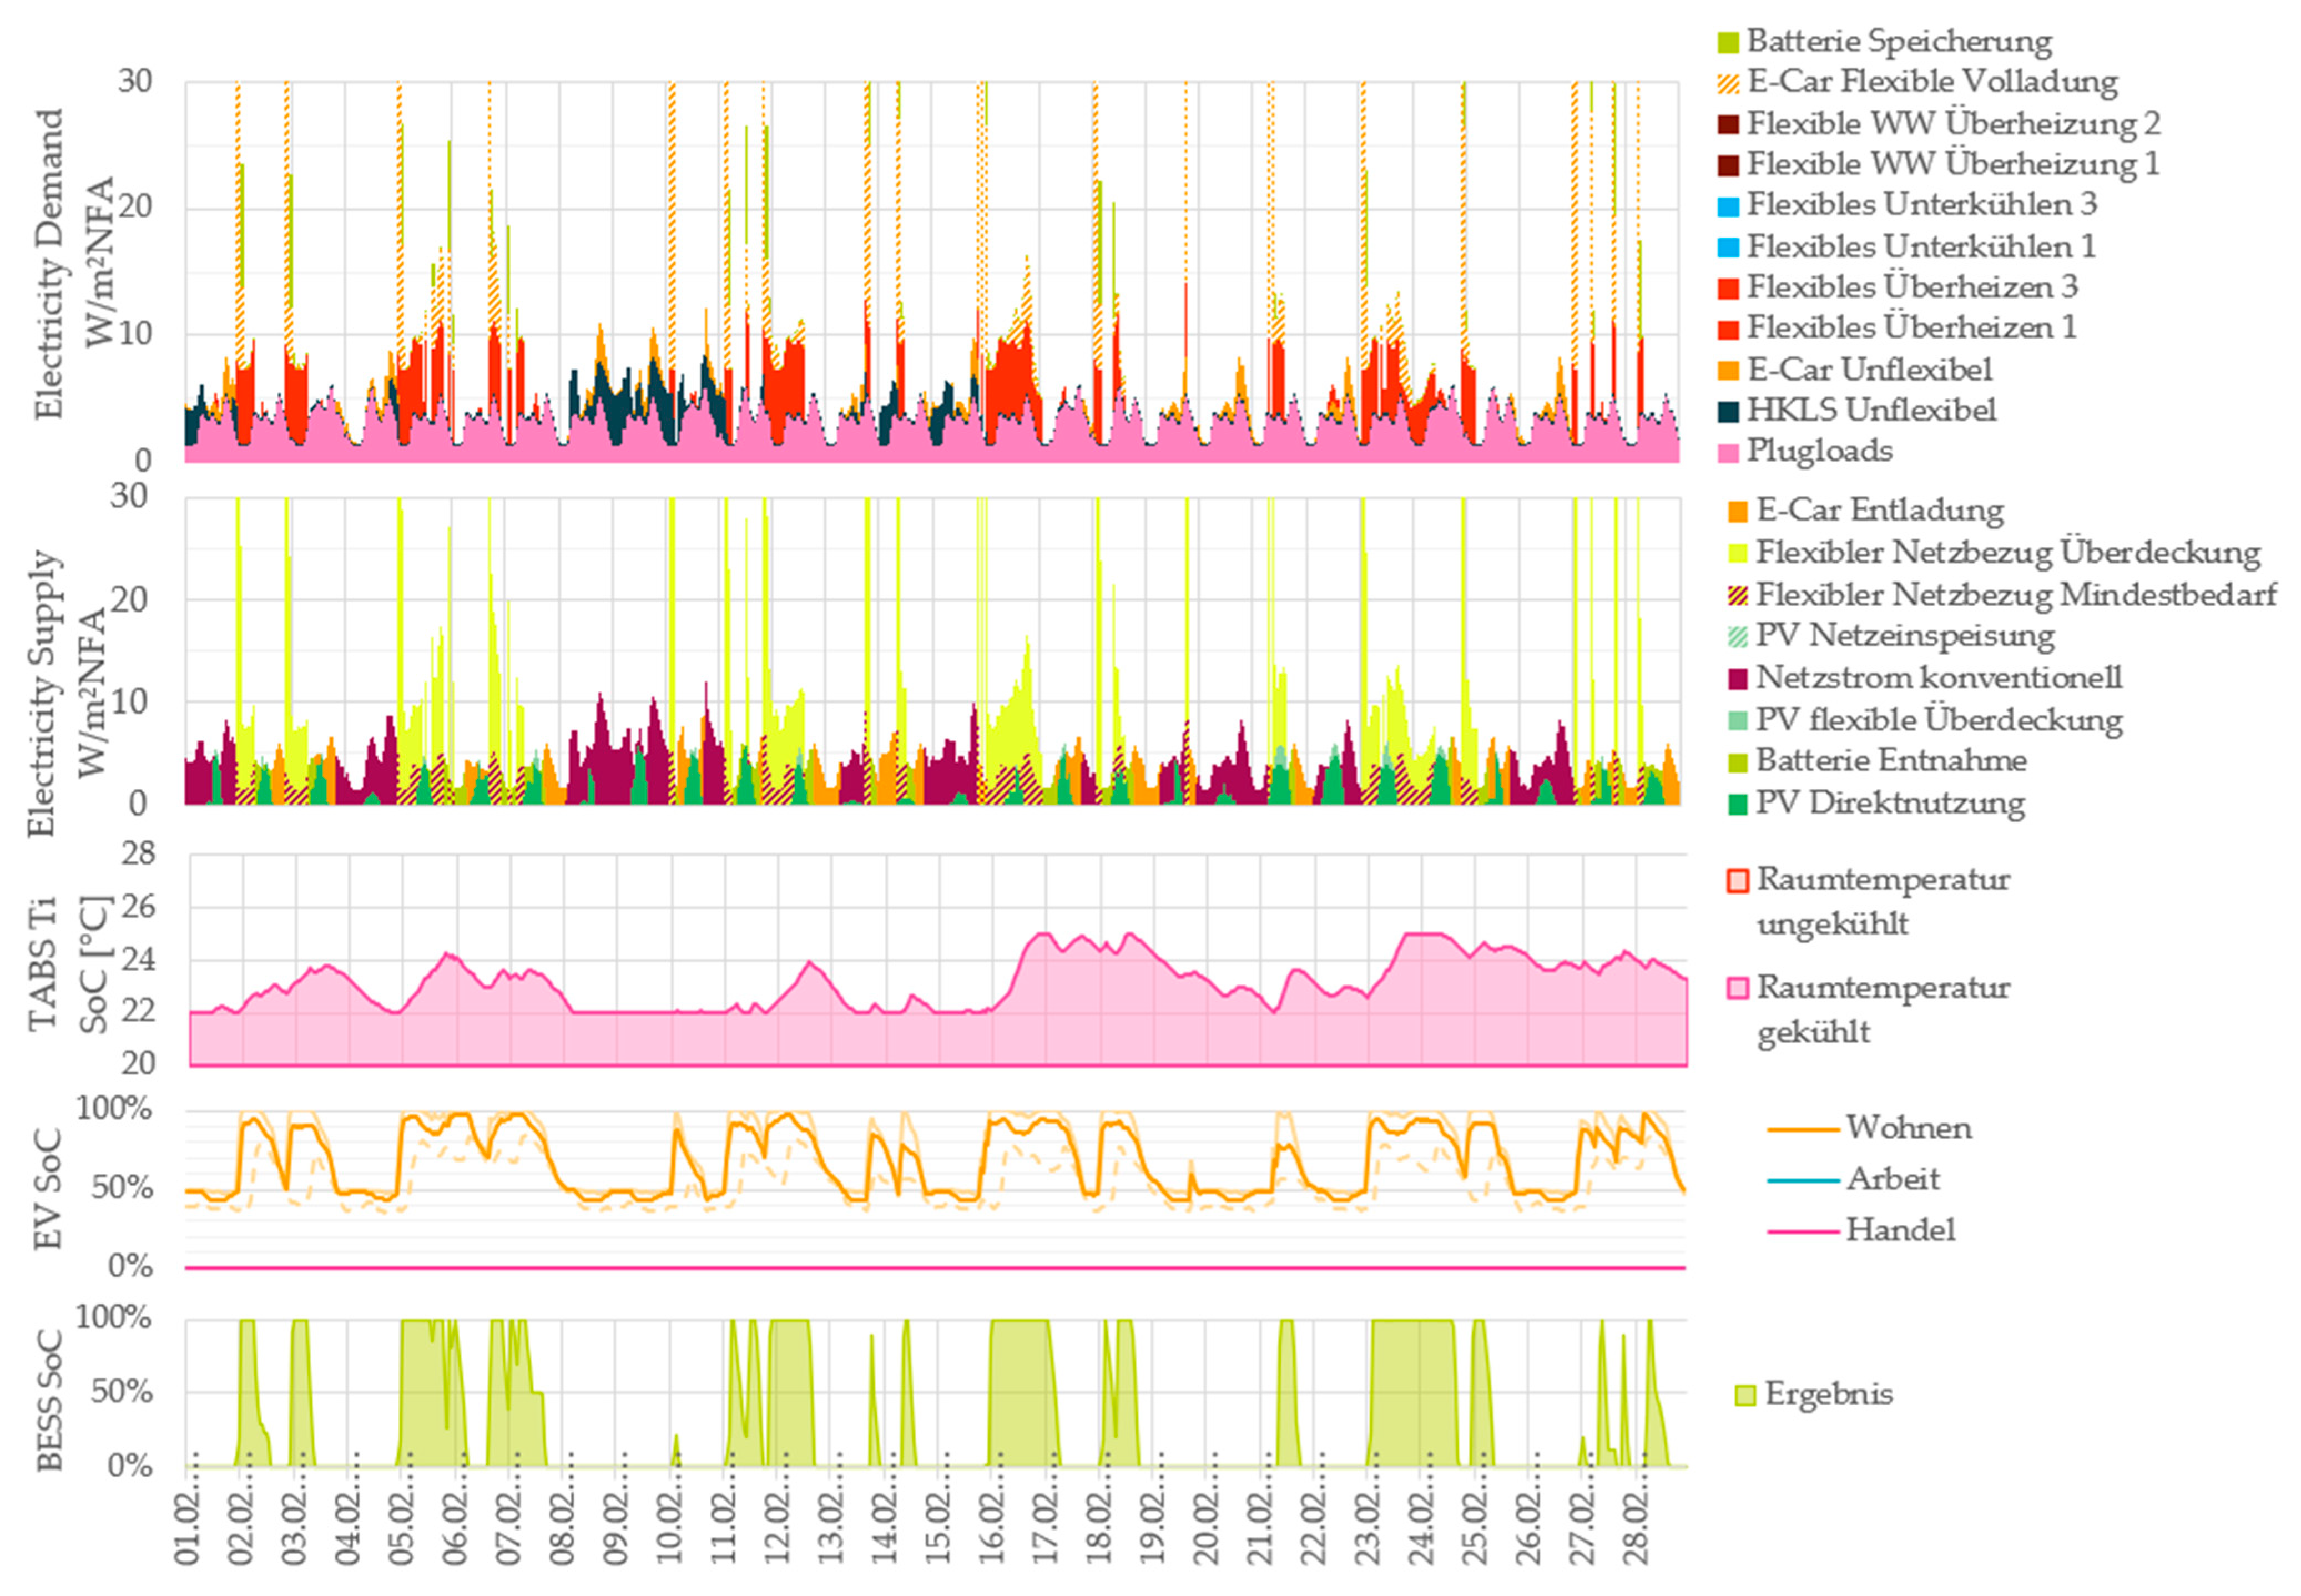
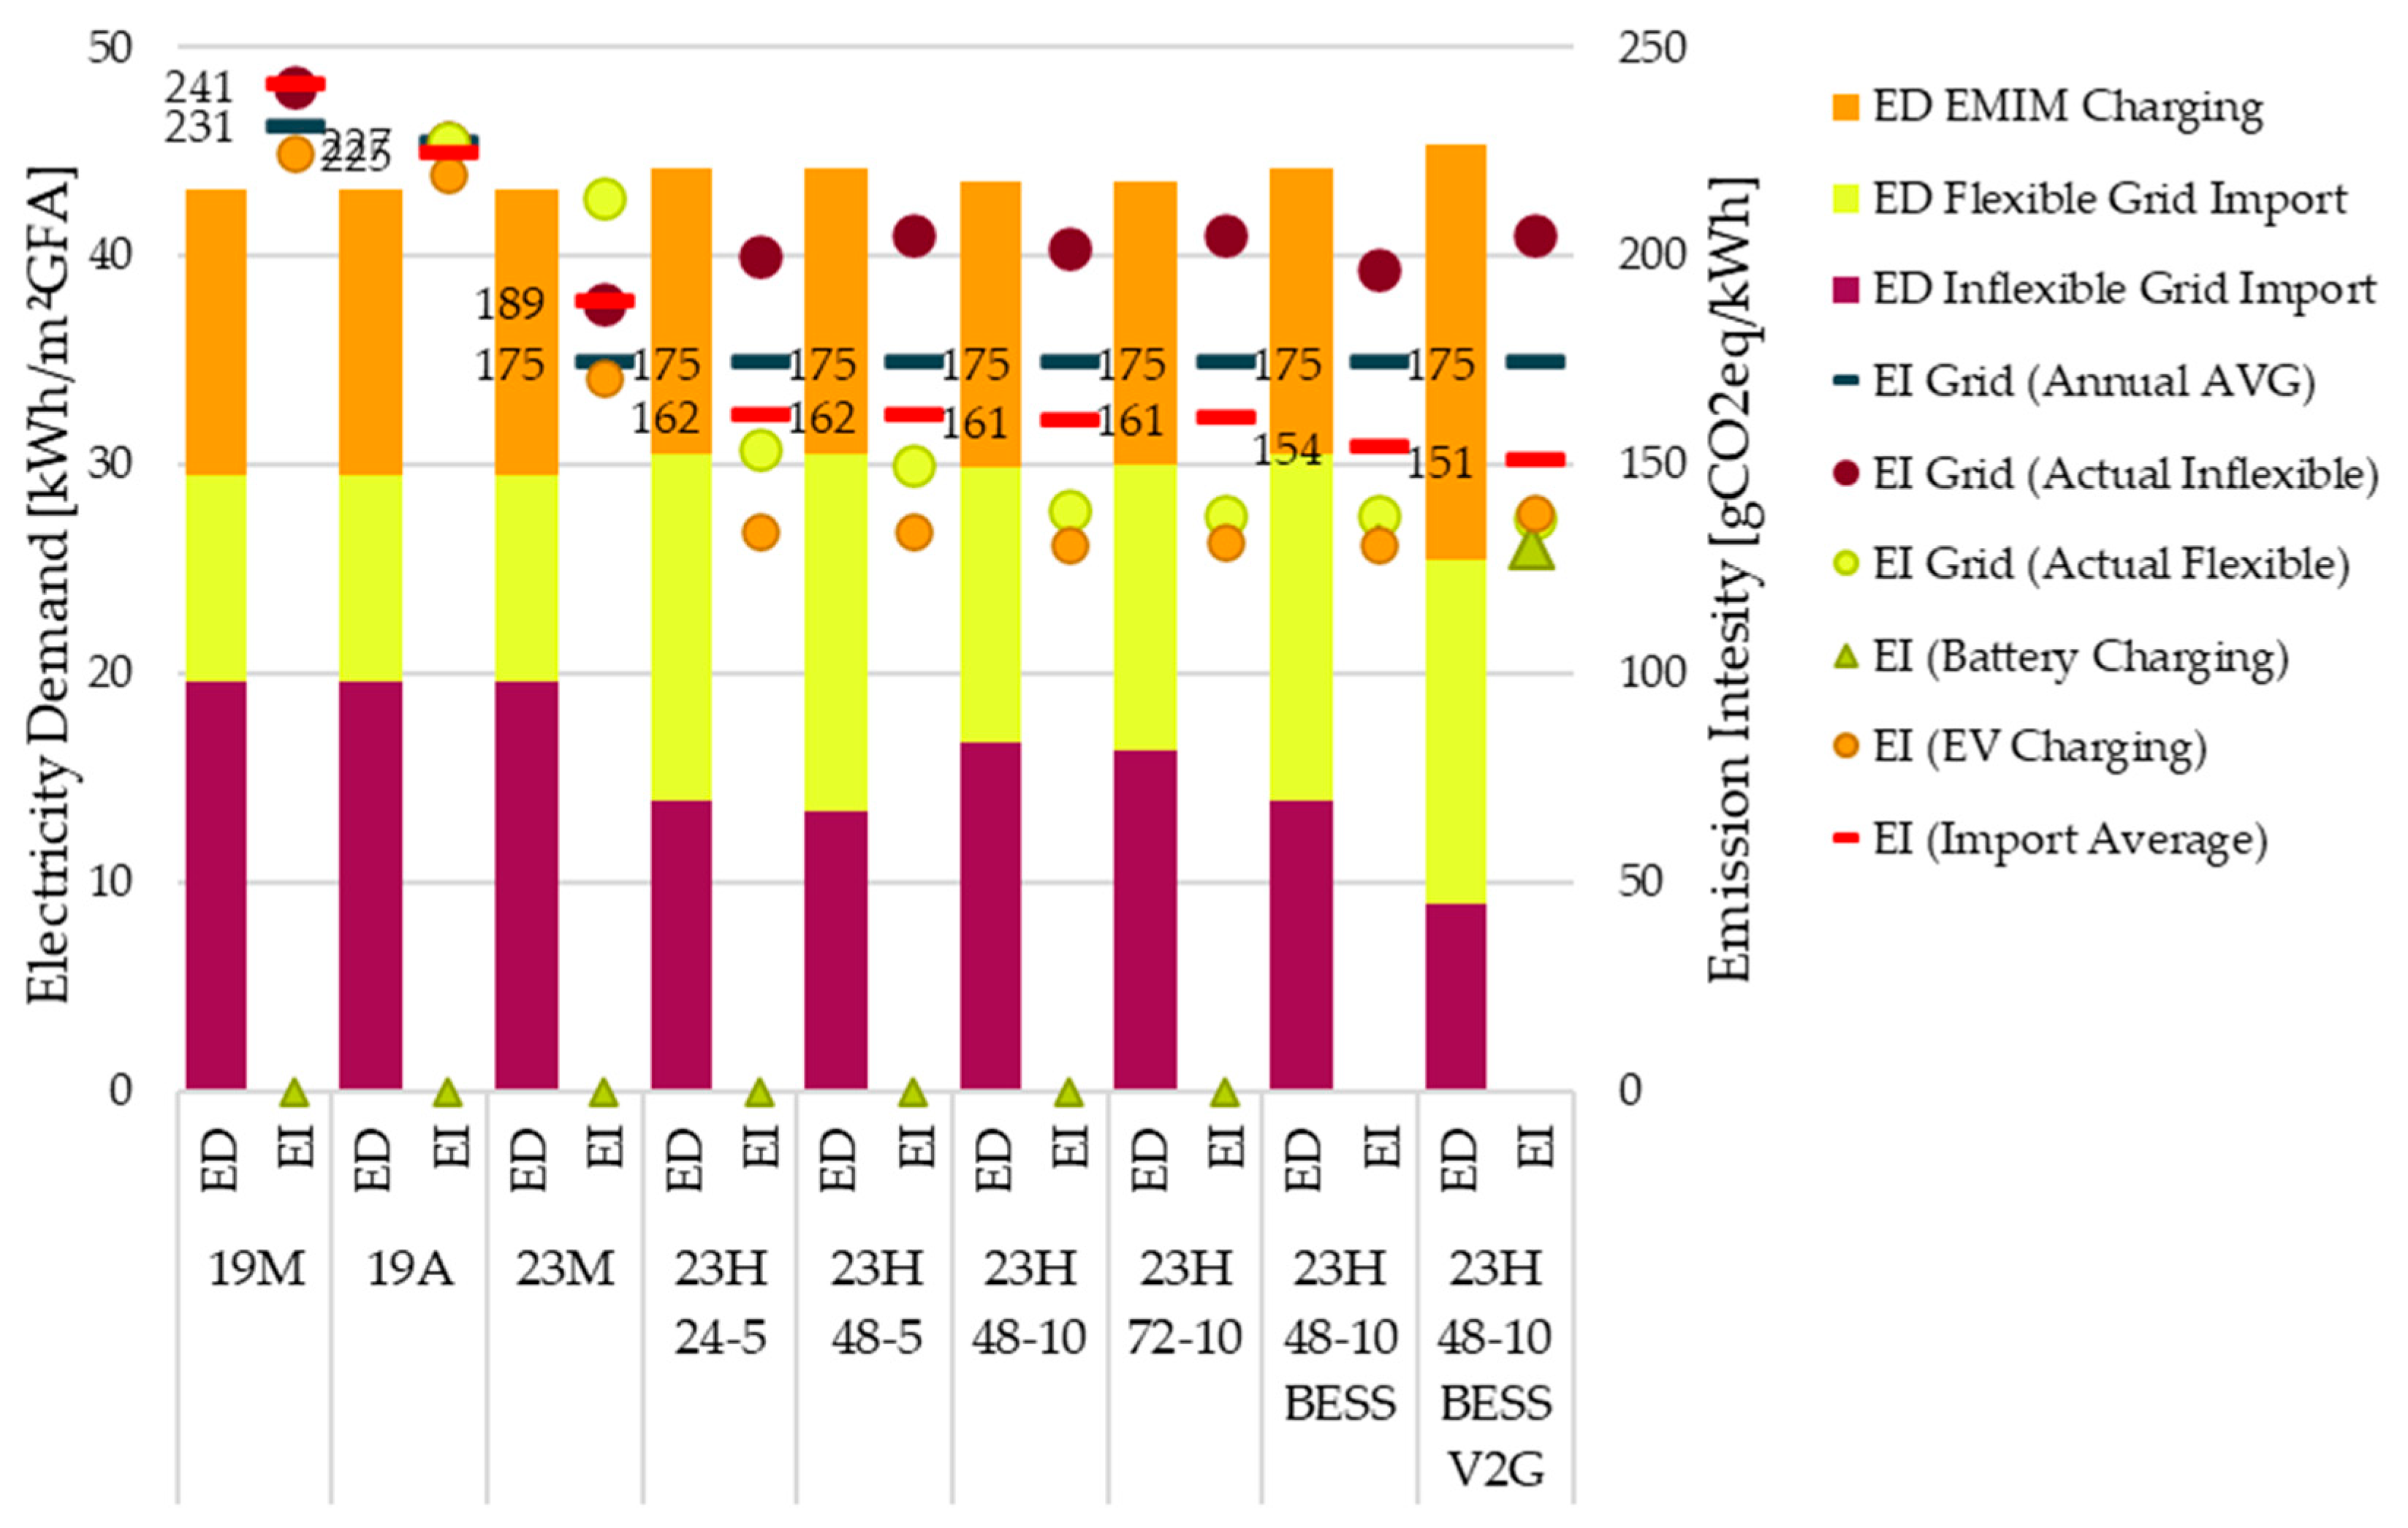
3.3. Case Study District 4: Effect of Dynamic vs. Static Grid Emission Factors and Flexibility Signals
- GHG Emission factors:
- Monthly and annual factors (2019 M, 2023 M, 2019 A) Twelve constant monthly values per vintage or a constant annual value (see Appendix A Figure A2).
- Hourly factors (2023 H). 8760 time steps based on historic live tracking; annual means match the corresponding OIB vintage 2023 (see Appendix A Figure A2)
- Flexibility Signals:
- Wind Peaks (for 2020, above 50% nominal Power)
- GHG Emission rolling averages (RA): signal if current GHG EF(t) is y% below Rolling Average (x hour future window) (x ∈ {+24, +48, +72}, y ∈ {5%, 10%})
- Detailed scenario definitions for case study 4 can be found in Appendix A Table A5. The hourly flexibility signals are visualized in Appendix A Figure A2.
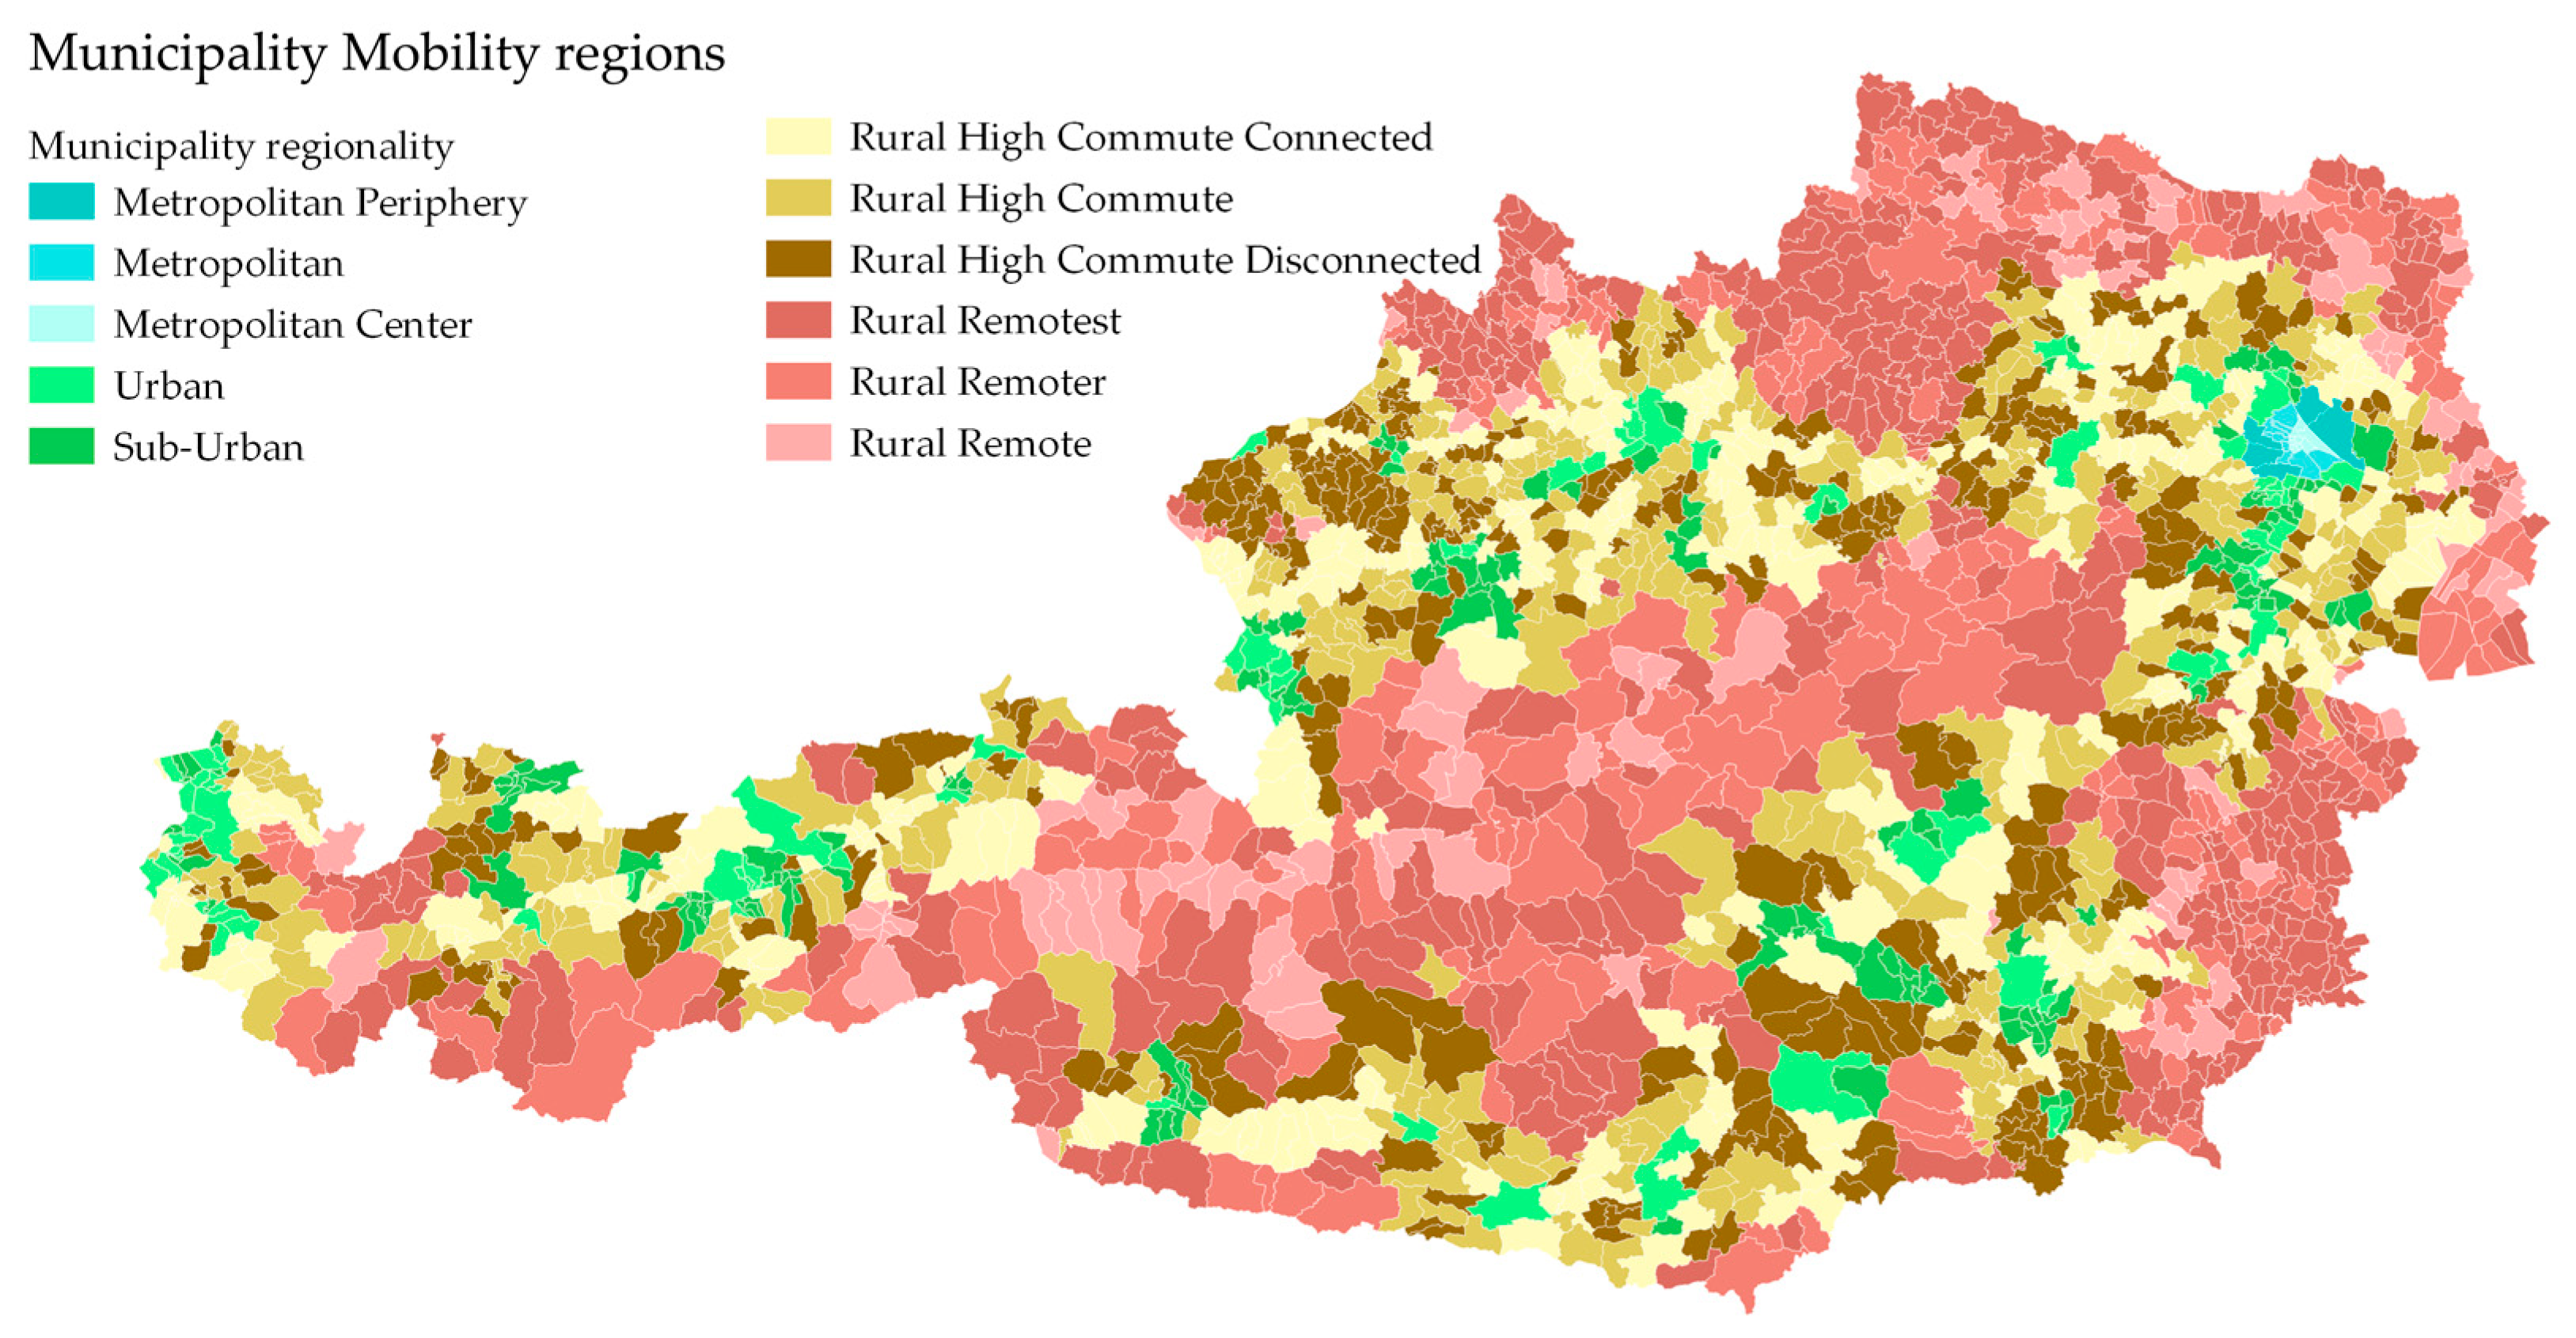
3.4. Case Study District 5: Mobility and Renovation Sensitivity
3.4.1. Impacts of Refurbishment
3.4.2. Sensitivity to Location and Renovation
3.5. Case Study District 6: Differences in Construction Practice and Materials
- Increasing the installed PV Capacity,
- Raising the share of electric vehicles in the mobility mix,
- Implementing more ambitious ecological construction measures (e.g., low-carbon materials).
4. Discussion
4.1. Methodological Implications
4.2. Applicability and Limitations
4.3. Policy Implications
5. Conclusions
- Two KPIs with targets: (1) cumulative GHG budget to 2050 and (2) annual primary energy balance for declaring PED status (with/without mobility).
- LCA scope: unified accounting of construction, operation, and EMIM (including embodied construction, maintenance, end-of-life) over the next 25 years within a single CO2 budget.
- Alignment with national sector targets: PV embodied impacts remain in the energy sector and are excluded at project level; non-EMIM travel modes (PT, walking, cycling) remain in the transport sector. PV exports are credited with time matching.
- Time-resolved emissions and pathways: hourly (or monthly) grid factors; distinct decarbonization trajectories for electricity and renewables; constant intensities for gas/biomass/other fossil carriers (with DH inheriting its supply mix).
- Design implications. Case study applications show that even highly efficient PED designs can exceed the available CO2 budget unless embodied emissions are minimized (through low-carbon/biogenic options, lean structures), renewable energy and flexibility contributions are maximized (through flexible dispatch with BESS/V2B/TABS), and operational emissions from user-driven mobility are effectively reduced (by electrification and demand reduction). The main findings of the case studies indicate that:
- A diverse set of districts, ranging from low-density residential to high-density urban contexts, can achieve compliance with the proposed carbon budget (L3) by adopting low-carbon construction materials, maximizing renewable energy generation (PV oversizing), and electrifying mobility (e.g., EVs).
- Operational mobility emissions (EMIM) remain a significant factor for compliance, particularly in rural areas with lower EV penetration and less access to public transport.
- Hourly emission factors and flexibility (via BESS/V2B/TABS) can significantly reduce operational emissions compared to traditional monthly or annual accounting methods, highlighting the importance of time-resolved emissions in accurate PED assessments.
- Limitations. The interpretational claim of “climate neutral” hinges on systemwide decarbonization trajectories and assumptions that remain a source of uncertainty and may require periodic re-adjustment moving forward. Transferability of results depends on localized data. Results obtained in early planning may be subject to change as planning progresses, potentially requiring separate declarations.
- Next steps.
- Link to dynamic LCA databases to strengthen embodied-emission estimates.
- Adapt to diverse regulatory contexts and add uncertainty analysis for pathways.
- Automate compliance checks and embed the workflow in planning regulations and municipal decision processes.
Author Contributions
Funding
Data Availability Statement
Acknowledgments
Conflicts of Interest
Abbreviations
| ACH | Air Changes per Hour |
| AS HP | Air Source Heat Pump (Air to Water) |
| BESS | Battery Energy Storage System |
| CLT | Cross-laminated Timber |
| COP | Coefficient of Performance |
| CO2e | CO2 Equivalents |
| DH | District Heating |
| DHW | Domestic Hot Water |
| EI | Emission Intensity |
| EMIM | Everyday motorized individual Mobility |
| EV | Electric Vehicle |
| FSI | Floor space index (Gross floor area over plot area) |
| GHG | Greenhouse Gas |
| GFA | Gross Floor Area |
| GS HP | Ground source Heat pump (boreholes) |
| HVAC | Heating, ventilation, air conditioning and DHW |
| ICE | Internal combustion engine (vehicle) |
| LCA | Life Cycle Assessment |
| NFA | Net Floor Area |
| PAX | Persons approximate |
| PEF | Primary Energy Factor |
| PE tot | Total Primary Energy |
| PE nre | Non-renewable Primary Energy |
| PE re | Renewable Primary Energy |
| PED | Positive Energy District |
| PV | Photovoltaics/Photovoltaic System |
| TES | Technical Building Energy Systems |
| TSD | Time Series Data |
| V2G | Vehicle to Grid |
| V2B | Vehicle to Building |
Appendix A
| Variable | Unit | Timeframe | 50% | 66% | Source |
|---|---|---|---|---|---|
| Paris-compatible CO2 budget (+1.5 °C, no overshoot) | Mt CO2 | 2022–2075 | 510 | 280 | [27] |
| Paris-compatible CO2 budget (+1.5 °C, with overshoot) | Mt CO2 | 2022–2075 | 610 | 340 | [27] |
| Remaining budget after 2024 (no overshoot) | Mt CO2 | 2025–2075 | 360 | 130 | calc. from [27] |
| Remaining budget after 2024 (with overshoot) | Mt CO2 | 2025–2075 | 460 | 190 | calc. from [27] |
| Population (Austria) | million cap | 2025 | 9.0 | 9.0 | [27] |
| Per capita net budget (no overshoot) | t CO2 cap−1 | 2025–2075 | 40.0 | 14.5 | calc. from [63] |
| Per capita net budget (with overshoot) | t CO2 cap−1 | 2025–2075 | 51.1 | 21.1 | calc. from [63] |
| Natural carbon sinks (NCS) | t CO2 cap−1a−1 | — | 1.0 | 1.0 | [64] |
| Cumulative NCS added (50 years) | t CO2 cap−1 | 2025–2075 | 50.0 | 50.0 | — |
| Per capita gross budget (no overshoot + NCS) | t CO2 cap−1 | 2025–2075 | 90.0 | 64.5 | — |
| Per capita gross budget (with overshoot + NCS) | t CO2 cap−1 | 2025–2075 | 101.1 | 71.1 | — |
| Buildings + EMIM sector share of per capita budget (A1–A3, B1–B6 + EMIM, C1–C4) | % | — | 50 | 50 | [49] based on [26] |
| Estimated national GFA (all uses) | million m2 | 2040 | 906.7 | 906.7 | [65] |
| Specific GFA per capita (all uses) | m2 GFA cap−1 | — | 101 | 101 | calc from [65] |
| Boundary | Scope Description |
|---|---|
| BB1 | Complete thermal envelope, including internal floor ceilings |
| BB3 | BB1 plus all interior walls, basement structures, unheated buffer zones; excluding open circulation spaces (stairs, balconies, loggias, galleries) |
| BB5 | BB3 plus shared circulation areas and building services |
| BB6 (used here) | BB5 plus exterior facilities (carports, bicycle shelters, etc.) and auxiliary buildings |
| Energy Carrier | PEtot | PEnre | PEre | GHG |
|---|---|---|---|---|
| kWhPE·kWh−1EE | gCO2e·kWh−1 | |||
| Grid Electricity | 1.76 | 0.79 | 0.97 | 156 |
| District heating—boiler plant (renewable) | 1.72 | 0.4 | 1.32 | 59 |
| District heating—boiler plant (non-renewable) | 1.48 | 1.16 | 0.32 | 193 |
| District heating—high-efficiency CHP (default) | 0.59 | 0.41 | 0.18 | 67 |
| District heating—high-efficiency CHP (best case) | 0.33 | – | 0.33 | 20 |
| Waste heat (default) | 1.00 | – | 1.00 | 20 |
| Waste heat (best case) | 0.30 | – | 0.30 | 20 |
| Coal | 1.46 | 1.46 | 0.00 | 360 |
| Heating oil | 1.20 | 1.20 | 0.00 | 271 |
| Natural gas | 1.10 | 1.10 | 0.00 | 201 |
| Biomass (solid) | 1.13 | 0.10 | 1.03 | 247 |
| Biofuels (gaseous, stand-alone operation) | 1.40 | 0.40 | 1.00 | 100 |
| Biofuels (liquid, stand-alone operation) | 1.50 | 0.50 | 1.00 | 70 |
| District cooling Vienna [67] | 0.42 | 0.13 | 0.29 | 42 |
| Category | Description of Data | Parameters |
|---|---|---|
| District | Gross floor areas, net to gross ratios, renovation shares per usage | 24 |
| Weather | Hourly TSD of ambient temperature and N/E/S/W/H Irradiation | 6 × 8760 |
| Heights | Average room heights per usage | 8 |
| Building Hulls | Hull areas by type and orientation | 8 |
| Building Physics | Thermal transmittances, effective heat capacities, heat bridges, air tightness | 10 |
| Windows | Total transmittance, shading offsets summer, winter, mobile shading | 32 |
| Ventilation | Per usage: Share of mechanical/window ventilation, night ventilation, ACH, electricity demand, heat recovery rates | 44 |
| Usage | Concurrencies, DHW demands, auxiliary and plug loads per usage | 35 |
| Lighting | Daylight controls and coefficients, illuminations, light power loads per usage | 12 |
| Heating | Heating periods, Heating Powers and COPs of up to four heating systems (2 electric, 2 thermal), setpoint temperatures | 33 |
| Cooling | Cooling periods, Cooling Powers and COPs of up to 3 active and 1 passive systems (2 electric, 1 thermal, 1 free cooling), setpoint temperatures | 37 |
| DHW | Hot water demand profiles, storage volumes, generation efficiencies, distribution losses | 17 |
| PV Systems | Installed PV capacity, module and inverter efficiency, Hourly TSD of PV yield | 5 + 8760 |
| BESS | Battery capacity, charging/discharging efficiencies, c-rates, losses | 11 |
| Flexibility | Heating, Cooling, DHW, PV, BESS utilization ranges | 11 |
| Mobility | Usage intensity, concurrency, motorization, Annual mileage, EV penetration rates, charging infrastructure, minimum SOCs, utilization of bi-directional charging | 32 |
| Embodied carbon | Construction materials and components, GHG intensities, life cycles, reference areas | 37 |
| PE and Emission factors | Primary energy and emission conversion factors, annual weights, context factors | 2 × 8760 13 |
| Scenario | Grid Emission [66] | Flexibility Signal | Flexibility Option (s) |
|---|---|---|---|
| 19M | 2019 M | Wind Peaks > 50% Pnom | TABS |
| 19A | 2019 A | Wind Peaks > 50% Pnom | TABS |
| 23M (Baseline) | 2023 M | Wind Peaks > 50% Pnom | TABS |
| 23H 24-5 | 2023 H | RA x = 24, y = 5% | TABS |
| 23H 48-5 | 2023 H | RA x = 48, y = 5% | TABS |
| 23H 48-10 | 2023 H | RA x = 48, y = 10% | TABS |
| 23H 72-10 | 2023 H | RA x = 72, y = 10% | TABS |
| 23H 48-10 BESS | 2023 H | RA x = 48, y = 10% | TABS + BESS |
| 23H 48-10 BESS V2B | 2023 H | RA x = 48, y = 10% | TABS + BESS + V2B |

References
- United Nations Framework Convention on Climate Change. Paris Agreement. 2015. Available online: https://unfccc.int/sites/default/files/english_paris_agreement.pdf (accessed on 10 October 2025).
- Masson-Delmotte, V.; Zhai, P.; Pirani, A.; Connors, S.L.; Péan, C.; Berger, S.; Caud, N.; Chen, Y.; Goldfarb, L.; Gomis, M.I.; et al. (Eds.) Climate Change 2021: The Physical Science Basis. Contribution of Working Group I to the Sixth Assessment Report of the Intergovernmental Panel on Climate Change; Cambridge University Press: Cambridge, UK, 2021; Available online: https://www.ipcc.ch/report/ar6/wg1/ (accessed on 10 October 2025).
- Core Writing Team; Lee, H.; Romero, J.; IPCC (Eds.) Climate Change 2023: Synthesis Report. Contribution of Working Groups I, II and III to the Sixth Assessment Report of the Intergovernmental Panel on Climate Change; IPCC: Geneva, Switzerland, 2023; Available online: https://www.ipcc.ch/report/sixth-assessment-report-cycle/ (accessed on 10 October 2025).
- Pathak, M.; Slade, R.; Shukla, P.R.; Skea, J.; Pichs-Madruga, R.; Ürge-Vorsatz, D. Climate Change 2022—Mitigation of Climate Change: Working Group III Contribution to the Sixth Assessment Report of the Intergovernmental Panel on Climate Change; Intergovernmental Panel on Climate Change (IPCC), Ed.; Cambridge University Press: Cambridge, UK, 2023. [Google Scholar]
- Rogelj, J.; Shindell, D.; Jiang, K.; Fifita, S.; Forster, P.; Ginzburg, V.; Handa, C.; Kheshgi, H.; Kobayashi, S.; Kriegler, E.; et al. Mitigation Pathways Compatible with 1.5 °C in the Context of Sustainable Development. In Special Report on Global Warming of 1.5 °C, IPCC; Cambridge University Press: Cambridge, UK, 2018; pp. 93–174. [Google Scholar] [CrossRef]
- Röck, M.; Ruschi Mendes Saade, M.; Balouktsi, M.; Rasmussen, F.N.; Birgisdottir, H.; Frischknecht, R.; Habert, G.; Lützkendorf, T.; Passer, A. Embodied GHG Emissions of Buildings—The Hidden Challenge for Effective Climate Change Mitigation. Appl. Energy 2020, 230, 115–124. [Google Scholar] [CrossRef]
- Brozovsky, J.; Gustavsen, A.; Gaitani, N. Zero Emission Neighbourhoods and Positive Energy Districts—A State-of-the-Art Review. Sustain. Cities Soc. 2021, 72, 103013. [Google Scholar] [CrossRef]
- Knotzer, A.; Geier, S.; Höfler, K.; Venus, D.; Nussmüller, W.; Weiss, T. IEA SHC Task 40/EBC Annex 52: Internationale Definition von Nullenergiegebäuden; Bundesministerium für Verkehr, Innovation und Technologie: Wien, Austria, 2014; Available online: https://nachhaltigwirtschaften.at/resources/iea_pdf/endbericht_201417_iea_shc_task40_ebc_annex_52.pdf (accessed on 10 October 2025).
- Magrini, A.; Lentini, G.; Cuman, S.; Bodrato, A.; Marenco, L. From Nearly Zero Energy Buildings (NZEB) to Positive Energy Buildings (PEB): The next Challenge-The Most Recent European Trends with Some Notes on the Energy Analysis of a Forerunner PEB Example. Dev. Built Environ. 2020, 3, 100019. [Google Scholar] [CrossRef]
- Minelli, F.; Ciriello, I.; Minichiello, F.; D’Agostino, D. From Net Zero Energy Buildings to an Energy Sharing Model—The Role of NZEBs in Renewable Energy Communities. Renew. Energy 2024, 223, 120110. [Google Scholar] [CrossRef]
- Wiik, M.K.; Fufa, S.M.; Andresen, I.; Brattebø, H.; Gustavsen, A. A Norwegian Zero Emission Neighbourhood (ZEN) Definition and a ZEN Key Performance Indicator (KPI) Tool. IOP Conf. Ser. Earth Environ. Sci. 2019, 352, 012030. [Google Scholar] [CrossRef]
- Hedman, Å.; Rehman, H.U.; Gabaldón, A.; Bisello, A.; Albert-Seifried, V.; Zhang, X.; Guarino, F.; Grynning, S.; Eicker, U.; Neumann, H.-M.; et al. IEA EBC Annex83 Positive Energy Districts. Buildings 2021, 11, 130. [Google Scholar] [CrossRef]
- Hinterberger, R.; Gollner, C.; Noll, M.; Meyer, S.; Schwarz, H.G. JPI Urban Europe/SET Plan Action 3.2. White Paper on PED Reference Framework for Positive Energy Districts and Neighbourhoods; JPI Urban Europe: Vienna, Austria, 2020; Available online: https://jpi-urbaneurope.eu/app/uploads/2020/04/White-Paper-PED-Framework-Definition-2020323-final.pdf (accessed on 10 October 2025).
- Shnapp, S.; Paci, D.; Bertoldi, P. Enabling Positive Energy Districts across Europe: Energy Efficiency Couples Renewable Energy; Publication Office of the European Union: Luxembourg, 2020; Available online: https://data.europa.eu/doi/10.2760/452028 (accessed on 10 October 2025).
- European Commission. Directorate General for Research and Innovation. In 100 Climate-Neutral Cities by 2030—By and for the Citizens: Report of the Mission Board for Climate Neutral and Smart Cities; Publications Office: Luxembourg, 2020; Available online: https://data.europa.eu/doi/10.2777/46063 (accessed on 10 October 2025).
- Lindholm, O.; Rehman, H.U.; Reda, F. Positioning Positive Energy Districts in European Cities. Buildings 2021, 11, 19. [Google Scholar] [CrossRef]
- Turci, G.; Alpagut, B.; Civiero, P.; Kuzmic, M.; Pagliula, S.; Massa, G.; Albert-Seifried, V.; Seco, O.; Soutullo, S. A Comprehensive PED-Database for Mapping and Comparing Positive Energy Districts Experiences at European Level. Sustainability 2022, 14, 427. [Google Scholar] [CrossRef]
- Guarino, F.; Rincione, R.; Mateu, C.; Teixidó, M.; Cabeza, L.F.; Cellura, M. Renovation Assessment of Building Districts: Case Studies and Implications to the Positive Energy Districts Definition. Energy Build. 2023, 296, 113414. [Google Scholar] [CrossRef]
- Kiviluoma, J.; Pallonetto, F.; Marin, M.; Savolainen, P.T.; Soininen, A.; Vennström, P.; Rinne, E.; Huang, J.; Kouveliotis-Lysikatos, I.; Ihlemann, M.; et al. Spine Toolbox: A Flexible Open-Source Workflow Management System with Scenario and Data Management. SoftwareX 2022, 17, 100967. [Google Scholar] [CrossRef]
- Ala-Juusela, M.; Pozza, C.; Salom, J.; Luque Segura, I.; Tuerk, A.; Lollini, R.; Gaitani, N.; Belleri, A. Workshop on Positive Energy Buildings—Definition. Environ. Sci. Proc. 2021, 11, 26. [Google Scholar] [CrossRef]
- Häkkinen, T.; Kuittinen, M.; Ruuska, A.; Jung, N. Reducing Embodied Carbon during the Design Process of Buildings. J. Build. Eng. 2015, 4, 1–13. [Google Scholar] [CrossRef]
- Chen, X.; Vand, B.; Baldi, S. Challenges and Strategies for Achieving High Energy Efficiency in Building Districts. Buildings 2024, 14, 1839. [Google Scholar] [CrossRef]
- Fawcett, T. Personal Carbon Trading: A Policy Ahead of Its Time? Energy Policy 2010, 38, 6868–6876. [Google Scholar] [CrossRef]
- Schneider, S.; Zelger, T.; Sengl, D.; Baptista, J. A Quantitative Positive Energy District Definition with Contextual Targets. Buildings 2023, 13, 1210. [Google Scholar] [CrossRef]
- Albert-Seifried, V.; Murauskaite, L.; Massa, G.; Aelenei, L.; Baer, D.; Krangsås, S.G.; Alpagut, B.; Mutule, A.; Pokorny, N.; Vandevyvere, H. Definitions of Positive Energy Districts: A Review of the Status Quo and Challenges. In Proceedings of the Sustainability in Energy and Buildings 2021; Littlewood, J.R., Howlett, R.J., Jain, L.C., Eds.; Springer Nature: Singapore, 2022; pp. 493–506. [Google Scholar] [CrossRef]
- Steininger, K.W.; Meyer, L.; Nabernegg, S.; Kirchengast, G. Sectoral Carbon Budgets as an Evaluation Framework for the Built Environment. Build. Cities 2020, 1, 337–360. [Google Scholar] [CrossRef]
- Steininger, K.W.; Williges, K.; Meyer, L.H.; Maczek, F.; Riahi, K. Sharing the Effort of the European Green Deal among Countries. Nat. Commun. 2022, 13, 3673. [Google Scholar] [CrossRef]
- Habert, G.; Röck, M.; Steininger, K.; Lupísek, A.; Birgisdottir, H.; Desing, H.; Chandrakumar, C.; Pittau, F.; Passer, A.; Rovers, R.; et al. Carbon Budgets for Buildings: Harmonising Temporal, Spatial and Sectoral Dimensions. Build. Cities 2020, 1, 429–452. [Google Scholar] [CrossRef]
- prEN 15978:2024; Sustainability of Construction Works—Assessment of Environmental Performance of Buildings—Requirements and Guidance. European Committee for Standardization (CEN): Brussels, Belgium, 2024. Available online: https://www.cen.eu (accessed on 10 October 2025).
- Cabeza, L.F.; Rincón, L.; Vilariño, M.V.; Pérez, G.; Castell, A. Life Cycle Assessment (LCA) and Life Cycle Energy Analysis (LCEA) of Buildings and the Building Sector: A Review. Renew. Sustain. Energy Rev. 2014, 29, 394–416. [Google Scholar] [CrossRef]
- Mastrucci, A.; Marvuglia, A.; Leopold, U.; Benetto, E. Life Cycle Assessment of Building Stocks from Urban to Transnational Scales: A Review. Renew. Sustain. Energy Rev. 2017, 74, 316–332. [Google Scholar] [CrossRef]
- Weidner, T.; Guillén-Gosálbez, G. Planetary Boundaries Assessment of Deep Decarbonisation Options for Building Heating in the European Union. Energy Convers. Manag. 2023, 278, 116602. [Google Scholar] [CrossRef]
- Hamels, S.; Himpe, E.; Laverge, J.; Delghust, M.; Van den Brande, K.; Janssens, A.; Albrecht, J. The Use of Primary Energy Factors and CO2 Intensities for Electricity in the European Context—A Systematic Methodological Review and Critical Evaluation of the Contemporary Literature. Renew. Sustain. Energy Rev. 2021, 146, 111182. [Google Scholar] [CrossRef]
- Pehl, M.; Arvesen, A.; Humpenöder, F.; Popp, A.; Hertwich, E.G.; Luderer, G. Understanding Future Emissions from Low-Carbon Power Systems by Integration of Life-Cycle Assessment and Integrated Energy Modelling. Nat. Energy 2017, 2, 939–945. [Google Scholar] [CrossRef]
- IEA. CO2 Emissions in 2023; IEA: Paris, France, 2024; Available online: https://www.iea.org/reports/co2-emissions-in-2023 (accessed on 10 October 2025).
- Schneider, S.; Drexel, R.; Zelger, T.; Baptista, J. PEExcel: A Fast One-Stop-Shop Assessment and Simulation Framework for Positive Energy Districts. In Proceedings of the 10th Conference of IBPSA-Germany and Austria, Vienna, Austria, 23–26 September 2024; Volume 10, pp. 80–88. [Google Scholar] [CrossRef]
- Stadt-Quartiere, Klimaaktiv. Available online: https://www.klimaaktiv.at/erneuerbare/erneuerbarewaerme/stadt-quartiere.html (accessed on 19 August 2024).
- Schöfmann, P.; Zelger, T.; Bartlmä, N.; Schneider, S.; Leibold, J.; Bell, D. Zukunftsquartier—Weg zum Plus-Energie-Quartier in Wien; Berichte aus Energie- und Umweltforschung; Austrian Research Promotion Agency: Vienna, Austria, 2020; p. 203. Available online: https://nachhaltigwirtschaften.at/resources/sdz_pdf/schriftenreihe-2020-11-zukunftsquartier.pdf (accessed on 10 October 2025).
- Schöfmann, P.; Forstinger, V.; Zelger, T.; Schneider, S.; Leibold, J.; Bell, D.; Schindler, M.; Mlinaric, I.; Hackl, L.; Wimmer, F.; et al. Zukunftsquartier 2.0 Replizierbare, Thermisch und Elektrisch Netzdienliche Konzeption von (Plus-Energie-) Quartieren im Dichten Urbanen Kontext; Berichte aus Energie- und Umweltforschung; Bundesministerium für Klimaschutz, Umwelt, Energie, Mobilität, Innovation und Technologie: Vienna, Austria, 2022. [Google Scholar]
- Schneider, S. Cities4PEDs Definition of Positive Energy Districts. 2023. Available online: https://energy-cities.eu/wp-content/uploads/2023/07/Cities4PEDs-WP2-Definition-.pdf (accessed on 10 October 2025).
- Simon Schneider PED Assessment Framework. Available online: https://github.com/simonschaluppe/peexcel (accessed on 21 August 2025).
- Austrian Standards Austrian Standards International. Nachhaltigkeit von Bauwerken—Umweltdeklarationen für Bauprodukte—Grundregeln für die Produktkategorie Bauprodukte (ÖNORM EN 15804); 91.010.99; Wien. 2022. Available online: https://www.austrian-standards.at/de/shop/onorm-en-15804-2022-02-15~p2614831 (accessed on 10 October 2025).
- Oekoindex OI3—IBO—Österreichisches Institut Für Bauen Und Ökologie. Available online: https://www.ibo.at/en/building-material-ecology/lifecycle-assessments/oekoindex-oi3 (accessed on 21 August 2025).
- Hoxha, E.; Passer, A.; Saade, M.R.M.; Trigaux, D.; Shuttleworth, A.; Pittau, F.; Allacker, K.; Habert, G. Biogenic Carbon in Buildings: A Critical Overview of LCA Methods. Build. Cities 2020, 1, 504–524. [Google Scholar] [CrossRef]
- Hawkins, W.; Cooper, S.; Allen, S.; Roynon, J.; Ibell, T. Embodied Carbon Assessment Using a Dynamic Climate Model: Case-Study Comparison of a Concrete, Steel and Timber Building Structure. Structures 2021, 33, 90–98. [Google Scholar] [CrossRef]
- Levasseur, A.; Lesage, P.; Margni, M.; Samson, R. Biogenic Carbon and Temporary Storage Addressed with Dynamic Life Cycle Assessment. J. Ind. Ecol. 2013, 17, 117–128. [Google Scholar] [CrossRef]
- Dobra, T.; Dolezal, F.; Zelger, T. TimberBioC—Critical Evaluation of the Effect on Climate Change by Biogenic Carbon in Wood Products by Means of Dynamic Models; IBO Verlag: Vienna, Austria, 2024; p. 2. [Google Scholar]
- Zelger, T.; Leibold, J.; Schneider, S.; Bachleitner, F.; Helnwein, J.; Holzer, P.; Stuckey, D.; Koch, A.; Doser, B.; Drexel, C.; et al. Aspern Klimafit 2.0 Final Report; Wien 3420 aspern Development AG: Wien, Austria, 2024; Available online: https://www.aspern-seestadt.at/Downloads-Pdfs/aspern%20klimafit.%20Endbericht%20-%20Kurzfassung_aspernKlimafit2_20240917.pdf (accessed on 10 October 2025).
- Streicher, W.; Schnitzer, H.; Tatzber, F.; Heimrath, R.; Wetz, I.; Titz, M.; Hausberger, S.; Haas, R.; Kalt, G.; Damm, A.; et al. Energieautarkie Für Österreich 2050. 2010. Available online: https://www.uibk.ac.at/media/filer_public/93/94/93941c9a-c2c4-4e68-bede-b275f5309689/energieautarkie_2050.pdf (accessed on 10 October 2025).
- Schneider, S.; Zelger, T.; Klauda, L. Reflections on the Question of What Share of Renewable Energy Must be Provided Locally in Austria in 2050 (Original German title: ÜBERLEGUNGEN ZUR FRAGE, WELCHER ANTEIL ERNEUERBARER ENERGIE 2050 IN ÖSTERREICH LOKAL AUFGEBRACHT WERDEN MUSS). 2020. Available online: https://simonschaluppe.org/publication/schneider-uberlegungen-2020/schneider-uberlegungen-2020.pdf (accessed on 10 October 2025).
- BUNDESMINISTERIUM FÜR NACHHALTIGKEIT UND TOURISMUS; BUNDESMINISTERIUM FÜR VERKEHR, I.U.T. #mission 2030 Klima- Und Energiestrategie. 2018. Available online: https://www.ewo-austria.at/wp-content/uploads/2020/03/mission2030_Klima-und-Energiestrategie_Endfassung.pdf (accessed on 10 October 2025).
- Bundesministerum für Klimaschutz. Integrierter nationaler Energie- und Klimaplan für Österreich. 2023. Available online: https://www.bmluk.gv.at/themen/klima-und-umwelt/klima/nationale-klimapolitik/energie_klimaplan.html (accessed on 10 October 2025).
- Tomschy, R.; Josef, F.; Follmer, R.; Sammer, G.; Klementschitz, R. Österreich Unterwegs 2013/2014; BMFIT: Wien, Austria, 2016; Available online: https://www.bmk.gv.at/dam/jcr:fbe20298-a4cf-46d9-bbee-01ad771a7fda/oeu_2013-2014_Ergebnisbericht.pdf (accessed on 9 October 2025).
- Schneider, S.; Baptista, J. Annual Hourly E-Mobility Modelling and Assessment in Climate Neutral Positive Energy Districts. In Proceedings of the 2025 IEEE International Conference on Environment and Electrical Engineering and 2025 IEEE Industrial and Commercial Power Systems Europe, Chania, Crete, 15–18 July 2025. [Google Scholar]
- Mair am Tinkhof, O.; Strasser, H.; Prinz, T.; Herbst, S.; Schuster, M.; Tomschy, R.; Figl, H.; Fellner, M.; Ploß, M.; Roßkopf, T. Richt- Und Zielwerte Für Siedlungen Zur Integralen Bewertung Der Klimaverträglichkeit von Gebäuden Und Mobilitätsinfrastruktur in Neubausiedlungen; Berichte aus Energie- und Umweltforschung; Bundesministerium für Verkehr, Innovation und Technologie: Wien, Austria, 2017; p. 118. Available online: https://nachhaltigwirtschaften.at/resources/sdz_pdf/berichte/schriftenreihe_2017-39_richt-zielwerte-siedlungen.pdf (accessed on 10 October 2025).
- Angelakoglou, K.; Kourtzanidis, K.; Giourka, P.; Apostolopoulos, V.; Nikolopoulos, N.; Kantorovitch, J. From a Comprehensive Pool to a Project-Specific List of Key Performance Indicators for Monitoring the Positive Energy Transition of Smart Cities—An Experience-Based Approach. Smart Cities 2020, 3, 705–735. [Google Scholar] [CrossRef]
- Salom, J.; Tamm, M.; Andresen, I.; Cali, D.; Magyari, Á.; Bukovszki, V.; Balázs, R.; Dorizas, P.V.; Toth, Z.; Zuhaib, S.; et al. An Evaluation Framework for Sustainable Plus Energy Neighbourhoods: Moving Beyond the Traditional Building Energy Assessment. Energies 2021, 14, 4314. [Google Scholar] [CrossRef]
- Suppa, A.R.; Cavana, G.; Binda, T. Supporting the EU Mission “100 Climate-Neutral Cities by 2030”: A Review of Tools to Support Decision-Making for the Built Environment at District or City Scale. In Proceedings of the International Conference on Computational Science and Its Applications, Malaga, Spain, 4–7 July 2022; Springer: Berlin/Heidelberg, Germany, 2022; pp. 151–168. [Google Scholar]
- Neumann, H.-M.; Hainoun, A.; Stollnberger, R.; Etminan, G.; Schaffler, V. Analysis and Evaluation of the Feasibility of Positive Energy Districts in Selected Urban Typologies in Vienna Using a Bottom-Up District Energy Modelling Approach. Energies 2021, 14, 4449. [Google Scholar] [CrossRef]
- Bruck, A.; Casamassima, L.; Akhatova, A.; Kranzl, L.; Galanakis, K. Creating Comparability among European Neighbourhoods to Enable the Transition of District Energy Infrastructures towards Positive Energy Districts. Energies 2022, 15, 4720. [Google Scholar] [CrossRef]
- Bruck, A.; Díaz Ruano, S.; Auer, H. A Critical Perspective on Positive Energy Districts in Climatically Favoured Regions: An Open-Source Modelling Approach Disclosing Implications and Possibilities. Energies 2021, 14, 4864. [Google Scholar] [CrossRef]
- Entwicklung Plusenergiequartierzertifizierung inklusive Quickcheck für klimaaktiv Zertifizierung Siedlungen. Available online: https://klimaneutralestadt.at/de/projekte/peq-quickcheck-klimaaktiv.php (accessed on 29 April 2025).
- Statistics Austria STATatlas. Available online: https://www.statistik.at/atlas/?theme=6 (accessed on 6 June 2022).
- Agency, I.E. Net Zero by 2050—A Roadmap for the Global Energy Sector; IEA: Paris, France, 2021; p. 224. Available online: https://www.iea.org/reports/net-zero-by-2050 (accessed on 10 October 2025).
- Amann, W.; Goers, S.; Komendantova, N.; Oberhuber, A. Kapazitätsanpassung der Bauwirtschaft für eine Erhöhte Sanierungsrate; Berichte aus Energie- und Umweltforschung; Bundesministerium für Klimaschutz, Umwelt, Energie, Mobilität, Innovation und Technologie: Wien, Austria, 2021; Available online: https://nachhaltigwirtschaften.at/resources/sdz_pdf/schriftenreihe-2021-27-kapazitaetsanpassung-bauwirtschaft.pdf (accessed on 10 October 2025).
- Österreichisches Institut für Bautechnik. OIB-Richtlinie 6. 2023. Available online: https://www.oib.or.at/kernaufgaben/oib-richtlinien/richtlinien/oib-richtlinien-2023/ (accessed on 10 October 2025).
- Dörn, M.; Fernkälte—Die Kühlung aus der Leitung. ArchiPHYSIK 2020. Available online: https://archiphysik.at/fernkaelte-die-kuehlung-aus-der-leitung/ (accessed on 10 October 2025).


| Type of PED | Acronym | Requirements |
|---|---|---|
| Positive Energy District | PED | PE Balance > 0 excl. EMIM |
| Positive Energy District with Mobility | PED + M | PE Balance > 0 incl. EMIM |
| Climate-Neutral Positive Energy District (reported in this study) | CN PED | PE Balance > 0 incl. EMIM GHG LCA ≤ L3 over 2025–2075 |
| Limit | Value | Unit | Description and Compliance Note |
|---|---|---|---|
| Paris-compatible target limit (GHG L1) | 72 | kgCO2e·m−2GFA | Stringent, science-based carbon budget based on [2,27] ensuring a safe pathway to 1.5 °C. Assumes no contribution from biogenic carbon sequestration. Achieving this limit provides the highest certainty of Paris alignment but is challenging in practice. |
| Precautionary compliance limit (GHG L2) | 196 | kgCO2e·m−2GFA | Upper bound for climate-neutral declaration, assuming 0.5 tCO2e·a−1·cap−1 sequestration. Offers flexibility while retaining a safety buffer; exceeding this value increases risk of overshooting Paris-compatible budgets. |
| Absolute compliance limit (GHG L3) | 320 | kgCO2e·m−2GFA | Maximum permissible budget, assuming 1 tCO2e·a−1·cap−1 global sequestration. Exceeding this value disqualifies a PED from climate-neutral status under this framework. |
| Life Cycle Stage | Sub-Stage | Module | Considered | Notes/Comments |
|---|---|---|---|---|
| A—Pre-construction | Pre-construction | A0 | No | Outside EN 15978 scope here |
| A—Product stage | Product stage | A1 | Yes | Raw material supply (embodied) |
| A2 | Yes | Transport to manufacturing | ||
| A3 | Yes | Manufacturing emissions | ||
| A—Construction process stage | Construction | A4 | Yes | Assessed if practical/data available |
| A5 | Yes | Assessed if practical/data available | ||
| B—Use stage | Use (non-energy) | B1 | No | Not considered |
| Maintenance | B2 | Yes | Included; post-2050 assumed carbon-neutral | |
| Repair | B3 | Yes | Same as B2 | |
| Replacement | B4 | Yes | Same as B2 | |
| Refurbishment | B5 | Yes | Same as B2 | |
| Operational energy use | B6 | Yes | Dynamic/Monthly factors (to 0 by 2050) | |
| Operational water use | B7 | No | Water-related GHG excluded | |
| Other building-related activities | B8 | Partly | EMIM B8.1 and B8.2 included (Section 2.4.2) Operational mileage + one-time vehicle embodied (≤2050) | |
| C—End-of-life stage | End-of-life | C1 | Yes | Included; post-2050 carbon-neutral |
| C2 | Yes | Same as C1 | ||
| C3 | Yes | Same as C1 | ||
| C4 | Yes | Same as C1 | ||
| D—Beyond system boundary | Reuse/recycling recovery | D1 | Yes | |
| Exported utilities | D2 | Yes | PV grid feed in credited as substitution with negative hourly/monthly factors | |
| Contextual | Off-plot public infrastructure | — | No | Optional reporting only (not for compliance) |
| B8 Emission Cause/Use | Accounted | Modeled | Emission Balance Impact | Treatment/Rationale |
|---|---|---|---|---|
| Public Transport | ✗ | ✗ | None | Allocated to transport sector; outside district control. |
| Pedestrian, Bike, Other | ✗ | ✗ | None | Negligible at district scale. (Included if not) |
| EMIM ICE Trips to District | ✓ | ✓ | + | Included. |
| EMIM ICE Trips elsewhere | ✗ | ✗ | None | Not included here; attributed to destination system. |
| EMIM EV On-site Charging | (✓) | ✓ | + | Included using hourly source emission factors (grid, local PV = 0) |
| EMIM EV Off-site Charging | (✓) | ✓ | + | Included using hourly grid emission factors. |
| → Trips to District | ✓ | ✓ | (+) | Implicitly included |
| → Trips elsewhere | ✗ | ✓ | − | Deduct grid-equivalent credit to remove out-of-district travel from EV charging OE |
| → V2B discharge | ✓ | ✓ | (+) | Like BESS: Charging included, but lowering building OE at discharge |
| Project | D1 | D2 | D3 | D4 | D5 | D6 | Unit |
|---|---|---|---|---|---|---|---|
| Location | Innsbruck | Vienna | Salzburg | Vienna | Vienna | Vienna | |
| Gross Floor Area (GFA) | 5886 | 13,069 | 31,799 | 9761 | 180,492 | 33,506 | m2 |
| Net to Gross Floor Area | 80 | 80 | 80 | 80 | 80 | 80 | % |
| Construction Type | Conv | Eco | Eco | Eco | Conv | Conv | |
| Refurbishment Share | 0 | 18 | 0 | 100 | 100 | 0 | % |
| Buildings | 5 | 2 | 16 | 2 | 71 | 3 | |
| District Plot area | 7341 | 14,095 | 28,000 | 4662 | 48,131 | 7323 | m2 |
| Floor Space Index (FSI) | 0.80 | 0.93 | 1.14 | 2.09 | 3.75 | 4.58 | – |
| Context Factor Density [24] | −11.3 | −3.7 | 5.6 | 26.2 | 37.9 | 40.7 | kWhPE·m−2NFA·a−1 |
| Context Factor Mobility [24] | 14.1 | 12.9 | 14.9 | 14.1 | 16.7 | 25.6 | kWhPE·m−2NFA·a−1 |
| Context Factor Renovation [24] | 0 | 2.2 | 0 | 15.0 | 15.0 | 0 | kWhPE·m−2NFA·a−1 |
| Residential Space Use | 100 | 96 | 100 | 91 | 52 | % | |
| Office/Commercial Space Use | 3 | 9 | 38 | % | |||
| Education Space Use | 100 | 1 | 2 | % | |||
| Retail Space Use | 8 | % | |||||
| Heating System | AS HP | GS HP | DH | GS HP | DH | GS HP | |
| Cooling System | None | GS HP | None | GS HP | None | GS HP * | |
| DHW System | AS HP | GS HP | DH | DH | DH | GS HP | |
| Window Ventilation Mechanical Ventilation | 0100 | 0100 | 0100 | 0100 | 90 10 | 0100 | % % |
| PV installed capacity | 196 | 345 | 547 | 91.1 | 127 | 560 | kWp |
| PV specific yield | 39.8 | 32.7 | 20.0 | 10.7 | 0.9 | 19.5 | kWh·m−2NFA·a−1 |
| EV Share | 70 | 70 | 70 | 70 | 70 | 70 | % |
| EMIM Reduction | 27% | 20% | 10% | 10% | |||
| Flexible TABS | +3K heat | +1K heat | None | +3K heat −2K cool | ±2K | +3K heat −2K cool |
| District | Heat Demand kWh·m−2NFA·a−1 | GHG LCA kgCO2e·m−2GFA | Δ vs. L3 * kgCO2e·m−2GFA | <L3 | PE Balance ** kWhPE·m−2NFA·a−1 | >0 | CN PED *** |
|---|---|---|---|---|---|---|---|
| D1 | 16.0 | 349.2 | +29.2 | ✗ | 2.8 | ✓ | ✗ |
| D2 | 21.3 | 292.6 | −27.4 | ✓ | 8.2 | ✓ | ✓ |
| D3 | 25.6 | 278.0 | −42.0 | ✓ | −47.7 | ✗ | ✗ |
| D4 | 33.3 | 211.3 | −108.7 | ✓ | 2.8 | ✓ | ✓ |
| D5 | 37.9 | 349.0 | +29.0 | ✗ | −34.3 | ✗ | ✗ |
| D6 | 13.8 | 620.2 | +300.2 | ✗ | 12.8 | ✓ | ✗ |
| Scenario | PV Yield kWh·m−2a−1 | EE A1–A3 w/o PV kgCO2e·m−2GFA | EE A1-3 TES PV kgCO2e·m−2GFA | ∆EE [%] | ∆LCA [%] |
|---|---|---|---|---|---|
| D1 | 39.8 | 284.0 | 38.6 | +13.6 | +11.0 |
| D2 | 32.7 | 232.8 | 30.6 | +13.1 | +10.5 |
| D3 | 20.0 | 122.1 | 19.9 | +16.3 | +7.1 |
| D4 | 10.7 | 58.0 | 10.8 | +18.7 | +5.1 |
| D5 | 0.9 | 163.1 | 8.1 | +5.0 | +2.3 |
| D6 | 19.5 | 433.0 | 19.4 | +4.3 | +3.1 |
| Scenario | Construction | PV Size | Mobility | TES | GHG LCA * | <L3 | <L2 | Primary Energy Balance kWhPE·m−2NFA·a−1 | Climate Neutral PED | |
|---|---|---|---|---|---|---|---|---|---|---|
| Fossil Constr | Fossil | 1× | 70% EV | DH | 378.2 | ✗ | ✗ | −47.4 | ✗ | ✗ |
| Eco Constr | Ecological | 1× | 70% EV | DH | 277.6 | ✓ | ✗ | −47.4 | ✗ | ✗ |
| EC + 2.6 × PV | Ecological | 2.6× | 70% EV | DH | 225.6 | ✓ | ✗ | +6.9 | ✓ | ✓ |
| EC + 2 × PV + Mob | Ecological | 2× | 90% EV, 80% EMIM | DH | 170.1 | ✓ | ✓ | +5.7 | ✓ | ✓ |
| EC + 1.7 × PV GSHP | Ecological | 1.7× | 70% EV | GS HP | 254.7 | ✓ | ✗ | +0.9 | ✓ | ✓ |
| Scenario | OE (B6-D2) | ∆BL % | PE Balance kWh·m−2·a−1 | ED kWh·m−2·a−1 | ∆BL % | EIGrid gCO2e·kWh−1 | EIdistrict gCO2e·kWh−1 | ∆EI/EIGrid % |
|---|---|---|---|---|---|---|---|---|
| [%]19M | 175.4 | +14.4 | +6.3 | 43.2 | 0.0 | 231 | 241.0 | +4.2 |
| 19A | 167.3 | +9.1 | +6.6 | 43.2 | 0.0 | 227 | 224.6 | −1.1 |
| 23M (Baseline) | 153.3 | - | +2.8 | 43.2 | - | 175 | 188.9 | +7.4 |
| 23H 24-5 | 141.3 | −7.8 | +22.2 | 44.2 | +2.3 | 175 | 162.1 | −8.0 |
| 23H 48-5 | 141.2 | −7.9 | +22.5 | 44.2 | +2.3 | 175 | 161.9 | −8.1 |
| 23H 48-10 | 139.4 | −9.0 | +14.4 | 43.6 | +0.9 | 175 | 160.6 | −9.0 |
| 23H 72-10 | 139.8 | −8.8 | +14.7 | 43.6 | +1.0 | 175 | 161.1 | −8.6 |
| 23H 48-10 BESS | 137.3 | −10.4 | +19.3 | 44.2 | +2.3 | 175 | 154.2 | −13.5 |
| 23H 48-10 BESS V2G | 137.9 | −10.0 | +25.6 | 45.4 | +5.1 | 175 | 151.3 | −15.7 |
| Factor | Levels (Examples) | Unit | How Operationalized |
|---|---|---|---|
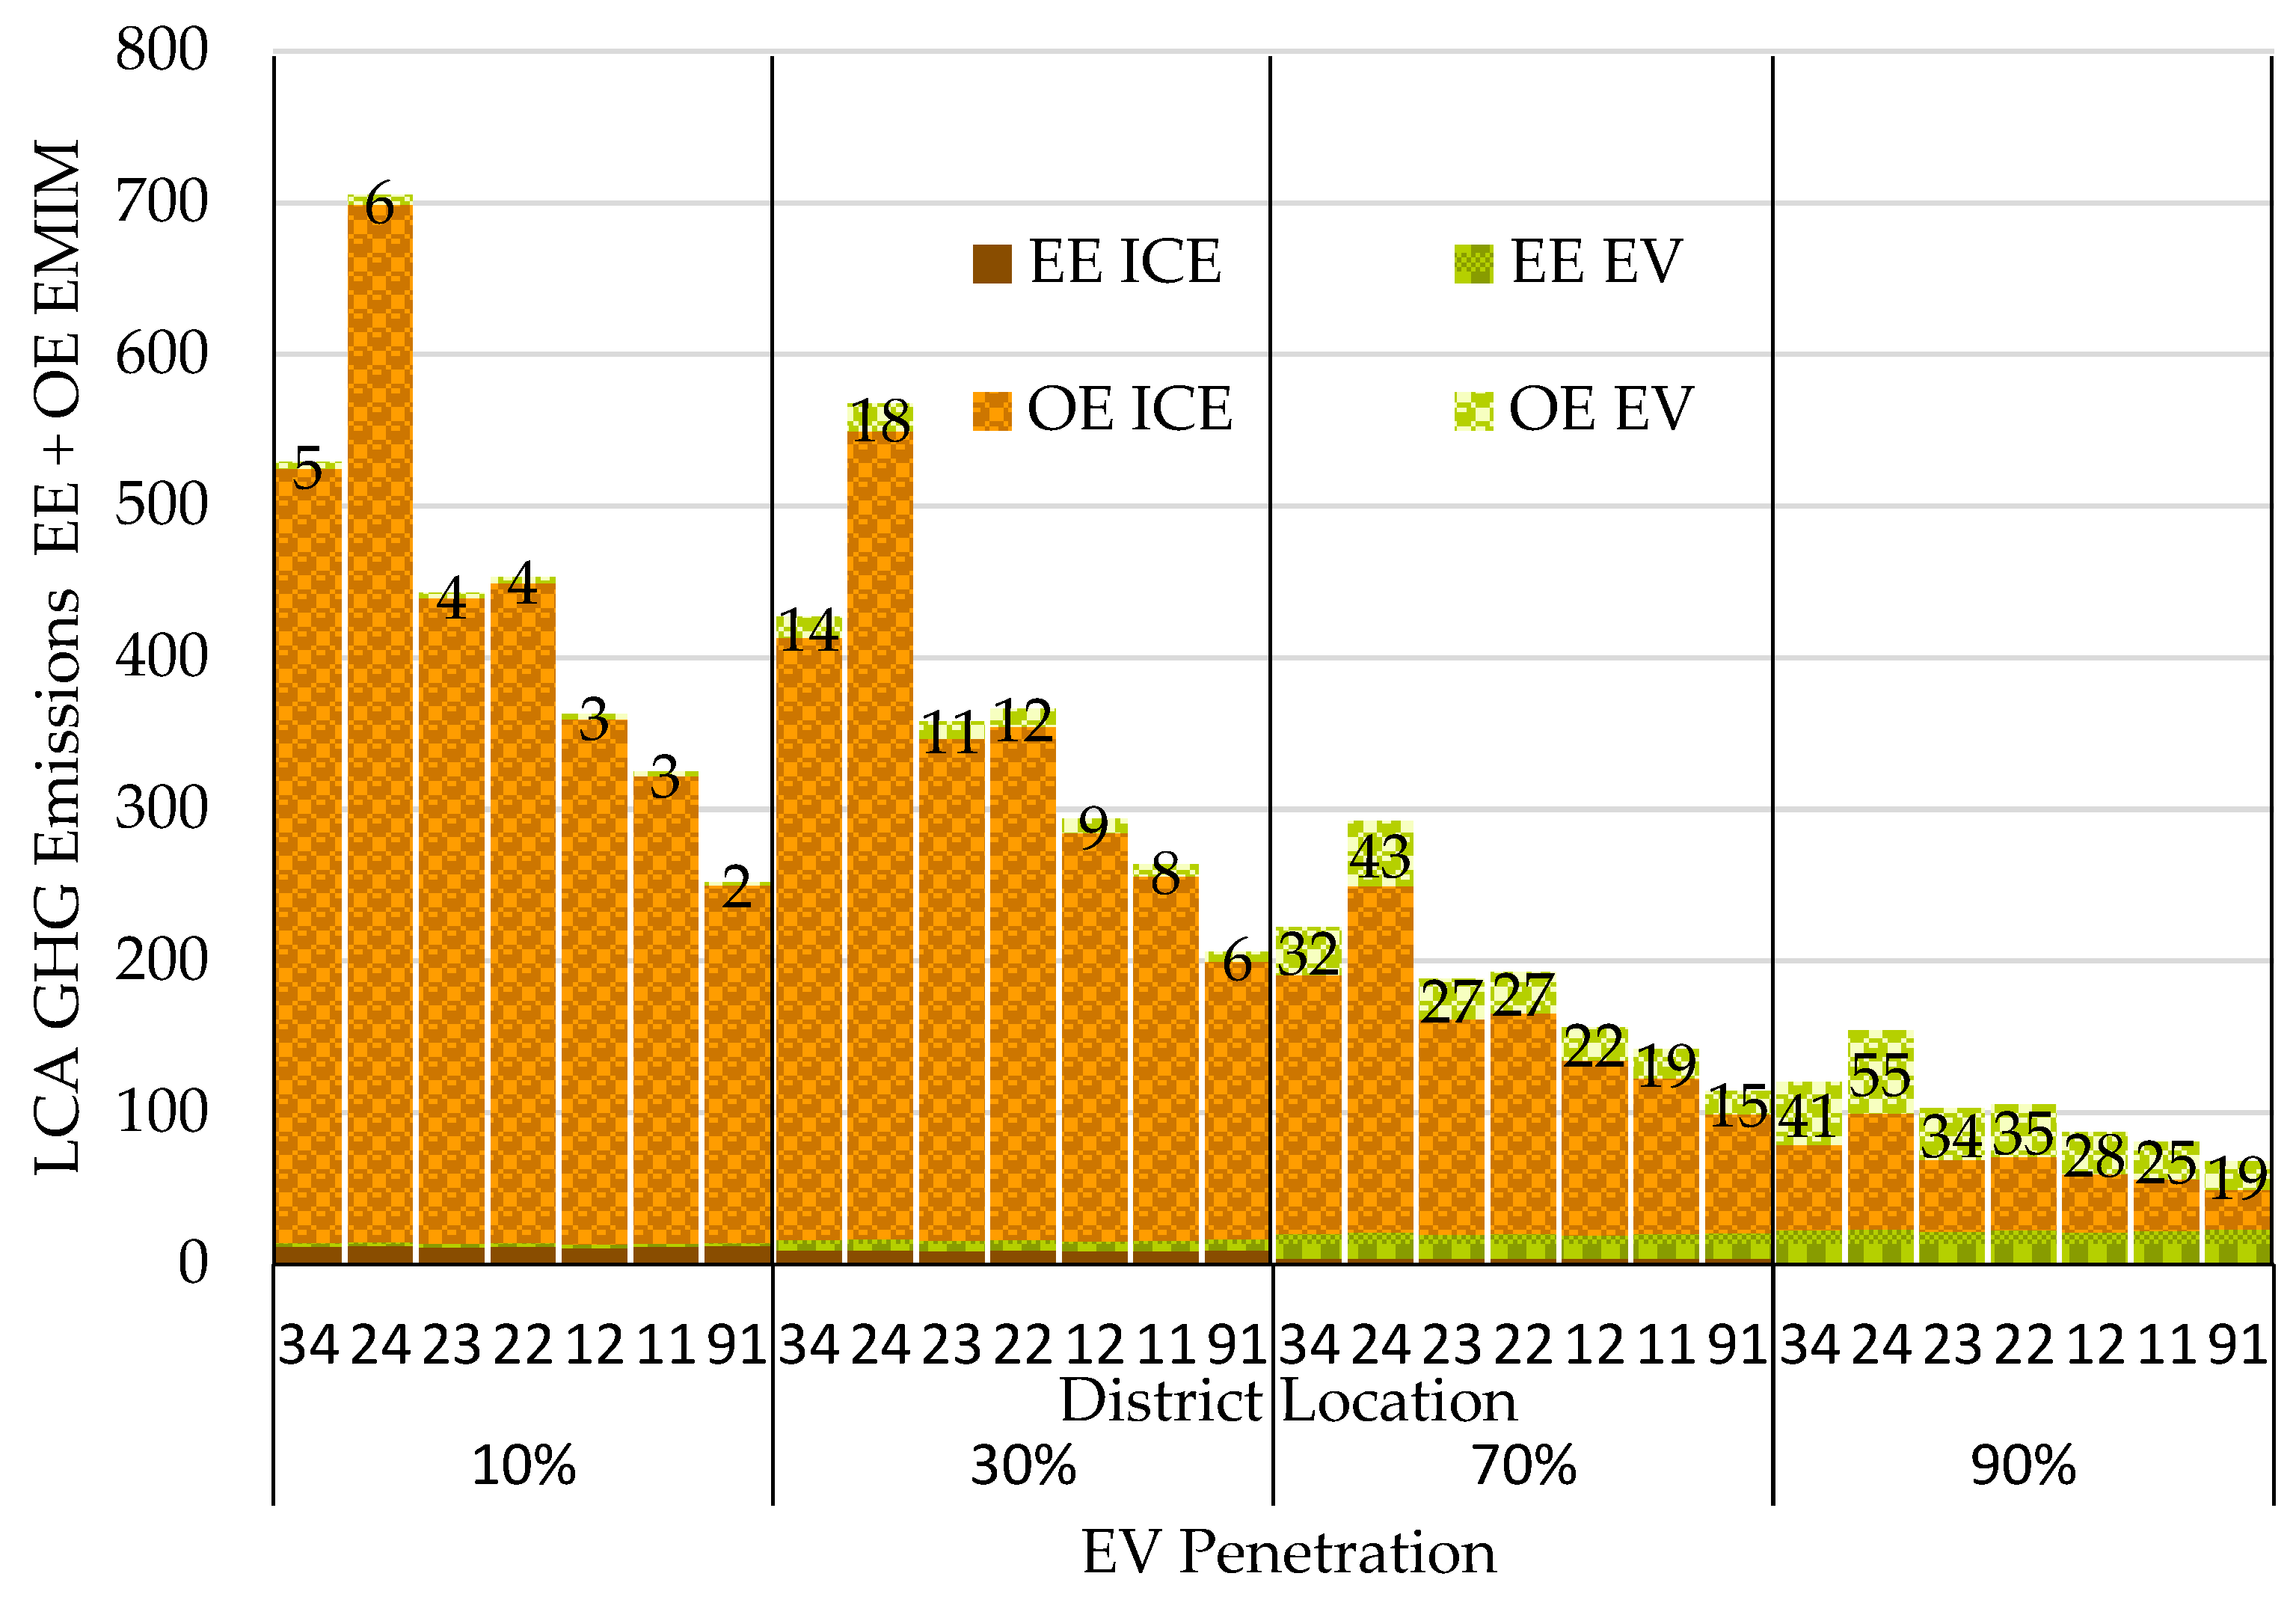
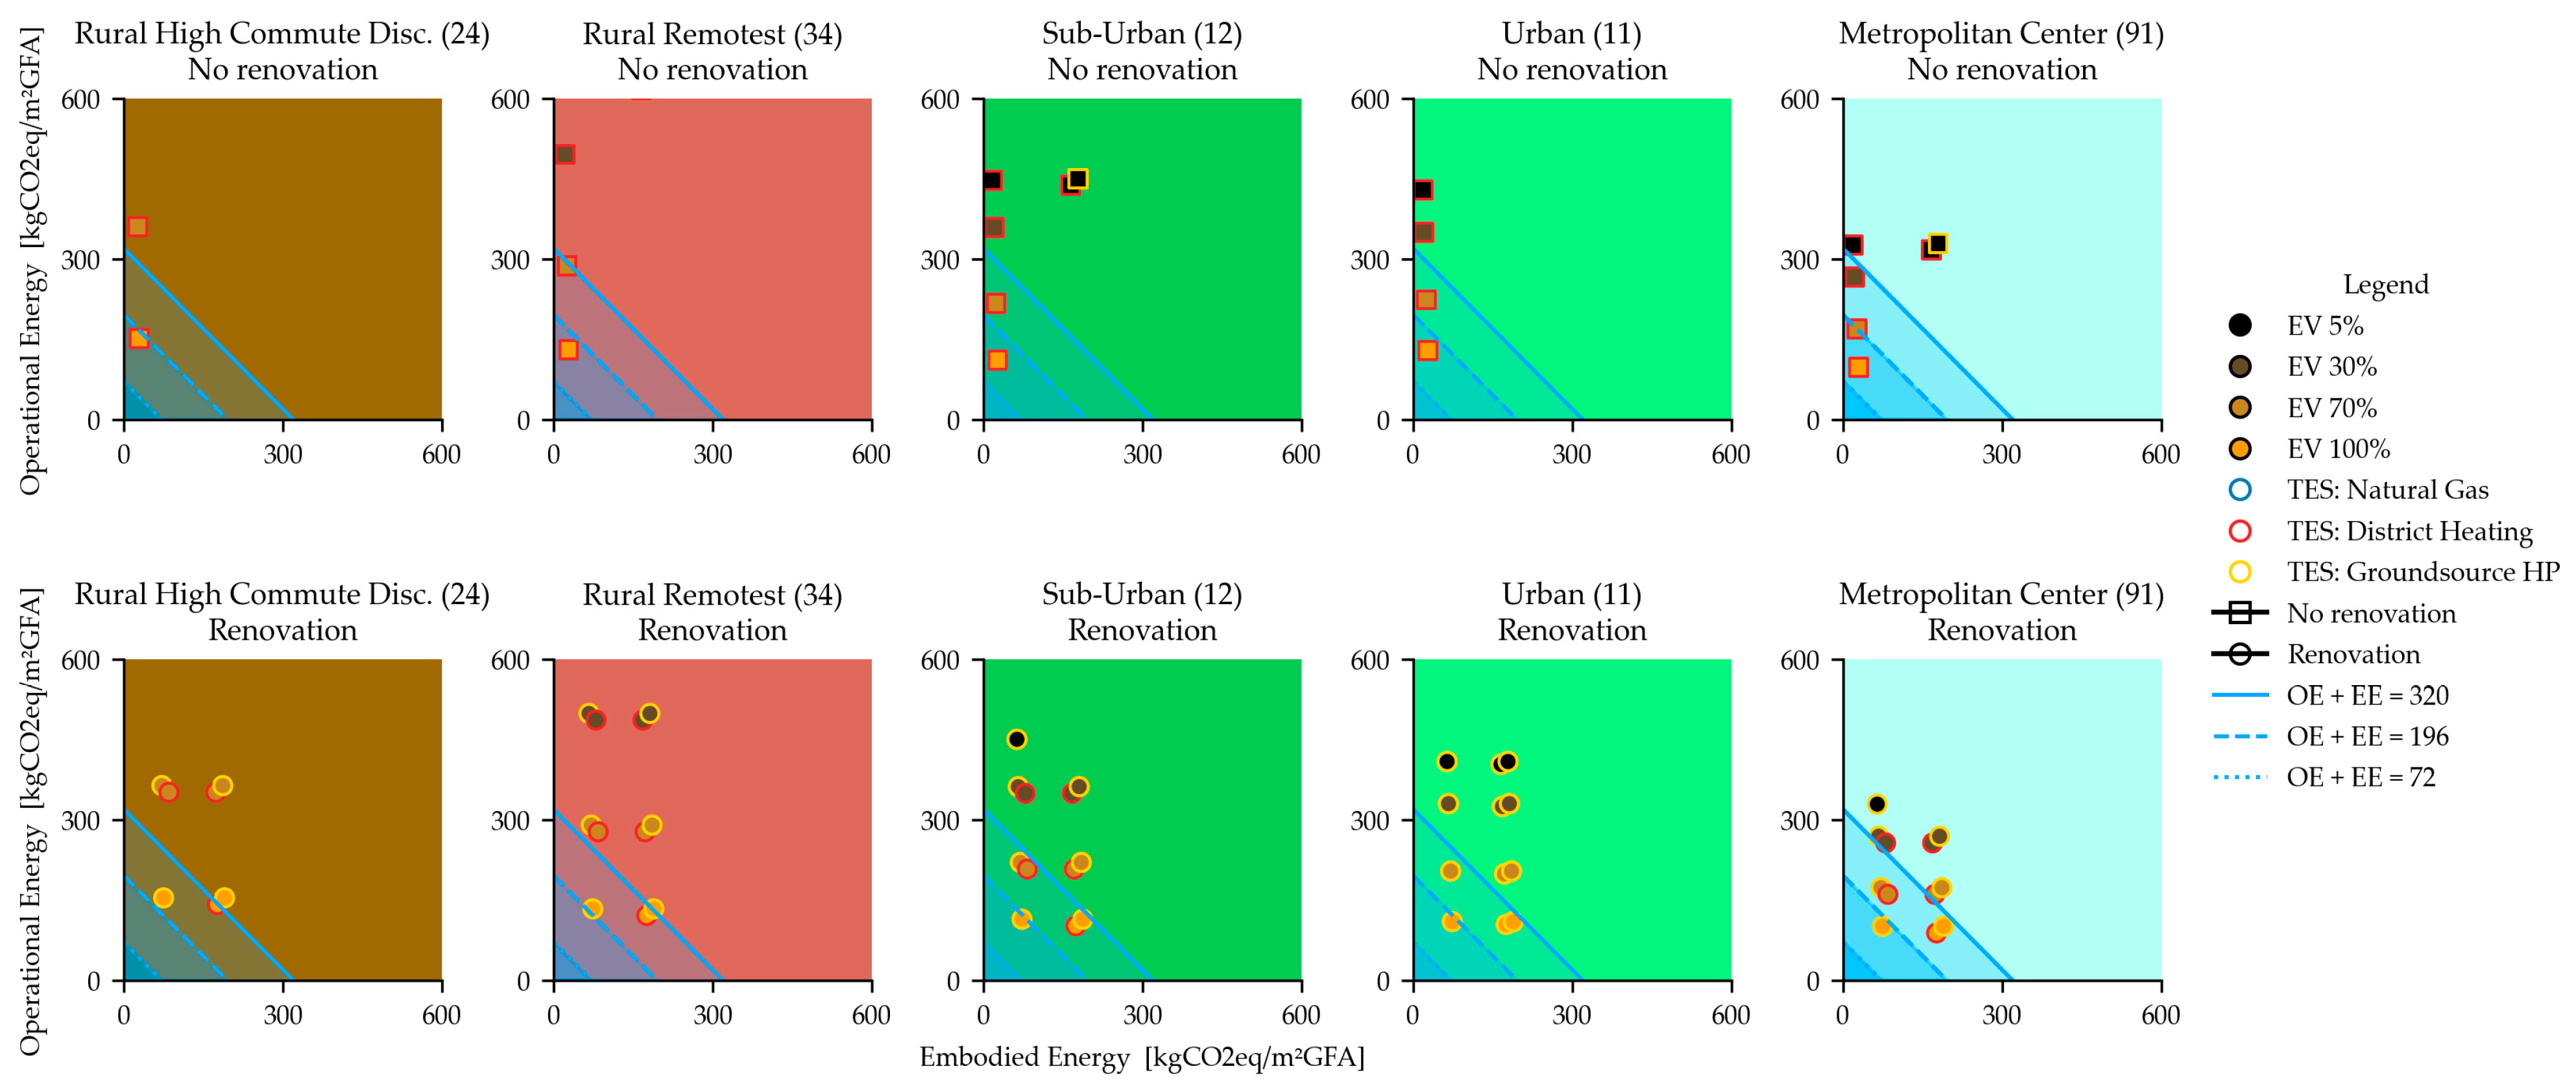
| Location (EMIM mileage) | 34 (Rural-2)/24 (Rural-1)/23/22/12 (Suburban)/11 (Urban)/91 (Metropolitan) | km·cap−1·a−1 | Per capita annual motorized mileage profile |
| EV share | 5/30/70/90 | % of EMIM | Split km into ICE/EV; apply EIc, EFc(t) |
| TES | Gas/DH/GSHP + PV | — | Carrier paths; PV substitution and D2 for feed-in |
| Renovation | None/Conventional/Ecologic | — | A1–A3 inventories; B6 demand |
| Scenario | TES | Renovation | GHG LCA kgCO2e·m−2GFA | L3 Compliance | PE Balance kWhPE·m−2GFAa−1 | PED Compliance |
|---|---|---|---|---|---|---|
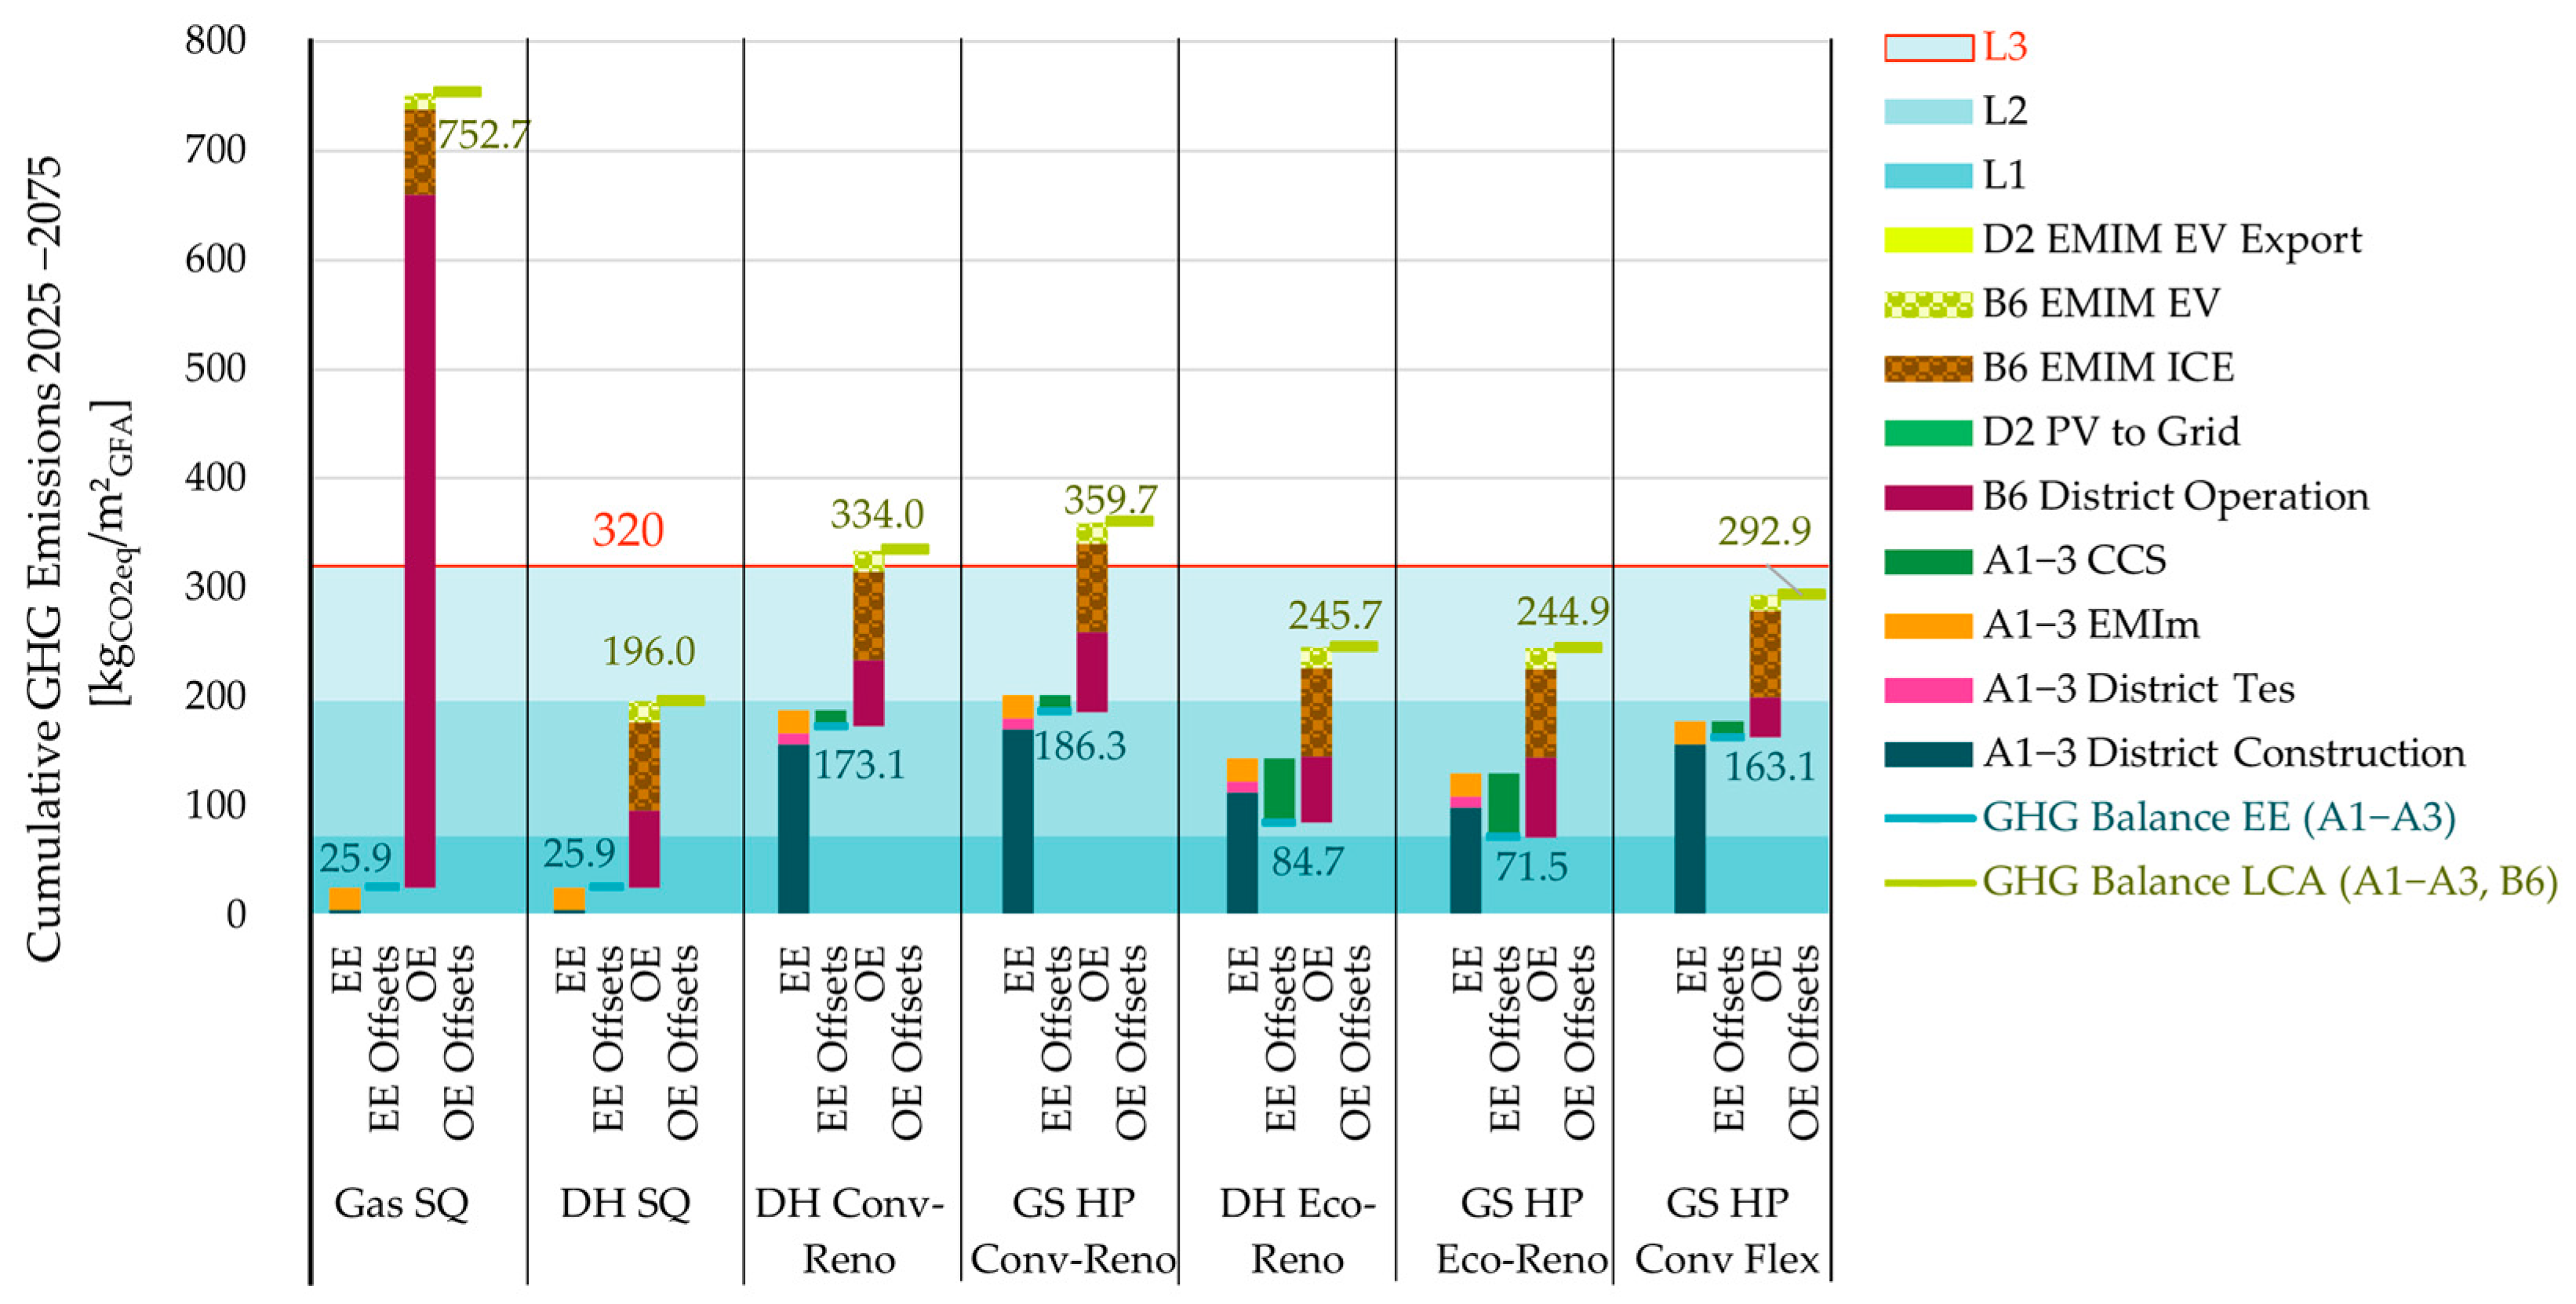
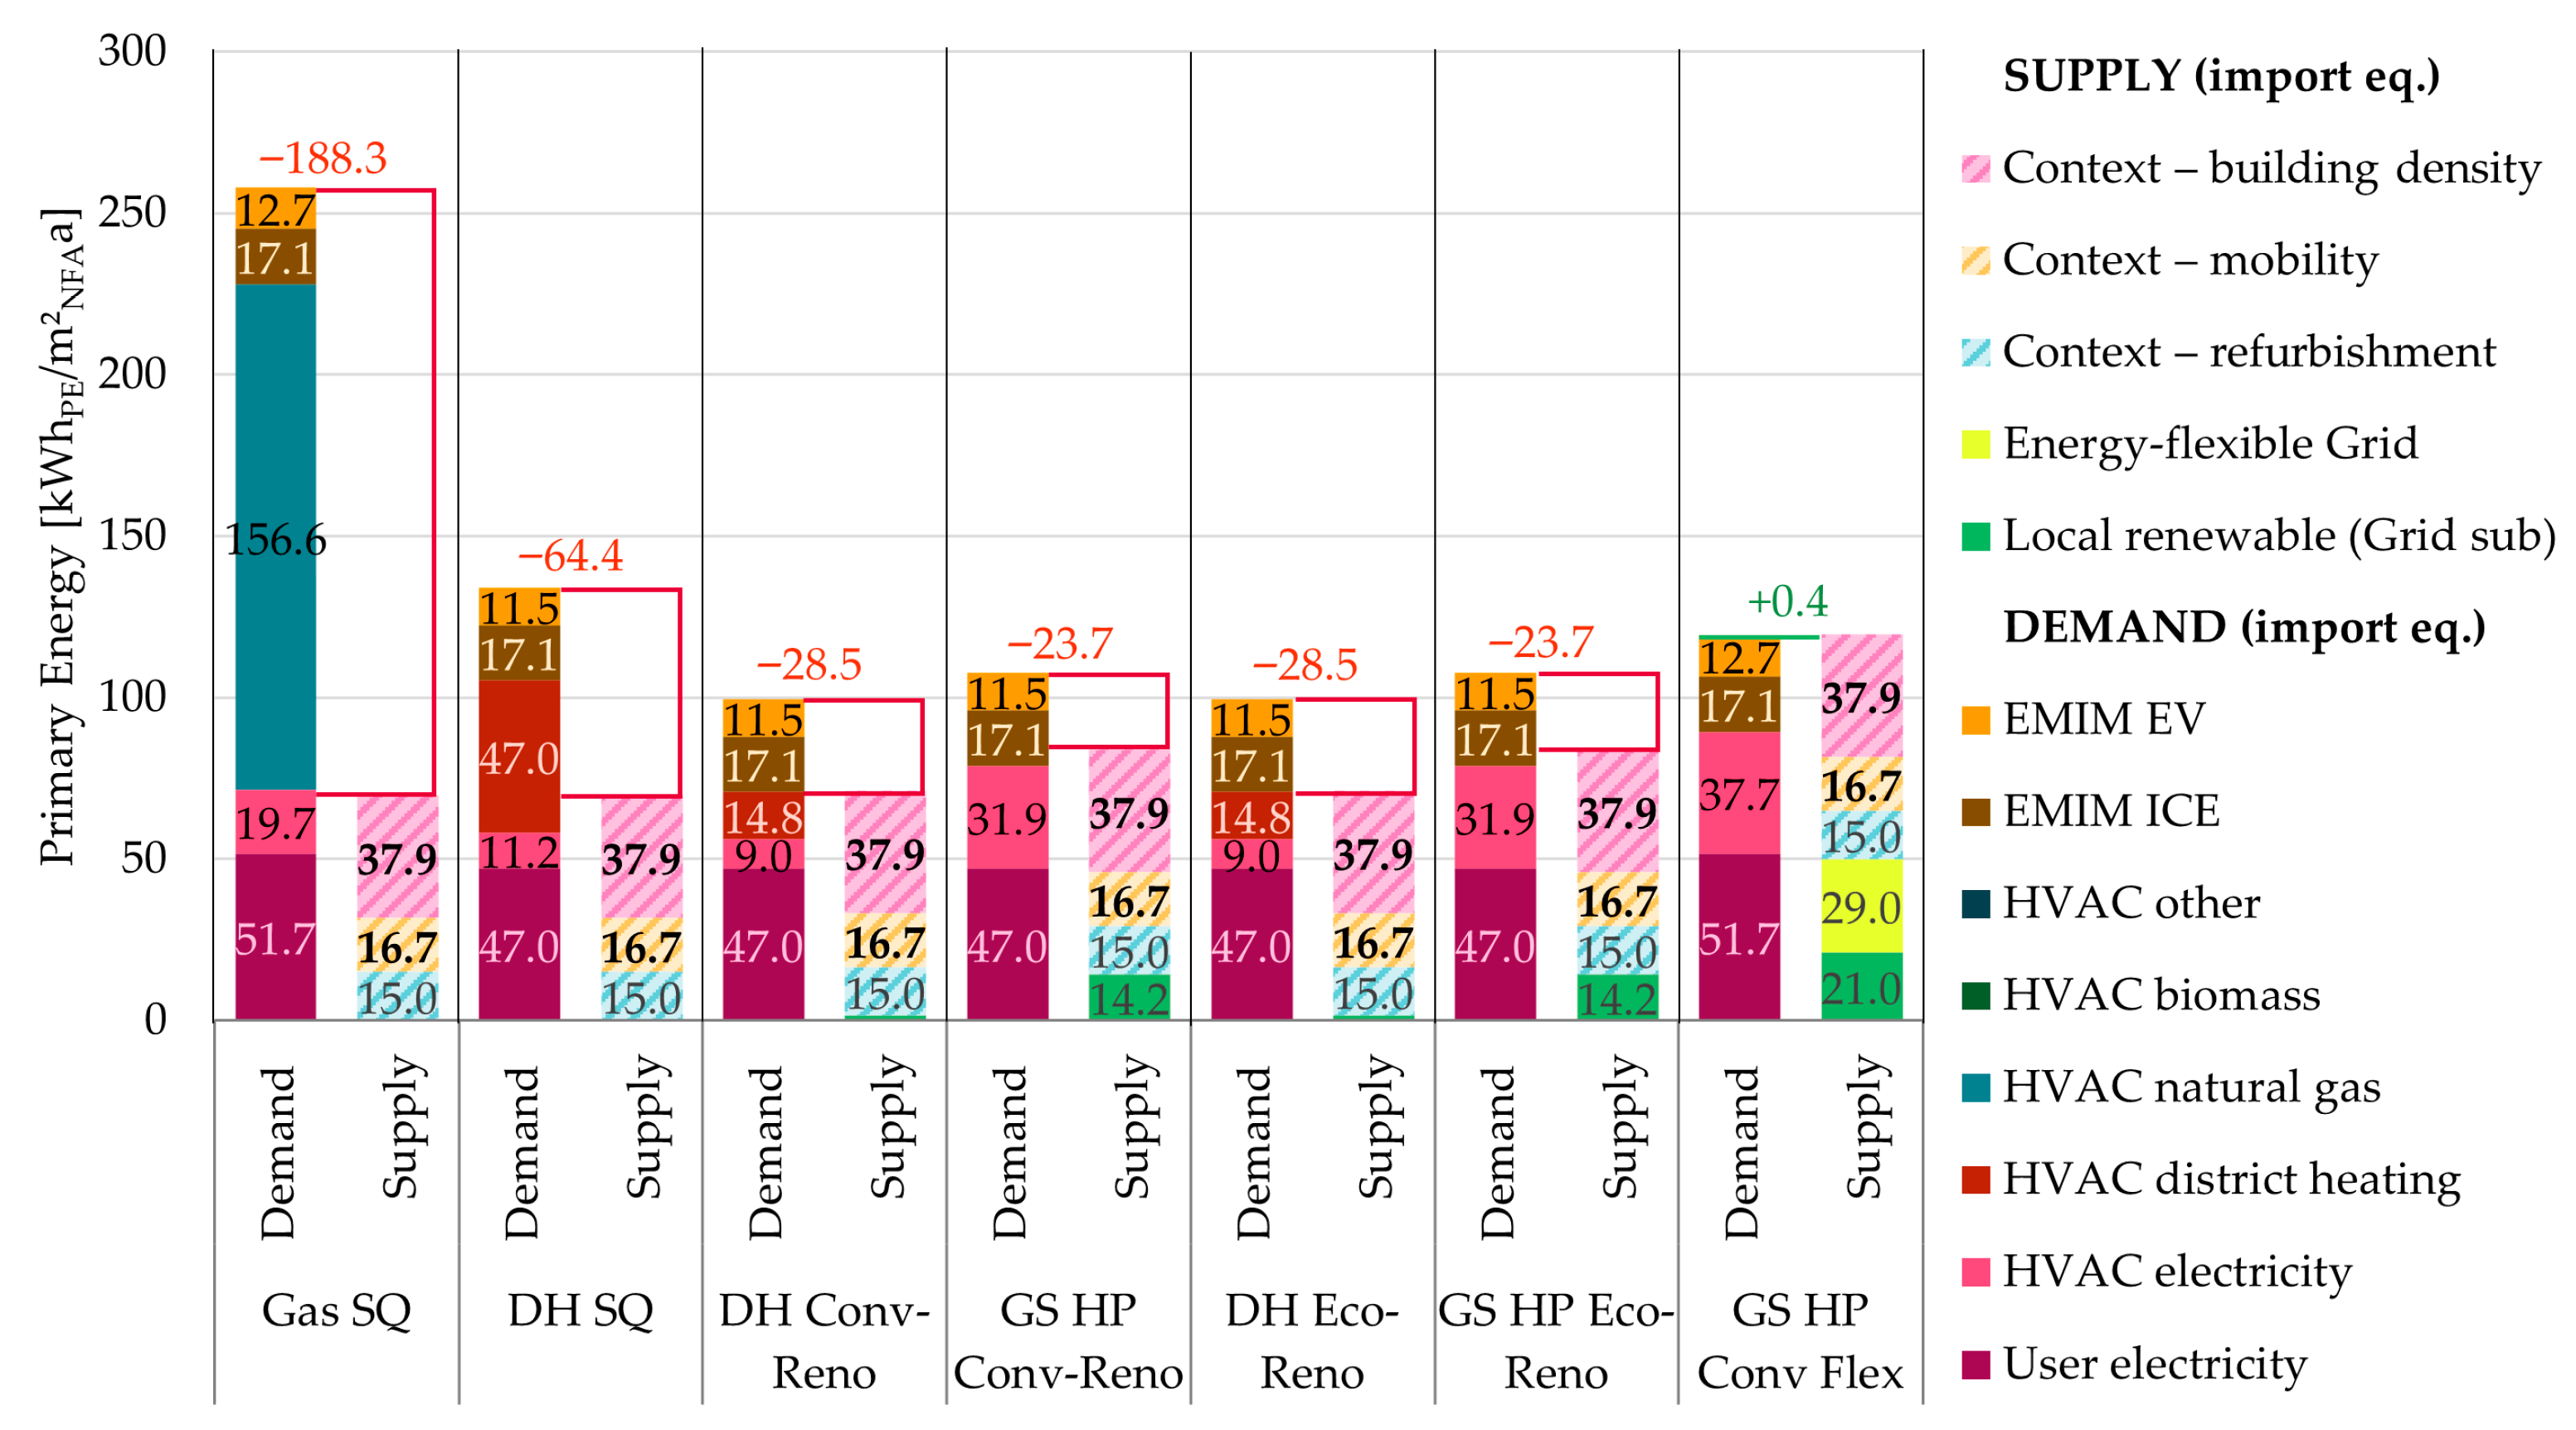
| Gas SQ | Gas | None | 752.7 | ✗ | −188.3 | ✗ |
| DH SQ | DH | None | 196.0 | ✓ | −64.4 | ✗ |
| DH Conv (Baseline) | DH | Conventional | 349.0 | ✗ | −28.5 | ✗ |
| GS HP Conv | GS HP | Conventional | 359.7 | ✗ | −23.7 | ✗ |
| DH Eco-Reno | DH | Ecological | 245.7 | ✓ | −28.5 | ✗ |
| GS HP Eco-Reno | GS HP | Ecological | 244.9 | ✓ | −23.7 | ✗ |
| GS HP Conv Flex | GS HP | Conventional | 292.9 | ✓ | +0.4 | ✓ |
| Scenario | EE A1–A3 | ∆ Baseline | EE Total | GHG LCA | Compliance |
|---|---|---|---|---|---|
| Conv-Build (Baseline) | 386.5 | - | 433.0 | 620.2 | ✗ |
| Eco-Skeleton | 266.7 | −31% | 313.2 | 500.3 | ✗ |
| Mixed-Use CLT | 90.1 | −77% | 136.6 | 323.8 | d (L3, <320) |
| Max-Eco | −91.0 | −124% | −44.5 | 142.7 | ✓ (L2, <196) |
Disclaimer/Publisher’s Note: The statements, opinions and data contained in all publications are solely those of the individual author(s) and contributor(s) and not of MDPI and/or the editor(s). MDPI and/or the editor(s) disclaim responsibility for any injury to people or property resulting from any ideas, methods, instructions or products referred to in the content. |
© 2025 by the authors. Licensee MDPI, Basel, Switzerland. This article is an open access article distributed under the terms and conditions of the Creative Commons Attribution (CC BY) license (https://creativecommons.org/licenses/by/4.0/).
Share and Cite
Schneider, S.; Zelger, T.; Drexel, R.; Schindler, M.; Krainer, P.; Baptista, J. Declaration-Ready Climate-Neutral PEDs: Budget-Based, Hourly LCA Including Mobility and Flexibility. Designs 2025, 9, 123. https://doi.org/10.3390/designs9060123
Schneider S, Zelger T, Drexel R, Schindler M, Krainer P, Baptista J. Declaration-Ready Climate-Neutral PEDs: Budget-Based, Hourly LCA Including Mobility and Flexibility. Designs. 2025; 9(6):123. https://doi.org/10.3390/designs9060123
Chicago/Turabian StyleSchneider, Simon, Thomas Zelger, Raphael Drexel, Manfred Schindler, Paul Krainer, and José Baptista. 2025. "Declaration-Ready Climate-Neutral PEDs: Budget-Based, Hourly LCA Including Mobility and Flexibility" Designs 9, no. 6: 123. https://doi.org/10.3390/designs9060123
APA StyleSchneider, S., Zelger, T., Drexel, R., Schindler, M., Krainer, P., & Baptista, J. (2025). Declaration-Ready Climate-Neutral PEDs: Budget-Based, Hourly LCA Including Mobility and Flexibility. Designs, 9(6), 123. https://doi.org/10.3390/designs9060123


