Article

Monitoring Occupant Posture Using a Standardized Sensor Interface with a Vehicle Seat

1
Enzo Ferrari Department of Engineering, University of Modena and Reggio Emilia, Via P. Vivarelli 10, 41125 Modena, Italy
2
Faculty of Mechanical Engineering, University of West Bohemia in Pilsen, Univerzitní 22, 306 14 Plzeň, Czech Republic
3
AIMotion Bavaria, Technische Hochschule Ingolstadt, Esplanade 10, D-85049 Ingolstadt, Germany
*
Author to whom correspondence should be addressed.
Designs 2025, 9(2), 52; https://doi.org/10.3390/designs9020052
Submission received: 24 March 2025 / Revised: 13 April 2025 / Accepted: 17 April 2025 / Published: 20 April 2025

Abstract

:
Car safety can be enhanced by enabling the Airbag Control Unit (ACU) to adaptively deploy different charges based on the occupant’s position once the crash occurs. In this context, monitoring the occupant’s position using a sensorized seat integrated with an Inertial Measurement Unit (IMU) offers a practical and cost-effective solution. However, certain challenges still need to be addressed. The adoption of sensorized seats in research and vehicle set-up is still under consideration. This study investigates an interface device that can be reconfigured to suit almost any seat model. This reconfigurability makes it easily adaptable to new vehicles under development and applicable to any passenger seat in the vehicle. This paper details the device’s design, including its programming using calibration and monitoring features, which significantly improves its reliability compared to earlier prototypes. Extensive testing through real driving experiments with multiple participants demonstrated an accuracy range of 45–100%. The testing involved both drivers and passengers, showcasing the device’s ability to effectively monitor various in-car scenarios.

1. Introduction and Related Works

The ACU in modern vehicles can implement adaptive deployment strategies based on sensors that monitor the state of the system, including travel speed, crash deceleration, or seat belt usage [1,2]. However, airbag deployment is not always beneficial, as its deployment against an Out-of-Position (OP) occupant can cause severe injuries instead of mitigating the impact of the crash [3,4,5,6]. To address this problem, ACUs could be further enhanced by adapting to the occupant’s position, and continuously monitored until the moment just before the crash [7,8,9,10].
Computer vision systems are highly effective for eye and face tracking to monitor driver attention and drowsiness in research settings [11,12,13]. Sophisticated versions of these systems have also been integrated into commercial vehicles [14,15,16,17]. Nevertheless, current vision-based monitoring technologies can generate false positives due to unpredictable factors such as occlusions, inadequate lighting, occupants with extreme body dimensions, or occupants positioned significantly away from the correct seating posture, conditions that are particularly likely in SAE levels 4 and 5 [18].
Research has explored the feasibility of seat devices for monitoring vehicle occupants. Seating comfort can be evaluated through extensive testing [19,20]. Seat devices can be used to measure vehicle inclination or detect a collision [21,22], to identify occupants and adapt restraint systems accordingly [23,24,25,26,27], and even to profile driving tasks [28,29].
The authors have developed four sensorized seat devices. In the first prototype, the surface pressure is monitored using 16 thin Force Sensing Resistors (FSRs) placed beneath the fabric [30,31,32]. During real dynamic driving conditions, the pressure distribution continuously changes as the body adjusts to vehicle accelerations. In order to isolate the occupant’s position, the vehicle acceleration is measured using an Inertial Measurement Unit (IMU) and subtracted from the position of the Centre of Pressure (CP). The seat is able to detect whether the occupant is in the correct position or in an OP condition by averaging the FSR readings in significant regions and tracking the CP in longitudinal and transverse directions.
This first device faces two main challenges. First, not all of the pressure distribution is monitored by the sensors, as they cover only specific areas of the seat surface. This limitation makes the device sensitive to surface irregularities and occupant biometrics, leading to monitoring errors. Second, the FSRs exhibit significant nonlinearity, hysteresis, and drift. These limitations cause the device to provide only qualitative measurements.
The second prototype is a flexible mat that covers the seat surface, possibly integrated as a layer beneath the seat fabric [33]. The device comprises three stacked layers: the outer layers contain parallel copper strips, with the lower layer arranged in rows and the upper layer in columns; the middle layer is a piezo-resistive sheet that decreases in electrical resistance when compressed. Pressure field scanning is performed using a matrix strategy, sequentially powering each Digital Output in the lower layer and reading the corresponding Analog Inputs in the upper one. With 1,500 monitored cells in the matrix, the system provides a highly detailed pressure distribution, allowing for advanced investigations.
This second device addresses the monitoring error by covering the entire seat surface. However, the limited reading effectiveness associated with the polymer sensor remains unsolved. Additionally, its air-proof design prevents seat ventilation. As a result, the device measurements are only suitable for experimentation focused on seating comfort.
The third prototype features a seat divided into 13 modules, each representing a significant region for monitoring the interaction between the occupant and the seat [34,35,36]. Each module is equipped with four metal load cells, providing linear, fast, and reliable reading.
This third device offers an effective solution for occupant monitoring. However, significant improvements are needed to enhance its robustness and comfort for practical use in commercial vehicles.
The latest prototype reuses the seat from a commercial car, modifying only the four-seat supports to integrate a load cell into each [37]. The seat has been extensively tested in harsh driving conditions with multiple test drivers, covering both normal and OP scenarios. Considering the car as a moving reference platform, monitored by an IMU, the seat can reliably identify the driver’s position and inform the onboard safety systems.
The main limitation of this device consists of its need for dedicated re-design efforts for each seat model. Additionally, the control software must be improved due to high cycle times that limit the effectiveness of the device for active safety. Finally, its safety across all crash conditions and homologation remains uncertain, necessitating extensive testing for each seat model.
The present research has developed an interface device that can be reconfigured to fit almost any seat model. The aim is to provide a sensor that is adaptable to any passenger seat, in both new and existing vehicles, for use in research and industrial projects. A comparison summary of the features and relative pros and cons of the four previous prototypes and the current one is reported in Table 1.
The remainder of this paper is organized as follows. Section 2 describes the construction and control of the sensor interface device. The results of static tests for device tuning and dynamic tests for its validation are reported and discussed in Section 3. Finally, Section 4 provides concluding remarks.

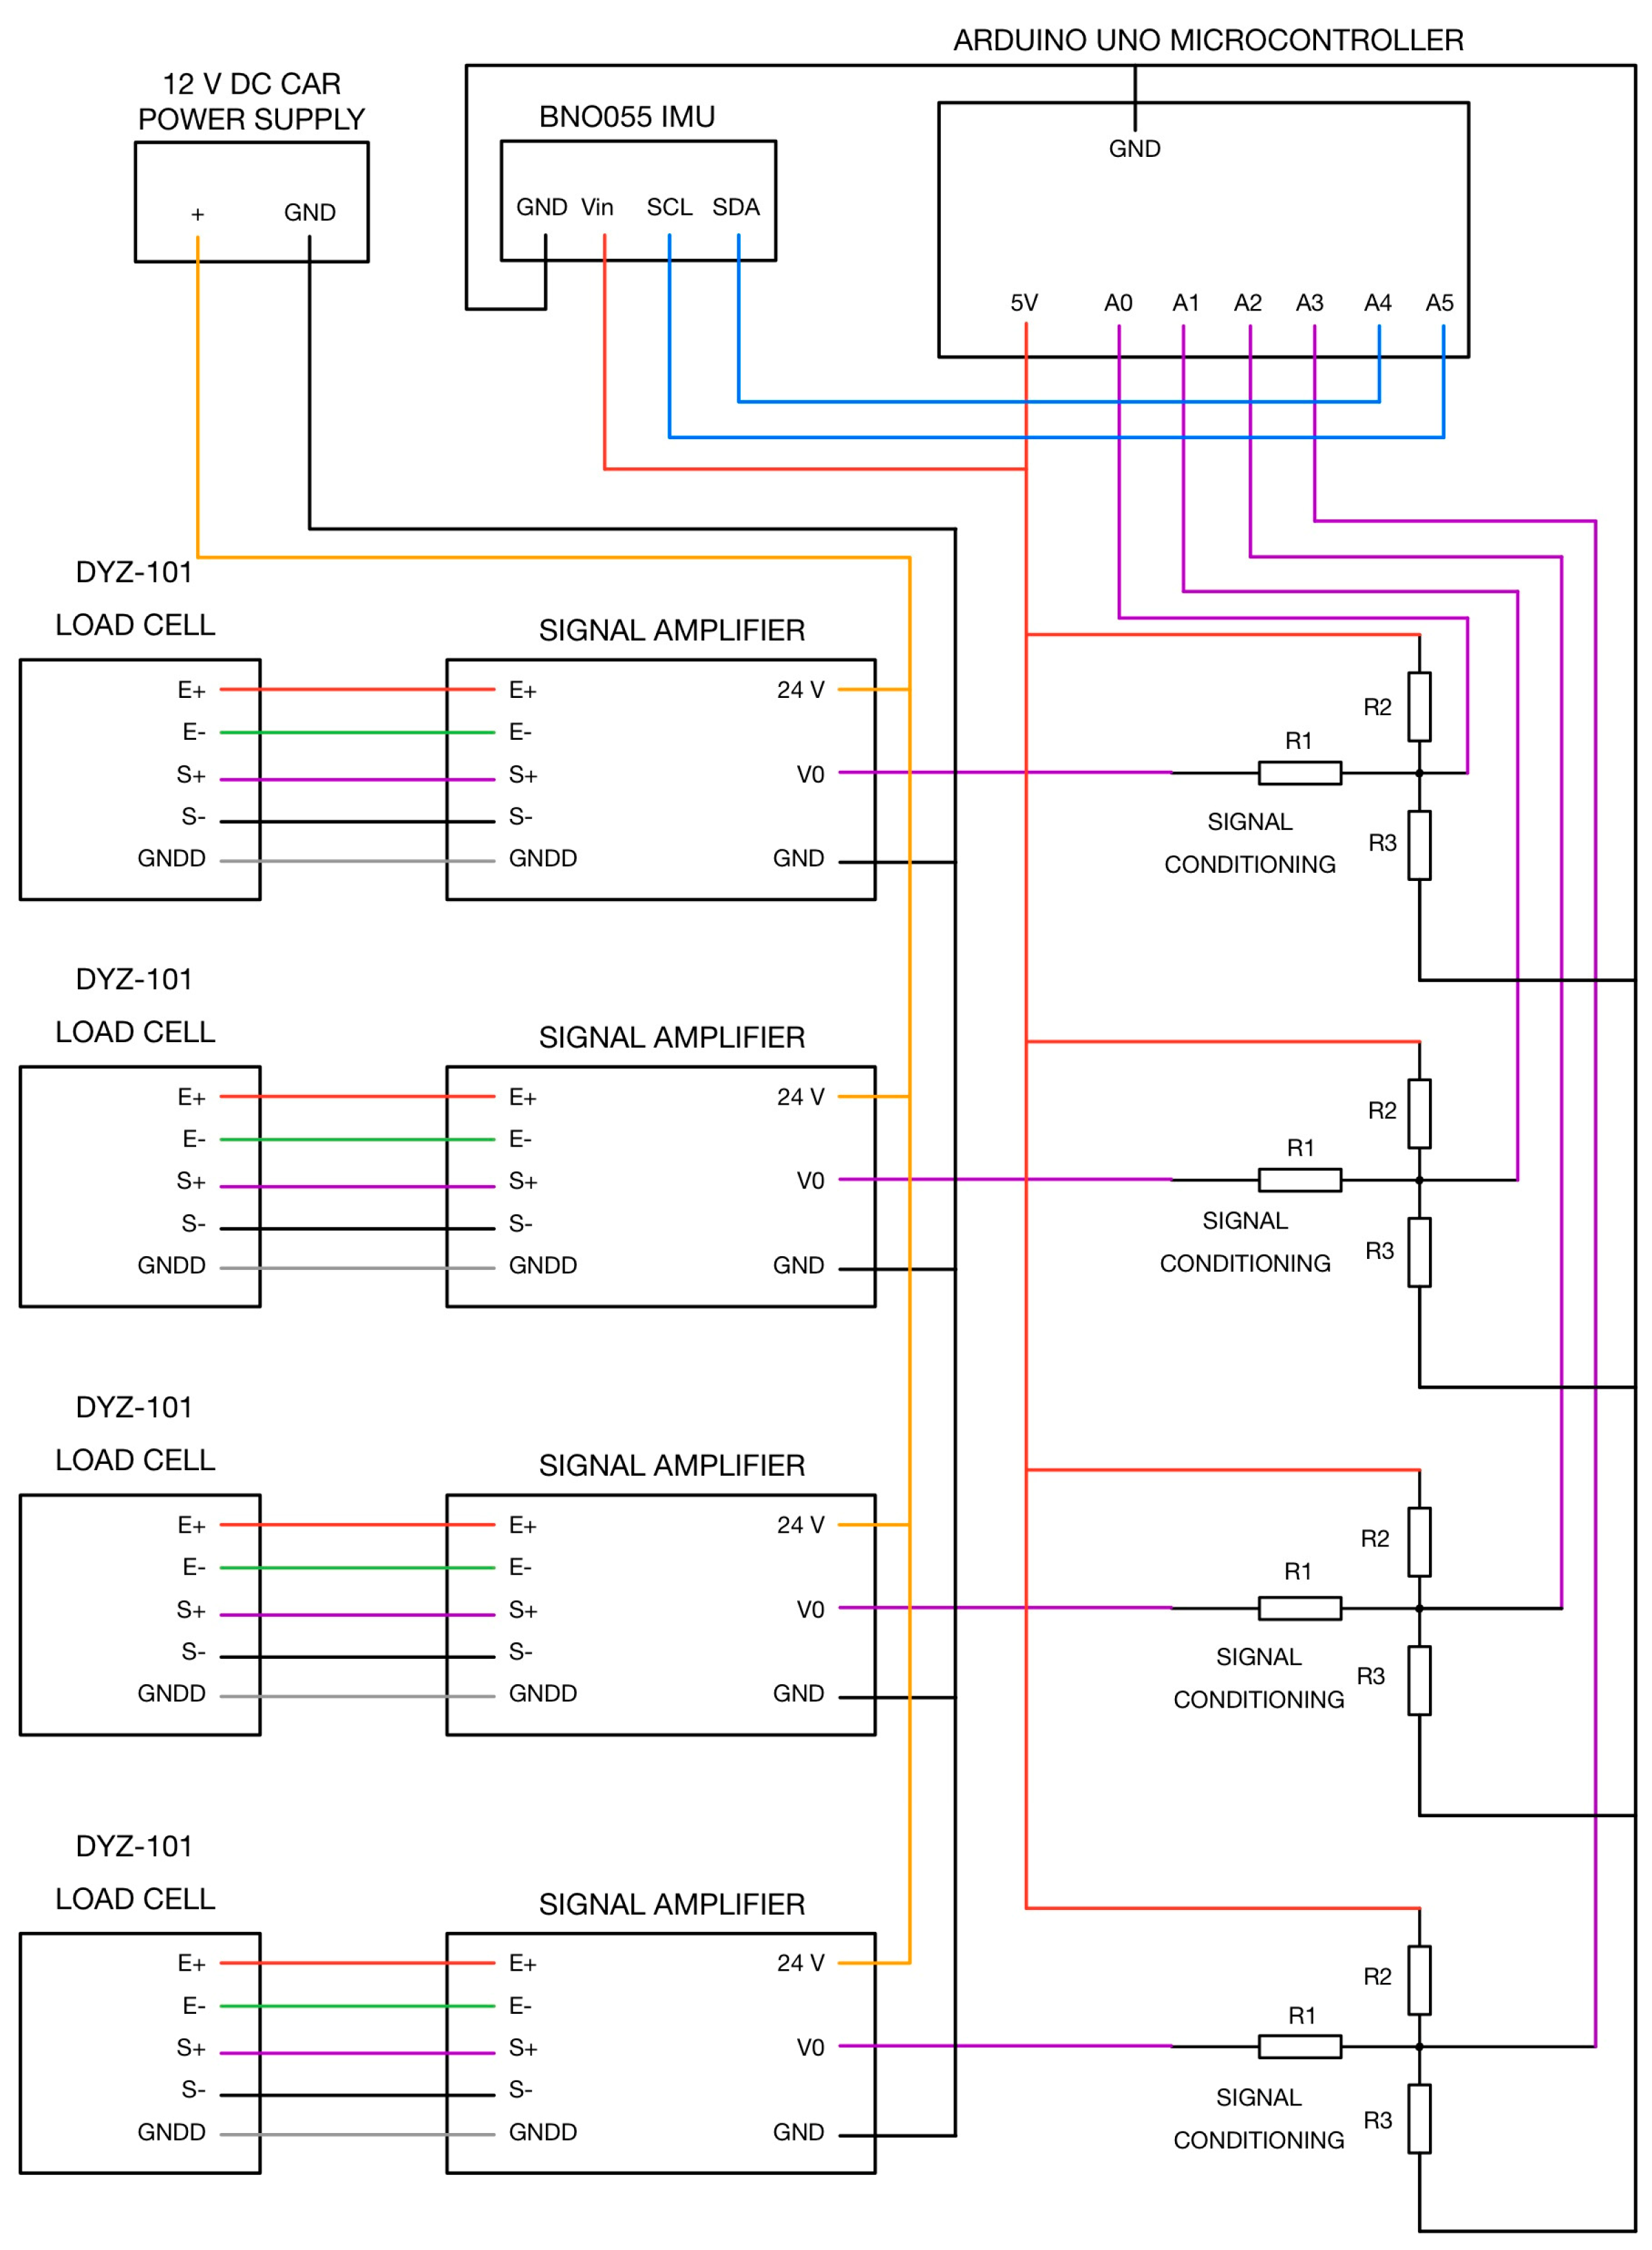
2. Sensor Interface Between Seat and Car Body

The latest prototype integrated load cells into the four supports of a commercial seat in order to not compromise ergonomics and safety [37]. A further step forward has been made with the new sensor device, which consists of a standard interface to be positioned between the car chassis and the slides of a commercial seat. The interface is sized to fit within the passenger compartment. An analysis of the seat structure mechanisms available on the market shows that fore-aft translation is consistently achieved using a sliding rail system. Vertical adjustment is usually managed through a four-bar linkage mechanism, which operates independently from the fore-aft one. The rails are configured to slide parallel to the floor, as investigated in both past surveys and recent studies on the structural optimization and safety of seat structures [38,39,40]. Seat homologation must comply with stringent safety standards related to its mounting on the chassis [41,42]. Regardless of the configuration, the seat is an auxiliary component secured to the chassis with four bolts following a kinematic mating scheme [43]. The system has been tested on three cars, namely, an Audi A3 Sportback, a Citroen C5 Crossair, and a Peugeot 308 SW, both on the driver and front passenger sides, with complete interchangeability. Adapting it to other seats will eventually require simply modifying the positioning of the holes for the assembly screws. The fastening mechanism completely reuses the holes already provided on the slides and chassis and the original screws. The prototype was manufactured using turning and laser cutting. Four turned cups serve as support for the load cells and are completely reusable. Laser cutting especially guarantees the fast adaptation of the interface to any car and seat models by simply modifying the dimensions in the parametric CAD model and exporting the *.dxf file to the machine. To the best of our knowledge, a few luxury sports cars may require a different interface configuration; however, they represent only a small portion of the overall market. The proposed interface, with potential parameter adjustments in the CAD model, is compatible with all seats featuring a sliding rail system parallel to the floor, which constitutes the majority of vehicles.
The electronics are positioned under the seat. 12 V and 5 V power supply are used. Sensor data are transmitted via a serial USB port to a laptop that runs the control logic. The sampling speed is about 50 Hz.
The overall cost was lower than EUR 1000.

2.1. Layout of the Sensor Interface

The interface of the sensor is composed of two plates for each slide, as shown in the complete assembly in Figure 1a. Each pair of base and top plates houses two load cells. The concept for matching the parts is shown in the right section in Figure 1b, where the load cells are fastened into dedicated cups using four M4 screws each. The bottom plates are fastened to the chassis with M10 screw stems, shown in red, and central nuts, shown in blue. The original seat slides are fixed onto the top plates by means of additional M10 screws and nuts, both shown in green. This system exactly replicates the force path of the previous prototype [37], while providing an additional safety feature. Specifically, the heads of the red M10 screws, matching the diameter and resistance of those approved for the original seat, do not come into contact with the slides due to a 1 mm clearance above and below, ensuring the entire load passes correctly through the load cells. In addition, these screws hold the seat firmly in the event of plate or load cell failure during a crash. Dividing the interface into two pairs of plates offers several advantages: a reduced weight of only 3 kg; ease of construction using standard laser-cut plates for both sides; compatibility with any transverse distance between the slides; easy accommodation of different longitudinal distances between the mounting screws via the slots in the plates. The dimensions of the components were determined through FEM simulations, according to the criteria already reported in [37]. The assembled system is shown in Figure 1c.

2.2. Control, Calibration, and Signal Processing

The electronic components and wiring are shown in Figure 2, including the four DYZ-101–500 kg load cells with dedicated signal amplifiers, the Arduino UNO microcontroller, and the BNO055 IMU. The use of the Arduino platform is easy and practical for reproduction and quick testing for interfacing sensors. The use of a laptop to capture, store, and process the raw data is optimal for the evaluation and demonstration of the developed methodology.
This section presents the improvements introduced in the new prototype. The main limitations identified are as follows:
  • The ATMega328P processor of the Arduino Uno, with a clock speed of 16 MHz, 32 KB of flash memory, and 2 KB of SRAM, lacks sufficient computing power; while it supports a high sampling rate, it is inadequate for processing complex data and storing it in memory;
  • Direct data transmission to Microsoft Excel is time-consuming due to the complexity of the data structure, including formatting in rows, columns, and colors; experimental tests estimated that writing a single string of values takes approximately 30 ms;
  • The single-core ATMega328P processor only allows for the sequential execution of functions, meaning the data must be read, processed, formatted, and then sent to the Excel data logger.
Automotive and manufacturing applications typically use microcontrollers with higher processing speed and power, whereas Arduino controllers and PC software very facilitate rapid prototyping and evaluation for research. Nevertheless, to improve its effectiveness, the code in the current interface prototype separates data reading from processing:
  • Data reading is carried out through Arduino UNO with a program written in the Arduino IDE;
  • Data processing and more complex tasks, such as data storage, are managed using an HP G7 laptop with a multicore processor Intel Core i7 and a Python 3.13.0 program that utilizes a parallel programming model. The data are stored in a simpler format, such as *.csv. The Python program runs multiple threads, which are synchronized using a priority system of Lock and Flag semaphores. The implemented threads include the following:
    • Main data processing: Responsible for acquiring, processing, and formatting the read data;
    • Graphical interface: provides real-time visualization of the CP position and the detection of any OP postures;
    • Self-calibration thread: enables the system to recalibrate itself after a set time interval;
    • Data save thread: ensures periodic data storage during acquisition.

2.2.1. Data Reading Thread

This program is designed to read four output values from the load cell amplifiers and three acceleration values from the IMU. The full code is provided in Appendix A. The sampling rate is controlled using the millis() function, which ensures a more consistent separation between readings and is better suited for data acquisition. Divided between void setup and void loop, the key operations of the program include the following:
  • Initializing the inertial platform (lines 1–5 and 20–30);
  • Initializing variables for the amplifier outputs (lines 7–11);
  • Setting the serial communication speed (line 18);
  • Defining the sampling interval of 20 milliseconds (lines 13–15 and 33–36).
Float variables are then created to store amplified voltages and acceleration values, which are formatted into a string using the serial.print() function. Finally, the data string is transmitted to the PC via the serial port, in alphanumerical format.

2.2.2. Data Processing Thread

The data string is processed by the program developed in Python code provided in Appendix B. The following libraries are used: “serial”, for serial communication between ports; “time”, to define all temporal operations; “csv”, necessary for the subsequent saving of data within a CSV file; “threading”, which allows for parallel programming of the processes; “key-board”, useful for activating the monitoring of actions performed on the keyboard; “deque”, for generating data lists used for calibration processes; “tkinter”, for creating graphical interfaces.
The main process includes the code for synchronization with Arduino and for data decoding, processing, and formatting. The serial.Serial() function enables serial communication by synchronizing the serial port (COM), data transmission rate, and sampling interval with the “Port”, “baudrate” and “timeout” parameters. The time.perf_counter() function will then determine the time reference point.
The main loop consists of an infinitely executed “while” loop. The time.time() function obtains a time value formatted in hours, minutes, and seconds through time.strftime() (lines 17–22). The data are read and decoded according to the 8-bit Unicode scheme (utf-8), compatible with the ASCII format used by Arduino’s serial.print(), using serial_com.readline().decode(‘utf-8’).strip() (line 25). The data are then passed into a first “if” loop to format them, and then into a second “if” loop to check and assign the header byte as the values of the “ampVal” and “acc” variables (lines 27–37).
Once the amplifier and accelerometer signals are decoded and assigned, the control logic calculates the positions and accelerations. The voltages, in the range of 0/1023, are converted into load values, in the range of −500/+500 kg, by scaling and shifting them around the zero position. Then, the masses on the front and rear load cells, along with the total mass, are used to calculate the projection of the occupant’s CP on the CPX-CPY plane. The accelerations are scaled to match the amplitudes of the CP shifts. In the next “if” cycle, the CP position is compared with the acceleration A (lines 51–59). Here, a tolerance constant is necessary to compensate for errors due to noise in the load cell signals or minor OPs. Finally, the time counter is updated in each cycle.
The remaining functions can be considered system functions for updating the calibration variables, communicating messages to the Graphical User Interface (GUI), buffering data for saving into a file, and debugging.

2.2.3. Calibration Thread

Appendix C details the calibration thread, which enables the system to self-calibrate under both static and dynamic conditions. Running in parallel with the other threads, it facilitates resetting the CP, scaling acceleration, and performing manual recalibration if automatic calibration fails. The calibration process begins with the declaration of variables (lines 2–8), followed by the deque function (lines 11–21), which defines queues storing recent values of the CP and acceleration along the x and y axes. This function, by updating the data at each iteration, is particularly useful, as it ensures the most recent values are always available for the necessary calculations.
At this stage, the functions reset_pressure_center() and scale() are defined. The reset_pressure_center() function calculates the shift variables by averaging the CPs in the CPX-CPY plane from the respective queues (lines 24–34). This averaging function filters out acceleration effects, driving noise, and sensor drift. The resulting shift variables are used to calibrate the average (CPX-CPY) position to (0,0), thereby compensating for the occupants’ varying seating adjustments. The scale() function determines the scale variables for acceleration based on dynamic data, updating the global variables accordingly. After the lists (deque) are populated and the absolute values are grouped, scale factors are calculated by comparing the differences between the maximum and minimum values in the queues related to the CP and acceleration (lines 37–53). In particular, the acceleration scale factors adjust the accelerations to closely match the CPs, effectively accounting for the occupant’s body size, which can influence the magnitude of CP shifts depending on height, as well as for the individual driving style, particularly in the case of transversal accelerations. Finally, the manual recalibration function is implemented, which can be run by pressing the ‘Z’ key on the keyboard. This function enables the driver to manually recalibrate the CP to (0,0) position if the automatic calibration during the initial acquisition phase was not successful (lines 57–65). This feature could be easily integrated into the cockpit with an acknowledgment button, to make the recalibration process more intuitive and easily accessible for the occupant.

2.2.4. Graphical User Interface Thread

This program is designed to create a graphical interface for the real-time interactive evaluation of the CP position, including an alarm that activates when the occupant assumes an OP condition. The complete code is available in Appendix D. Initially, the variables to be displayed are defined (lines 2–4). The main function, run_GUI() manages the graphical interface in real time. Within this function, two sub-functions run concurrently. The sub-function update_GUI() updates and displays the CP coordinates in the interface. The values are formatted to two decimal places and inserted into the labels via value1 and value2. A lock mechanism ensures synchronized data usage across the threads (lines 7–13). The sub-function update_alarm() adjusts the graphical alarm based on the Pos value. If Pos is 0, the light remains green, indicating a correct position. If Pos is nonzero, the light turns red, warning an OP state (lines 15–24).
The main window is created (lines 27–28), along with the specifications of its size. Within this window, a canvas is drawn to house the light indicator, enclosed by a black circular outline (lines 31–33). The labels for displaying the CPX and CPY values are initialized using the tk.Label() and tk.StringVar() variables, with their sizes and fonts specified. Additionally, a label is included to show the current status of the light (lines 35–42).
Next, the two functions are invoked to initiate the interface update process and executed at regular time steps using window.after(). update_CP() every 100 ms, in order to read the values without excessive signal fluctuations, while update_alarm() run every 20 ms, to ensure a responsive alarm system, as fast as the sensor system (lines 44–48). The main loop then begins, running continuously until the application is terminated (line 51). Finally, the complete thread is launched (lines 53–54). Once the thread is started, the system will activate or deactivate the warning.

2.2.5. Data Save Thread

This thread implements a method for saving data to a *.csv file, as reported in Appendix E. It utilizes a buffer to accumulate a series of values, which are periodically saved once the buffer reaches a predefined size. The list is first initialized through the data_buffered variable, with its maximum capacity set using list_size. The fill_buffer flag is introduced to manage the saving cycle, ensuring termination when the program is interrupted. As in the previous thread, the synchronization of actions and controlled entry into the buffer is handled using a Lock (lines 2–7).
Next, the CSV() function is developed, which runs in parallel with all the other processes whenever a save operation is required. The main “while” loop executes as long as the program remains active or there is still data in the buffer (lines 10–13). Access to the buffered data is controlled via save_lock, and if the buffer contains sufficient data, they are retrieved, stored in the save_list, and removed from the buffer to free storage space for new entries (lines 14–23). Once the save-list holds enough data, the CSV file is opened in “append” mode to write the data in sequential rows using the writer.writerows (lines 27–30). Similar to the previous thread, the process startup logic includes the use of threading.Thread() (lines 38–41).
Note that the buffer is set to hold 500 values and a minimum pause of 100 ms is forced between consecutive saves to reduce the frequency of execution for the previous process. This prevents the program from slowing down due to excessive simultaneous operations.

2.2.6. Data Conversion Code

After the data acquisition, the following code is used to convert the previously generated CSV file into an Excel file, as reported in Appendix E, making the data much easier to analyze. Similar to the data processing thread, the necessary libraries are imported, including Pandas, which is used for handling tabular data. The input and output file names are then specified, along with the headers for the columns where the values will be inserted (lines 4–8).
Since the CSV file contains lines of data separated by spaces and commas, it must be cleansed before being structured into tables. The line.strip() function removes leading and trailing spaces, while line.split(‘,’) separates values by eliminating commas. Additionally, data.append() removes any remaining spaces or quotes and ensures the time value is properly formatted, distinct from the other numerical values (lines 11–20).
The cleansed data are then converted into a DataFrame using pd.DataFrame(), with column headers assigned using data_frame.columns (lines 23–26). To ensure proper formatting, pd.to_numeric() converts each column into numeric values, excluding the first column (time), which remains as text (lines 29–30). Finally, the processed data are saved as an Excel file using data_frame.to_excel() (line 33). The entire loop is then inserted into a further “try-except” loop to facilitate the debugging of errors.

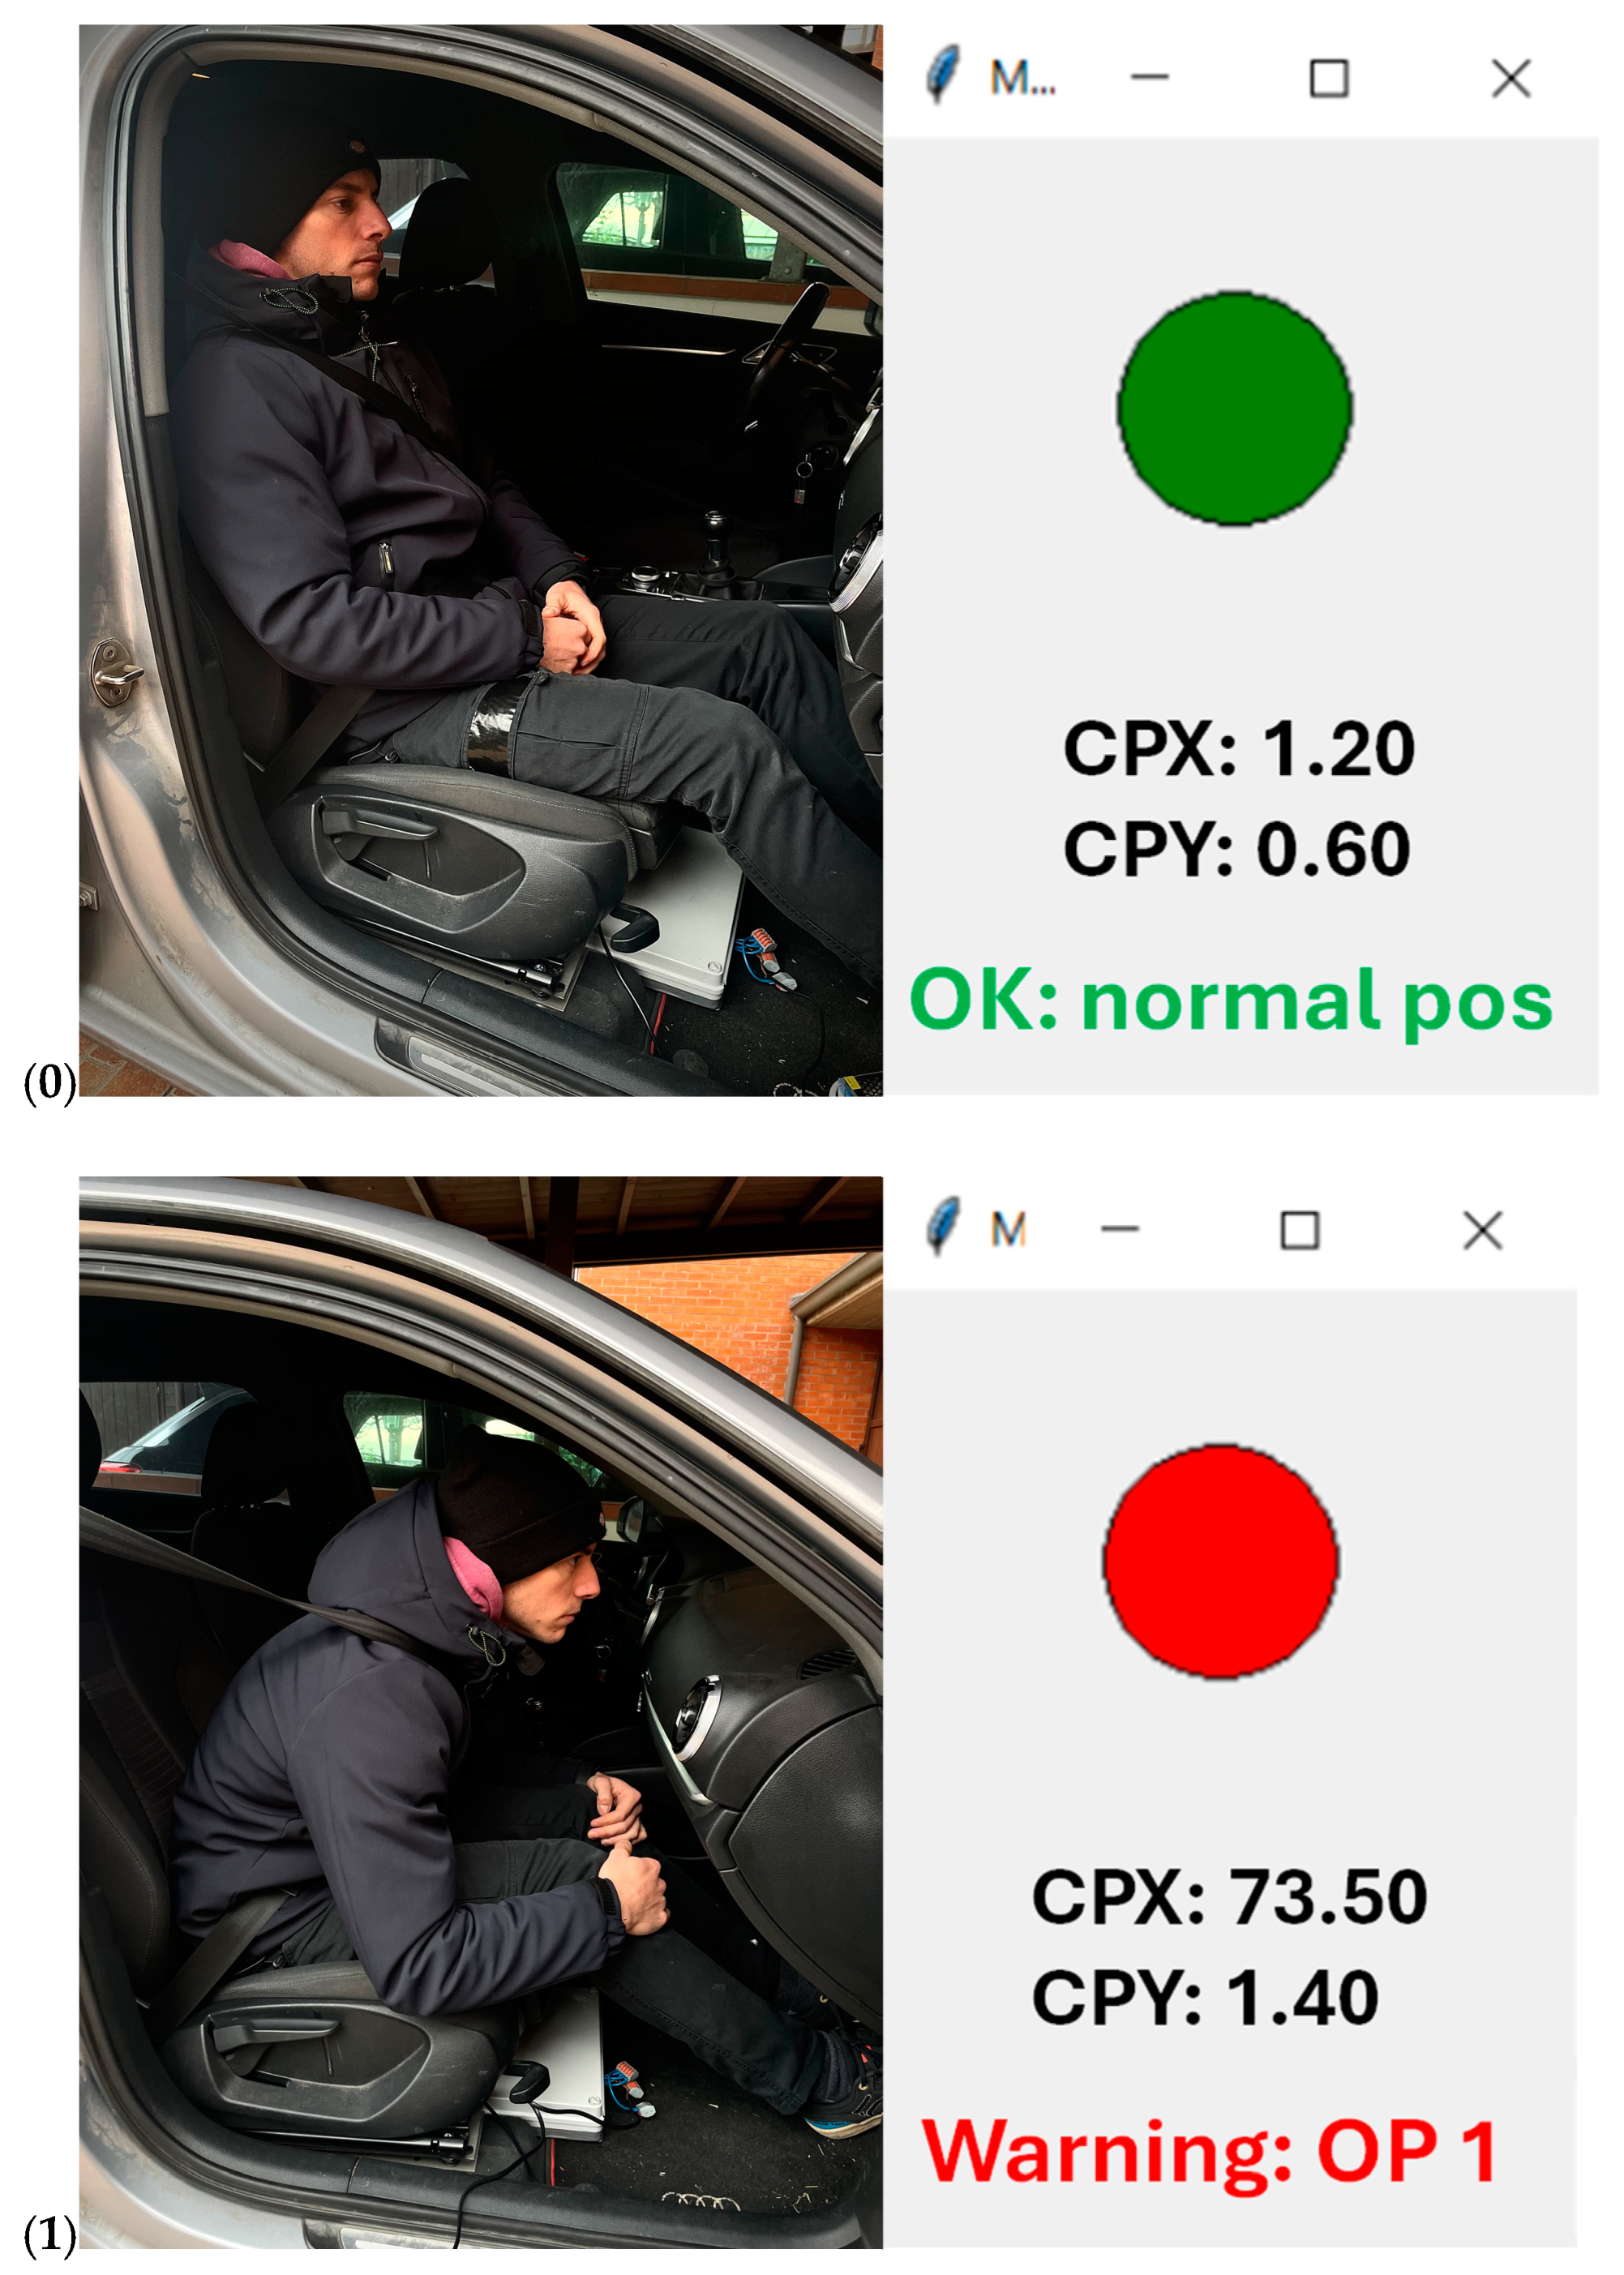
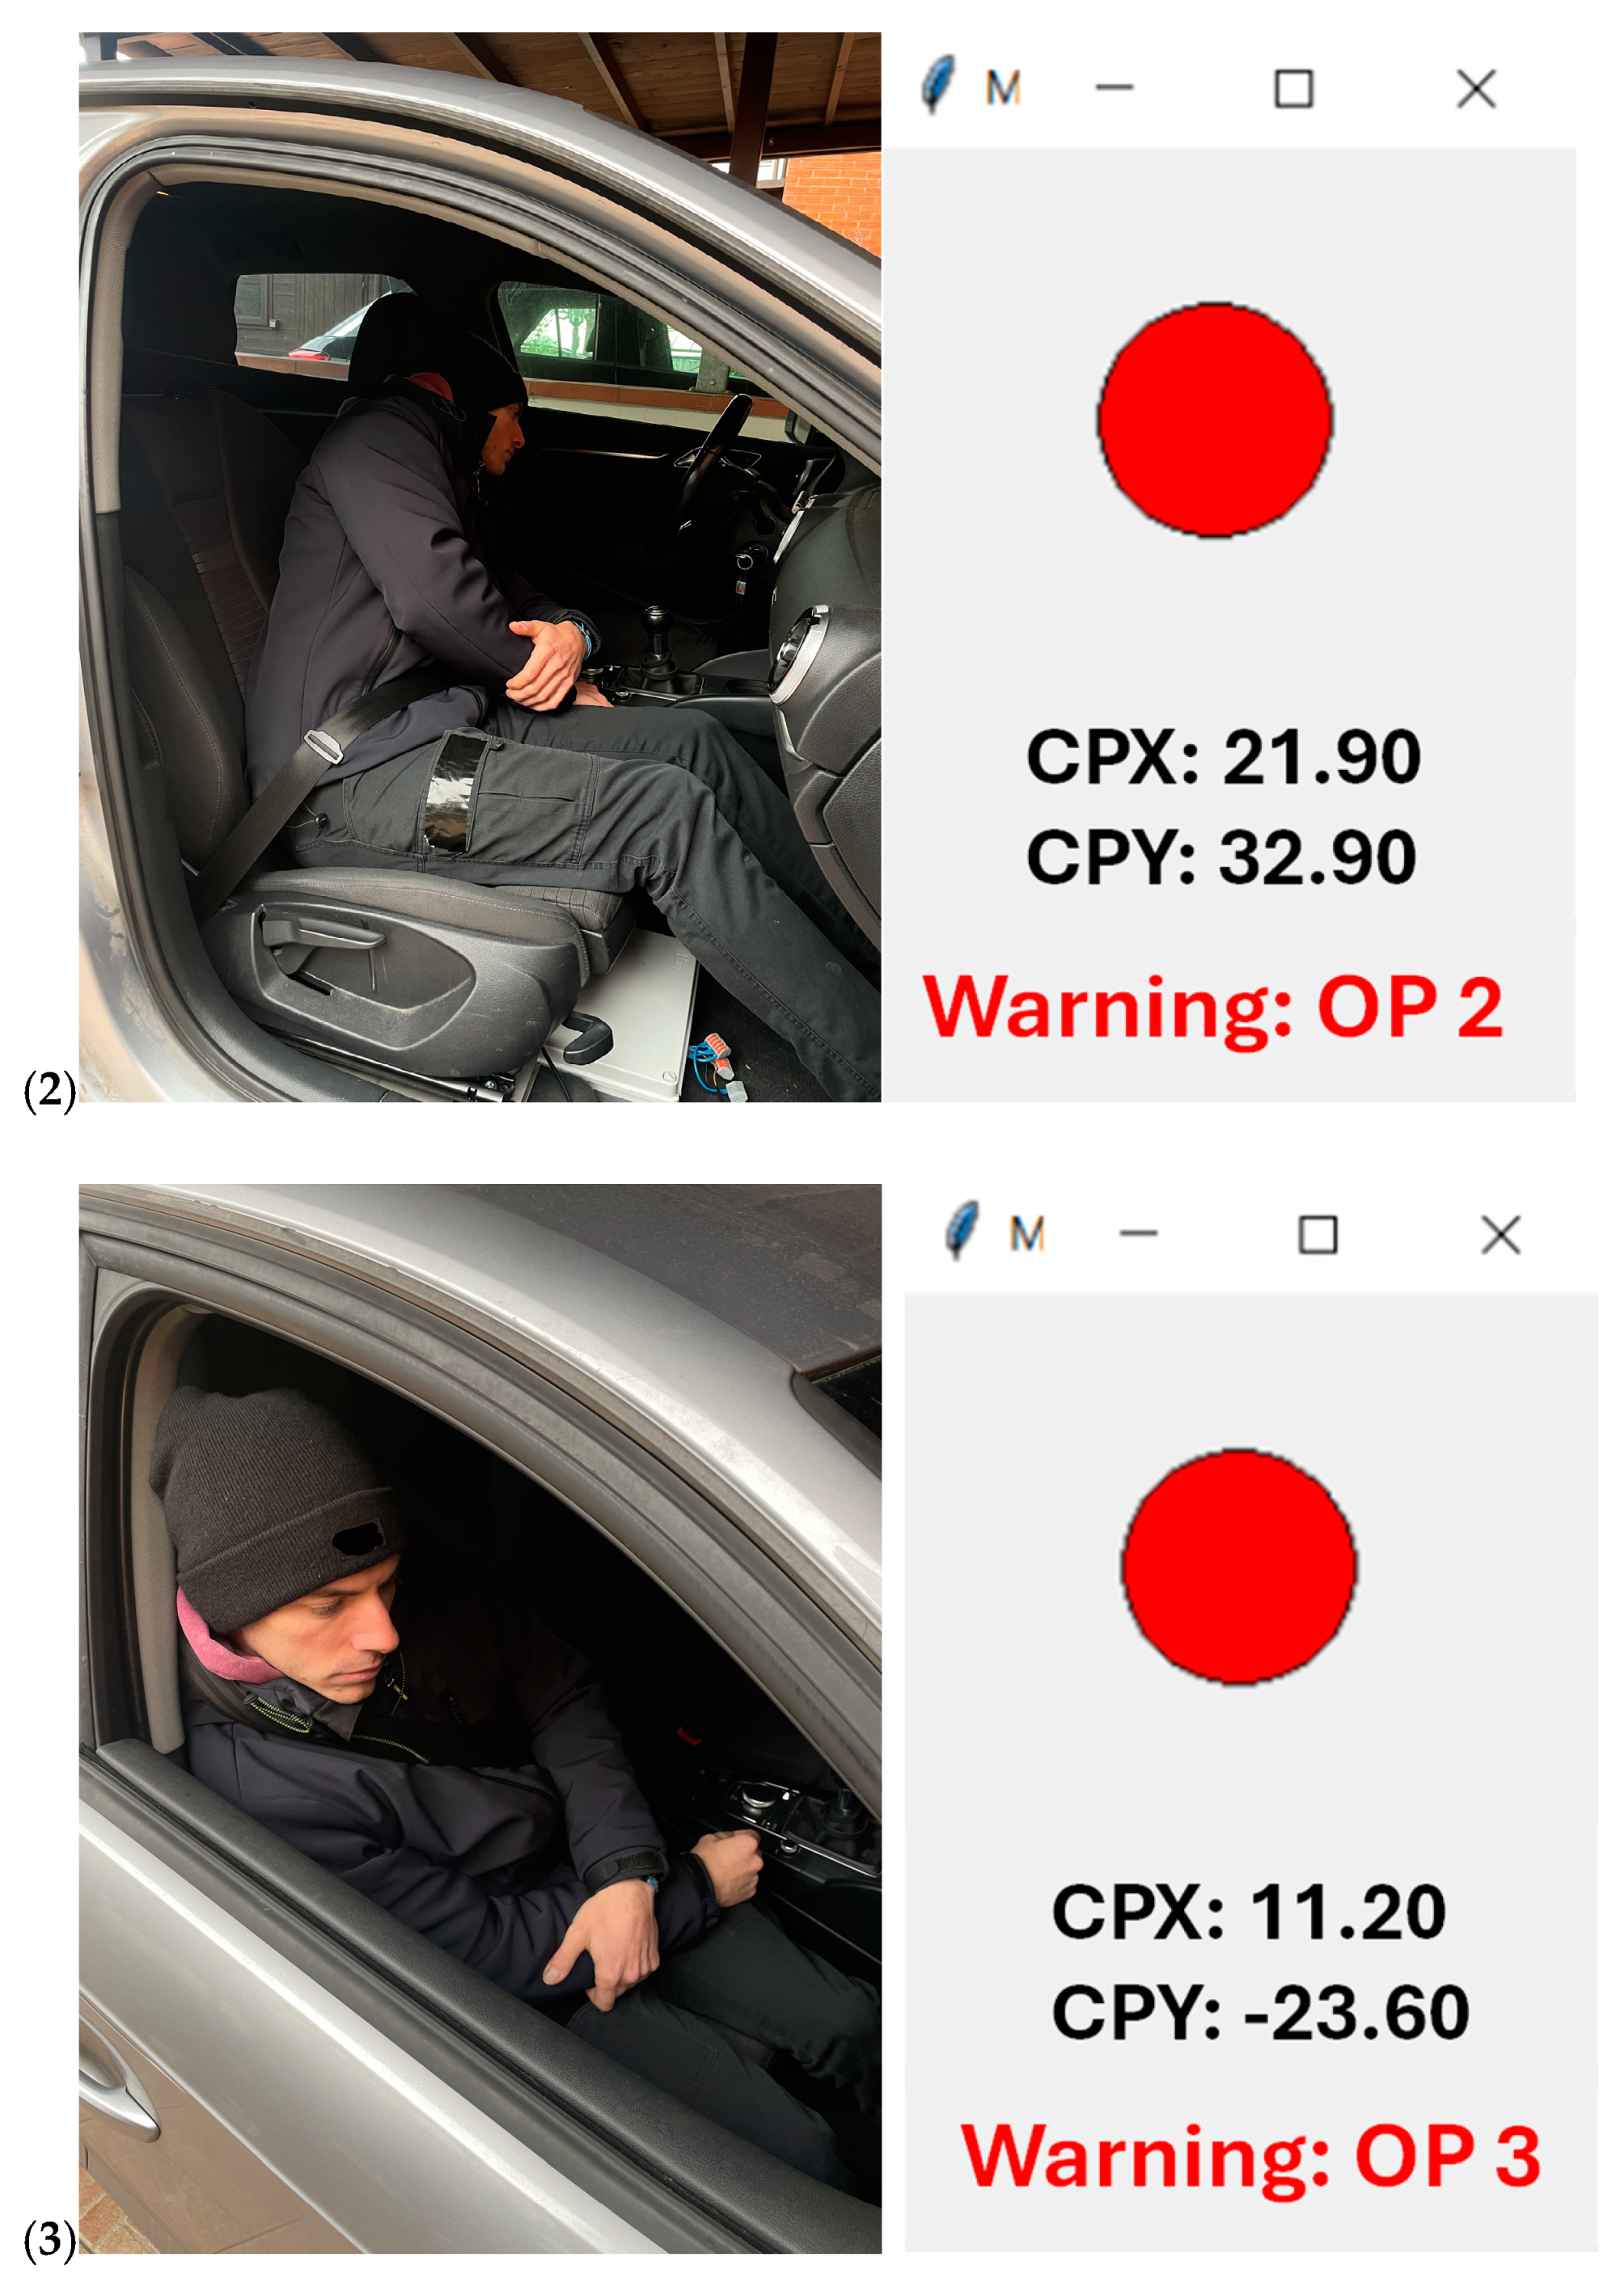
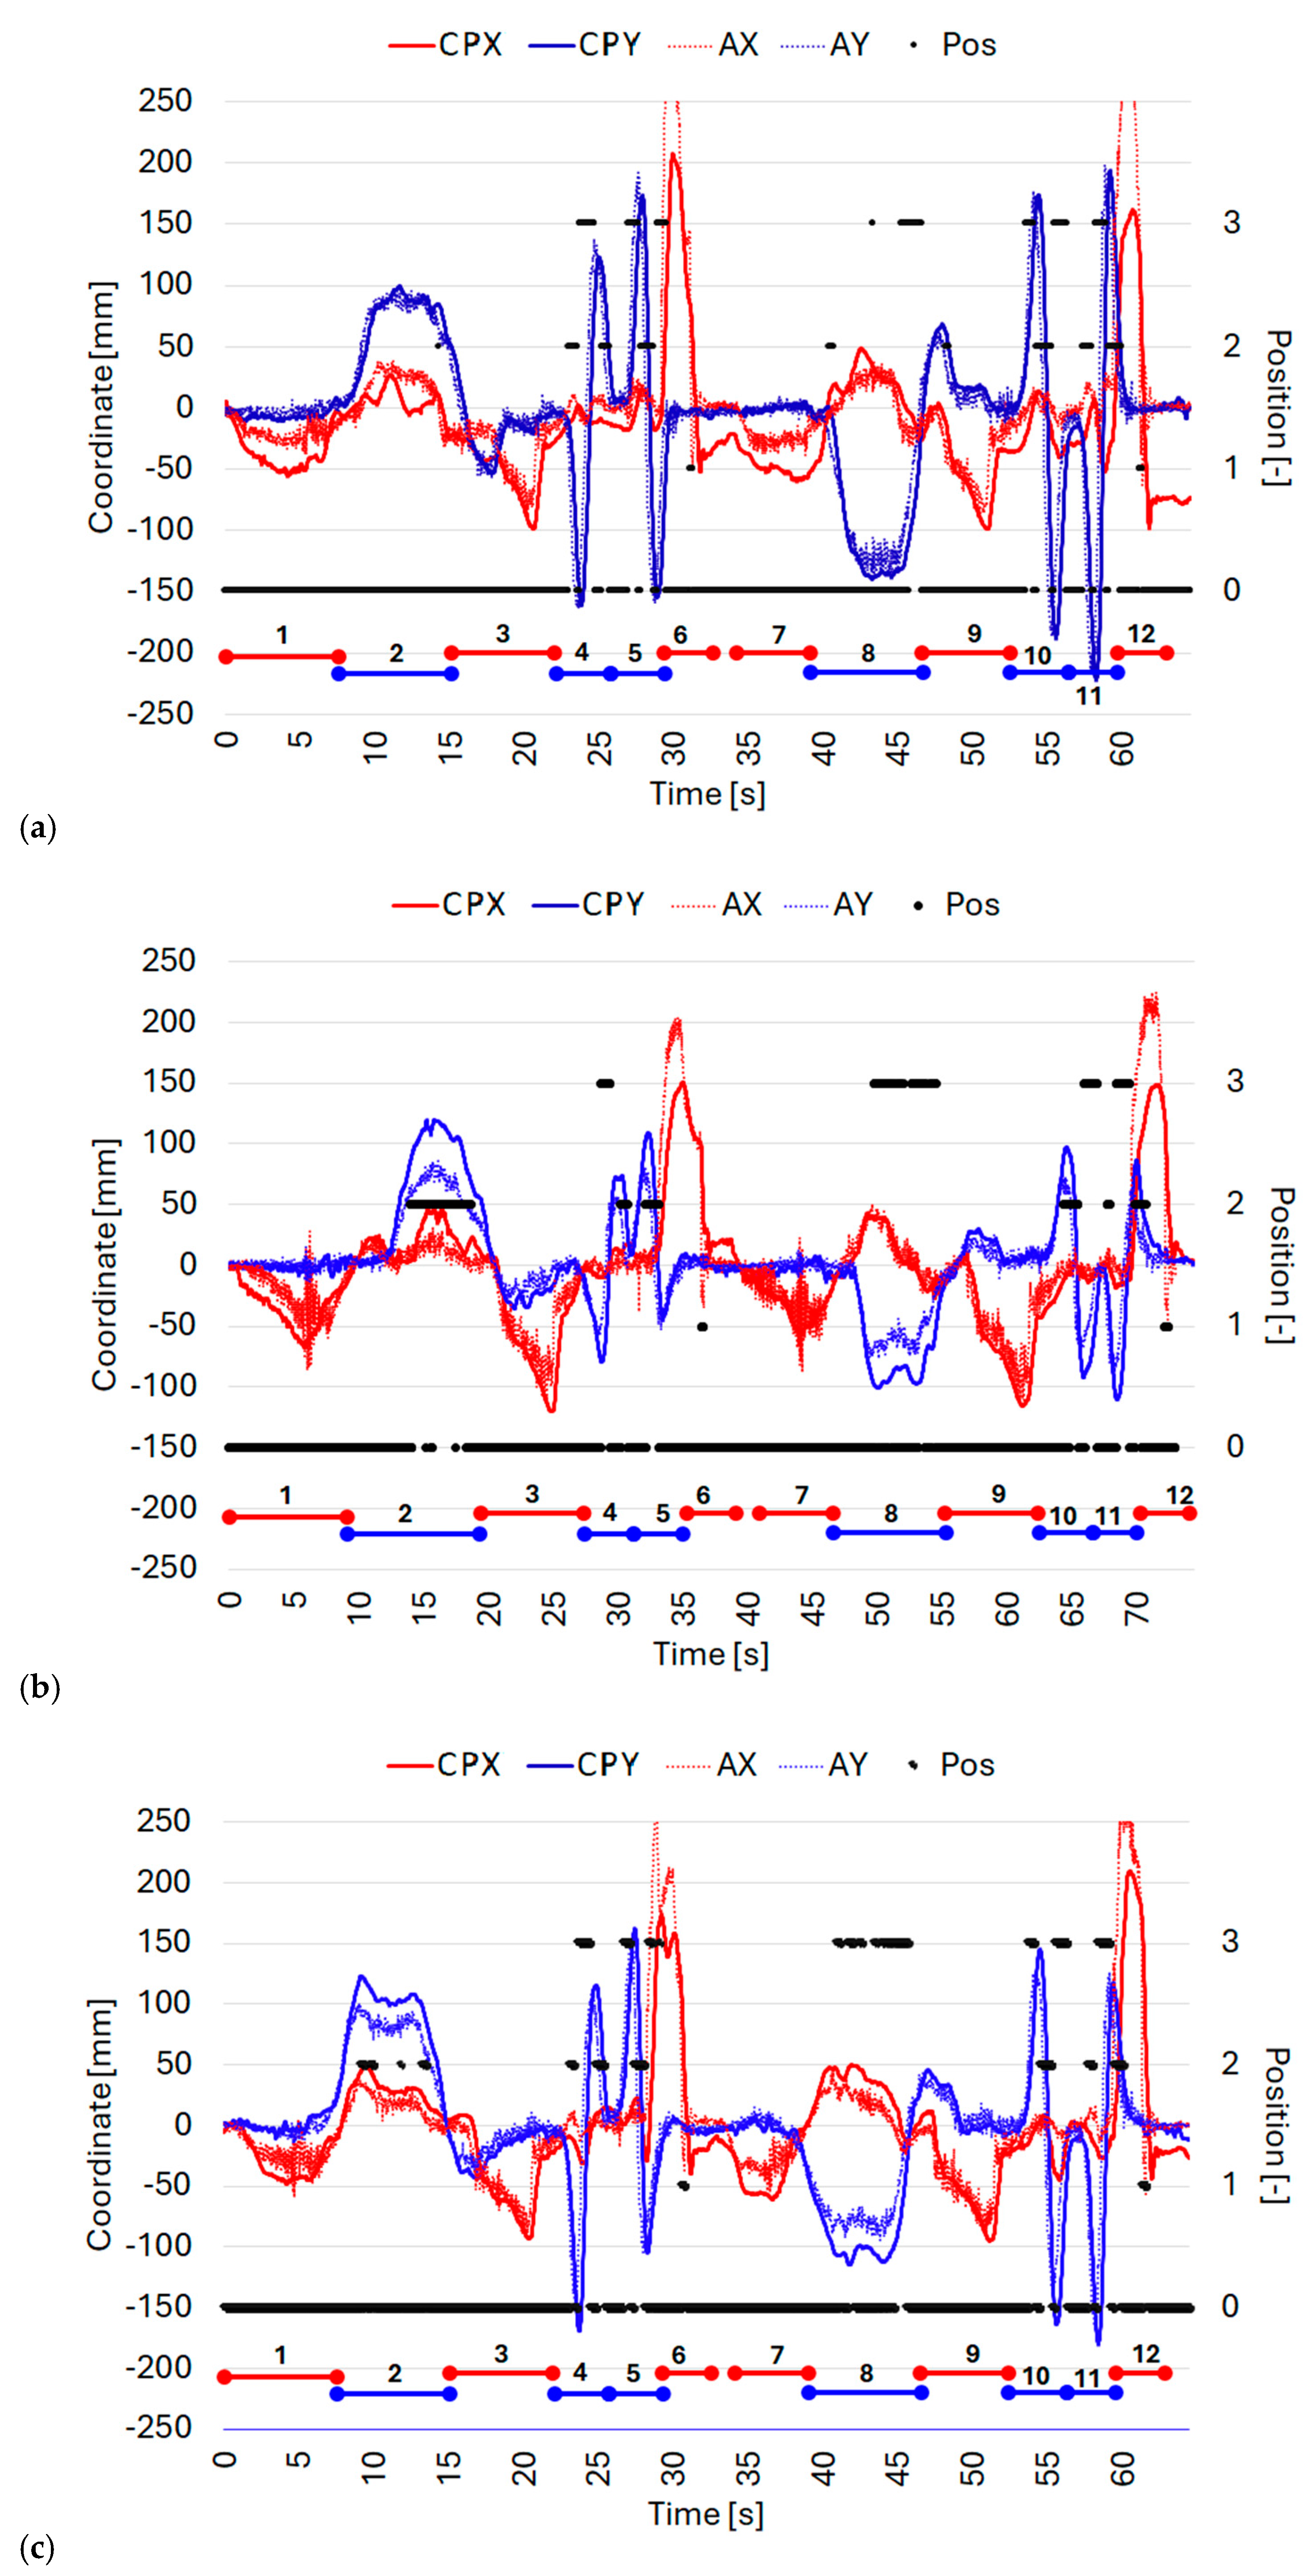
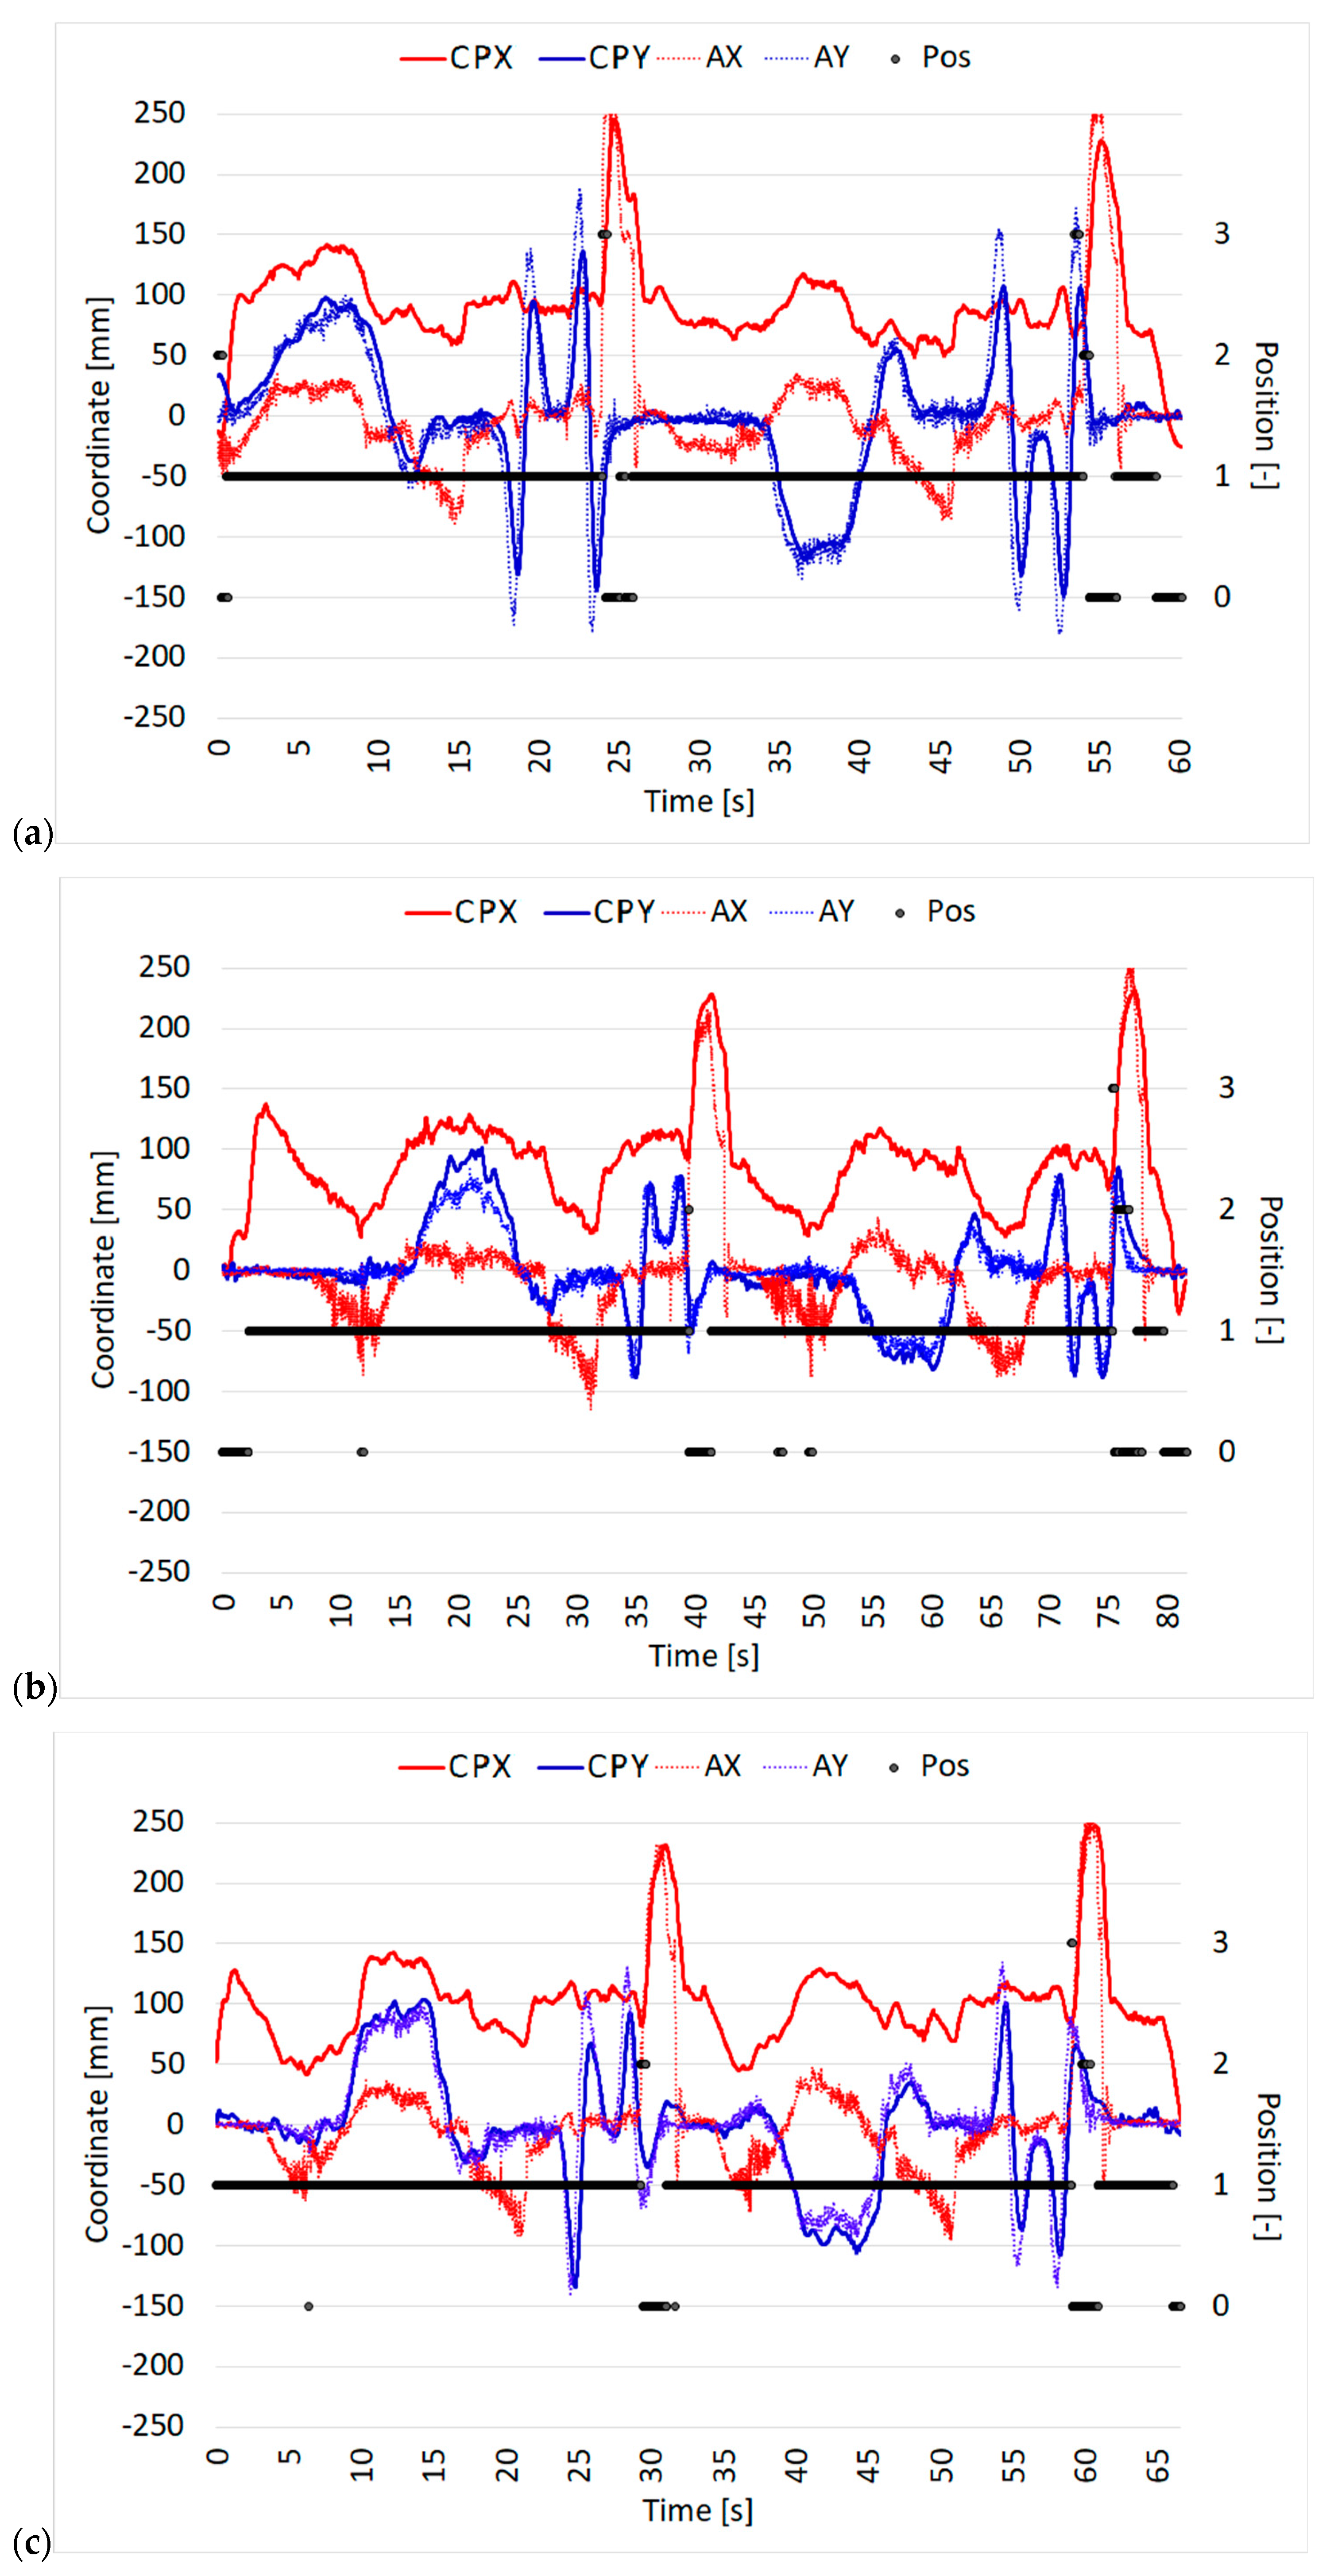
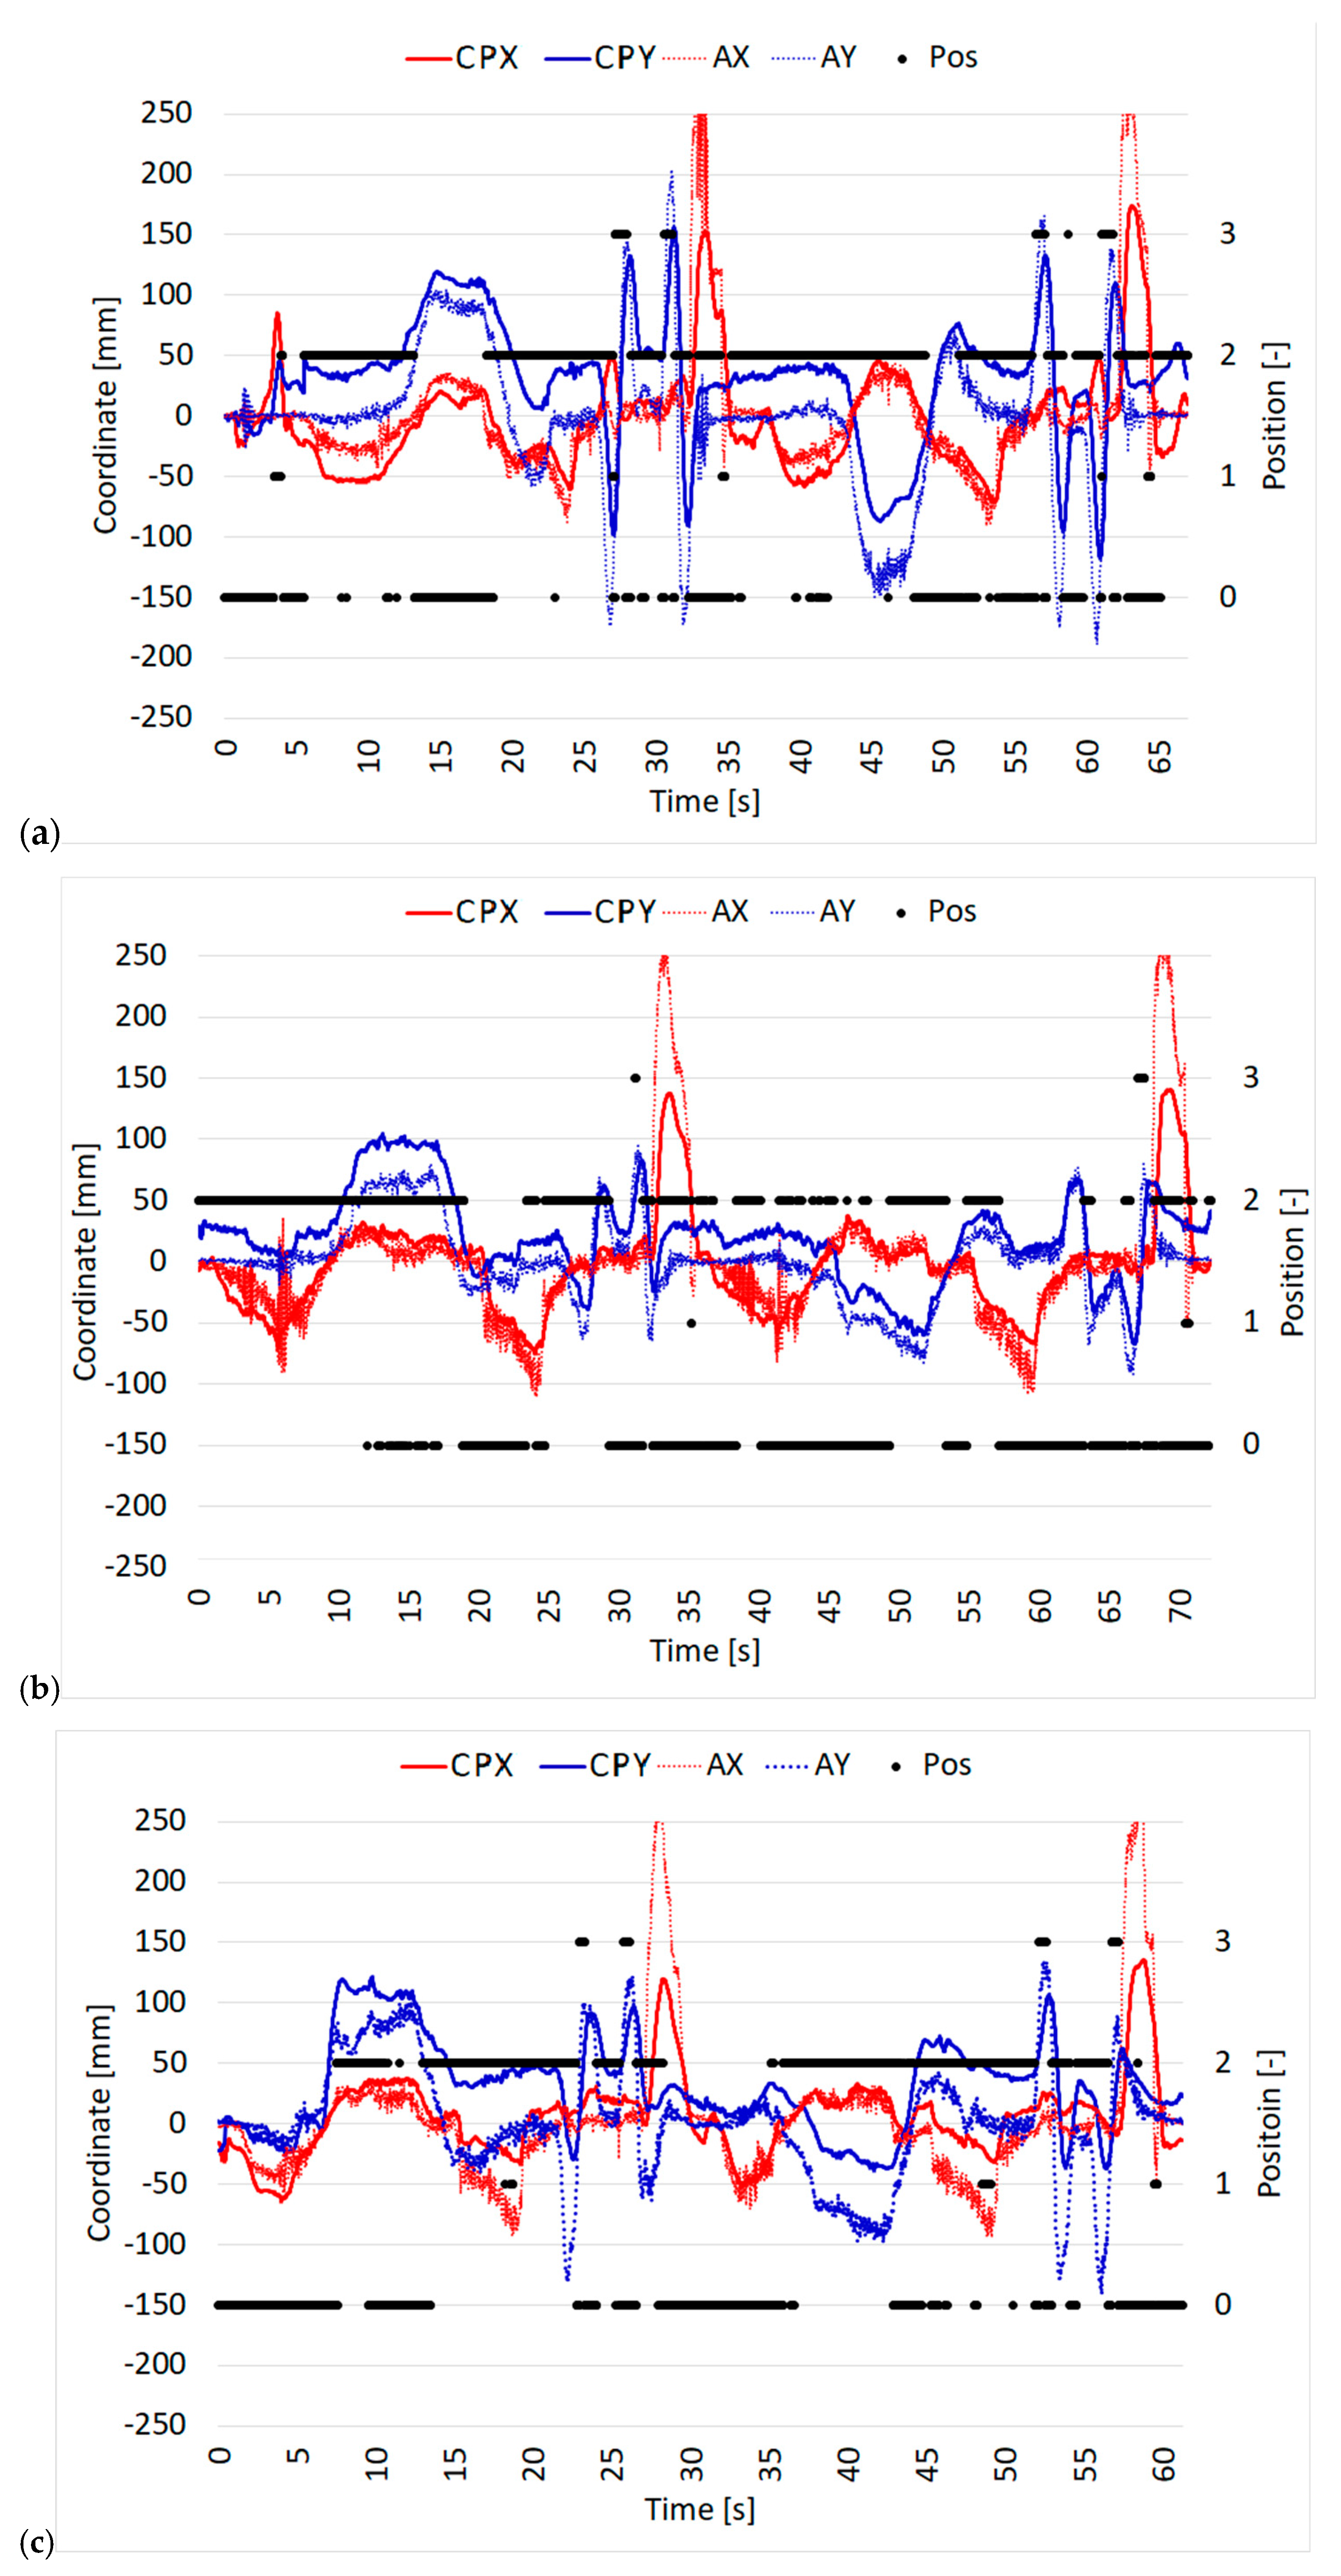
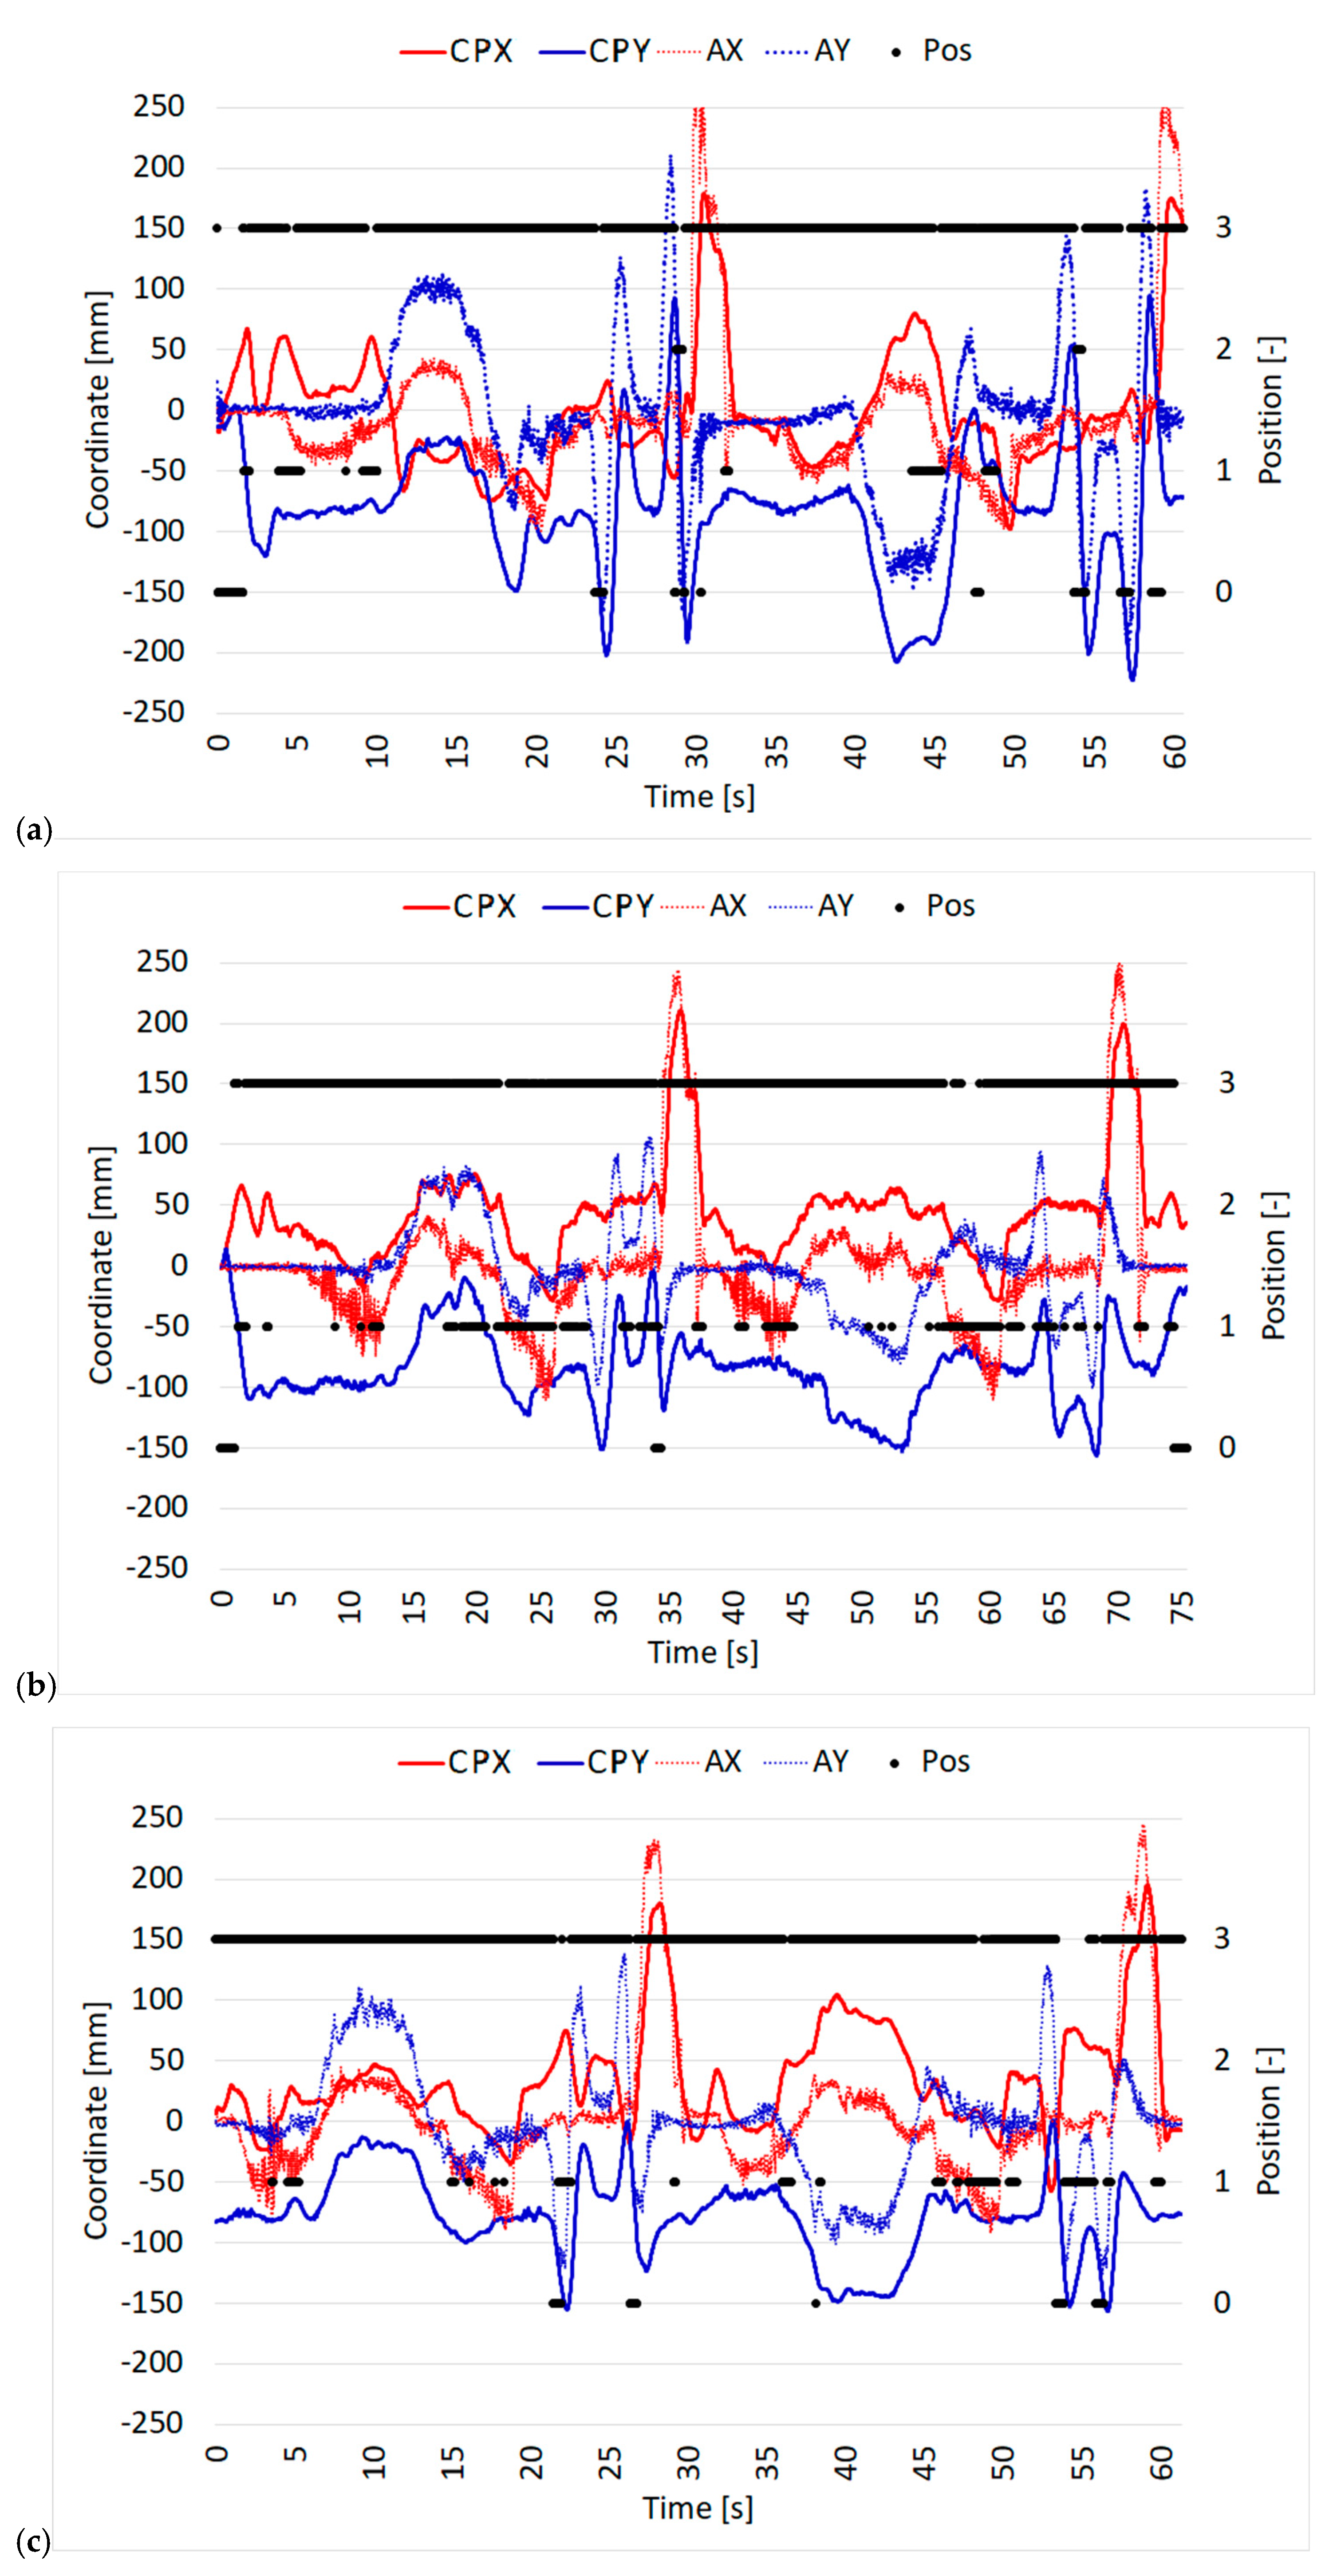
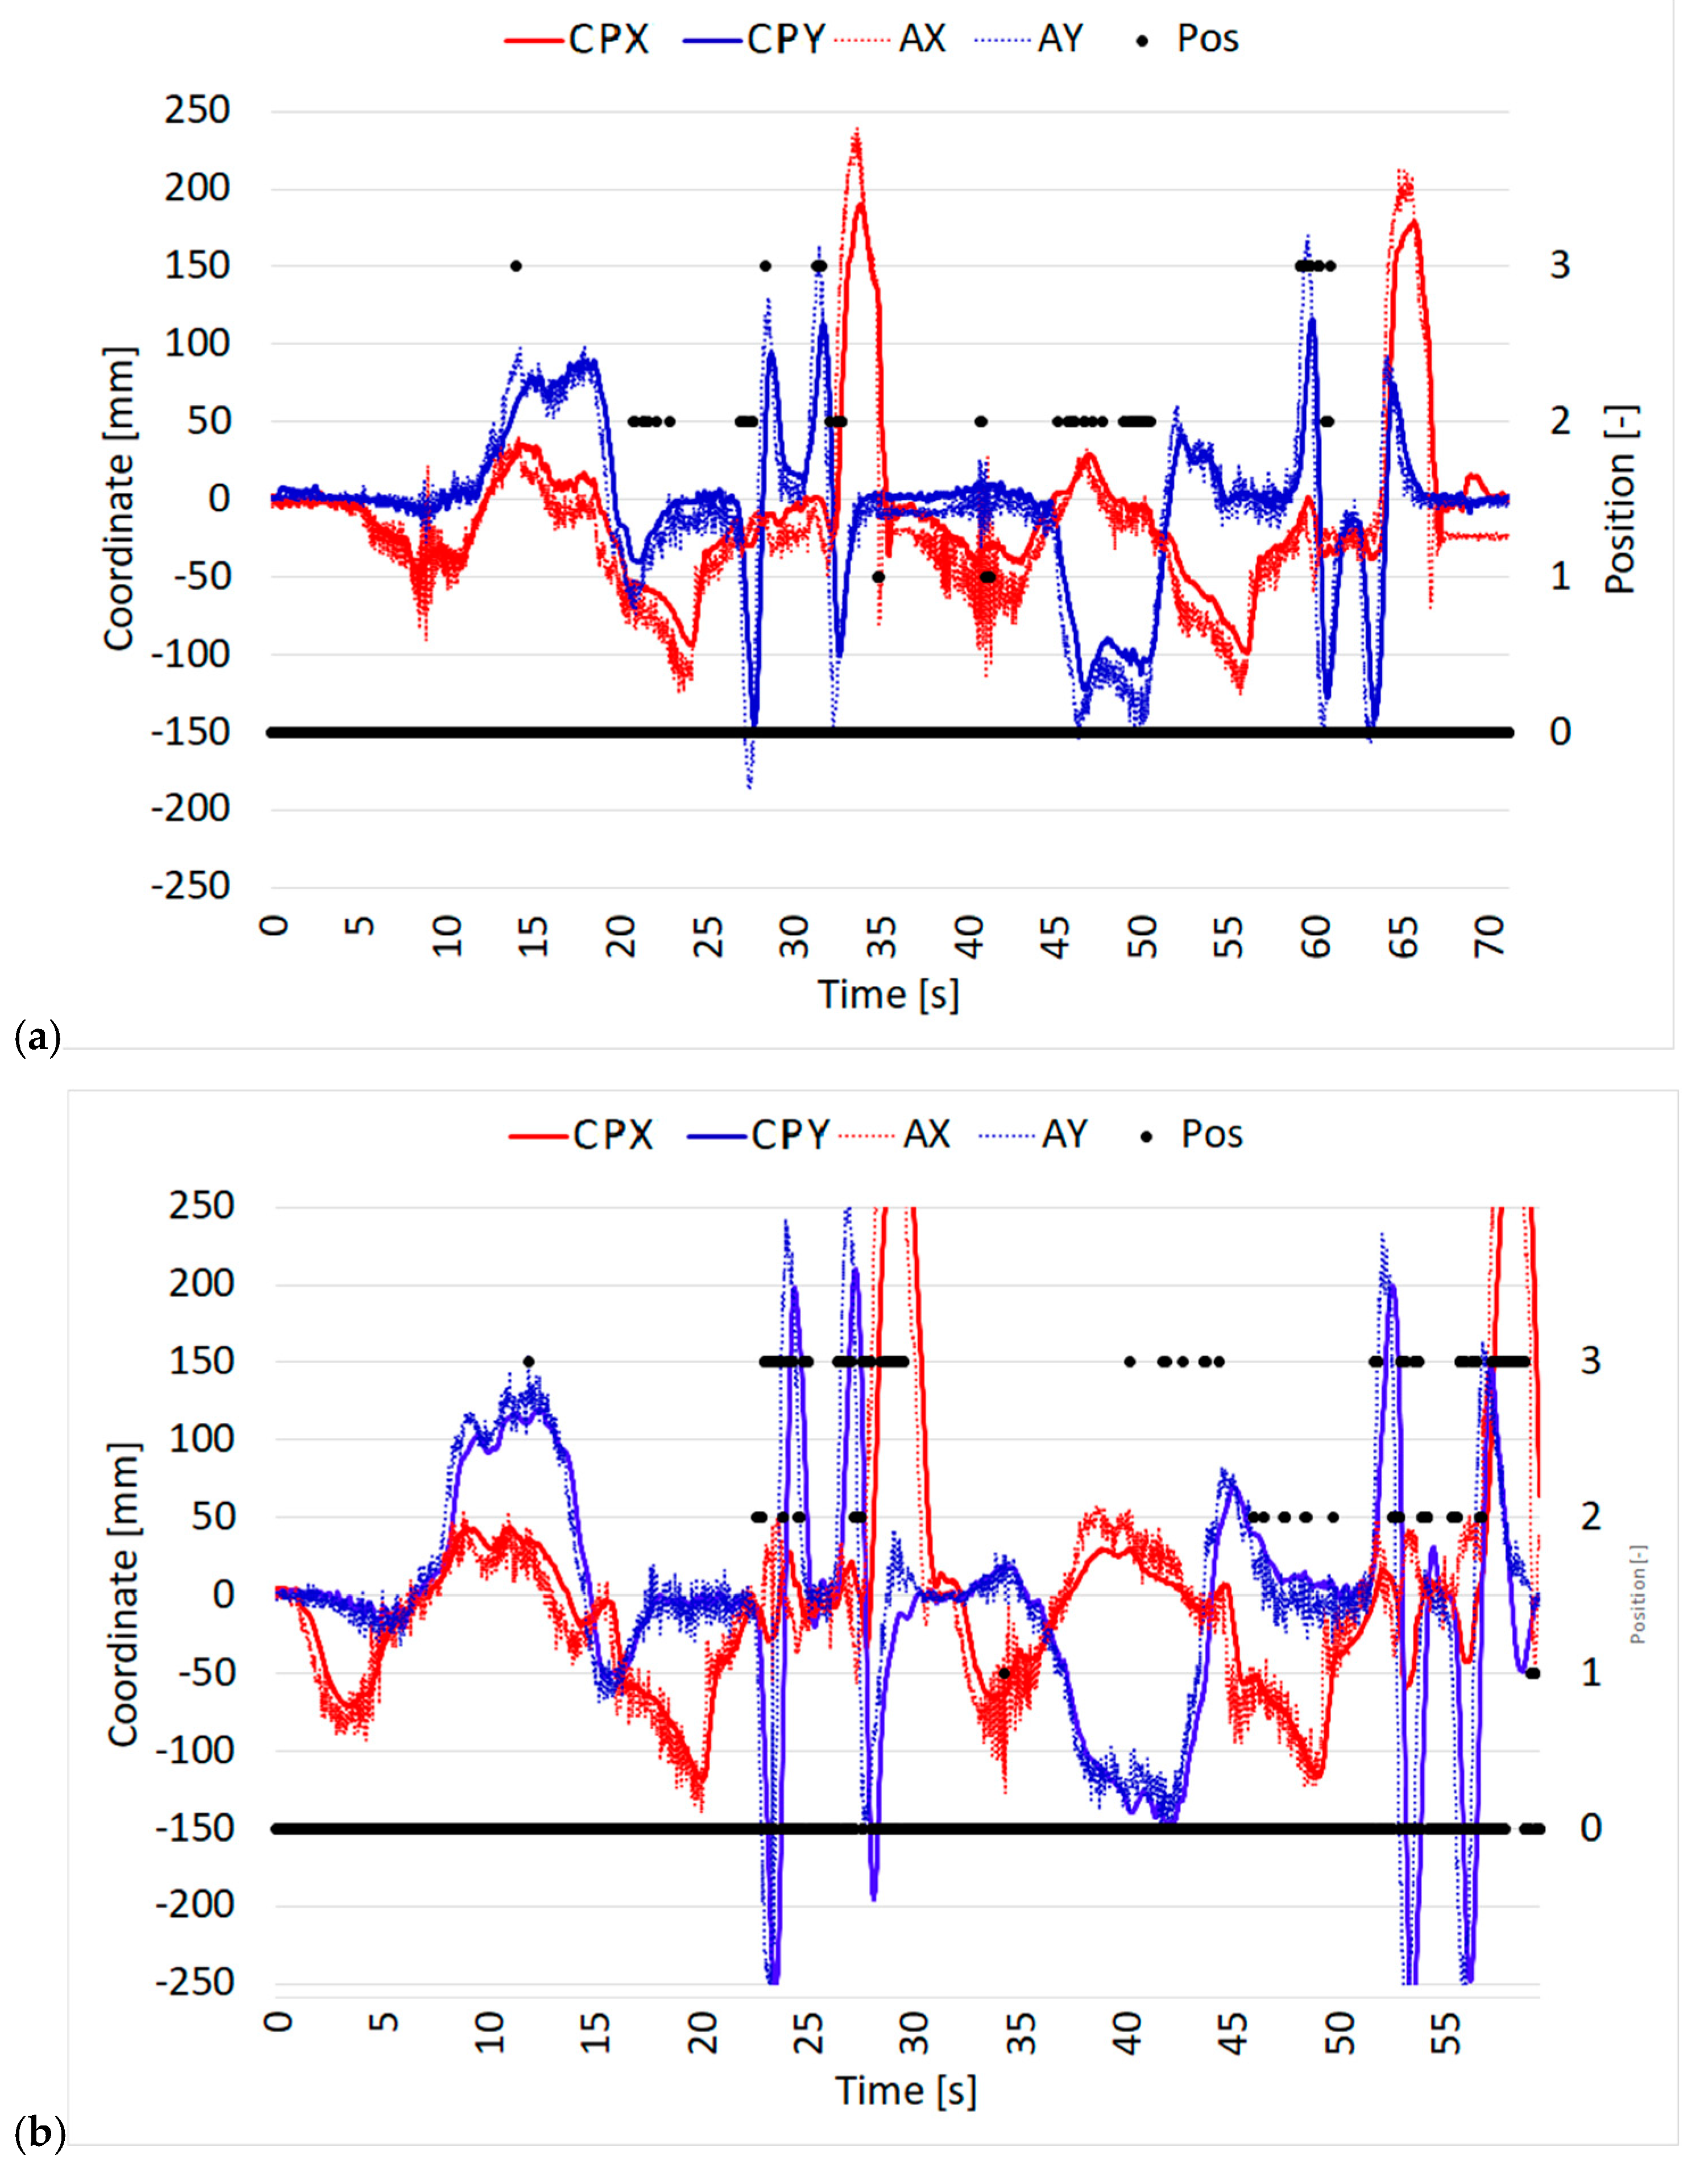
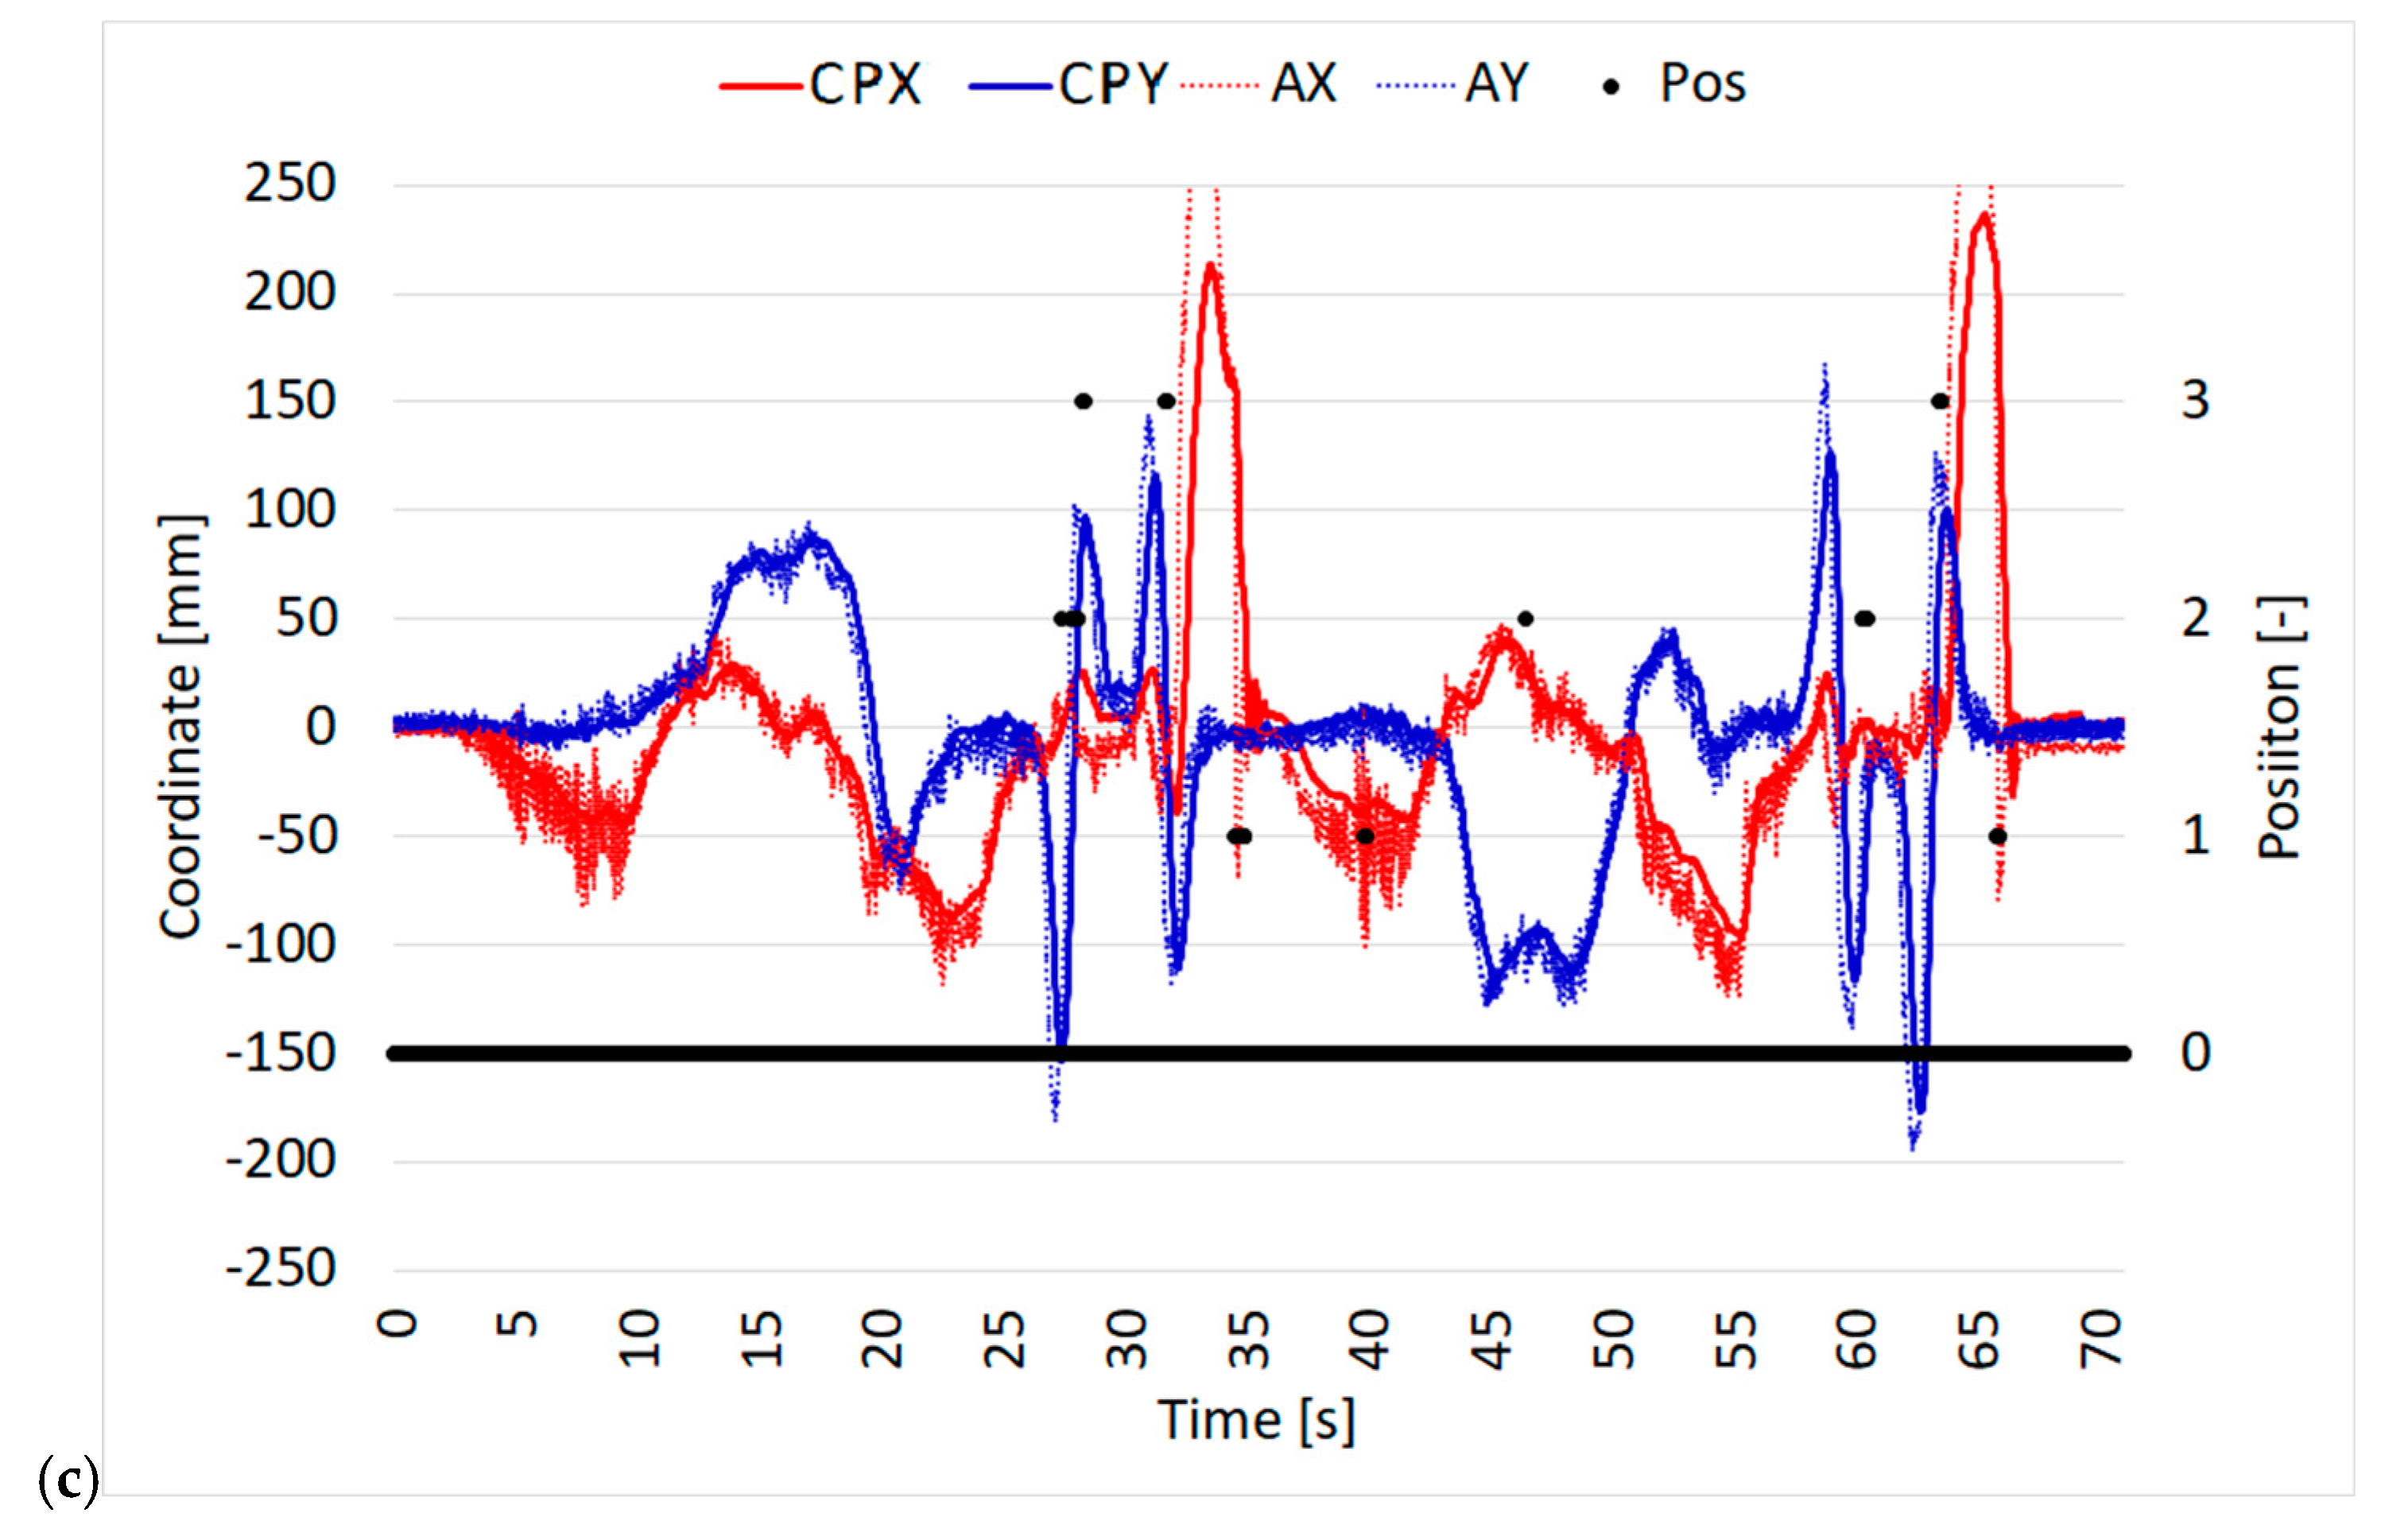
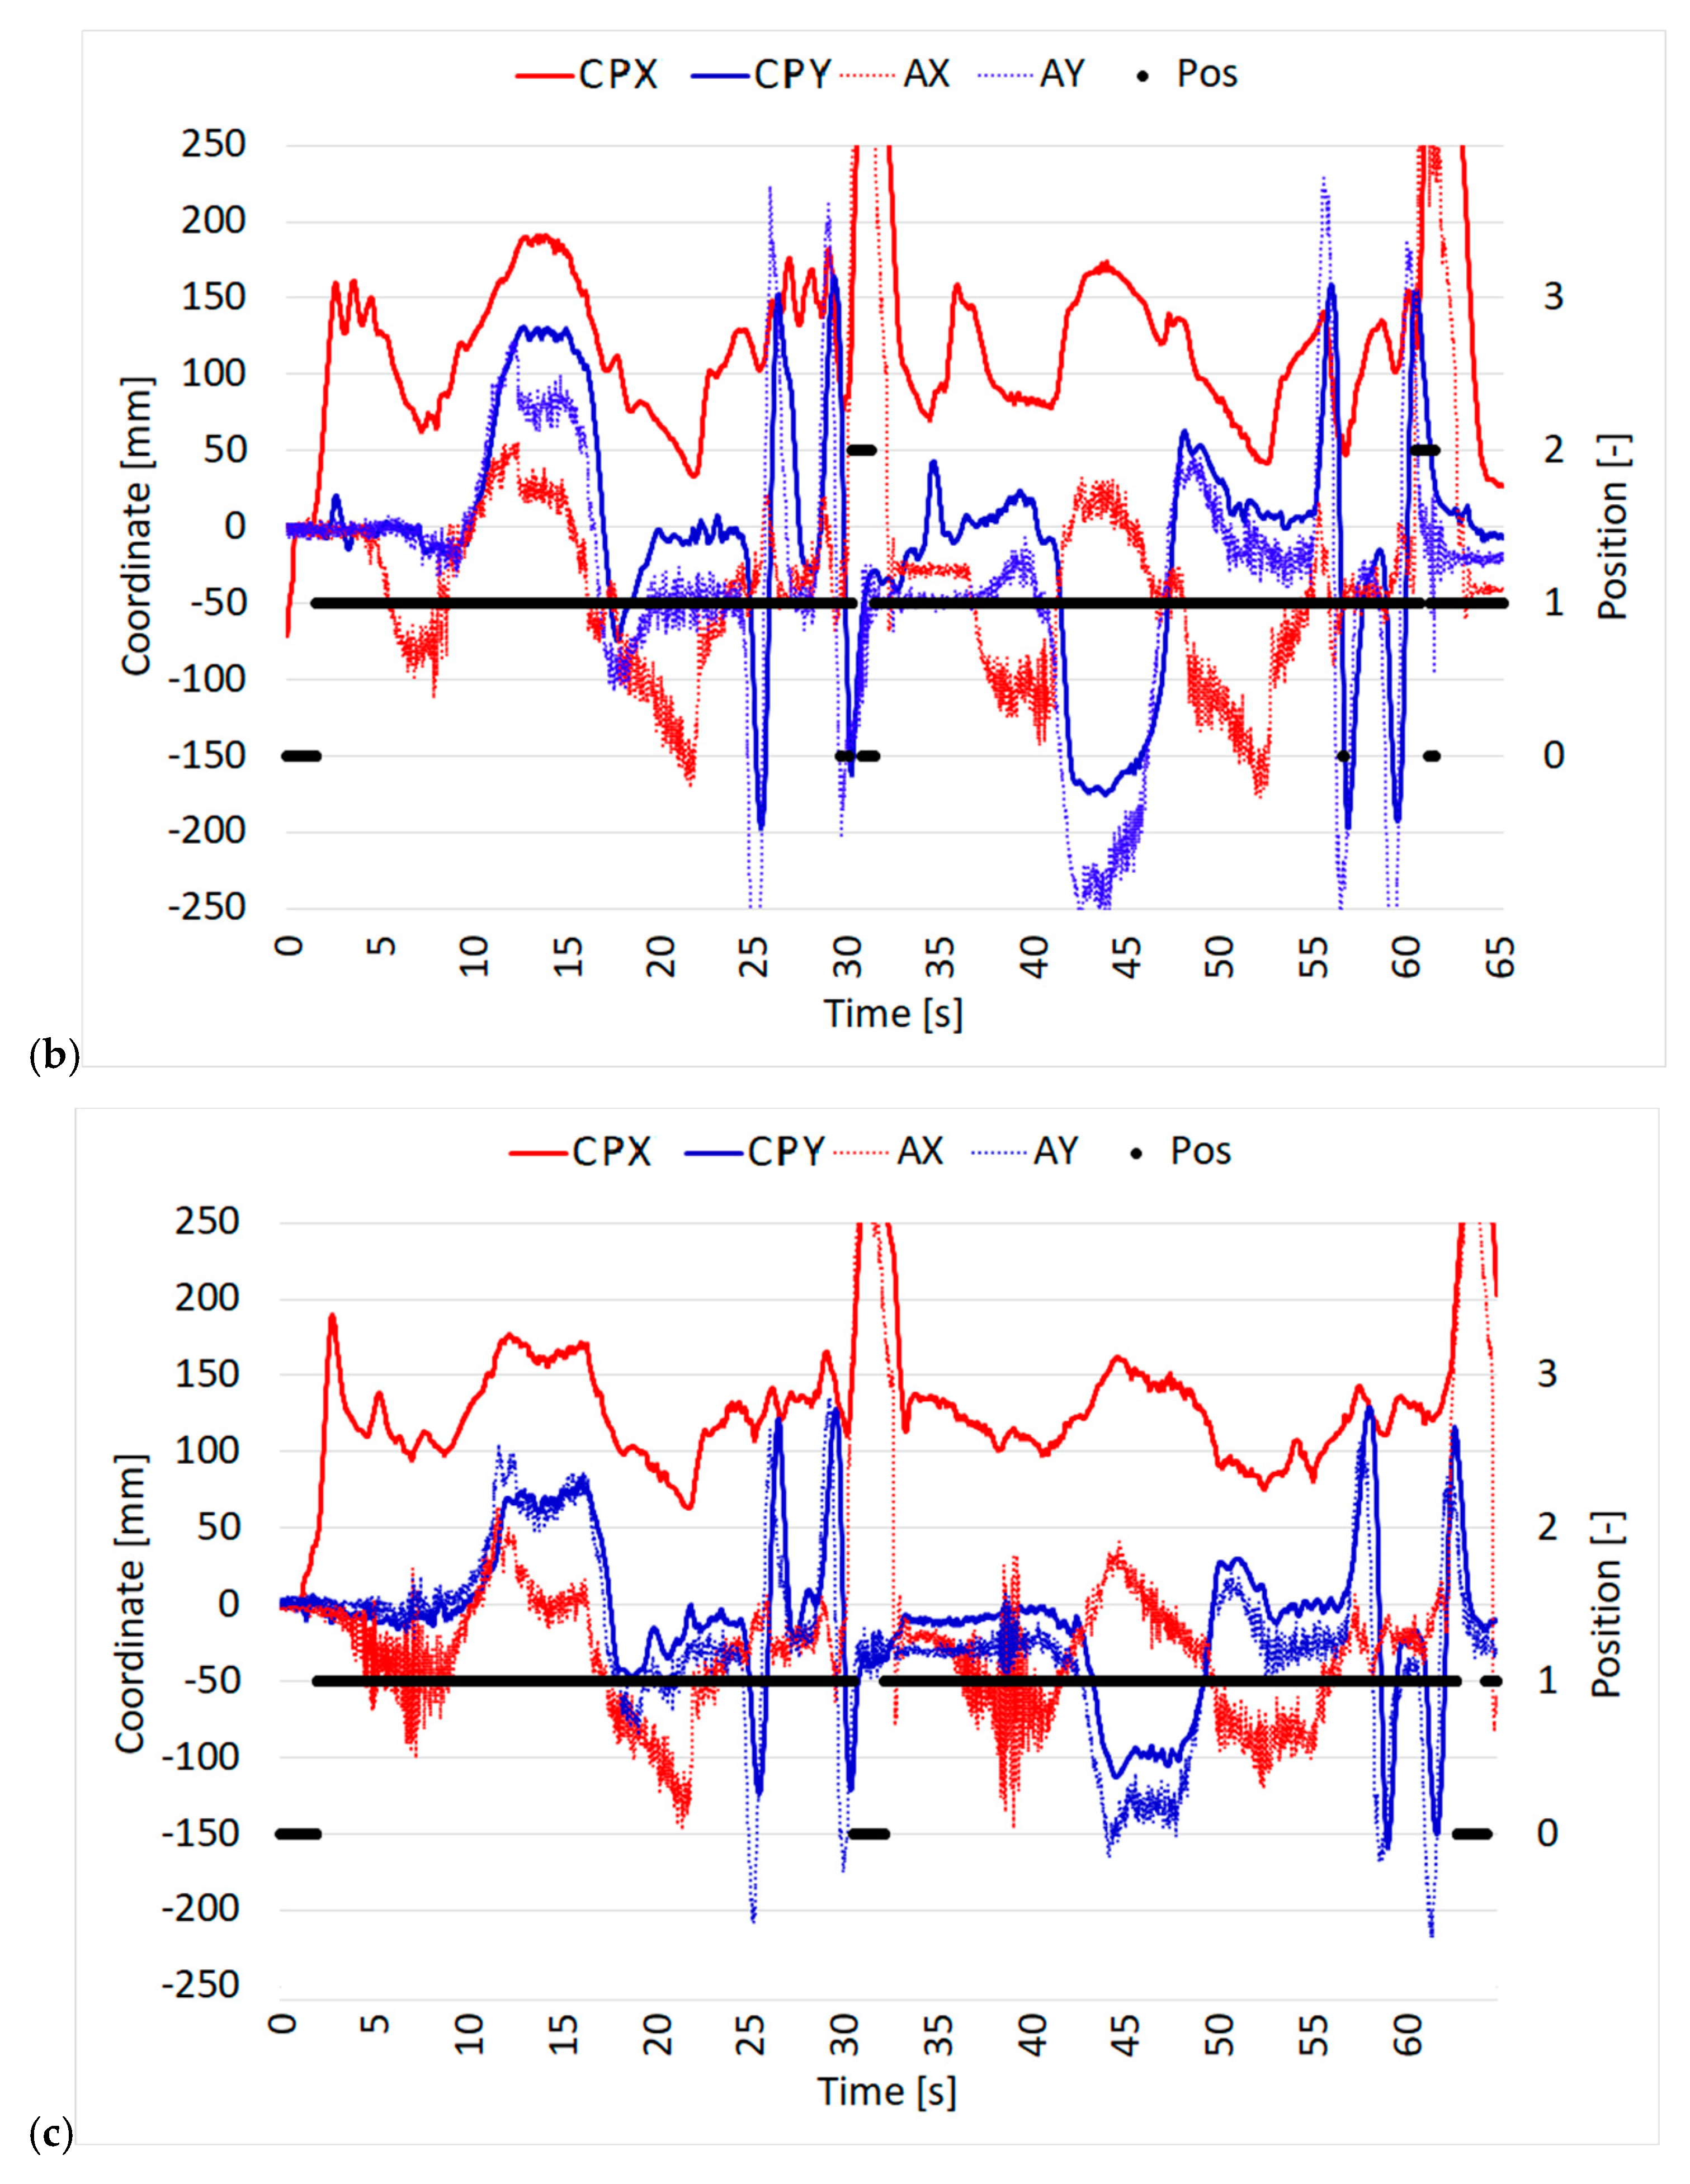
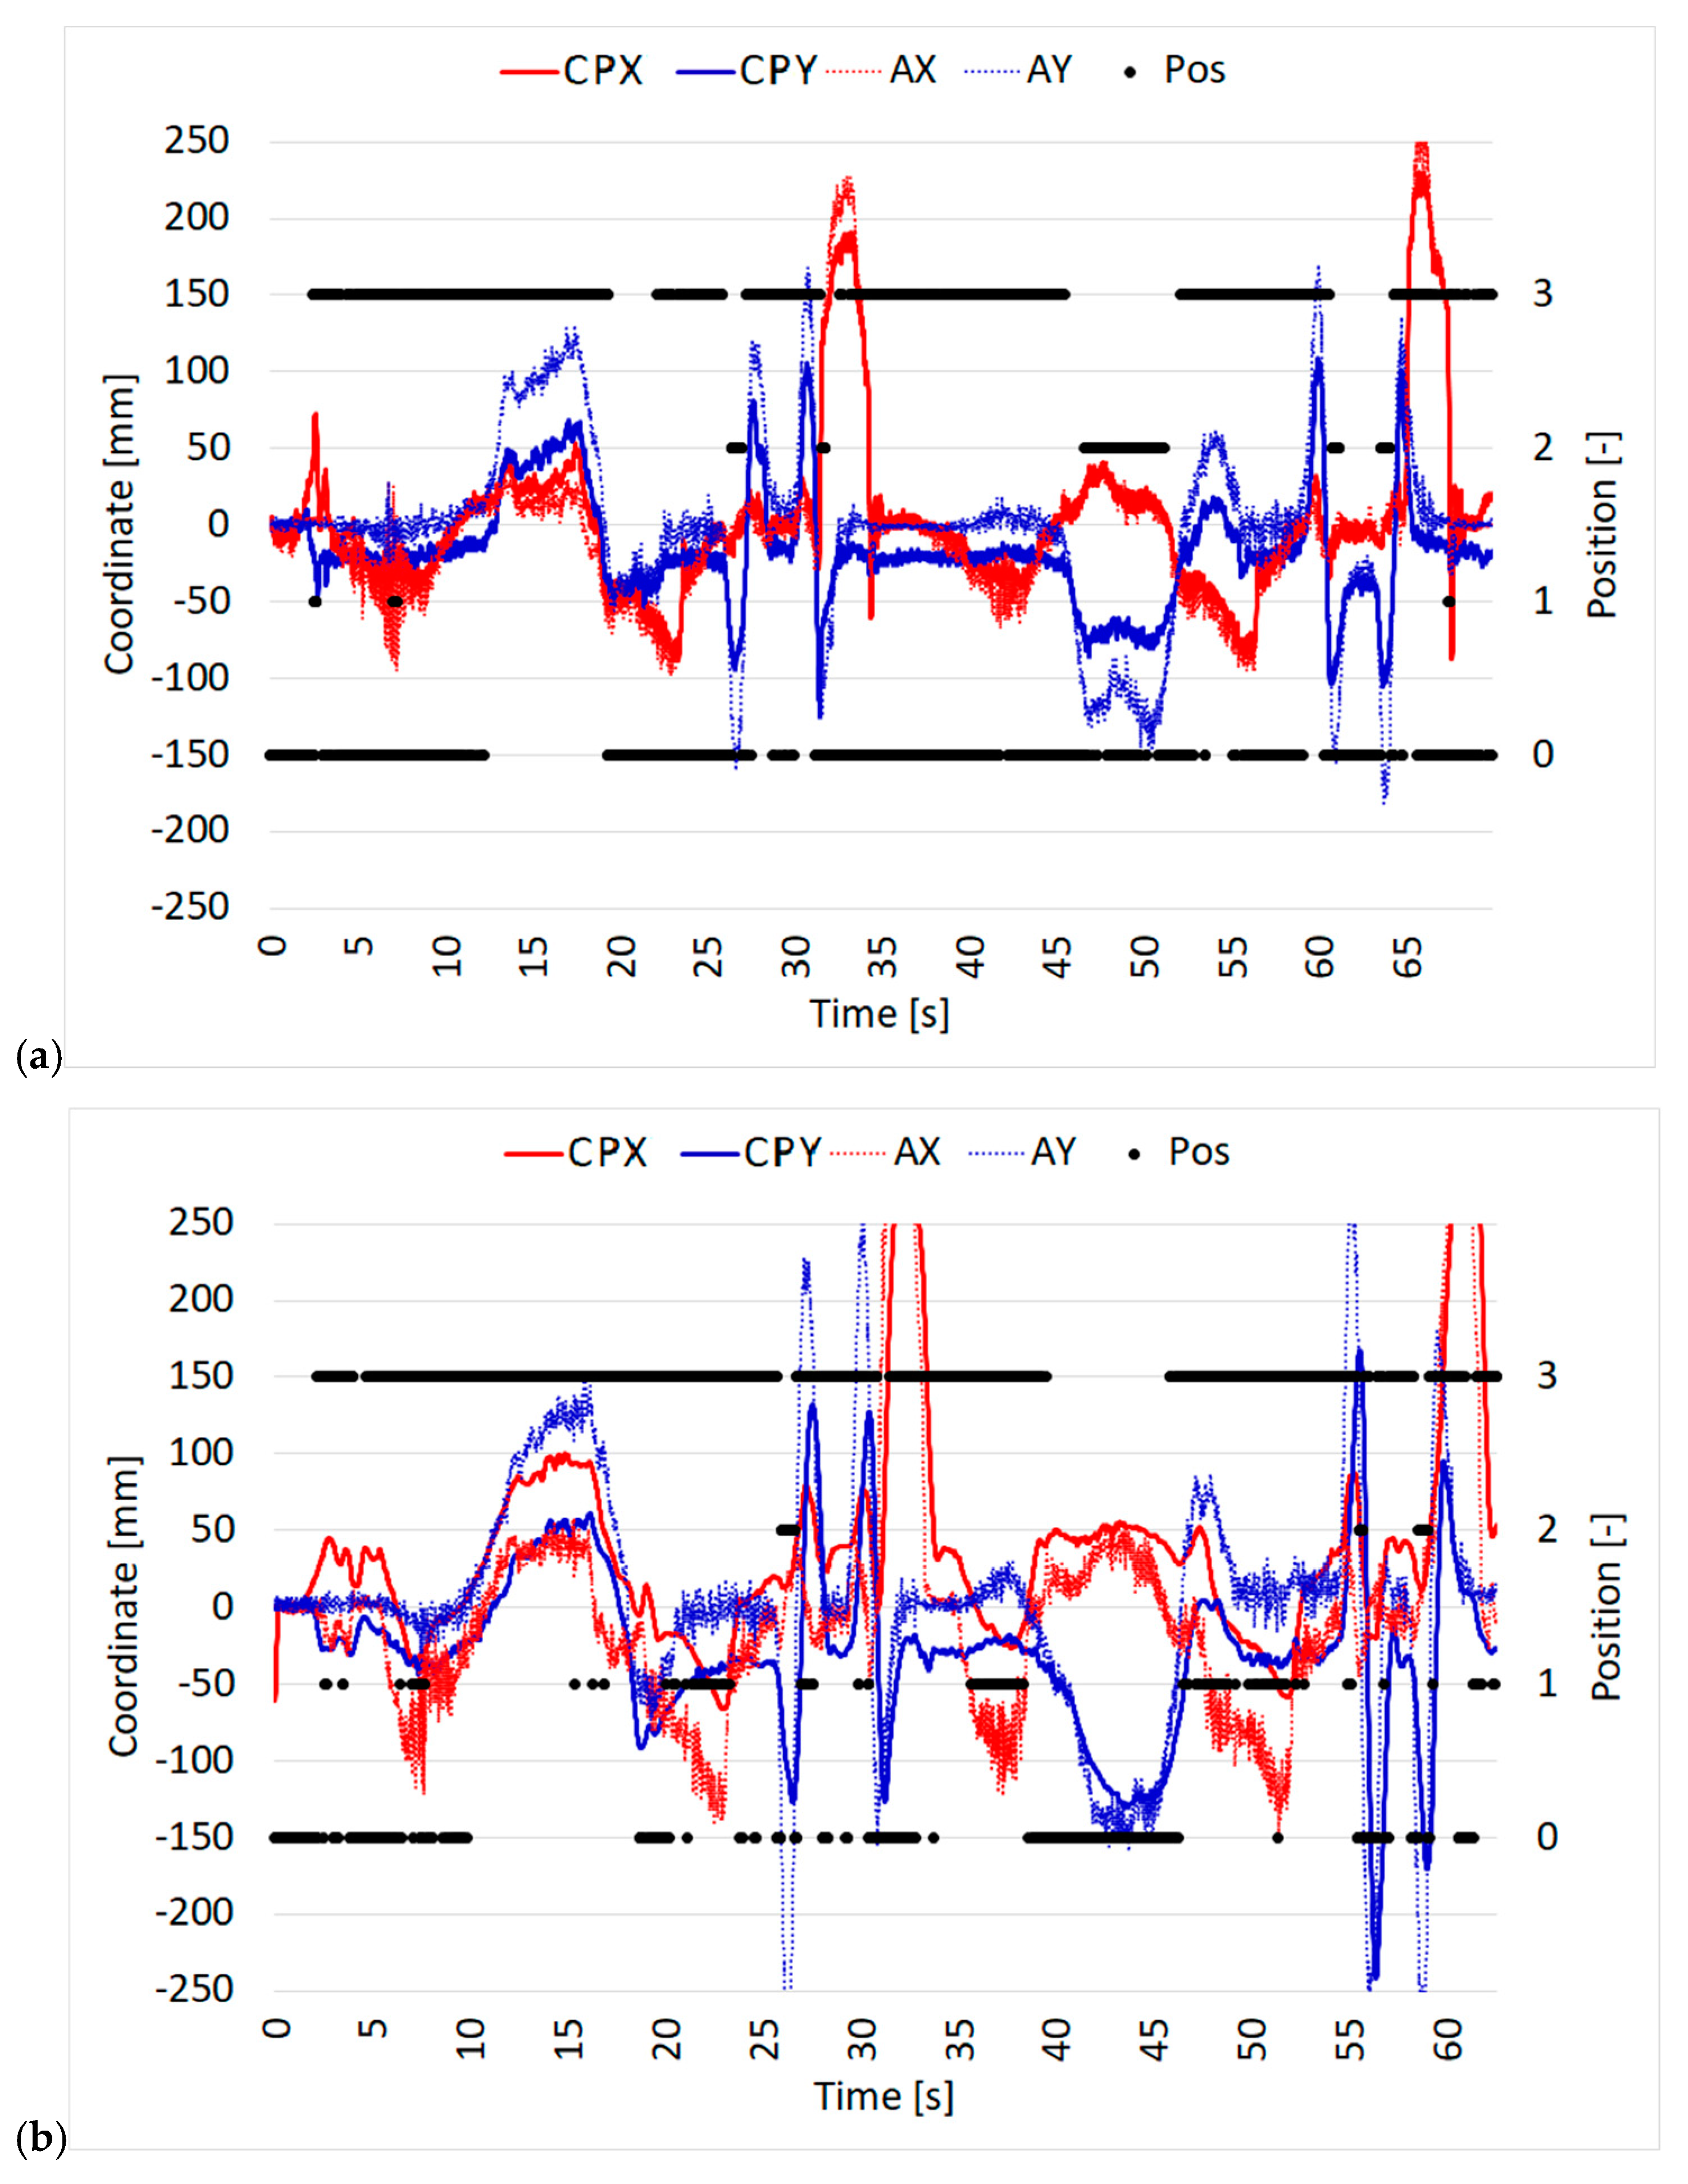
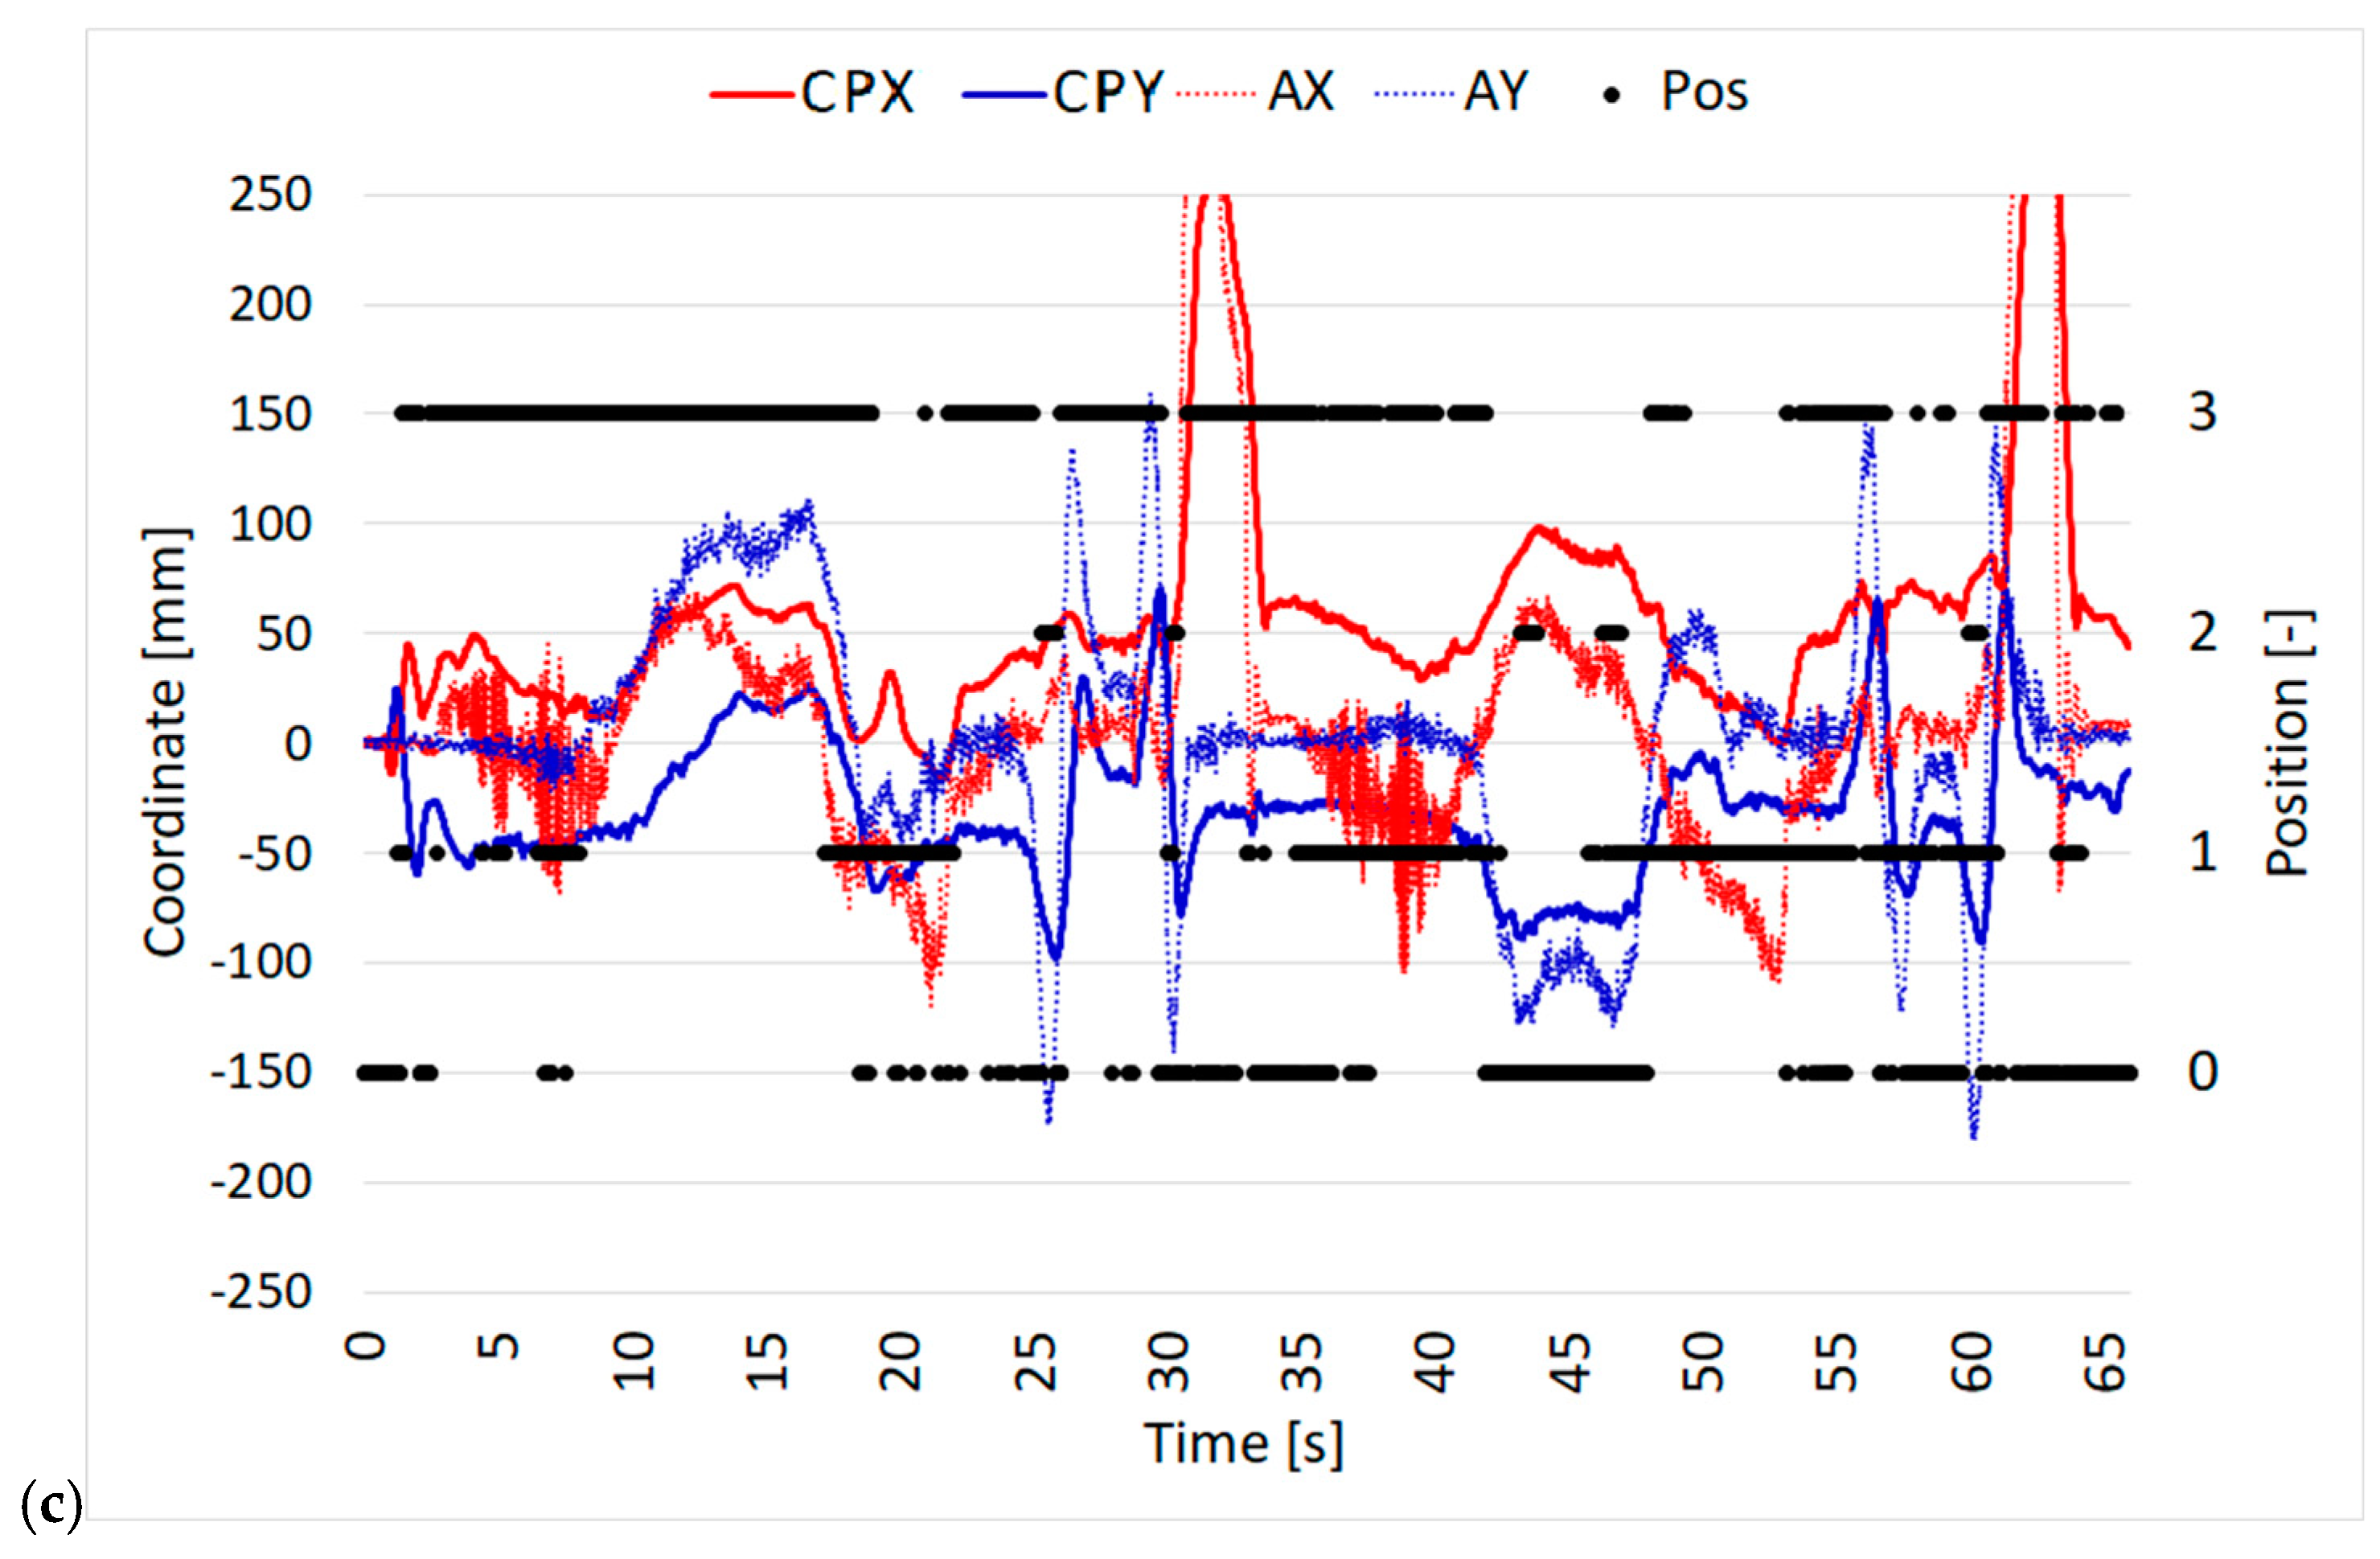
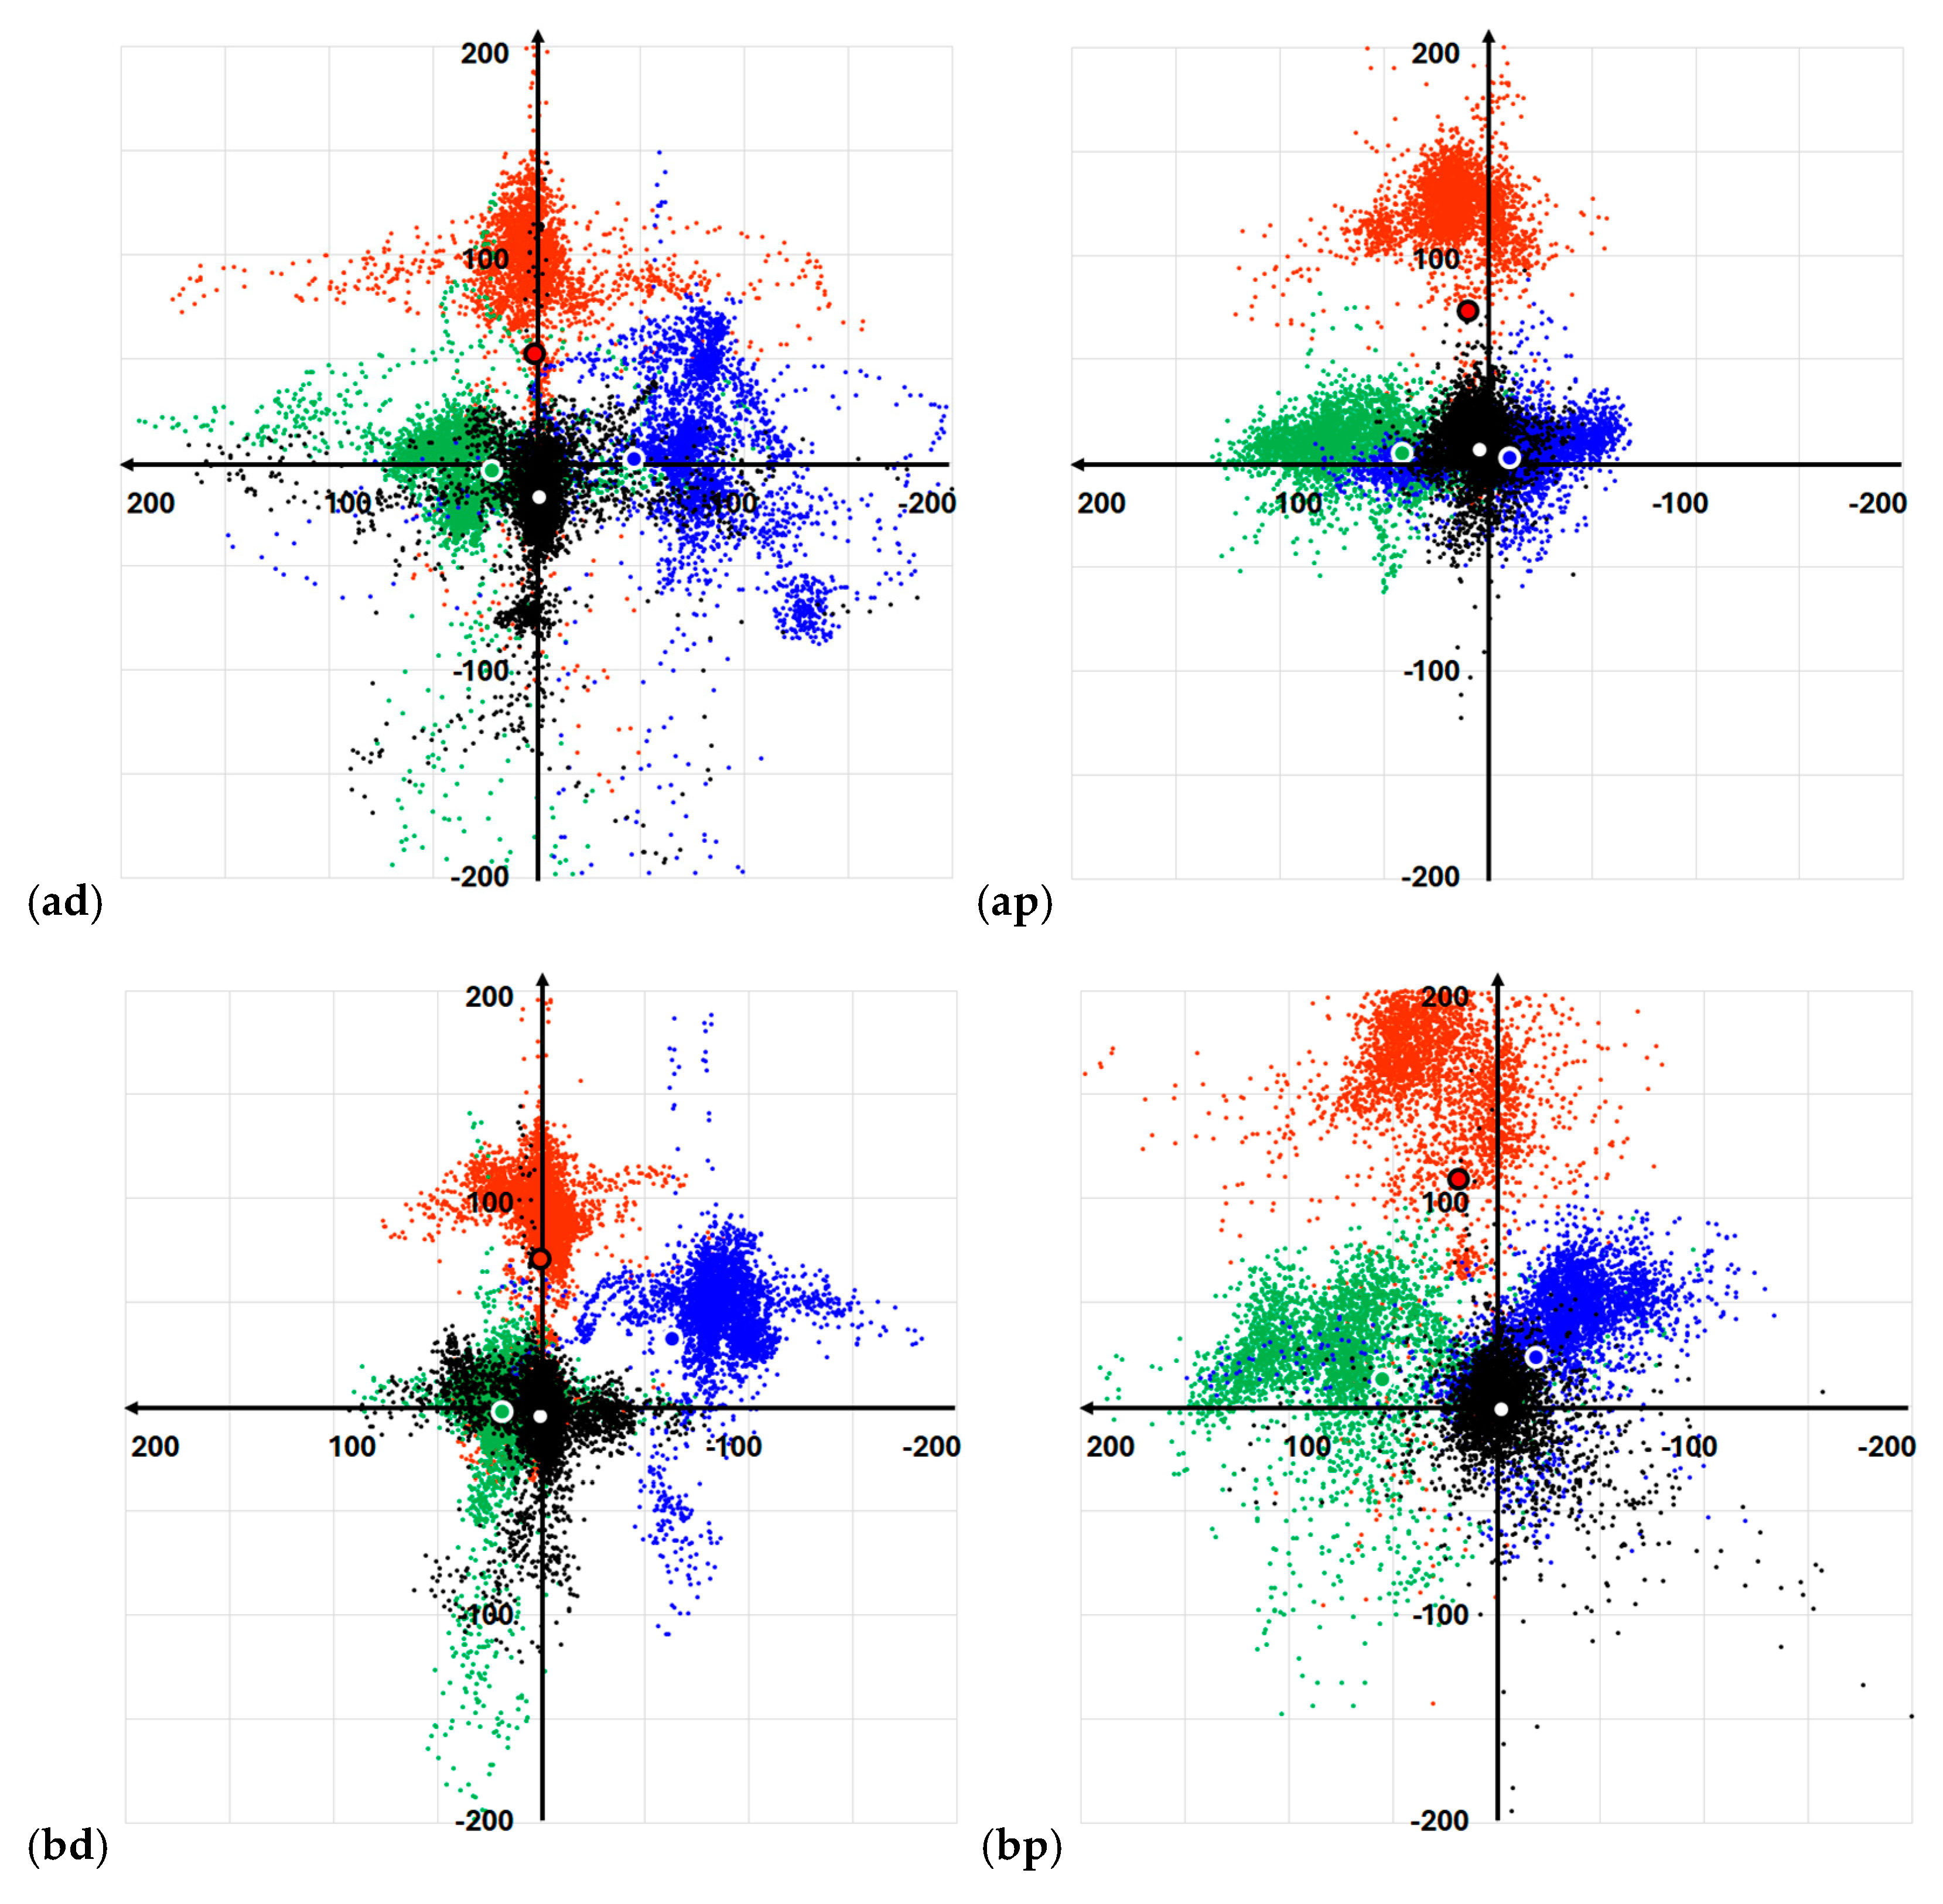
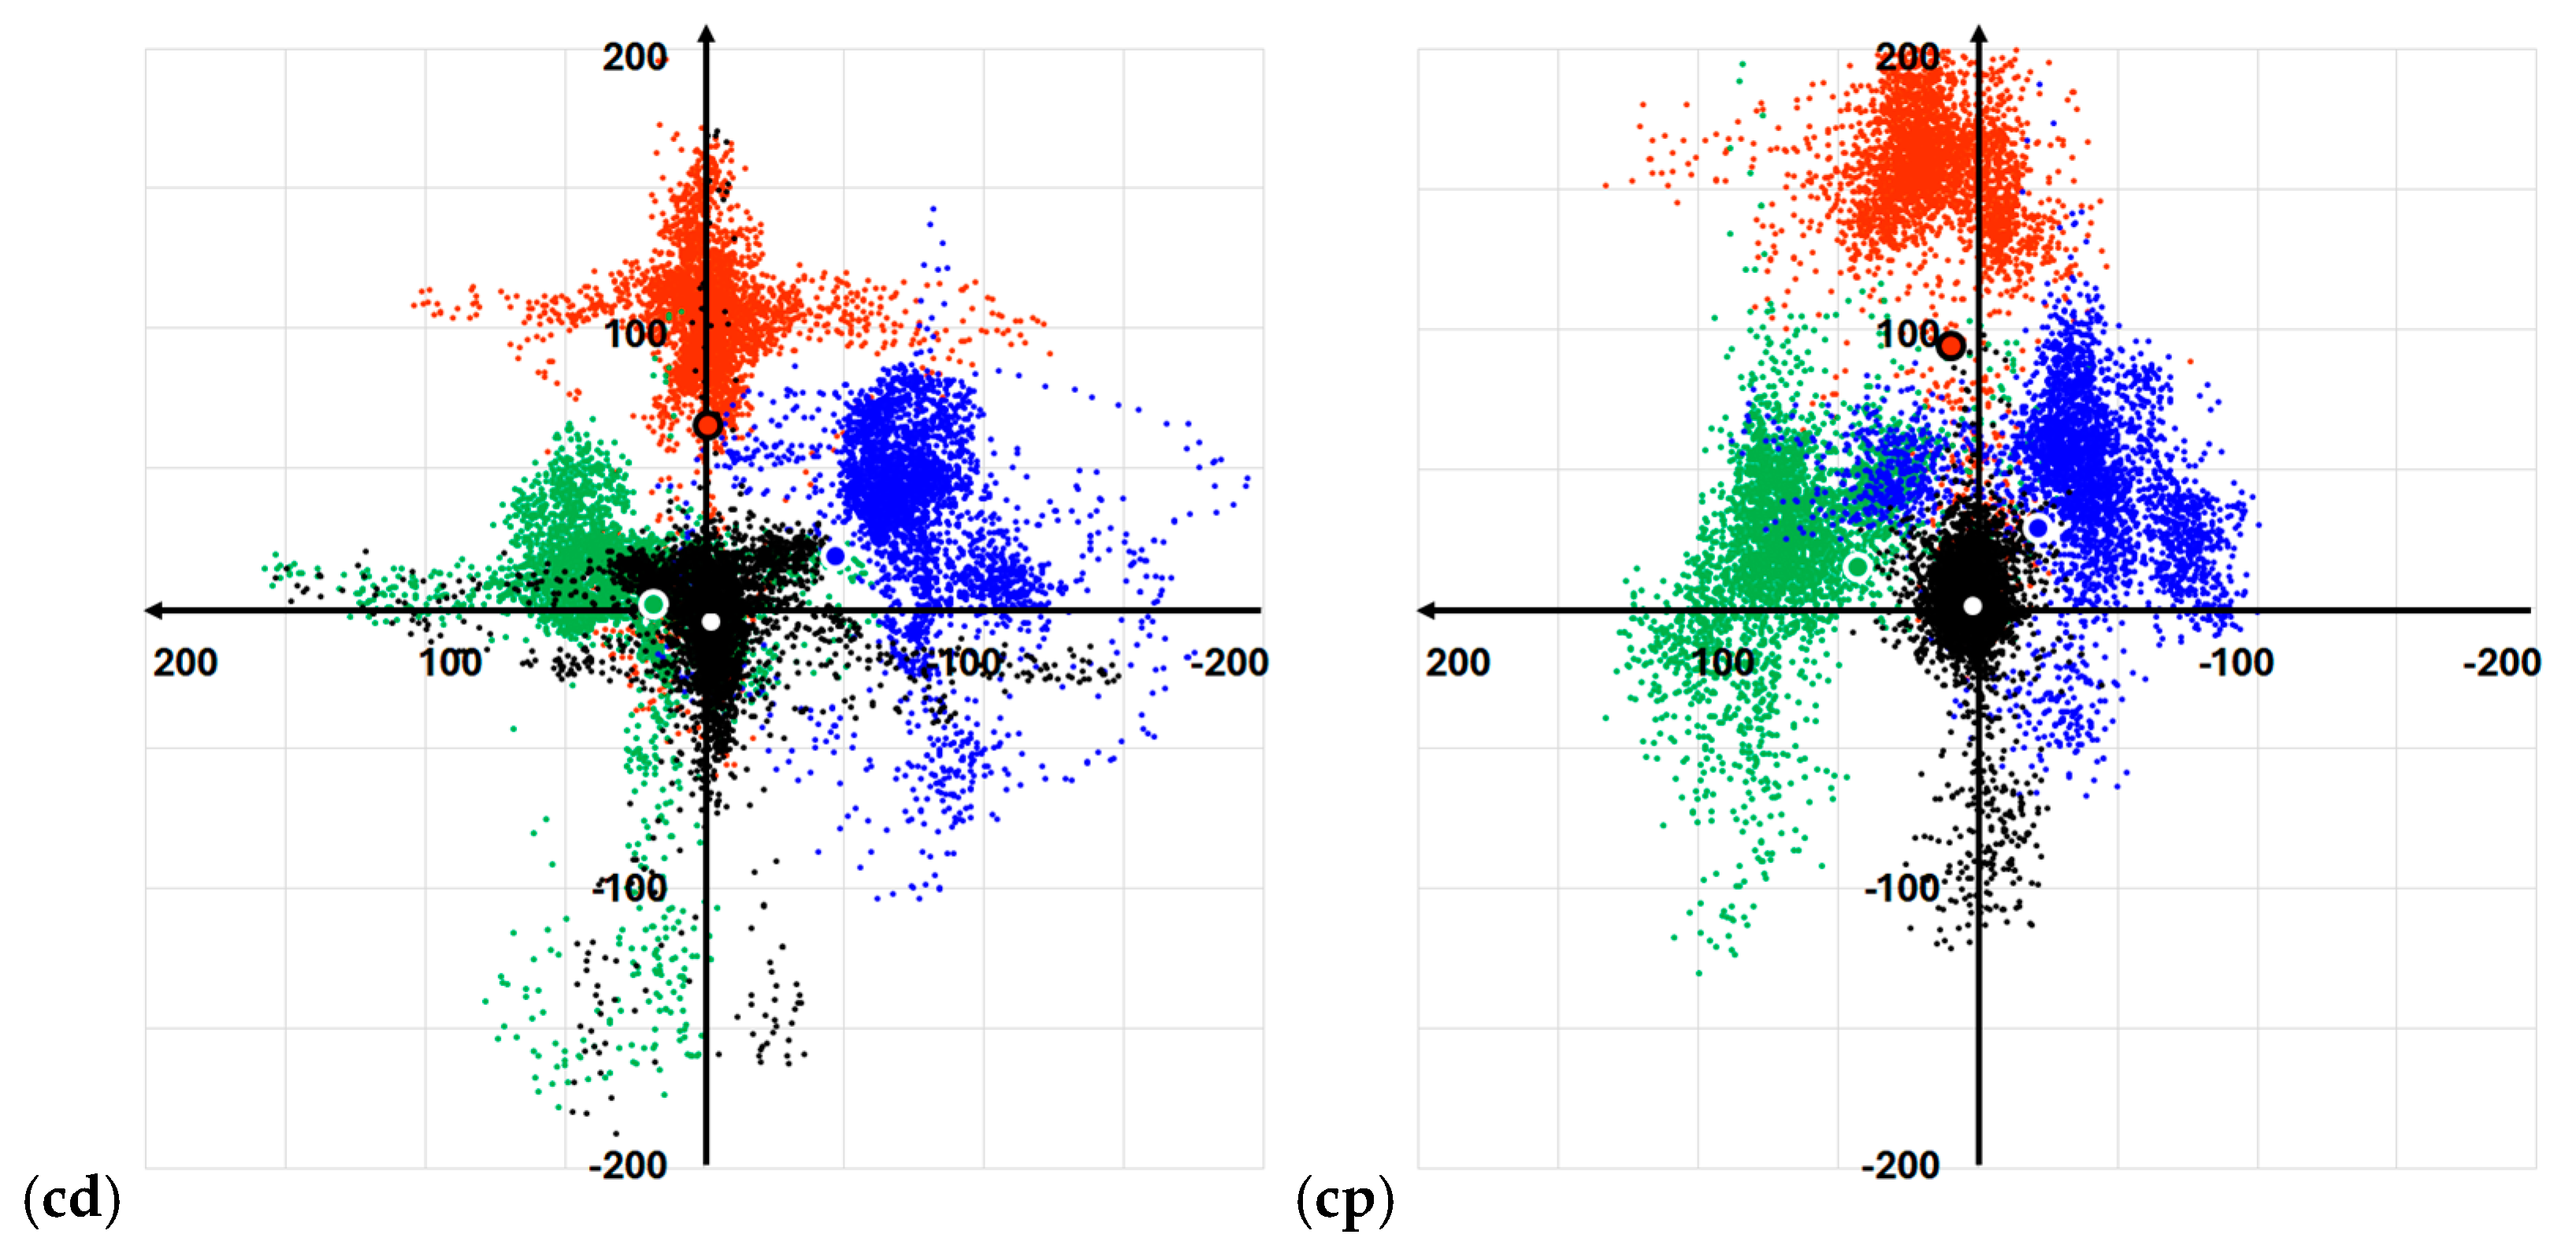
3. Occupant Monitoring Tests

The sensor interface with the seat has been tested with multiple participants in different cars, including an Audi A3 Sportback, a Citroen C5 Crossair, and a Peugeot 308 SW, on both the driver and passenger sides. The present section reports the results of the static validation test performed on the Audi A3 Sportback and the dynamic tests on the Peugeot 308 SW.

3.1. Static Tests

The tests began with the self-calibration process, as shown in Figure 3. After 30 s, the system calculated the shift factors by averaging the CPX and CPY positions, which were detected and queued as described in Section 2.2.3, thereby centering the computed CP around the zero position. The 30 s interval allowed the occupant to enter the car and settle into a comfortable seating position. If the initial calibration was not accurate or the occupant subsequently adjusted the seat or backrest position, the system could trigger a warning, allowing for manual recalibration and resetting the reference, as shown in Figure 3, after about 50 s. Note that the calibration thread continued by scaling the accelerations. However, in these static experiments, the accelerations were not recorded since they were zero, and the scaled values only resulted in minor spikes due to numerical errors.
Four different seating positions were tested: normal position, forward-reclined OP, left-reclined OP, and right-reclined OP. The forward-reclined OP poses a safety risk by significantly reducing the distance between the occupant’s torso and the dashboard. In the left- and right-reclined OPs, the occupant either shifts toward the door or leans toward the adjacent seat, depending on whether they are in the driver or passenger position. The tests were repeated with three different occupants, as detailed in Table 2 and referenced in [37]. The seat was tested on both the driver and passenger sides.
Each occupant was instructed to take one OP at a time, returning to the normal position before moving to the next. The different positions, along with their detection in the controller interface, are shown in Figure 4.
Figure 5 presents the trends of the CPX and CPY coordinates of the CP for the first occupant during testing on the occupant side. The detection of different positions is also shown, where 0 represents the normal position, 1 corresponds to the forward-reclined OP, 2 to the left-reclined OP, and 3 to the right-reclined OP. As discussed in Section 2.2.2, tolerance values must be defined in the controller to accurately distinguish among these positions. The experimental tests on the Audi A3 Sportback demonstrated an accuracy close to 100% using the tolerance values specified in Table 3. These tolerance values were used for all three drivers and passengers. The tolerance values in the tests on the driver and passenger sides had to be reversed for positions 2 and 3 due to limited movement space caused by the central pillar and the door.
The variation in tolerance values is due to the decreasing space available for the occupant when moving from positions 1 to 2 and 3. As the available space decreases, it becomes necessary to apply progressively narrower tolerances. The forward-reclined OP (position 1) was the easiest to detect since the movement was relatively unrestricted. The left-reclined OP (position 2) was also accurately identified; however, in most cases, the system additionally detected a forward shift in the CP during lateral movement. This occurs because most seats feature side panels on the backrest that, while aiding in maintaining proper posture while driving, require the occupant to lean forward slightly to change position. This explains the need for varying tolerances. The right-reclined OP (position 3) was the most challenging to detect on the passenger side due to limited movement space. The opposite was true for the tests conducted on the driver’s side.

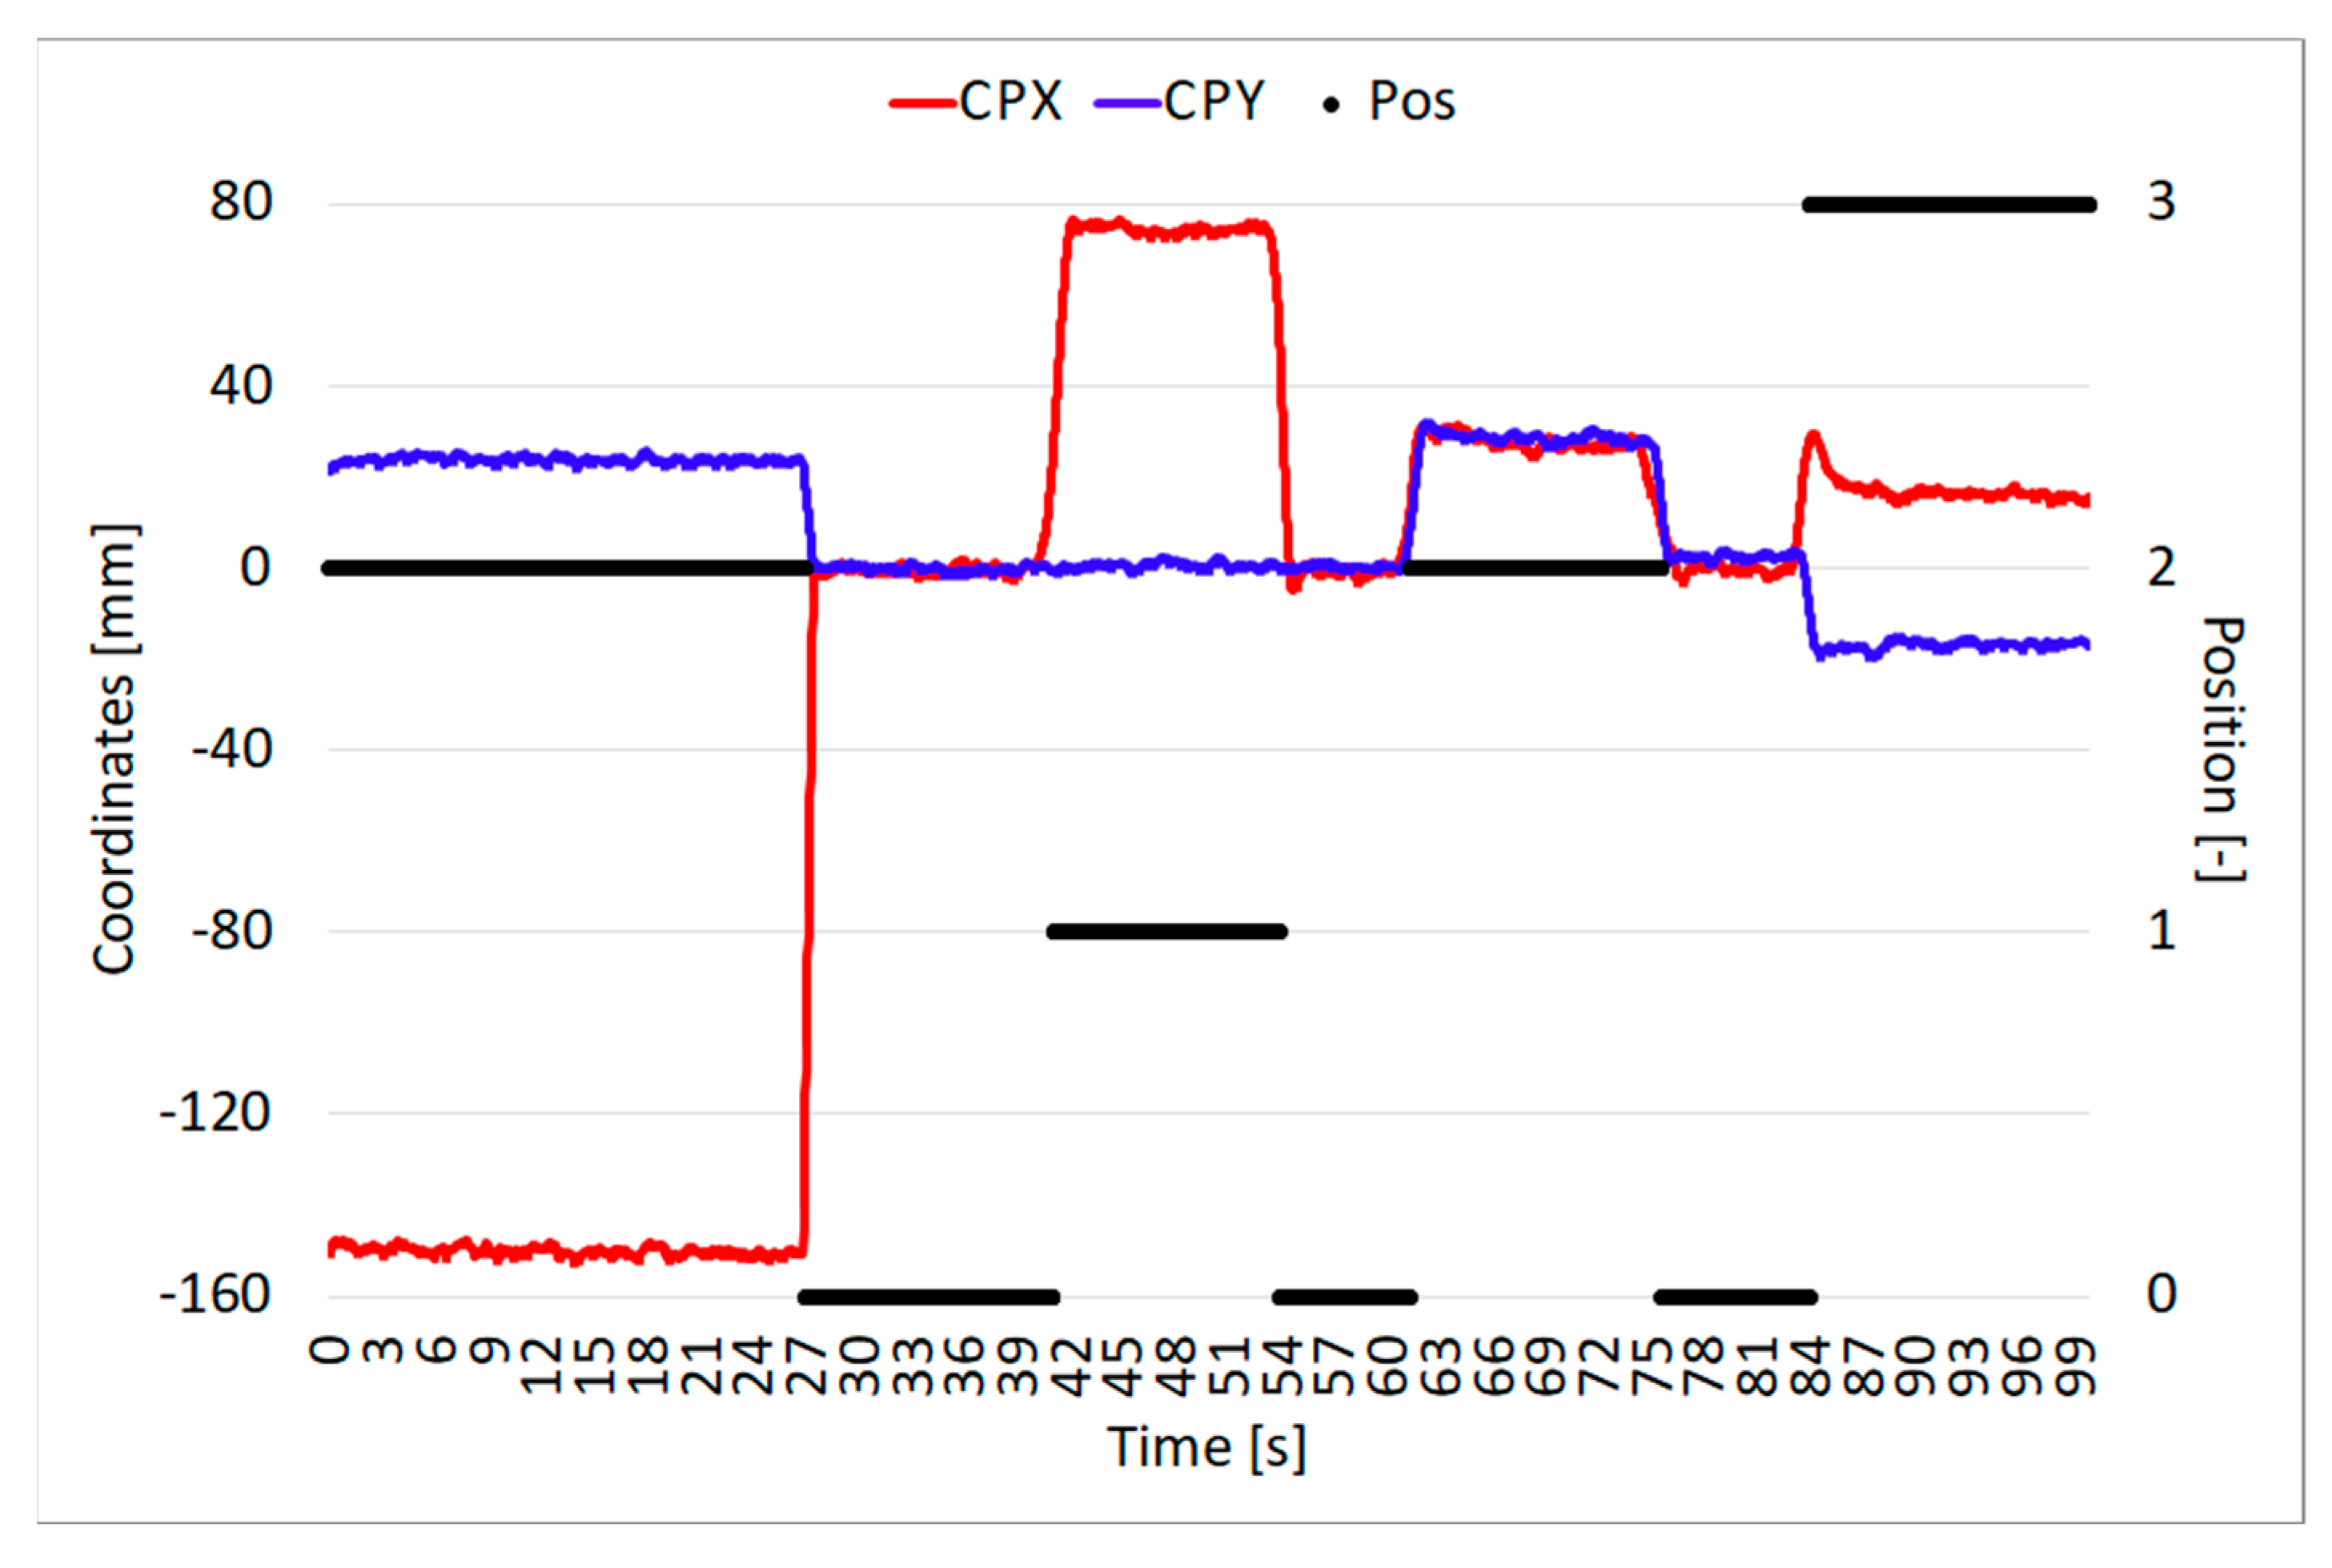
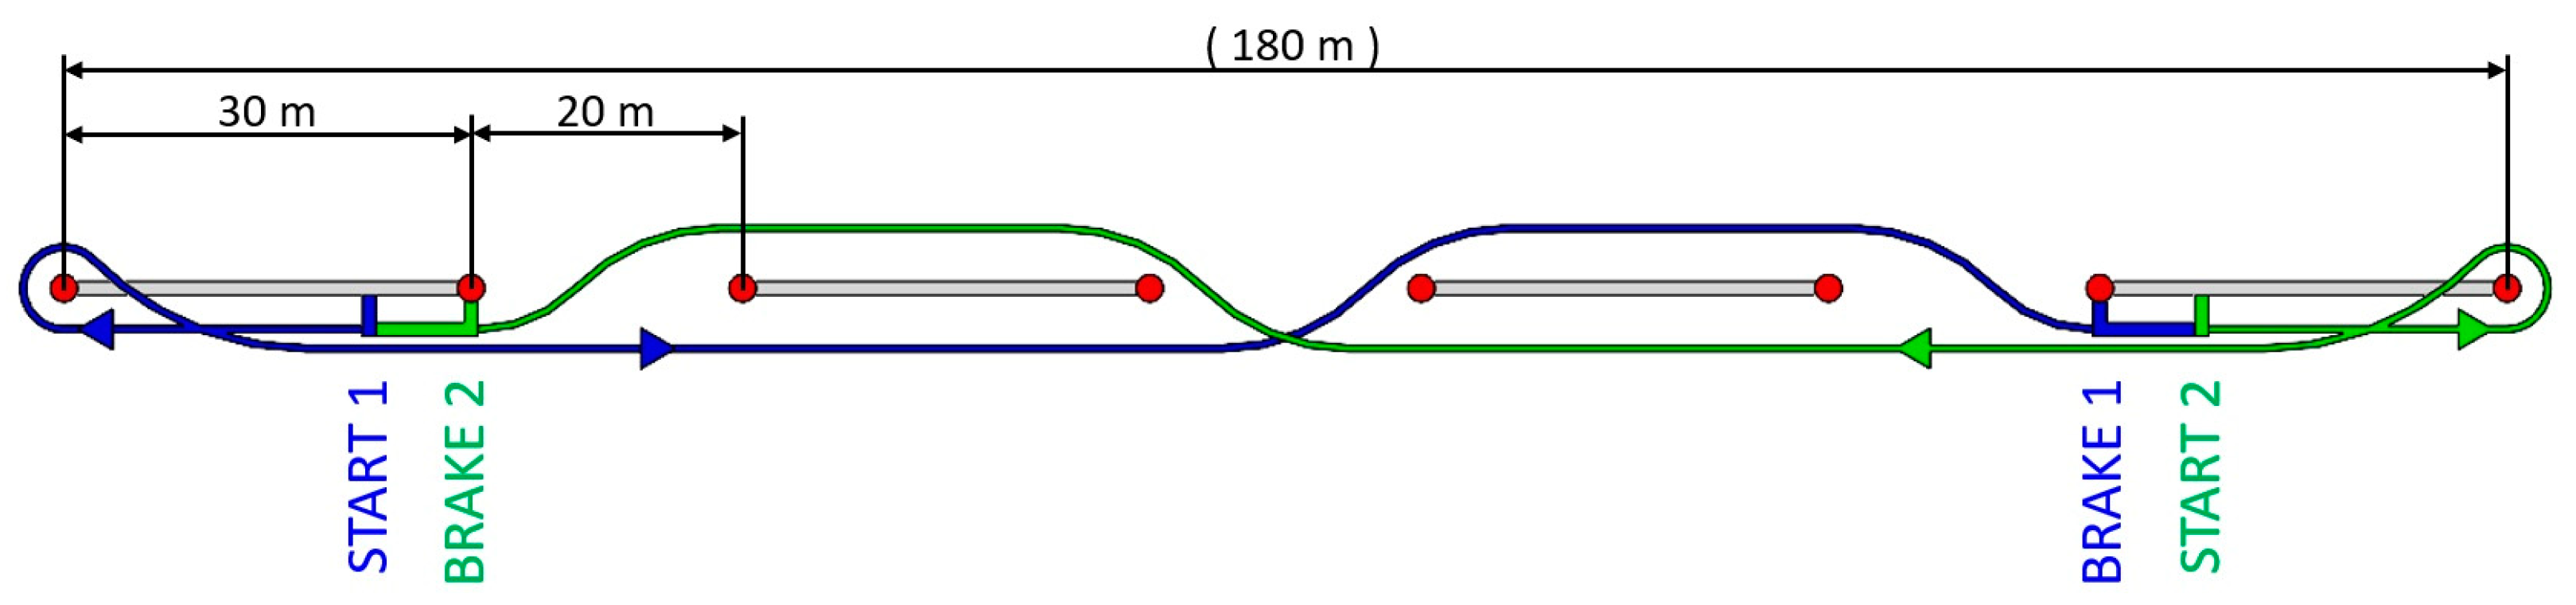
3.2. Dynamic Driving Tests

Extensive experiments were then carried out by three drivers; their anthropometric data are reported in Table 2. To ensure repeatability of the tests, they were carried out on a Peugeot 308 SW car, as it is equipped with a speed limiter that allows it to maintain a constant top speed. The tolerance values had to be increased, as reported in Table 4. This adjustment may be attributed to the differences in the car structures and dynamic behavior and, more importantly, the inertial forces and road noise that most influence the CP position during dynamic driving.
Since real-world driving scenarios cannot be fully replicated due to the device not being approved for public road use, we replicated maneuvers identified as critical in pre-crash and crash situations [44]. The test track was set up on the runway of the Aero Club of Modena [45], Italy, as shown in Figure 6 [37]. The track layout was determined based on the exact length of the painted center stripes and the spacing between them. The driving sequence, which included an outbound leg (blue) and a return leg (green), consisted of the following steps:
  • Start driving in first gear;
  • Half-eight turn at approximately 15 km/h;
  • Full-throttle acceleration in second gear until reaching the preset 50 km/h in the speed limiter function of the car;
  • Left lane change;
  • Right lane change;
  • Hard brake to full stop;
  • Restart driving in first gear;
  • Repeat 2;
  • Repeat 3;
  • Right lane change;
  • Left lane change;
  • Repeat 6.
First, each driver was asked to familiarize themselves with the car in a short driving session and to adjust the seat to a comfortable position. Then, each driver had to assume the positions already described, namely the normal position and the forward-, left-, and right-reclined OPs, completing three laps in each of them. All tests were conducted at a sampling frequency of 50 Hz. The displacement and scale variables for device calibration were calculated in the first lap while driving in the normal position. Each lap took approximately 50–55 s, with slight variations due to human error, including initial delays between the start of data acquisition and the start of driving, and different pause durations following the first braking maneuver. In total, 36 laps were completed in the experiment.
The second lap of tests in the normal position for all three drivers is reported in Figure 7. The sequence of the twelve maneuvers is further emphasized, as it is clearly distinguishable through the CP movements and the car accelerations in the longitudinal (red lines) and transverse directions (blue lines). Figure 8 presents the results of the second lap of tests in the forward-reclined OP, while Figure 9 and Figure 10 report the results in the left- and right-reclined OPs, respectively. The twelve driving phases illustrated in Figure 7 are clearly distinguishable, with comparable acceleration and CP. The 0 to 3 positions are identified with good but different reliability, as further discussed in the following sections.

3.3. Dynamic Passenger Tests

Due to its interchangeability, the seat interface was mounted on the passenger side of the Peugeot 308 SW to repeat the same track described in Section 3.2. A fourth driver was assigned to drive the track to test the same occupants presented in Table 2, assuming the same positions as described in Section 3.1 and using the tolerances reported in Table 3. The recorded CP and acceleration are reported in Figure 11, Figure 12, Figure 13 and Figure 14 for the normal position and the forward-, left-, and right-reclined OPs. It is possible to notice a general improvement in the identification of the position, but to a lesser extent than expected, as further discussed in the next section.

3.4. Results Discussion

The CP positions were compensated by the scaled accelerations of the car to reflect the driver’s position relative to the moving platform. Aside from the deviations caused by the car pitching and rolling during abrupt maneuvers, the CP position in the CPX-CPY plane represents the vertical projection of the CP.
Table 5 summarizes the position identification by averaging the second and third laps in the normal position for each driver, along with all three laps for each OP. This comparison includes the previous prototype tested on the driver side [37] and the new prototype tested on both the driver and passenger sides. The results confirm the reliability of both systems in accurately identifying the occupant’s position.
Figure 15 illustrates the CP position plots in the CPX-CPY plane, compensated by the scaled accelerations of the car, for the second of three tests conducted in the normal position (black dots), as well as the forward- (red), left- (green), and right-reclined (blue) OPs for all three drivers and for the same individuals tested in the passenger seat. The large points with thick borders represent the average CP positions, while the smaller points indicate all the experimental samples.
Considering the new interface prototype, while assuming an OP on the passenger side is relatively easier, maintaining this position during dynamic phases becomes more challenging. This difficulty arises due to fewer available support points, particularly for the hands, which play a crucial role in stabilizing the occupant during harsh maneuvers. It can be observed that, in general, during the assumption of OPs along the transverse axis, the position tends to oscillate more significantly. Taking the right position on the passenger side (represented in blue) as an example, the difficulty in maintaining this position becomes evident. This instability is reflected in both negative and positive values, leading to a reduction in the accuracy of position detection. On the driver side, the interaction with the steering wheel quite affects the load detection, but also helps counteract longitudinal and transverse load transfers, allowing the posture to be better maintained. In contrast, on the passenger side, reclining is much easier during straight motion but harder to maintain during abrupt lane changes.
Both the previous four-leg prototype and the new sensor interface struggled to accurately detect the position where the occupant reclined against the door, namely the left OP on the driver side and the right OP on the passenger side. This limitation is due to restricted space and the need for a slight forward reclination of the body. A key difference between the two systems is the higher sampling frequency of the new prototype, making it more responsive to load variations. While this improves precision, it also amplifies load oscillations, potentially increasing false positives in OP identification.

4. Conclusions

In this paper, a standardized sensor interface designed to continuously monitor the occupant’s position on a vehicle seat was introduced. The interface is highly adaptable, fitting various vehicles and seat models with ease. It demonstrated compatibility with an Audi A3 Sportback, based on the Volkswagen Group’s MQB platform (MQB Evo), a Peugeot 308, reusing the EMP2 V1 modular car platform, and with a Citroen C5, based on EMP2 V2, without requiring any modification, and could be easily installed on both the driver and passenger sides. For vehicles where compatibility is an issue, reconfiguration can be achieved by simply adjusting the parameters in the CAD model, exporting the *.dxf file to a laser cutting machine, and producing a customized interface in minimal time.
The system is equipped with four load cells to monitor the CP of the seat–occupant system in real-time. These load cells are dimensioned to withstand driving forces while ensuring they measure only vertical loads. Additionally, the new interface prototype includes restraining structures to enhance safety in the event of an accident, making the system more usable for extended testing in research and vehicle design. A refined calibration function enables the sensor interface to accommodate adjustments in both longitudinal and vertical seat positions without compromising driving comfort. The control system continuously compares the CP shifts with vehicle accelerations detected by the IMU in both the longitudinal and transverse directions. The classification algorithm determines whether CP shifts arise from inertia forces during driving or actual changes in the occupant position. Naturally, tolerance values have to be considered to filter out driving and sensor noise. The tolerances must be adjusted based on the more or less rigid dynamic behavior of the car models and, most importantly, the available space for occupant movement. However, once the values had been defined for the specific car model and the occupant or driver position, they were consistently used across all occupants during the tests. This ensures that the configuration can be set during the design phase and that the experimental results are valid for all occupants.
Extensive experiments were conducted with three individuals, tested as both drivers and passengers, in the normal position and three alternative OPs. Notably, most related works have only considered static or dynamic simulators, overlooking the effect of road noise, which is a major challenge for signal monitoring and detection algorithms. In contrast, this research replicated harsh maneuvers that have been identified as critical in pre-crash and crash scenarios, providing a significantly more realistic assessment.
The experiment results confirm the feasibility of a standardized sensor interface between the seat and vehicle chassis, accurately identifying the occupant’s normal position or OP in most cases. However, some misidentifications occurred due to road noise and forces applied by the driver to other vehicle parts other than the seat. While the system effectively tracks CP movements and detects OPs, it cannot differentiate the precise cause of these shifts. While CP deviations from the (0,0) normal position are detected, the system cannot determine whether they result from torso movement, pelvic displacement, or reduced seat loading due to foot support on the floor.
To achieve near-perfect accuracy, integrating additional onboard systems, such as cameras for redundant monitoring or sensorized seat belts for torso position tracking, would be a valuable enhancement. Sensor fusion could significantly improve also the self-calibration function, which eventually requires the occupant to manually press an acknowledgment button in the existing prototype. Redundant monitoring could be leveraged to evaluate whether a detected OP is a false positive. If so, the system could automatically trigger self-calibration without requiring intervention from the test occupant.
The control system of the sensorized interface itself could also be improved for more efficient data acquisition. Future upgrades might include a more advanced microcontroller with integrated multicore processors, enabling multi-threading and providing memory for large datasets. Another key enhancement would involve applying low-pass filtering to the signals. In fact, increasing the sampling frequency nearly tenfold has led to significant oscillations in load cell signals, so filtering the sampled data directly would improve resolution and stabilize measurements.
Thanks to its adaptability, the developed seat interface is particularly well-suited for extensive experiments in SAE Level 4 and 5 vehicles, where the occupant may assume unconventional positions while engaging in non-driving activities. In the next phase of the research, the dataset will be expanded by incorporating more participants, positions, and scenarios to support further development of the device. Future work will also focus on the interaction between a test dummy, the restraint systems, and the sensorized seat. Testing with dummies will enable to investigation also crash scenarios. Once completed, a legislative initiative will also be introduced.

Author Contributions

Conceptualization, methodology, experiments, data curation, writing original draft and editing, A.V.; equipment design, construction, software, experiments and writing review, A.P., C.G. and H.R.; conceptualization and methodology J.K., A.Z. and J.L.d.S.; supervision and writing review, F.L. All authors have read and agreed to the published version of the manuscript.

Funding

This research received no external funding.

Data Availability Statement

The raw data supporting the conclusions of this article will be made available by the authors on request.

Acknowledgments

The authors are very grateful for the support provided by the Aero Club of Modena, Italy, and for giving us the privilege of using the runway for the experiments.

Conflicts of Interest

The authors declare no conflicts of interest.

Appendix A. Reading Thread Code

  • 1. #include <Wire.h>
    2. #include  <Adafruit_Sensor.h>
    3. #include  <Adafruit_BNO055.h>
    4.
    5. Adafruit_BNO055 bno = Adafruit_BNO055(55);
    6.
    7. // Declaration of the pins of the amplifiers
    8. int const ampPin1 = A0; // analog pin of amplifier 1
    9. int const ampPin2 = A1; // analog pin of amplifier 2
    10. int const ampPin3 = A2; // analog pin of amplifier 3
    11. int const ampPin4 = A3; // analog pin of amplifier 4
    12.
    13. // definition of the milliseconds counter and sampling rate
    14. unsigned long  previousMillis = 0;
    15. const long  interval = 20;
    16.
    17. void setup() {
    18. Serial.begin(250000);  // set of serial communication speed
    19.
    20. Wire.setClock(100000); // set of sampling rate of IMU data at 400 KHz
    21.
    22. // BNO055 sensor initialization
    23. if (!bno.begin()) {
    24. Serial.println(“Ooops, no BNO055 detected ... Check your wiring or I2C ADDR!”);
    25. while (1); // stop here if the sensor is not detected
    26. }
    27.
    28. delay(1000);
    29. bno.setExtCrystalUse(true);
    30. }
    31.
    32. void loop() {
    33. unsigned long currentMillis = millis(); // definition time in milliseconds
    34.
    35. if (currentMillis - previousMillis >= interval) {
    36. previousMillis = currentMillis;
    37.
    38. // read sensor and send data
    39. // read data from amplifiers
    40. float ampVal1 = analogRead(ampPin1);
    41. float ampVal2 = analogRead(ampPin2);
    42. float ampVal3 = analogRead(ampPin3);
    43. float ampVal4 = analogRead(ampPin4);
    44.
    45. // read acceleration data from BNO055
    46. imu::Vector<3> acceleration = bno.getVector(Adafruit_BNO055::VECTOR_ACCELEROMETER);
    47. float accX = acceleration.x();
    48. float accY = acceleration.y();
    49. float accZ = acceleration.z();
    50.
    51. // data send in ASCII format
    52. Serial.print(“AA,”); // fix header in ASCII
    53.
    54. // send data of the 4 amplifiers
    55. Serial.print(ampVal1, 2); Serial.print(“,”);
    56. Serial.print(ampVal2, 2); Serial.print(“,”);
    57. Serial.print(ampVal3, 2); Serial.print(“,”);
    58. Serial.print(ampVal4, 2); Serial.print(“,”);
    59.
    60. // send dat of the 3 accelerations
    61. Serial.print(accX, 2); Serial.print(“,”);
    62. Serial.print(accY, 2); Serial.print(“,”);
    63. Serial.print(accZ, 2);
    64.
    65. // adding a line terminator to indicate the end of the packet
    66. Serial.println();
    67. }
    68. }

Appendix B. Processing Thread Code

  • 1. import serial
    2. import time
    3. import csv
    4. import threading
    5. from pynput import keyboard
    6. from collections import deque
    7. import tkinter as tk
    8. # Configure serial communication
    9. serial_com = serial.Serial(‘COM2’, 250000, timeout = 0.02)
    10. # (Serial Port, Baudrate, Reading time step synchronized with Arduino)
    11.
    12. # Initial time count
    13. start_time = time.perf_counter() # Time reference
    14.
    15. try:
    16. print(“Reading data”)
    17. while True:
    18. # Get current time
    19. current_time = time.time()
    20.
    21. # Convert in h, m, s format
    22. gmt_time = time.strftime(‘%H:%M:%S’, time.localtime(current_time))
    23. try:
    24. # Read a line from serial port
    25. serial_line = serial_com.readline().decode(‘utf-8’).strip() # Decodify serial line
    26.
    27. if serial_line:
    28. # Divide data by comma separator
    29. data = serial_line.split(“,”)
    30.  if data[0] == “AA”: # Verify header presence and read float variables
    31. ampVal1 = float(data[1])
    32. ampVal2 = float(data[2])
    33. ampVal3 = float(data[3])
    34. ampVal4 = float(data[4])
    35. accX = float(data[5])
    36. accY = float(data[6])
    37. accZ = float(data[7])
    38.
    39. # Computation based on received data
    40. kg1 = (ampVal1 - 512) * (500/512)
    41.  kg2 = (ampVal2 - 512) * (500/512)
    42.  kg3 = (ampVal3 - 512) * (500/512)
    43.  kg4 = (ampVal4 - 512) * (500/512)
    44. m_12, m_34 = kg1 + kg2, kg3 + kg4
    45. mtot = m_12 + m_34
    46. yg = -(kg1 * y13 + kg2 * y24 + kg3 * y13 + kg4 * y24)/mtot
    47. xg = (m_12 * x12 + m_34 * x34)/mtot
    48. CPX, CPY = xg - shiftx, yg - shifty
    49. AX, AY = accX * scalex, accY * scaley
    50.
    51. # Loop to define monitored position
    52. if CPX > (AX + toll_1):
    53.  pos = 1 # Forward reclined
    54.  elif CPY > (AY + toll_2):
    55. pos = 2 # Left reclined
    56. elif CPY < (AY - toll_3):
    57. pos = 3 # Right reclined
    58. else:
    59. pos = 0 # Normal position
    60.
    61. # elapsed time estimated in ms
    62. elapsed_time = int((time.perf_counter() - start_time) * 1000)
    63.
    64. # Update queue with new values
    65. recent_xg_static.append(xg)
    66. recent_yg_static.append(yg)
    67. recent_xg_dinamic.append(xg)
    68. recent_yg_dinamic.append(yg)
    69. recent_accX.append(accX)
    70. ecent_accY.append(accY)
    71.
    72. # Start automatic calibration after 30 s
    73.  if not calibrated and elapsed_time > 30 * 1000:
    74. # * 1000 because system uses ms
    75. print(“Automatic calibration ON ”)
    76. reset_pressure_center()
    77.
    78. # run scale function after 1 min
    79. if elapsed_time >= 60 * 1000:
    80. scale()
    81.
    82. # Update data for graphical interface
    83.  with lock:
    84. CP_values[“CPX”] = CPX
    85. CP_values[“CPY”] = CPY
    86.
    87.
    88. # Store data in buffer to later write them on CSV
    89.  with buffer_lock:
    90. data_buffered.append([gmt_time, elapsed_time, xg, yg, CPX, CPY, kg1, kg2, kg3, kg4, accX, accY, accZ, ACCX, ACCY, pos, mtot])
    91.
    92.  # Print data in visual monitor
    93.  print(f{‘Time’:<10} {‘elapsed_time’:<10} {‘xg’:<10} {‘yg’:<10} {‘CPX’:<10} {‘CPY’:<10} {‘kg1’:<10} {‘kg2’:<10} {‘kg3’:<10} {‘kg4’:<10} {‘accX’:<10} {‘accY’:<10} {‘ac-cZ’:<10} {‘ACCX’:<10} {‘ACCY’:<10} {‘Pos’:<10} {‘Total Mass’:<10})
    94.
    95. print(f{gmt_time:<10} {elapsed_time:<10.2f} {xg:<10.2f} {yg:<10.2f} {CPX:<10.2f} {CPY:<10.2f} {kg1:<10.2f} {kg2:<10.2f} {kg3:<10.2f} {kg4:<10.2f} {accX:<10.2f} {accY:<10.2f} {accZ:<10.2f} {ACCX:<10.2f} {ACCY:<10.2f} {pos:<10} {mtot:<10.2f})
    96.
    97. except (ValueError):
    98. print(“values conversion failed”)
    99.
    100. except KeyboardInterrupt:
    101. print(“Program quitted ”)
    102. finally:
    103. serial_com.close()
    104. print(“Serial connection quitted ”)

Appendix C. Calibration Thread Code

  • 1. # Initilized variables for calibration process
    2. shiftx_static = 0
    3. shifty_static = 0
    4. shiftx_dinamic = 0
    5. shifty_dinamic = 0
    6. scalex = 0
    7. scaley = 0
    8. scaled = False
    9.
    10. # Queues for storage of last useful values for system calibration
    11. recent_xg_static = deque(maxlen = 500)
    12. # Queue for xg (max 500 elements sampled at 50 Hz)
    13. recent_yg_static = deque(maxlen = 500)
    14. # Queue for yg (max 500 elements sampled at 50 Hz)
    15. recent_xg_dinamic = deque(maxlen = 3000)
    16. # Queue for xg_pred (max 3000 elements sampled at 50 Hz)
    17. recent_yg_dinamic = deque(maxlen = 3000)
    18. # Queue for yg_pred (max 3000 elements sampled at 50 Hz)
    19. recent_accX = deque(maxlen = 3000)
    20. # Queue for accX of 3000 elements
    21. recent_accY = deque(maxlen = 3000)
    22. # Queue for accY of 3000 elements
    23. # Function to reset the center of pressure considering the average of the data stored in the queues
    24. def reset_pressure_center() :
    25. global shiftx, shifty, shiftx_pred, shifty_pred
    26.
    27. if recent_xg_static and recent_yg_static:
    28. # Check available data for xg and yg
    29. shiftx = -(sum(recent_xg_static)/len(recent_xg_static))
    30. # Calculate the average of xg
    31. shifty = -(sum(recent_yg_static)/len(recent_yg_static))
    32. # Calculate the average of yg
    33. else:
    34. print(“CP reset failed”)
    35.
    36. # Function to scale accelerations
    37. def scale():
    38. global scalex, scaley, scaled
    39.
    40. if len(recent_xg_dinamic) > 0 and len(recent_xg_dinamic) > 0 and len(recent_accX) > 0 and len(recent_accY) > 0:
    41. # Necessary condition to execute the loop
    42. # Calculating the absolute values of CP components and accelerations on X and Y axis
    43. abs_xg = [abs(x) for x in recent_xg_dinamic]
    44. abs_yg = [abs(y) for y in recent_yg_dinamic]
    45. abs_accX = [abs(x) for x in recent_accX]
    46. abs_accY = [abs(y) for y in recent_accY]
    47.
    48. # Calculating the scale factors on X and Y axis
    49. scalex = -(max(abs_xg) - min(abs_xg))/(max(abs_accX) - min(abs_accX))
    50. scaley = -(max(abs_yg) - min(abs_yg))/(max(abs_accY) - min(abs_accY))
    51. scaled = True # Flag for execution
    52. else:
    53. print(“scale process failed”)
    54.
    55.
    56. # Function to manage the manual reset of the center of pressure
    57. def z_press(key):
    58. try:
    59. if key.char == ‘z’: # Pressing ‘z’ for manual recalibration
    60. thread_c = threading.Thread(target = reset_pressure_center)
    61. # Selecting the function to enable the recalibration thread
    62. thread_c.start()
    63. # Starting the manual recalibration thread
    64. except AttributeError:
    65. pass
    66.
    67.
    68. k_listen = keyboard.Listener(z_press = z_press)
    69. # Keyboard listener definition
    70. k_listen.start() # start to listen

Appendix D. Graphical User Interface Thread

  • 1. # Shared variables for the Graphical Interface
    2. CP_values = {“CPX”: 0.0, “CPY”: 0.0}
    3. pos = 0 # Position initialized
    4. lock_D = threading.Lock() # Thread D lock for synchronization of data access
    5.
    6. # Function for GI startup
    7. def run_GUI():
    8. def update_CP():
    9. #Function for the visualization in real time of CPX and CPY values
    10. # Access data through lock
    11. with lock_D:
    12. value1.set(f“CPX: {CP_values[‘CPX’]:.2f})
    13. value2.set(f“CPY: {CP_values[‘CPY’]:.2f})
    14.
    15. def update_alarm(): #function for red or green light
    16. current_pos = pos
    17. # Change colour of the light based on the pos value
    18. if current_pos == 0:
    19. alarm_area.itemconfig(light, fill = “green”)
    20. status_label.config(text = “OK: Normal position”, fg = “green”)
    21. #Green light for Normal Position
    22. else:
    23. alarm_area.itemconfig(light, fill = “red”)
    24. status_label.config(text = f“Warning: Position {current_pos}, fg = “red”) #Red light for Out of Position
    25.
    26. # Create the main window
    27. window = tk.Tk()
    28. window.title(“Monitoring in real time”)
    29.
    30. # Graphical area for the alarm
    31. alarm_area = tk.Canvas(window, width = 100, height = 100) #Window dimension
    32. alarm_area.pack(pady = 20) #Set of vertical border
    33. light = alarm_area.create_oval(20, 20, 80, 80, fill = “gray”, outline = “black”)
     #Dimension and base colour of led light
    34.  # Labels to visualize the values
    35. tk.Label(window, textvariable = value1, font = (“Helvetica”, 14)).pack()
    36. tk.Label(window, textvariable = value2, font = (“Helvetica”, 14)).pack()
    37. status_label = tk.Label(window, text = “Stato: ---”, font = (“Helvetica”, 14))
    38. status_label.pack(pady = 10)
    39.
    40. # Variables for CP components
    41. value1 = tk.StringVar()
    42. value2 = tk.StringVar()
    43.
    44. window.after(100, update_CP) # Update loads after 100ms
    45. window.after(20, update_alarm) # Update alarm after 20ms
    46. # Start of GI and alarm update
    47. update_CP()
    48. update_alarm()
    49.
    50. # Start loop
    51. window.mainloop()
    52. # Start thread
    53. thread_D = threading.Thread(target = run_GI, daemon = True)
    54. thread_D.start()

Appendix E. Data Save Thread

  • 1. # Buffer list to store data
    2. data_buffered = [] # Initialize the list
    3. list_size = 500 # Definition of the list with dimension of 500 values
    4. fill_buffer= True # Control flag for buffer filling
    5.
    6. # Lock for synchronzation buffer access
    7. save_lock = threading.Lock()
    8.
    9. # Function to save data on csv
    10. def CSV():
    11.
    12. global data_buffered # Declaration of a global variable
    13. while fill_buffer or len(data_buffered) > 0:
    14. # Continue running program if no data are available in buffer
    15. save_list = []
    16.
    17. # Read a list from the buffer without thread overlap
    18. with save_lock:
    19. if len(data_buffered) >= list_size:
    20. # If buffer has enough values, stored data
    21. save_list = data_buffered[:list_size]
    22. # Copy a list of data reading from the data_buffered
    23. data_buffered = data_buffered[list_size:]
    24. # Empties the list on the buffer once copied
    25.
    26. # Write the list in CSV
    27. if save_list: # If there are data to save
    28. with open(‘File.csv’, mode = ‘a’, newline = ‘ ’) as file:
    # (Open a named file, append mode to add data without overwriting and without empty new lines)
    29. data_to_write = csv.writer(file) # write data in a CSV file
    30. data_to_write.writerows([datum for datum in save_list])
    31. # Write data list adding each element of save_list and a line in the CSV
    32.
    33.
    34. time.sleep(0.1)
    35. # Pause to reduce the frequency of runs
    36.
    37. # Start the save thread in the background
    38. thread_E = threading.Thread(target = CSV, daemon = True)
    39. # (Function to execute, daemon to kill thread_E when main is killed)
    40. 
    41. thread_E.start() # Starting the thread for saving data

Appendix F. Data Conversion Code

  • 1. import pandas  as pd
    2. 
    3.  # Name of CSV and Excel files
    4. csv_file = “File.csv”
    5. excel_file = “File.xlsx”
    6.
    7. # Define column headers
    8. column_names = [“Time”, “timer”, “CPX”, “CPY”, “kg1”, “kg2”, “kg3”, “kg4”,
    9. “accX”, “accY”, “AX”, “AY”, “Pos”, “Total Mass”]
    10.
    11. try:
    12. # Read CSV file as text and remove square brackets
    13. with open(csv_file, ‘r’) as file:
    14. data = []
    15. for line in file:
    16. line = line.strip() # Remove initial/final white spaces
    17. # Separate values, also handling commas in numbers
    18. values = line.split(‘,’)
    19. # Removes any extra spaces and separates the time from the numbers
    20. data.append([value.strip().replace(“’”, “”) for value in values])
    21.
    22. # Convert data to a DataFrame
    23. data_frame = pd.DataFrame(data)
    24.
    25. # Add headers
    26. data_frame.columns = column_names
    27.
    28. # Convert each column to numeric, except the first one (Time) which is string
    29. for col_name in data_frame.columns[1:]: # Skip first column ‘Time’
    30. data_frame[col_name] = pd.to_numeric(data_frame[col_name], errors = ‘coerce’) # Convert to numeric, replace errors with NaN
    31.
    32. # Save as Excel file
    33. data_frame.to_excel(excel_file, index = False)# Save without including the index
    34.
    35. print(f“File successfully converted: {excel_file})
    36. except FileNotFoundError as e:
    37. print(f“Error: {e})

References

  1. Mutlag, A.H.; Mahdi, S.Q.; Salim, O.N.M. A Comparative Study of an Artificial Intelligence-Based Vehicle Airbag Controller. In Proceedings of the 2022 IEEE 18th International Colloquium on Signal Processing & Applications, Selangor, Malaysia, 12 May 2022. [Google Scholar] [CrossRef]
  2. Machens, K.U.; Kübler, L. Dynamic Testing with Pre-Crash Activation to Design Adaptive Safety Systems. In Proceedings of the 27th International Technical Conference on the Enhanced Safety of Vehicles (ESV), Yokohama, Japan, 3–6 April 2023; Available online: https://www-esv.nhtsa.dot.gov/Proceedings/27/27ESV-000067.pdf (accessed on 6 May 2024).
  3. Lebarbé, M.; Potier, P.; Baudrit, P.; Petit, P.; Trosseille, X.; Vallancien, G. Thoracic Injury Investigation Using PMHS in Frontal Airbag Out-of-Position Situations. Stapp Car Crash J. 2005, 49, 323–342. [Google Scholar] [CrossRef] [PubMed]
  4. Maxeiner, H.; Hahn, M. Airbag-Induced Lethal Cervical Trauma. J. Trauma Acute Care Surg. 1997, 42, 1148–1151. [Google Scholar] [CrossRef] [PubMed]
  5. Potula, S.R.; Solanki, K.N.; Oglesby, D.L.; Tschopp, M.A.; Bhatia, M.A. Investigating occupant safety through simulating the interaction between side curtain airbag deployment and an out-of-position occupant. Accid. Anal. Prev. 2009, 49, 392–403. [Google Scholar] [CrossRef] [PubMed]
  6. Yoganandan, M.; Pintar, F.A.; Zhang, J.; Gennarelli, T.A. Lateral impact injuries with side airbag deployments—A descriptive study. Accid. Anal. Prev. 2007, 39, 22–27. [Google Scholar] [CrossRef] [PubMed]
  7. Depottey, T.A.; Schneider, D.W. Airbag Cushion with Adaptive Venting for Reduced Out-of-Position Effects. U.S. Patent 7,261,319, 28 August 2007. [Google Scholar]
  8. Farmer, M.E.; Jain, A.K. Occupant classification system for automotive airbag suppression. In Proceedings of the IEEE Com-puter Society Conference on Computer Vision and Pattern Recognition, Madison, WI, USA, 18–20 June 2003. [Google Scholar] [CrossRef]
  9. Hall, I.; Rao, M.K.; Ryan, S. Airbag System for Out-of-Position Occupant Protection and Adaptive Venting. U.S. Patent 7,448,646, 11 November 2008. [Google Scholar]
  10. Schneider, D.W.; Rose, L.D. Airbag Adaptive Venting for Out-of-Position Occupants. U.S. Patent 7,770,926, 10 August 2010. [Google Scholar]
  11. Bergasa, L.M.; Nuevo, J.; Sotelo, M.A.; Barea, R.; Lopez, M.E. Real-time system for monitoring driver vigilance. IEEE Trans. Intell. Transp. Syst. 2006, 7, 63–77. [Google Scholar] [CrossRef]
  12. Borghi, G.; Venturelli, M.; Vezzani, R.; Cucchiara, R. Poseidon: Face-from-depth for driver pose estimation. In Proceedings of the IEEE Conference on Computer Vision and Pattern Recognition, Honolulu, HI, USA, 21–26 July 2017. [Google Scholar] [CrossRef]
  13. Dong, Y.; Hu, Z.; Uchimura, K.; Murayama, N. Driver Inattention Monitoring System for Intelligent Vehicles: A Review. IEEE Trans. Intell. Transp. Syst. 2011, 12, 596–614. [Google Scholar] [CrossRef]
  14. Driver Attention Monitor (Honda Sensing® Feature). Available online: https://www.hondainfocenter.com/2024/CR-V/Feature-Guide/Interior-Features/Driver-Attention-Monitor/ (accessed on 8 March 2024).
  15. A Moment More Attention: Mercedes-Benz Presents “Awake”. Available online: https://media.mercedes-benz.com/article/2798d797-85c0-45bc-aa01-e12fcbc5745f (accessed on 8 March 2024).
  16. Mazda Driver Attention Alert. Available online: https://www.mazdausa.com/static/manuals/2020/cx-30/contents/05281103.html (accessed on 16 April 2025).
  17. Volvo Driver Alert. Available online: https://www.volvocars.com/en-eg/support/car/xc60/article/f57bafffba0c0468c0a8015174f226d8 (accessed on 8 March 2024).
  18. J3016_201401; Taxonomy and Definitions for Terms Related to On-Road Motor Vehicle Automated Driving Systems. SAE: Warrendale, PA, USA, 2014; pp. 1–16. Available online: https://www.sae.org/standards/content/j3016_201401/ (accessed on 6 May 2024).
  19. Kyung, G.; Nussbaum, M.A. Driver Sitting Comfort and Discomfort (part II): Relationships with and Prediction from Interface Pressure. Int. J. Ind. Ergon. 2008, 38, 526–538. [Google Scholar] [CrossRef]
  20. Na, S.; Lim, S.; Choi, H.S.; Chung, M.K. Evaluation of driver’s discomfort and postural change using dynamic body pressure distribution. Int. J. Ind. Ergon. 2005, 35, 1085–1096. [Google Scholar] [CrossRef]
  21. Ito, K.; Inayoshi, M.; Enomoto, A.; Fujii, H. Vehicle Tilt Detecting Apparatus and Seat Load Detecting Apparatus Using the Same. U.S. Patent US8296099B2, 23 October 2009. [Google Scholar]
  22. Inayoshi, M.; Enomoto, A.; Fujii, H. Apparatus and Method for Determining Impact on Vehicle and Apparatus for Warning Impact on Vehicle. U.S. Patent US8328276B2, 11 December 2009. [Google Scholar]
  23. Schousek, T.J. Vehicle Occupant Restraint with Seat Pressure Sensor. U.S. Patent 5,474,327, 12 December 1995. [Google Scholar]
  24. White, C.W.; Behr, L.W. Passenger Out-of-Position Sensor. U.S. Patent 5,071,160, 10 December 1991. [Google Scholar]
  25. Toshiaki Ishida, T.; Ogasawara, H. Load Detection Structure for Vehicle Seat. JP Patent JP3904913B2, 7 November 2001. [Google Scholar]
  26. Yanagi, E. Load Sensor and Seat Weight Measuring Apparatus with a Plurality of Strain Gauges. U.S. Patent US7055365B2, 6 June 2002. [Google Scholar]
  27. Osmer, W.; Wills, M.; Blakesley, P. Vehicle Occupant Position Detector and Airbag Control System. U.S. Patent EP1202876B1, 28 May 1999. [Google Scholar]
  28. Martínez, M.V.; Del Campo, I.; Echanobe, J.; Basterretxea, K. Driving behavior signals and machine learning: A personalized driver assistance system. In Proceedings of the IEEE 18th International Conference on Intelligent Transportation Systems, Las Palmas de Gran Canaria, Spain, 15–18 September 2015. [Google Scholar]
  29. Zhang, Y.; Lin, W.C.; Chin, Y.K.S. A pattern-recognition approach for driving skill characterization. IEEE Trans. Intell. Transp. Syst. 2010, 11, 905–916. [Google Scholar] [CrossRef]
  30. Yaniger, S.I. Force sensing resistors™: A review of the technology. In Proceedings of the Electro International Conference, New York, NY, USA, 16–18 April 1991; pp. 666–668. [Google Scholar] [CrossRef]
  31. Vergnano, A.; Leali, F. Out of Position Driver Monitoring from Seat Pressure in Dynamic Maneuvers. In Proceedings of the 2nd International Conference on Intelligent Human Systems Integration, San Diego, CA, USA, 7–10 February 2019. [Google Scholar] [CrossRef]
  32. Vergnano, A.; Leali, F. A methodology for out of position occupant identification from pressure sensors embedded in a vehicle seat. Hum. Intell. Syst. Integr. 2020, 2, 35–44. [Google Scholar] [CrossRef]
  33. Vergnano, A.; Muscio, A.; Leali, F. Sensor matrix robustness for monitoring the interface pressure between car driver and seat. In Proceedings of the 2nd International Conference on Human Systems Engineering and Design: Future Trends and Applications (IHSED 2019), Munich, Germany, 16–18 September 2019. [Google Scholar]
  34. Ng, D.; Cassar, T.; Gross, C.M. Evaluation of an intelligent seat system. Appl. Ergon. 1995, 26, 109–116. [Google Scholar] [CrossRef]
  35. Vergnano, A.; Piras, A.; Leali, F. Vehicle Seat with Occupant Detection System. IT Patent 102019000022221, 26 November 2019. [Google Scholar]
  36. Vergnano, A.; Piras, A.; Leali, F. Modular Car Seat for Monitoring the Pressure Distribution on Regions of Pan and Backrest. In Proceedings of the 3rd International Conference on Human Systems Engineering and Design, Pula, Croatia, 22–24 September 2020. [Google Scholar] [CrossRef]
  37. Vergnano, A.; Giorgianni, C.; Leali, F. Monitoring the Center of Gravity of a Vehicle Seat to Detect the Occupant Position. Designs 2024, 8, 44. [Google Scholar] [CrossRef]
  38. Severy, D.M.; Blaisdell, D.M.; Kerkhoff, J.F. Automotive seat design and collision performance. SAE Trans. 1976, 85, 2551–2565. [Google Scholar]
  39. Kathiresan, S.S.; Echempati, R. Structural Analysis and Design Modification of Seat Rail Structures in Various Operating Conditions; SAE Technical Paper 2020-01-1101; SAE: Warrendale, PA, USA, 2020. [Google Scholar]
  40. Sun, C.; Zhu, W. Design and Simulation Analysis of Automobile Seat Impact Detection System. Procedia Comput. Sci. 2004, 243, 224–234. [Google Scholar] [CrossRef]
  41. Uniform Provisions Concerning the Approval of Vehicles with Regard to the Seats, Their Anchorages and Any Head Restraints; Addendum 16: Regulation No. 17; United Nations Economic Commission for Europe: Geneva, Switzerland, 2002.
  42. National Highway Traffic Safety Administration, Department of Transportation. Title 49—Transportation, Subtitle B—Other Regulations Relating to Transportation, Chapter V—Part 571—Federal Motor Vehicle Safety Standards, 49 CFR 571.207. 2025. Available online: https://www.ecfr.gov/current/title-49/subtitle-B/chapter-V/part-571/subpart-B/section-571.207 (accessed on 16 April 2025).
  43. Whitney, D.E. Mechanical Assemblies: Their Design, Manufacture, and Role in Product Development; Oxford University Press: New York, NY, USA, 2004. [Google Scholar]
  44. Reed, M.P.; Ebert, S.M.; Jones, M.H.; Park, B.K. D. Occupant Dynamics During Crash Avoidance Maneuvers (No. DOT HS 812 997); United States Department of Transportation, National Highway Traffic Safety Administration: Washington, DC, USA, 2021. Available online: https://rosap.ntl.bts.gov/view/dot/54737 (accessed on 16 April 2025).
  45. Aero Club of Modena. Available online: https://aeroclubmodena.it/ (accessed on 23 April 2024).
Figure 1. Sensor interface: (a) complete CAD assembly, (b) details of the working principle, and (c) installation in an Audi A3 Sportback car.
Designs 09 00052 g001
Figure 2. Scheme of electronics wiring of the sensorized seat [37].
Designs 09 00052 g002
Figure 3. System calibration during the first 30 s and manual recalibration after occupant repositioning.
Designs 09 00052 g003
Figure 4. Tested positions and warnings in the static experiments in (0) normal position, (1) forward-reclined OP, (2) left-reclined OP, and (3) right-reclined OP.
Designs 09 00052 g004aDesigns 09 00052 g004b
Figure 5. Static test results for the first occupant.
Designs 09 00052 g005
Figure 6. The test track created on the runway of the Aero Club of Modena with steps 1 to 6 of the outward path colored in blue and steps 7 to 12 of the return path in green [37].
Designs 09 00052 g006
Figure 7. Driving tests in the normal position for the (a) first, (b) second, and (c) third drivers.
Designs 09 00052 g007
Figure 8. Driving tests in the forward-reclined OP for the (a) first, (b) second, and (c) third drivers.
Designs 09 00052 g008
Figure 9. Driving tests in left-reclined OP for the (a) first, (b) second, and (c) third drivers.
Designs 09 00052 g009
Figure 10. Driving tests in right-reclined OP for the (a) first, (b) second, and (c) third drivers.
Designs 09 00052 g010
Figure 11. Driving tests in the normal position for the (a) first, (b) second, and (c) third side occupants.
Designs 09 00052 g011aDesigns 09 00052 g011b
Figure 12. Driving tests in the forward-reclined OP for the (a) first, (b) second, and (c) third side occupants.
Designs 09 00052 g012aDesigns 09 00052 g012b
Figure 13. Driving tests in the left-reclined OP for the (a) first, (b) second, and (c) third side occupants.
Designs 09 00052 g013
Figure 14. Driving tests in the right-reclined OP for the (a) first, (b) second, and (c) third side occupants.
Designs 09 00052 g014aDesigns 09 00052 g014b
Figure 15. CP positions compensated by the scaled accelerations of the car, in the normal position (black), and forward-(red), left-(green), and right-reclined (blue) OPs, for the (ad) 1st, (bd) 2nd, and (cd) 3rd drivers, and for the (ap) 1st, (bp) 2nd, and (cp) 3rd passengers.
Designs 09 00052 g015aDesigns 09 00052 g015b
Table 1. Comparison of the features and relative pros and cons of the four previous prototypes and the current one.
1
16FRSs Proto
[31,32]
2
Pressure Mat
[33]
3
Modular Seat
[35,36]
4
4-Legs Proto
[37]
5
Current
Interface
Technology16 Force Sensing Resistors + IMUPolymeric piezoresistive foil + IMU52 load cells + IMU4 load cells + IMU4 load cells + IMU
Working PrincipleMonitoring pressure distribution and vehicle accelerationsMonitoring pressure distribution and vehicle accelerationsMonitoring forces and vehicle accelerations Monitoring centre of pressure and vehicle accelerationsMonitoring centre of pressure and vehicle accelerations
SensingNonlinearity, hysteresis, and driftNonlinearity, hysteresis, and driftLinear and fastLinear and fastLinear and fast
Data Frame Rate100 ms400 ms100 ms100 ms20 ms
Evaluation of pressure distributionLimited, on 16 small areasVery effective, on the whole surfaceLimited, monitoring resulting forcesNo No
Evaluation of forcesWith data processingWith data processingOn 13 relevant areas of the seatResulting forces of the whole driver-seat systemResulting forces of the whole driver-seat system
Posture ClassificationYes Yes Yes Yes Yes
Support to multiple vehicle platformsNo No No No Yes
FeasibilityEasy to embed the FSRs in the seatAir-proof layer not suitable for comfortable seatsGreat design effortNeed to redesign and homologate the seatReuse commercial seats
Table 2. Anthropometries of the three test occupants.
OccupantWeight [kg]Stature [m]
1781.75
2961.86
3621.68
Table 3. Tolerances set in the controller for triggering the detection of positions in the static tests.
PositionTolerance [mm]
145 (both sides)
215 (driver); 25 (passenger)
325 (driver); 15 (passenger)
Table 4. Tolerances set in the controller to trigger the detection of positions in the dynamic tests.
PositionTolerance [mm]
160 (both sides)
230 (both sides)
330 (both sides)
Table 5. Positions identification for the three drivers using the previous 4-legs prototype, and for the three individuals acting as drivers or passengers using the new sensorized interface.
Test0 Pos1 Pos2 Pos3 Pos
4-LegsInterface4-LegsInterface4-LegsInterface4-LegsInterface
Individ.DriverDriverPassengerDriverDriverPassengerDriverDriverPassengerDriverDriverPassenger
186%86%97%99%90%95%51%60%89%73%85%47%
289%88%88%100%90%94%52%51%79%84%79%65%
392%83%98%94%94%92%45%52%84%76%87%47%
Disclaimer/Publisher’s Note: The statements, opinions and data contained in all publications are solely those of the individual author(s) and contributor(s) and not of MDPI and/or the editor(s). MDPI and/or the editor(s) disclaim responsibility for any injury to people or property resulting from any ideas, methods, instructions or products referred to in the content.

