Article

Modeling and Research of the Process of Bench Tests of Plunger Hydraulic Cylinders with Energy Recovery

Agribusiness Faculty, Don State Technical University, 1, Gagarin Sq., Rostov-on-Don 344003, Russia
*
Author to whom correspondence should be addressed.
Designs 2025, 9(3), 53; https://doi.org/10.3390/designs9030053
Submission received: 15 March 2025 / Revised: 23 April 2025 / Accepted: 27 April 2025 / Published: 29 April 2025
(This article belongs to the Topic Digital Manufacturing Technology)

Abstract

The practice of operating hydraulic machines and equipment shows that failures can occur earlier than the specified lifespan. At the same time, at the stage of carrying out strength calculations of the designed machines and equipment, significant safety margins are incorporated into parts and units. That is, calculated machine lifespans often exceed actual values. Accurate data require full-scale lifespan testing or observations of operation. However, resource tests are economically expensive, since they require a significant amount of energy, and, as a result, lead to a negative impact on the environment. It is possible to level out the listed shortcomings during resource tests by using energy-efficient and energy-saving technologies, such as energy recovery. This study enhances energy efficiency and assesses engineering systems during equipment design. In particular, we present a hydromechanical drive design for testing reciprocating hydraulic machines. The study analyzes energy-saving and energy recovery methods during operation. On the basis of the analysis and previously conducted studies, we developed a mathematical model for hydraulic equipment testing. The developed model is based on the volumetric stiffness theory, enabling analysis of the design and functional characteristics of test stand components on their dynamic behavior and energy efficiency.

1. Introduction

In the modern world, the problem of high energy prices and threats to environmental safety is particularly acute. In this regard, it is extremely important to develop and implement innovative technologies aimed at improving energy efficiency and minimizing harm to nature [1,2]. One of the most common ways to reduce energy consumption by technological systems and equipment is to increase the efficiency of individual elements or use methods to restore [3] and return [4] energy lost during operation.
Scientific investigations consider energy efficiency and energy saving issues in various ways. This topic is especially important at the stage of the technological machinery and equipment design [5]. In mechanical engineering, scientists pay great attention to analyzing the current state and development of structural design issues. Especially important at the design stage is the consideration of the theory and methods of optimization [6]. Conduction of tests, allowing us to estimate one of the main parameters of details, junctions, systems, and machines’ quality—reliability, is typical for this stage [7].
A hydraulic drive, as a complex technical system, requires supplementary loads during testing. This simulates external forces acting on the system. To provide the load, additional sources that consume working fluid, such as dissipative and inertial forces, are used. This method of loading incurs significant energy costs due to inefficiency in useful work conversion. Therefore, it is important to incorporate an energy recovery system in the design of the test bench. Then the test bench method will not only speed up the testing process, but also enable partial energy recovery. In general, in modern mechanical engineering, regenerative drive designs are commonly used. For example, the authors of [8] use energy recovery in machine and equipment drives not only to partially recover energy but also to enhance overall efficiency. Since large energy losses are caused by pumps during unloading and motors operating with low efficiency, which is the most energy-consuming for hydraulic drive systems consisting of several motor pumps, to solve this problem, the authors proposed a design method in which motors and pumps are selected from the relevant catalogs of available components. Of course, the catalogs have a limited list of motors and pumps, but the results of testing show that the use of this method reduces energy consumption in the operational cycle by 26.97%. Another striking example of solving the problem of high energy costs in drives is the use of a built-in hydraulic accumulator, functioning as an energy storage device in tandem with asymmetric hydraulic cylinders functioning as a digital converter [9]. Such a drive design allows for the reduction in energy losses and dynamic loads on the prime mover. However, it is possible to achieve significantly higher efficiency of the energy recovery process by introducing an additional power unit (electric motor generator, battery, inverter and AC to DC converter, and sometimes also an electric double-layer capacitor) into the hydraulic drive design [10,11].
The scientific literature describes situations where a decrease in the mass of potential energy makes it possible for hydraulic mechanisms to operate in engine mode, while electrical equipment acts as a generator controlled by frequency converters [12,13]. Investigations of systems for hydraulic energy recovery have been made in automotive engineering in order to apply it in hybrid cars. Combination of an internal combustion engine (ICE) and energy accumulators has great potential in improving the performance standards of cars and lowering petrol consumption and the wearing of brake systems.
Some studies describe an analytical model of hydraulic energy recovery, including an accumulator, oil tank, a pump/motor of variable volume, connecting piping, and fly wheel used for the simulation of vehicle’s inertness. The integration algorithm is used for a simultaneous solution of control levels and prediction of the system efficiency. Such variables as pressure and temperature of the accumulator, pump/motor momentum, efficiency coefficient (η), pressure losses, and rotation rate of the fly wheel as the time function are predicted. After calculation of system capacity variables, it is easy to determine power losses and efficiency of the back drive [14,15,16,17].
Long work on finding and analysis of materials devoted to life tests, particularly energy recovery, has confirmed the fact of an insufficient level of development and highlighting of this question [18,19]. Therefore, the aim of this study is to improve the calculation theory of the hydromechanical drive of test rigs for reciprocating hydraulic machines via an energy recovery scheme.
The scientific novelty of the study lies in the application of the method for assessing dynamic characteristics at the design stage and in the developed method to evaluate the energy efficiency of a test bench for plunger-type hydraulic cylinders with energy recovery.

2. Materials and Methods

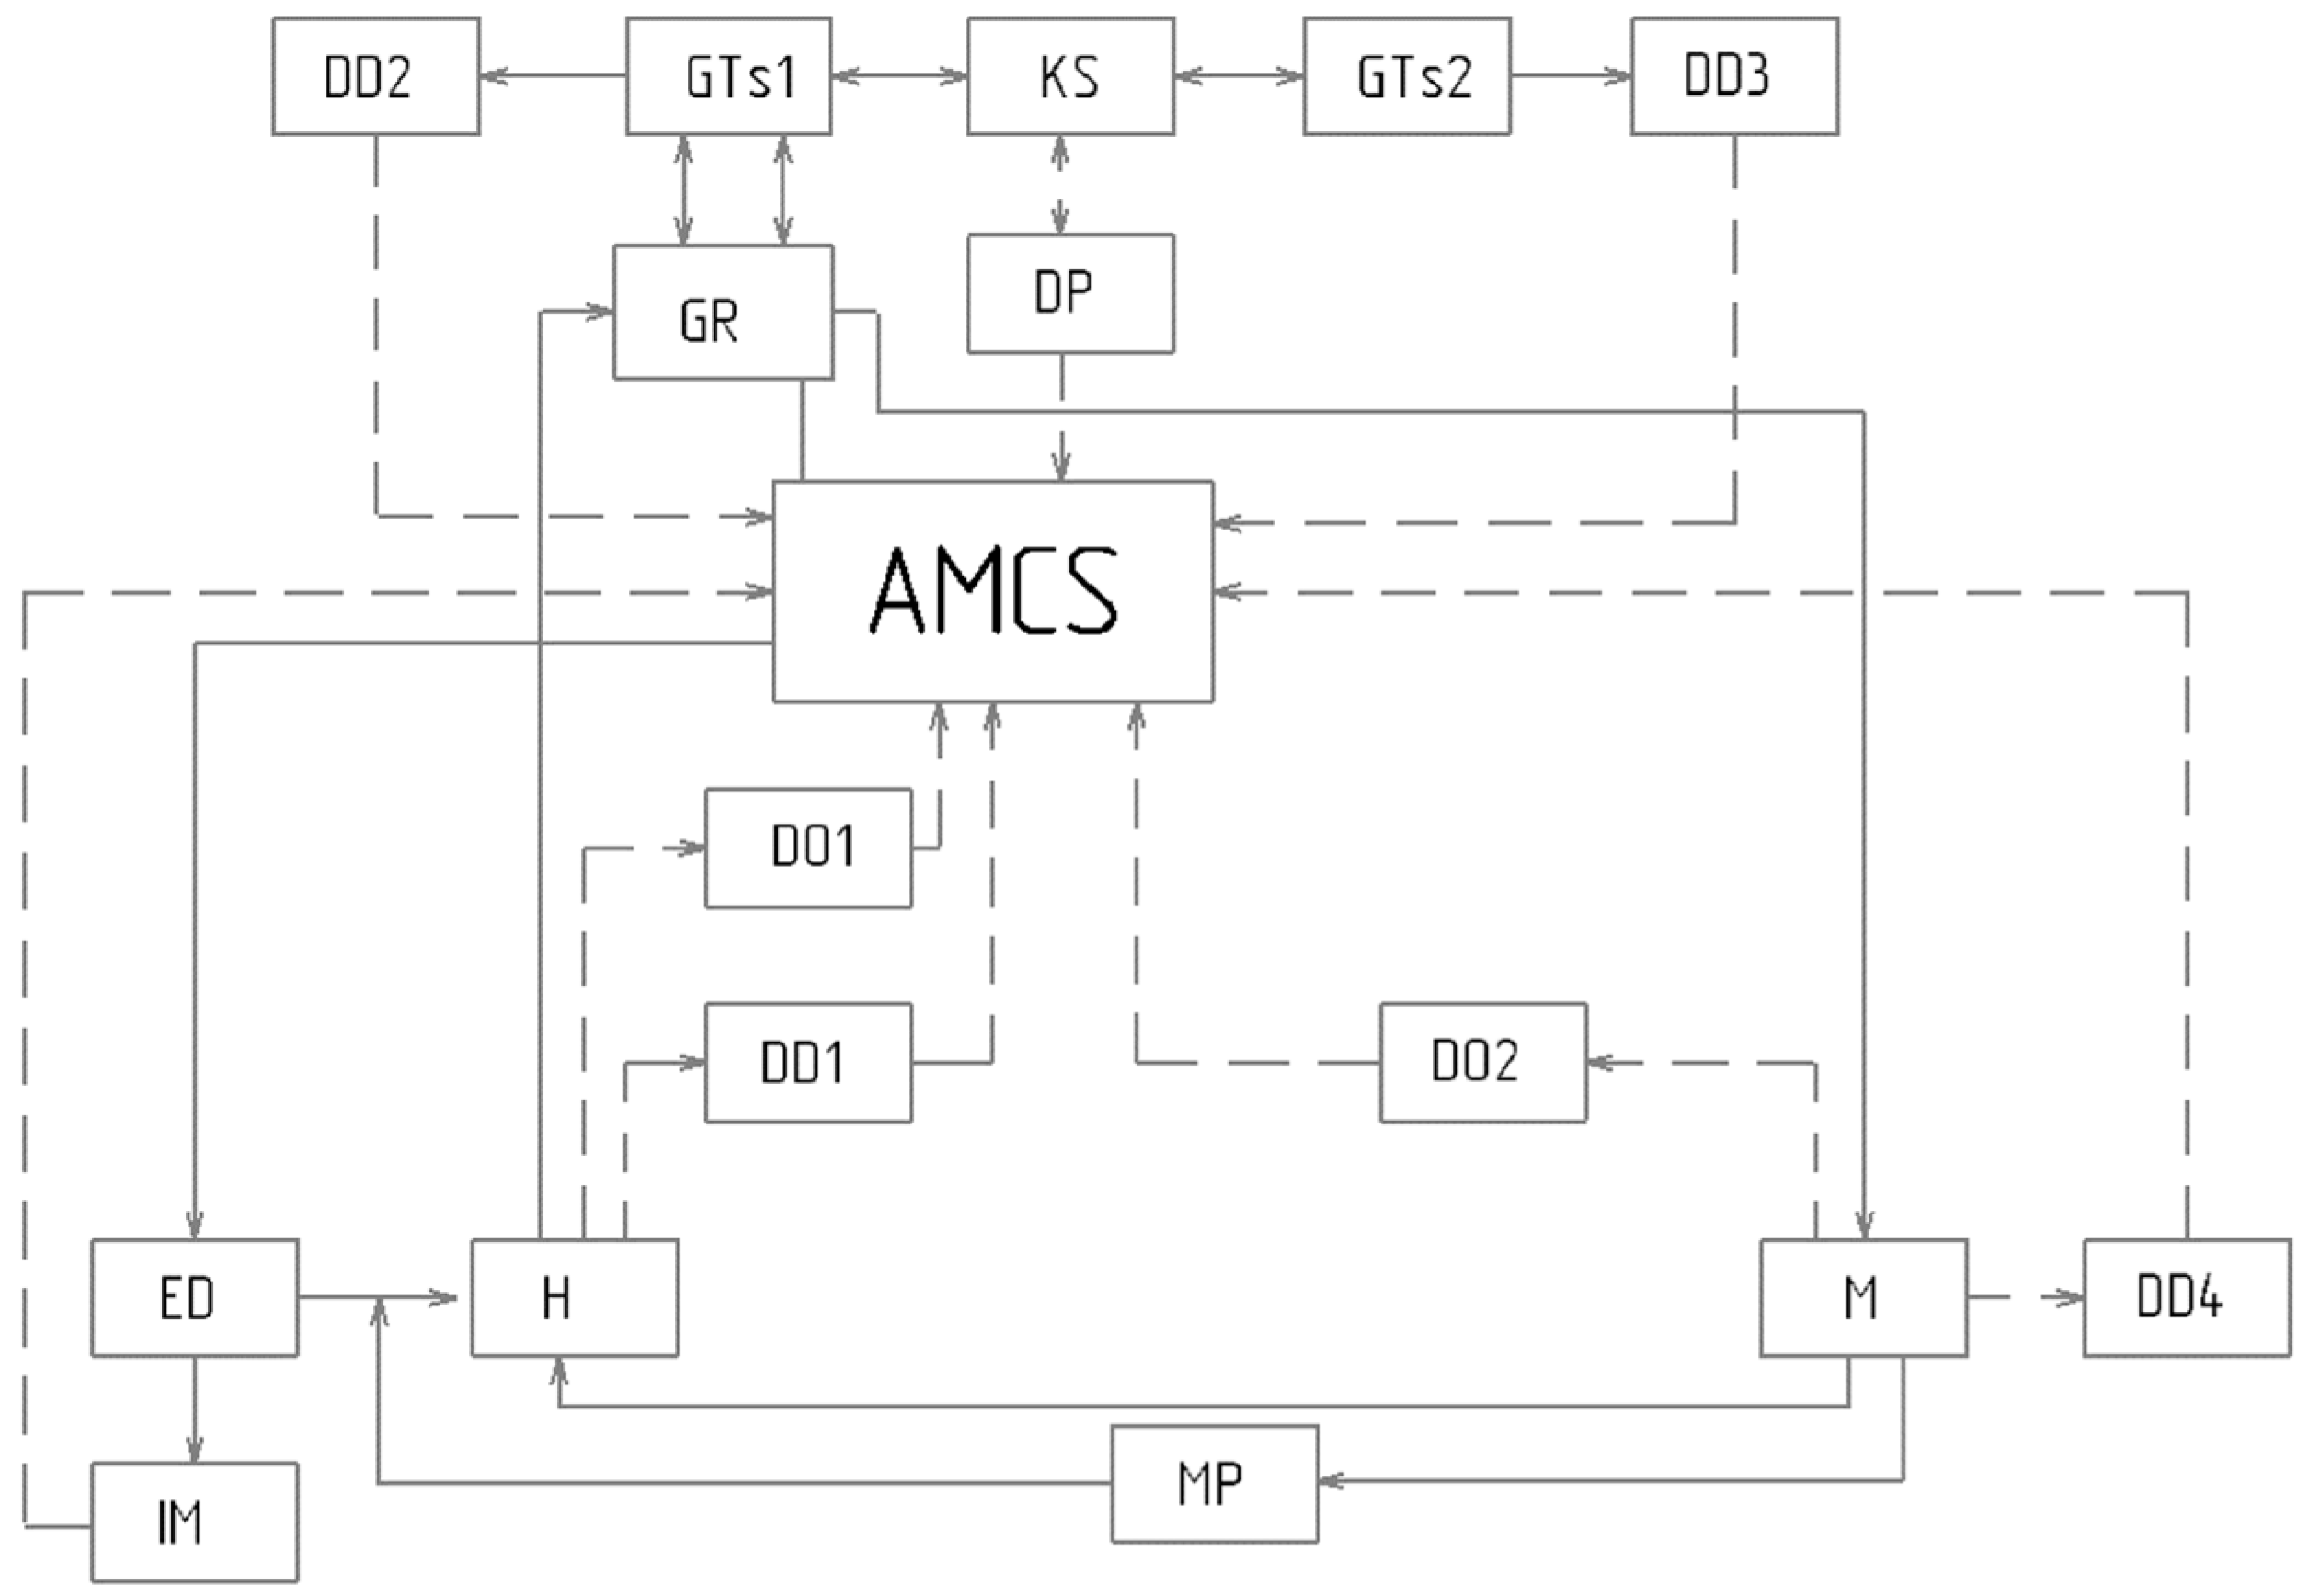
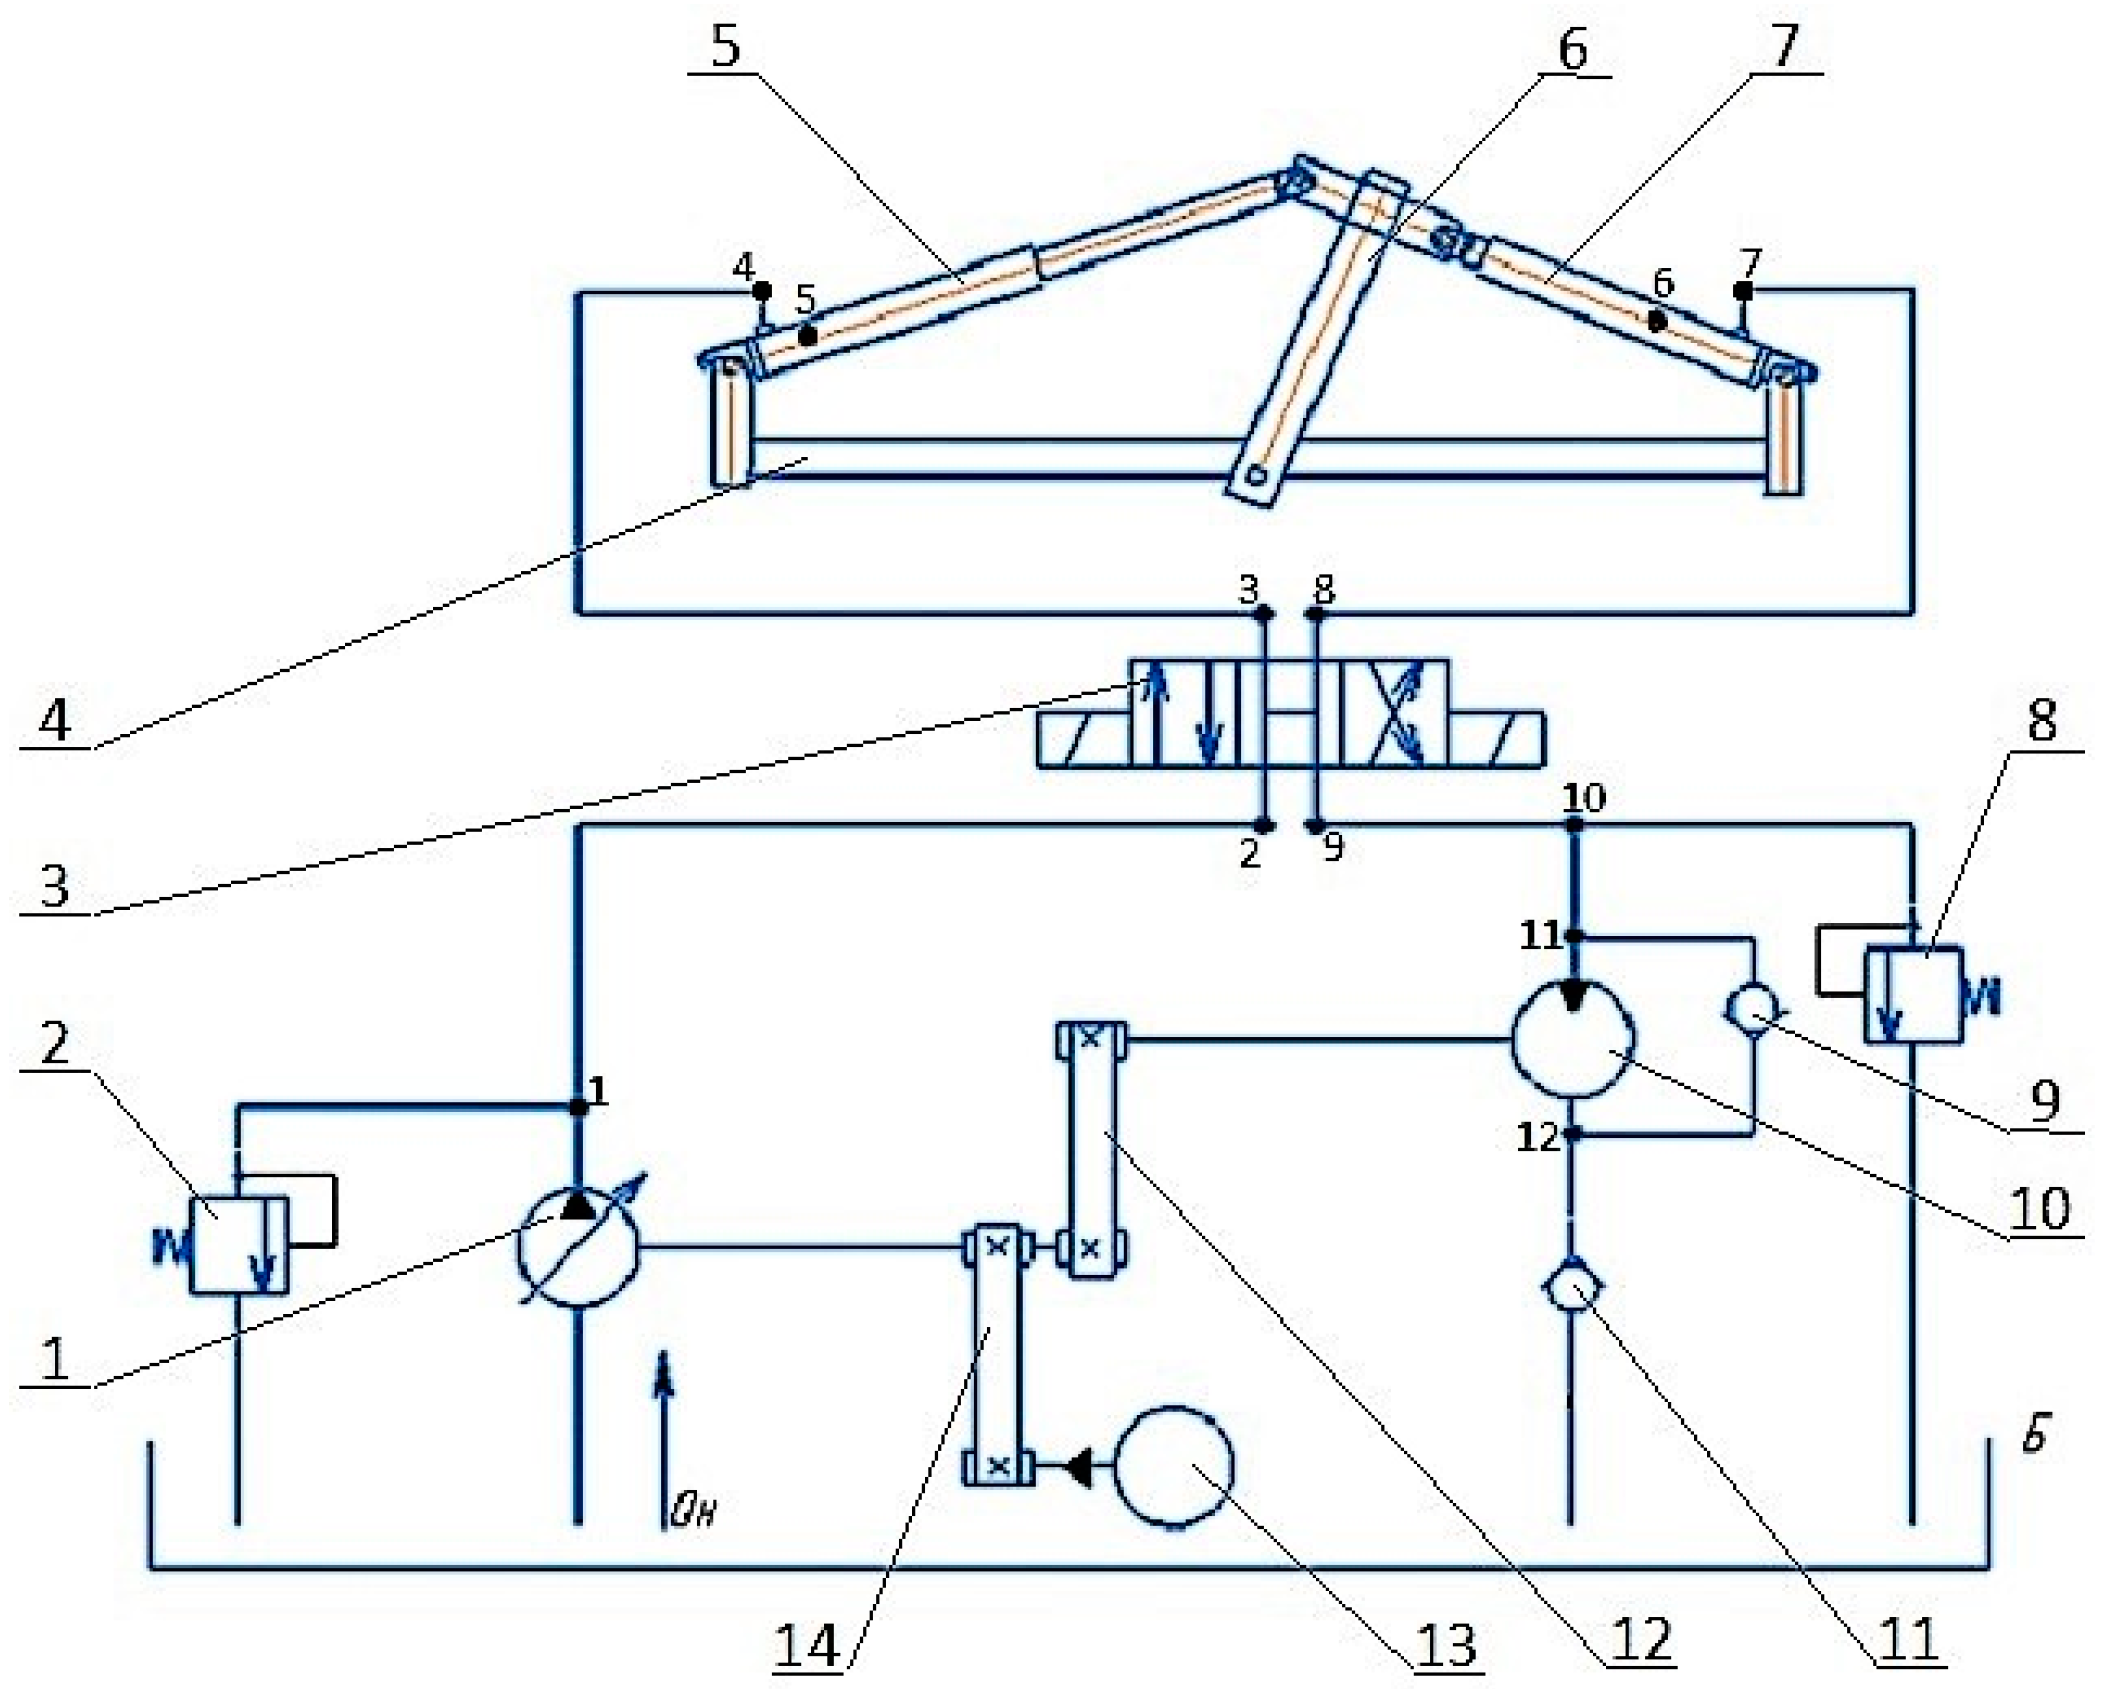
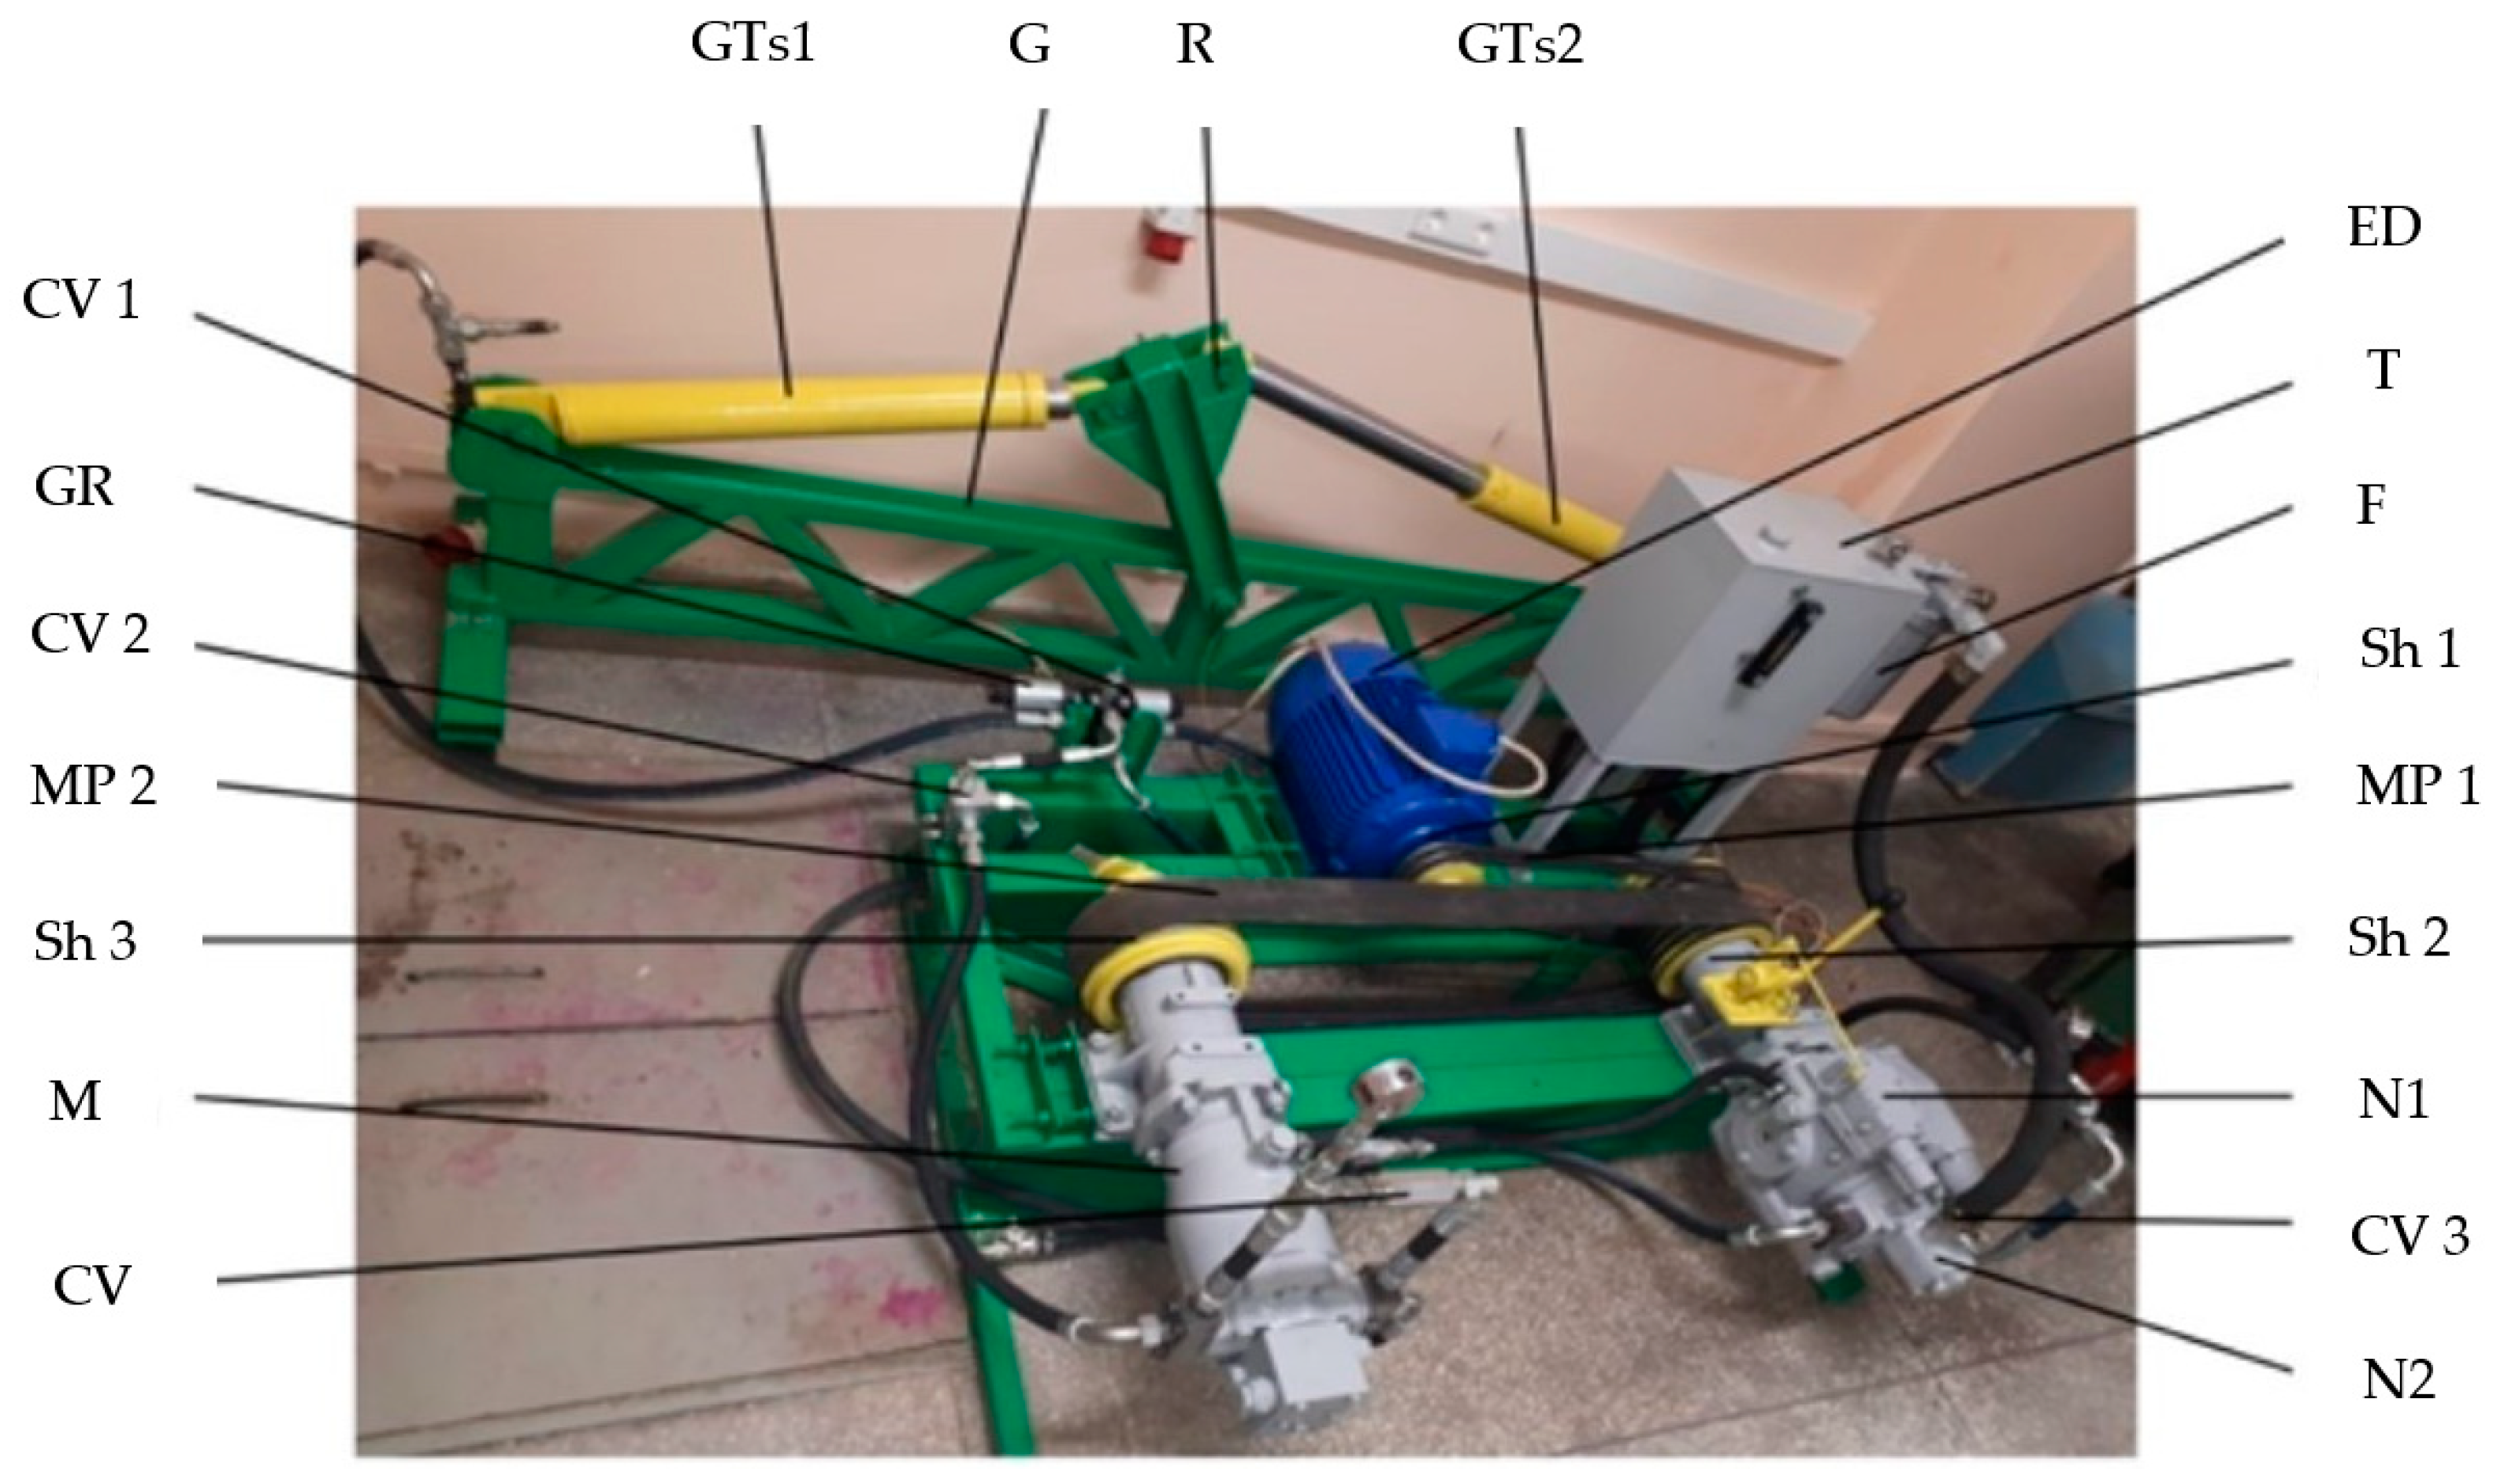
2.1. Calculation Scheme of the Test Bench for Plunger Hydraulic Cylinders

As part of this study, an analysis of the test bench drives for hydraulic cylinders was conducted. The main attention was paid to the design and application features of the benches that take into account energy recovery. The results of the analysis indicate that high energy costs during testing can be reduced by using energy recovery methods.
Based on the unique design features of the previously proposed test benches, a structural diagram of the test bench drive for testing plunger hydraulic cylinders was proposed, based on the use of the energy recovery method using rotary hydraulic machines (Figure 1).
The main difference of the Id stand Is the ability to recuperate energy during the testing of hydraulic machines of reciprocating action. The stand design has a transmission link KS—a rocker, which allows for the spatial action of forces between the tested hydraulic cylinders to be as close as possible to real operating conditions.
The system of the test bench, presented in Figure 1, includes hydromechanical subsystems and a test process control and management system (AMCS).
The primary energy source consists of an electric motor ED and a hydraulic pump H, designed to compensate for the energy lost by the system during testing.
The subsystem for testing hydraulic cylinders includes the tested plunger hydraulic cylinders GTs1 and GTs2, a mechanical transmission KS and a hydraulic distributor GR, which is designed to control the flow of working fluid when changing the direction of movement of the working bodies of the tested hydraulic cylinders.
The energy recovery system consists of a hydraulic motor M and a mechanical transmission MP to create a load on the tested hydraulic cylinders and return part of the energy from the shaft of the hydraulic motor M to the shaft of the hydraulic pump H, thereby recuperating energy during testing.
An automatic monitoring and control system (AMCS) is designed to monitor the main technological parameters of the hydraulic cylinder testing process and control this process. It includes pressure sensors (DD1…DD4), speed sensors (DO1 and DO2), rotation sensor DP, and kilowattmeter IM, designed to measure the pressure at characteristic points of the system, the rotation speed of the hydraulic pump H and hydraulic motor M, the angle of rotation of the rocker arm KS, the power consumed by the electric motor ED, and further processing of information, for which the AMCS contains an electronic system for processing and displaying and printing the received information about the test progress.

2.2. Modeling the Drive System of the Stand

At present, one of the most effective approaches to the preliminary study of technical objects is their mathematical modeling.
To carry out modeling with subsequent study of the hydromechanical system of the stand, its basic hydrokinematic diagram was developed, shown in Figure 2. The diagram shows the division of the hydraulic system into sections that are subject to pressure changes labeled numerically from 1 to 12.
Modeling of the hydraulic system of the test bench have been conducted using the volumetric stiffness theory for the hydraulic system [20]. The theory of volumetric stiffness allows the use of the coefficient of volumetric stiffness in the calculations of a hydraulic system. As a result, it becomes possible to model a hydraulic system not only with a stationary fluid filling the internal volume of the system, but also with a moving liquid. According to this theory, the pressure increase dpi in each limited volume of the hydraulic system can be determined by the formula:
d p i = C i Q i n t i + Q o u t i d t ,
where C i —coefficient of volumetric stiffness of the section of the hydraulic system under consideration; Q i n t i and Q o u t i —total flow rates of liquid entering and leaving the volume under consideration.
At the same time, power fluid losses through the hydraulic resistance are determined with the following expression:
Q i = μ i S i 2 ρ p i p i + 1 · s i g n p i p i + 1 .
In the Formula (2): p i and p i + 1 —pressures at the input and output of the corresponding hydraulic resistance; S i —area of the clear opening; ρ —density of power fluid.
The discharge coefficient of local hydraulic resistances, including the hydraulic distributor, is determined with consideration to the coefficient of the hydraulic resistance ζi using the following formula:
μ i = 1 ζ i .  
The given discharge coefficient of linear hydraulic resistances (pipelines) μ i can be determined with consideration to the power fluid flow state using the following formula:
μ l = 1 λ l l l d l ,        
where λ l —frictional coefficient of linear hydraulic resistance is determined with consideration to the power fluid flow state; l l and d l —length and diameter of linear hydraulic resistance, accordingly.
The given coefficients of the volumetric stiffness for major elements of the hydraulic drive, including metallic pipelines, have been obtained analytically. The proposed coefficients of the volumetric stiffness of high-pressure elastic sleeves have been determined experimentally.
Power fluid losses through the hydraulic pump and motor are determined with due regard for their current volumetric coefficient of efficiency η V , which is determined depending on the current value of power fluid pressure p using the following formula:
η V = 1 1 η V . n o m · p p n o m
where η V . n o m and p n o m —values of the nominal volume of the efficiency coefficient and nominal pressure of the corresponding hydraulic machine.
Speed v p l of hydraulic cylinders’ plungers’ transition is calculated via the differential equation of their movement, taking into account frictional force in compressions F f r i c [21] and counter-force of its transition from the side of the second hydraulic cylinder (through the mechanical transmission) F m e c h .
d v p l d t = 1 m r e d π d p l 2 4 p c i l F m e c h F f r i c   .    
As a result of the modeling, the previously published mathematical model of the test bench for testing hydraulic cylinders’ plungers with energy recovery has been obtained.
In order to conduct the numerical experiment, a special program in the computer modeling environment SimInTech [22,23] has been developed. It uses blocks for solving differential equations. The preliminary results of the numerical experiment have been approved through the experiments.
To estimate the energy efficiency of the testing process, it is proposed to use “coefficient of testing energy efficiency”, which can be determined in two ways:
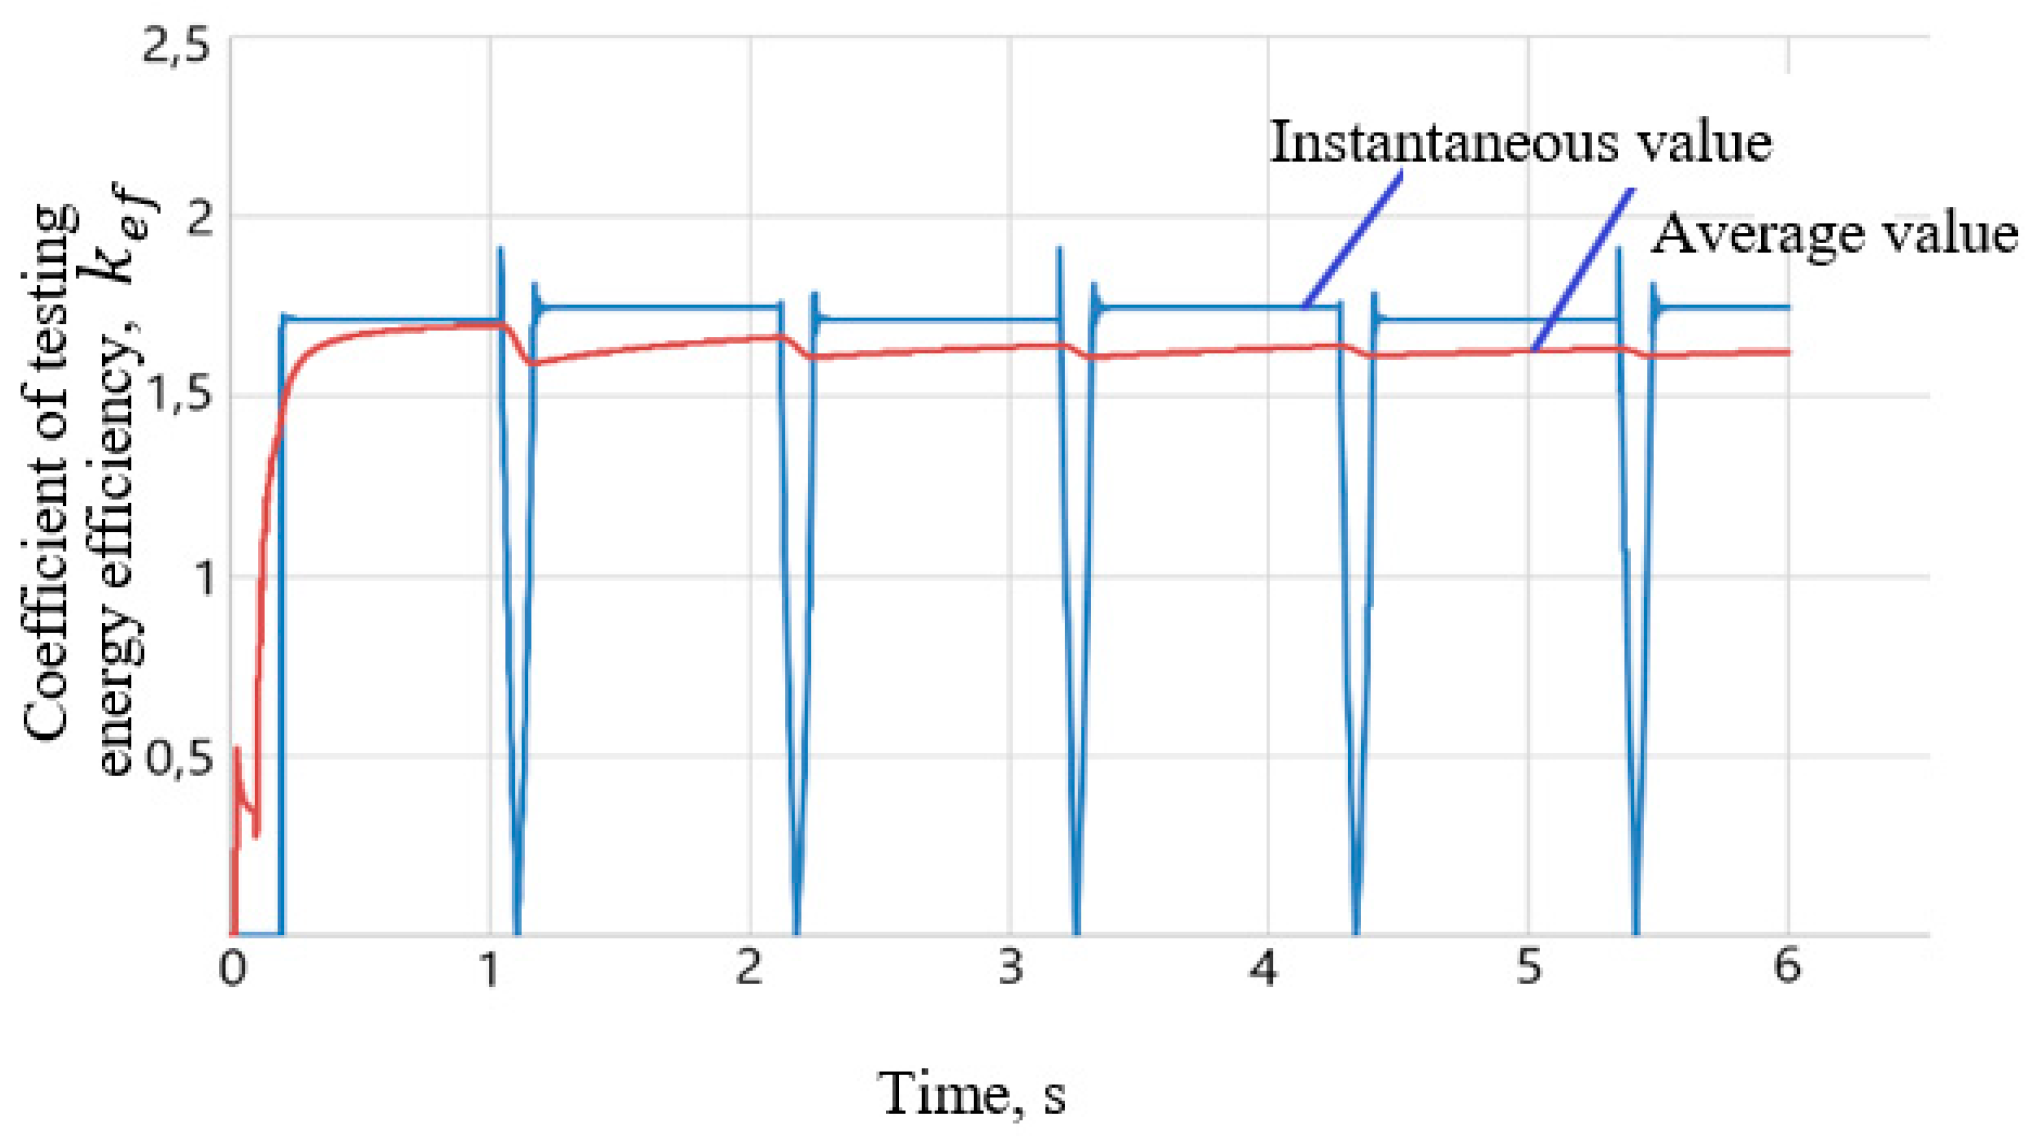
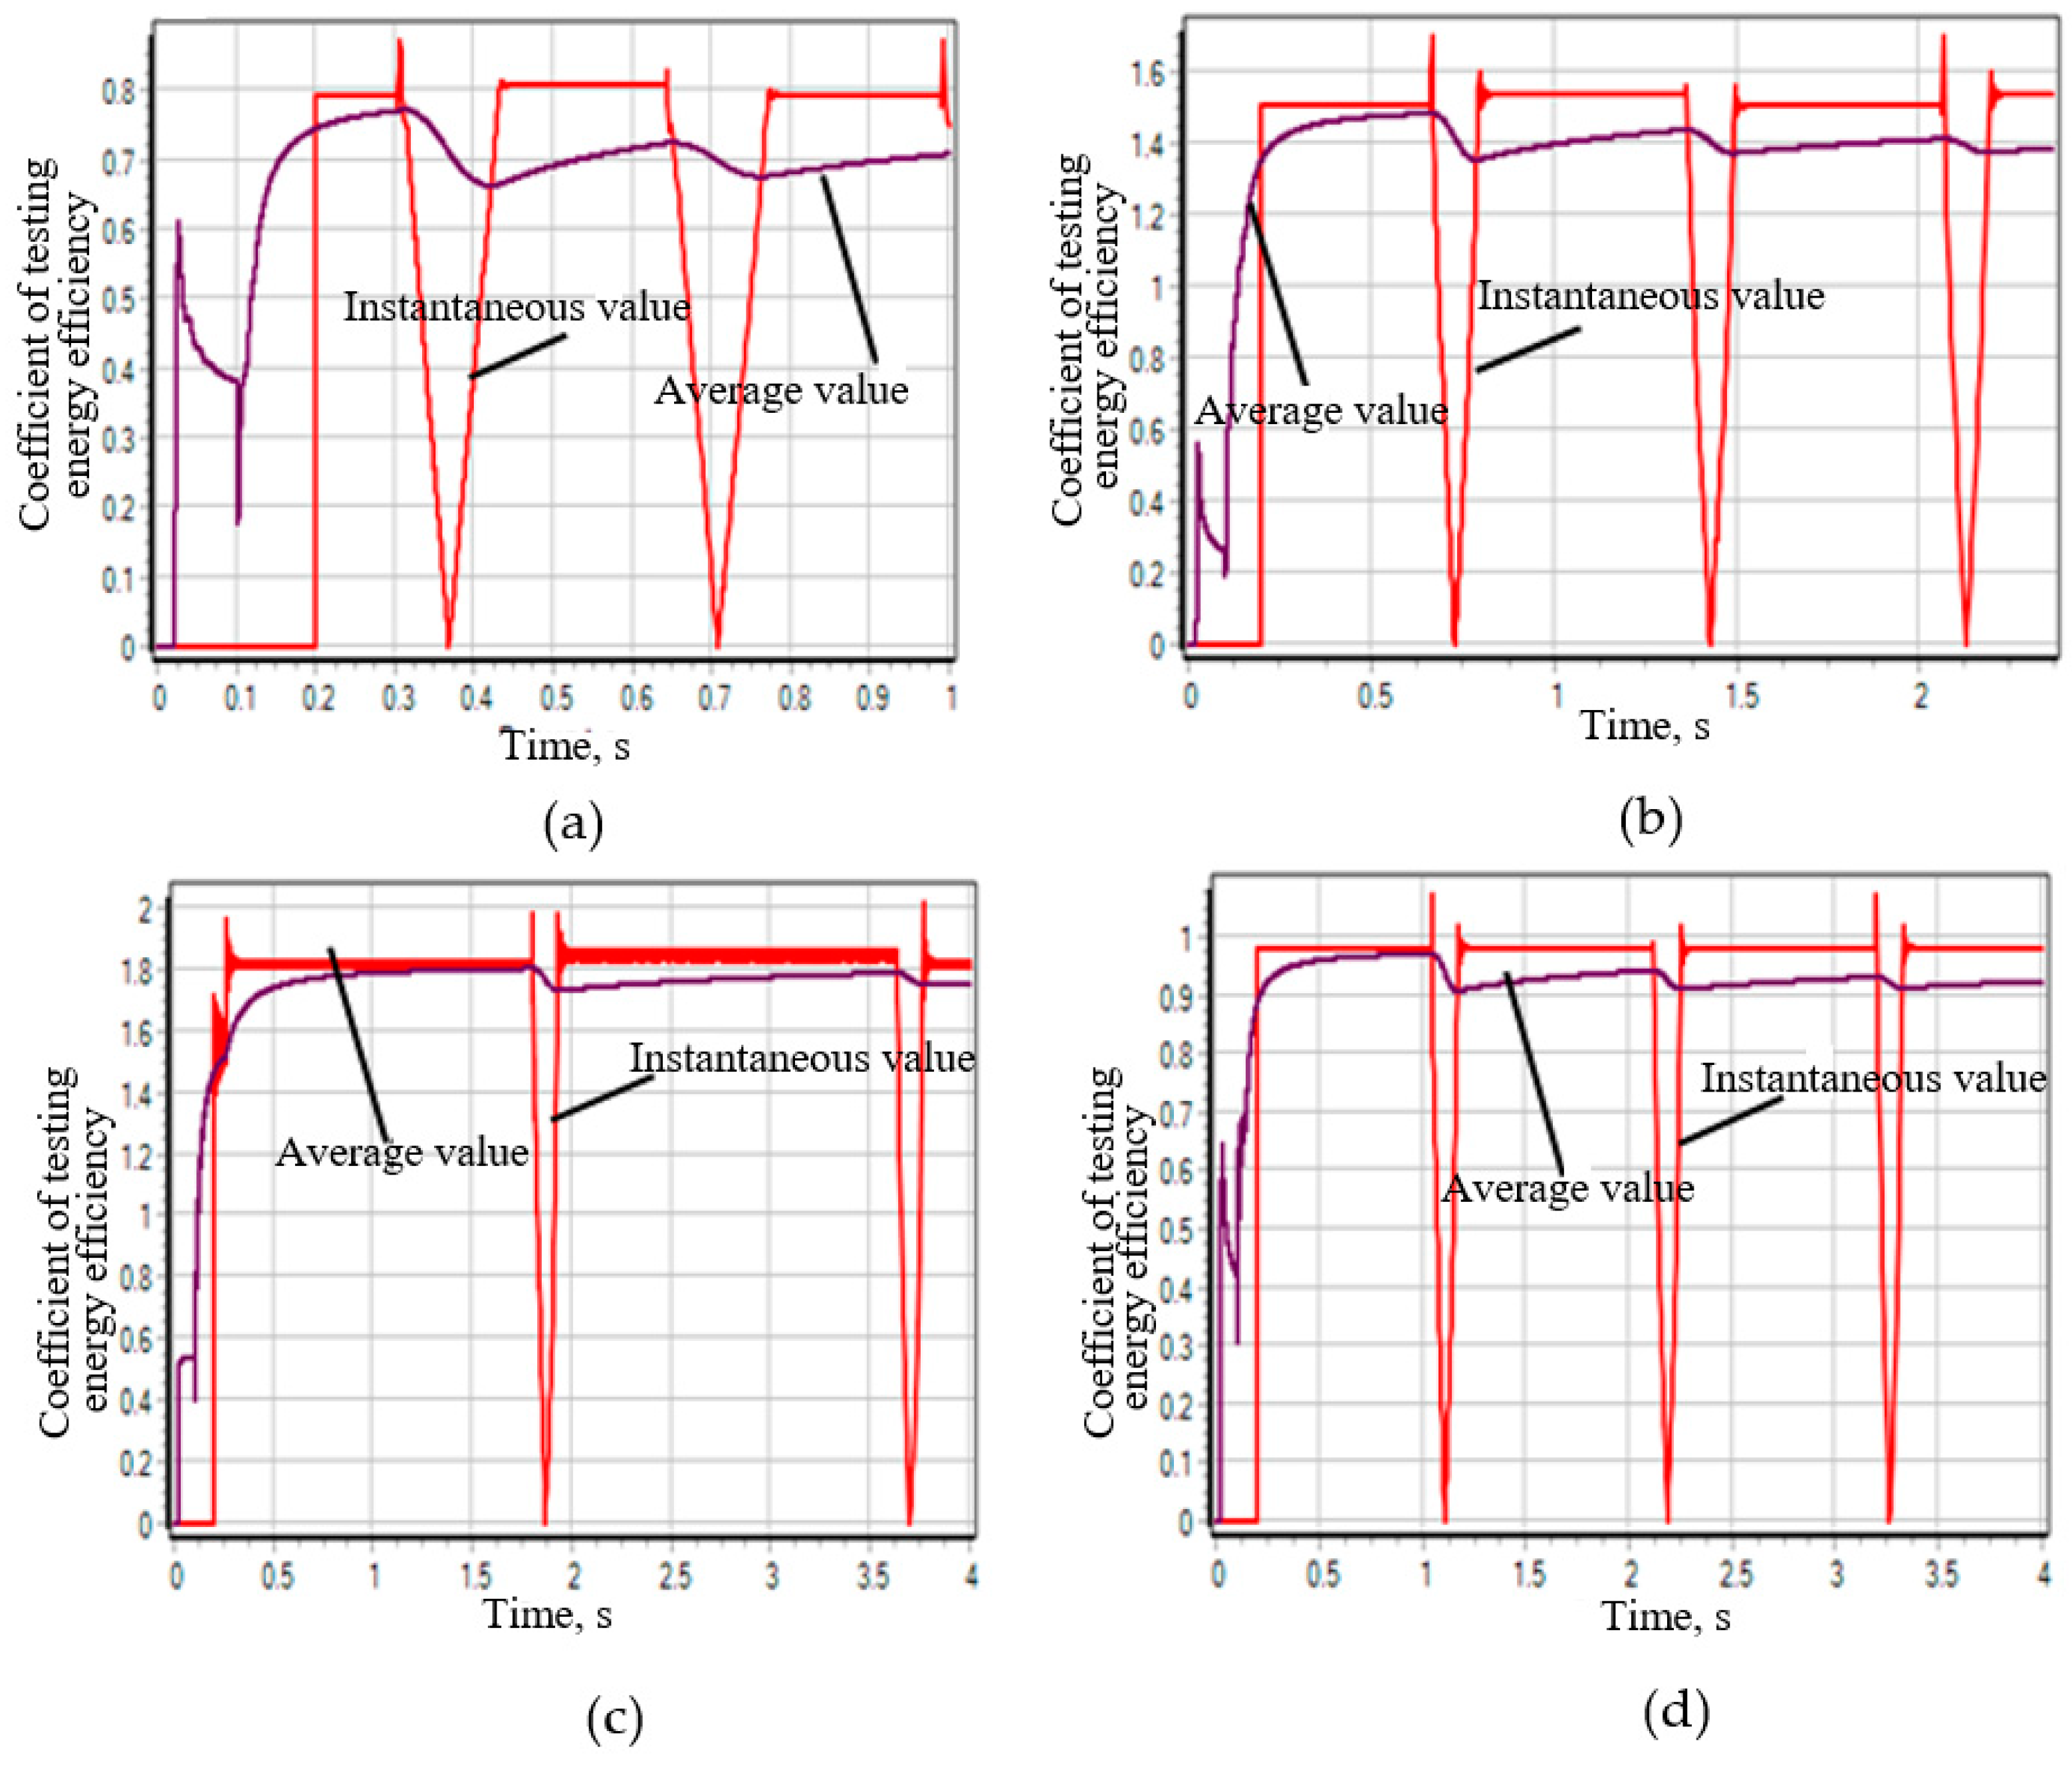
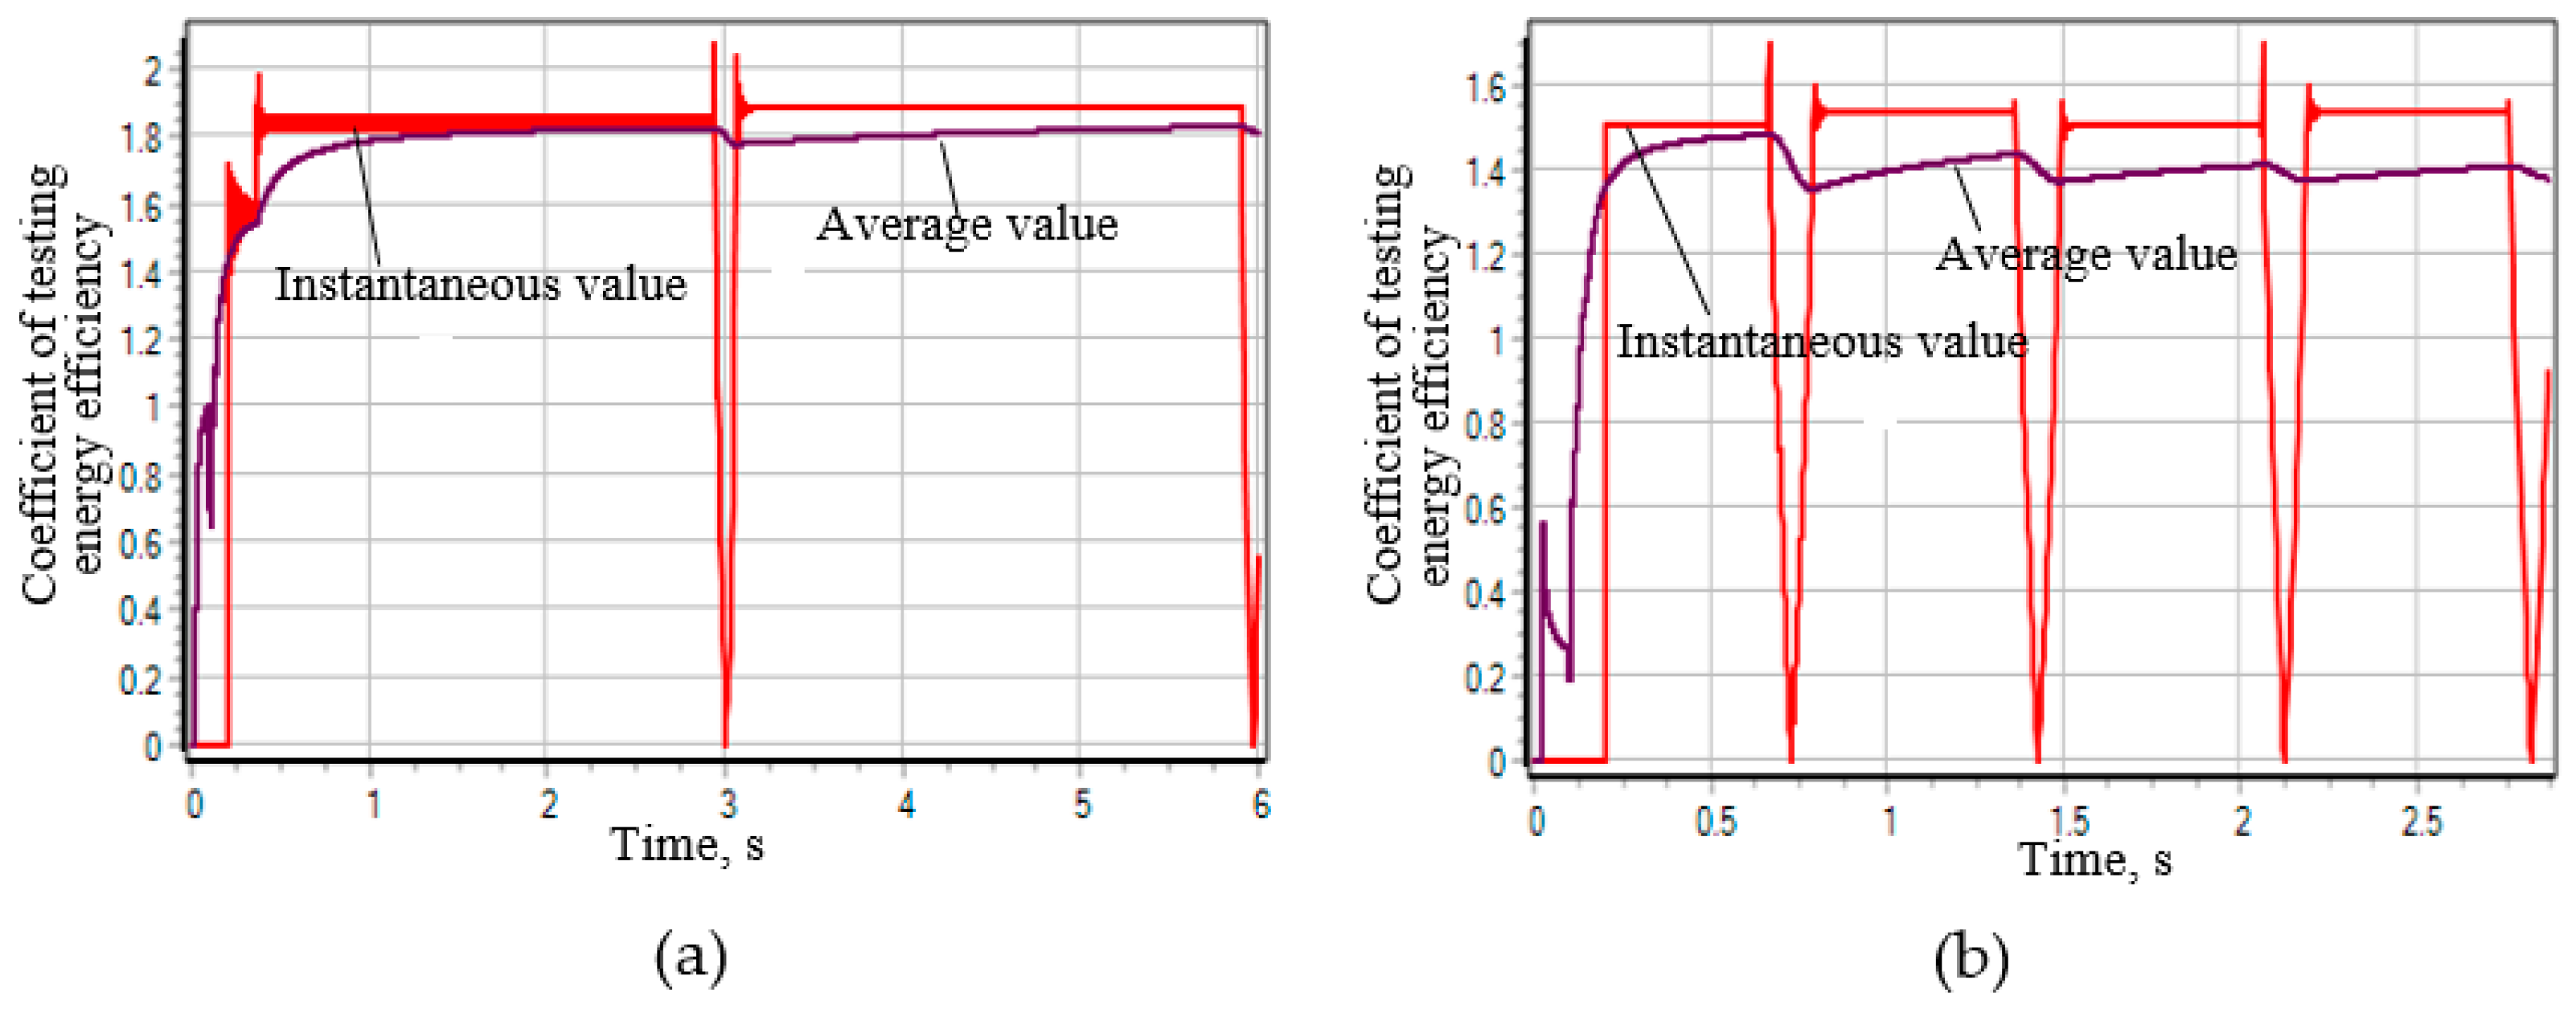
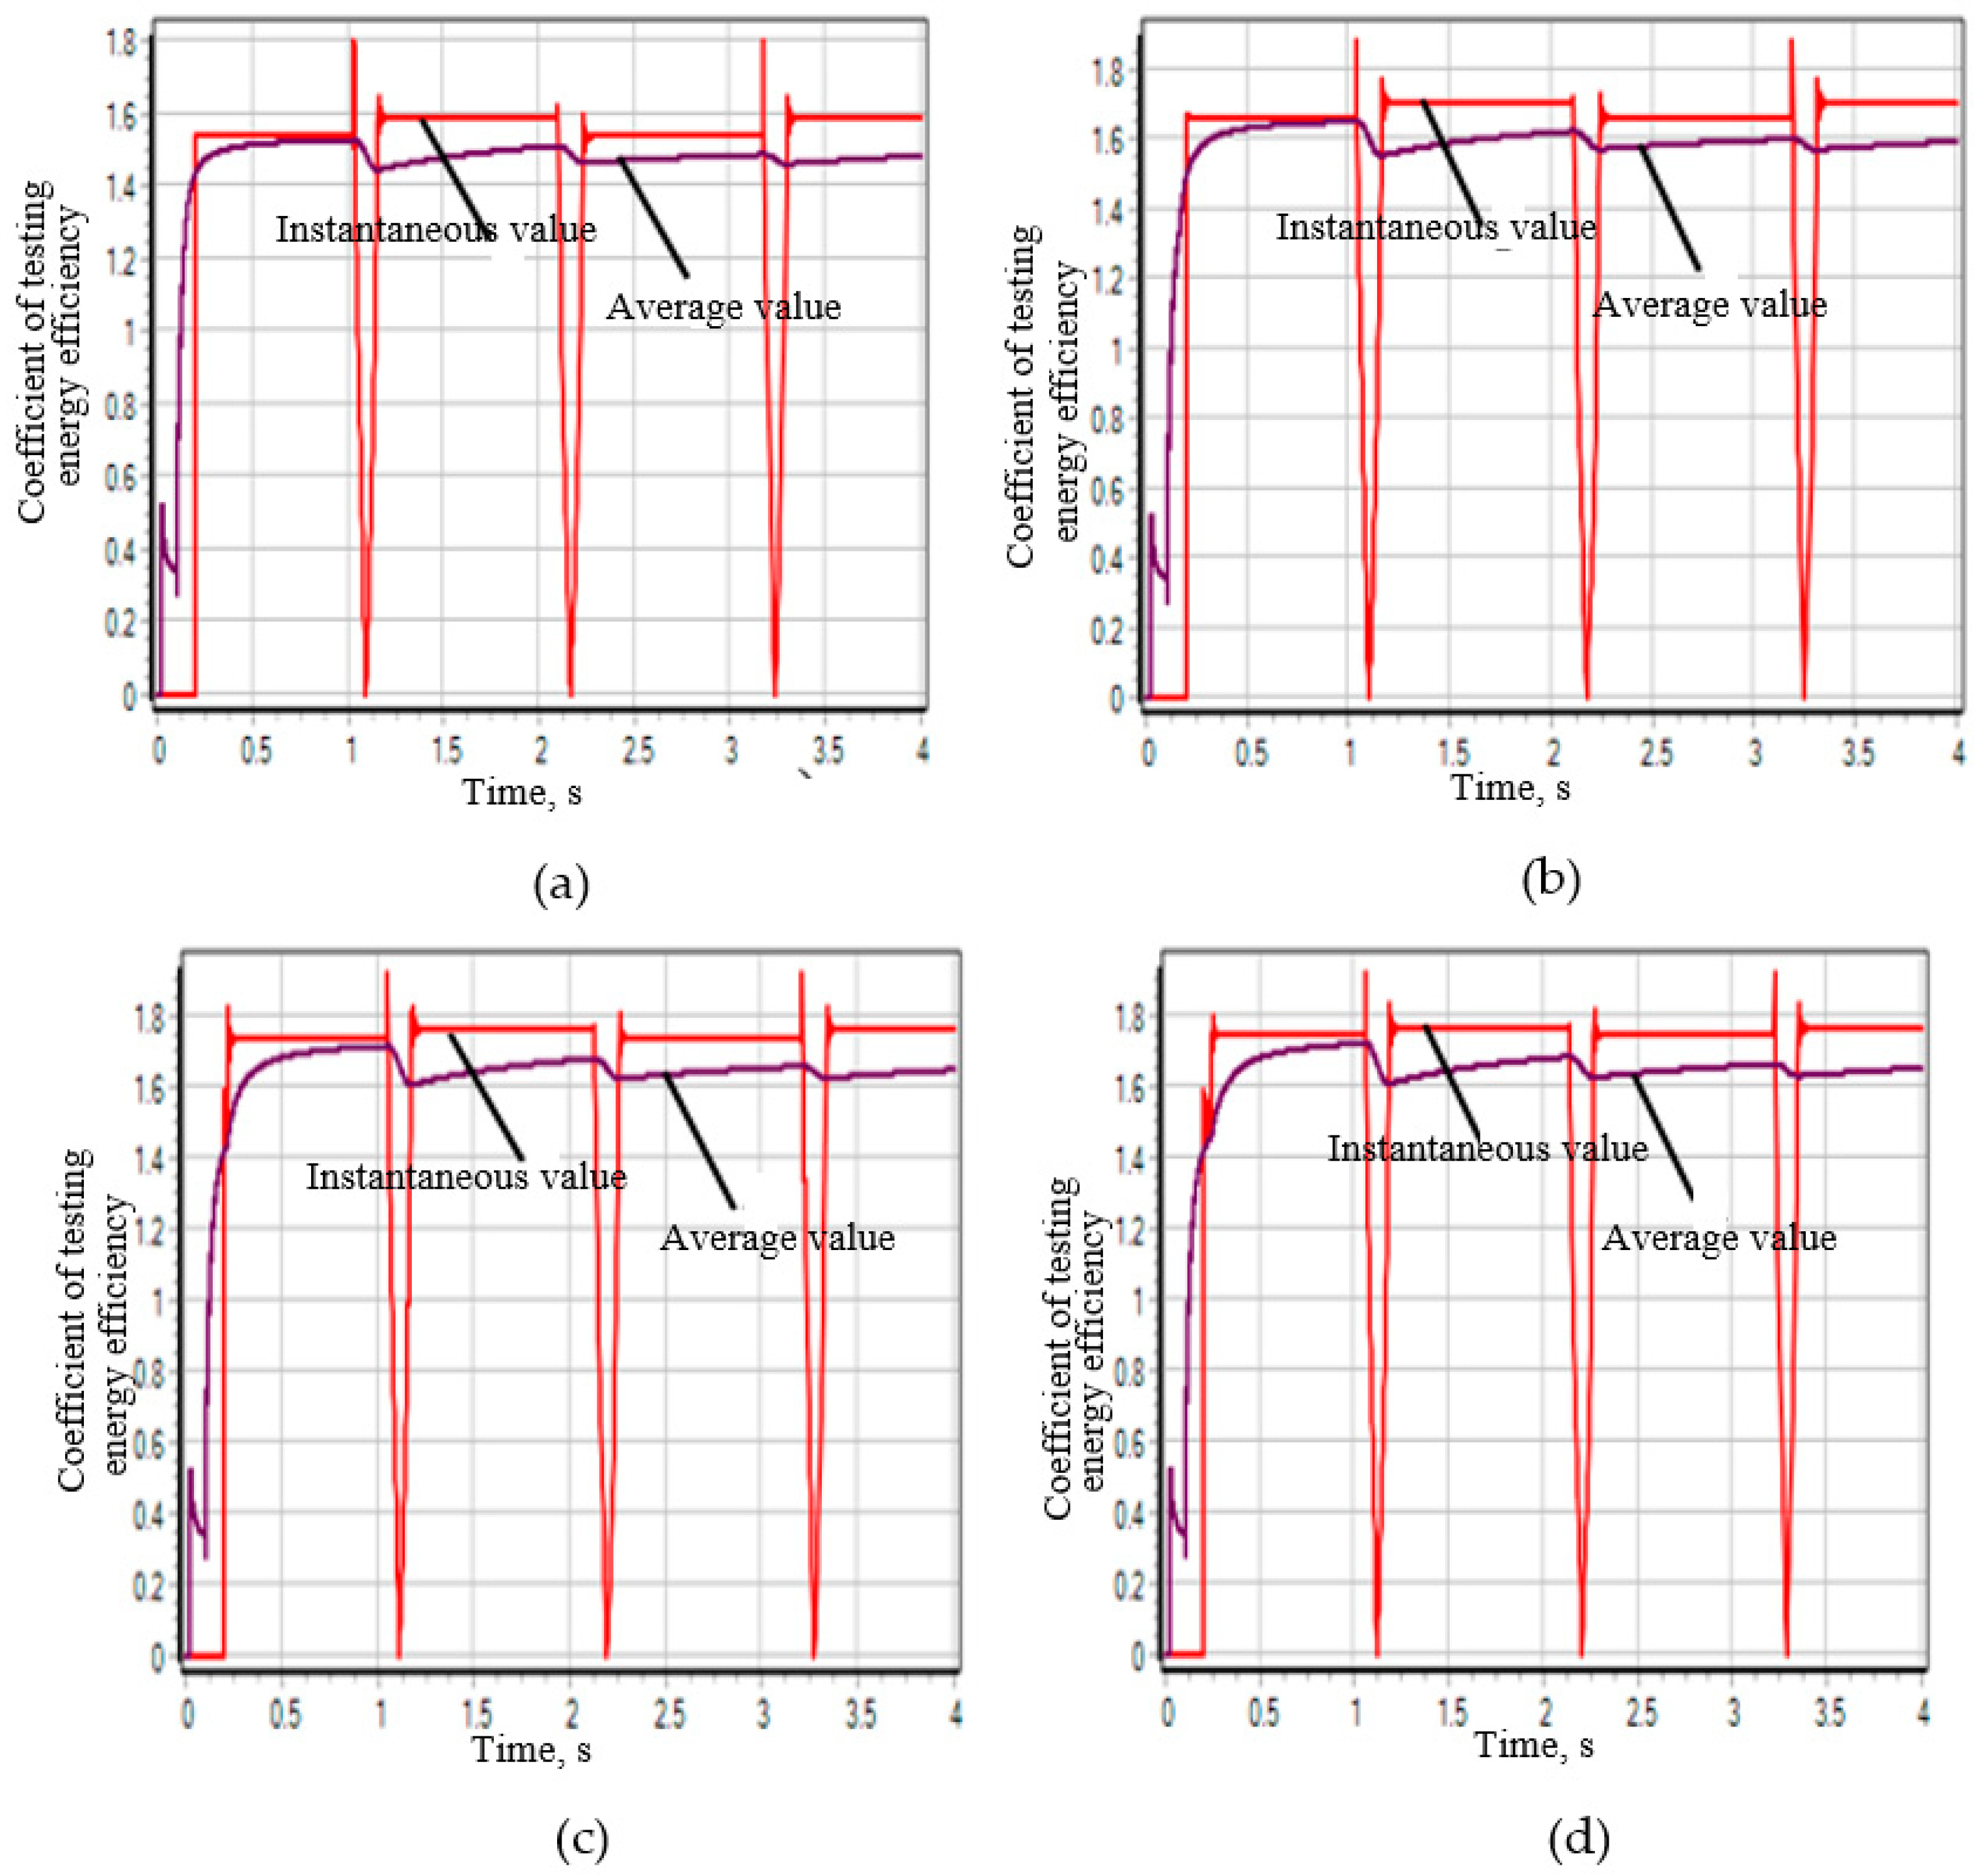
  • Instantaneous value determined by the formula
    k e f   i = N c i N e l i
    where N c i —power of the tested hydraulic cylinder at the I moment of time, W; N e l i —power at the input of the electric motor of the hydraulic pump drive at the I moment of time, W.
  • The average value is determined by the formula
    k e f   s r   = W t e s t W e l
    where W t e s t —energy passed through the tested hydraulic cylinder from the start of the test to the considered moment in time, J; W e l —energy consumed by the hydraulic pump energy source (electric motor) over the same period of time, J.
It is seen from the Equation (7) that, depending on the ratio of power under which hydraulic cylinders are tested and the power of the energy primary source (electric motor), the coefficient of testing energy efficiency for hydraulic cylinders can be both lower and bigger than 1.
If the coefficient of testing energy efficiency is lower than 1, there is no energy recuperation (recovery) during the testing. This means that more energy is used for testing than is required to fully conduct the tests.
If the coefficient of testing energy efficiency is more than 1, there is recuperation (recovery) of some of the energy going through the units under testing. Hence, tests are conducted with the energy saving.
Figure 3 shows a graph comparing the instantaneous and average values of the efficiency coefficient of plunger hydraulic cylinder tests.
The figure shows that when changing the direction of movement (reversal), the pistons of the hydraulic cylinders are fixed in the end positions. It is at this moment that the instantaneous value (blue curve) of the measurement efficiency coefficient drops sharply to zero. The average value (red curve) of the efficiency coefficient during steady-state operation of the system is stably maintained at around 1.65. Therefore, when conducting an analysis, it is advisable to use the mean efficiency coefficient. To improve test performance, it is necessary to minimize the time of switching between reverse modes, which, in turn, can affect the operational dynamics and system parameters of the system.

3. Results and Discussion

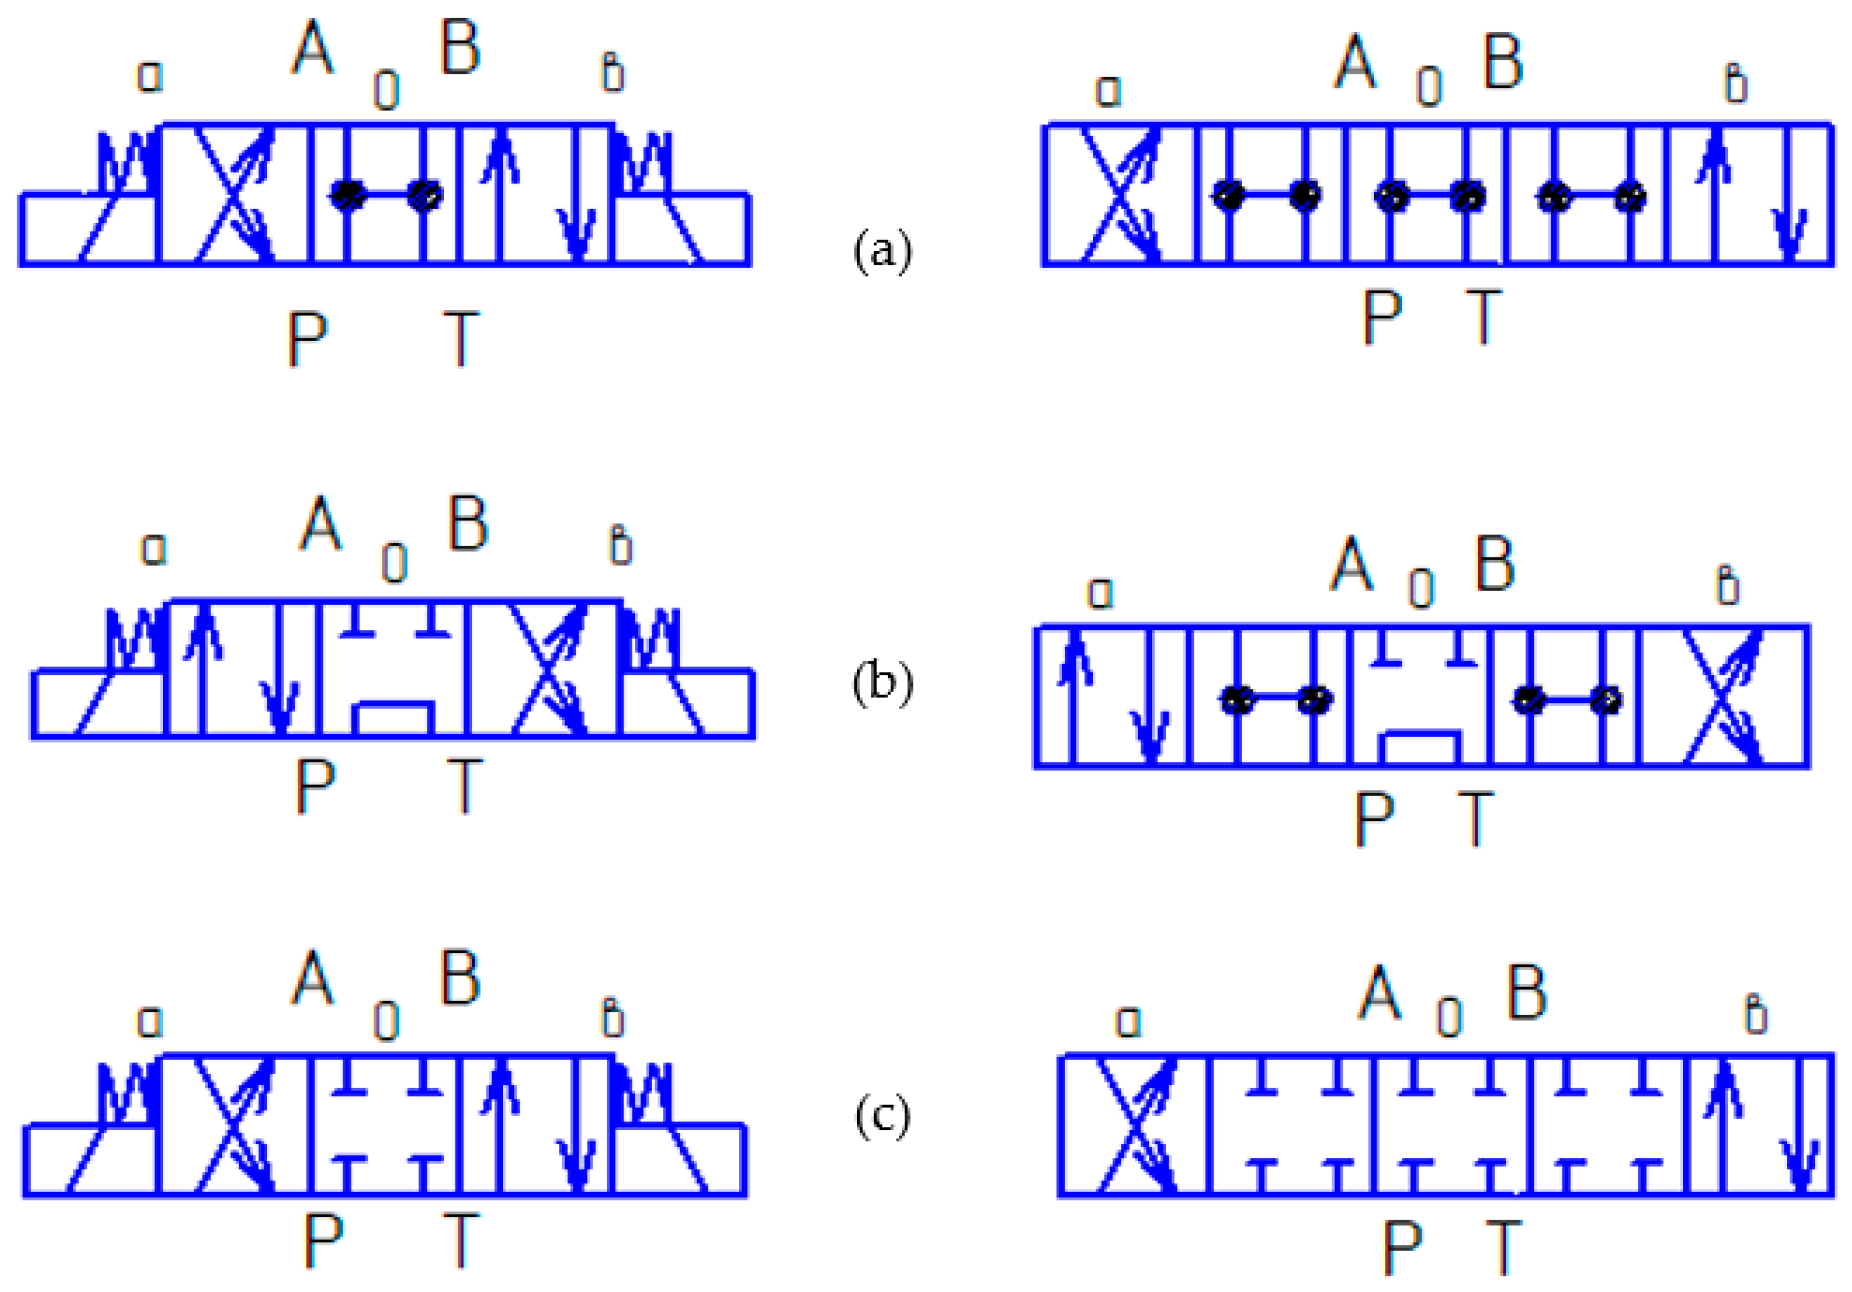
3.1. Selection of the Hydraulic Distributor Circuit Type to Ensure the Best Dynamic Performance of the Stand

Analysis of theoretical aspects of the hydromechanical drive of the test bench for carrying out resource tests of plunger hydraulic cylinders using energy recovery showed that in order to create a test bench with the best test efficiency factor, it is important to conduct theoretical studies in advance that will help determine the influence of various design parameters of the test bench on this factor. These parameters include the dynamic characteristics of transient processes in the hydraulic system, as well as the design features of the hydromechanical drive of the test bench.
The dynamics and quality of the processes of the test bench hydraulic system are assessed by mathematical modeling of the switching schemes of the electric hydraulic distributor. The significant design parameters of the test bench include the relationship between the electric motor and hydraulic pump (gear ratio 1_2), the hydraulic motor and hydraulic pump (gear ratio 3_2), the angular speed of rotation of the electric motor shaft, the working volumes of the hydraulic motor and hydraulic pump, as well as the setting pressure of the pressure valve.
Mathematical modeling of the characteristics of the electric hydraulic distributor with various switching schemes of the spool valve was carried out (Figure 4).
For the neutral position of the hydraulic distributor connection, the following diagrams are considered: 14—all channels are combined (Figure 4a); 64—the discharge and drain lines are connected, and cavities A and B are disconnected (Figure 4b); diagram 44—all channels are disconnected (Figure 4c). By combining these three cases, it is possible to obtain many connection positions.
The above hydraulic distributor connection diagrams operate as follows. In the neutral position, the cylindrical spool with three flanges is located in the housing with bores, the working fluid is supplied to the central groove, and the outer ones are connected to the drain. The cavities between the spool flanges are connected to the corresponding cavities of the hydraulic cylinders. The edges of the spool with the housing bores form throttling slots, the area of which changes depending on the displacement of the spool from the neutral position. For further convenience, we will use abbreviations in accordance with the names of the hydraulic lines, for example, TA—connects hydraulic line A with drain T, etc.
The analysis of the influence of changes in the flow area of the hydraulic distributor channels when the spool is shifted showed that the speed of the plunger movement changes in the following accordance:
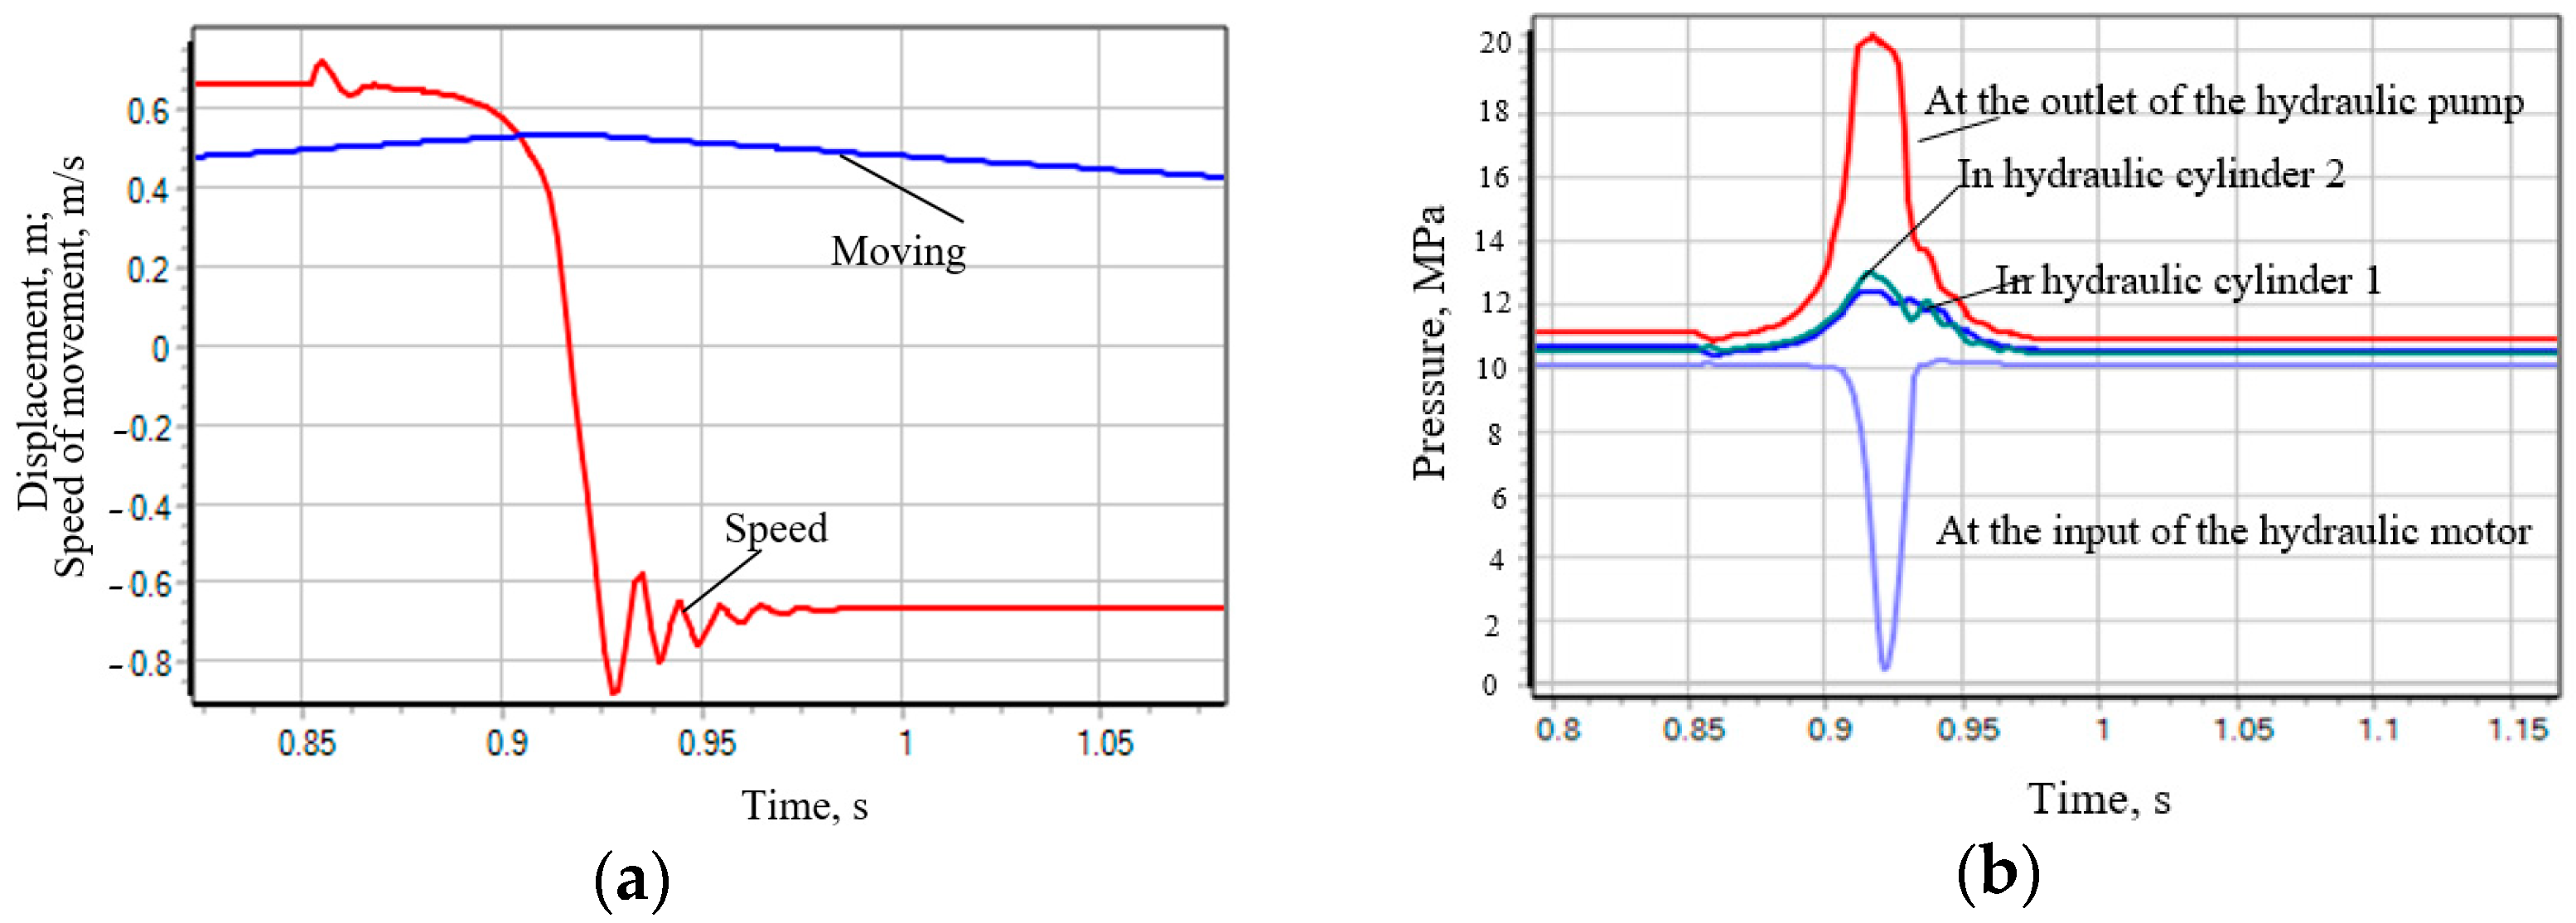
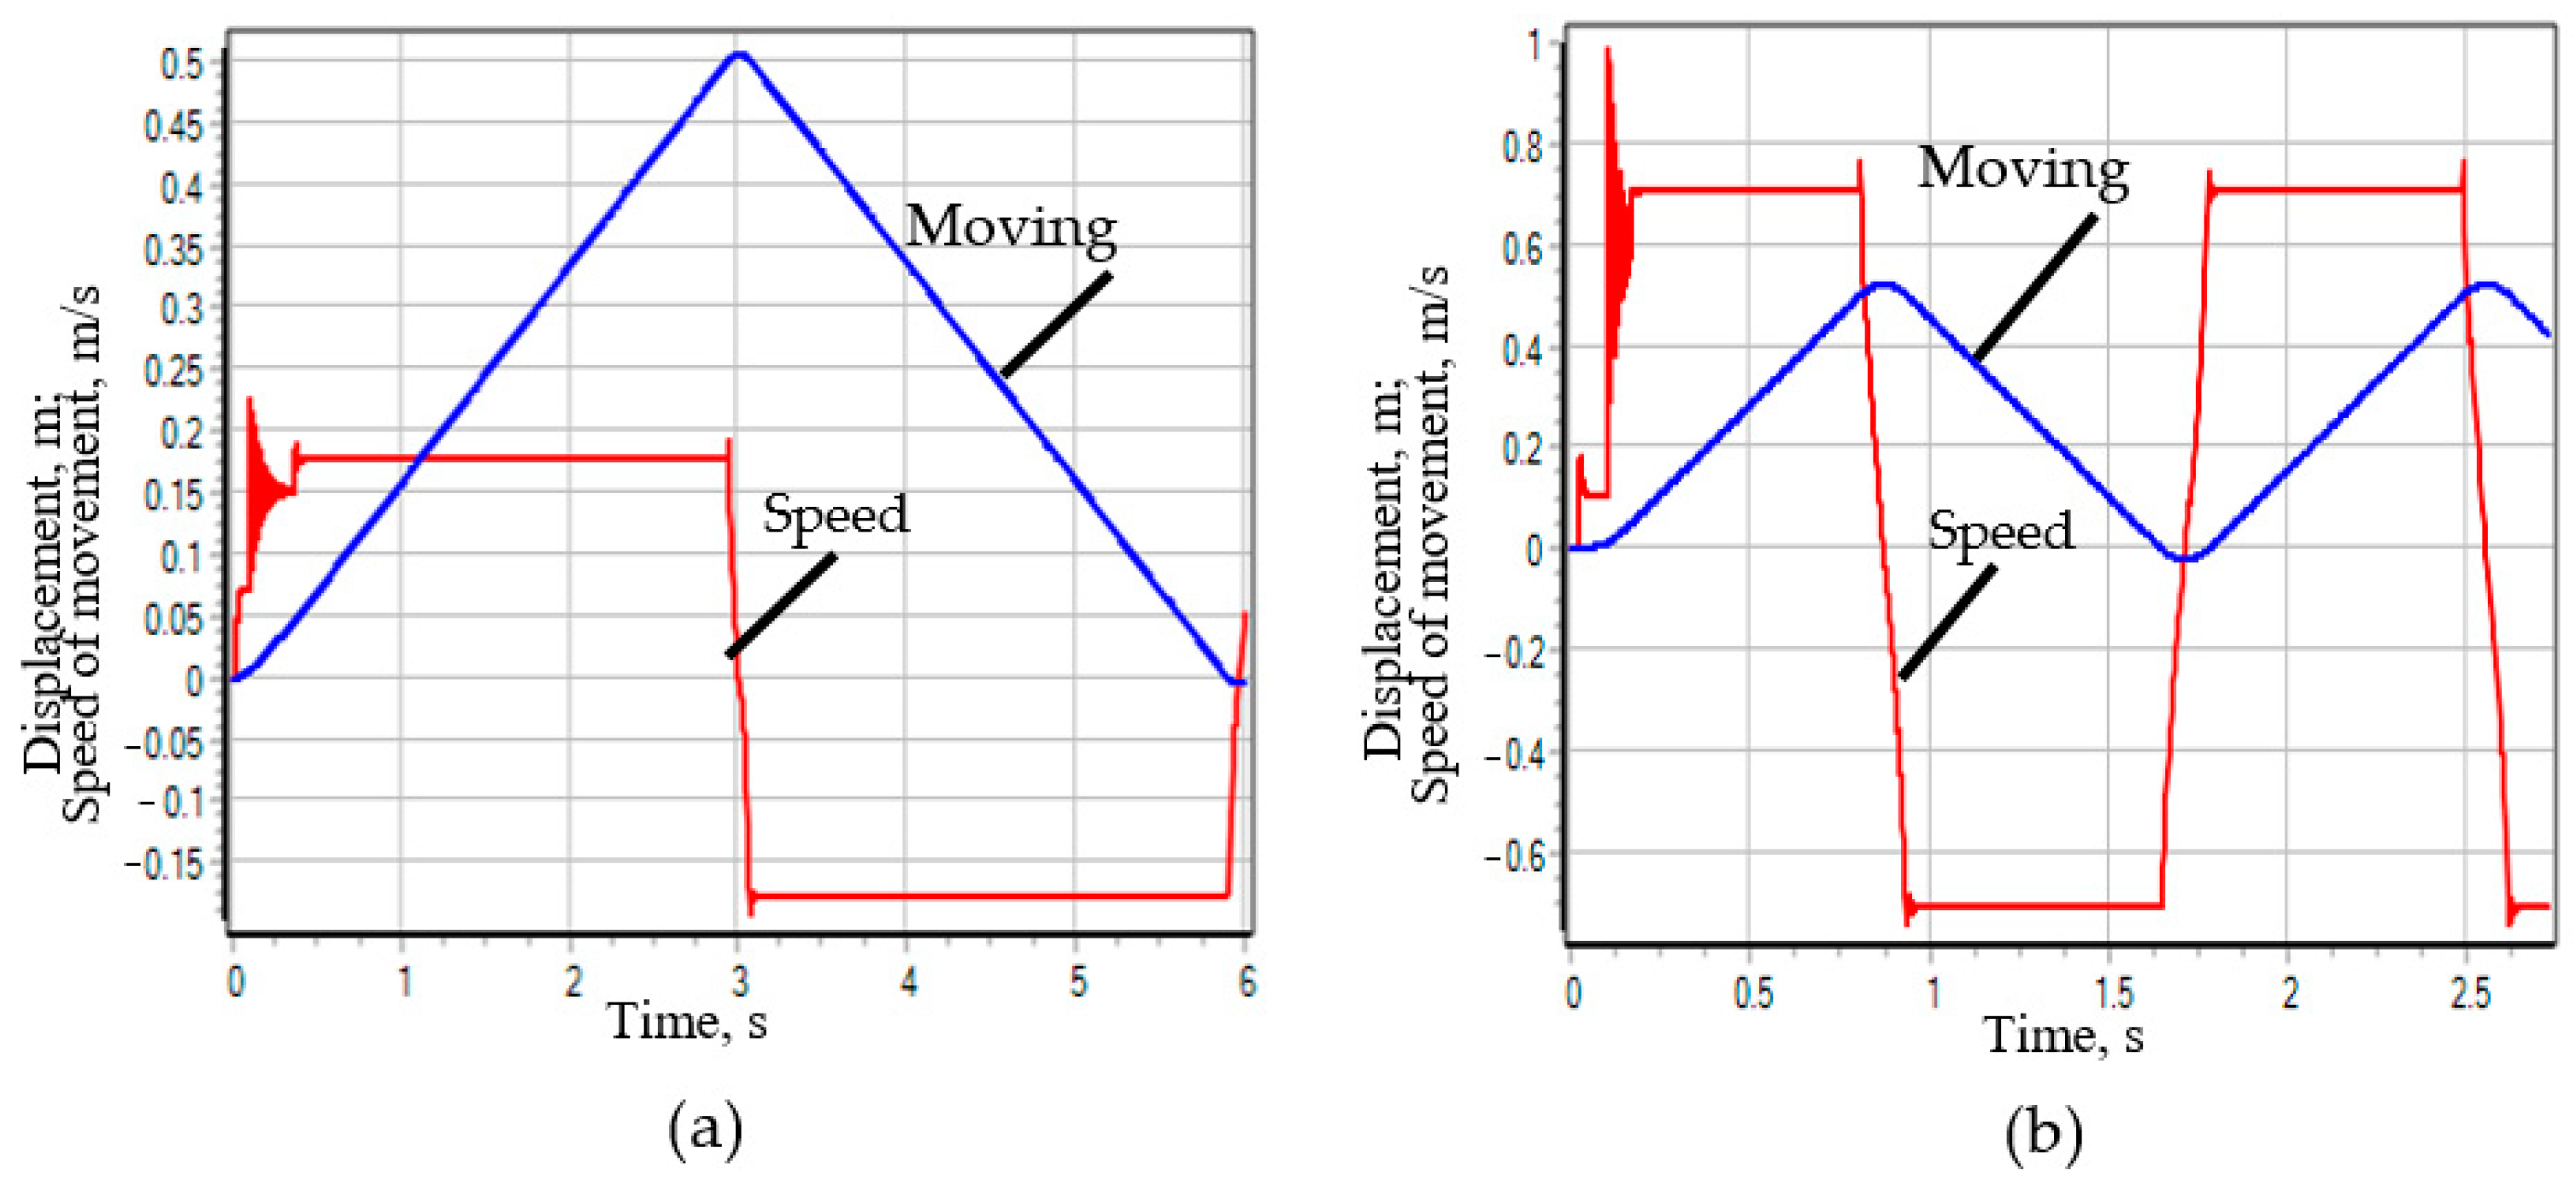
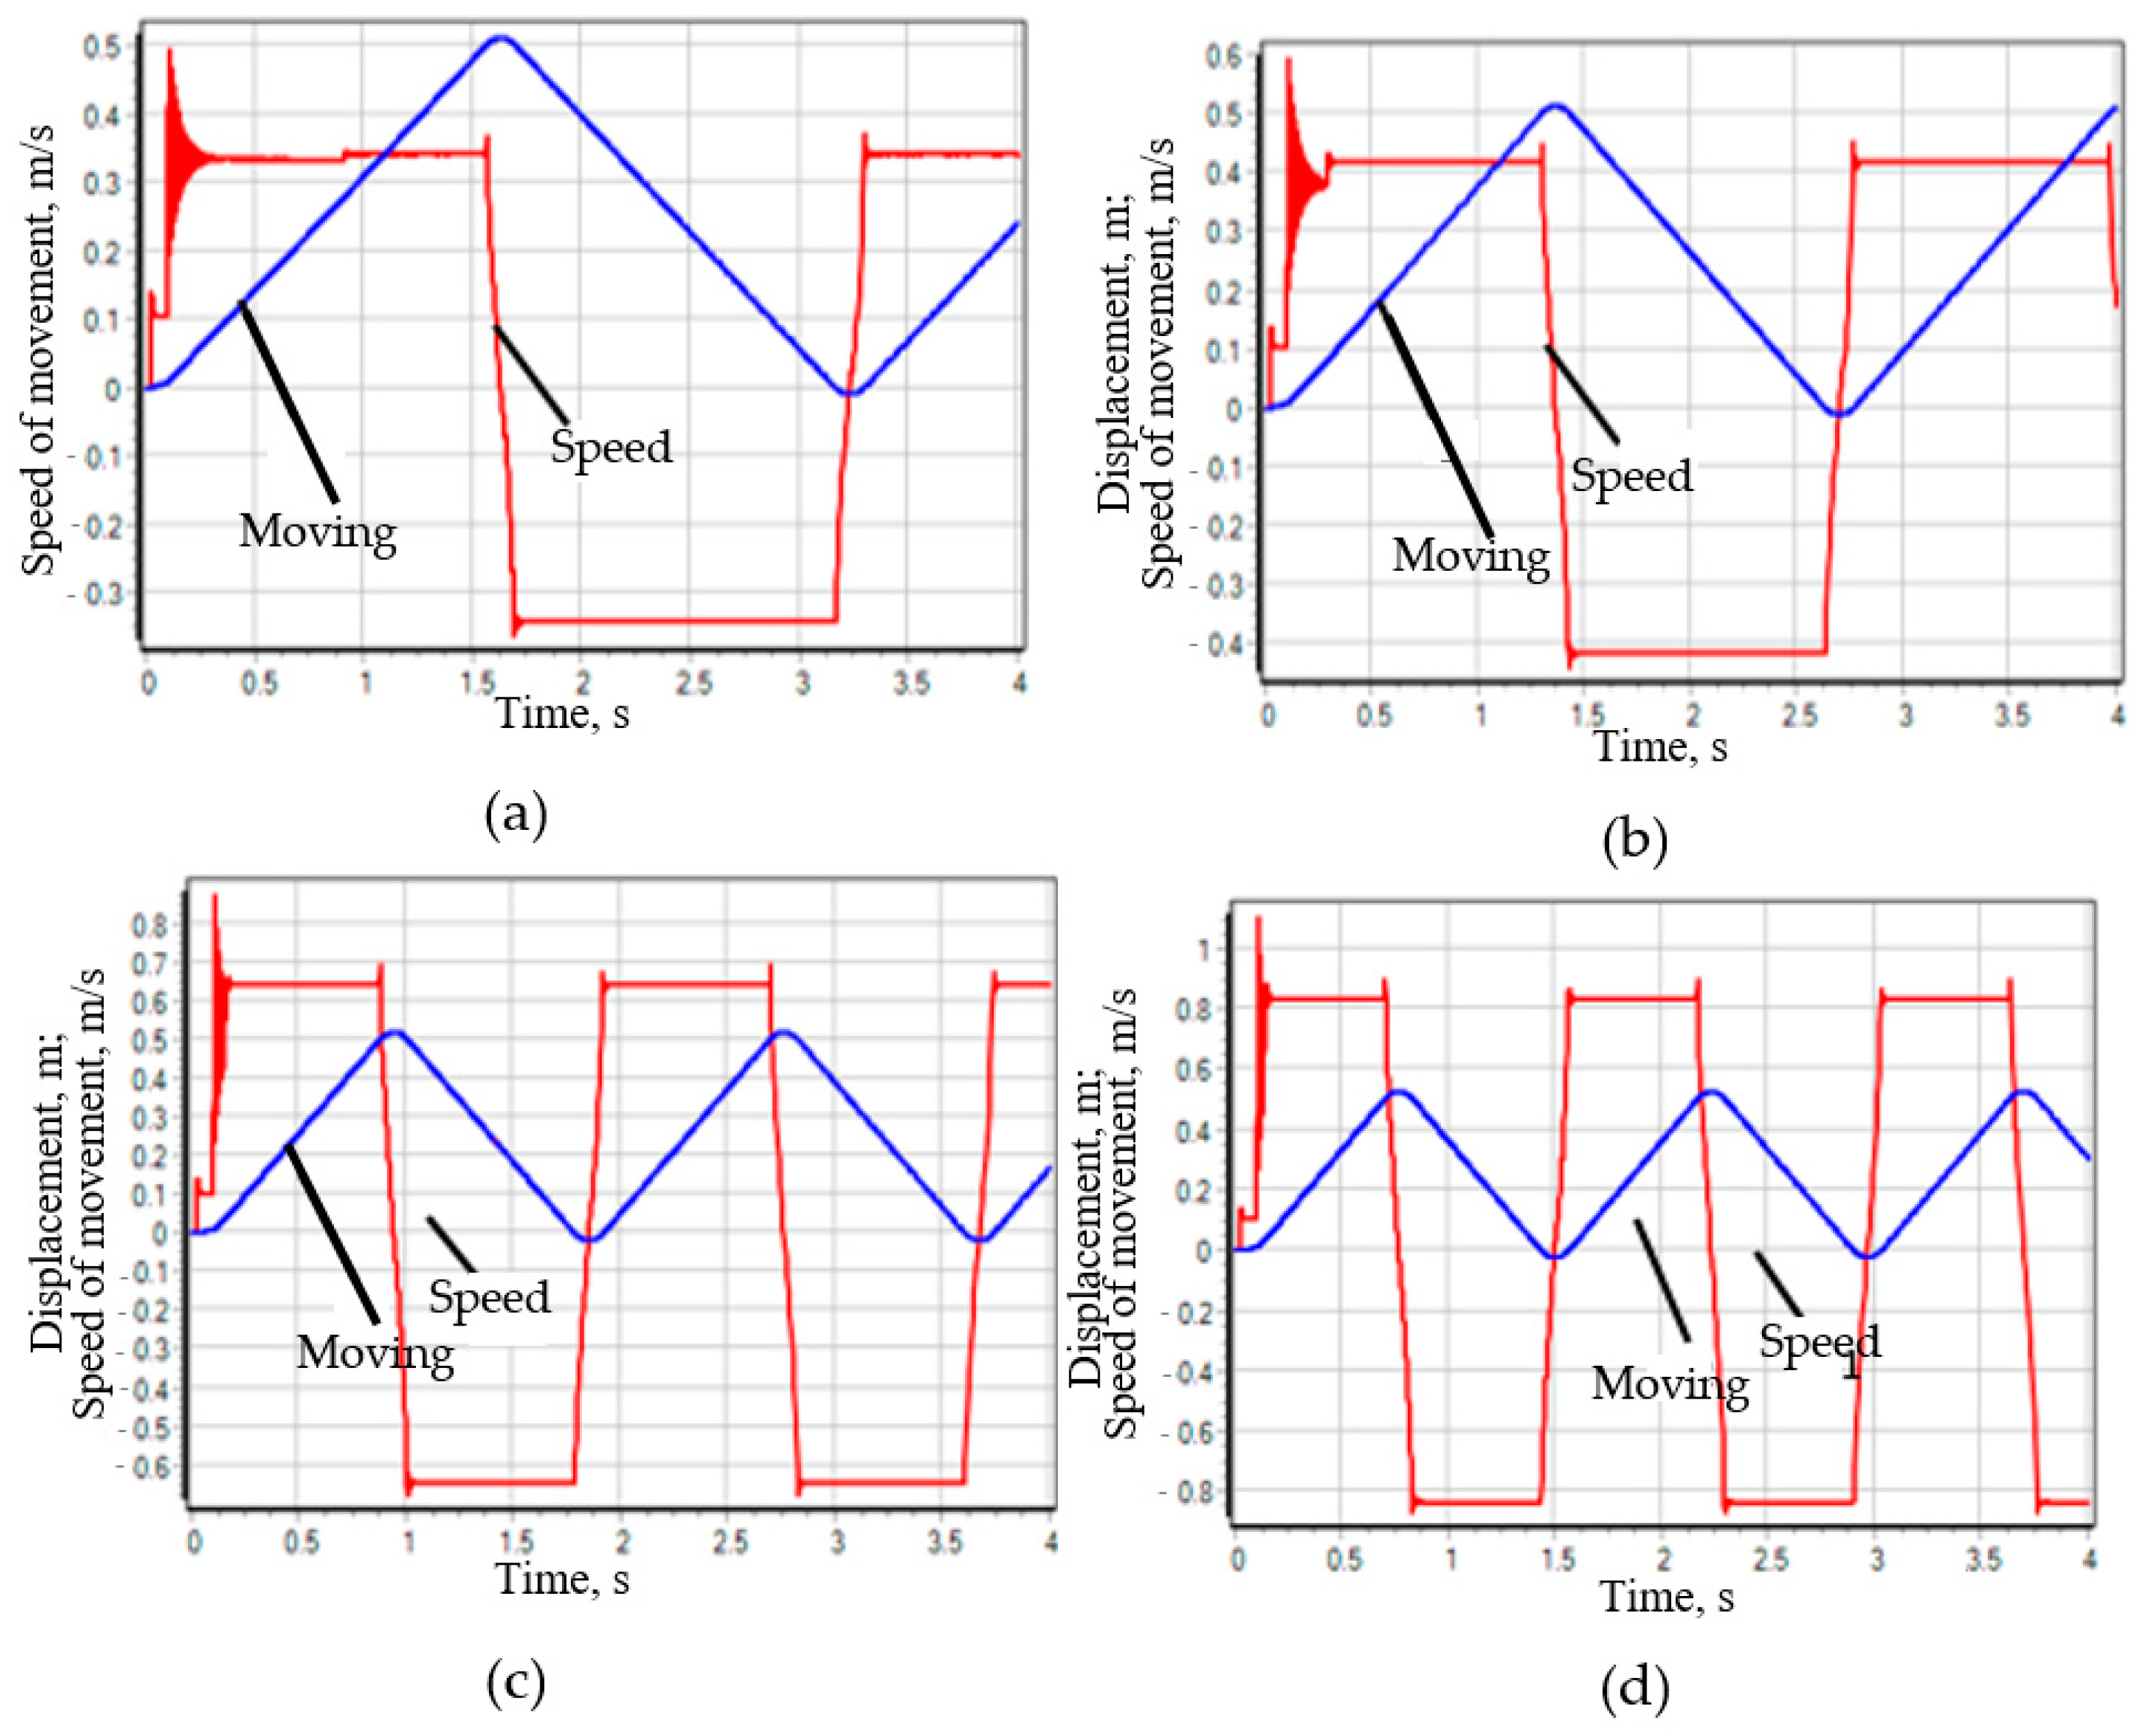
  • Scheme 44. During the transient process of the drive system equipped with a hydraulic distributor, the change in the speed of the plunger of the Hydraulic Cylinder 1 (Figure 5b) has an oscillatory damping character with a damping time of ~0.05 s and an overshoot magnitude >30%. In this case, the pressure at the outlet of the hydraulic pump increases twofold (up to 20 Mpa), which can be seen from Figure 5b. Such a significant surge in pressure in the system has a destructive effect on the power supply system of the stand, and therefore on its reliability.
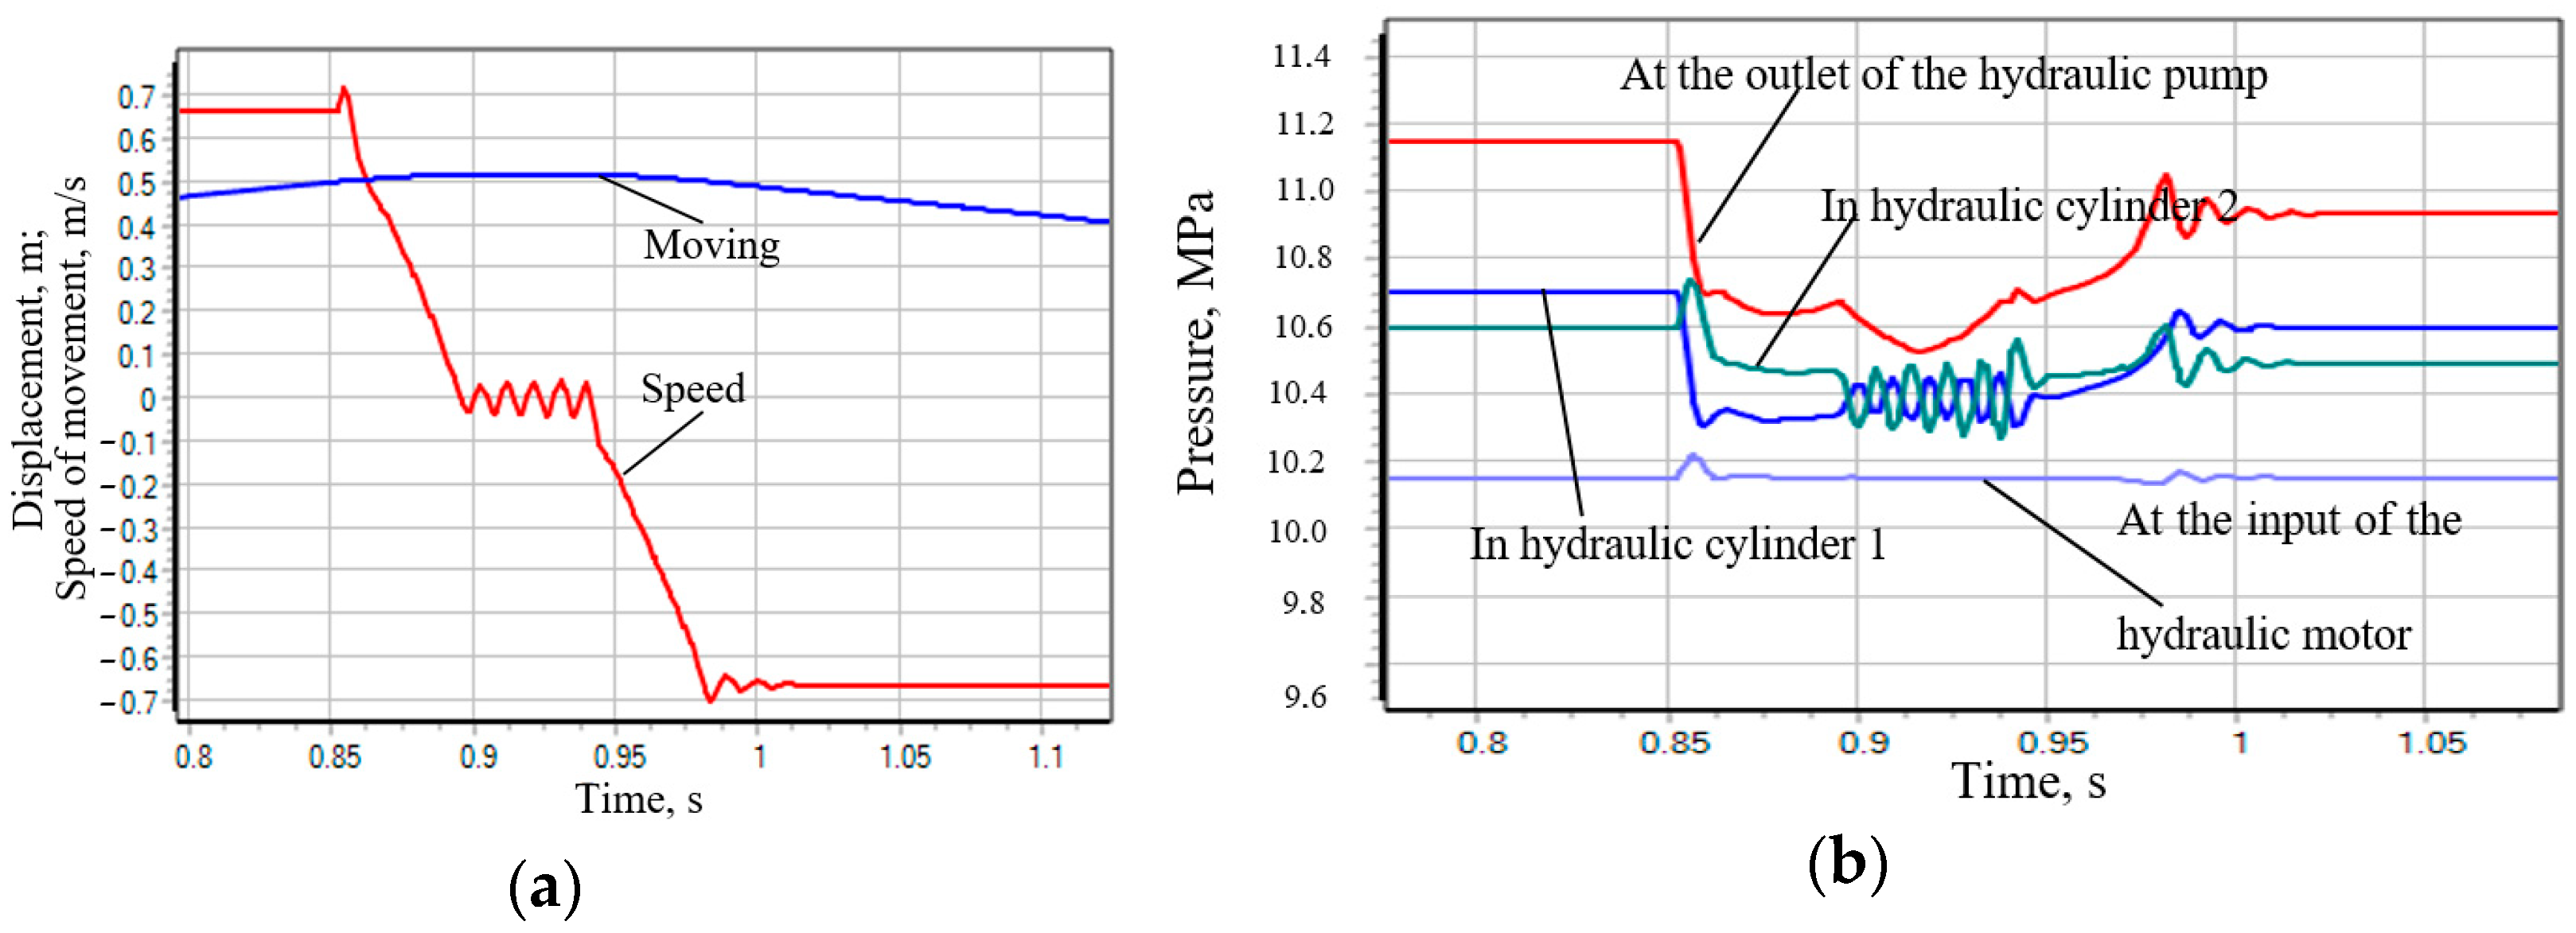
  • Scheme 64. The transient process of such a drive system compares favorably with diagram 44. Although the change in speed also has an oscillatory damping character (Figure 6a), the damping time in this case is two times less and the overshoot value has a very insignificant value (Figure 6a). However, when the spool of the hydraulic distributor passes the neutral position with the channels of hydraulic lines A and B closed, the plunger of the hydraulic distributor “rattles”, which is caused by the action of inertial forces, but the amplitude of the oscillations of the plunger of the hydraulic cylinder is not significant. From Figure 6b it is evident that the change in pressure in the channels of the system also has an oscillatory character, but the amplitude of these oscillations is not significant.
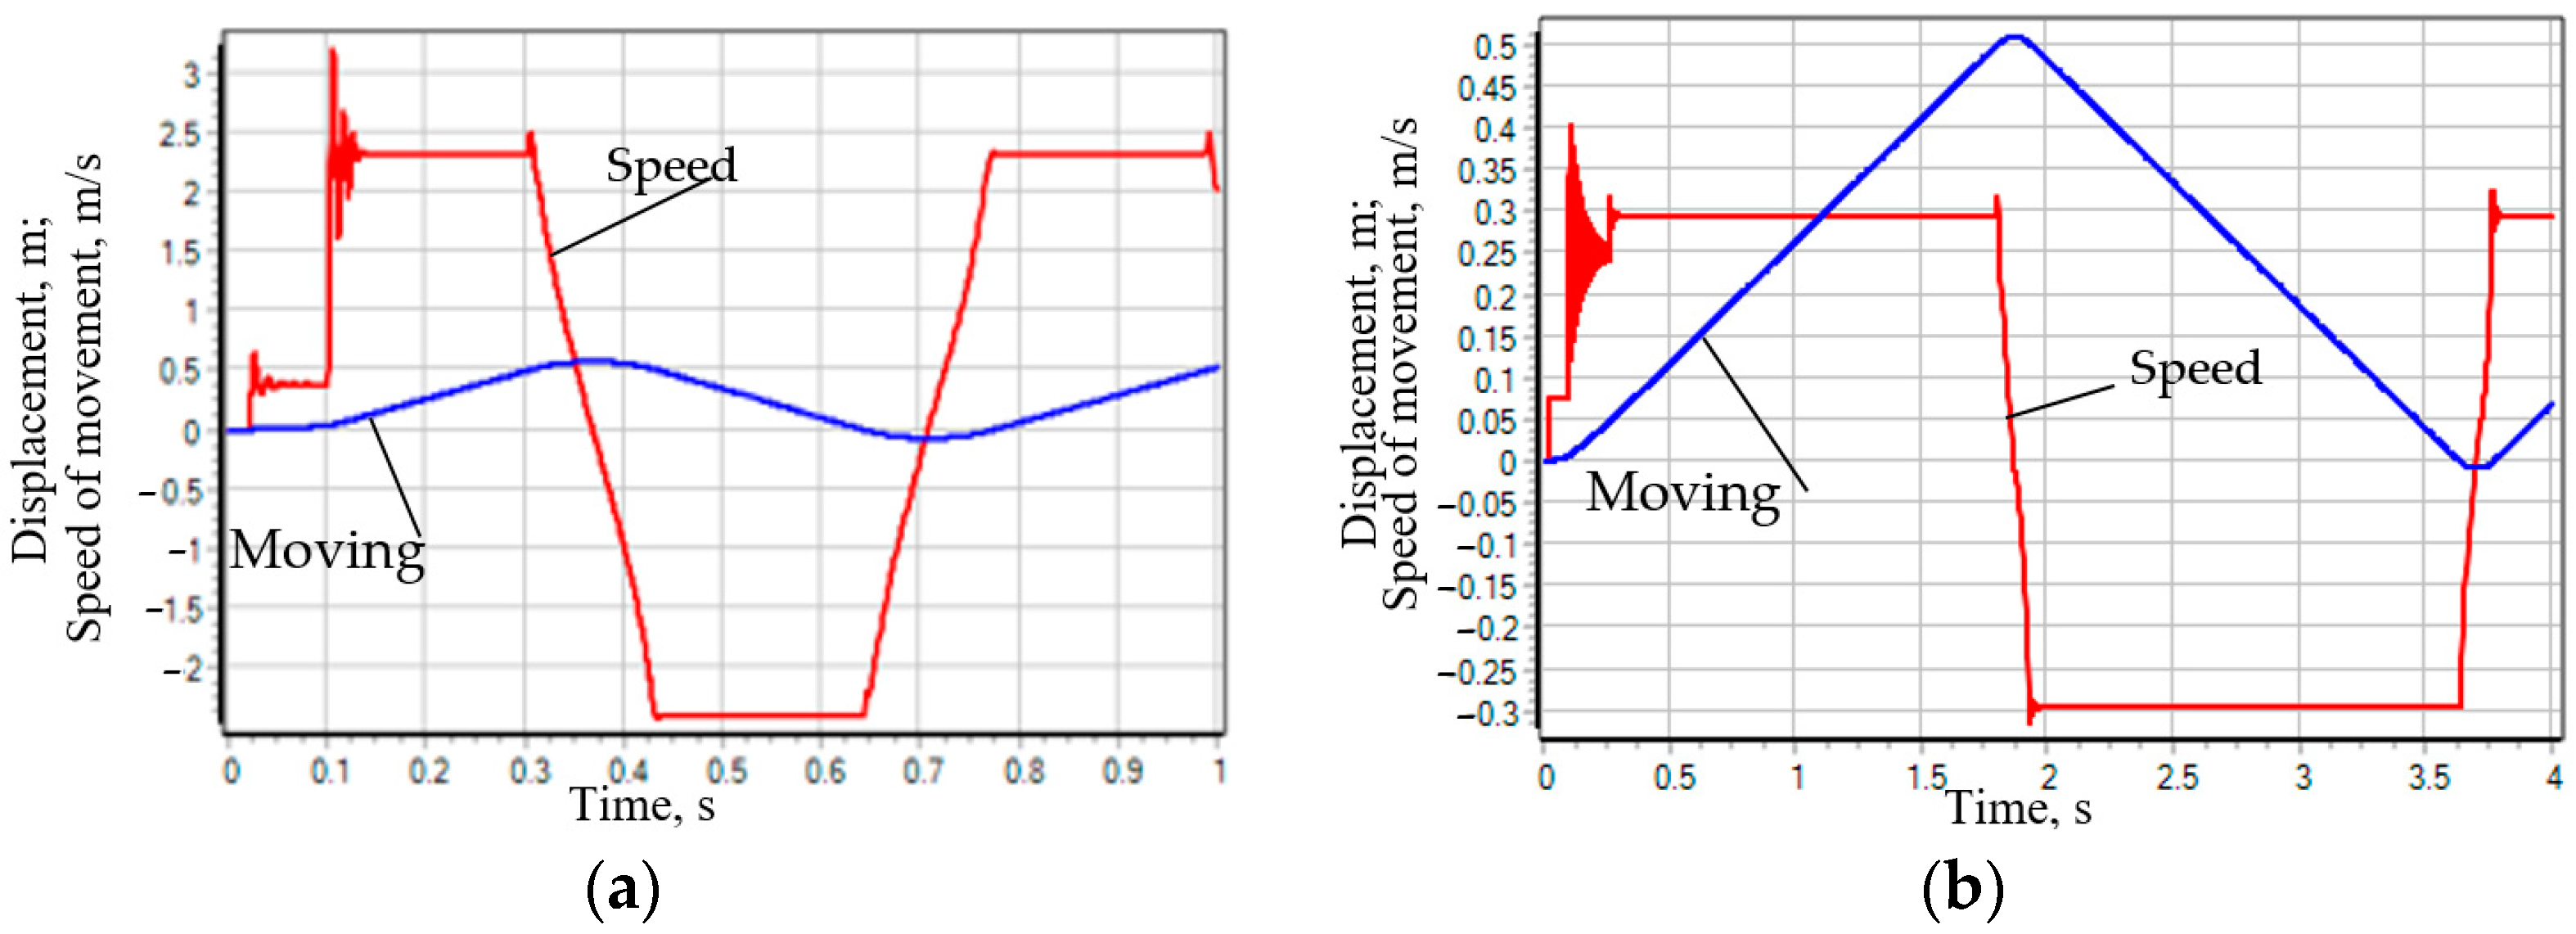
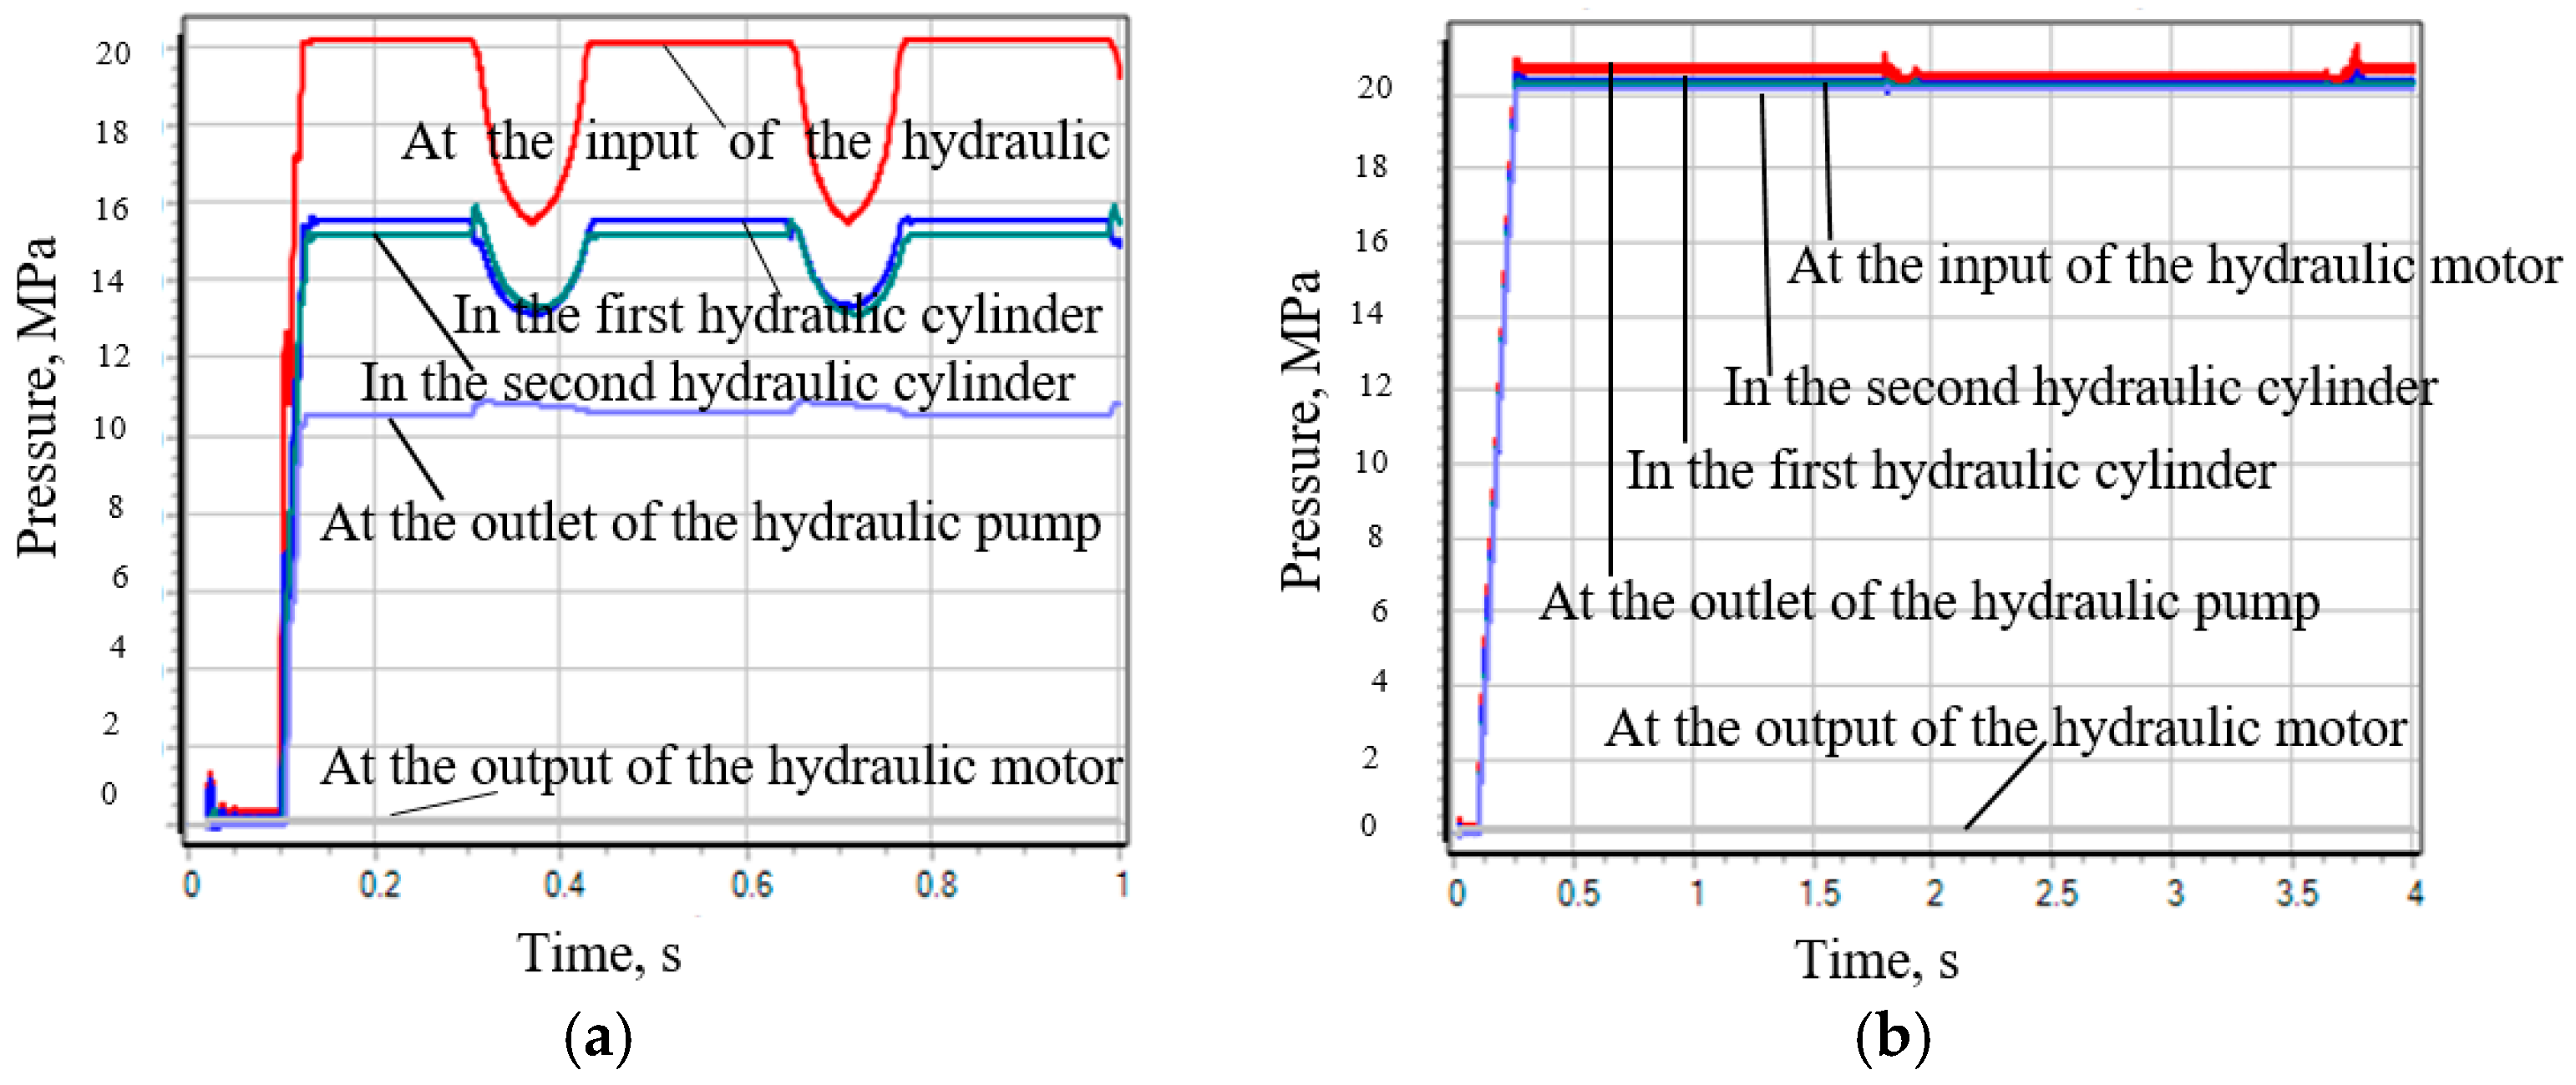
  • Scheme 14. The best characteristics of the transient process of the three considered cases are possessed by the hydraulic system of the stand drive, equipped with a hydraulic distributor, made according to scheme 14. From Figure 7b it is evident that the change in the speed of movement of the plunger of the hydraulic cylinder 1 is similar to the transient process of the system with the distributor of scheme 64, but with the distributor of scheme 14 there is no stop of the plunger in the neutral position of the distributor spool and there is no "chatter" of the speed in this position—the speed smoothly changes its sign with a very insignificant oscillatory process. The pressure in the system also changes smoothly with insignificant oscillations.
As a result, it can be concluded that the best dynamic characteristics of the design of the experimental setup of the stand are ensured by using a hydraulic distributor with an open center and switching scheme 14 or 64.

3.2. Study of the Influence of the Design Parameters of the Stand on Its Operational Characteristics

Modeling of various hydraulic distributor configurations and analysis of the obtained transient processes allowed us to determine the optimal type of device for the test bench which would provide the optimal dynamic characteristics. However, to obtain a bench with the optimal energy characteristics, it is also necessary to determine the rational design parameters of the bench, on which the value of the test efficiency coefficient largely depends.
For this purpose, a numerical experiment was conducted to identify the nature of the influence of various design parameters of the bench on the test efficiency coefficient.
Table 1 shows the variable design parameters of the bench, which were used in mathematical modeling and changed during the numerical experiment.

3.2.1. The Influence of the Gear Ratio i1_2 on the Performance Characteristics of the Stand

In the belt drives 1–2, the gear ratio is calculated as the ratio of the angular velocity of the electric motor shaft to the angular velocity of the hydraulic pump shaft.
i 1 _ 2 = ω e m ω h p ,
where ωem—electric motor shaft rotation speed, ωhp—hydraulic pump shaft rotation speed.
Then
ω h p = ω e m i 1 _ 2 ,
Increasing the value of the gear ratio i1_2 under unchanged operating conditions leads to a decrease in the rotation frequency of the pump shaft. This, in turn, directly affects the reduction in the flow rate of the working fluid, which ultimately affects the operational characteristics of the stand.
Figure 8 shows that increasing i1_2 reduces the plunger speed of the hydraulic cylinder under study, due to a decrease in the rotation speed and, consequently, the hydraulic pump performance. At the same time, the total displacement of the plunger remains constant, since it is determined exclusively by the plunger stroke length.
Figure 9 shows that the level of pressure loss in the hydraulic system is inversely proportional to the value of the gear ratio i1_2. Low values of i1_2 are accompanied by significant pressure losses, while high values are characterized by their practical absence. This is due to the fact that a decrease in i1_2 leads to an increase in pump performance and, as a consequence, to an increase in hydraulic losses.
Analysis of the data presented in Figure 10 shows that an increase in the gear ratio i1_2 is accompanied by a decrease in the power of all hydraulic machines. This is explained by a decrease in the rotation speed of the machines due to a decrease in the hydraulic pump feed with an unchanged load on the shafts.
It is evident from Figure 11 that with an increase in the gear ratio i1_2, the test efficiency coefficient first increases and then decreases. Such an ambiguous effect is explained by the fact that with an increase in the gear ratio i1_2 (with a decrease in the hydraulic pump performance), there is a significant decrease in harmful energy losses in the drive system of the tested machines and the efficiency coefficient increases, but a further decrease in the hydraulic pump performance (an increase in the gear ratio i1_2) leads to a decrease in the useful power on the tested hydraulic cylinders, and, consequently, to a decrease in the test efficiency coefficient.

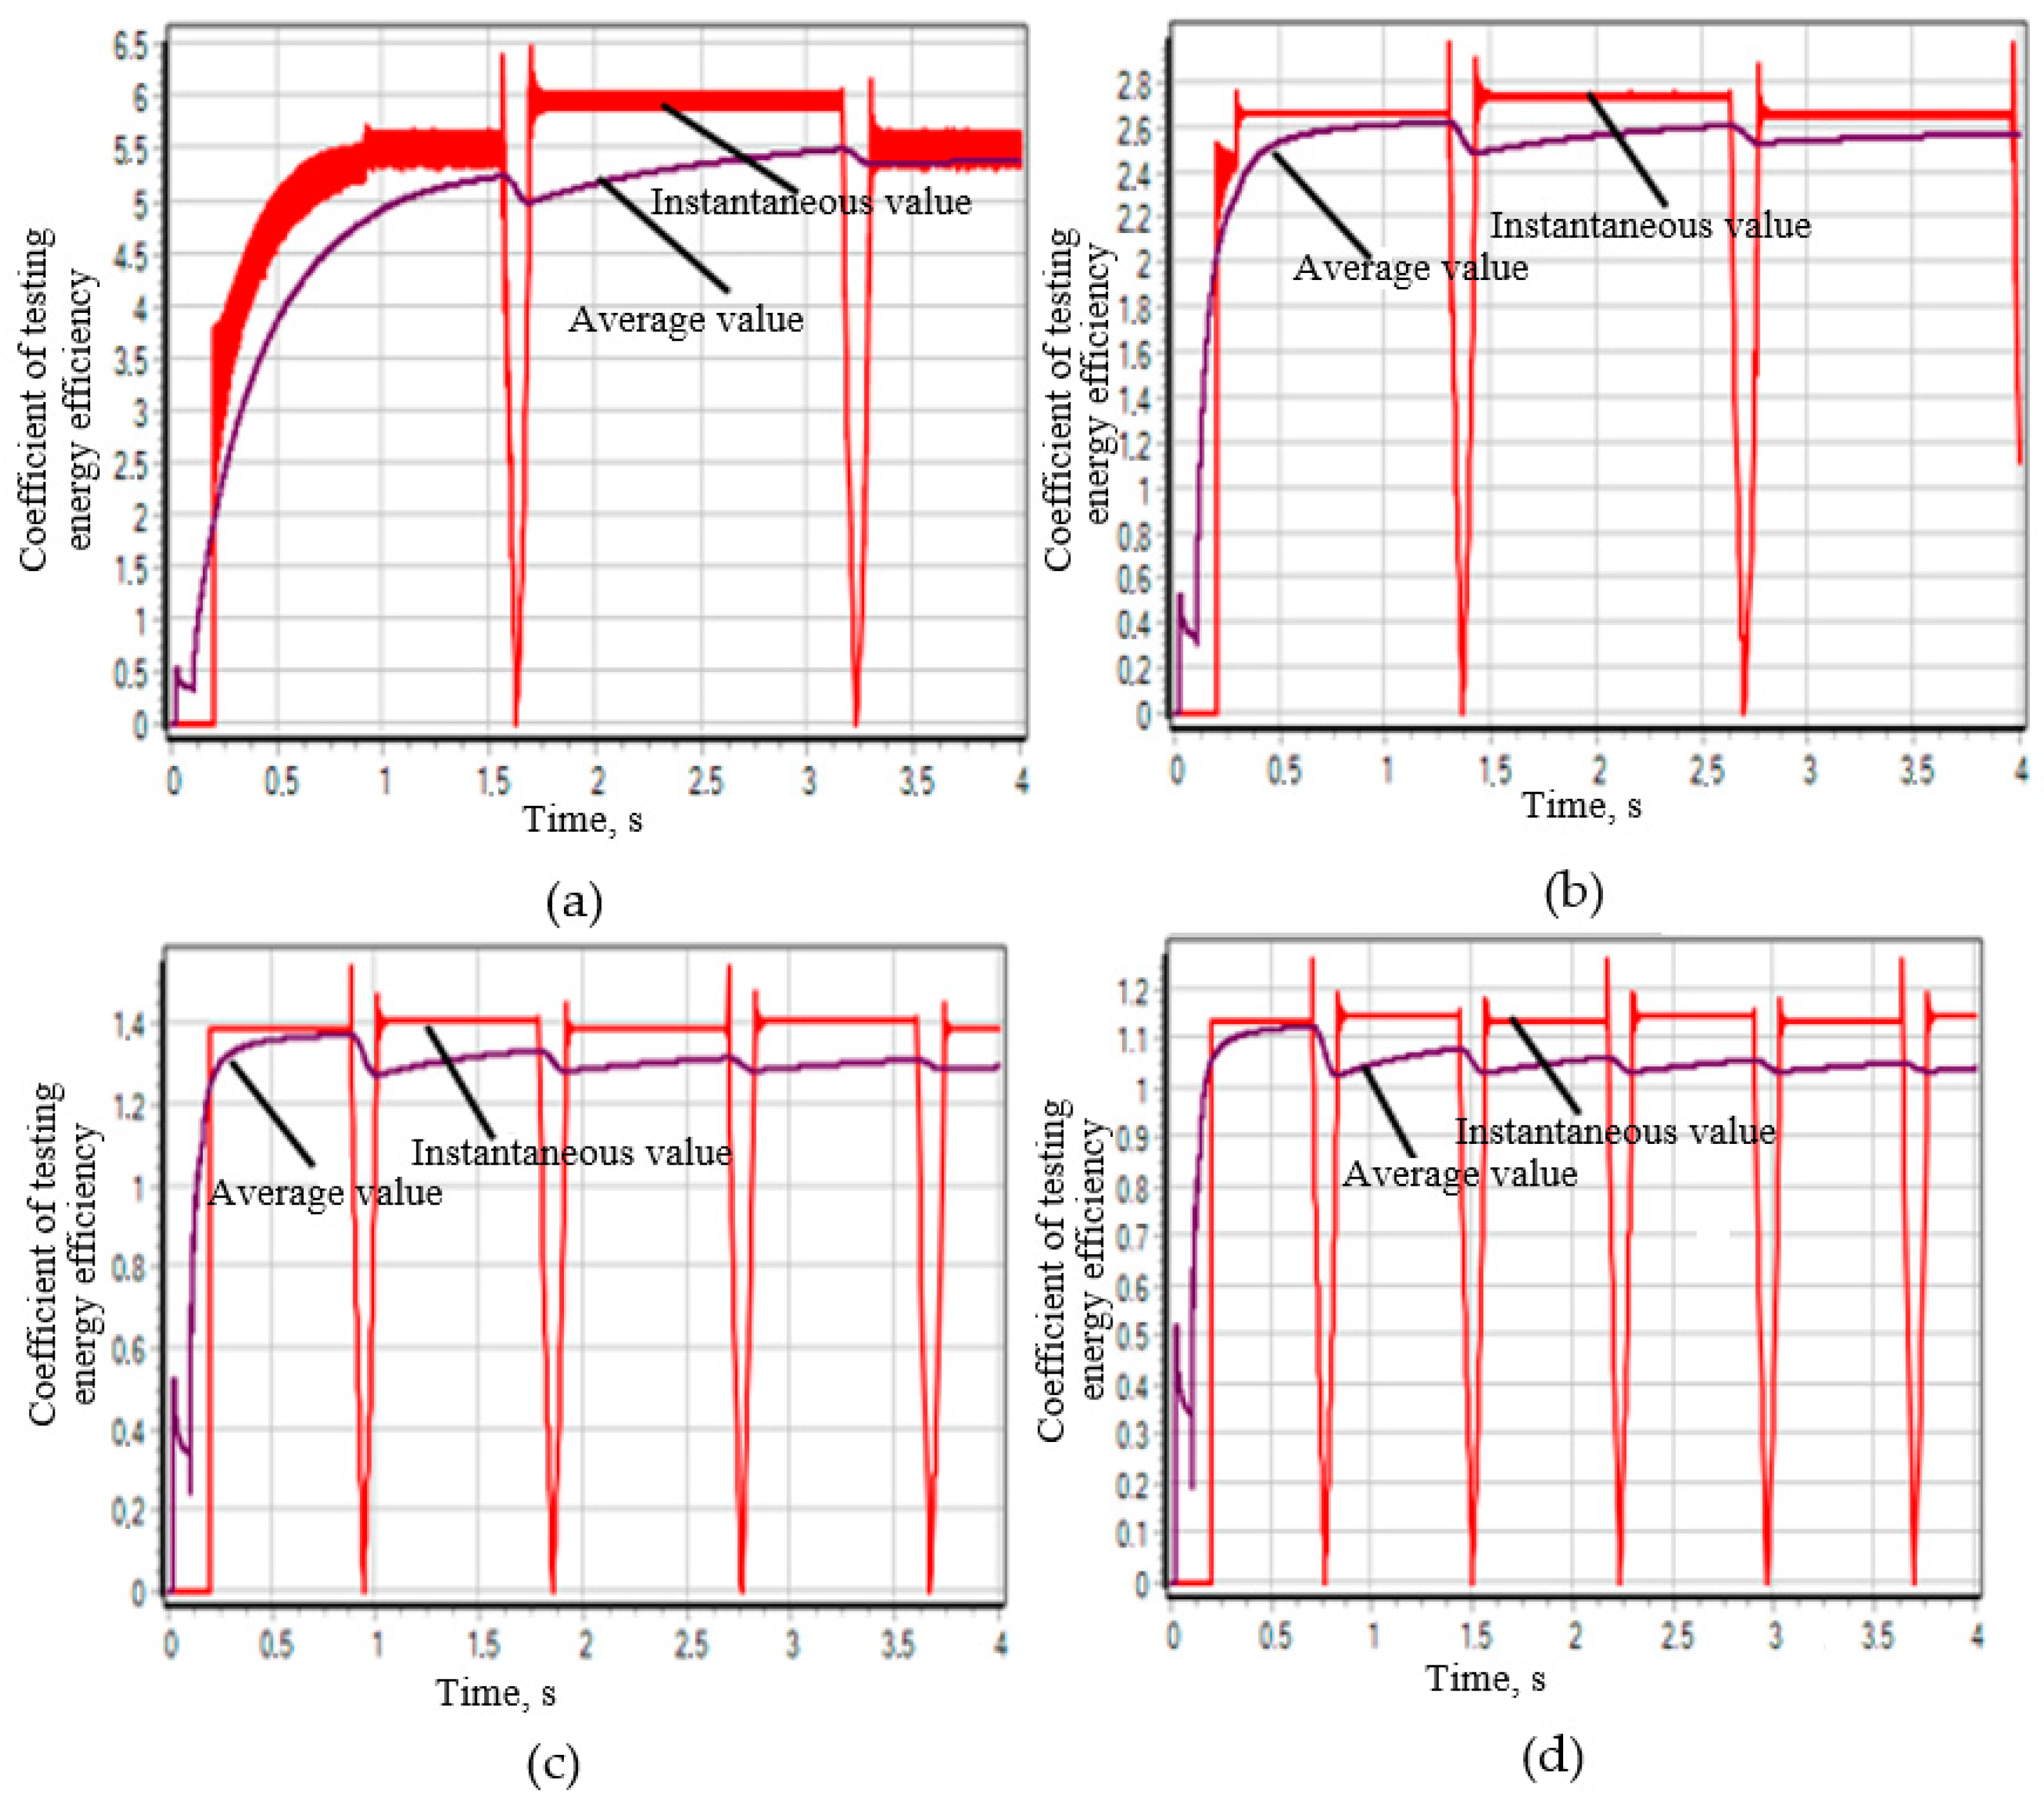
3.2.2. The Influence of the Gear Ratio i3_2 on the Performance Characteristics of the Stand

The second significant design parameter of the stand is the gear ratio i3_2, determined by the ratio of the torques of the hydraulic motor shafts Mhm and hydraulic pump Mhp.
i 3 _ 2 = M h p M h m .
Then, from the expression given above, the magnitude of the torque on the hydraulic pump shaft can be determined using the formula
M h p = i 3 _ 2 M h m   .
Increasing the gear ratio i3_2 (all other things being equal) leads to an increase in torque on the hydraulic pump shaft, transmitted from the hydraulic motor shaft. This, in turn, increases the useful power at the hydraulic pump output, which explains the effect of changing i3_2 on the rig’s characteristics.
Figure 12 demonstrates that the gear ratio i3_2 does not have a significant effect on the parameters of the hydraulic cylinder plunger movement. This is due to the fact that the rotation frequency of the hydraulic pump is determined exclusively by the rotation frequency of the electric motor and does not depend on the rotation frequency of the hydraulic motor, which ensures the constancy of the pump performance.
Also, the gear ratio i3_2 does not have a significant effect on the operating pressure in the test bench system. But the relationship between the power consumed by the electric motor and the gear ratio i3_2 is inverse, since an increase in i3_2 leads to a decrease in the consumed power, which is explained by an increase in the power transmitted from the hydraulic motor to the hydraulic pump. At the same time, the dependence of the test efficiency coefficient on the gear ratio i3_2 is direct—an increase in i3_2 contributes to an increase in efficiency. However, at i3_2 values approaching one, a violation of the recuperation process is observed, and the system operates as a traditional hydraulic drive.

3.2.3. Effect of the Angular Velocity of the Electric Motor on the Operational Characteristics of the Stand

With unchanged design parameters of the stand, a change in the angular velocity of the electric motor has a direct effect on its characteristics. Since the pump performance is directly proportional to the rotation speed of the electric motor, an increase in the rotation frequency of the electric motor leads to an increase in the pump performance and, as a consequence, to a change in the speed characteristics of the hydraulic drive. The dependences of the plunger motion parameters of hydraulic cylinder 1 on the rotation frequency of the electric motor are shown in Figure 13.
Figure 13 shows that with an increase in the angular velocity of the electric motor shaft from 50 to 250 rad/s, the displacement does not change because the plunger stroke is limited, and the speed of movement of the hydraulic cylinder plunger increases due to an increase in the hydraulic pump feed.
Significant pressure losses are shown in Figure 14b due to the increase in the flow rate of the working fluid; with a decrease in the angular velocity of the electric motor, losses are practically absent.
The graphs in Figure 15 show that with an increase in the angular velocity of the electric motor shaft, the power on all hydraulic machines of the stand increased, due to an increase in the productivity of the hydraulic pump.
It is evident from the graphs in Figure 16 that the efficiency factor of the tests decreases with increasing angular velocity of the electric motor shaft. This is explained by a significant increase in non-productive energy losses in the hydraulic system due to internal friction and control with increasing hydraulic pump performance.

3.2.4. Effect of the Pressure Setting of the Discharge Valve on the Performance Characteristics of the Rig

A key factor affecting the performance of the test rig is the pressure setting of the relief valve. This valve, which is an integral part of the recuperative system, controls the load on the tested hydraulic cylinders. Unlike a simple relief valve, which is focused solely on protection against excess pressure, this component actively regulates the power supply. This is due to the fact that the pump power is a function of both the flow rate and the supply pressure: an increase in the valve pressure setting directly leads to a higher output power to the test cylinders.
Calculations confirmed that the parameters of the plunger movement of the tested hydraulic cylinders do not change depending on the setting pressure of the valve KP2, since the pressure does not affect the speed parameters of the volumetric hydraulic drive. It should be noted that an increase in the setting pressure of the valve KP2 leads to an increase in pressure on the elements of the hydraulic system as a whole, since the safety valve KP1 is set to a higher pressure level.
As can be seen from Figure 17, with an increase in the setting pressure of the pressure valve KP2, the power of the hydraulic pump, hydraulic cylinder 1, and hydraulic motor increases. In Figure 17a,b, the power of the electric motor exceeds the power of the hydraulic motor at low values of the setting pressure of the valve KP2 due to the low level of power transmitted from the hydraulic motor to the shaft of the hydraulic pump—low recuperated power.
In this case, an increase in the setting pressure of the pressure valve KP2 leads to a completely insignificant increase in the test efficiency coefficient.

3.2.5. Effect of the Hydraulic Motor Working Volume on the Performance Characteristics of the Test Bench

Analysis of the effect of the hydraulic motor working volume on the performance of the test bench requires consideration of the inverse relationship between the engine speed and the working volume. With other parameters remaining constant, a decrease in the engine working volume requires an increase in its rotation speed to maintain the operating parameters. However, the speed of the hydraulic motor is determined by the speed of the hydraulic pump, which is mechanically connected to it. As a result, the pressure at the hydraulic motor inlet will increase and most of the working fluid will be discharged into the hydraulic tank through the pressure relief valve KP2.
The analysis of the obtained calculation results showed the following:
a change in the working volume of the hydraulic motor does not affect the parameters of the hydraulic cylinder rod movement, since the hydraulic motor and the pressure valve KP2 are located after the hydraulic cylinders;
it has no effect of the working volume of the hydraulic motor on the pressure value on the hydraulic machines of the designed stand, since its value is specified and limited by the set pressure of the pressure valve KP2;
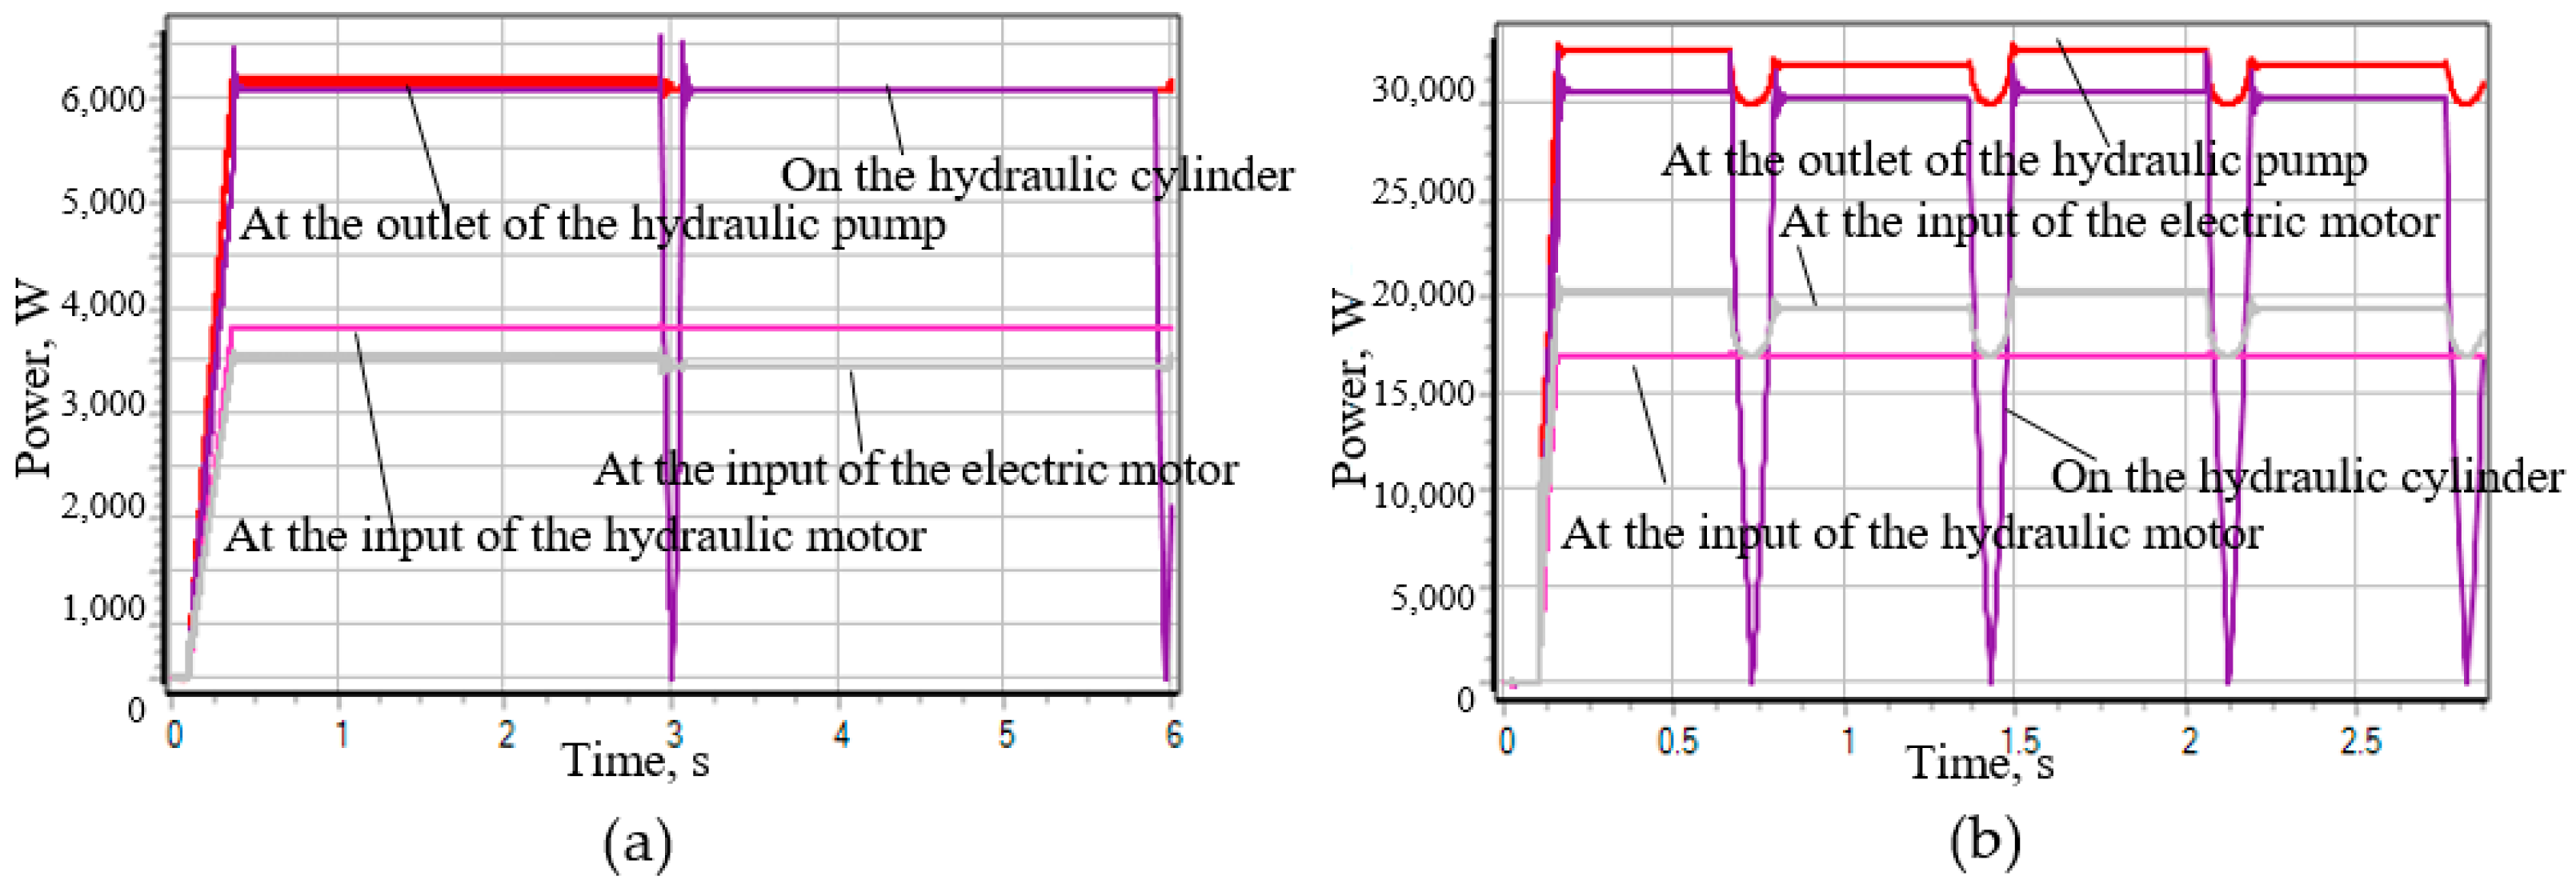
an increase in the working volume of the hydraulic motor leads to an increase in the transmitted power to the shaft of the hydraulic pump, accompanied by a decrease in the power consumed by the electric motor.
From Figure 18, we can conclude that with an increase in the working volume of the hydraulic motor, the efficiency factor of the test rig increases and that with a working volume of the hydraulic motor equal to 100 cm3, the expended power (at the input of the electric motor) is almost three times less than the power on the tested hydraulic cylinders, and the efficiency factor of the tests is 3.5 (Figure 18d).

3.2.6. Influence of the Working Volume of the Hydraulic Pump on the Performance Characteristics of the Rig

This section examines the influence of the working volume of the hydraulic pump on the overall performance of the test rig. To eliminate the influence of the working volume, all other design parameters of the test rig were maintained at constant values throughout the experiment. The relationship between the working volume of the pump and its volumetric flow rate is well known: a larger working volume directly leads to a higher flow rate, which, in turn, increases the power transmitted through the hydraulic fluid. The effect of this increased power on the dynamic behavior of the hydraulic cylinder is shown graphically in Figure 19, which shows the movement of the cylinder plunger as a function of time for different pump displacements.
Figure 19 shows a clear positive correlation between the hydraulic pump displacement and the piston speed of the hydraulic cylinder. This relationship is directly related to the increase in flow rate created by the pump as its displacement increases. A higher flow rate results in a larger volume of hydraulic fluid being delivered to the cylinder per unit of time, thereby accelerating the piston movement.
There is a direct correlation between the displacement of a hydraulic pump and the pressure in the system. The increase in system pressure is a consequence of the increase in flow rate due to increased displacement. This increase in flow rate results in a greater pressure drop across the various components of the hydraulic system due to friction losses and other flow resistances. Therefore, the higher the flow rate, the greater the pressure drop, resulting in a net increase in the operating pressure in the system. Increasing the displacement of a hydraulic pump increases the power delivered to the hydraulic system. However, this additional power is largely consumed by friction losses and the hydraulic motor control system. The power returned by the motor depends on the pressure setting of the KP2 valve, which results in a significant increase in the power consumption of the electric motor.
Figure 20 shows that the maximum efficiency of the tests is achieved with small values of the working volume of the hydraulic pump, and therefore with small values of its productivity. This is due to the minimal losses due to friction in the hydraulic system and the energy spent on controlling the recuperation.
Thus, the study of the mathematical model of the functioning of the test bench for testing plunger hydraulic cylinders showed the following:
  • Optimum dynamics of the test rig’s hydraulic system are achieved by using open center hydraulic valves using 14 and 64 switching configurations.
  • The efficiency of the test is primarily determined by the working volume of the hydraulic motor, the working volume of the pump, and the gear ratio (i3_2) between the hydraulic motor and the pump, and is less dependent on the pressure setting of the relief valve or the speed of the drive motor.
  • Gear ratio (i1_2) between the electric motor and the hydraulic motor has a minor effect on the test efficiency, which is determined mainly by the characteristics of the hydraulic cylinders being tested. However, at low values of i1_2, a system failure is possible, which may lead to its unstable operation.
  • Changing the working volume of the hydraulic pump is impossible, since the hydraulic pump is selected based on the condition of ensuring the high-speed operating mode of the tested hydraulic cylinders. The main parameter for optimizing the energy efficiency of testing hydraulic cylinders on this stand is the gear ratio (i3_2) hydraulic power transmission between the hydraulic motor and the pump, which is a key component of the recuperation system.
  • The proposed mathematical model considers simplified system operating conditions such as no energy losses and constant motor speed. On the one hand, these assumptions allow us to simplify the analysis of processes and facilitate understanding of the basic regularities of the behavior of this system. However, in further research it is important to bring the results of modeling to the real conditions of equipment operation as much as possible. The complete absence of assumptions in modeling will provide an adequate theoretical basis for the design and optimization of complex technical systems.
On the basis of the results of the conducted investigations, the experimental test bench for the resource testing of plunger hydraulic cylinders was developed and framed (Figure 21).

4. Conclusions

The analysis of the results of the conducted research confirms the correctness of the hypothesis on the possibility of effective energy recovery during testing of reciprocating hydraulic machines. The proposed mathematical model of the drive system of the test bench for testing plunger hydraulic cylinders guarantees the analysis of the impact of design and functional parameters on the dynamic properties and energy efficiency of the drive already at the design stage.
Thus, the goal set in this study has been achieved—effective energy recovery during testing of plunger hydraulic cylinders using the proposed regenerative drive system of the test bench for testing plunger hydraulic cylinders has been confirmed.
The work is carried out as part of the project “Development of a new technology for differentiated harvesting of cereal crops” (FZNE-2024-0014)

5. Patents

Rybak A.T., Tsybri I.K., Pelipenko A.Yu. Test bench for hydraulic motors and pumps with energy recovery/Patent for utility model 204153 U1, 11 May 2021. Application No. 2020134672 dated 22 October 2020.

Author Contributions

Conceptualization, A.R.; Formal analysis, A.R. and Y.S.; Funding acquisition and project administration, B.M. and D.R.; Investigation S.T., A.P. and Y.S.; Methodology, A.R.; Supervision, A.R., B.M., D.R. and A.O.; Validation, A.R. and B.M.; Visualization, S.T. and A.P.; Writing—original draft, A.P.; Writing—review and editing, A.O. and S.T. All authors have read and agreed to the published version of the manuscript.

Funding

The work is carried out as part of the project “Development of a new technology for differenti-ated harvesting of cereal crops” (FZNE-2024-0014).

Data Availability Statement

Rybak A.T. Theory and methodology of calculation and design of drive systems of technological machines and agribusiness units/dissertation for the degree of Doctor of Technical Sciences/Don State Technical University. Rostov-on-Don, 2011. Pelipenko A.Yu. Improving the efficiency of the hydromechanical drive system of the service life testing stand of plunger hydraulic cylinders/dissertation for the degree of Candidate of Technical Sciences/Don State Technical University. Rostov-on-Don, 2022. Patents: RU 204153 U1, 11 May 2021; RU 2796721 C1, 29 May 2023; RU 2811221 C1, 11 Janaury 2024.

Conflicts of Interest

The authors declare no conflicts of interest.

References

  1. Minav, T.; Heikkinen, J.; Pietola, M. Direct driven hydraulic drive for new powertrain topologies for non-road mobile machinery. Electr. Power Syst. Res. 2017, 152, 390–400. [Google Scholar] [CrossRef]
  2. Zhang, Q.; Kong, X.; Yu, B. Review and Development Trend of Digital Hydraulic Technology. Appl. Sci. 2020, 10, 579. [Google Scholar] [CrossRef]
  3. Kepekciand, H.; Ezgi, C. Thermodynamic Analysis of a Marine Diesel Engine Waste Heat-Assisted Cogeneration Power Plant Modified with Regeneration Onboard a Ship. J. Mar. Sci. Eng. 2024, 12, 1667. [Google Scholar] [CrossRef]
  4. Mu, H.; Luo, Y.; Luo, Y.; Chen, L. Numerical Analysis of Energy Recovery of Hybrid Loader Actuators Based on Parameters Optimization. Actuators 2022, 11, 260. [Google Scholar] [CrossRef]
  5. Nikonov, V.O.; Posmetyev, V.I.; Kozlov, E.V.; Borodkin, V.O. Analysis of the structural energies of hydraulic technological machines with the recovery of the potential energy of the working body with a cargo. Voronezh Sci. Tech. Bull. 2019, 27, 4–17. [Google Scholar]
  6. Fei, C.W.; Li, C.; Lin, J.Y.; Han, Y.J.; Choy, Y.S.; Chen, C.H. Structural design of aeroengine radiators: State of the art perspectives. Propuls. Power Res. 2024, 13, 319–334. [Google Scholar] [CrossRef]
  7. Ho, T.H.; Kyoung-Kwan, A. Saving energy control of cylinder drive using hydraulic transformer combined with an assisted hydraulic circuit. In Proceedings of the ICCAS-SICE 2009, Fukuoka, Japan, 18–21 August 2009. [Google Scholar]
  8. Ho, T.H.; Le, T.D. Development and Evaluation of Energy-Saving Electro-Hydraulic Actuator. Actuators 2021, 10, 302. [Google Scholar] [CrossRef]
  9. Karpenko, M.M.; Pelevin, L.E.; Bogdevicius, M.P. The Prospect of Using Hydraulic Energy-Saving Drive. Technical and Technological Problems of the Service. 2017. No. 3(41), 7–12. Available online: https://unecon.ru/wp-content/uploads/2022/09/num41.pdf (accessed on 25 April 2025).
  10. Yu, Y.X.; Ahn, K.K. Optimization of energy regeneration of hybrid hydraulic excavator boom. Energy Convers. Manag. 2019, 183, 26–34. [Google Scholar] [CrossRef]
  11. Huova, M.; Aalto, A.; Linjama, M.; Huhtala, K. Study of Energy Losses in Digital Hydraulic Multi-Pressure Actuator. In Proceedings of the 15th Scandinavian International Conference on Fluid Power, SICFP’17, Linköping, Sweden, 7–9 June 2017; pp. 214–223. Available online: https://ep.liu.se/ecp/144/021/ecp17144021.pdf (accessed on 25 April 2025).
  12. Xiao, Q.; Wang, Q.; Zhang, Y. Control strategies of power system in hybrid hydraulic excavator. J. Autom. Constr. 2008, 17, 361–367. [Google Scholar] [CrossRef]
  13. Minav, T.; Hänninen, H.; Sinkkonen, A.; Laurila, L.; Pyrhönen, J. Electric or Hydraulic Energy Recovery Systems in a Reach Truck. J. Mech. Eng. 2014, 4, 232–240. [Google Scholar] [CrossRef]
  14. Ho, T.H.; Ahn, K.K. Design and control of a closed-loop hydraulic energy regenerative system. J. Autom. Constr. 2012, 22, 444–458. [Google Scholar] [CrossRef]
  15. Minav, T.; Immonen, P.; Laurila, L.; Vtorov, V.; Pyrhönen, J.; Niemelä, M. Electric energy recovery system for a hydraulic forklift—Theoretical and experimental evaluation. IET Electr. Power Appl. 2011, 5, 377–385. [Google Scholar] [CrossRef]
  16. Pourmovahed, A.; Beachey, N.; Fronczak, F. Modeling of a Hydraulic Energy Regeneration System—Part I: Analytical Treatment. ASME 1992, 114, 155–159. [Google Scholar] [CrossRef]
  17. Järf, A. Flow Compensation Using Hydraulic Accumulator in Direct Driven Hydraulic Differential Cylinder Application and Effects on Energy Efficiency. Master’s Thesis, Aalto University, Espoo, Finland, 2016. [Google Scholar]
  18. Bashta, T.M. Mashine Building Hydraulics; Mashine Building: Moscow, Russia, 1971; p. 672. [Google Scholar]
  19. Nikitin, O.F. Reliability, Diagnostics and Operation of Hydraulic Drive of Mobile Objects; Publishing House of Bauman Moscow State Technical University: Moscow, Russia, 2007; pp. 262–264. [Google Scholar]
  20. Zenin, A.R.; Rybak, A.T.; Beskopylny, A.N.; Pelipenko, A.; Serdyukova, Y. Test bench for reciprocating hydraulic cylinders with energy recovery: Structure, modeling and calculation. Adv. Eng. Res. Rostov Don 2024, 24, 347–359. [Google Scholar] [CrossRef]
  21. Kandokov, L.A.; Golubev, A.I.; Ovander, V.B.; Gordeev, V.V.; Furmanov, B.A.; Karmugin, B.V. Seals and Sealing Technology: A Reference Book; Mashinostroenie: Moscow, Russia, 1986; 464p. [Google Scholar]
  22. Rybak, A.; Meskhi, B.; Pelipenko, A.; Odabashyan, M.; Alentsov, E. Mathematical modelling of the hydromechanical drive of the test bench for plunger hydraulic cylinders with energy recovery. E3S Web Conf. 2023, 413, 02047. [Google Scholar] [CrossRef]
  23. Abalov, A.A.; Nosachev, S.V.; Zharov, P.; Minko, V.A. Using the simintech dynamic modeling environment to build and check the operation of automation systems. MATEC Web Conf. 2018, 226, 04003. [Google Scholar] [CrossRef]
Figure 1. Structural diagram of the experimental test rig for plunger hydraulic cylinders with energy recovery: IM—kilowattmeter; ED—electric motor; H—hydraulic pump; MP—mechanical transmission; M—hydraulic motor; DD1…DD4—pressure sensors; DO1 and DO2—speed sensors; DP—rotation sensor; GTs1 and GTs2—hydraulic cylinders; KS—mechanical transmission; GR—hydraulic distributor; AMCS—automatic monitoring and control system.
Designs 09 00053 g001
Figure 2. Hydrokinematic diagram of the test rig for plunger hydraulic cylinders with energy recovery: 1—hydraulic pump (H); 2 and 8—safety valve; 3—hydraulic distributor (GR); 4—rig frame; 5, 7—plunger hydraulic cylinders (GTs1 and GTs2); 6—rocker arm (KS); 9 and 11—check valve; 10—hydraulic motor (M); 12 and 14—mechanical transmission (MP); 13—electric motor (ED).
Designs 09 00053 g002
Figure 3. Test efficiency coefficient.
Designs 09 00053 g003
Figure 4. Connection diagrams of the hydraulic distributor with main and intermediate positions: (a) diagram 14, (b) diagram 64, (c) diagram 44.
Designs 09 00053 g004
Figure 5. Change in system characteristics when using hydraulic distributor circuit 44: (a) parameters of the movement of the hydraulic cylinder plunger; (b) pressure of the transient process of the hydraulic distributor.
Designs 09 00053 g005
Figure 6. Change in system characteristics when using hydraulic distributor circuit 64: (a) parameters of the movement of the plunger of the hydraulic cylinder; (b) pressure of the transient process of the hydraulic distributor.
Designs 09 00053 g006
Figure 7. Change in the characteristics of the system when using the hydraulic distributor circuit 14: (a) parameters of the movement of the plunger of the hydraulic cylinder; (b) pressure of the transient process of the hydraulic distributor.
Designs 09 00053 g007
Figure 8. Parameters of movement of the plunger of the hydraulic cylinder (a) i1_2 = 0.2; (b) i1_2 = 1.8.
Designs 09 00053 g008
Figure 9. Pressure change: (a) i1_2 = 0.2; (b) i1_2 = 1.8.
Designs 09 00053 g009
Figure 10. Change power: (a) i1_2 = 0.2; (b) i1_2 = 0.6; (c) i1_2 = 1.4; (d) i1_2 = 1.8.
Designs 09 00053 g010
Figure 11. Test efficiency coefficient: (a) i1_2 = 0.2; (b) i1_2 = 0.6; (c) i1_2 = 1.4; (d) i1_2 = 1.8.
Designs 09 00053 g011
Figure 12. Parameters of movement of the hydraulic cylinder plunger: (a) i3_2 = 0.2; (b) i3_2 = 1.
Designs 09 00053 g012
Figure 13. Parameters of movement of plunger of hydraulic cylinder 1: (a) ωem = 50 rad/s; (b) ωem = 250 rad/s.
Designs 09 00053 g013
Figure 14. Pressure change: (a) ωem = 50 rad/s; (b) ωem = 250 rad/s.
Designs 09 00053 g014
Figure 15. Power change: (a) ωem = 50 rad/s; (b) ωem = 250 rad/s.
Designs 09 00053 g015
Figure 16. Test efficiency coefficient: (a) ωem = 50 rad/s; (b) ωem = 250 rad/s.
Designs 09 00053 g016
Figure 17. Change in power: (a) pKP2 = 4 Mpa; (b) pKP2 = 7 Mpa; (c) pKP2 = 13 Mpa; (d) pKP2 = 16 Mpa.
Designs 09 00053 g017
Figure 18. Change in test efficiency coefficient over time: (a) qm = 40 cm3; (b) qm = 55 cm3; (c) qm = 85 cm3; (d) qm = 100 cm3.
Designs 09 00053 g018
Figure 19. Hydraulic cylinder rod movement parameter 1: (a) qn = 45 cm3; (b) qn = 55 cm3; (c) qn = 85 cm3; (d) qn = 110 cm3.
Designs 09 00053 g019
Figure 20. Change in test efficiency coefficient over time: (a) qn = 45 cm3; (b) qn = 55 cm3; (c) qn = 85 cm3; (d) qn = 110 cm3.
Designs 09 00053 g020
Figure 21. The experimental test bench for resource testing of plunger hydraulic cylinders: ED—electric motor; M—hydraulic motor; N1—main pump; N2—replenishment pump; Sh 1—electric motor shaft; Sh 2—hydraulic pump shaft; Sh 3—hydraulic motor axle; MP 1—mechanical transmission “electric motor-hydraulic pump”; MP 2—mechanical transmission “hydraulic motor-hydraulic pump”; GR—hydraulic distributor; GTs1 and GTs2—tested hydraulic cylinders; CV—back-pressure valve (diverter); CV 1—safety valve; CV 2—pressure valve; CV 3—safety valve of the replenishment pump; R—yoke; G—farm; F—filter; T—hydraulic reservoir.
Designs 09 00053 g021
Table 1. Values of the variable design parameters of the HMP.
Gear Ratio i1_2Gear Ratio i3_2Electric Motor Rotation Frequency rad/sSetting Pressure KP2, MpaWorking Volume of Hydraulic Motor cm3Working Volume of Hydraulic Pump cm3
0.20.25044040
0.60.410075545
1.40.8200138555
1.812501610085
100
110
Disclaimer/Publisher’s Note: The statements, opinions and data contained in all publications are solely those of the individual author(s) and contributor(s) and not of MDPI and/or the editor(s). MDPI and/or the editor(s) disclaim responsibility for any injury to people or property resulting from any ideas, methods, instructions or products referred to in the content.

